citizen voice and action for government accountability and ... · this is the basic structure of...
TRANSCRIPT
Page | 0
FINAL EVALUATION REPORT
COMMUNITY MATTERS PTY LTD October 2018
Citizen Voice and Action for Government Accountability and Improved Services: Maternal, Newborn, Infant and Child
Health Services
Page | 1
Acknowledgements This is the final report for the evaluation of the GPSA Maternal, Newborn and Child Health Project.
The evaluation is a collaborative initiative between Wahana Visi Indonesia, World Vision Australia, and
Community Matters Pty Ltd. Community Matters is an independent evaluation company which led
the evaluation, and provided capacity building in realist evaluation for Wahana Visi and project staff.
Data collection was undertaken by Wahana Visi and project staff. Analysis was undertaken by staff
from the project and Community Matters. World Vision Australia contributed significant funding to
the evaluation as a contribution to evaluation capacity building in Wahana Visi.
The following people contributed to the production of this report.
Evaluation Leadership Team: Andreas Sihotang, GPSA Project Manager Wahana Visi Indonesia; Cahyo
Prihadi, National Monitoring & Evaluation Coordinator, World Vision Indonesia (2014-15); Timothy
Nugroho Adi, MEL Coordinator for the GPSA Project (2015-2018); Gill Westhorp, Director, Community
Matters.
Evaluation design: Gill Westhorp, Andreas Sihotang, Cahyo Prihadi, Masrawati Sinaga.
Data collection: GPSA Project Staff collected survey data, MSC stories, and interviews.
Analysis of qualitative data: GPSA Project staff; Gill Westhorp; Andreas Sihotang; Timothy Nugroho
Adi
Analysis of quantitative data: Daniel Ball, Community Matters; Timothy Nugroho Adi, GPSA Mel
Coordinator
Translation of survey instruments into Indonesian: Andreas Sihotang, Cahyo Prihadi
Translation of survey, MSC and interview data into English: Andreas Sihotang, Timothy Nugroho Adi
Interpreting: Elvi Tambunan and Andreas Sihotang acted as interpreters for the MSC training and MSC
data analysis workshops from 2015 forward. By the final workshops for the project (2017/18), they
acted as co-facilitators. Timothy Nugroho Adi also acted as a small group facilitator in workshops.
Report writing: Daniel Ball, Gill Westhorp
This evaluation and the report that comes from it was truly a collaborative effort. Community Matters
thanks the staff of the project and the staff of Wahana Visi for their commitment and many
contributions to the evaluation.
Dr Gill Westhorp
Director, Community Matters
August, 2018

Page | 2
Affirmation Except as acknowledged by the references in this paper to other authors and publications, this report
consists of our own work. It was undertaken as the final evaluation report for the GPSA-funded
Maternal, Infant and Child Health Project in three districts of Indonesia: Kupang, Sikka and Timor
Tengah Utara (TTU).
The evaluation of the GPSA Maternal, New-born and Child Health Project is a collaborative initiative
between Wahana Visi Indonesia, World Vision Australia, and Community Matters Pty Ltd. The
evaluation aims to provide a comprehensive, rigorous, learning oriented evaluation of the project and
to develop capacity in realist evaluation in Wahana Visi.
Page | 3
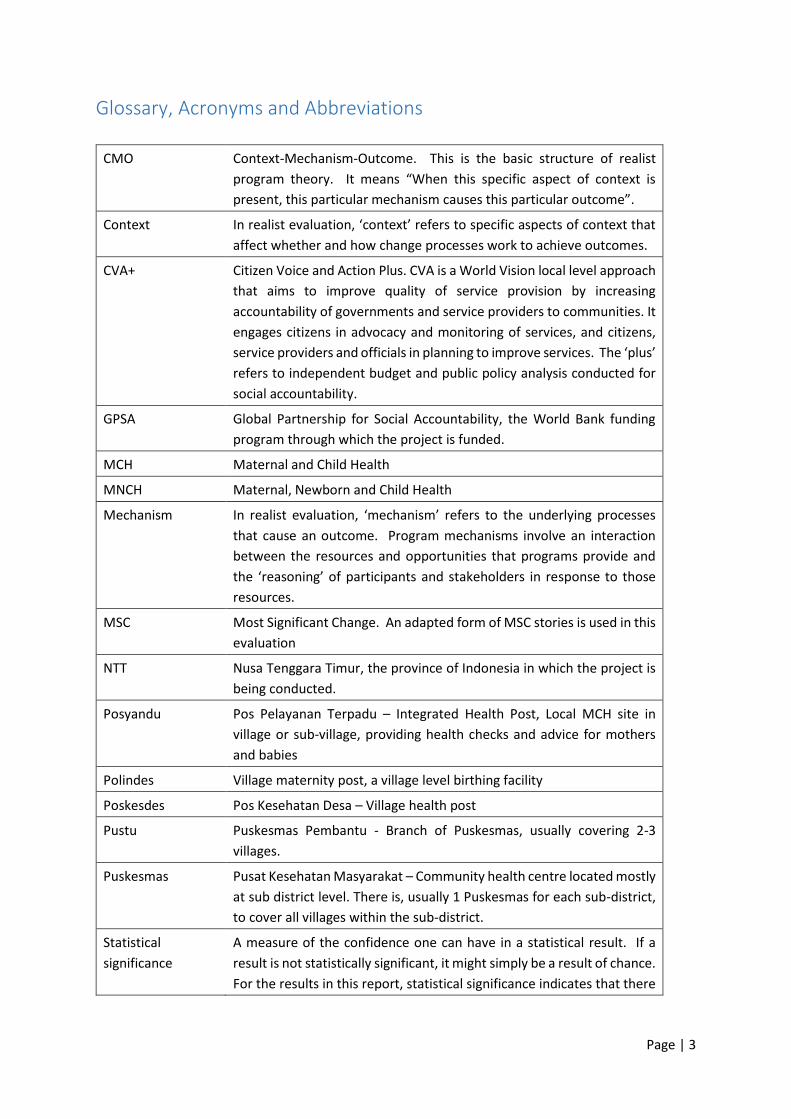
Glossary, Acronyms and Abbreviations
CMO Context-Mechanism-Outcome. This is the basic structure of realist
program theory. It means “When this specific aspect of context is
present, this particular mechanism causes this particular outcome”.
Context In realist evaluation, ‘context’ refers to specific aspects of context that
affect whether and how change processes work to achieve outcomes.
CVA+ Citizen Voice and Action Plus. CVA is a World Vision local level approach
that aims to improve quality of service provision by increasing
accountability of governments and service providers to communities. It
engages citizens in advocacy and monitoring of services, and citizens,
service providers and officials in planning to improve services. The ‘plus’
refers to independent budget and public policy analysis conducted for
social accountability.
GPSA Global Partnership for Social Accountability, the World Bank funding
program through which the project is funded.
MCH Maternal and Child Health
MNCH Maternal, Newborn and Child Health
Mechanism In realist evaluation, ‘mechanism’ refers to the underlying processes
that cause an outcome. Program mechanisms involve an interaction
between the resources and opportunities that programs provide and
the ‘reasoning’ of participants and stakeholders in response to those
resources.
MSC Most Significant Change. An adapted form of MSC stories is used in this
evaluation
NTT Nusa Tenggara Timur, the province of Indonesia in which the project is
being conducted.
Posyandu Pos Pelayanan Terpadu – Integrated Health Post, Local MCH site in
village or sub-village, providing health checks and advice for mothers
and babies
Polindes Village maternity post, a village level birthing facility
Poskesdes Pos Kesehatan Desa – Village health post
Pustu Puskesmas Pembantu - Branch of Puskesmas, usually covering 2-3
villages.
Puskesmas Pusat Kesehatan Masyarakat – Community health centre located mostly
at sub district level. There is, usually 1 Puskesmas for each sub-district,
to cover all villages within the sub-district.
Statistical
significance
A measure of the confidence one can have in a statistical result. If a
result is not statistically significant, it might simply be a result of chance.
For the results in this report, statistical significance indicates that there

Page | 4
is a 95% chance or better that the result is a ‘real’ result, and not just a
result of chance.
TTU Timor Tengah Utara, one of three districts within NTT in which the
project is being conducted
WVA World Vision Australia
WVIDN Wahana Visi Indonesia – World Vision Indonesia
Page | 5
Contents Acknowledgements ................................................................................................................................. 1
Affirmation .............................................................................................................................................. 2
Glossary, Acronyms and Abbreviations .................................................................................................. 3
Contents .................................................................................................................................................. 5
1 Executive Summary ......................................................................................................................... 7
1.1 Introduction ............................................................................................................................ 7
1.2 Standards Monitoring .............................................................................................................. 8
1.3 Survey data ............................................................................................................................ 10
1.4 Comparing standards, scorecard and survey data ................................................................ 11
1.5 Most Significant Change stories ............................................................................................ 12
1.6 Refining the theory of change for CVA .................................................................................. 13
2 Introduction and background ....................................................................................................... 15
2.1 The Project ............................................................................................................................ 15
2.2 Evaluation Methodology ....................................................................................................... 16
2.3 Baseline status of MNCH services ......................................................................................... 18
2.4 Surveys .................................................................................................................................. 20
2.5 Structure of the report .......................................................................................................... 21
3 Standards monitoring. .................................................................................................................. 22
3.1 Change over time .................................................................................................................. 22
3.2 Conclusion ............................................................................................................................. 26
4 Score Cards.................................................................................................................................... 28
4.1 All Service levels, all districts ................................................................................................ 28
4.2 Conclusion ............................................................................................................................. 40
5 Household Survey Data Analysis ................................................................................................... 41
5.1 Demographic Data ................................................................................................................ 41
5.2 Comparison of responses over time ..................................................................................... 42
5.3 Comparison of Phase 1 and Phase 2 villages ........................................................................ 49
5.4 Comparison of Districts in 2017/18 ...................................................................................... 55
5.5 Conclusion ............................................................................................................................. 65
6 Officials and Cadres Survey Data Analysis .................................................................................... 67
6.1 Demographic Data ................................................................................................................ 67
6.2 Comparison of responses over time ..................................................................................... 68
6.3 Comparison of Phase 1 and Phase 2 villages ........................................................................ 75
6.4 Comparison of Districts in 2017/18 ...................................................................................... 77
Page | 6
6.5 Conclusion ............................................................................................................................. 91
7 Most Significant Change Stories ................................................................................................... 93
7.1 Introduction .......................................................................................................................... 93
7.2 Methods ................................................................................................................................ 93
7.3 Categories of change identified ............................................................................................ 97
7.4 Mechanisms of change ....................................................................................................... 109
7.5 Sustainability ....................................................................................................................... 129
7.6 Contexts affecting change ................................................................................................... 132
7.7 Summary ............................................................................................................................. 133
8 Refining CVA Program Theory ..................................................................................................... 135
8.1 Introduction ........................................................................................................................ 135
8.2 Refining the original hypotheses ........................................................................................ 135
8.3 Changing power relations ................................................................................................... 144
8.4 Strengthening systems ........................................................................................................ 146
8.5 Power and the role of Wahana Visi .................................................................................... 149
8.6 Conclusion ........................................................................................................................... 150
9 Appendices .................................................................................................................................. 153
9.1 Appendix 1. Overarching and subsidiary questions ............................................................ 154
9.2 Appendix 2. Service Standards for Puskesmas................................................................... 155
9.3 Appendix 3. Household Survey .......................................................................................... 157
9.4 Appendix 4. Officials and Cadres Survey ............................................................................. 176
Page | 7
1 Executive Summary
1.1 Introduction
The ‘Citizen Voice and Action for Government Accountability and Improved Services: Maternal,
Newborn, Infant and Child Health Services’ project was funded through the World Bank’s Global
Partnership for Social Accountability (GPSA) program. The overall aim of the project was to improve
maternal, newborn, child health, and nutrition (MNCHN) services, and specifically to achieve
“Improved quantity and quality of Midwives and District Health Office's Services for MNCHN” in the
three districts.
The project operated in three districts of NTT province in Indonesia: Kupang, Sikka and Timor Tengah
Utara (TTU). Each district had 20 villages involved. The project employed a Manager and a Monitoring
and Evaluation Learning Coordinator, a District Coordinator for each of the three Districts and two
Field Facilitators per district.
The project used World Vision’s ‘Citizen Voice and Action’ (CVA) approach. This approach involves
training facilitators at village level, who then, with support from project staff, facilitate a series of
processes at village, sub-district and district level. Those processes enable villagers and local staff to
assess services against both official standards and villager-determined standards, to develop local
plans for service improvement, and to advocate to higher levels of the service delivery system for
improvements.
The project was implemented in two stages, with 30 villages in each phase. Implementation for the
second phase commenced one year after implementation in the first phase. Baseline data was
collected in 2014 for all 60 villages, in order to allow particular kinds of analysis to be undertaken in
later stages of the evaluation. Data was then collected from the 30 Phase 1 Villages in 2015 and all 60
villages in 2016 and 2017/18.
The evaluation was undertaken using realist evaluation methodology (Pawson and Tilley, 1997).
Realist evaluation does not ask “Did this work”, but “For whom did this work, in what contexts, in what
respects, to what extent, and how?”
The purposes of the evaluation were to:
1 Determine the outcomes of the GPSA-funded CVA project for maternal, infant and child
health services in 3 districts of NTT (Kupang, Sikka and TTU), Indonesia, within the time frame
of the project.
2 Improve understanding of the circumstances in which, and mechanisms by which, the
project improves the provision and quality of maternal, infant and child health services.
3 Inform refinements to Citizen Voice and Action methodology
4 Improve the capacity of Wahana Visi in realist evaluation.
The three overarching questions for the evaluation were:
1. What are the outcomes of the CVA for MNCHN project? How and why do outcomes vary
across contexts?
2. In what contexts is GPSA most effective? In what ways do contextual factors affect the
outcomes of the GPSA project?

Page | 8
3. What participation is required for the program to be effective, and what is required to enable
that participation?
The evaluation used a variety of data sources including a survey of households with children under 5
and/or a pregnant woman and another survey of officials and health cadres; assessments against
government standards, community score cards and action plans; Most Significant Change stories and
interviews, and program administrative data.
The evaluation was undertaken over a four-year time frame (2014-2018). It involved annual rounds
of data collection and analysis, with interim reports being fed into the program to inform program
improvements.
This is the final evaluation report. The baseline report was provided in March 2015, based on data
collected in 2014. Two Interim Reports were provided in May 2016, based on data collected in 2014-
15; and in June 2017, based on data collected in late 2016 and early 2017. This final report is based on
data collected in late 2017 and early 2018, and also provides analysis of data across the four years of
the project.
1.2 Standards Monitoring
Assessments were made for services at three levels: Posyandu (local health posts), Polindes (local
birthing centres) and Puskesmas (community health centres, at sub-district level). Health centre staff
assessed their own services against government standards for health services at each level.
The results from the standards monitoring were very largely positive.
Across the program as a whole, there were positive changes for seven of the eight standards for
Posyandu. The one that did not improve was ‘Time’, for which all regions had scored over 9 (out of
10) at baseline. The average score across all standards increased from 6.4 to 7.6 (out of a maximum
of 10). A score of 7.5 was used as the cut-off point for whether a service was meeting the standards.
By this measure, on average, Posyandu services were meeting the standards by the end of the
program. The average score increased for all three districts. There were statistically significant
increases for all eight standards in Kupang while in both Sikka and TTU there were increases for six
of the eight standards.
At the Polindes level, there was an increase across the project for four out of five standards. The
average increased from 7.4 (just under the cut-off for meeting the standards) to 7.8. There were
clear differences in achievements across the districts. In Kupang the score increased for all five
standards but the data represented only one Polindes. In both TTU and Sikka, the score only
improved for two of the five standards; for both districts, scores for having appropriate health
personnel decreased. Equipment was the only standard for which there was improvement in all
three districts.
For Puskesmas, there was improvement in the scores for nine of the twelve standards. The average
increased from 8.1 to 9.3, well over the 7.5 required to be considered to be meeting the standards.
There were more positive changes in Kupang (12 of 12 standards) compared to either Sikka (9 of 12)
or TTU (6 of 12; however, two items started and finished with scores of 10 and therefore could not
have improved).
The increases across the project as a whole the average scores for Posyandu, Polindes and Puskesmas
provide good evidence that the quality of services has improved, which was the primary aim of the
Page | 9
program. However, there were local decreases in scores for some standards at all three levels.
Concerns remain in relation to staffing levels, particularly at Polindes.
The pattern of change over time was quite varied for the standards data. For Posyandu, there was
greater change in the average score later in the project (that is, the change from 2016 to 2017 was
greater than the change from 2015 to 2016). For both Polindes and Puskesmas, there was greater
change earlier in the project (that is, the change was greater from 2015 to 2016 than from 2016 to
2017). It is possible that this reflects the lower number of Polindes and Puskesmas services: with fewer
services, changes could be made earlier. It is also possible that it reflects different types of changes
for Posyandu: some quite significant changes at local level, such as new buildings and building
upgrades, may have taken longer to achieve. However, the data that would be necessary to check
these possibilities was not available to the evaluation.
Score Cards
Community scorecards were designed during the first year of the project in consultation with
community members. Participants nominated their ideal criteria and then voted on those criteria
using 5-point scales (represented by smiley faces). Where criteria were similar, those were grouped
together by the MEL Coordinator for the project, providing a ‘summary list’ of ideal criteria. Voting
processes were facilitated by GPSA staff and the village facilitator, with scores determined by
community members at a community meeting.
The scorecard data fit into ten general categories and applied across the three service levels
(Posyandu, Polindes and Puskesmas). The categories were: 1. Policy; 2. ‘User active’ (active use of
services by eligible clients); 3. Place; 4. Support; 5. Cost; 6. Structure; 7. Equipment; 8. Personnel; 9.
Infrastructure, and 10. Services. However, data was not available for every category at every time
interval.
The changes overall in the scorecard data were positive. The combined scores for the three levels of
services across the three districts were higher in 2017 than 2015 for all nine categories for which there
were sufficient votes to compare. (Score card data was not collected in 2014, because the score cards
were being developed then.) There was stronger change from 2015 to 2016 than from 2016 to 2017.
In the final year, there were two standards (user active and place) for which the percentage of positive
votes decreased. The increase in percentage was smaller from 2016 to 2017 than 2015 to 2016 for
another five standards. This suggests some ‘levelling off’ of both engagement and service
improvement in the later stages of the project. There were two standards (support and equipment)
for which the percentage of positive votes increased by more in the final year.
A similar pattern was evident when looking at the individual health service levels. There were
increases in the percentage of positive votes over the two years for all the standards compared, except
for cost at both Posyandu and Puskesmas. There was more variation when looking at the change from
2016 to 2017, with some standards improving while others decreased.
Despite the overall improvement, there remains room for further improvement. Only three of the
categories (User Active, Personnel and Services) reached the stage where over half the votes were
positive and none reached 60%. There were also two categories (Cost and Infrastructure) for which
only a quarter of votes were positive.

Page | 10
Improvements in scorecard data over the course of the project provide evidence of greater community
satisfaction with services provided, an indirect indicator of improved quality of services.
1.3 Survey data
Two surveys were developed to provide data for the evaluation. The first was a survey for households
in the target population (the target group for the program is women and children under the age of 5
years. The target group for the survey was parents, and most commonly mothers or pregnant women,
in the target population). The second was a survey for officials and health cadres (volunteers in local
health services).
Each survey collected information about knowledge of maternal and child health services, standards
for those services, and health insurance. Increasing awareness of the availability of services, and of
rights and standards in relation to those services, was a key aim of the project. This was based on two
elements of program theory. If knowledge of services improved, use of services may also improve. If
knowledge of standards and rights improved, citizen engagement in advocacy for service
improvement may also improve.
Survey data was collected in 2014 (baseline) for all 60 villages. In 2015, data was collected only for
the Phase 1 villages. In 2016 and 2017/18, data was again collected for all 60 villages. There were
approximately 600 respondents - 10 per village - for each year (except 2015) that data was collected.
This is sufficiently large to be representative of the population.
It is important to note that the surveys in different years do not necessarily include the same
respondents. This was to guard against survey effects (i.e. respondents learning the answers as a
result of undertaking the survey in earlier years). This means that there could be some variation in
responses which is due to different respondents being involved, rather than to the effects of the
program. There is a greater chance of surveying the same respondents in the Officials and Cadres
survey, because officials and cadres were limited in number and likely to remain in their positions over
a number of years. For the household survey, the sample was deliberately varied each year to obtain
as accurate a representation as possible of community levels of awareness.
The surveys collected two sets of information about services. The first was awareness of services
actually provided at health centres in the respondents’ localities (described below as ‘services
provided’). The second was awareness of services that were required to be provided under
government standards for the different levels of health service (described below as ‘services
required’). This was to account for the possibility that some services required may not be provided in
all localities.
1.3.1 Household survey
Over the course of the project there were statistically significant increases in Household survey
respondents’ knowledge of services provided. This was true at all levels: Posyandu (increase for 8 of
10 services), Polindes (increases for 6 of 6 services) and Puskesmas (increases for 11 of 12 services).
The results were similar for respondents’ knowledge of services required under the standards.
There were increases in respondents’ ability to name nine out of ten services listed as being required
by government standards at Posyandu, six out of six at Polindes and eleven of 12 at Puskesmas.
There were also statistically significant increases in whether respondents had heard of BPJS
(government provided health insurance) and whether they had heard of minimum standards for
MCH services.
Page | 11
Despite the very positive results there remains room for improvement. Less than half the
respondents identified 16 or more of the 30 services actually provided across the three levels of
health service. Similarly, less than half the respondents identified 15 of the 30 services required
under the standards across the three health services.
The greatest proportion (a little over half) of the change in respondents’ ability to identify services
(both actual and required) happened in the final year of the project. The standards data showed
greater change for Polindes and Puskesmas from 2015 to 2016 than 2016 to 2017. However, the
opposite was true for Posyandu, where the greatest change occurred in the first year of the project.
All parents of young infants are expected to use Posyandu services each month, whereas Polindes
and Puskesmas services are used for childbirth and when there are health problems. The earlier
improvement in awareness of Posyandu services may therefore reflect more frequent use of
Posyandu by a higher proportion of the target group than use of Polindes and Puskesmas.
Continued improvement in awareness over time suggests that continued action by health services
and communities to promote health services and standards may increase the percentage of people
who understand services and rights, and/or increase the retention of information for those reached.
Household surveys provide good evidence in improvements in citizens’ knowledge of services and
standards. This is important, not least because it contributes to their likelihood of accessing services
when needed. It can also help their ability to identify where there are gaps in the services provided
against the standards, which is important to improve citizen’s ability to hold services and systems to
account.
1.3.2 Officials and cadres survey
As with the responses from respondents to the household survey, the results from the officials and
cadres survey were very positive. Respondents’ ability to name services provided improved in relation
to Posyandu (7 of 9 services), Polindes (5 of 6 services) and Puskesmas (13 of 14 services).
The results were even more positive in relation to respondents’ ability to name the services required
by standards. There was a statistically significant improvement for all services at Polindes (6 of 6) and
Puskesmas (14 of 14) and all but one service at Posyandu (8 of 9).
Results for changes in awareness were impressive - both in terms of the number of services for which
there were changes and the size of the changes in understanding. However, less than half the
respondents reported that that a service was being provided for 13 of the 29 services listed across the
health service levels. Similarly, less than half the respondents indicated that a service was required
by the government standards for 10 of the 29 services.
While the pattern was not as strong as for the household survey respondents, a greater proportion of
the overall improvement in the knowledge of health services occurred in the final year of the project
than in earlier years.
Village officials and cadres form part of the health services system in Indonesia – cadres as direct
service providers, and village officials as part-funders, supervisors and information providers.
Consequently, growth in knowledge for these cohorts is likely to support growth in knowledge for
citizens.
1.4 Comparing standards, scorecard and survey data
Over the course of the project, there were improvements across the project in services meeting
government standards (standards data), citizen satisfaction with services (scorecards data), and

Page | 12
citizen, cadre and officials’ knowledge of services required and provided. However, there were
differences in the patterns of change over time.
Standards data suggested that improvements in services were achieved earlier in Polindes and
Puskesmas, and later in Posyandu. As noted above, this may reflect either the greater number of
Posyandu or the different nature of changes achieved at Posyandu.
Scorecard data showed earlier, rather than later, improvements in satisfaction with services across all
service levels. There appeared to be some ‘levelling off’ of satisfaction with both engagement and
service improvement in the later stages of the project. Early improvements may reflect both ‘quick
wins’ and satisfaction that action was being taken to address long-standing concerns.
Survey data, which assessed the wider community’s knowledge of health services which should be,
and which were, provided, improved later in the project. This trend for later improvement in
knowledge was stronger for households than for officials and cadres.
Standards and scorecards data were provided by those directly engaged with services, and/or
sufficiently concerned about those services to attend community meetings about them. This may
suggest that the perceptions of those directly involved with health services moved earlier in the
project, while changes in the knowledge of health services across the wider community took longer.
1.5 Most Significant Change stories
‘Most Significant Change’ (MSC) is a technique for collecting stories about changes that have been
experienced as a result of a program. Stories were collected from a variety of respondents (a mother
using Posyandu services; a local cadre; the village facilitator; a midwife and the Village Head) in
twenty-four villages each year. Stories were quantitatively coded by project staff. Main mechanisms
and higher-level outcomes were also coded. Significant quotes were extracted and translated into
English. In addition, in the final two years of the projects, a sample of more in-depth interviews were
conducted and translated in full.
MSC stories have validated data collected through other means (standards data, score card data and
survey data) in relation to outcomes from the CVA project. The most commonly reported changes
related to services and citizen participation. For services, availability and quality of services were
most commonly reported, closely followed by improvements in relation to midwives (increased
employment of midwives, increased availability because more lived locally in villages, and improved
service provision). Changes in relation to policy, budgets, services and government responsiveness
were most commonly reported in the second year of the project. For citizens, the most commonly
reported changes were improved knowledge of health services and increased use of health services.
Citizen participation increased steadily over the course of the project. It remains to be seen whether
this will turn out to be project specific, or whether citizens will continue to participate after the
project has concluded.
Importantly, the stories have also provided evidence of progress towards some higher-level
outcomes, including reductions in maternal and infant mortality and improvements in infant
nutrition, which respondents attributed at least in part to the CVA project. Some spillover effects
were also reported, where health services, villages and at least one individual have adapted CVA
processes for use in other sectors.
The stories have also provided the main basis for refining understandings of how the CVA program
has contributed to change. Improving knowledge and awareness, citizen participation and activating
leadership were the most commonly identified mechanisms. Interestingly, these were the three
mechanisms initially selected at the initial program theory workshop as being the most important to
Page | 13
investigate through the evaluation. However, no particular steps were taken to prioritise them in
MSC stories: respondents simply identified the ways that they thought changes had come about. It
would seem that staff and stakeholders had, at the beginning of the project, strong hunches about
the predominant causal pathways involved. (This may well reflect World Vision’s long history of
conducting CVA projects.)
More importantly, however, the stories have provided data to refine understandings of the
mechanisms. Using the three priority mechanisms as examples: There is evidence to suggest that it
is not so much awareness of gaps that motivates citizen engagement, but increased confidence to
speak up. Changes in confidence related partly to increased awareness but also were also generated
by the collective processes used in the project and by World Vision’s ‘standing beside’ program
participants. Increased knowledge and awareness resulted not just from the project’s awareness-
raising activities, but from increasing engagement over time of service providers, officials, cadres
and community members in informing others. Increased awareness of rights and standards on the
part of service managers and officials triggered internal accountability systems, such that resources
were reallocated and staff were both enabled to, and held accountable for, provision of services to
meet standards. However, it was not just managers and officials who became more active as
leaders: so too were political leaders and community leaders. They were motivated to improve
service quality, but also health promotion and use of health services. Leaders took action in their
own spheres of responsibility and – through improved relationships with each other – did so in more
collaborative ways.
There was relatively little information about how contexts affect the operation of these
mechanisms. Clearly, national provision of funding for maternal and child health, and (separately) for
village level planning and service provision was very significant. The legislative and regulatory
environment, which was moving towards democratisation and accountability, was strongly
supportive. Contributions to positive outcomes by a range of stakeholders external to the project
were also identified. While much has been learned about mechanisms of change through this
evaluation, improving understanding of contexts and how they affect the operation of those
mechanisms may make an appropriate focus for future research or evaluation of CVA.
1.6 Refining the theory of change for CVA
Realist evaluation begins with ‘an initial rough theory’ about how a program is supposed to work. It
finishes with refined theory that specifies how and in what circumstances the program does work. The
intention is that refined theory can be used to inform future implementation of the program, either
by helping to select the contexts within which programs are most likely to be effective, or by informing
adaptations of programs to contexts.
In this project, the initial rough theory comprised a diagram of the Theory of Action for the project
and eight main mechanisms (underlying change processes), all of which were expected to be necessary
for the project to work. Throughout this evaluation, those originally hypothesised mechanisms have
been refined in two ways. Firstly, the original eight mechanisms have been substantially refined, with
much more detailed descriptions of the ways in which they in fact operate. These are described in
Section 8.2 below. It should be noted that these are still written in positive terms, and the contexts in
which they are less likely to operate in this way have not been defined. This is largely a result of the
high degree of effectiveness of this project, which has made it difficult to identify contexts in which
the mechanisms have not operated as expected. (There is some evidence about unsupportive contexts
later in this report, and in the earlier interim reports for the project.)
Page | 14
Finally, two new, overarching mechanisms have been identified through this evaluation. They operate
at a higher level of abstraction than the very detailed mechanisms just described, and are thus likely
to apply to many CVA programs, and potentially to other social advocacy projects as well.
The first is that CVA works by changing power relations. It does so by using structured and transparent
processes to organise collective opinion, which is harder to dismiss than individual opinions; by making
the criteria for judgements transparent; by increasing the legitimacy of claims on the system; by
empowering women; and by bringing different types and levels of decision-makers into the process,
such that different forms of authority are available to address different issues. World Vision itself
brings multiple types of power and “authorising” to the table, including its independence; access to
higher levels of government; access to media; and the fact that it is a donor organisation. Staff in this
project did not believe that World Vision’s own power was particularly important in this project,
believing that positive relationships were more important. However they suggested that it could be
important in the early stages of CVA, or where the wider context is less supportive.
The second is that CVA works by strengthening systems. That is, in this case, the boundaries of the
health system at local level were expanded to include citizens and local government; component
elements of the system were strengthened; relationships were established between various elements
of the system; stronger information and resource flows were introduced within the system; and
positive feedback loops supported ongoing action to improve system effectiveness.

Page | 15
2 Introduction and background
2.1 The Project
The ‘Citizen Voice and Action for Government Accountability and Improved Services: Maternal,
Newborn, Infant and Child Health Services’ project was funded through the World Bank’s Global
Partnership for Social Accountability (GPSA) program. The overall aim of the project was to improve
maternal, newborn, child health, and nutrition (MNCHN) services, and specifically to achieve
“Improved quantity and quality of Midwives and District Health Office's Services for MNCHN” in the
three districts.
The project operated in three districts of NTT province in Indonesia: Kupang, Sikka and TTU. Each
district had 20 villages involved.
The project employed a Manager and a Monitoring and Evaluation Learning Coordinator, a District
Coordinator for each of the three Districts and two Field Facilitators per district. The project used
World Vision’s ‘Citizen Voice and Action’ approach. This involved:
▪ developing accurate information about citizens’ rights and entitlements to services – in this
project, contained in national, district and local health budgets and policies and Indonesian
standards for maternal and infant child health services;
▪ developing relationships with village, sub-district and district officials and health service
providers to encourage their engagement in the program;
▪ educating residents, service providers and officials about their rights and entitlements
▪ working with residents in villages to develop citizen score cards to monitor the extent to which
standards are achieved and the quality of service provision at the local level;
▪ working with residents, service providers and local officials to develop plans to improve the
achievement of standards and the quality of services. Plans identify what will be done by
which stakeholder groups locally and at sub-district or district level to enable standards to be
met. Action plans can include advocacy to higher levels of government for provision of budgets
and staffing to meet standards;
▪ monitoring of standards and services by citizens;
▪ annual reviews of achievement against standards and plans to assess progress and update
plans as required.
The project was implemented in two stages, with 30 villages each phase. Implementation for the
second phase commenced one year after implementation in the first phase. Baseline data was
collected at the same time for all 60 villages, in order to allow particular kinds of analysis to be
undertaken in later stages of the evaluation. Data was subsequently collected on a yearly basis but in
2015, only data from phase 1 villages was collected.
Page | 16
2.2 Evaluation Methodology
The evaluation was undertaken using realist evaluation methodology (Pawson and Tilley, 1997).
Realist evaluation does not ask “Did this work”, but “For whom did this work, in what contexts, in what
respects, to what extent, and how?” The key assumptions built into a realist evaluation include the
following:
▪ No program works for everyone or everywhere – programs have different outcomes for
different sub-groups and/or in different situations.
▪ Programs do not directly cause outcomes – they provide opportunities, resources and
constraints that affect the choices and decisions that providers, stakeholders and participants
make. Those decisions underlie new behaviours which generate different outcomes. This
process is known as a ‘program mechanism’.
▪ Context really does make a difference to whether and how programs operate, because:
▪ contexts affect people’s ‘reasoning’ and decision-making
▪ contexts affect how programs are implemented
▪ contexts affect whether resources are available to put intended decisions into action.
The purposes of the evaluation were to:
▪ Determine the outcomes of the GPSA-funded CVA project for maternal, infant and child health
services in 3 districts of NTT (Kupang, Sikka and TTU), Indonesia, within the time frame of the
project.
▪ Improve understanding of the circumstances in which, and mechanisms by which, the project
improves the provision and quality of maternal, infant and child health services.
▪ Inform refinements to Citizen Voice and Action methodology
▪ Improve the capacity of Wahana Visi in realist evaluation.
The three overarching questions for the evaluation were:
4. What are the outcomes of the CVA for MNCHN project? How and why do outcomes vary
across contexts?
5. In what contexts is GPSA most effective? In what ways do contextual factors affect the
outcomes of the GPSA project?
6. What participation is required for the program to be effective, and what is required to enable
that participation?
The subsidiary questions for the evaluation are provided in Appendix 9.1.
The evaluation was undertaken over a four-year time frame (2014-2018). It involved annual rounds
of data collection and analysis, with interim reports being fed into the program to inform program
improvements.
The evaluation design was developed during a one-week workshop held in Kupang in (2014). It was
attended by all GPSA staff, eight staff from Wahana Visi central office, two staff from WVA and a staff
Page | 17
member from a local university. The workshop was facilitated by Community Matters. The workshop
provided introductory training in realist evaluation, developed the key elements of the program
theory to be explored through the evaluation, developed the overarching and subsidiary questions for
the evaluation and discussed data sources to be used to answer those questions.
Realist evaluation seeks to test and refine the program theory. Testing program theory improves
understanding of how and why programs are working or not working in different circumstances, and
that enables policy makers and providers to improve program design and implementation. The
program theory comprises:
▪ an overarching theory of action (what is supposed to happen, organised in a hierarchy showing
earlier actions contributing to intermediate and later outcomes);
▪ a set of eight main mechanisms, all of which are assumed to be necessary for the program to
operate as intended;
▪ a set of specific context-mechanism-outcome (CMO) hypotheses to be tested in this
evaluation. The mechanisms relate to the key questions outlined above and to three of the
eight main mechanisms: ‘improving knowledge and awareness’, ‘increasing citizen
engagement’, and ‘activating leadership’.
All these components of the program theory are described in the evaluation design document. The
three main mechanisms to be examined in this evaluation were:
▪ Improving knowledge and awareness of policies and budgets affecting MNCHN. Improved
understanding of rights and entitlements and improved understanding of shortfalls in
resources and services motivates citizens to advocate for gaps to be filled and quality to be
improve;
▪ Increasing citizen engagement in monitoring and advocacy for MNCHN services, which both
increases government awareness of service delivery issues and community concerns in
relation to services, and increases pressure for accountability by service providers and
governments;
▪ Activating leadership to implement the actions necessary to improve the quantity and quality
of services at the sub-district and local level.
The evaluation was initially designed to capitalise on the two-phase implementation of the project to
investigate:
• Whether there were ‘spill-over effects’ in Phase 2 villages from implementation during the
first year of the program.
We hypothesised that this may be possible because villages sit within sub-districts, each of
which has at least one Puskesmas (community health centre). If there are changes in
Puskesmas decision-making as a result of work in Phase 1 villages, this may flow through to
Phase 2 (and other) villages in that sub-district;
• Whether patterns of change over time were similar or dissimilar in the two cohorts of villages.
This will involve two sets of analyses: difference in difference analyses conducted each year
(e.g. comparing Phase 1 and Phase 2 villages in 2016) , and comparisons for the year-of-
Page | 18
implementation (e.g. comparing Phase 1 villages in 2015 with Phase 2 villages in 2016, each
of them at the end of their respective first year of implementation).
The evaluation used a variety of data sources including survey of households and another survey of
officials and health cadres, ratings of services against standards, community score cards and action
plans, and Most Significant Change stories and interviews. Program administrative data was used by
CVA staff to provide annual accountability reports to the funding body, and those reports were in turn
drawn upon in the evaluation. The standards and community scorecards data were collected in 2015,
2016 and 2017.
Unfortunately, data was only collected in phase 1 villages in 2015, which means that the analysis of
potential spill over effects was limited.
The evaluation was also used to help upskill Wahana Visi staff by providing training in realist evaluation
methods. CVA and Wahana Visi national office staff were involved in developing the design,
developing the program theory, and refining instruments. Project staff undertook all data collection
and were involved in annual analysis workshops in 2016, 2017 and 2018. In all three workshops,
qualitative analysis was undertaken, while quantitative analysis was only undertaken in one workshop.
Quantitative analysis was undertaken by the CVA MEL coordinator (primarily for use in accountability
reports and other project activities) and independently by the external evaluators. Samples of
qualitative data were translated into English and analysed independently by the external evaluators.
2.3 Baseline status of MNCH services
Data was collected by project staff from secondary sources about the 60 villages involved in the
program and some aspects of their MNCH services. A profile of villages was established in an Excel
spreadsheet such that it could be updated annually to monitor progress. At February 2015, the profile
identified:
▪ the name of each village and the sub-district and district within which it belongs. There are 20
villages from each of Kupang, TTU and Sikka districts involved in the project. The villages are
drawn from 11 sub-districts: Taebenu, Fatuleu and Takari in the Kupang district; Miumafo
Tengah, Insana Tengah, Miumafo Barat and Insana Barat in TTU; and Nita, Doreng, Lela and
Koting in Sikka;
▪ the number of sub-villages and households in each village – a total of 205 sub-villages and
23,323 households;
▪ the geographical area covered by each village: together the 60 villages cover an area of 845
square kilometres;
▪ the male, female and total populations of the villages. The Kupang villages have a combined
population of 39,952 (20321 male and 19631 female); the Sikka villages a population of 29,851
(14188 male and 15663 female); and the TTU villages a population of 23,494 (11629 male and
11865 female);
▪ the number of Posyandu (local MCH health site) per village - a total of 203 across the 60
villages - and the level of those services. The four levels of services are:
Page | 19
1. Posyandu pratama – these are not yet fully established, have limited numbers of cadres
and do not run routine activities each month.
2. Posyandu madya – these conduct activities more than 8 times a year, average 5 cadres
or more but have coverage of less than 50% of the population.
3. Posyandu purnama – these conduct activities more than 8 times a year, average 5 cadres
or more and coverage of the main programs is more than 50% of the population.
4. Posyandu mandiri – these are independent Posyandu with regular activities, has good
coverage for the main programs, runs additional programs and the Health Fund reaches
50% or more of the heads of families.
There were 63 Posyandu pratama, 14 Posyandu madya, 101 Posyandu purnama and 27
Posyandu mandiri. All analysis of Posyandu data was undertaken together.
▪ the number of larger health service sites: Polindes (29), Poskesdes (9), Pustu (25) and
Puskesmas (12);
▪ the distance from each village to the closest Puskesmas. The distances were recorded in
different formats and could not be collated, but ranged between 0 and 45 kilometres;
▪ numbers of GPs and dentists for each Puskesmas, and numbers of nurses, midwives and
cadres per village. A total of 69 midwives and 980 cadres were reported in the 2015 data;
▪ whether midwives live in the village they serve and whether they serve one or two villages;
▪ the number of pregnant women (a total of 898 at the time of data collection) and children
under 5 (a total of 8,260 at the time of data collection) per village;
▪ whether or not the village has a village level regulation and a specific budget for MCH services.
56 of the 60 villages had at least one midwife working in the village. 46 of the villages were served by
one midwife, seven were served by two midwives and three were served by three midwives. Three
of the four villages without midwives were located in the TTU district and the other was in the Sikka
district.
Data about whether the midwife lived in the village they lived in or not was not available for all
midwives. 43 midwives in 41 villages lived in the village they worked. In 14 villages, midwives did not
live in the village they worked in.
Only 6 of the 60 villages had a village regulation for maternal and child health available. Three of these
villages were from the Kupang district and three from the TTU district.
Two-thirds (n=40) of the villages had an allocated budget for maternal and child health. All 20 villages
from the Sikka district had a MCH budget available. 90% of the villages in the TTU district (n=18) had
a MCH budget available. In the Kupang district, only 10% (2 villages) had a specific MCH budget.
Page | 20
2.4 Surveys
2.4.1 Survey Design
Two surveys were developed to provide data for the evaluation. The first was a survey for households
in the target population (the target population was women and children under the age of 5 years. The
target group for the survey was parents, and most commonly mothers, in the target population). The
second was a survey for officials and health cadres (volunteers in local health services).
Each survey collected information about knowledge of maternal and child health services, standards
for those services, and health insurance. Survey questions were developed to meet project outcome
indicators required by the funding body and to test aspects of the ‘knowledge and awareness’
mechanism. The surveys were developed collaboratively in English by the evaluation partners and
translated into Indonesian by Wahana Visi staff. They were then formatted for mobile data collection
software by Wahana Visi evaluation staff. They were field tested in three villages and refined slightly.
2.4.2 Survey Administration
Surveys were administered by GPSA staff and local enumerators in October and November 2014 and
then in the final quarter of each of 2015, 2016 and 2017. There were four enumerators for each
district. Enumerators received three days of training in use of the smart phone data collection system,
ethics for data collection and data management. In data collection visits to households, enumerators
were accompanied by a local cadre or official in order to reduce mistrust of strangers. Once data had
been collected and cleaned it was returned to the Community Matters team for analysis.
2.4.3 MSC stories
‘Most Significant Change’ (MSC) is a technique for collecting stories about changes that have been
experienced as a result of a program. It was developed to identify concrete changes in community
development programs where outcomes might be quite different in different settings. In the
traditional approach, a wide variety of stories are collected and then individual stories are selected as
being ‘the most representative’ of change at different levels (within communities, regions, programs
as a whole). However, this tends to hide differences in outcomes for different groups. In this
evaluation, the process was modified to collect stories from individuals and all stories were analysed.
Questions were also added to enquire about underlying change processes and the contextual factors
that affect them.
Stories were collected from a purposive sample of 24 villages comprising:
• 12 villages from each cohort (phase 1 and phase 2)
• All districts and sub-districts; and
• The villages which were performing best, least well and average against input and performance standards at baseline. This sampling framework was designed to avoid generating biases that might result if all the worst performing villages were selected - these might be the villages in which it is easiest or hardest to create change - or ceiling effects - where change may either be hard to achieve or hard to identify because there is little room for improvement.

Page | 21
Stories were from five respondents (a mother using Posyandu services; a local cadre; the village
facilitator; a midwife and the Village Head) in twelve villages: four per District. Stories were
quantitatively coded by staff, identifying changes in policy, budget, service provision, government
responsive, community knowledge of and use of services, and community participation. Main
mechanisms and higher-level outcomes were also coded. Significant quotes were extracted and
translated into English.
In early 2017, one additional data collection method was introduced. Project staff had noted that the
selection of villages for MSC stories did not necessarily result in selection of the villages in which they
perceived the greatest and least progress had been made. They argued that the existing selection may
under-represent the extent of change achieved in some villages; but also that it made it more difficult
to compare how change was (or was not) achieved. It was therefore agreed that six villages would be
selected, two in each District. Of the two, one was selected for its apparent high level of progress; the
other for apparent slower progress.
Implementation issues meant that the sample was not completed as planned. Interviews were
conducted in TTU as planned; but in Kupang, only one interview was conducted in the ‘high level of
progress’ village and that was with the village facilitator. Six interviews were conducted in the ‘slower
progress’ village. In Sikka, interviews had already been completed using the original MSC questions
and it was agreed that it would be unreasonable to re-interview participants. However, the extended
interviews with District Health Officials, which are conducted as a normal part of MSC data collection,
were translated and included in the analysis.
Extended MSC interviews were conducted in these villages. Those interviews were transcribed and
translated in full, providing greater depth of data for the evaluation than the selected quotations from
all other MSC stories.
In the 2017 data analysis workshop, project staff had noted that they were still finding it difficult to
obtain data in relation to program mechanisms (how change is caused). In response to their request,
an additional training workshop was conducted in realist interviewing prior to the final round of data
collection (early 2018). Extended interviews were conducted with some respondents in all villages,
and additional questions were added to test particular aspects of program theory. Further
information about the sample is provided in Chapter 7 below.
2.5 Structure of the report
In the following chapters of this report, the quantitative data is presented followed by the
qualitative data. Standards monitoring is discussed in Chapter 3 and Score Cards data is discussed in
Chapter 4. The Household and Officials and Cadres surveys are discussed in Chapters 5 and 6
respectively. Analysis of the MSC stories and interview data is presented in Chapter 7. Chapter 7
also provides descriptions of mechanisms of change. Chapter 8 refines the program theory based on
the evidence gathered during the evaluation.

Page | 22
3 Standards monitoring. Processes for monitoring of standards were developed and implemented over the first year of the
program. The first round of data collection was conducted at the end of the first year of operation of
the program (2015), only for the 30 Phase 1 villages. Data was collected at the end of 2016 for all
villages and then again at the end of 20171.
‘Standards monitoring’ refers to assessment against government standards for health facilities. The
process was facilitated by GPSA project staff and the village facilitator, with scores against the
standard determined by service providers and their managers. The standards that apply to each level
of health service are listed in their respective sections below.
For each standard, the service was given a score ranging from 0 to 10, where 0 was the worst and 10
was the best. The total score achieved was created by adding the scores for each standard and then
an average was created by dividing the total score by the number of standards. Services that had an
average score of 7.5 or better were considered to be meeting the standards.
3.1 Change over time
3.1.1 Posyandu
For the standards monitoring, Posyandu were scored on eight aspects of their operation. For some
aspects, there were multiple requirements to meet the standards. They were also given an average
score across the eight aspects.
The table below shows the eight aspects and the requirements to have met the standard.
Table 1. Posyandu standards
Time Minimum once per month
Place Easy to access
Number of Cadre Minimum 5 persons
Puskesmas Health Personnel Visit Minimum once per month
Support * Village officer * Posyandu Working Group * Village Family Empowerment team
Equipment MCH Book
KMS Card
Height Measure-Baby
Height Measure-Under 5 (U5)
Weight Measure-Baby
Weight Measure-Under 5 (U5)
Weight Measure-Adult
Main Activities Maternal and Child Health (MCH)
Family Planning
Immunisation
Nutrition
Diarrhoea Management
Additional Activities Open to Posyandu resources capacity
1 It is possible that data was collected over the end of 2017 and early 2018, however we refer to ‘2017’ for all results in this chapter.

Page | 23
The table below shows the average scores for Posyandu in each district over the three years. The
table also shows the difference in scores between 2015 and 2017 (rows labelled “Diff”). Scores
highlighted in green are positive scores, that is the score in 2017 was higher than the score in 2015,
showing improvement against the standards. Scores highlighted in red are negative scores and
indicate that the score in 2017 was lower than the score in 2015.
It is important to note that the total score is not simply an average of the scores for the three districts.
There were differing numbers of Posyandu from which data was collected in the three districts.
The following table shows the standards scores for all villages for which there was data available in
each of the years. It is also important to note that data was only collected in phase 1 villages in 2015
whereas it was collected from all villages in 2016 and 2017.
Table 2. Posyandu 2015-2016-2017 by District
Time Place Cadre# Pusk-Visit Support
Equip-ment
Main Activ.
Addit’l Activ.
Average
Kupang 2015 9.5 7.7 7.8 3.7 4.0 7.1 7.1 4.5 6.4
2016 9.3 8.1 8.5 7.2 3.0 7.3 7.4 4.3 6.9
2017 9.9 8.4 9.2 8.0 6.0 8.7 8.6 6.4 8.1
Diff. 0.4 0.7 1.4 4.3 2.0 1.6 1.5 1.9 1.7
Sikka 2015 9.3 6.8 8.2 5.6 4.4 6.5 4.4 2.7 6
2016 8.6 7.2 7.8 5.9 4.5 6.2 5.1 4.1 6.1
2017 8.5 7.3 7.9 6.6 5.7 6.6 6.3 4.8 6.7
Diff. -0.8 0.5 -0.3 1.0 1.3 0.1 1.9 2.1 0.7
TTU 2015 9.8 6.8 7.7 9.5 3.6 6.6 6.3 5.5 7
2016 9.9 7.3 7.9 8.9 4.2 6.8 7.4 6.8 7.4
2017 9.7 7.5 8.2 9.4 6.2 7.0 7.6 7.5 7.9
Diff. -0.1 0.7 0.5 -0.1 2.6 0.4 1.3 2.0 0.9
Total 2015 9.5 7.2 7.9 5.7 4.1 6.8 6.0 4.1 6.4
2016 9.2 7.6 8.2 7.2 3.7 6.9 6.7 4.8 6.8
2017 9.4 7.8 8.6 7.9 5.9 7.7 7.7 6.2 7.6
Diff. -0.1 0.6 0.7 2.2 1.8 0.9 1.7 2.1 1.2
There were three standards, main and additional activities and support, which increased by more than
a point for all three districts over the course of the two years. In Kupang, scores for all eight standards
(and the average) increased from 2015 to 2017 and in Sikka and TTU there were six (and the average)
that increased. The increases overall ranged from between half a point and more than two points on
a ten-point scale. Whether the Posyandu had reached the standards overall increased by more than a
point.
For the program as a whole, there was only one standard, Time, for which the score decreased from
2015 to 2017 (and then only by 0.1 of a point). All regions had scored over 9 (out of 10) at baseline
for that standard.
3.1.2 Polindes
The table below shows the five aspects on which Polindes were rated and the requirements to have
met each standard.
Page | 24
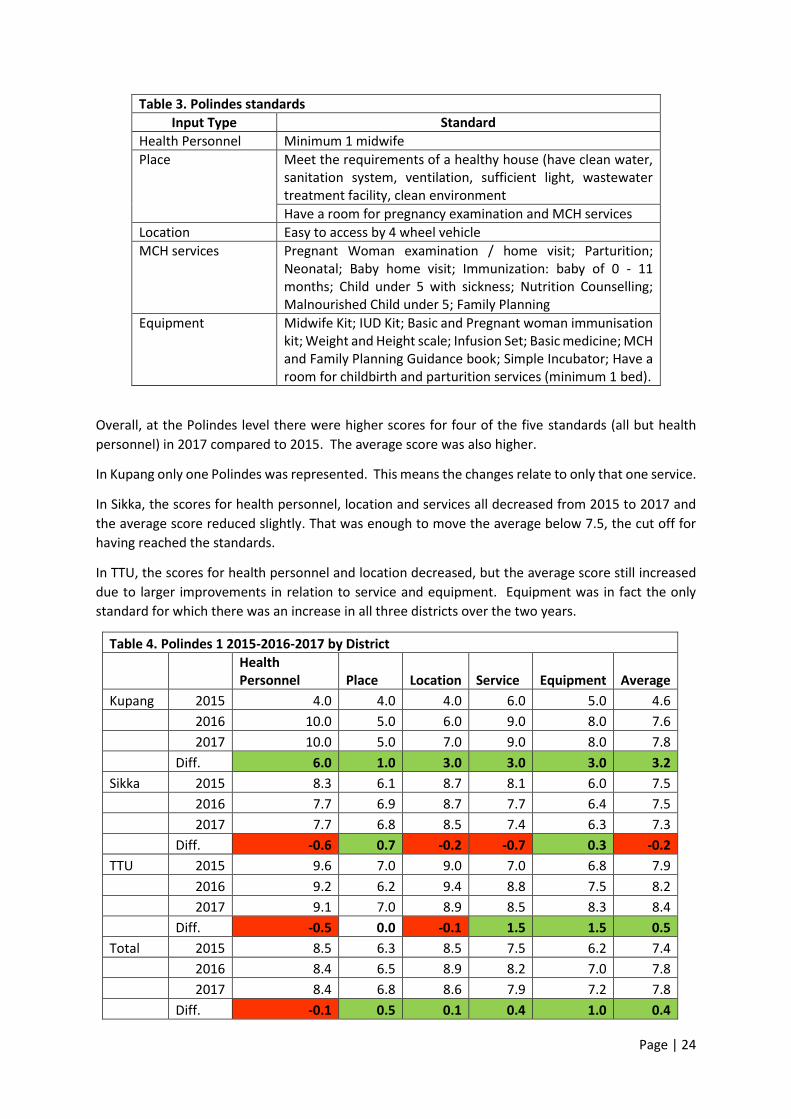
Table 3. Polindes standards
Input Type Standard
Health Personnel Minimum 1 midwife
Place
Meet the requirements of a healthy house (have clean water, sanitation system, ventilation, sufficient light, wastewater treatment facility, clean environment
Have a room for pregnancy examination and MCH services
Location Easy to access by 4 wheel vehicle
MCH services Pregnant Woman examination / home visit; Parturition; Neonatal; Baby home visit; Immunization: baby of 0 - 11 months; Child under 5 with sickness; Nutrition Counselling; Malnourished Child under 5; Family Planning
Equipment Midwife Kit; IUD Kit; Basic and Pregnant woman immunisation kit; Weight and Height scale; Infusion Set; Basic medicine; MCH and Family Planning Guidance book; Simple Incubator; Have a room for childbirth and parturition services (minimum 1 bed).
Overall, at the Polindes level there were higher scores for four of the five standards (all but health
personnel) in 2017 compared to 2015. The average score was also higher.
In Kupang only one Polindes was represented. This means the changes relate to only that one service.
In Sikka, the scores for health personnel, location and services all decreased from 2015 to 2017 and
the average score reduced slightly. That was enough to move the average below 7.5, the cut off for
having reached the standards.
In TTU, the scores for health personnel and location decreased, but the average score still increased
due to larger improvements in relation to service and equipment. Equipment was in fact the only
standard for which there was an increase in all three districts over the two years.
Table 4. Polindes 1 2015-2016-2017 by District
Health Personnel Place Location Service Equipment Average
Kupang 2015 4.0 4.0 4.0 6.0 5.0 4.6
2016 10.0 5.0 6.0 9.0 8.0 7.6
2017 10.0 5.0 7.0 9.0 8.0 7.8
Diff. 6.0 1.0 3.0 3.0 3.0 3.2
Sikka 2015 8.3 6.1 8.7 8.1 6.0 7.5
2016 7.7 6.9 8.7 7.7 6.4 7.5
2017 7.7 6.8 8.5 7.4 6.3 7.3
Diff. -0.6 0.7 -0.2 -0.7 0.3 -0.2
TTU 2015 9.6 7.0 9.0 7.0 6.8 7.9
2016 9.2 6.2 9.4 8.8 7.5 8.2
2017 9.1 7.0 8.9 8.5 8.3 8.4
Diff. -0.5 0.0 -0.1 1.5 1.5 0.5
Total 2015 8.5 6.3 8.5 7.5 6.2 7.4
2016 8.4 6.5 8.9 8.2 7.0 7.8
2017 8.4 6.8 8.6 7.9 7.2 7.8
Diff. -0.1 0.5 0.1 0.4 1.0 0.4
Page | 25
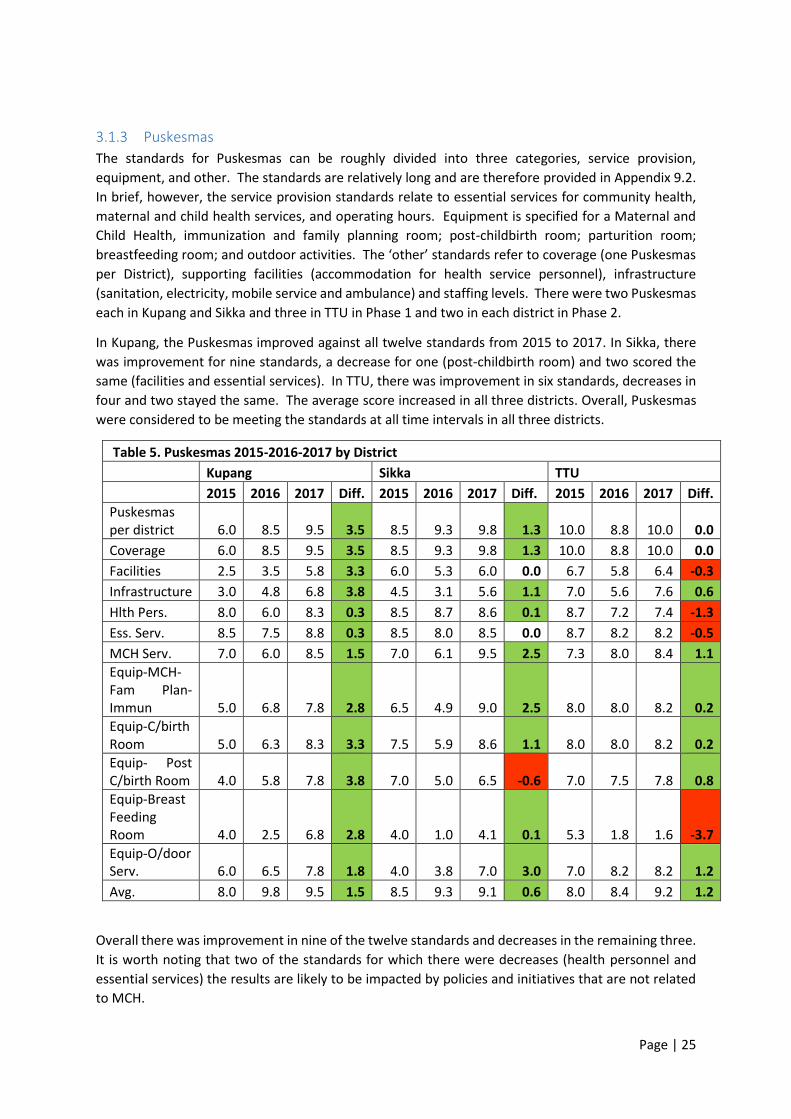
3.1.3 Puskesmas
The standards for Puskesmas can be roughly divided into three categories, service provision,
equipment, and other. The standards are relatively long and are therefore provided in Appendix 9.2.
In brief, however, the service provision standards relate to essential services for community health,
maternal and child health services, and operating hours. Equipment is specified for a Maternal and
Child Health, immunization and family planning room; post-childbirth room; parturition room;
breastfeeding room; and outdoor activities. The ‘other’ standards refer to coverage (one Puskesmas
per District), supporting facilities (accommodation for health service personnel), infrastructure
(sanitation, electricity, mobile service and ambulance) and staffing levels. There were two Puskesmas
each in Kupang and Sikka and three in TTU in Phase 1 and two in each district in Phase 2.
In Kupang, the Puskesmas improved against all twelve standards from 2015 to 2017. In Sikka, there
was improvement for nine standards, a decrease for one (post-childbirth room) and two scored the
same (facilities and essential services). In TTU, there was improvement in six standards, decreases in
four and two stayed the same. The average score increased in all three districts. Overall, Puskesmas
were considered to be meeting the standards at all time intervals in all three districts.
Table 5. Puskesmas 2015-2016-2017 by District
Kupang Sikka TTU
2015 2016 2017 Diff. 2015 2016 2017 Diff. 2015 2016 2017 Diff.
Puskesmas per district 6.0 8.5 9.5 3.5 8.5 9.3 9.8 1.3 10.0 8.8 10.0 0.0
Coverage 6.0 8.5 9.5 3.5 8.5 9.3 9.8 1.3 10.0 8.8 10.0 0.0
Facilities 2.5 3.5 5.8 3.3 6.0 5.3 6.0 0.0 6.7 5.8 6.4 -0.3
Infrastructure 3.0 4.8 6.8 3.8 4.5 3.1 5.6 1.1 7.0 5.6 7.6 0.6
Hlth Pers. 8.0 6.0 8.3 0.3 8.5 8.7 8.6 0.1 8.7 7.2 7.4 -1.3
Ess. Serv. 8.5 7.5 8.8 0.3 8.5 8.0 8.5 0.0 8.7 8.2 8.2 -0.5
MCH Serv. 7.0 6.0 8.5 1.5 7.0 6.1 9.5 2.5 7.3 8.0 8.4 1.1
Equip-MCH-Fam Plan-Immun 5.0 6.8 7.8 2.8 6.5 4.9 9.0 2.5 8.0 8.0 8.2 0.2
Equip-C/birth Room 5.0 6.3 8.3 3.3 7.5 5.9 8.6 1.1 8.0 8.0 8.2 0.2
Equip- Post C/birth Room 4.0 5.8 7.8 3.8 7.0 5.0 6.5 -0.6 7.0 7.5 7.8 0.8
Equip-Breast Feeding Room 4.0 2.5 6.8 2.8 4.0 1.0 4.1 0.1 5.3 1.8 1.6 -3.7
Equip-O/door Serv. 6.0 6.5 7.8 1.8 4.0 3.8 7.0 3.0 7.0 8.2 8.2 1.2
Avg. 8.0 9.8 9.5 1.5 8.5 9.3 9.1 0.6 8.0 8.4 9.2 1.2
Overall there was improvement in nine of the twelve standards and decreases in the remaining three.
It is worth noting that two of the standards for which there were decreases (health personnel and
essential services) the results are likely to be impacted by policies and initiatives that are not related
to MCH.

Page | 26
Table 6. Puskesmas 2015-2016-2017 Overall
Total
2015 2016 2017 Diff.
Puskesmas per district 8.4 8.9 9.8 1.3
Coverage 8.4 8.9 9.8 1.3
Facilities 5.3 4.9 6.1 0.8
Infrastructure 5.1 4.6 6.7 1.6
Health personnel 8.4 7.3 8.0 -0.4
Essential services 8.6 7.9 8.5 -0.1
MCH services 7.1 6.8 8.8 1.6
Equip-MCH-Fam Plan-Immun 6.7 6.7 8.3 1.6
Equip-C/birth Room 7.0 6.8 8.3 1.3
Equip- Post C/birth Room 6.1 6.1 7.4 1.2
Equip-Breast Feeding Room 4.6 1.8 4.0 -0.6
Equip-O/door Serv. 5.9 6.3 7.7 1.8
Avg. 8.1 9.1 9.3 1.1
Across the project as a whole the average scores for Posyandu, Polindes and Puskesmas all improved
which is important as the use of standards supports the proposed mechanisms for changing power
relationships through both making the standards transparent and a direct relationship to government
policy. It also suggests that the increases in householders and officials and cadres’ knowledge of
services being provided and required under standards may actually be linked to increases in the
provision of services not just increases in their knowledge.
3.2 Conclusion
The results from the standards monitoring were very largely positive.
Across the program as a whole, there were positive changes for seven of the eight standards for
Posyandu. The average score increased from 6.4 to 7.6 (out of a maximum of 10). A score of 7.5
was used as the cut-off for whether a service was meeting the standards and so by this measure, on
average, Posyandu services were meeting the standards by the end of the program. There were
statistically significant increases for all eight standards in Kupang, while in both Sikka and TTU there
were increases for six of the eight standards. The average increased for all three districts.
At the Polindes level there was an increase across the project for four out of five standards. The
average increased from 7.4 (just under the cut-off for meeting the standards) to 7.8. There was no
obvious pattern of change across the districts. In Kupang the score increased for all five standards
but the data only represented one Polindes. In both TTU and Sikka, the score only improved for two
of the five standards. Equipment was the only standard for which there was improvement in all
three districts.
For Puskesmas, there was improvement in the scores for standards for nine of the twelve standards.
The average increased from 8.1 to 9.3, which was well over the 7.5 required to be considered to be
meeting the standards. There were more positive changes in Kupang (12 of 12 standards) compared
to either Sikka (9 of 12) or TTU (6 of 12; however, two items started and finished with scores of 10
and therefore could not have improved).
Page | 27
The increases across the project as a whole the average scores for Posyandu, Polindes and
Puskesmas provide good evidence that the quality of services has improved, which was the primary
aim of the program.
Page | 28
4 Score Cards Scorecards were designed during the first year of the project in consultation with community
members. Participants nominated their ideal criteria and then voted on those criteria using 5-point
scales (represented by smiley faces). Where criteria were similar, those were grouped together by the
MEL Coordinator for the project, providing a ‘summary list’ of ideal criteria. Voting processes are
facilitated by GPSA staff and the village facilitator, with scores determined by community members at
a community meeting.
The scorecard data fit into ten general categories for each of the three service levels (Posyandu,
Polindes and Puskesmas). The categories were: 1. Policy; 2. User active; 3. Place; 4. Support; 5. Cost;
6. Structure; 7. Equipment; 8. Personnel; 9. Infrastructure, and 10. Services. However, data was not
available for every category at every time interval.
In all there were 12985 votes cast in 2015, 21081 in 2016 and 22627 in 2017. There was a very large
difference in the number of votes cast across the categories at different time intervals. This affects
whether or not comparisons of data can reasonably be made. Where there were less than 100 votes
for a category at a given time interval that category at that time interval has been excluded from the
analysis. For example, in 2017 there were less than 100 votes relating to cost at Polindes. In both
2015 and 2016 there were more than 100 votes in this category at Polindes level and so the results
from 2015 and 2016 are compared but the results from 2017 are not.
In the analysis below ‘good’ and ‘very good’ votes are considered to be positive votes and ‘poor’ and
‘very poor’ votes are considered to be negative votes.
It should be noted that the use of scorecards has become relatively common in social accountability
practice, but the nature of the cards themselves and the methods employed vary quite widely. The
findings here relate to Citizen Voice and Action methods, and caution should be applied in deciding
whether the learnings from the use of scorecards in this program are portable to other social
accountability interventions.
4.1 All Service levels, all districts
In both 2015 and 2017 there were a very small number of votes in relation to policy and therefore the
policy category has been excluded from the analysis below.
The percentage of votes for ‘very good’ increased from 2016 to 2017 in eight of the nine categories
(all but Place) while the percentage of votes for ‘good’ increased for five of the nine categories (Place,
Support, Structure, Equipment, and Personnel). For the four services that had lower percentages of
‘good’ votes in 2017 than 2016 the overall percentage of positive votes (‘good’ and ‘very good’)
increased for three as the increase in the percentage of ‘very good’ votes increased by more than the
decrease in ‘good votes’. The only categories for which there was an overall decrease in the
percentage of positive votes were User Active and Place.
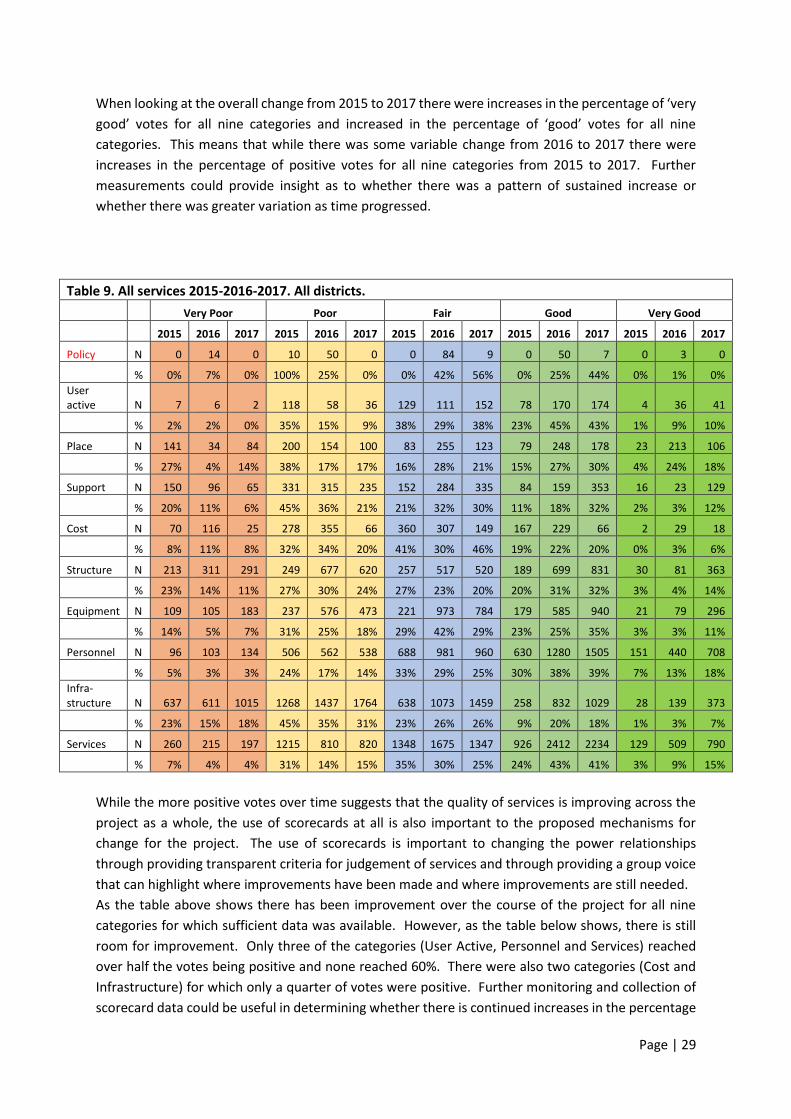
Page | 29
When looking at the overall change from 2015 to 2017 there were increases in the percentage of ‘very
good’ votes for all nine categories and increased in the percentage of ‘good’ votes for all nine
categories. This means that while there was some variable change from 2016 to 2017 there were
increases in the percentage of positive votes for all nine categories from 2015 to 2017. Further
measurements could provide insight as to whether there was a pattern of sustained increase or
whether there was greater variation as time progressed.
Table 9. All services 2015-2016-2017. All districts.
Very Poor Poor Fair Good Very Good
2015 2016 2017 2015 2016 2017 2015 2016 2017 2015 2016 2017 2015 2016 2017
Policy N 0 14 0 10 50 0 0 84 9 0 50 7 0 3 0
% 0% 7% 0% 100% 25% 0% 0% 42% 56% 0% 25% 44% 0% 1% 0%
User active N 7 6 2 118 58 36 129 111 152 78 170 174 4 36 41
% 2% 2% 0% 35% 15% 9% 38% 29% 38% 23% 45% 43% 1% 9% 10%
Place N 141 34 84 200 154 100 83 255 123 79 248 178 23 213 106
% 27% 4% 14% 38% 17% 17% 16% 28% 21% 15% 27% 30% 4% 24% 18%
Support N 150 96 65 331 315 235 152 284 335 84 159 353 16 23 129
% 20% 11% 6% 45% 36% 21% 21% 32% 30% 11% 18% 32% 2% 3% 12%
Cost N 70 116 25 278 355 66 360 307 149 167 229 66 2 29 18
% 8% 11% 8% 32% 34% 20% 41% 30% 46% 19% 22% 20% 0% 3% 6%
Structure N 213 311 291 249 677 620 257 517 520 189 699 831 30 81 363
% 23% 14% 11% 27% 30% 24% 27% 23% 20% 20% 31% 32% 3% 4% 14%
Equipment N 109 105 183 237 576 473 221 973 784 179 585 940 21 79 296
% 14% 5% 7% 31% 25% 18% 29% 42% 29% 23% 25% 35% 3% 3% 11%
Personnel N 96 103 134 506 562 538 688 981 960 630 1280 1505 151 440 708
% 5% 3% 3% 24% 17% 14% 33% 29% 25% 30% 38% 39% 7% 13% 18%
Infra-structure N 637 611 1015 1268 1437 1764 638 1073 1459 258 832 1029 28 139 373
% 23% 15% 18% 45% 35% 31% 23% 26% 26% 9% 20% 18% 1% 3% 7%
Services N 260 215 197 1215 810 820 1348 1675 1347 926 2412 2234 129 509 790
% 7% 4% 4% 31% 14% 15% 35% 30% 25% 24% 43% 41% 3% 9% 15%
While the more positive votes over time suggests that the quality of services is improving across the
project as a whole, the use of scorecards at all is also important to the proposed mechanisms for
change for the project. The use of scorecards is important to changing the power relationships
through providing transparent criteria for judgement of services and through providing a group voice
that can highlight where improvements have been made and where improvements are still needed.
As the table above shows there has been improvement over the course of the project for all nine
categories for which sufficient data was available. However, as the table below shows, there is still
room for improvement. Only three of the categories (User Active, Personnel and Services) reached
over half the votes being positive and none reached 60%. There were also two categories (Cost and
Infrastructure) for which only a quarter of votes were positive. Further monitoring and collection of
scorecard data could be useful in determining whether there is continued increases in the percentage
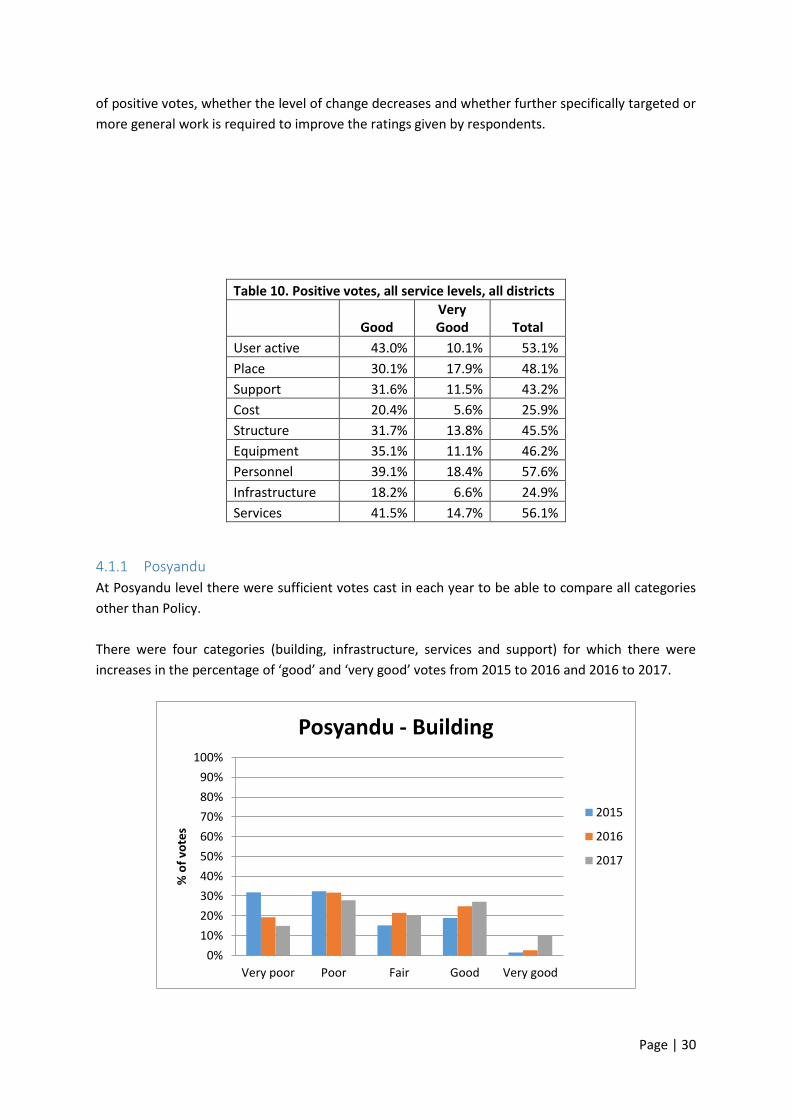
Page | 30
of positive votes, whether the level of change decreases and whether further specifically targeted or
more general work is required to improve the ratings given by respondents.
Table 10. Positive votes, all service levels, all districts
Good Very Good Total
User active 43.0% 10.1% 53.1%
Place 30.1% 17.9% 48.1%
Support 31.6% 11.5% 43.2%
Cost 20.4% 5.6% 25.9%
Structure 31.7% 13.8% 45.5%
Equipment 35.1% 11.1% 46.2%
Personnel 39.1% 18.4% 57.6%
Infrastructure 18.2% 6.6% 24.9%
Services 41.5% 14.7% 56.1%
4.1.1 Posyandu
At Posyandu level there were sufficient votes cast in each year to be able to compare all categories
other than Policy.
There were four categories (building, infrastructure, services and support) for which there were
increases in the percentage of ‘good’ and ‘very good’ votes from 2015 to 2016 and 2016 to 2017.
0%
10%
20%
30%
40%
50%
60%
70%
80%
90%
100%
Very poor Poor Fair Good Very good
% o
f vo
tes
Posyandu - Building
2015
2016
2017
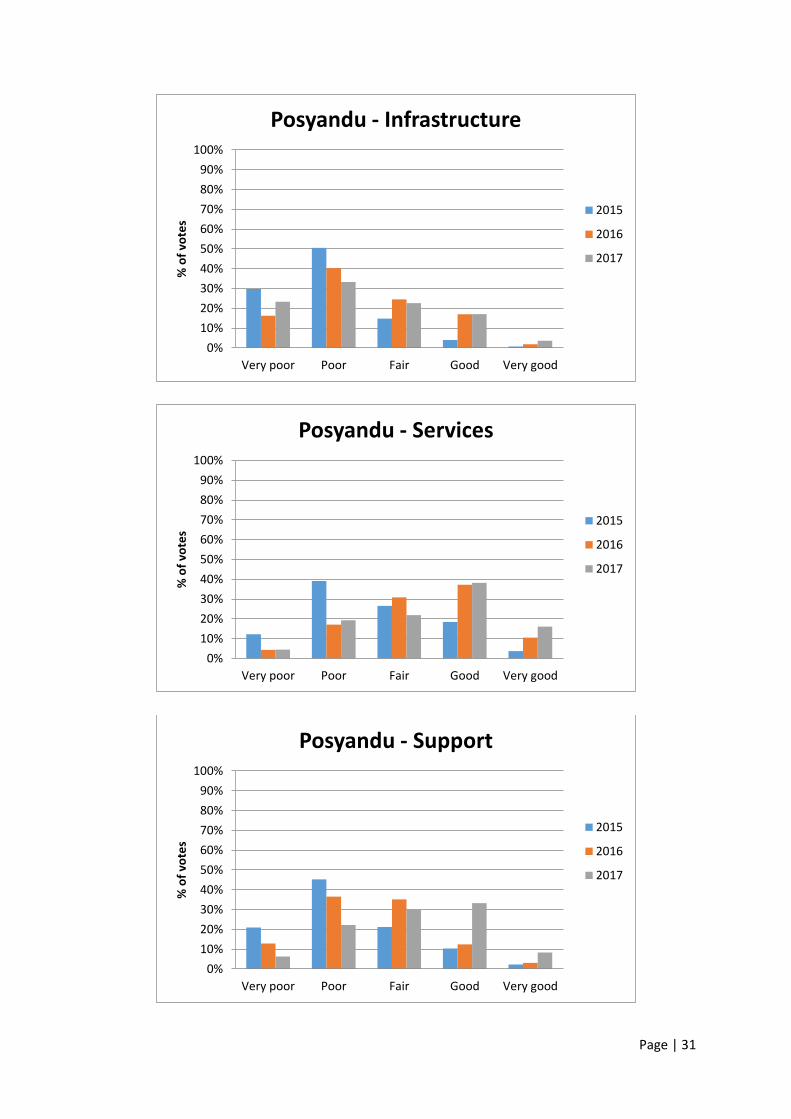
Page | 31
0%
10%
20%
30%
40%
50%
60%
70%
80%
90%
100%
Very poor Poor Fair Good Very good
% o
f vo
tes
Posyandu - Infrastructure
2015
2016
2017
0%
10%
20%
30%
40%
50%
60%
70%
80%
90%
100%
Very poor Poor Fair Good Very good
% o
f vo
tes
Posyandu - Services
2015
2016
2017
0%
10%
20%
30%
40%
50%
60%
70%
80%
90%
100%
Very poor Poor Fair Good Very good
% o
f vo
tes
Posyandu - Support
2015
2016
2017

Page | 32
There were another four categories (active user, equipment, personnel and place) for which there
were increases in the percentage of ‘good’ and ‘very good’ votes over the two years but not for both
years treated separately.
Active user and place both saw increases in the percentage of ‘good’ and ‘very good’ votes from 2015
to 2016 but small decreases in both the percentage of ‘good’ and the percentage of ‘very good’ votes
from 2016 to 2017.
For equipment there was a small increase in the percentage of ‘good’ votes from 2015 to 2016 but a
small decrease in the percentage of ‘very good’ votes in the same time period. From 2016 to 2017
there was a larger increase in both the percentage of ‘good’ and the percentage of ‘very good’ votes
resulting in an increase overall for both.
0%
10%
20%
30%
40%
50%
60%
70%
80%
90%
100%
Very poor Poor Fair Good Very good
% o
f vo
tes
Posyandu - Active User
2015
2016
2017
0%
10%
20%
30%
40%
50%
60%
70%
80%
90%
100%
Very poor Poor Fair Good Very good
% o
f vo
tes
Posyandu - Place
2015
2016
2017
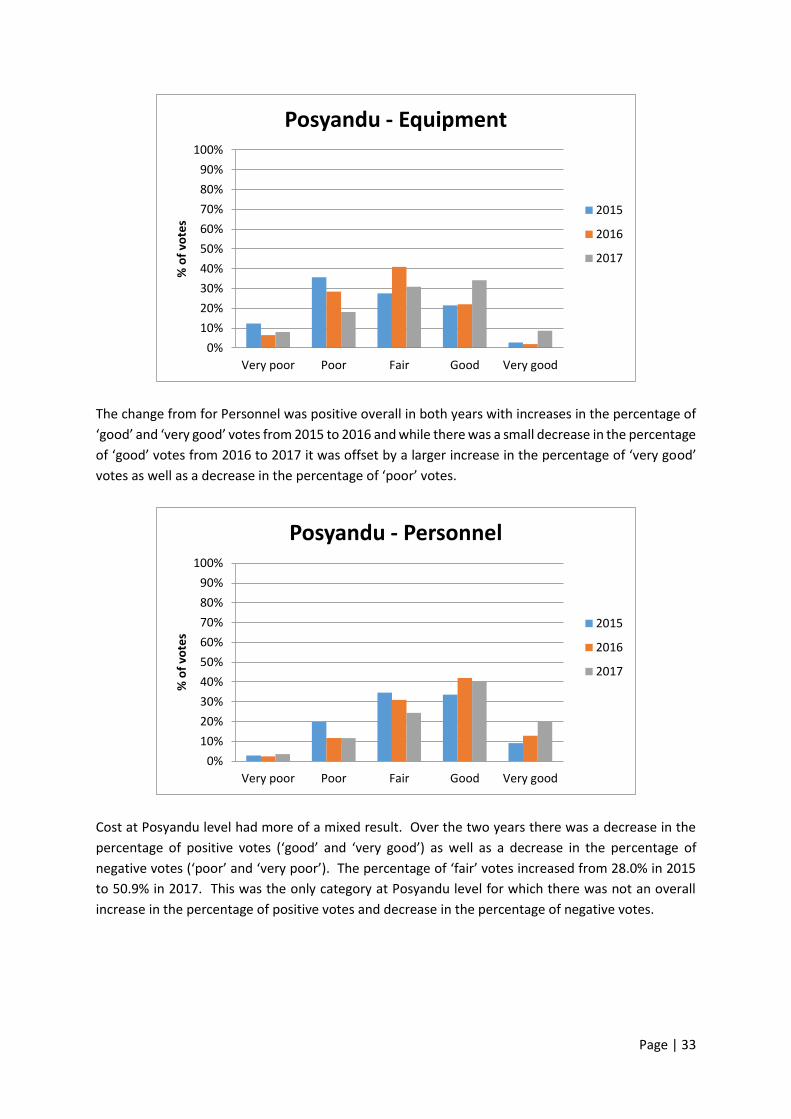
Page | 33
The change from for Personnel was positive overall in both years with increases in the percentage of
‘good’ and ‘very good’ votes from 2015 to 2016 and while there was a small decrease in the percentage
of ‘good’ votes from 2016 to 2017 it was offset by a larger increase in the percentage of ‘very good’
votes as well as a decrease in the percentage of ‘poor’ votes.
Cost at Posyandu level had more of a mixed result. Over the two years there was a decrease in the
percentage of positive votes (‘good’ and ‘very good’) as well as a decrease in the percentage of
negative votes (‘poor’ and ‘very poor’). The percentage of ‘fair’ votes increased from 28.0% in 2015
to 50.9% in 2017. This was the only category at Posyandu level for which there was not an overall
increase in the percentage of positive votes and decrease in the percentage of negative votes.
0%
10%
20%
30%
40%
50%
60%
70%
80%
90%
100%
Very poor Poor Fair Good Very good
% o
f vo
tes
Posyandu - Equipment
2015
2016
2017
0%
10%
20%
30%
40%
50%
60%
70%
80%
90%
100%
Very poor Poor Fair Good Very good
% o
f vo
tes
Posyandu - Personnel
2015
2016
2017
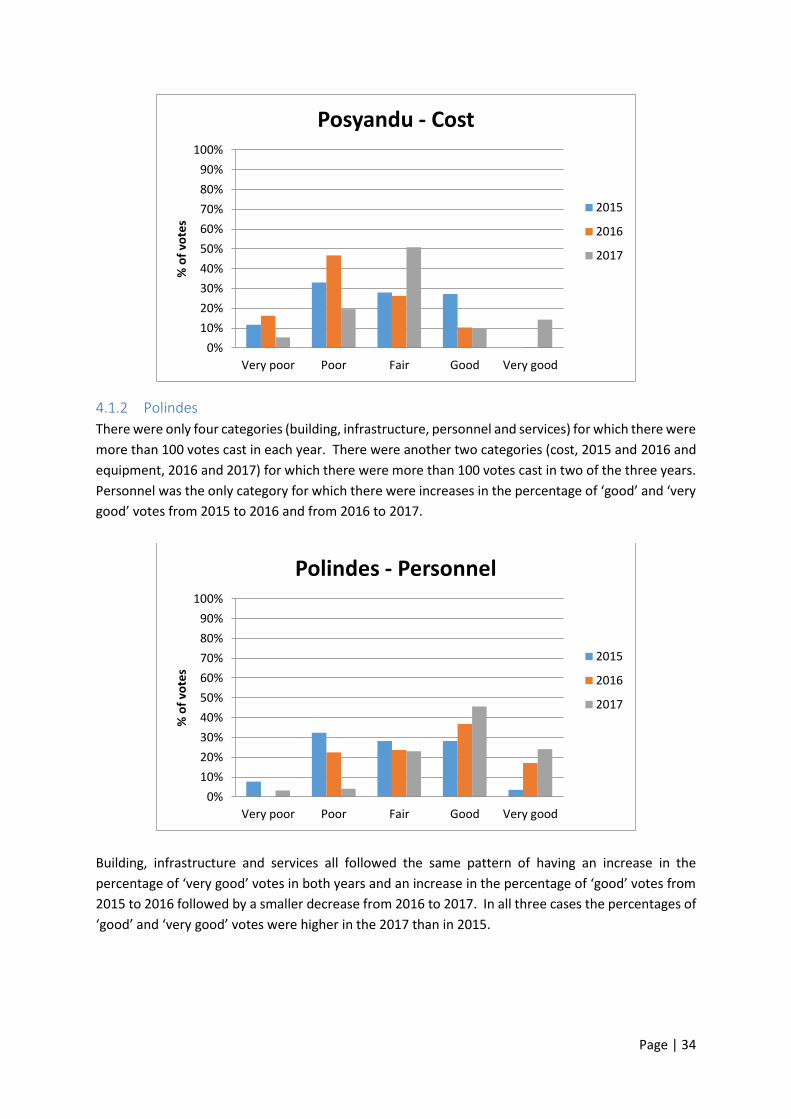
Page | 34
4.1.2 Polindes
There were only four categories (building, infrastructure, personnel and services) for which there were
more than 100 votes cast in each year. There were another two categories (cost, 2015 and 2016 and
equipment, 2016 and 2017) for which there were more than 100 votes cast in two of the three years.
Personnel was the only category for which there were increases in the percentage of ‘good’ and ‘very
good’ votes from 2015 to 2016 and from 2016 to 2017.
Building, infrastructure and services all followed the same pattern of having an increase in the
percentage of ‘very good’ votes in both years and an increase in the percentage of ‘good’ votes from
2015 to 2016 followed by a smaller decrease from 2016 to 2017. In all three cases the percentages of
‘good’ and ‘very good’ votes were higher in the 2017 than in 2015.
0%
10%
20%
30%
40%
50%
60%
70%
80%
90%
100%
Very poor Poor Fair Good Very good
% o
f vo
tes
Posyandu - Cost
2015
2016
2017
0%
10%
20%
30%
40%
50%
60%
70%
80%
90%
100%
Very poor Poor Fair Good Very good
% o
f vo
tes
Polindes - Personnel
2015
2016
2017

Page | 35
0%
10%
20%
30%
40%
50%
60%
70%
80%
90%
100%
Very poor Poor Fair Good Very good
% o
f vo
tes
Polindes - Building
2015
2016
2017
0%
10%
20%
30%
40%
50%
60%
70%
80%
90%
100%
Very poor Poor Fair Good Very good
% o
f vo
tes
Polindes - Infrastructure
2015
2016
2017
0%
10%
20%
30%
40%
50%
60%
70%
80%
90%
100%
Very poor Poor Fair Good Very good
% o
f vo
tes
Polindes - Services
2015
2016
2017
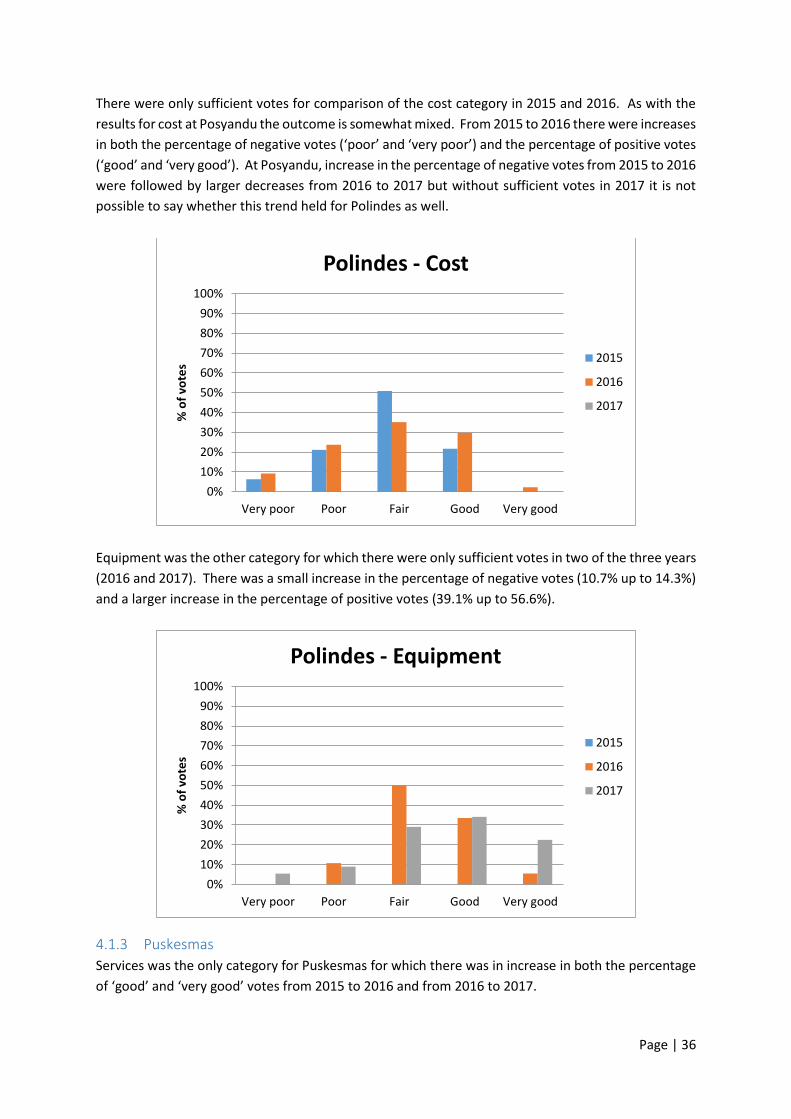
Page | 36
There were only sufficient votes for comparison of the cost category in 2015 and 2016. As with the
results for cost at Posyandu the outcome is somewhat mixed. From 2015 to 2016 there were increases
in both the percentage of negative votes (‘poor’ and ‘very poor’) and the percentage of positive votes
(‘good’ and ‘very good’). At Posyandu, increase in the percentage of negative votes from 2015 to 2016
were followed by larger decreases from 2016 to 2017 but without sufficient votes in 2017 it is not
possible to say whether this trend held for Polindes as well.
Equipment was the other category for which there were only sufficient votes in two of the three years
(2016 and 2017). There was a small increase in the percentage of negative votes (10.7% up to 14.3%)
and a larger increase in the percentage of positive votes (39.1% up to 56.6%).
4.1.3 Puskesmas
Services was the only category for Puskesmas for which there was in increase in both the percentage
of ‘good’ and ‘very good’ votes from 2015 to 2016 and from 2016 to 2017.
0%
10%
20%
30%
40%
50%
60%
70%
80%
90%
100%
Very poor Poor Fair Good Very good
% o
f vo
tes
Polindes - Cost
2015
2016
2017
0%
10%
20%
30%
40%
50%
60%
70%
80%
90%
100%
Very poor Poor Fair Good Very good
% o
f vo
tes
Polindes - Equipment
2015
2016
2017
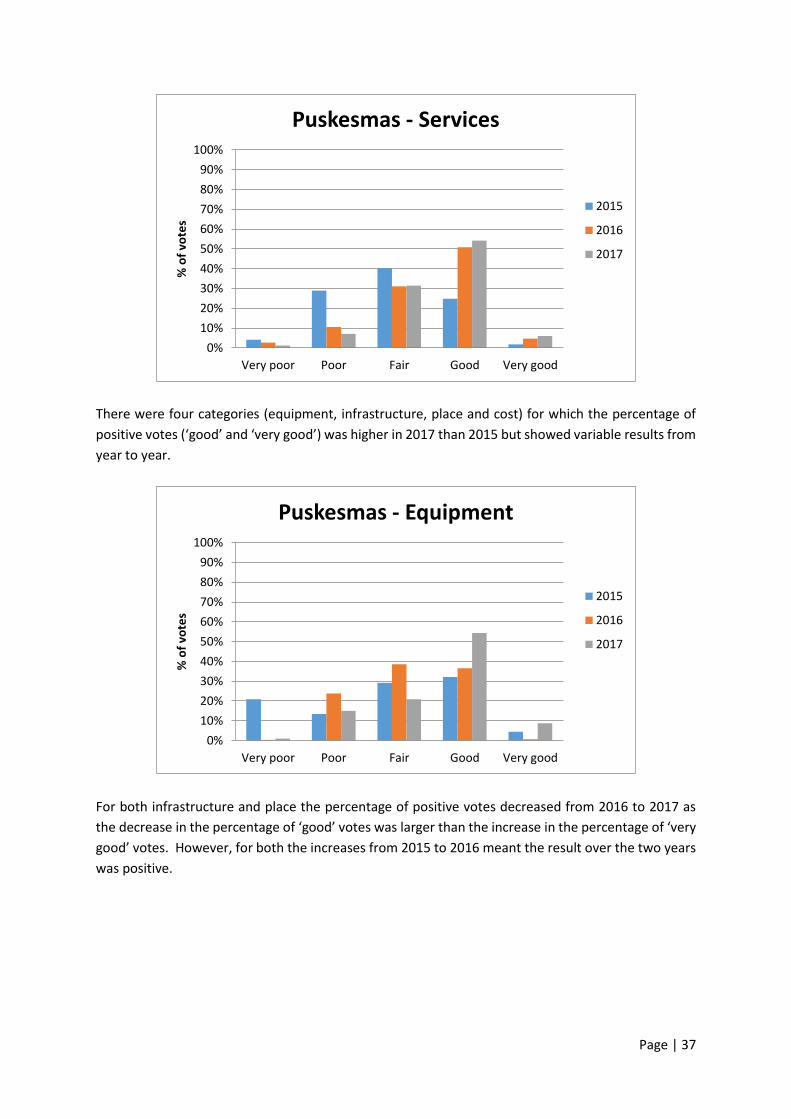
Page | 37
There were four categories (equipment, infrastructure, place and cost) for which the percentage of
positive votes (‘good’ and ‘very good’) was higher in 2017 than 2015 but showed variable results from
year to year.
For both infrastructure and place the percentage of positive votes decreased from 2016 to 2017 as
the decrease in the percentage of ‘good’ votes was larger than the increase in the percentage of ‘very
good’ votes. However, for both the increases from 2015 to 2016 meant the result over the two years
was positive.
0%
10%
20%
30%
40%
50%
60%
70%
80%
90%
100%
Very poor Poor Fair Good Very good
% o
f vo
tes
Puskesmas - Services
2015
2016
2017
0%
10%
20%
30%
40%
50%
60%
70%
80%
90%
100%
Very poor Poor Fair Good Very good
% o
f vo
tes
Puskesmas - Equipment
2015
2016
2017

Page | 38
Cost was, again, the least positive category in terms of change. There was a large increase in the
percentage of positive votes from 2015 to 2016 but a significant drop from 2016 to 2017. In 2017
there were no votes for ‘very good’. The overall outcome for the category was still positive as there
was a decrease in the percentage of negative votes over the two years. The change from 2016 to 2017
does provide some concern as there was an increase in the percentage of ‘very poor’, ‘poor’ and ‘fair’
votes and a decrease in the percentage of ‘good’ and ‘very good’ votes.
0%
10%
20%
30%
40%
50%
60%
70%
80%
90%
100%
Very poor Poor Fair Good Very good
% o
f vo
tes
Puskesmas - Infrastructure
2015
2016
2017
0%
10%
20%
30%
40%
50%
60%
70%
80%
90%
100%
Very poor Poor Fair Good Very good
% o
f vo
tes
Puskesmas - Place
2015
2016
2017
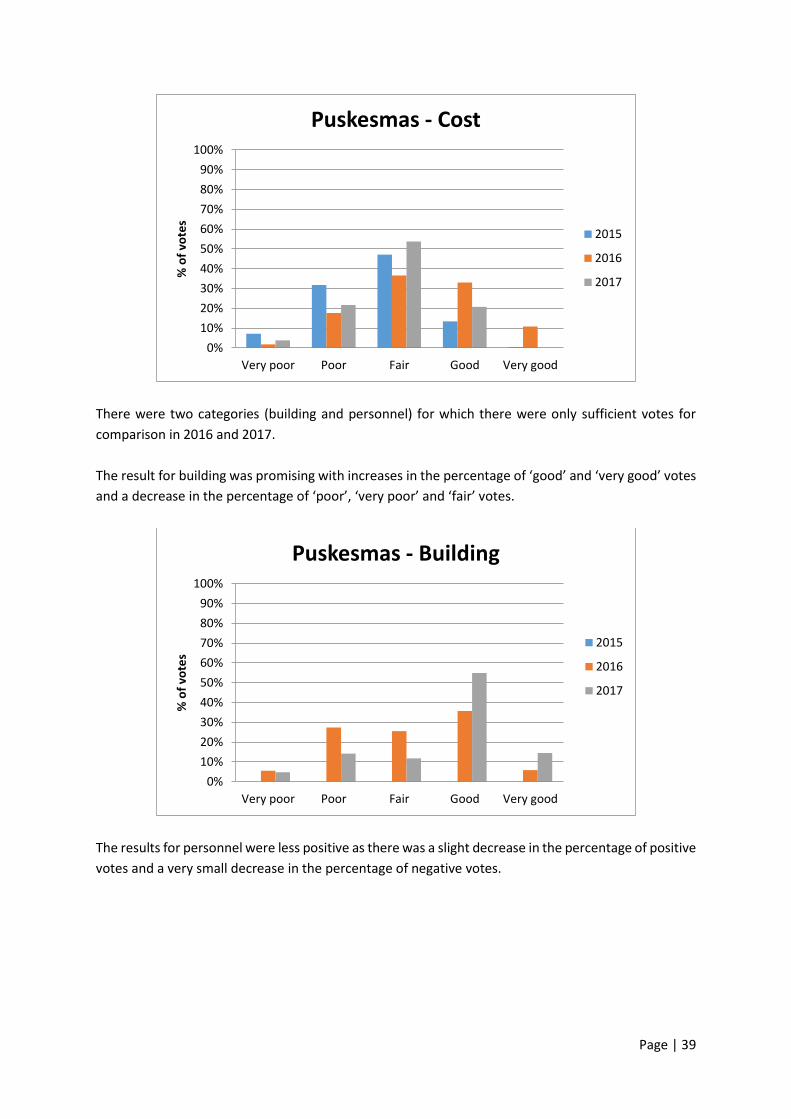
Page | 39
There were two categories (building and personnel) for which there were only sufficient votes for
comparison in 2016 and 2017.
The result for building was promising with increases in the percentage of ‘good’ and ‘very good’ votes
and a decrease in the percentage of ‘poor’, ‘very poor’ and ‘fair’ votes.
The results for personnel were less positive as there was a slight decrease in the percentage of positive
votes and a very small decrease in the percentage of negative votes.
0%
10%
20%
30%
40%
50%
60%
70%
80%
90%
100%
Very poor Poor Fair Good Very good
% o
f vo
tes
Puskesmas - Cost
2015
2016
2017
0%
10%
20%
30%
40%
50%
60%
70%
80%
90%
100%
Very poor Poor Fair Good Very good
% o
f vo
tes
Puskesmas - Building
2015
2016
2017
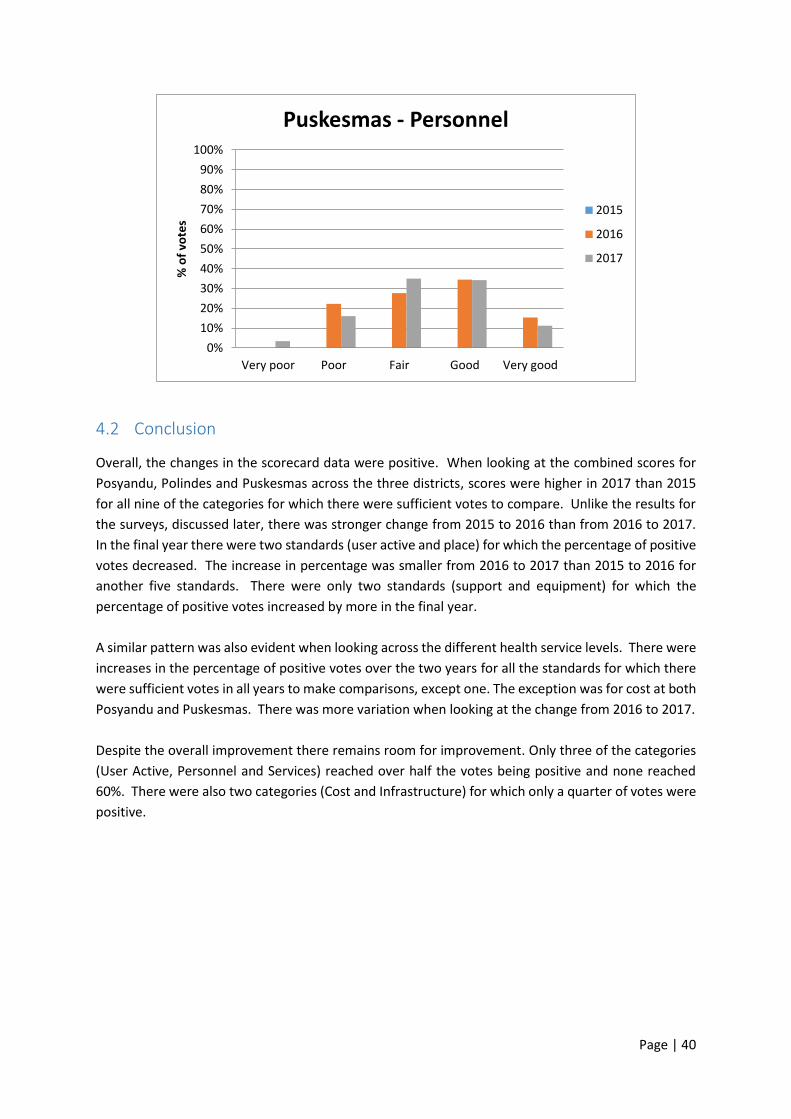
Page | 40
4.2 Conclusion
Overall, the changes in the scorecard data were positive. When looking at the combined scores for
Posyandu, Polindes and Puskesmas across the three districts, scores were higher in 2017 than 2015
for all nine of the categories for which there were sufficient votes to compare. Unlike the results for
the surveys, discussed later, there was stronger change from 2015 to 2016 than from 2016 to 2017.
In the final year there were two standards (user active and place) for which the percentage of positive
votes decreased. The increase in percentage was smaller from 2016 to 2017 than 2015 to 2016 for
another five standards. There were only two standards (support and equipment) for which the
percentage of positive votes increased by more in the final year.
A similar pattern was also evident when looking across the different health service levels. There were
increases in the percentage of positive votes over the two years for all the standards for which there
were sufficient votes in all years to make comparisons, except one. The exception was for cost at both
Posyandu and Puskesmas. There was more variation when looking at the change from 2016 to 2017.
Despite the overall improvement there remains room for improvement. Only three of the categories
(User Active, Personnel and Services) reached over half the votes being positive and none reached
60%. There were also two categories (Cost and Infrastructure) for which only a quarter of votes were
positive.
0%
10%
20%
30%
40%
50%
60%
70%
80%
90%
100%
Very poor Poor Fair Good Very good
% o
f vo
tes
Puskesmas - Personnel
2015
2016
2017

Page | 41
5 Household Survey Data Analysis Two surveys were developed to provide data for the evaluation. The first was a survey for households
in the target population (the target group for the program is women and children under the age of 5
years. The target group for the survey was parents, and most commonly mothers, in the target
population). The second was a survey for officials and health cadres (volunteers in local health
services). Each survey collects information about knowledge of maternal and child health services,
knowledge of standards for those services, and health insurance. Survey questions were developed
to meet project outcome indicators required by the funding body and to test aspects of the
‘knowledge and awareness’ mechanism.
Detailed tables underpinning this section are provided in Appendix 9.3.
5.1 Demographic Data
Almost all respondents to the household survey were women as the data collectors were supposed to
target mothers. 602 of 606 (99.3%) respondents in 2017/18 were women.
Almost half of the respondents were between the ages of 30 and 40 while another third were between
the ages of 20 and 30.
Table 11. Age of respondents
N %
Below 20 years 11 1.8
20-30 years 213 35.1
30-40 years 286 47.2
40-50 years 81 13.4
Over 50 years 15 2.5
Total 606
The largest percentage of respondents, at a little under half, had completed junior school. The next
highest group, at a little over a quarter, had completed a diploma or bachelor degree.
Table 12. Respondent’s education level
N %
Did not complete elementary school 4 0.7
Completed elementary school 22 3.6
Completed junior school 278 45.9
Completed senior school 108 17.8
Completed diploma or bachelor degree 164 27.1
Other 30 5.0
Total 606
Almost three quarters of respondents did not have a child under the age of one. Over three quarters
of respondents had one child under five years of age. There were very few respondents who either
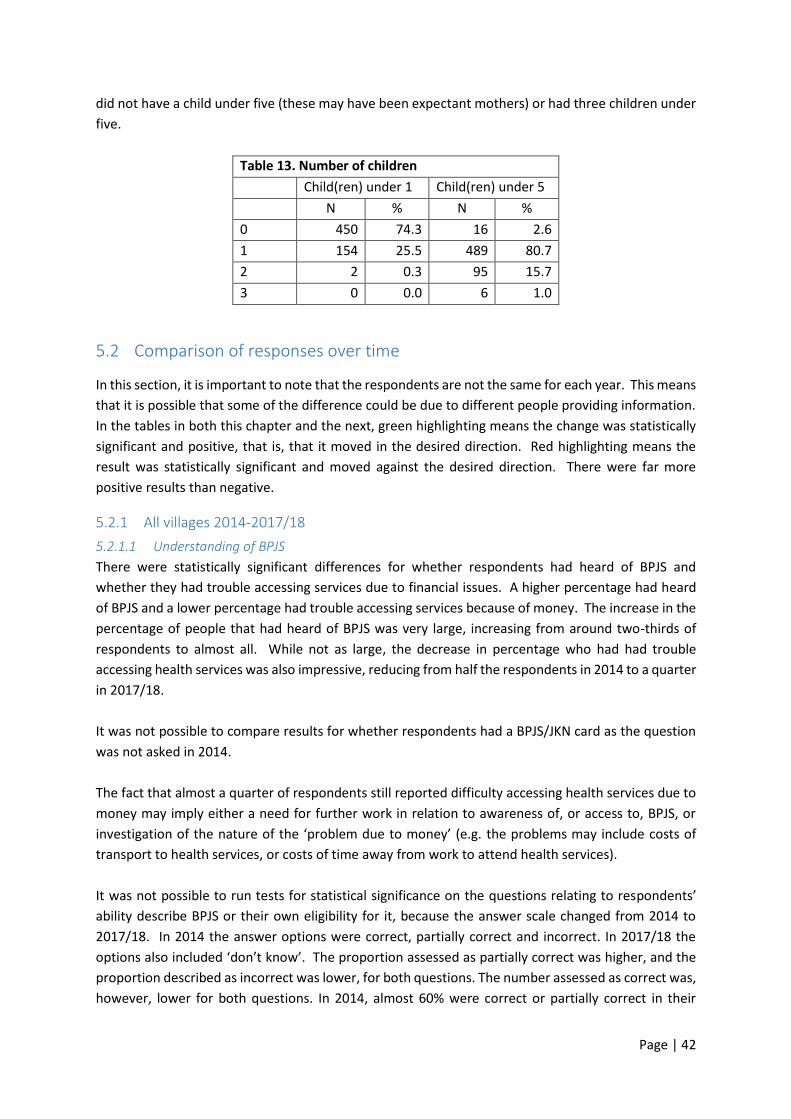
Page | 42
did not have a child under five (these may have been expectant mothers) or had three children under
five.
Table 13. Number of children
Child(ren) under 1 Child(ren) under 5
N % N %
0 450 74.3 16 2.6
1 154 25.5 489 80.7
2 2 0.3 95 15.7
3 0 0.0 6 1.0
5.2 Comparison of responses over time
In this section, it is important to note that the respondents are not the same for each year. This means
that it is possible that some of the difference could be due to different people providing information.
In the tables in both this chapter and the next, green highlighting means the change was statistically
significant and positive, that is, that it moved in the desired direction. Red highlighting means the
result was statistically significant and moved against the desired direction. There were far more
positive results than negative.
5.2.1 All villages 2014-2017/18
5.2.1.1 Understanding of BPJS
There were statistically significant differences for whether respondents had heard of BPJS and
whether they had trouble accessing services due to financial issues. A higher percentage had heard
of BPJS and a lower percentage had trouble accessing services because of money. The increase in the
percentage of people that had heard of BPJS was very large, increasing from around two-thirds of
respondents to almost all. While not as large, the decrease in percentage who had had trouble
accessing health services was also impressive, reducing from half the respondents in 2014 to a quarter
in 2017/18.
It was not possible to compare results for whether respondents had a BPJS/JKN card as the question
was not asked in 2014.
The fact that almost a quarter of respondents still reported difficulty accessing health services due to
money may imply either a need for further work in relation to awareness of, or access to, BPJS, or
investigation of the nature of the ‘problem due to money’ (e.g. the problems may include costs of
transport to health services, or costs of time away from work to attend health services).
It was not possible to run tests for statistical significance on the questions relating to respondents’
ability describe BPJS or their own eligibility for it, because the answer scale changed from 2014 to
2017/18. In 2014 the answer options were correct, partially correct and incorrect. In 2017/18 the
options also included ‘don’t know’. The proportion assessed as partially correct was higher, and the
proportion described as incorrect was lower, for both questions. The number assessed as correct was,
however, lower for both questions. In 2014, almost 60% were correct or partially correct in their

Page | 43
description of BPJS and this increased to just over 82% in 2017/18. The proportion correct or partially
correct in their description of their own eligibility remained relatively stable at around 95%.
5.2.1.2 Knowledge of Health Services
There was a large, statistically significant increase in the percentage of respondents who had heard of
minimum standards for MNCH from 2014 to 2017/18. The percentage who responded positively in
2017/18 (71.0%) was over double that of 2014 (30.1%). This is important because knowing that there
are minimum standards is a necessary pre-requisite for trying to hold service providers and
governments accountable for meeting those standards.
For knowing where services are located, there were statistically significant differences for knowing
the locations of Polindes and Puskesmas but not for Posyandu. This is probably at least partially due
to the fact that almost everyone was able to identify the locations of Posyandu in both years. The
increases were small but there was also little room for improvement, as over 90% of respondents were
able to identify the location of Polindes and Puskesmas at the beginning of the program.
There were statistically significant differences in the percentage of respondents who had received
services at Polindes and Puskesmas levels of health service. The increase was relatively small but it
should also be noted that it is possible that some respondents did not need the service. Further, the
initial percentages were high (84.9% or above), so there was not a lot of room for improvement.
There were statistically significant differences for all three service levels in terms of respondent
satisfaction with services provided. At all three levels, there was an improvement in satisfaction levels.
The percentages that were ‘very satisfied’ increased around fourfold from 2014 to 2017/18. The
percentage who were unsatisfied or very unsatisfied with services decreased by 11.1% for Posyandu
services, 15.7% for Polindes services, and 9.5% for Puskesmas services.
5.2.1.3 Posyandu
Questions in relation to services provided investigated whether respondents believed that specific
services were provided at a particular level in their local services; and whether they believed that they
were required to be provided under the government standards.
For individual services provided at Posyandu, eight of ten services showed statistically significant
differences. The two that did not were provision of Vitamin A and tetanus vaccinations. The
differences were quite large for immunisation and family planning and extremely large for nutrition
advice. The differences were smaller but still statistically significant for weighing and measuring
babies, addressing diarrhoea and supplementary feeding. Two services, health checks for pregnant
women and iron and zinc supplements had negative statistically significant changes. There was a large
decrease in the percentage that reported that iron/zinc supplements were being provided and a
smaller but important decrease in the percentage that reported that health checks were being
provided for pregnant women. This result is particularly interesting as there were increases in the
percentage of respondents who reported that health checks were being provided for pregnant women
at both Polindes and Puskesmas.

Page | 44
The tables below show the change from 2014 to 2017/18. ‘Total’ is the number of respondents to the
survey, ‘N’ represents the number of respondents who reported that a service is either provided or
required to be provided under the standards – depending on the question – and ‘%’ is the percentage
of the total who reported the service is provided or required.
In the graphs, a legend entry in red indicates that there was a statistically significant change from 2016
to 2017/18 while a legend entry in italics indicates that there was a statistically difference from 2014
to 2017/18. A legend entry in both indicates that there was a statistically significant difference over
both time periods.
There were statistically significant changes from 2014 to 2017/18 for all but one service (health checks
for pregnant women). There was only one service (iron and zinc supplements) for which the change
was negative.
All but three of the services (immunisation, weighing and measuring babies and tetanus vaccinations)
showed statistically significant, positive changes from 2016 to 2017/18. There were no statistically
significant decreases from 2016 to 2017/18.
While awareness of the services provided generally improved, it is perhaps important to note that
there were only five services which were identified by more than half of the respondents (weighing
and measuring babies, immunisation, nutrition advice and supplementary feeding and provision of
Vitamin A). For everything except weighing and measuring babies, more than a quarter of respondents
did not identify that the service was available. This may suggest that many Posyandu are providing a
smaller range of services than expected; or that there is still significant room for improving
understanding amongst families with young children about the range of services available.
0
10
20
30
40
50
60
70
80
90
100
2014 2015 2016 2017/18
% o
f re
spo
nd
en
ts
% of respondents who reported… (Services)
Immunisation
Nutrition Advice
Weighing and measuringbabiesAddressing diarrhoea
Family planning
Provision of Vitamin A
Supplementary feeding
Health checks for pregnantwomenTetanus vaccinations
Iron/Zinc supplements

Page | 45
In terms of services required to be provided by Posyandu, there were statistically significant differences
between 2014 and 2017/18 for all 10 services. The changes were positive for all but iron and zinc
supplements. The same pattern was also true for changes from 2016 to 2017/18.
There were very large differences over the course of the four years for immunisation, nutrition advice,
weighing and measuring babies and family planning, moderate increases for addressing diarrhoea,
provision of Vitamin A and supplementary feeding and a small increase for tetanus vaccinations.
Perhaps the most important finding in this section relates to health checks for pregnant women. In
the qualitative data from earlier years, a number of respondents suggested that improvements in
rates of health checks by pregnant women were important achievements. This may well be the case.
However, in this household survey in 2017/18, only around a third of respondents identified that this
service was provided or should be provided, at Posyandu. Given the importance of health checks
during pregnancy for maternal and child wellbeing, it would appear that this should be a focus in
future community awareness activities in the program.
It should also be noted that in 2016 the proportions of people who could identify what services were
supposed to be provided was lower than those who could identify the services that were provided.
This however changed in 2017/18 with a higher percentage of respondents reporting that seven of
the ten services should be provided compared to those that reported that service was being provided.
5.2.1.4 Polindes
There were statistically significant improvements in identification for all six services listed for Polindes
from 2014 to 2017/18. The biggest impact was for family planning. There were also moderate to large
increases for health checks for both pregnant women and babies and young children and for tetanus
0
10
20
30
40
50
60
70
80
90
100
2014 2015 2016 2017/18
% o
f re
spo
nd
en
ts
% of respondents who reported… (Standards) Immunisation
Nutrition Advice
Weighing and measuringbabiesAddressing diarrhoea
Family planning
Provision of Vitamin A
Supplementary feeding
Health checks forpregnant womenTetanus vaccinations
Iron/Zinc supplements
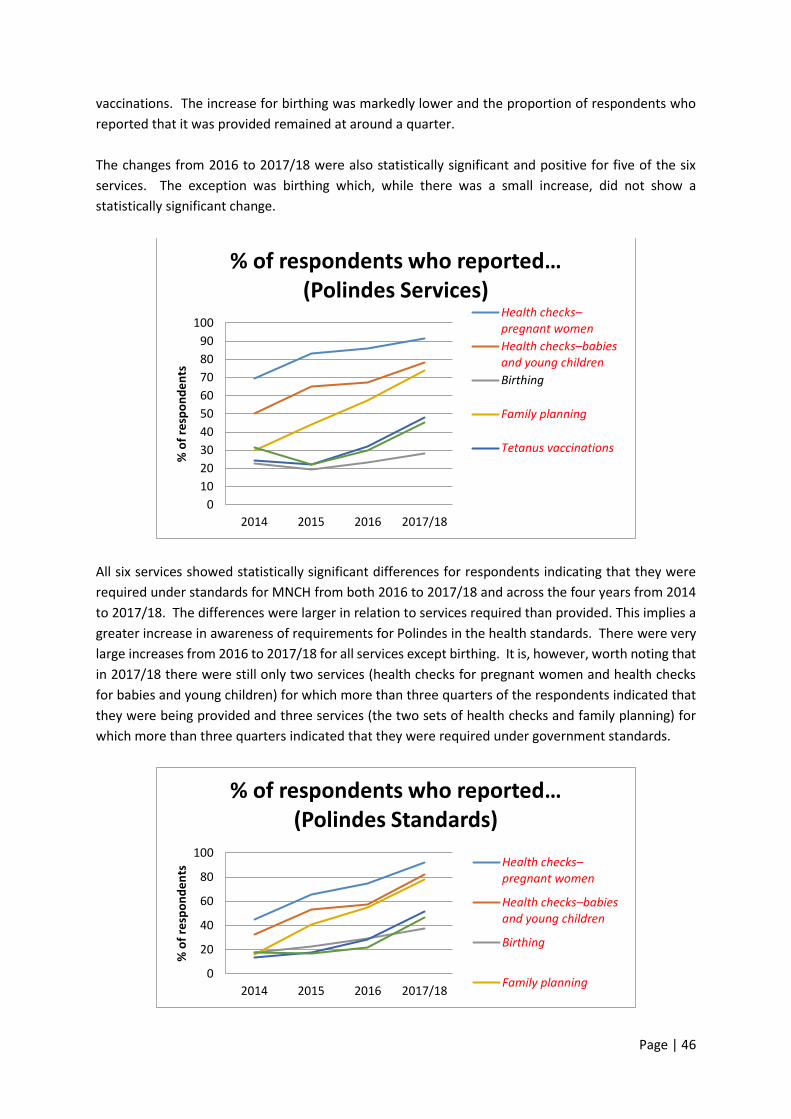
Page | 46
vaccinations. The increase for birthing was markedly lower and the proportion of respondents who
reported that it was provided remained at around a quarter.
The changes from 2016 to 2017/18 were also statistically significant and positive for five of the six
services. The exception was birthing which, while there was a small increase, did not show a
statistically significant change.
All six services showed statistically significant differences for respondents indicating that they were
required under standards for MNCH from both 2016 to 2017/18 and across the four years from 2014
to 2017/18. The differences were larger in relation to services required than provided. This implies a
greater increase in awareness of requirements for Polindes in the health standards. There were very
large increases from 2016 to 2017/18 for all services except birthing. It is, however, worth noting that
in 2017/18 there were still only two services (health checks for pregnant women and health checks
for babies and young children) for which more than three quarters of the respondents indicated that
they were being provided and three services (the two sets of health checks and family planning) for
which more than three quarters indicated that they were required under government standards.
0
10
20
30
40
50
60
70
80
90
100
2014 2015 2016 2017/18
% o
f re
spo
nd
en
ts
% of respondents who reported… (Polindes Services)
Health checks–pregnant women
Health checks–babies and young children
Birthing
Family planning
Tetanus vaccinations
0
20
40
60
80
100
2014 2015 2016 2017/18
% o
f re
spo
nd
en
ts
% of respondents who reported… (Polindes Standards)
Health checks–pregnant women
Health checks–babies and young children
Birthing
Family planning

Page | 47
5.2.1.5 Puskesmas
At Puskesmas level there were two services which could not be compared across the years as they
were not listed in 2014. These were immunisation and treatment for malnourishment. From the
twelve that could be compared, there were eleven positive changes that were statistically significant.
Iron and zinc supplements were the only service for which there was not a statistically significant
change. The largest change was, again, for family planning. There were large increases for seeing a
doctor, health checks for pregnant women and birthing and small to moderate increases for the other
services for which there were statistically significant differences. In 2017/18 awareness levels still
varied widely, from around 15% of respondents for complications with newborns and complementary
feeding to almost 90% for Health checks for pregnant women and birthing.
There were statistically significant increases from 2016 to 2017/18 for all fourteen services. The
increase in the percentage of respondents who reported iron and zinc supplements was large enough
to mean that there was an increase – although not statistically significant – over the four years, despite
a decrease in the first year of the project (2014 to 2015). This pattern was also evident for seeing a
doctor, complementary feeding and nutrition advice for mothers. For these last three services, the
increases were statistically significant over the course of the project.
0
10
20
30
40
50
60
70
80
90
100
2014 2015 2016 2017/18
% o
f re
spo
nd
en
ts
% of respondents who reported… (Puskesmas Services)
See a doctor
Health check–pregnant womenBirthing
Complications withnewbornsHealth check–babies and young childrenComplementary feeding
Services for children under 5
Nutrition advice–mothers
Nutrition advice–children
Family planning
Immunisation
Malnourishment treatment
Tetanus vaccinations
Iron/Zinc supplements
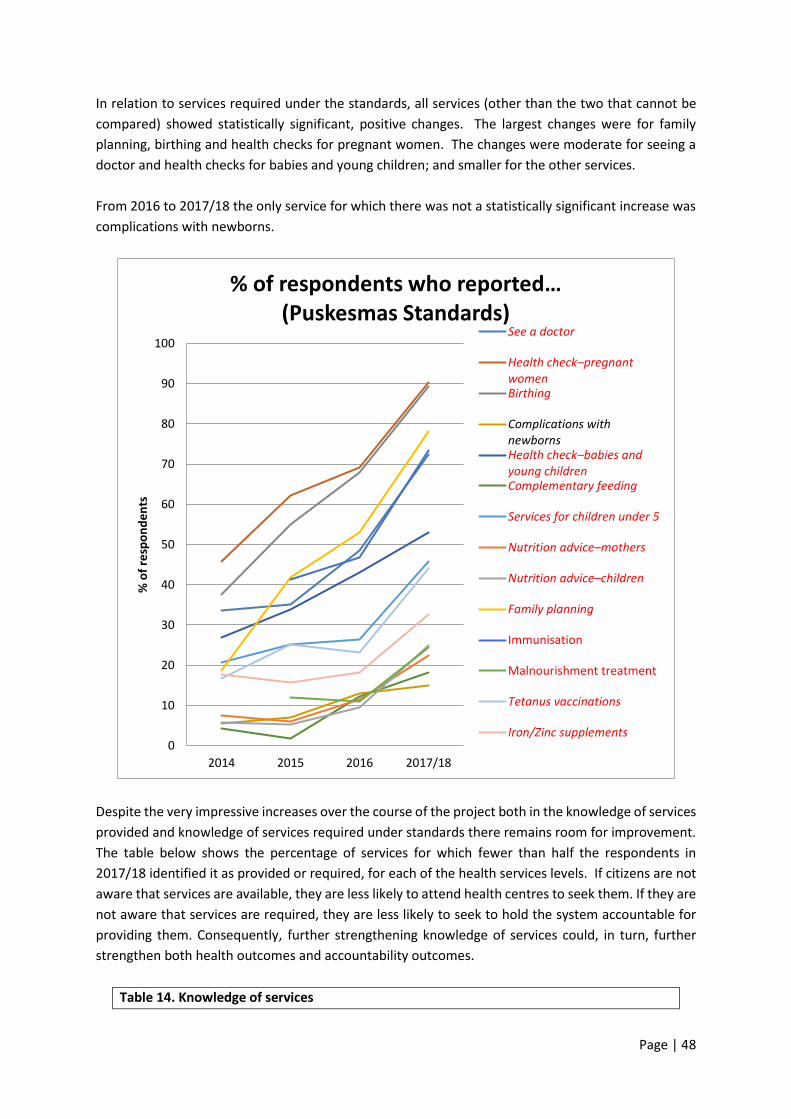
Page | 48
In relation to services required under the standards, all services (other than the two that cannot be
compared) showed statistically significant, positive changes. The largest changes were for family
planning, birthing and health checks for pregnant women. The changes were moderate for seeing a
doctor and health checks for babies and young children; and smaller for the other services.
From 2016 to 2017/18 the only service for which there was not a statistically significant increase was
complications with newborns.
Despite the very impressive increases over the course of the project both in the knowledge of services
provided and knowledge of services required under standards there remains room for improvement.
The table below shows the percentage of services for which fewer than half the respondents in
2017/18 identified it as provided or required, for each of the health services levels. If citizens are not
aware that services are available, they are less likely to attend health centres to seek them. If they are
not aware that services are required, they are less likely to seek to hold the system accountable for
providing them. Consequently, further strengthening knowledge of services could, in turn, further
strengthen both health outcomes and accountability outcomes.
Table 14. Knowledge of services
0
10
20
30
40
50
60
70
80
90
100
2014 2015 2016 2017/18
% o
f re
spo
nd
en
ts
% of respondents who reported… (Puskesmas Standards)
See a doctor
Health check–pregnant womenBirthing
Complications withnewbornsHealth check–babies and young childrenComplementary feeding
Services for children under 5
Nutrition advice–mothers
Nutrition advice–children
Family planning
Immunisation
Malnourishment treatment
Tetanus vaccinations
Iron/Zinc supplements

Page | 49
Services provided Services required
Posyandu 5 of 10 (50.0%) 5 of 10 (50.0%)
Polindes 3 of 6 (50.0%) 2 of 6 (33.3%)
Puskesmas 8 of 14 (57.1%) 8 of 14 (57.1%)
There was another finding which suggests that continued action in the region could help to fill these
gaps. The table below shows the average increases for both ‘services provided’ and ‘services required
to be provided’ at each of the health service levels for 2016 to 2017/18 and from 2014 to 2017/18.
The final column shows the percentage of the overall change that happened in 2016 to 2017/18. This
shows that for all except services required at Polindes, more than half the change happened in the
final year. That is, the results, which were already positive, improved more in the final year than the
previous two years combined. Given that projects often take three years to bed down, this is not
entirely surprising: however, it suggests that a ‘tipping point’ had been achieved in the rate of growth
in knowledge. This is in keeping with findings in Chapter 7 below about very consistent provision of
information by cadres and health service providers: the longer information provision is maintained,
the more people it is likely to reach. It is also consistent with the finding that village officials and
parents themselves becoming active as information providers: the more people providing
information, the wider the reach is likely to be. It suggests that knowledge of services may continue
to increase if that information provision is maintained. It also suggests that specific information may
be required about particular services – the ones that are not well known – to further improve health
outcomes.
The other thing that this table shows is just how strong the results from the project have been (see
middle column, Change 2014 – 2017/18). A change of 15% is generally considered strong. This means
that the outcomes here range from strong to exceptionally strong, as all the increases surpassed the
15% mark, and half of them were more than double that.
Table 15. Average increases by service level
Change
2016-
2017/18
Change
2014-
2017/18
% of total
change
occurring in
2016- 17/18
Posyandu Services 9.6% 15.9% 60.4%
Posyandu Standards 17.6% 34.2% 51.5%
Polindes Services 11.6% 22.9% 50.7%
Polindes Standards 20.3% 40.8% 49.8%
Puskesmas Services 11.7% 23.0% 50.9%
Puskesmas Standards 16.5% 31.7% 52.1%
5.3 Comparison of Phase 1 and Phase 2 villages
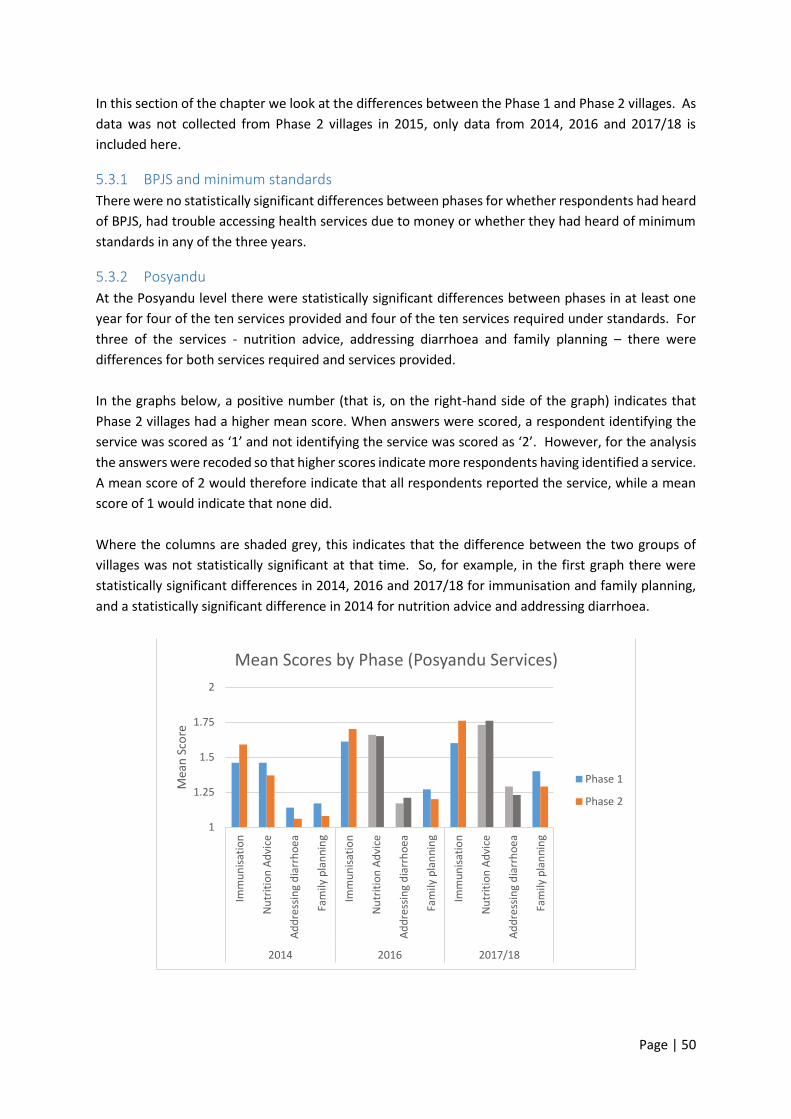
Page | 50
In this section of the chapter we look at the differences between the Phase 1 and Phase 2 villages. As
data was not collected from Phase 2 villages in 2015, only data from 2014, 2016 and 2017/18 is
included here.
5.3.1 BPJS and minimum standards
There were no statistically significant differences between phases for whether respondents had heard
of BPJS, had trouble accessing health services due to money or whether they had heard of minimum
standards in any of the three years.
5.3.2 Posyandu
At the Posyandu level there were statistically significant differences between phases in at least one
year for four of the ten services provided and four of the ten services required under standards. For
three of the services - nutrition advice, addressing diarrhoea and family planning – there were
differences for both services required and services provided.
In the graphs below, a positive number (that is, on the right-hand side of the graph) indicates that
Phase 2 villages had a higher mean score. When answers were scored, a respondent identifying the
service was scored as ‘1’ and not identifying the service was scored as ‘2’. However, for the analysis
the answers were recoded so that higher scores indicate more respondents having identified a service.
A mean score of 2 would therefore indicate that all respondents reported the service, while a mean
score of 1 would indicate that none did.
Where the columns are shaded grey, this indicates that the difference between the two groups of
villages was not statistically significant at that time. So, for example, in the first graph there were
statistically significant differences in 2014, 2016 and 2017/18 for immunisation and family planning,
and a statistically significant difference in 2014 for nutrition advice and addressing diarrhoea.
1
1.25
1.5
1.75
2
Imm
un
isat
ion
Nu
trit
ion
Ad
vice
Ad
dre
ssin
g d
iarr
ho
ea
Fam
ily p
lan
nin
g
Imm
un
isat
ion
Nu
trit
ion
Ad
vice
Ad
dre
ssin
g d
iarr
ho
ea
Fam
ily p
lan
nin
g
Imm
un
isat
ion
Nu
trit
ion
Ad
vice
Ad
dre
ssin
g d
iarr
ho
ea
Fam
ily p
lan
nin
g
2014 2016 2017/18
Mea
n S
core
Mean Scores by Phase (Posyandu Services)
Phase 1
Phase 2
Page | 51
There were statistically significant differences at baseline for four of the services provided. Phase 1
villages were more likely to identify nutrition advice, addressing diarrhoea, and family planning as
being provided; Phase 2 villages were more likely to identify immunisation as being provided. Only
two of those - immunisation and family planning - remained significantly different in 2016 and 2017-
18. This suggests that for nutrition advice and addressing diarrhoea there was a ‘closing of the gap’.
The following table shows the change in the mean scores for each Phase from 2014 to 2017/18 and
the difference in those changes. The important fact to note is that there was actually very little
difference between the villages in the two phases. Overall, Phase 2 villages improved slightly more
for three of the four services and Phase 1 improved slightly more in relation to family planning. The
negative difference for family planning simply means that Phase 1 villages increased by more than
Phase 2 villages for that service. It is not an indication of a ‘bad’ result. For the other three services
Phase 2 villages improved by more.
Table 16. Total Change in Mean Scores (Posyandu Services)
Phase 1 Phase 2 Diff.
Immunisation 0.14 0.17 0.03
Nutrition Advice 0.27 0.39 0.12
Addressing diarrhoea 0.15 0.17 0.02
Family planning 0.23 0.21 -0.02
In relation to services required under standards, all but one of the statistically significant differences
showed better scores for Phase 1 villages. The exception was for nutrition advice in 2017/18 where,
despite scoring lower at baseline in 2014, Phase 2 villages scored higher at the end of the project.
As with the services provided at Posyandu, nutrition advice showed the largest difference in change
over time between the two phases. Phase 2 villages improved more than Phase 1 villages by enough
that, by 2017/18, Phase 2 villages had a statistically significantly higher mean score. That is, at the
1
1.25
1.5
1.75
2
Nu
trit
ion
Ad
vice
Ad
dre
ssin
g d
iarr
ho
ea
Fam
ily p
lan
nin
g
Iro
n/Z
inc
sup
ple
me
nts
Nu
trit
ion
Ad
vice
Ad
dre
ssin
g d
iarr
ho
ea
Fam
ily p
lan
nin
g
Iro
n/Z
inc
sup
ple
me
nts
Nu
trit
ion
Ad
vice
Ad
dre
ssin
g d
iarr
ho
ea
Fam
ily p
lan
nin
g
Iro
n/Z
inc
sup
ple
me
nts
2014 2016 2017/18
Mea
n S
core
s
Mean Scores by Phase (Posyandu Standards)
Phase 1
Phase 2

Page | 52
start of the program more Phase 1 householders than Phase 2 householders identified that nutrition
advice was supposed to be provided at Posyandu but by the end of the project, more Phase 2
householders identified that nutrition advice was supposed to be provided.
For two of the services, nutrition advice and addressing diarrhoea, Phase 2 villages improved more
while for one (family planning) Phase 1 villages improved more. Both groups had worse scores (with
the same difference) for iron and zinc supplements.
Table 17. Total Change in Mean Scores (Posyandu Standards)
Phase 1 Phase 2 Diff.
Nutrition Advice 0.37 0.50 0.13
Addressing diarrhoea 0.21 0.27 0.06
Family planning 0.39 0.35 -0.04
Iron/Zinc supplements -0.09 -0.09 0.00
5.3.3 Polindes
There were no services provided for which there were statistically significant difference between the
phases at baseline, or in 2016 or 2017-18.
For all three services required for which there was a statistically significant difference between phases,
the phase 2 villages scored worse at baseline in 2014, but improved by more over the course of the
project. For family planning, villages in both Phases scored the same in 2017-18. For health checks
for babies and young children and birthing, Phase 2 villages improved sufficiently to score slightly
better in 2017-18 than Phase 1 villages.
Table 18. Total Change in Mean Scores (Polindes Standards)
Phase 1 Phase 2 Diff.
Health checks–babies and young children 0.41 0.57 0.16
1
1.25
1.5
1.75
2
Hea
lth
ch
ecks
–bab
ies
and
yo
un
g ch
ildre
n
Bir
thin
g
Fam
ily p
lan
nin
g
Hea
lth
ch
ecks
–bab
ies
and
yo
un
g ch
ildre
n
Bir
thin
g
Fam
ily p
lan
nin
g
Hea
lth
ch
ecks
–bab
ies
and
yo
un
g ch
ildre
n
Bir
thin
g
Fam
ily p
lan
nin
g
2014 2016 2017/18
Mea
n S
core
Mean Scores by Phase (Polindes Standards)
Phase 1
Phase 2

Page | 53
Birthing 0.13 0.25 0.12
Family planning 0.58 0.65 0.07
5.3.4 Puskesmas
There were statistically significant differences between Phase 1 and Phase 2 villages in at least one
year, for 7 of the 14 services provided at Puskesmas level. However, no clear pattern of differences
emerged.
For three services - health checks for babies and young children, services for children under five and
nutrition advice for children - Phase 1 villages scored statistically significantly better at baseline (2014).
However, Phase 2 villages improved more over time, and by 2017/18 there were no statistically
significant differences between the two sets of villages for any of those services. Phase 2 villages also
improved by more than Phase 1 villages in relation to knowledge of nutrition advice for mothers. For
that item, there was a statistically significant difference in 2017/18, but not in either of the previous
years.
However, Phase 1 villages’ knowledge improved by more than Phase 2 villages in relation to
complementary feeding, family planning and immunisation.
There were two services, complementary feeding and family planning for which there was a
statistically significant difference in 2016 but not either 2014 or 2017/18. For complementary feeding
the difference in 2016 favoured Phase 2 villages but for family planning it favoured Phase 1 villages.
This is highly likely to reflect different respondents to the surveys at different points in time.
Table 19. Total Change in Mean Scores (Puskesmas Services)
Phase 1 Phase 2 Diff.
1
1.25
1.5
1.75
2
Hea
lth
ch
eck–
bab
ies
and
…
Co
mp
lem
en
tary
fee
din
g
Serv
ices
fo
r ch
ildre
n…
Nu
trit
ion
ad
vice
–mo
ther
s
Nu
trit
ion
ad
vice
–ch
ildre
n
Fam
ily p
lan
nin
g
Imm
un
isat
ion
Hea
lth
ch
eck–
bab
ies
and
…
Co
mp
lem
en
tary
fee
din
g
Serv
ices
fo
r ch
ildre
n…
Nu
trit
ion
ad
vice
–mo
ther
s
Nu
trit
ion
ad
vice
–ch
ildre
n
Fam
ily p
lan
nin
g
Imm
un
isat
ion
Hea
lth
ch
eck–
bab
ies
and
…
Co
mp
lem
en
tary
fee
din
g
Serv
ices
fo
r ch
ildre
n…
Nu
trit
ion
ad
vice
–mo
ther
s
Nu
trit
ion
ad
vice
–ch
ildre
n
Fam
ily p
lan
nin
g
Imm
un
isat
ion
2014 2016 2017/18
Mea
n S
core
Mean Scores by Phase (Puskesmas Services)
Phase 1
Phase 2
Page | 54
Health check–babies and young children 0.12 0.19 0.07
Complementary feeding 0.12 0.05 -0.07
Services for children under 5 0.15 0.24 0.09
Nutrition advice–mothers 0.09 0.21 0.12
Nutrition advice–children 0.12 0.23 0.11
Family planning 0.47 0.42 -0.05
Immunisation 0.19 0.15 -0.04
The pattern for services required under the standards at Puskesmas was clearer. Phase 1 villages had
statistically significantly better scores than Phase 2 villages at baseline, but not in either of the
following years for five of the services. For nutrition advice for mothers, Phase 2 villages scored
statistically significantly better in 2017/18, but not in the earlier years. Both suggest that knowledge
of standards improved more in Phase 2 villages than in Phase 1 villages.
In all, knowledge of Phase 2 villages improved more for all eight services required for which there
were statistically significant differences in any year. However, the Phase 1 villages still improved their
knowledge in relation to all eight of the services.
Table 20. Total Change in Means (Puskesmas Standards)
Phase 1 Phase 2 Diff.
See a doctor 0.37 0.40 0.03
Birthing 0.48 0.55 0.07
Health check–babies and young children 0.21 0.32 0.11
Services for children under 5 0.19 0.31 0.12
Nutrition advice–mothers 0.10 0.20 0.10
Nutrition advice–children 0.15 0.23 0.08
Family planning 0.56 0.63 0.07
1
1.25
1.5
1.75
2
See
a d
oct
or
Bir
thin
g
Hea
lth
ch
eck–
bab
ies …
Serv
ices
fo
r ch
ildre
n…
Nu
trit
ion
ad
vice
–…
Nu
trit
ion
ad
vice
–ch
ildre
n
Fam
ily p
lan
nin
g
Imm
un
isat
ion
See
a d
oct
or
Bir
thin
g
Hea
lth
ch
eck–
bab
ies …
Serv
ices
fo
r ch
ildre
n…
Nu
trit
ion
ad
vice
–…
Nu
trit
ion
ad
vice
–ch
ildre
n
Fam
ily p
lan
nin
g
Imm
un
isat
ion
See
a d
oct
or
Bir
thin
g
Hea
lth
ch
eck–
bab
ies …
Serv
ices
fo
r ch
ildre
n…
Nu
trit
ion
ad
vice
–…
Nu
trit
ion
ad
vice
–ch
ildre
n
Fam
ily p
lan
nin
g
Imm
un
isat
ion
2014 2016 2017/18
Mea
n S
core
Mean Scores by Phase (Puskesmas Standards)
Phase 1
Phase 2
Page | 55
Immunisation 0.24 0.36 0.12
5.3.5 Conclusion
Examination of whether there were differences in outcomes in Phase 1 or Phase 2 villages was
originally intended to examine whether there were spillover effects from Phase 1 to Phase 2 villages.
However, because 2015 data was not collected in Phase 2 villages, this comparison could not be made.
Instead, we have compared whether there were differences in householder knowledge of services
between the Phase 1 and Phase 2 villages at baseline, by the midpoint of the program (2016-17) and
by the end of the program (2017-18). Because Phase 2 villages started one year later than Phase 1
villages, it might be expected that the increase in knowledge would be lower in Phase 2 villages.
In fact, however, an anomalous pattern emerged. Across all 30 services (10 at Posyandu, 6 at Polindes
and 14 at Puskesmas), Phase 1 villages’ knowledge of services actually provided improved more for 20
of 30 services. However, Phase 2 villages’ knowledge of services required under the standards
improved more for 24 of 30 services.
It is not clear why this pattern emerged. A range of explanations can be hypothesised, but they cannot
be tested with the data available to this evaluation. Perhaps GPSA staff focused more on the direct
provision of services during their first year of working in the project (when only Phase 1 villages were
active). Then, as their confidence in their own understanding of the standards increased, perhaps
their focus on standards increased. Phase 2 villages would thus be exposed more and earlier in their
involvement with the program to standards information than Phase 1 villages had been. Or perhaps
a similar process happened for workers in services, due to changes made by leaders in those services
(at least some of whom had responsibilities across both Phase 1 and Phase 2 villages). Perhaps there
were differences in the number or nature of similarly focussed projects being run by other agencies in
some villages but not others. Perhaps, given that the differences between the two sets of villages are
generally small and not all of them were statistically significant, the apparent pattern is just an artefact
of the data. What is clear, however, is that by the end of the program, the knowledge of Phase 2
villages had in general ‘caught up’ with that of Phase 1 villages.
5.4 Comparison of Districts in 2017/18
One-way ANOVA were undertaken to determine whether there were statistically significant
differences between districts in 2017/18. Only results for questions for which there were statistically
significant differences are reported in this section.
5.4.1 Comparison of Districts in 2017/18
There was a statistically significant difference in the percentage of respondents who had heard of BPJS
in 2014 but not in any of the subsequent years. By 2016 the percentages who had heard of BPJS was
approaching 100% and in 2017/18 it actually reached 100% of respondents in both TTU and Sikka.
Page | 56
There was a statistically significant difference between districts for whether householders had had
trouble accessing health services due to financial reasons at each time interval. In 2014, just under
half the respondents in Kupang reported having trouble accessing BPJS, while in Sikka and TTU it was
a little over half. In 2017/18, just over a third of respondents reported having had problems in Sikka,
just under a quarter in TTU and about one in six in Kupang. That is, there was a much greater
improvement in Kupang, a good improvement in TTU, and some improvement in Sikka over the period.
There was a relatively small decrease in the percentage of respondents who were able to describe
their own eligibility for BPJS in TTU with the percentage who were able to do so correctly dropping
from 69.7% in 2014 to 58.2% in 2017/18. This was largely due to an increase from 2016 to 2017/18.
The decreases were more substantial in Kupang and Sikka although in Kupang there was an increase
from 2015 to 2016. It is possible that these increases were at least partially due to different people
being surveyed each year.
0
20
40
60
80
100
2014 2015 2016 2017/18
% o
f re
spo
nd
en
ts
% of respondents who had heard of BPJS
Kupang
TTU
Sikka
0
20
40
60
80
100
2014 2015 2016 2017/18
% o
f re
spo
nd
en
ts
% of respondents who had trouble accessing health services
Kupang
TTU
Sikka
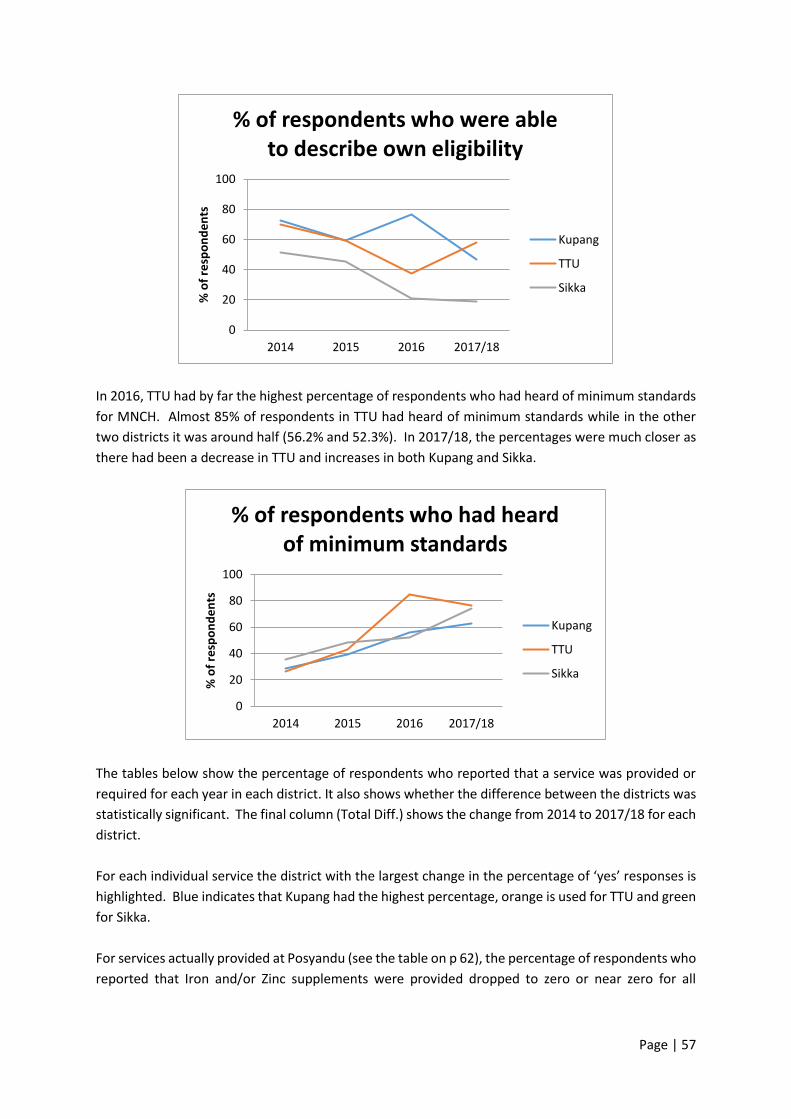
Page | 57
In 2016, TTU had by far the highest percentage of respondents who had heard of minimum standards
for MNCH. Almost 85% of respondents in TTU had heard of minimum standards while in the other
two districts it was around half (56.2% and 52.3%). In 2017/18, the percentages were much closer as
there had been a decrease in TTU and increases in both Kupang and Sikka.
The tables below show the percentage of respondents who reported that a service was provided or
required for each year in each district. It also shows whether the difference between the districts was
statistically significant. The final column (Total Diff.) shows the change from 2014 to 2017/18 for each
district.
For each individual service the district with the largest change in the percentage of ‘yes’ responses is
highlighted. Blue indicates that Kupang had the highest percentage, orange is used for TTU and green
for Sikka.
For services actually provided at Posyandu (see the table on p 62), the percentage of respondents who
reported that Iron and/or Zinc supplements were provided dropped to zero or near zero for all
0
20
40
60
80
100
2014 2015 2016 2017/18
% o
f re
spo
nd
en
ts
% of respondents who were able to describe own eligibility
Kupang
TTU
Sikka
0
20
40
60
80
100
2014 2015 2016 2017/18
% o
f re
spo
nd
en
ts
% of respondents who had heard of minimum standards
Kupang
TTU
Sikka
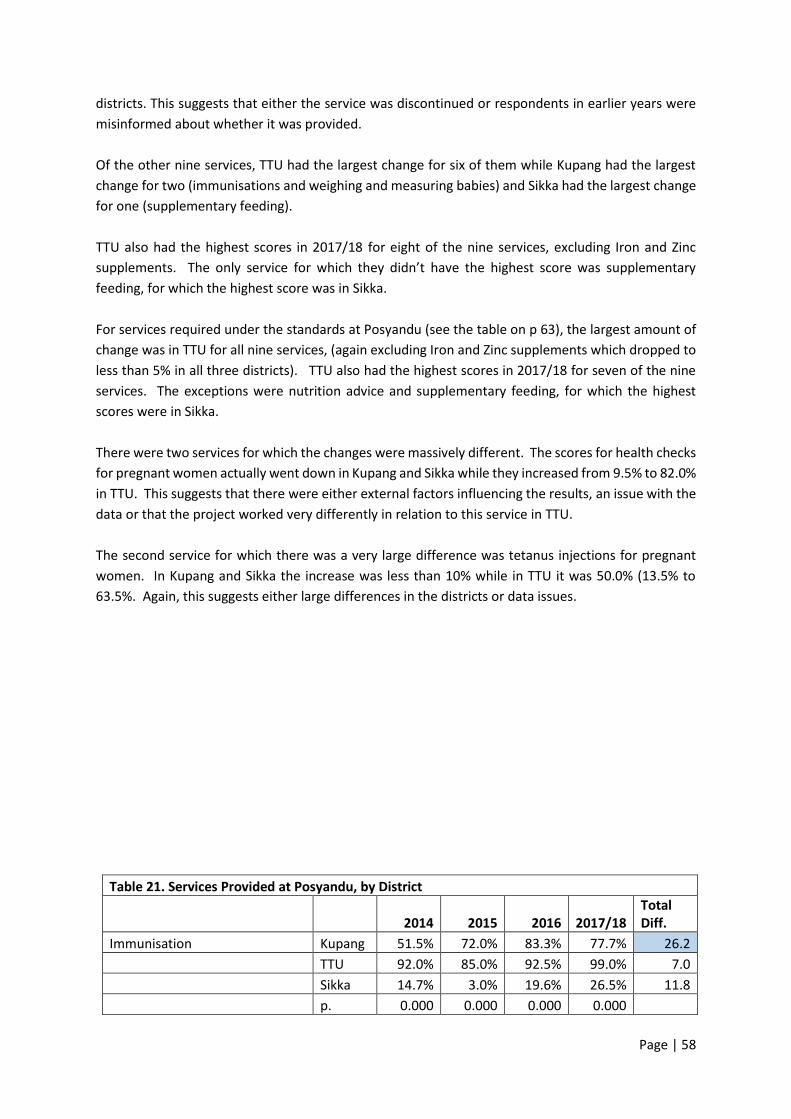
Page | 58
districts. This suggests that either the service was discontinued or respondents in earlier years were
misinformed about whether it was provided.
Of the other nine services, TTU had the largest change for six of them while Kupang had the largest
change for two (immunisations and weighing and measuring babies) and Sikka had the largest change
for one (supplementary feeding).
TTU also had the highest scores in 2017/18 for eight of the nine services, excluding Iron and Zinc
supplements. The only service for which they didn’t have the highest score was supplementary
feeding, for which the highest score was in Sikka.
For services required under the standards at Posyandu (see the table on p 63), the largest amount of
change was in TTU for all nine services, (again excluding Iron and Zinc supplements which dropped to
less than 5% in all three districts). TTU also had the highest scores in 2017/18 for seven of the nine
services. The exceptions were nutrition advice and supplementary feeding, for which the highest
scores were in Sikka.
There were two services for which the changes were massively different. The scores for health checks
for pregnant women actually went down in Kupang and Sikka while they increased from 9.5% to 82.0%
in TTU. This suggests that there were either external factors influencing the results, an issue with the
data or that the project worked very differently in relation to this service in TTU.
The second service for which there was a very large difference was tetanus injections for pregnant
women. In Kupang and Sikka the increase was less than 10% while in TTU it was 50.0% (13.5% to
63.5%. Again, this suggests either large differences in the districts or data issues.
Table 21. Services Provided at Posyandu, by District
2014 2015 2016 2017/18 Total Diff.
Immunisation Kupang 51.5% 72.0% 83.3% 77.7% 26.2
TTU 92.0% 85.0% 92.5% 99.0% 7.0
Sikka 14.7% 3.0% 19.6% 26.5% 11.8
p. 0.000 0.000 0.000 0.000

Page | 59
Nutrition advice Kupang 18.1% 36.0% 47.3% 45.1% 27.0
TTU 46.0% 70.0% 85.0% 91.0% 45.0
Sikka 61.3% 65.3% 64.8% 88.5% 27.2
p. 0.000 0.000 0.000 0.000
Weighing and measuring babies Kupang 80.4% 98.0% 100.0% 96.1% 15.7
TTU 98.5% 98.0% 99.5% 100.0% 1.5
Sikka 98.0% 99.0% 94.0% 98.0% 0.0
p. 0.000 0.000 0.019
Addressing diarrhoea Kupang 7.4% 1.0% 8.4% 14.1% 6.7
TTU 11.5% 27.0% 30.5% 53.0% 41.5
Sikka 10.8% 20.8% 17.1% 11.5% 0.7
p. 0.000 0.000 0.000
Family planning Kupang 7.8% 18.0% 25.6% 26.7% 18.9
TTU 15.5% 16.0% 34.5% 51.5% 36.0
Sikka 14.2% 19.8% 10.1% 27.0% 12.8
p. 0.044 0.000 0.000
Vitamin A distribution Kupang 24.0% 28.0% 34.0% 41.3% 17.3
TTU 64.0% 68.0% 76.0% 95.5% 31.5
Sikka 38.7% 37.6% 18.6% 67.5% 28.8
p. 0.000 0.000 0.000 0.000
Supplementary feeding Kupang 41.2% 35.0% 44.3% 49.0% 7.8
TTU 66.5% 67.0% 70.5% 78.0% 11.5
Sikka 62.7% 64.4% 75.4% 92.0% 29.3
p. 0.000 0.000 0.000 0.000
Health checks for pregnant women Kupang 20.1% 6.0% 14.1% 7.8% -12.3
TTU 57.0% 37.0% 59.0% 86.5% 29.5
Sikka 24.5% 4.0% 5.5% 7.5% -17.0
p. 0.000 0.000 0.000 0.000
TT injection for pregnant mothers Kupang 7.4% 2.0% 12.3% 8.3% 0.9
TTU 43.0% 14.0% 29.0% 63.0% 20.0
Sikka 4.4% 3.0% 5.5% 13.0% 8.6
p. 0.000 0.000 0.000 0.000
Iron/Zinc Kupang 15.7% 0.0% 0.5% 0.5% -15.2
TTU 33.0% 0.0% 0.0% 0.0% -33.0
Sikka 7.8% 1.0% 1.0% 0.0% -7.8
p. 0.000
Table 22. Services Required Under Standards at Posyandu, by District
2014 2015 2016 2017/18 Total Diff.
Immunisation Kupang 42.2% 71.7% 84.7% 84.5% 42.3%
TTU 28.5% 55.0% 82.0% 96.0% 67.5%
Sikka 26.5% 14.9% 32.2% 53.5% 27.0%
p. 0.001 0.000 0.000 0.000
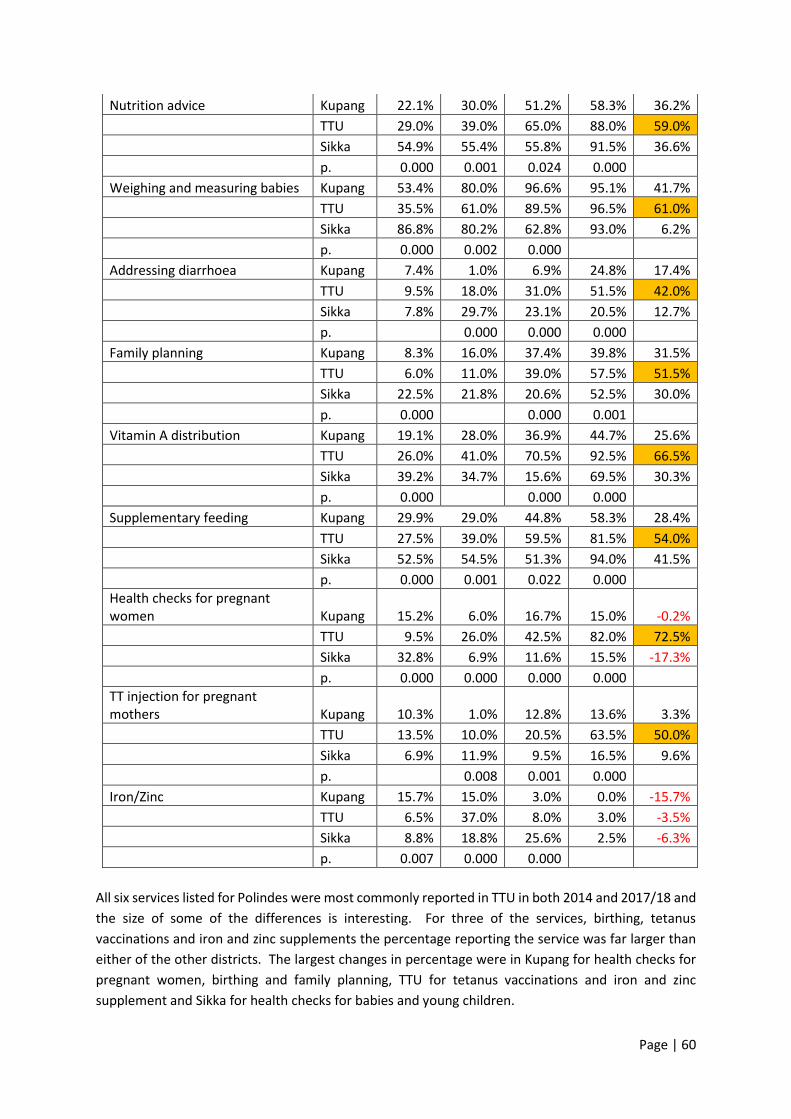
Page | 60
Nutrition advice Kupang 22.1% 30.0% 51.2% 58.3% 36.2%
TTU 29.0% 39.0% 65.0% 88.0% 59.0%
Sikka 54.9% 55.4% 55.8% 91.5% 36.6%
p. 0.000 0.001 0.024 0.000
Weighing and measuring babies Kupang 53.4% 80.0% 96.6% 95.1% 41.7%
TTU 35.5% 61.0% 89.5% 96.5% 61.0%
Sikka 86.8% 80.2% 62.8% 93.0% 6.2%
p. 0.000 0.002 0.000
Addressing diarrhoea Kupang 7.4% 1.0% 6.9% 24.8% 17.4%
TTU 9.5% 18.0% 31.0% 51.5% 42.0%
Sikka 7.8% 29.7% 23.1% 20.5% 12.7%
p. 0.000 0.000 0.000
Family planning Kupang 8.3% 16.0% 37.4% 39.8% 31.5%
TTU 6.0% 11.0% 39.0% 57.5% 51.5%
Sikka 22.5% 21.8% 20.6% 52.5% 30.0%
p. 0.000 0.000 0.001
Vitamin A distribution Kupang 19.1% 28.0% 36.9% 44.7% 25.6%
TTU 26.0% 41.0% 70.5% 92.5% 66.5%
Sikka 39.2% 34.7% 15.6% 69.5% 30.3%
p. 0.000 0.000 0.000
Supplementary feeding Kupang 29.9% 29.0% 44.8% 58.3% 28.4%
TTU 27.5% 39.0% 59.5% 81.5% 54.0%
Sikka 52.5% 54.5% 51.3% 94.0% 41.5%
p. 0.000 0.001 0.022 0.000
Health checks for pregnant women Kupang 15.2% 6.0% 16.7% 15.0% -0.2%
TTU 9.5% 26.0% 42.5% 82.0% 72.5%
Sikka 32.8% 6.9% 11.6% 15.5% -17.3%
p. 0.000 0.000 0.000 0.000
TT injection for pregnant mothers Kupang 10.3% 1.0% 12.8% 13.6% 3.3%
TTU 13.5% 10.0% 20.5% 63.5% 50.0%
Sikka 6.9% 11.9% 9.5% 16.5% 9.6%
p. 0.008 0.001 0.000
Iron/Zinc Kupang 15.7% 15.0% 3.0% 0.0% -15.7%
TTU 6.5% 37.0% 8.0% 3.0% -3.5%
Sikka 8.8% 18.8% 25.6% 2.5% -6.3%
p. 0.007 0.000 0.000
All six services listed for Polindes were most commonly reported in TTU in both 2014 and 2017/18 and
the size of some of the differences is interesting. For three of the services, birthing, tetanus
vaccinations and iron and zinc supplements the percentage reporting the service was far larger than
either of the other districts. The largest changes in percentage were in Kupang for health checks for
pregnant women, birthing and family planning, TTU for tetanus vaccinations and iron and zinc
supplement and Sikka for health checks for babies and young children.

Page | 61
Table 23. Services provided at Polindes, by District
2014 2015 2016 2017/18 Total Diff.
Health checks–pregnant women Kupang 55.4% 75.0% 77.8% 82.5% 27.1%
TTU 84.5% 88.0% 93.0% 98.0% 13.5%
Sikka 68.6% 87.1% 86.9% 93.5% 24.9%
p. 0.000 0.022 0.000 0.000
Health checks–babies and young children Kupang 43.1% 64.0% 58.1% 64.1% 21.0%
TTU 70.0% 74.0% 79.0% 90.0% 20.0%
Sikka 38.2% 57.4% 64.3% 81.5% 43.3%
p. 0.000 0.046 0.000 0.000
Birthing Kupang 16.2% 11.0% 16.3% 24.8% 8.6%
TTU 40.0% 40.0% 48.0% 46.5% 6.5%
Sikka 11.8% 7.9% 5.0% 12.5% 0.7%
p. 0.000 0.000 0.000 0.000
Family planning Kupang 12.3% 49.0% 60.6% 74.8% 62.5%
TTU 52.0% 59.0% 81.5% 89.5% 37.5%
Sikka 25.5% 23.8% 30.2% 58.0% 32.5%
p. 0.000 0.000 0.000 0.000
Tetanus vaccinations Kupang 12.7% 9.0% 15.3% 29.1% 16.4%
TTU 47.5% 50.0% 68.0% 83.0% 35.5%
Sikka 12.7% 7.9% 13.6% 32.5% 19.8%
p. 0.000 0.000 0.000 0.000
Iron/Zinc supplements Kupang 22.1% 5.0% 18.7% 21.8% -0.3%
TTU 53.5% 49.0% 63.5% 89.0% 35.5%
Sikka 19.1% 12.0% 7.0% 26.5% 7.4%
p. 0.000 0.000 0.000 0.000
The similar pattern was evident for services required under MNCH standards. Four of the six services
listed were most commonly reported in TTU with very large differences for tetanus vaccinations and
iron and zinc supplements. TTU also had the largest improvement for five of the six services required,
family planning being the exception where the largest change was in Kupang.
Table 24. Services required under Standards at Polindes, by District
2014 2015 2016 2017/18 Total Diff.
Health checks–pregnant women Kupang 43.6% 74.0% 75.9% 86.9% 43.3%
TTU 29.5% 50.0% 87.0% 94.0% 64.5%
Sikka 62.3% 73.3% 59.8% 96.0% 33.7%
p. 0.000 0.000 0.000 0.001
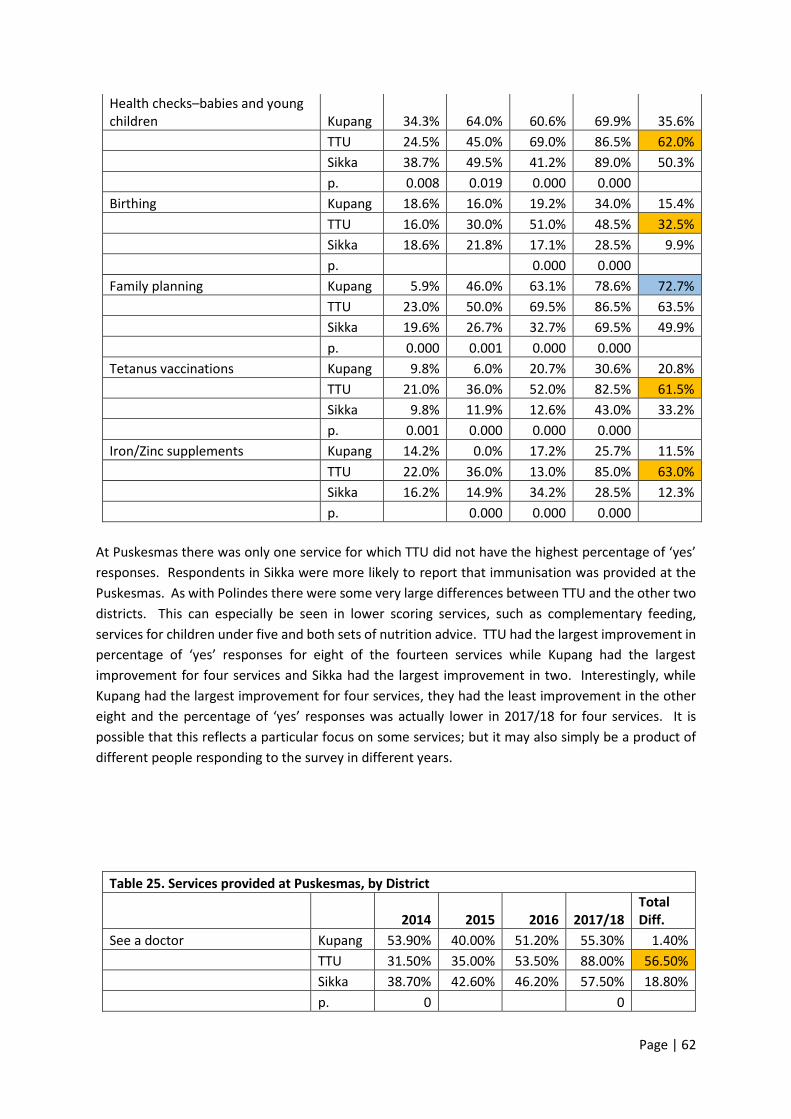
Page | 62
Health checks–babies and young children Kupang 34.3% 64.0% 60.6% 69.9% 35.6%
TTU 24.5% 45.0% 69.0% 86.5% 62.0%
Sikka 38.7% 49.5% 41.2% 89.0% 50.3%
p. 0.008 0.019 0.000 0.000
Birthing Kupang 18.6% 16.0% 19.2% 34.0% 15.4%
TTU 16.0% 30.0% 51.0% 48.5% 32.5%
Sikka 18.6% 21.8% 17.1% 28.5% 9.9%
p. 0.000 0.000
Family planning Kupang 5.9% 46.0% 63.1% 78.6% 72.7%
TTU 23.0% 50.0% 69.5% 86.5% 63.5%
Sikka 19.6% 26.7% 32.7% 69.5% 49.9%
p. 0.000 0.001 0.000 0.000
Tetanus vaccinations Kupang 9.8% 6.0% 20.7% 30.6% 20.8%
TTU 21.0% 36.0% 52.0% 82.5% 61.5%
Sikka 9.8% 11.9% 12.6% 43.0% 33.2%
p. 0.001 0.000 0.000 0.000
Iron/Zinc supplements Kupang 14.2% 0.0% 17.2% 25.7% 11.5%
TTU 22.0% 36.0% 13.0% 85.0% 63.0%
Sikka 16.2% 14.9% 34.2% 28.5% 12.3%
p. 0.000 0.000 0.000
At Puskesmas there was only one service for which TTU did not have the highest percentage of ‘yes’
responses. Respondents in Sikka were more likely to report that immunisation was provided at the
Puskesmas. As with Polindes there were some very large differences between TTU and the other two
districts. This can especially be seen in lower scoring services, such as complementary feeding,
services for children under five and both sets of nutrition advice. TTU had the largest improvement in
percentage of ‘yes’ responses for eight of the fourteen services while Kupang had the largest
improvement for four services and Sikka had the largest improvement in two. Interestingly, while
Kupang had the largest improvement for four services, they had the least improvement in the other
eight and the percentage of ‘yes’ responses was actually lower in 2017/18 for four services. It is
possible that this reflects a particular focus on some services; but it may also simply be a product of
different people responding to the survey in different years.
Table 25. Services provided at Puskesmas, by District
2014 2015 2016 2017/18 Total Diff.
See a doctor Kupang 53.90% 40.00% 51.20% 55.30% 1.40%
TTU 31.50% 35.00% 53.50% 88.00% 56.50%
Sikka 38.70% 42.60% 46.20% 57.50% 18.80%
p. 0 0
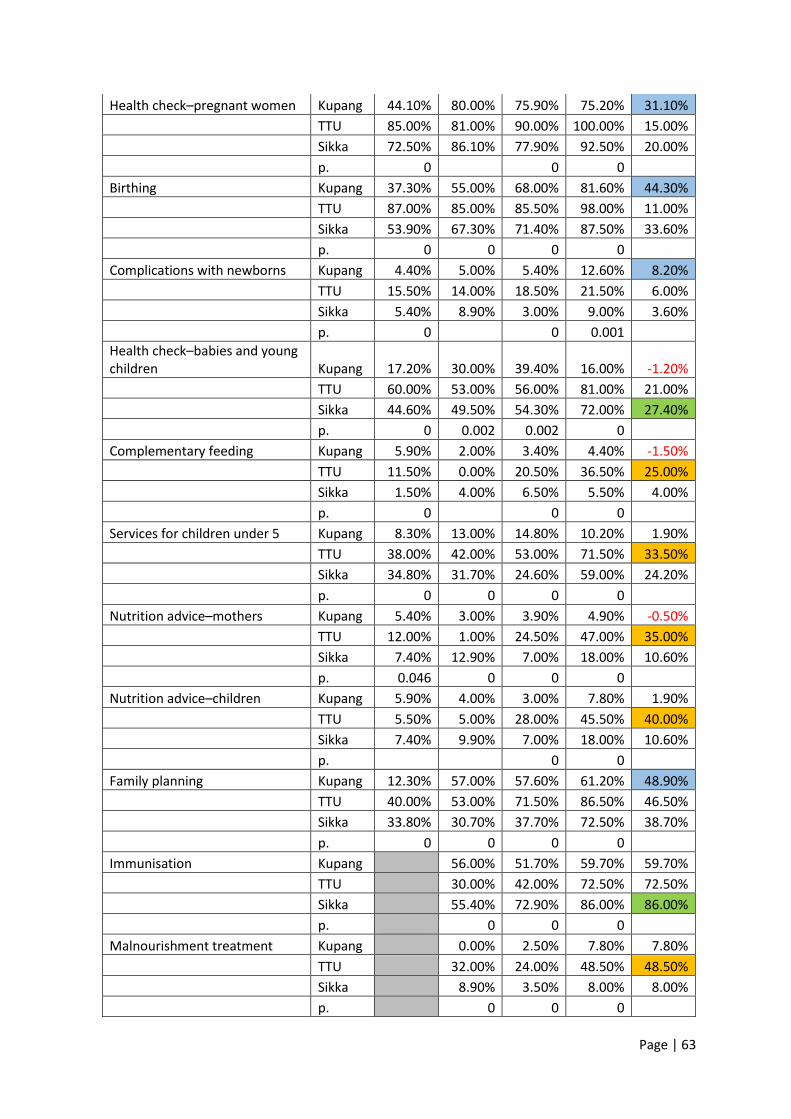
Page | 63
Health check–pregnant women Kupang 44.10% 80.00% 75.90% 75.20% 31.10%
TTU 85.00% 81.00% 90.00% 100.00% 15.00%
Sikka 72.50% 86.10% 77.90% 92.50% 20.00%
p. 0 0 0
Birthing Kupang 37.30% 55.00% 68.00% 81.60% 44.30%
TTU 87.00% 85.00% 85.50% 98.00% 11.00%
Sikka 53.90% 67.30% 71.40% 87.50% 33.60%
p. 0 0 0 0
Complications with newborns Kupang 4.40% 5.00% 5.40% 12.60% 8.20%
TTU 15.50% 14.00% 18.50% 21.50% 6.00%
Sikka 5.40% 8.90% 3.00% 9.00% 3.60%
p. 0 0 0.001
Health check–babies and young children Kupang 17.20% 30.00% 39.40% 16.00% -1.20%
TTU 60.00% 53.00% 56.00% 81.00% 21.00%
Sikka 44.60% 49.50% 54.30% 72.00% 27.40%
p. 0 0.002 0.002 0
Complementary feeding Kupang 5.90% 2.00% 3.40% 4.40% -1.50%
TTU 11.50% 0.00% 20.50% 36.50% 25.00%
Sikka 1.50% 4.00% 6.50% 5.50% 4.00%
p. 0 0 0
Services for children under 5 Kupang 8.30% 13.00% 14.80% 10.20% 1.90%
TTU 38.00% 42.00% 53.00% 71.50% 33.50%
Sikka 34.80% 31.70% 24.60% 59.00% 24.20%
p. 0 0 0 0
Nutrition advice–mothers Kupang 5.40% 3.00% 3.90% 4.90% -0.50%
TTU 12.00% 1.00% 24.50% 47.00% 35.00%
Sikka 7.40% 12.90% 7.00% 18.00% 10.60%
p. 0.046 0 0 0
Nutrition advice–children Kupang 5.90% 4.00% 3.00% 7.80% 1.90%
TTU 5.50% 5.00% 28.00% 45.50% 40.00%
Sikka 7.40% 9.90% 7.00% 18.00% 10.60%
p. 0 0
Family planning Kupang 12.30% 57.00% 57.60% 61.20% 48.90%
TTU 40.00% 53.00% 71.50% 86.50% 46.50%
Sikka 33.80% 30.70% 37.70% 72.50% 38.70%
p. 0 0 0 0
Immunisation Kupang 56.00% 51.70% 59.70% 59.70%
TTU 30.00% 42.00% 72.50% 72.50%
Sikka 55.40% 72.90% 86.00% 86.00%
p. 0 0 0
Malnourishment treatment Kupang 0.00% 2.50% 7.80% 7.80%
TTU 32.00% 24.00% 48.50% 48.50%
Sikka 8.90% 3.50% 8.00% 8.00%
p. 0 0 0
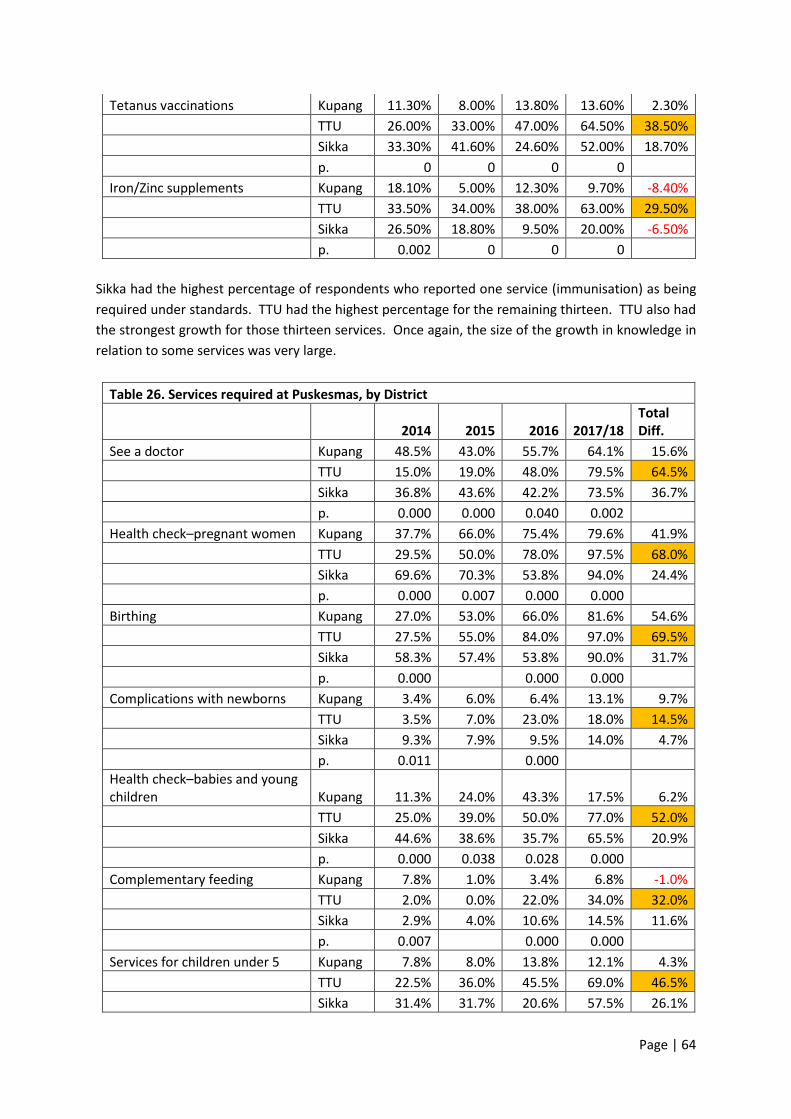
Page | 64
Tetanus vaccinations Kupang 11.30% 8.00% 13.80% 13.60% 2.30%
TTU 26.00% 33.00% 47.00% 64.50% 38.50%
Sikka 33.30% 41.60% 24.60% 52.00% 18.70%
p. 0 0 0 0
Iron/Zinc supplements Kupang 18.10% 5.00% 12.30% 9.70% -8.40%
TTU 33.50% 34.00% 38.00% 63.00% 29.50%
Sikka 26.50% 18.80% 9.50% 20.00% -6.50%
p. 0.002 0 0 0
Sikka had the highest percentage of respondents who reported one service (immunisation) as being
required under standards. TTU had the highest percentage for the remaining thirteen. TTU also had
the strongest growth for those thirteen services. Once again, the size of the growth in knowledge in
relation to some services was very large.
Table 26. Services required at Puskesmas, by District
2014 2015 2016 2017/18 Total Diff.
See a doctor Kupang 48.5% 43.0% 55.7% 64.1% 15.6%
TTU 15.0% 19.0% 48.0% 79.5% 64.5%
Sikka 36.8% 43.6% 42.2% 73.5% 36.7%
p. 0.000 0.000 0.040 0.002
Health check–pregnant women Kupang 37.7% 66.0% 75.4% 79.6% 41.9%
TTU 29.5% 50.0% 78.0% 97.5% 68.0%
Sikka 69.6% 70.3% 53.8% 94.0% 24.4%
p. 0.000 0.007 0.000 0.000
Birthing Kupang 27.0% 53.0% 66.0% 81.6% 54.6%
TTU 27.5% 55.0% 84.0% 97.0% 69.5%
Sikka 58.3% 57.4% 53.8% 90.0% 31.7%
p. 0.000 0.000 0.000
Complications with newborns Kupang 3.4% 6.0% 6.4% 13.1% 9.7%
TTU 3.5% 7.0% 23.0% 18.0% 14.5%
Sikka 9.3% 7.9% 9.5% 14.0% 4.7%
p. 0.011 0.000
Health check–babies and young children Kupang 11.3% 24.0% 43.3% 17.5% 6.2%
TTU 25.0% 39.0% 50.0% 77.0% 52.0%
Sikka 44.6% 38.6% 35.7% 65.5% 20.9%
p. 0.000 0.038 0.028 0.000
Complementary feeding Kupang 7.8% 1.0% 3.4% 6.8% -1.0%
TTU 2.0% 0.0% 22.0% 34.0% 32.0%
Sikka 2.9% 4.0% 10.6% 14.5% 11.6%
p. 0.007 0.000 0.000
Services for children under 5 Kupang 7.8% 8.0% 13.8% 12.1% 4.3%
TTU 22.5% 36.0% 45.5% 69.0% 46.5%
Sikka 31.4% 31.7% 20.6% 57.5% 26.1%
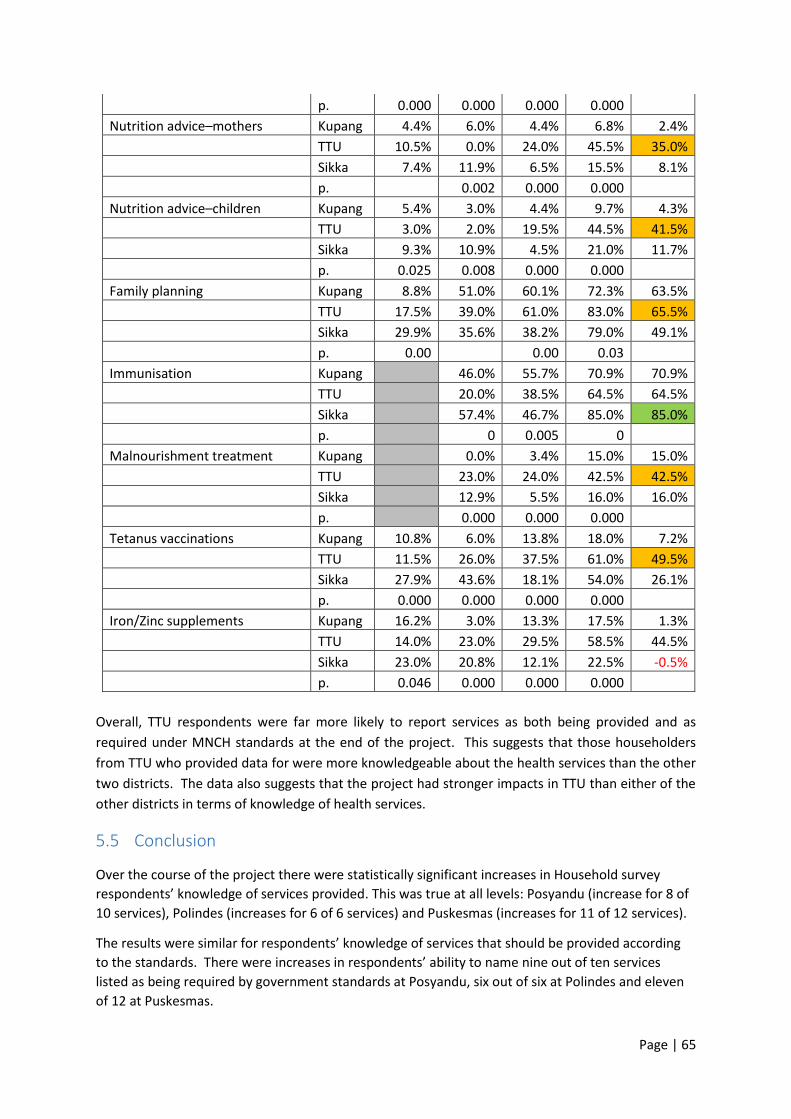
Page | 65
p. 0.000 0.000 0.000 0.000
Nutrition advice–mothers Kupang 4.4% 6.0% 4.4% 6.8% 2.4%
TTU 10.5% 0.0% 24.0% 45.5% 35.0%
Sikka 7.4% 11.9% 6.5% 15.5% 8.1%
p. 0.002 0.000 0.000
Nutrition advice–children Kupang 5.4% 3.0% 4.4% 9.7% 4.3%
TTU 3.0% 2.0% 19.5% 44.5% 41.5%
Sikka 9.3% 10.9% 4.5% 21.0% 11.7%
p. 0.025 0.008 0.000 0.000
Family planning Kupang 8.8% 51.0% 60.1% 72.3% 63.5%
TTU 17.5% 39.0% 61.0% 83.0% 65.5%
Sikka 29.9% 35.6% 38.2% 79.0% 49.1%
p. 0.00 0.00 0.03
Immunisation Kupang 46.0% 55.7% 70.9% 70.9%
TTU 20.0% 38.5% 64.5% 64.5%
Sikka 57.4% 46.7% 85.0% 85.0%
p. 0 0.005 0
Malnourishment treatment Kupang 0.0% 3.4% 15.0% 15.0%
TTU 23.0% 24.0% 42.5% 42.5%
Sikka 12.9% 5.5% 16.0% 16.0%
p. 0.000 0.000 0.000
Tetanus vaccinations Kupang 10.8% 6.0% 13.8% 18.0% 7.2%
TTU 11.5% 26.0% 37.5% 61.0% 49.5%
Sikka 27.9% 43.6% 18.1% 54.0% 26.1%
p. 0.000 0.000 0.000 0.000
Iron/Zinc supplements Kupang 16.2% 3.0% 13.3% 17.5% 1.3%
TTU 14.0% 23.0% 29.5% 58.5% 44.5%
Sikka 23.0% 20.8% 12.1% 22.5% -0.5%
p. 0.046 0.000 0.000 0.000
Overall, TTU respondents were far more likely to report services as both being provided and as
required under MNCH standards at the end of the project. This suggests that those householders
from TTU who provided data for were more knowledgeable about the health services than the other
two districts. The data also suggests that the project had stronger impacts in TTU than either of the
other districts in terms of knowledge of health services.
5.5 Conclusion
Over the course of the project there were statistically significant increases in Household survey
respondents’ knowledge of services provided. This was true at all levels: Posyandu (increase for 8 of
10 services), Polindes (increases for 6 of 6 services) and Puskesmas (increases for 11 of 12 services).
The results were similar for respondents’ knowledge of services that should be provided according
to the standards. There were increases in respondents’ ability to name nine out of ten services
listed as being required by government standards at Posyandu, six out of six at Polindes and eleven
of 12 at Puskesmas.

Page | 66
There were also statistically significant increases in whether respondents had heard of BPJS and
whether they had heard of minimum standards for MCH services.
Despite the very positive results, there remains room for improvement. Less than half the
respondents identified 16 of the 30 services actually provided across the three levels of health
service. Similarly, less than half the respondents identified 15 of the 30 services required under the
standards across the three health services.
A little over half of the change in respondents’ ability to identify services (both actual and required)
happened in the final year of the project. This reinforces the fact that change takes time. Continued
action by local services and cadres may increase the percentage or people reached and/or increase
the retention of information for those reached.
Improvements in citizens’ knowledge is important, not least because it contributes to the likelihood
of their accessing services when needed. It can also help their ability to identify where there are
gaps in the services provided against the standards, which is important to enable citizens to hold
services and systems to account.

Page | 67
6 Officials and Cadres Survey Data Analysis The second survey designed for the evaluation was for officials and cadres in the target villages. As
with the household survey, the officials and cadres survey collects information about knowledge of
maternal and child health services, standards for those services, and health insurance. Survey
questions were developed to meet project outcome indicators required by the funding body and to
test aspects of the ‘knowledge and awareness’ mechanism.
Detailed tables underpinning this section are provided in Appendix 9.4.
6.1 Demographic Data
Almost two-thirds (n=223, 62.1%) of respondents were women and just over a third were men (n=136,
37.9%). One third of the respondents were between the ages of 30 and 40 while another third were
between the ages of 50 and 50.
Table 27. Age of respondents
N %
20-30 years 38 10.6%
30-40 years 120 33.4%
40-50 years 132 36.8%
Over 50 years 69 19.2%
Total 359
The largest percentage of respondents, at a little under half, had completed senior school. The next
highest group, at a little over one in five, had completed a elementary school while just under one in
five had completed junior school.
Table 28. Respondent’s education level
N %
Did not complete elementary school 1 0.3%
Completed elementary school 78 21.7%
Completed junior school 70 19.5%
Completed senior school 175 48.7%
Completed diploma or bachelor degree 35 9.7%
Total 359
Almost exactly one-third of respondents had a child under five years of age while two-thirds did not.
Table 29. Number of children
Child(ren) under 5
N %
Yes 120 33.4%
No 239 66.6%
Total 359

Page | 68
Half the respondents (n=181, 50.4%) to the survey worked at a Posyandu. Of those, 132 (36.8%%) were Posyandu cadres. The remaining respondents were relatively evenly spread among the other roles.
Table 30. Role of respondent
N %
Village Head 46 12.8%
Village secretary 33 9.2%
Development head 21 5.8%
Social welfare head 24 6.7%
BPD head 20 5.6%
BPD member 34 9.5%
Posyandu leader 49 13.6%
Posyandu cadre 132 36.8%
Total 359
6.2 Comparison of responses over time
In this section, it is important to note that the respondents are not necessarily the same for each year.
While the data collection design for the officials and cadres survey did not call for targeting different
people each year it also did not preclude the collection of data from different people. This means that
it is possible that some of the difference could be due to different people providing information.
In the tables in both this chapter and the next, green highlighting means the change was statistically
significant and positive, that is, that it moved in the desired direction. Red highlighting means the
result was statistically significant and moved against the desired direction. There were far more
positive results than negative.
6.2.1 Understanding of BPJS
There was a statistically significant difference for whether respondents had heard of BPJS. In 2014
the majority (86.2%) of officials and cadres had heard of BPJS but by 2017/18 almost all had (99.2%).
That is, by 2017/18 less than 1% of respondents had not heard of BPJS. The proportion of respondents
who reported having trouble accessing BPJS due to financial issues reduced from a little over four out
of every ten people to less than two out of every ten.
It was not possible to run tests for statistical significance on the questions relating to respondents’
ability describe BPJS or their own eligibility for it, because the answer scale changed from 2014 to
2017/18. In 2014 the answer options were correct, partially correct and incorrect. In 2017/18 the
options also included ‘don’t know’. The proportions assessed as partially correct and correct were
higher in 2017/18 than 2014 for whether respondents were able to describe BPJS. For whether they
were able to describe eligibility there was a decrease in the percentage that were correct and an
increase in the percentage that were partially correct. Overall, the proportion that were either correct
or partially correct remained similar (about 98%).
Page | 69
6.2.2 Knowledge of Health Services
There were statistically significant differences in respondents being able to correctly identify the
annual budget for the Puskesmas in their district and for correctly identifying the proportion of the
national budget which was supposed to be allocated to health. For both questions there was an
increase in both the percentage who were correct and the percentage who were incorrect. The
percentage who indicated they did not know decreased. For both questions, the increase in the
percentage that were incorrect was larger than the increase in the percentage who were correct. In
2017/18 less than 1 in 10 respondents were able to identify the proportion of the national budget that
is supposed to be allocated to health and just over 1 in 10 knew the annual budget for Puskesmas in
their district.
Respondents were asked whether they had heard of minimum standards for MCHN, whether they
could identify the closest service to them, and a series of questions relating to funding and
government standards.
There was a statistically significant improvement for whether respondents had heard of minimum
standards for MCHN. In 2014 almost half of respondents had heard of minimum standards (n=166,
46.6%) while in 2017/18 it was up to almost three-quarters (n=262, 73.0%).
Officials and Cadres were asked whether the village had put in place regulations regarding MCHN.
They were also asked whether the district had done the same. There were statistically significant
increases for both questions. A higher percentage of respondents indicated the village had issued a
regulation and a higher percentage were able to correctly identify whether the district had issued a
regulation. The difference in the percentage of people who were able to identify whether district
regulations had been put in place was particularly large, increasing from 38.5% in 2014 to 69.1% in
2017/18. Less than half of respondents reported that their village had put regulations in place in
2017/18.
The respondents were also asked a series of questions about the funding and operation of health
services in the area. There was a statistically significant increase in respondents’ ability to correctly
identify the level of government responsible for funding both Posyandu and Puskesmas as well as their
ability to identify the allocation of midwives to their village. Both increased from around two-thirds
in 2014 to approximately nine-tenths of respondents in 2017/18.
There was, however, a small but statistically significant decrease in respondents’ ability to identify the
allocation of midwives for the closest Puskesmas. In 2014, 29.8% were able to identify the allocation
while in 2016/17 it was 23.7%.
6.2.2.1 Posyandu
Questions in relation to services provided investigate whether respondents believe that specific
services are provided at a particular level in their local services; and whether they believe that they
are required to be provided under the government standards.
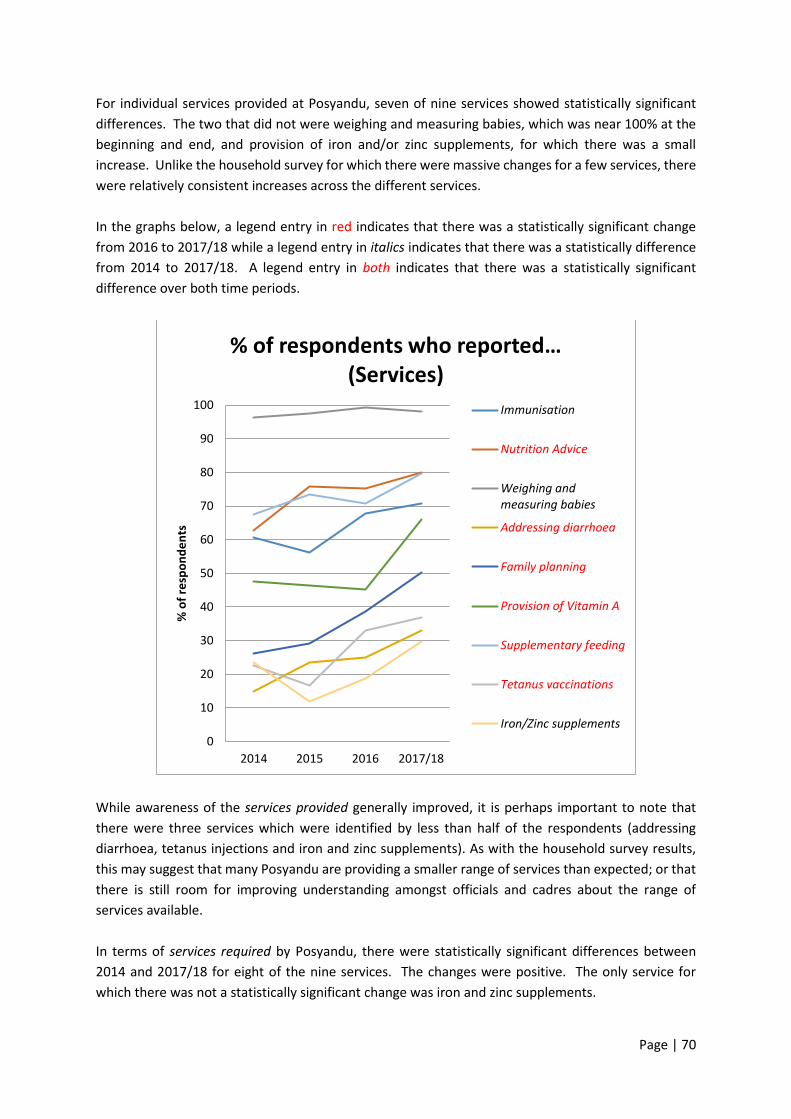
Page | 70
For individual services provided at Posyandu, seven of nine services showed statistically significant
differences. The two that did not were weighing and measuring babies, which was near 100% at the
beginning and end, and provision of iron and/or zinc supplements, for which there was a small
increase. Unlike the household survey for which there were massive changes for a few services, there
were relatively consistent increases across the different services.
In the graphs below, a legend entry in red indicates that there was a statistically significant change
from 2016 to 2017/18 while a legend entry in italics indicates that there was a statistically difference
from 2014 to 2017/18. A legend entry in both indicates that there was a statistically significant
difference over both time periods.
While awareness of the services provided generally improved, it is perhaps important to note that
there were three services which were identified by less than half of the respondents (addressing
diarrhoea, tetanus injections and iron and zinc supplements). As with the household survey results,
this may suggest that many Posyandu are providing a smaller range of services than expected; or that
there is still room for improving understanding amongst officials and cadres about the range of
services available.
In terms of services required by Posyandu, there were statistically significant differences between
2014 and 2017/18 for eight of the nine services. The changes were positive. The only service for
which there was not a statistically significant change was iron and zinc supplements.
0
10
20
30
40
50
60
70
80
90
100
2014 2015 2016 2017/18
% o
f re
spo
nd
en
ts
% of respondents who reported… (Services)
Immunisation
Nutrition Advice
Weighing andmeasuring babies
Addressing diarrhoea
Family planning
Provision of Vitamin A
Supplementary feeding
Tetanus vaccinations
Iron/Zinc supplements
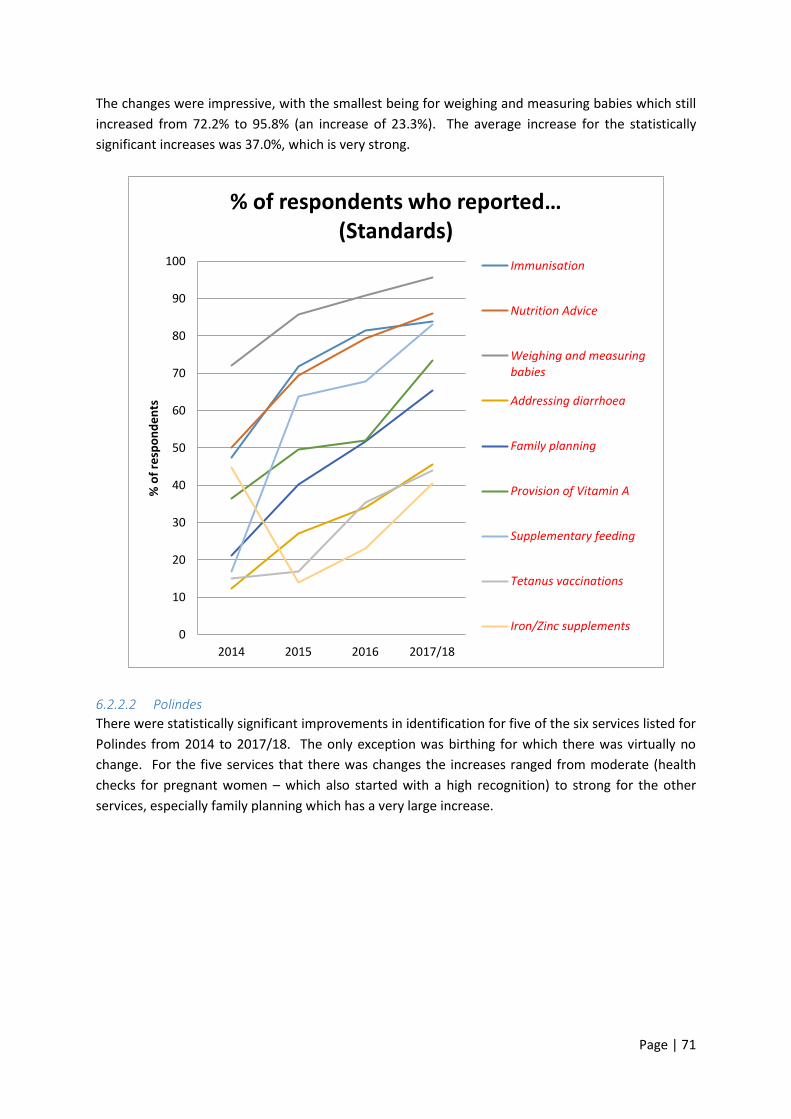
Page | 71
The changes were impressive, with the smallest being for weighing and measuring babies which still
increased from 72.2% to 95.8% (an increase of 23.3%). The average increase for the statistically
significant increases was 37.0%, which is very strong.
6.2.2.2 Polindes
There were statistically significant improvements in identification for five of the six services listed for
Polindes from 2014 to 2017/18. The only exception was birthing for which there was virtually no
change. For the five services that there was changes the increases ranged from moderate (health
checks for pregnant women – which also started with a high recognition) to strong for the other
services, especially family planning which has a very large increase.
0
10
20
30
40
50
60
70
80
90
100
2014 2015 2016 2017/18
% o
f re
spo
nd
en
ts
% of respondents who reported… (Standards)
Immunisation
Nutrition Advice
Weighing and measuringbabies
Addressing diarrhoea
Family planning
Provision of Vitamin A
Supplementary feeding
Tetanus vaccinations
Iron/Zinc supplements
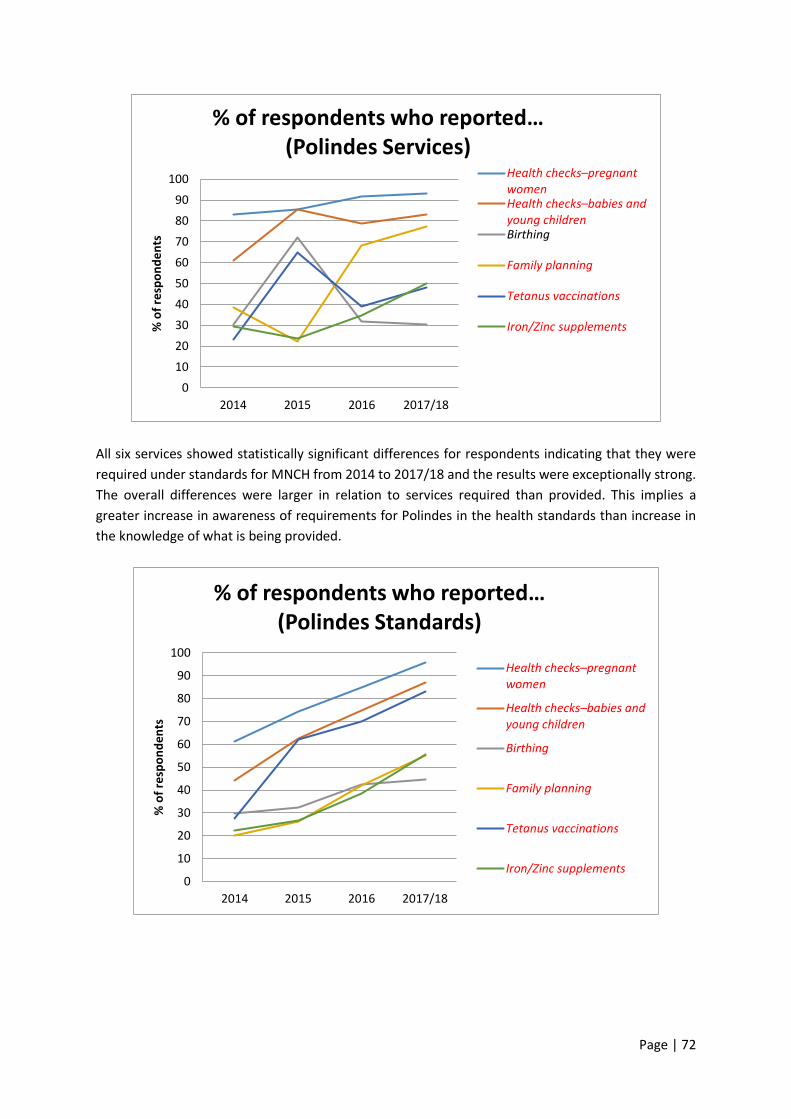
Page | 72
All six services showed statistically significant differences for respondents indicating that they were
required under standards for MNCH from 2014 to 2017/18 and the results were exceptionally strong.
The overall differences were larger in relation to services required than provided. This implies a
greater increase in awareness of requirements for Polindes in the health standards than increase in
the knowledge of what is being provided.
0
10
20
30
40
50
60
70
80
90
100
2014 2015 2016 2017/18
% o
f re
spo
nd
en
ts
% of respondents who reported… (Polindes Services)
Health checks–pregnant womenHealth checks–babies and young childrenBirthing
Family planning
Tetanus vaccinations
Iron/Zinc supplements
0
10
20
30
40
50
60
70
80
90
100
2014 2015 2016 2017/18
% o
f re
spo
nd
en
ts
% of respondents who reported… (Polindes Standards)
Health checks–pregnant women
Health checks–babies and young children
Birthing
Family planning
Tetanus vaccinations
Iron/Zinc supplements

Page | 73
6.2.2.3 Puskesmas
There were statistically significant differences for 13 of the 14 services listed as provided at
Puskesmas. The only one for which there was not was complications with newborns. Overall the
increases were smaller than for either Posyandu or Polindes but there were still very strong results for
family planning and immunisation and strong results for seeing a doctor, birthing, services for children
under five, nutrition advice for children, treatment for malnourishment and tetanus injections.
Despite these strong results, there were still eight of the fourteen services for which less than half the
respondents reported the service as being provided. Again, this suggests that either there is a smaller
range of services being provided than required or more work is required to improve officials and
cadres understanding of what is available.
In relation to services required under the standards, all services showed statistically significant,
positive changes. The changes were very large for the most part with the exceptions being
complementary feeding, which was still large, complications with newborns and nutrition advice for
mothers, for which the changes were moderate.
0
10
20
30
40
50
60
70
80
90
100
2014 2015 2016 2017/18
% o
f re
spo
nd
en
ts
% of respondents who reported… (Puskesmas Services) See a doctor
Health check–pregnant womenBirthing
Complications withnewbornsHealth check–babies and young childrenComplementary feeding
Services for children under 5
Nutrition advice–mothers
Nutrition advice–children
Family planning
Immunisation
Malnourishment treatment
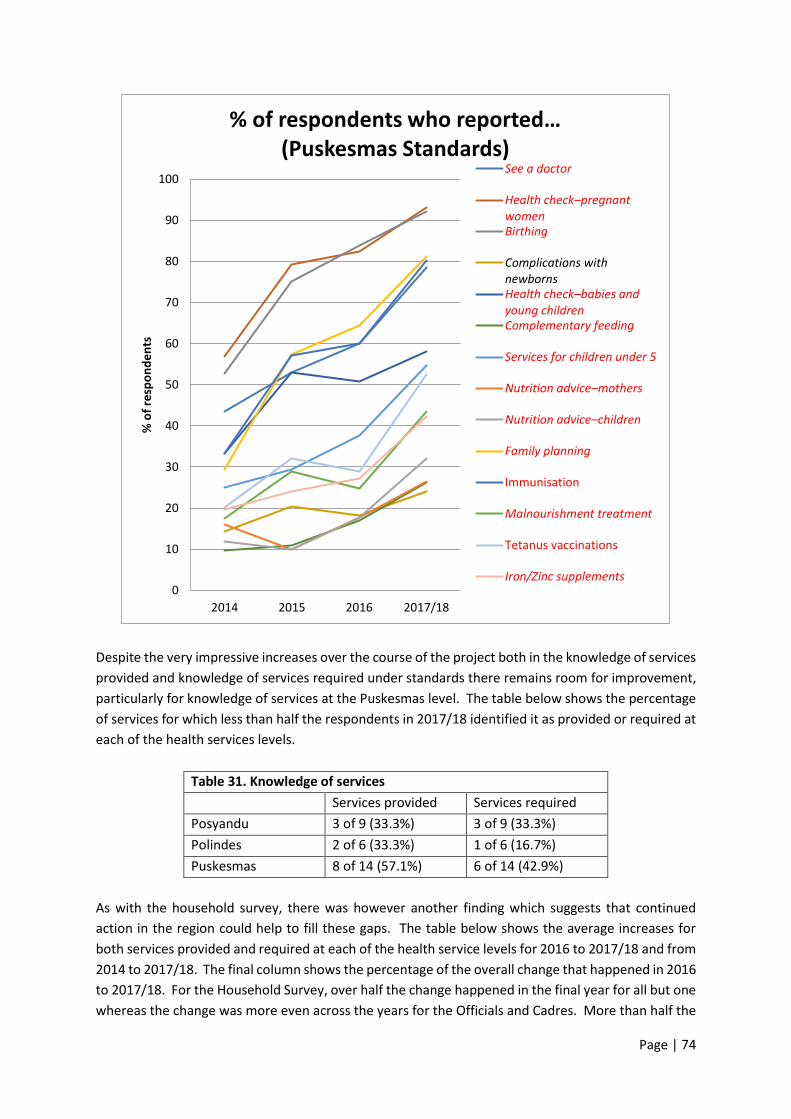
Page | 74
Despite the very impressive increases over the course of the project both in the knowledge of services
provided and knowledge of services required under standards there remains room for improvement,
particularly for knowledge of services at the Puskesmas level. The table below shows the percentage
of services for which less than half the respondents in 2017/18 identified it as provided or required at
each of the health services levels.
Table 31. Knowledge of services
Services provided Services required
Posyandu 3 of 9 (33.3%) 3 of 9 (33.3%)
Polindes 2 of 6 (33.3%) 1 of 6 (16.7%)
Puskesmas 8 of 14 (57.1%) 6 of 14 (42.9%)
As with the household survey, there was however another finding which suggests that continued
action in the region could help to fill these gaps. The table below shows the average increases for
both services provided and required at each of the health service levels for 2016 to 2017/18 and from
2014 to 2017/18. The final column shows the percentage of the overall change that happened in 2016
to 2017/18. For the Household Survey, over half the change happened in the final year for all but one
whereas the change was more even across the years for the Officials and Cadres. More than half the
0
10
20
30
40
50
60
70
80
90
100
2014 2015 2016 2017/18
% o
f re
spo
nd
en
ts
% of respondents who reported… (Puskesmas Standards)
See a doctor
Health check–pregnant womenBirthing
Complications withnewbornsHealth check–babies and young childrenComplementary feeding
Services for children under 5
Nutrition advice–mothers
Nutrition advice–children
Family planning
Immunisation
Malnourishment treatment
Tetanus vaccinations
Iron/Zinc supplements
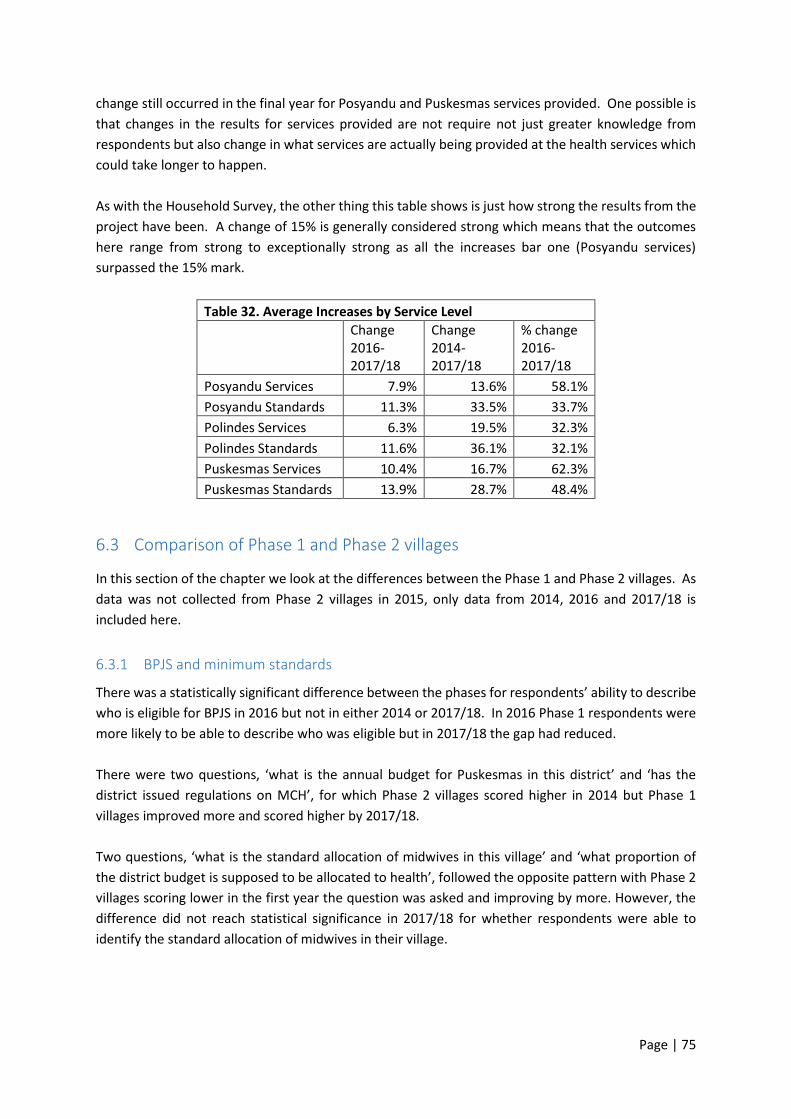
Page | 75
change still occurred in the final year for Posyandu and Puskesmas services provided. One possible is
that changes in the results for services provided are not require not just greater knowledge from
respondents but also change in what services are actually being provided at the health services which
could take longer to happen.
As with the Household Survey, the other thing this table shows is just how strong the results from the
project have been. A change of 15% is generally considered strong which means that the outcomes
here range from strong to exceptionally strong as all the increases bar one (Posyandu services)
surpassed the 15% mark.
Table 32. Average Increases by Service Level
Change 2016-2017/18
Change 2014-2017/18
% change 2016-2017/18
Posyandu Services 7.9% 13.6% 58.1%
Posyandu Standards 11.3% 33.5% 33.7%
Polindes Services 6.3% 19.5% 32.3%
Polindes Standards 11.6% 36.1% 32.1%
Puskesmas Services 10.4% 16.7% 62.3%
Puskesmas Standards 13.9% 28.7% 48.4%
6.3 Comparison of Phase 1 and Phase 2 villages
In this section of the chapter we look at the differences between the Phase 1 and Phase 2 villages. As
data was not collected from Phase 2 villages in 2015, only data from 2014, 2016 and 2017/18 is
included here.
6.3.1 BPJS and minimum standards
There was a statistically significant difference between the phases for respondents’ ability to describe
who is eligible for BPJS in 2016 but not in either 2014 or 2017/18. In 2016 Phase 1 respondents were
more likely to be able to describe who was eligible but in 2017/18 the gap had reduced.
There were two questions, ‘what is the annual budget for Puskesmas in this district’ and ‘has the
district issued regulations on MCH’, for which Phase 2 villages scored higher in 2014 but Phase 1
villages improved more and scored higher by 2017/18.
Two questions, ‘what is the standard allocation of midwives in this village’ and ‘what proportion of
the district budget is supposed to be allocated to health’, followed the opposite pattern with Phase 2
villages scoring lower in the first year the question was asked and improving by more. However, the
difference did not reach statistical significance in 2017/18 for whether respondents were able to
identify the standard allocation of midwives in their village.
Page | 76
6.3.2 Posyandu
At the Posyandu level there were statistically significant differences between phases in at least one
year for three of the nine services provided and four of the ten services required under standards.
Two of the services provided, immunisation (for which Phase 2 villages scored better) and family
planning (for which Phase 1 villages scored better), had similar differences in 2014 and 2017/18
(although the difference did not quite reach statistical significance in 2017/18 for family planning).
This means the improvement in the scores was quite similar for the two phases. Addressing diarrhoea
had a different pattern, with large difference favouring Phase 1 in 2014, Phase 2 in 2016 and then a
much smaller difference in 2017/18.
There were four services required by standards for which there was a statistically significant difference
between the phases in any year. There were statistically significant differences in 2014 for two of the
services required, addressing diarrhoea and tetanus vaccinations, but not in either 2016 or 2017/18.
This suggests that for there was a ‘closing of the gap’ for these two services. This appears to also be
the case for provision of Vitamin A although the gap inverted from 2014, when Phase 1 scored better,
to 2016, when Phase 2 scored better, before reducing in 2017/18. Family planning had a steadily
increasing gap between the phases with Phase 1 villages scoring higher in all three years. The
difference was statistically significant in 2016 and 2017/18.
6.3.3 Polindes
There were three services for which there was a statistically significant difference in any of the years
at the Polindes level. For both health checks for pregnant women and for babies and young children
Phase 2 villages scored higher in 2016 but the difference had all but disappeared by 2017/18. This
seems counterintuitive given Phase 1 villages started a year earlier.
Family planning showed an increase in the difference each year with Phase 1 villages scoring higher
each time. By 2017/18 the difference had reached statistical significance.
There was only one service required by standards for which there was a statistically significant
difference in any year. There was a statistically significant difference in 2017/18 for iron and zinc
supplements with Phase 1 villages scoring higher than Phase 2 villages. Phase 1 villages also scored
higher in each of the other years but the gap was not as large.
6.3.4 Puskesmas
There were statistically significant differences in at least one year for 6 of the 14 services provided at
Puskesmas level. In half of these - health checks for pregnant women, health checks for babies and
young children and family planning - Phase 1 villages increased their scores more from 2014 to 2016
and then Phase 2 villages ‘caught up’ in 2017/18. This is a pattern that fits with the implementation
being undertaken in Phase 1 villages first.
The other three, seeing a doctor, nutrition advice for children and immunisation, do not fit that
pattern. Phase 1 villages initially scored higher for seeing a doctor, but then there was very little
difference between the two sets of villages in 2016 or 2017/18. Nutrition advice for children showed
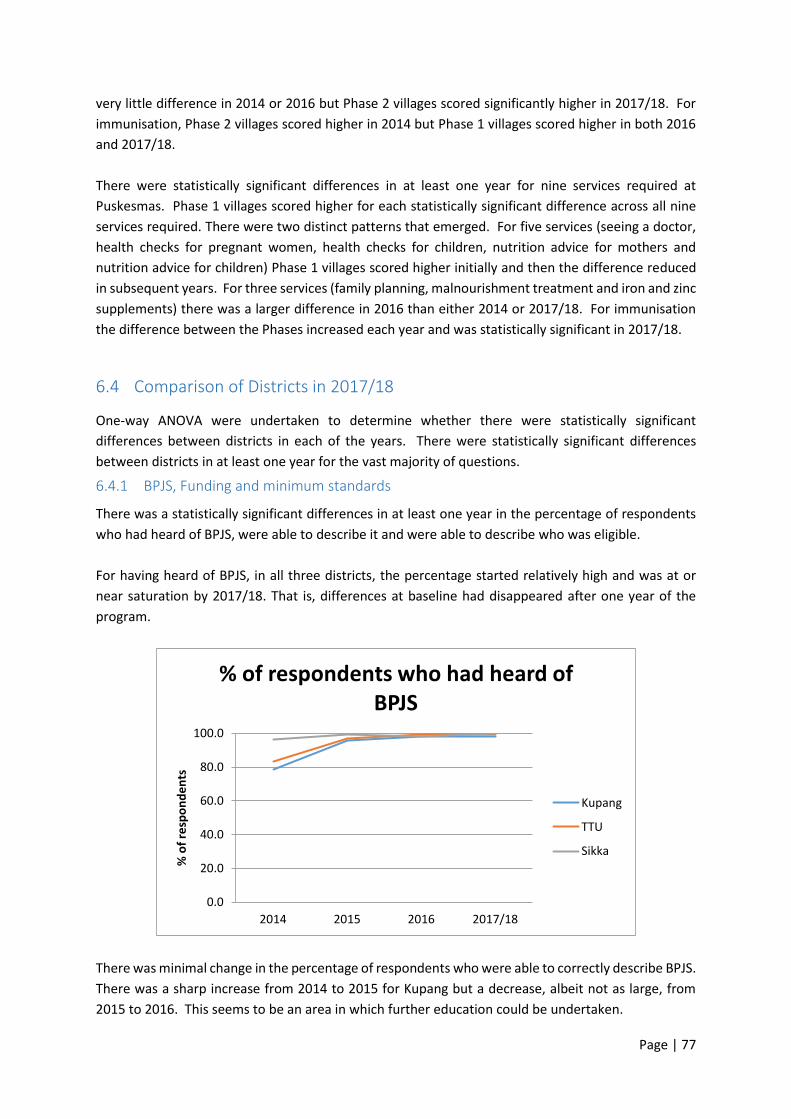
Page | 77
very little difference in 2014 or 2016 but Phase 2 villages scored significantly higher in 2017/18. For
immunisation, Phase 2 villages scored higher in 2014 but Phase 1 villages scored higher in both 2016
and 2017/18.
There were statistically significant differences in at least one year for nine services required at
Puskesmas. Phase 1 villages scored higher for each statistically significant difference across all nine
services required. There were two distinct patterns that emerged. For five services (seeing a doctor,
health checks for pregnant women, health checks for children, nutrition advice for mothers and
nutrition advice for children) Phase 1 villages scored higher initially and then the difference reduced
in subsequent years. For three services (family planning, malnourishment treatment and iron and zinc
supplements) there was a larger difference in 2016 than either 2014 or 2017/18. For immunisation
the difference between the Phases increased each year and was statistically significant in 2017/18.
6.4 Comparison of Districts in 2017/18
One-way ANOVA were undertaken to determine whether there were statistically significant
differences between districts in each of the years. There were statistically significant differences
between districts in at least one year for the vast majority of questions.
6.4.1 BPJS, Funding and minimum standards
There was a statistically significant differences in at least one year in the percentage of respondents
who had heard of BPJS, were able to describe it and were able to describe who was eligible.
For having heard of BPJS, in all three districts, the percentage started relatively high and was at or
near saturation by 2017/18. That is, differences at baseline had disappeared after one year of the
program.
There was minimal change in the percentage of respondents who were able to correctly describe BPJS.
There was a sharp increase from 2014 to 2015 for Kupang but a decrease, albeit not as large, from
2015 to 2016. This seems to be an area in which further education could be undertaken.
0.0
20.0
40.0
60.0
80.0
100.0
2014 2015 2016 2017/18
% o
f re
spo
nd
en
ts
% of respondents who had heard of BPJS
Kupang
TTU
Sikka
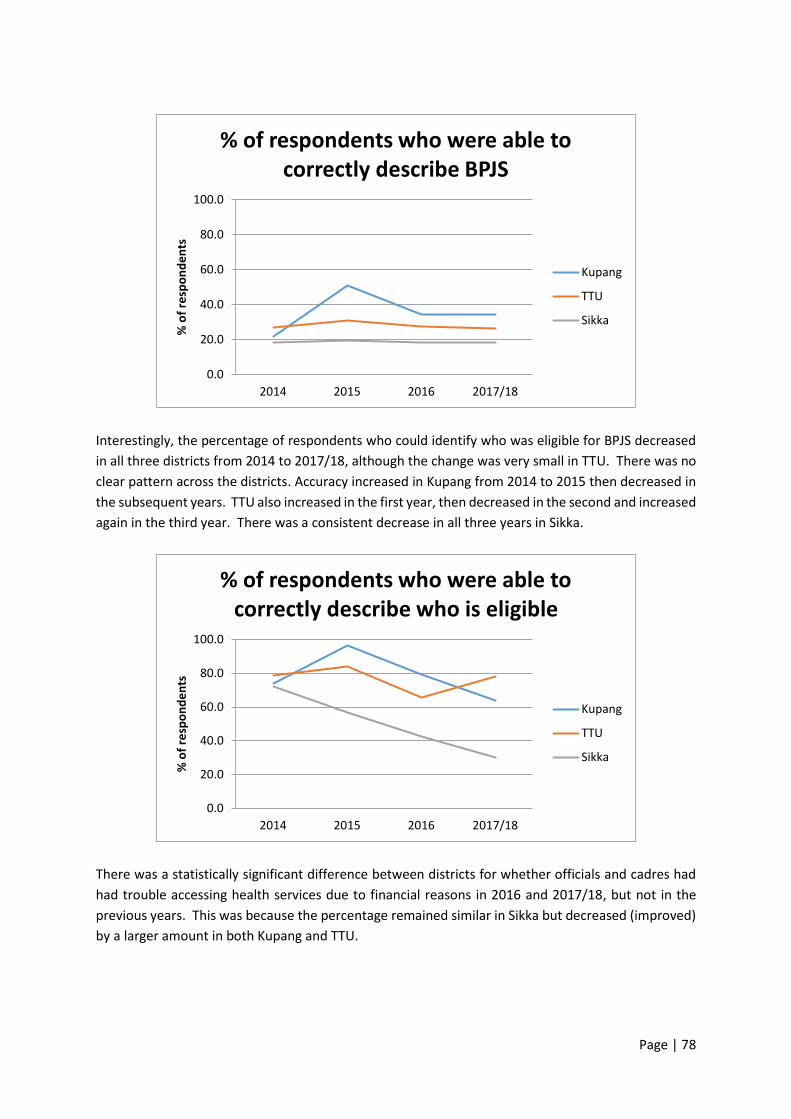
Page | 78
Interestingly, the percentage of respondents who could identify who was eligible for BPJS decreased
in all three districts from 2014 to 2017/18, although the change was very small in TTU. There was no
clear pattern across the districts. Accuracy increased in Kupang from 2014 to 2015 then decreased in
the subsequent years. TTU also increased in the first year, then decreased in the second and increased
again in the third year. There was a consistent decrease in all three years in Sikka.
There was a statistically significant difference between districts for whether officials and cadres had
had trouble accessing health services due to financial reasons in 2016 and 2017/18, but not in the
previous years. This was because the percentage remained similar in Sikka but decreased (improved)
by a larger amount in both Kupang and TTU.
0.0
20.0
40.0
60.0
80.0
100.0
2014 2015 2016 2017/18
% o
f re
spo
nd
en
ts
% of respondents who were able to correctly describe BPJS
Kupang
TTU
Sikka
0.0
20.0
40.0
60.0
80.0
100.0
2014 2015 2016 2017/18
% o
f re
spo
nd
en
ts
% of respondents who were able to correctly describe who is eligible
Kupang
TTU
Sikka

Page | 79
There was a statistically significant difference in whether respondents had heard of minimum
standards for maternal and child health in 2017/18 but not in the previous years. This was due to a
sharp decrease from 2016 to 2017/18 in the percentage of respondents in Kupang who had heard of
minimum standards. There was also a smaller decrease from 2016 to 2017/18 in TTU.
Respondents were asked whether their village and their district had issued regulations on maternal
and child health. There were statistically significant differences in 2014, 2015 and 2016 for villages
and all four time intervals for districts.
There was a slight increase each year in Sikka for whether villages had issued regulations. In TTU there
was an increase in the first two years and a decrease in the third. In Kupang the percentage remained
steady in the first year, decreased in the second and then increased by a large amount in the third.
0.0
20.0
40.0
60.0
80.0
100.0
2014 2015 2016 2017/18
% o
f re
spo
nd
en
ts
% of respondents who had difficulty accessing services due to money
Kupang
TTU
Sikka
0.0
20.0
40.0
60.0
80.0
100.0
2014 2015 2016 2017/18
% o
f re
spo
nd
en
ts
% of respondents who had heard of minimum standards
Kupang
TTU
Sikka
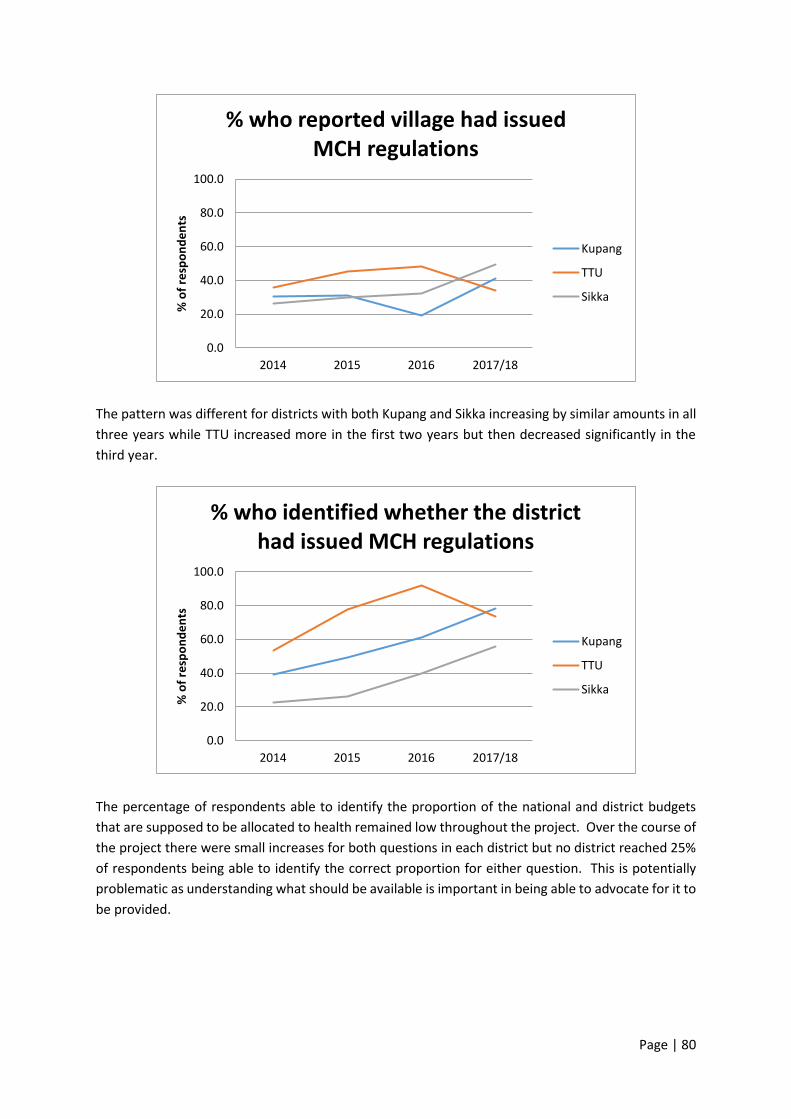
Page | 80
The pattern was different for districts with both Kupang and Sikka increasing by similar amounts in all
three years while TTU increased more in the first two years but then decreased significantly in the
third year.
The percentage of respondents able to identify the proportion of the national and district budgets
that are supposed to be allocated to health remained low throughout the project. Over the course of
the project there were small increases for both questions in each district but no district reached 25%
of respondents being able to identify the correct proportion for either question. This is potentially
problematic as understanding what should be available is important in being able to advocate for it to
be provided.
0.0
20.0
40.0
60.0
80.0
100.0
2014 2015 2016 2017/18
% o
f re
spo
nd
en
ts
% who reported village had issued MCH regulations
Kupang
TTU
Sikka
0.0
20.0
40.0
60.0
80.0
100.0
2014 2015 2016 2017/18
% o
f re
spo
nd
en
ts
% who identified whether the district had issued MCH regulations
Kupang
TTU
Sikka

Page | 81
The same was true for whether respondents were able to identify the annual budget for Puskesmas
although in Kupang the percentage who were able to did increase to just over a quarter of
respondents. All three districts started with the same percentage (1.7%) but increased by different
amounts. There was a large increase in Kupang (24.4%), a moderate increase in Sikka (9.8%) and a
small increase in TTU (1.6%).
0.0
20.0
40.0
60.0
80.0
100.0
2014 2015 2016 2017/18
% o
f re
spo
nd
en
ts
% who identified proportion of national budget to be spent on health
Kupang
TTU
Sikka
0.0
20.0
40.0
60.0
80.0
100.0
2014 2015 2016 2017/18
% o
f re
spo
nd
en
ts
% who identified proportion of district budget to be spent on health
Kupang
TTU
Sikka
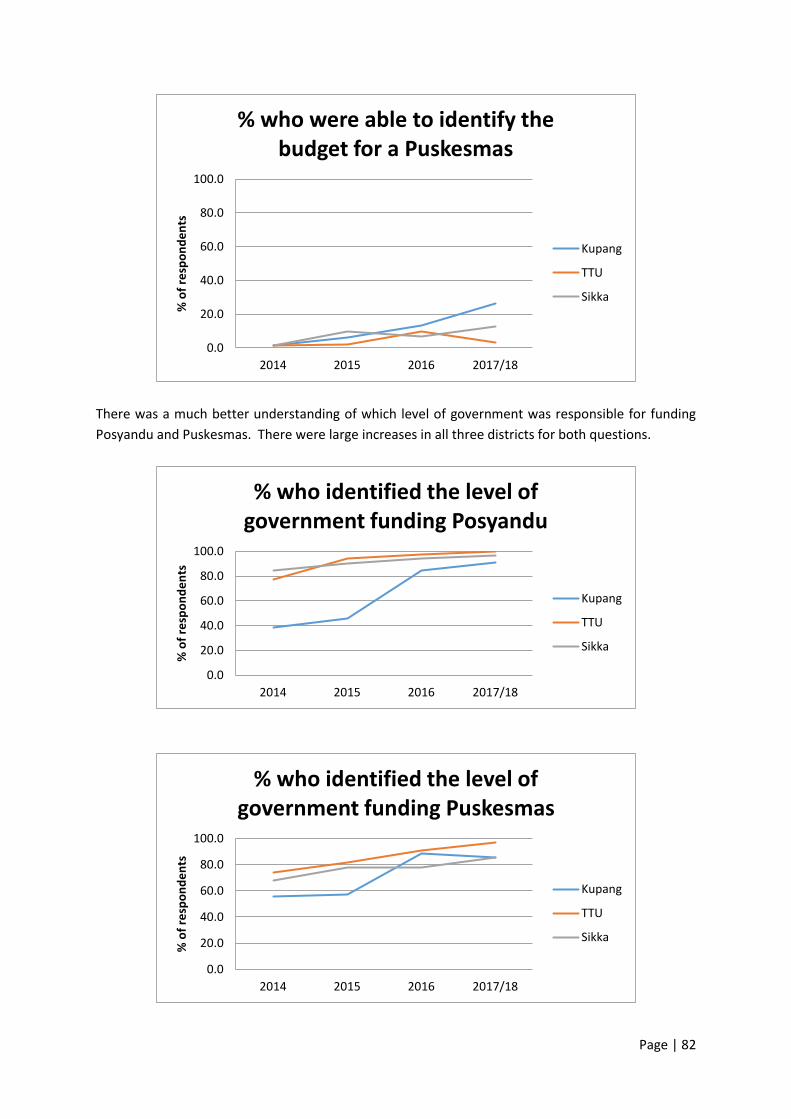
Page | 82
There was a much better understanding of which level of government was responsible for funding
Posyandu and Puskesmas. There were large increases in all three districts for both questions.
0.0
20.0
40.0
60.0
80.0
100.0
2014 2015 2016 2017/18
% o
f re
spo
nd
en
ts
% who were able to identify the budget for a Puskesmas
Kupang
TTU
Sikka
0.0
20.0
40.0
60.0
80.0
100.0
2014 2015 2016 2017/18
% o
f re
spo
nd
en
ts
% who identified the level of government funding Posyandu
Kupang
TTU
Sikka
0.0
20.0
40.0
60.0
80.0
100.0
2014 2015 2016 2017/18
% o
f re
spo
nd
en
ts
% who identified the level of government funding Puskesmas
Kupang
TTU
Sikka

Page | 83
There was a good understanding of the number of midwives that should be allocated to the village in
all three districts and in all three districts there was improvement. The improvement was stronger in
TTU and Sikka, both of which started lower than Kupang but finished higher.
The same was not true for respondents understanding of the number of midwives who should be
allocated to Puskesmas as the proportion started at less than a third in all three districts and decreased
further in both Kupang and Sikka. There was a small increase in TTU.
Overall there does not seem to be a pattern of stronger change in any one of the districts compared
to the other two. Each of the districts had strong results in some areas and concerning results in
others. The differences within districts may be due to different people being surveyed each year. In
particular, if there was an influx of people who were either new to their roles or new to the district,
this could help to explain the decreases for some questions.
0.0
20.0
40.0
60.0
80.0
100.0
2014 2015 2016 2017/18
% o
f re
spo
nd
en
ts
% of respondents who identified the allocation of midwives to Posyandu
Kupang
TTU
Sikka
0.0
20.0
40.0
60.0
80.0
100.0
2014 2015 2016 2017/18
% o
f re
spo
nd
en
ts
% of respondents who identified the allocation of midwives to Puskesmas
Kupang
TTU
Sikka
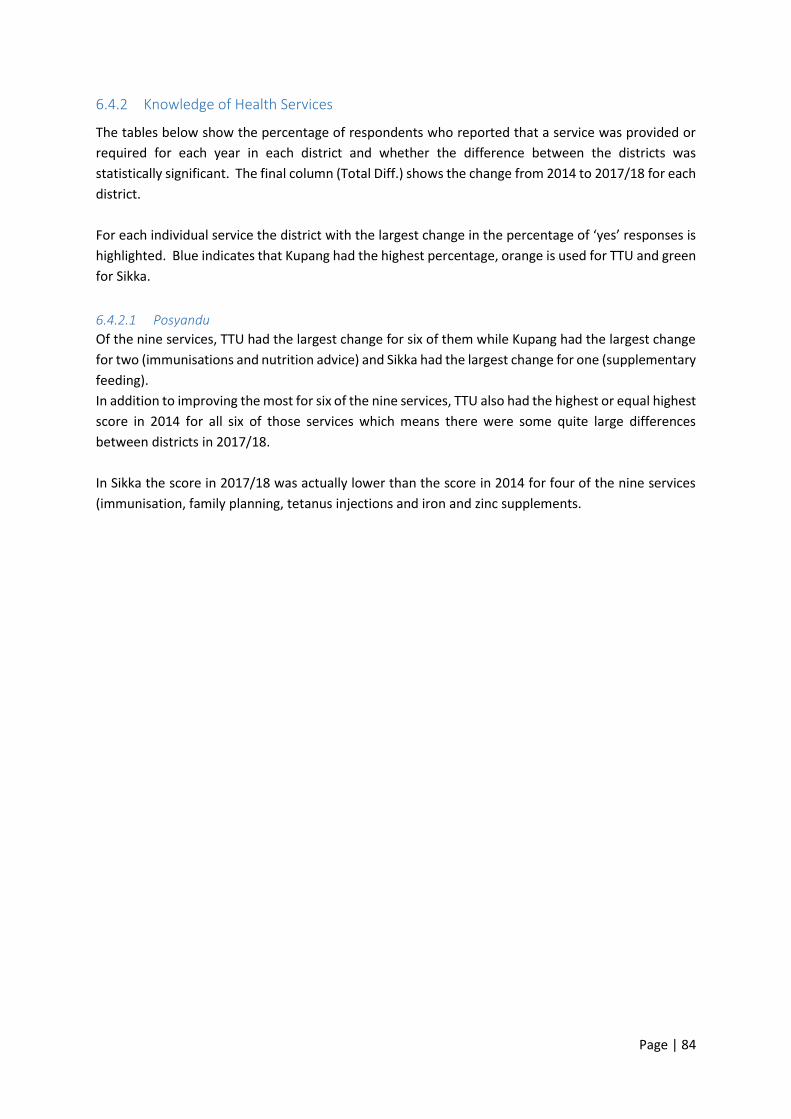
Page | 84
6.4.2 Knowledge of Health Services
The tables below show the percentage of respondents who reported that a service was provided or
required for each year in each district and whether the difference between the districts was
statistically significant. The final column (Total Diff.) shows the change from 2014 to 2017/18 for each
district.
For each individual service the district with the largest change in the percentage of ‘yes’ responses is
highlighted. Blue indicates that Kupang had the highest percentage, orange is used for TTU and green
for Sikka.
6.4.2.1 Posyandu
Of the nine services, TTU had the largest change for six of them while Kupang had the largest change
for two (immunisations and nutrition advice) and Sikka had the largest change for one (supplementary
feeding).
In addition to improving the most for six of the nine services, TTU also had the highest or equal highest
score in 2014 for all six of those services which means there were some quite large differences
between districts in 2017/18.
In Sikka the score in 2017/18 was actually lower than the score in 2014 for four of the nine services
(immunisation, family planning, tetanus injections and iron and zinc supplements.

Page | 85
Table 33. Services provided at Posyandu, by District
2014 2015 2016 2017/188 Total Diff.
Immunisation Kupang 58.1 71.0 89.3 84.9 26.8
TTU 94.2 89.0 95.8 98.3 4.1
Sikka 29.4 9.7 18.3 29.2 -0.2
p. 0.000 0.000 0.000 0.000
Nutrition advice Kupang 40.2 57.0 63.6 63.0 22.8
TTU 71.7 83.0 85.0 86.7 15.0
Sikka 75.6 87.4 77.5 90.0 14.4
p. 0.000 0.000 0.000 0.000
Weighing and measuring babies Kupang 94.0 95.0 100.0 95.0 1.0
TTU 97.5 98.0 100.0 100.0 2.5
Sikka 97.5 99.0 98.3 99.2 1.7
p. 0.010
Addressing diarrhoea Kupang 6.0 8.0 12.4 28.6 22.6
TTU 23.3 38.0 43.3 49.2 25.9
Sikka 15.1 24.3 19.2 21.7 6.6
p. 0.001 0.000 0.000 0.000
Family planning Kupang 14.5 23.0 44.6 47.1 32.6
TTU 32.5 37.0 55.0 72.5 40.0
Sikka 31.1 27.2 15.8 30.8 -0.3
p. 0.002 0.000 0.000
Vitamin A distribution Kupang 32.5 32.0 46.3 55.5 23.0
TTU 62.5 71.0 75.0 90.8 28.3
Sikka 47.1 36.9 14.2 51.7 4.6
p. 0.000 0.000 0.000 0.000
Supplementary feeding Kupang 44.4 65.0 50.4 54.6 10.2
TTU 86.7 72.0 78.3 92.5 5.8
Sikka 70.6 82.5 84.2 91.7 21.1
p. 0.000 0.017 0.000 0.000
TT injection for pregnant mothers Kupang 12.0 6.0 24.0 20.2 8.2
TTU 45.8 43.0 63.3 86.7 40.9
Sikka 9.2 1.0 11.7 3.3 -5.9
p. 0.000 0.000 0.000 0.000
Iron/Zinc Kupang 15.4 5.0 10.7 16.8 1.4
TTU 40.8 22.0 41.7 64.2 23.4
Sikka 14.3 8.7 3.3 8.3 -6.0
p. 0.000 0.000 0.000 0.000
For services required at Posyandu, eight of the nine services, all but supplementary feeding, had the
largest amount of change in TTU. TTU also had the highest scores in 2017/18 for eight of the nine
services. The exception was nutrition advice for which the highest scores were in Sikka.
The size of the difference in change over time is somewhat concerning. The changes in TTU ranged
from 36.7% to 71.6% and the average increase was 53.5%. In Kupang the average was 29.9% and in
Sikka the average was 17.1%. This suggests that there was either external factors influencing the
results, an issue with the data or that the project worked very differently in relation to understanding
of services required in TTU.
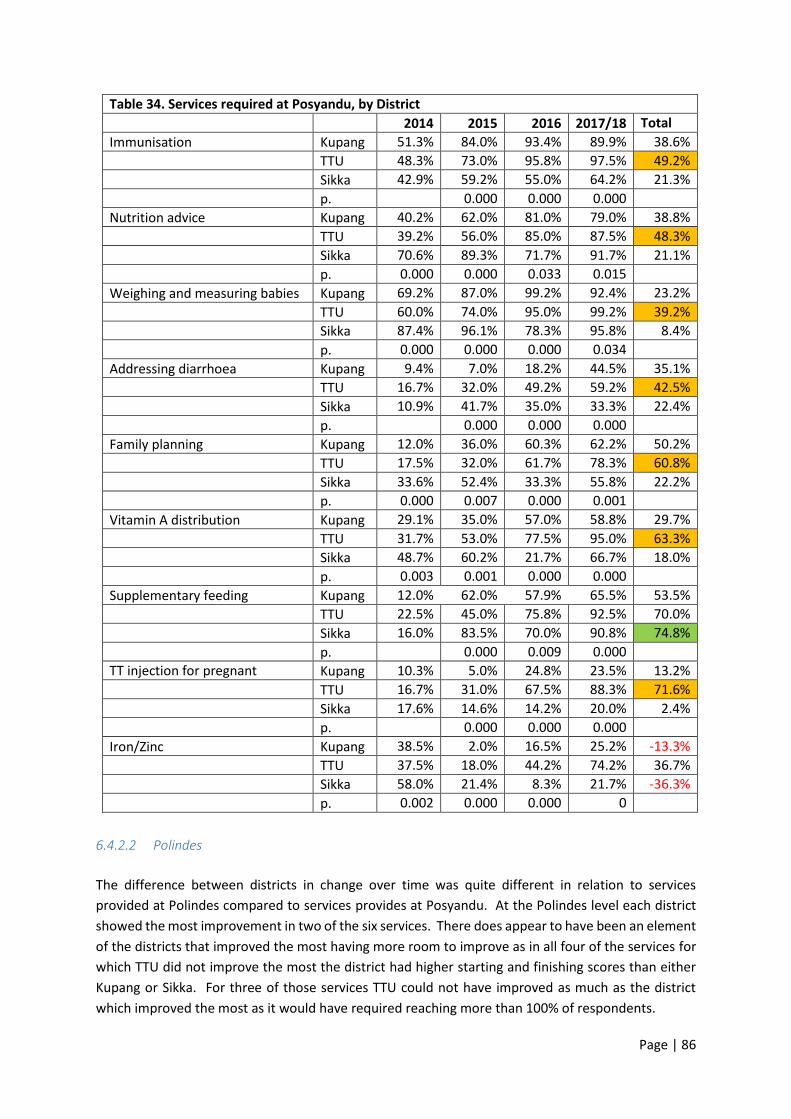
Page | 86
Table 34. Services required at Posyandu, by District
2014 2015 2016 2017/18 Total Diff. Immunisation Kupang 51.3% 84.0% 93.4% 89.9% 38.6%
TTU 48.3% 73.0% 95.8% 97.5% 49.2%
Sikka 42.9% 59.2% 55.0% 64.2% 21.3%
p. 0.000 0.000 0.000
Nutrition advice Kupang 40.2% 62.0% 81.0% 79.0% 38.8%
TTU 39.2% 56.0% 85.0% 87.5% 48.3%
Sikka 70.6% 89.3% 71.7% 91.7% 21.1%
p. 0.000 0.000 0.033 0.015
Weighing and measuring babies Kupang 69.2% 87.0% 99.2% 92.4% 23.2%
TTU 60.0% 74.0% 95.0% 99.2% 39.2%
Sikka 87.4% 96.1% 78.3% 95.8% 8.4%
p. 0.000 0.000 0.000 0.034
Addressing diarrhoea Kupang 9.4% 7.0% 18.2% 44.5% 35.1%
TTU 16.7% 32.0% 49.2% 59.2% 42.5%
Sikka 10.9% 41.7% 35.0% 33.3% 22.4%
p. 0.000 0.000 0.000
Family planning Kupang 12.0% 36.0% 60.3% 62.2% 50.2%
TTU 17.5% 32.0% 61.7% 78.3% 60.8%
Sikka 33.6% 52.4% 33.3% 55.8% 22.2%
p. 0.000 0.007 0.000 0.001
Vitamin A distribution Kupang 29.1% 35.0% 57.0% 58.8% 29.7%
TTU 31.7% 53.0% 77.5% 95.0% 63.3%
Sikka 48.7% 60.2% 21.7% 66.7% 18.0%
p. 0.003 0.001 0.000 0.000
Supplementary feeding Kupang 12.0% 62.0% 57.9% 65.5% 53.5%
TTU 22.5% 45.0% 75.8% 92.5% 70.0%
Sikka 16.0% 83.5% 70.0% 90.8% 74.8%
p. 0.000 0.009 0.000
TT injection for pregnant mothers
Kupang 10.3% 5.0% 24.8% 23.5% 13.2%
TTU 16.7% 31.0% 67.5% 88.3% 71.6%
Sikka 17.6% 14.6% 14.2% 20.0% 2.4%
p. 0.000 0.000 0.000
Iron/Zinc Kupang 38.5% 2.0% 16.5% 25.2% -13.3%
TTU 37.5% 18.0% 44.2% 74.2% 36.7%
Sikka 58.0% 21.4% 8.3% 21.7% -36.3%
p. 0.002 0.000 0.000 0
6.4.2.2 Polindes
The difference between districts in change over time was quite different in relation to services
provided at Polindes compared to services provides at Posyandu. At the Polindes level each district
showed the most improvement in two of the six services. There does appear to have been an element
of the districts that improved the most having more room to improve as in all four of the services for
which TTU did not improve the most the district had higher starting and finishing scores than either
Kupang or Sikka. For three of those services TTU could not have improved as much as the district
which improved the most as it would have required reaching more than 100% of respondents.

Page | 87
Table 35. Services provided at Polindes, by District
2014 2015 2016 2017/18 Total Diff. Health checks–pregnant women Kupang 77.8% 80.0% 90.9% 89.1% 11.3%
TTU 93.3% 88.0% 93.3% 98.3% 5.0%
Sikka 77.3% 88.3% 90.8% 92.5% 15.2%
p. 0.001 0.015
Health checks–babies and young children
Kupang 53.8% 80.0% 78.5% 73.9% 20.1%
TTU 77.5% 88.0% 84.2% 95.0% 17.5%
Sikka 52.1% 88.3% 74.2% 80.0% 27.9%
p. 0.000 0.000
Birthing Kupang 26.5% 67.0% 34.7% 38.7% 12.2%
TTU 47.5% 77.0% 50.0% 43.3% -4.2%
Sikka 16.8% 71.8% 10.8% 9.2% -7.6%
p. 0.000 0.000 0.000
Family planning Kupang 21.4% 22.0% 82.6% 80.7% 59.3%
TTU 62.5% 35.0% 85.0% 94.2% 31.7%
Sikka 31.1% 10.7% 36.7% 57.5% 26.4%
p. 0.000 0.000 0.000 0.000
Tetanus vaccinations Kupang 11.1% 71.0% 25.6% 32.8% 21.7%
TTU 42.5% 69.0% 75.0% 84.2% 41.7%
Sikka 16.0% 55.3% 16.7% 27.5% 11.5%
p. 0.000 0.038 0.000 0.000
Iron/Zinc supplements Kupang 17.9% 12.0% 19.8% 32.8% 14.9%
TTU 49.2% 45.0% 75.8% 92.5% 43.3%
Sikka 21.0% 14.6% 9.2% 25.0% 4.0%
p. 0.000 0.000 0.000 0.000
TTU had the largest improvement for four of the six services required, birthing and family planning
being the exceptions where the largest change was in Kupang.
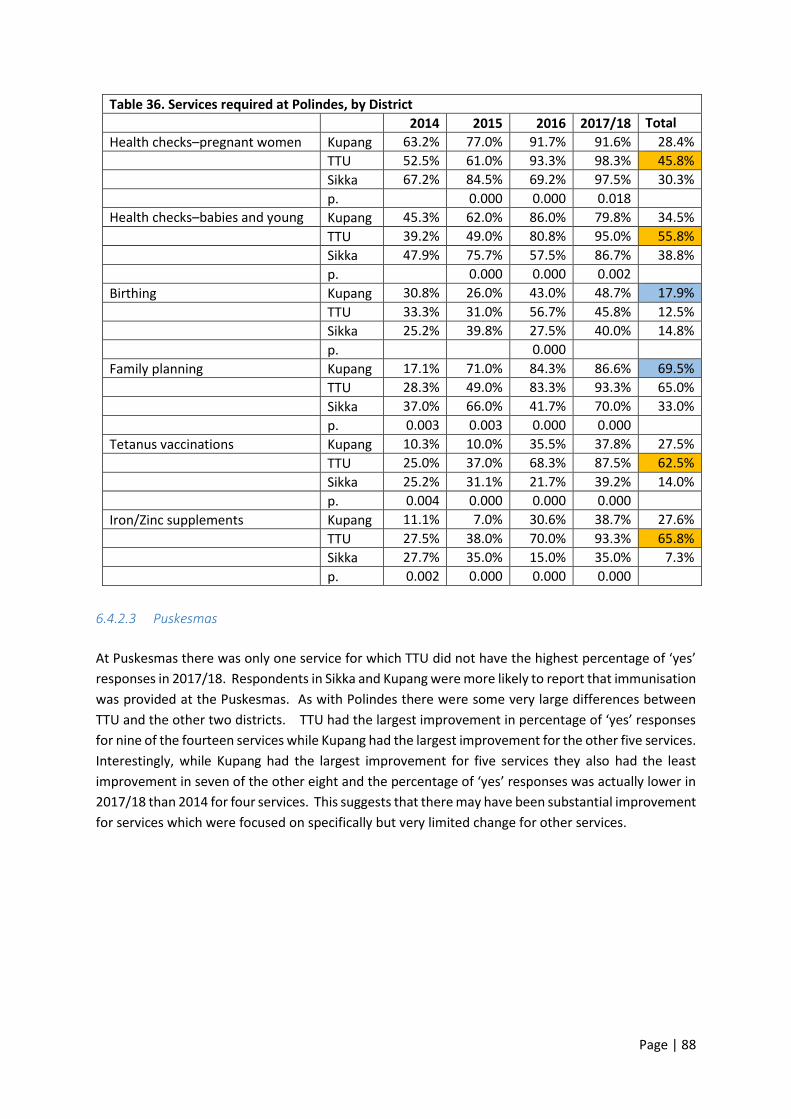
Page | 88
Table 36. Services required at Polindes, by District
2014 2015 2016 2017/18 Total Diff. Health checks–pregnant women Kupang 63.2% 77.0% 91.7% 91.6% 28.4%
TTU 52.5% 61.0% 93.3% 98.3% 45.8%
Sikka 67.2% 84.5% 69.2% 97.5% 30.3%
p. 0.000 0.000 0.018
Health checks–babies and young children
Kupang 45.3% 62.0% 86.0% 79.8% 34.5%
TTU 39.2% 49.0% 80.8% 95.0% 55.8%
Sikka 47.9% 75.7% 57.5% 86.7% 38.8%
p. 0.000 0.000 0.002
Birthing Kupang 30.8% 26.0% 43.0% 48.7% 17.9%
TTU 33.3% 31.0% 56.7% 45.8% 12.5%
Sikka 25.2% 39.8% 27.5% 40.0% 14.8%
p. 0.000
Family planning Kupang 17.1% 71.0% 84.3% 86.6% 69.5%
TTU 28.3% 49.0% 83.3% 93.3% 65.0%
Sikka 37.0% 66.0% 41.7% 70.0% 33.0%
p. 0.003 0.003 0.000 0.000
Tetanus vaccinations Kupang 10.3% 10.0% 35.5% 37.8% 27.5%
TTU 25.0% 37.0% 68.3% 87.5% 62.5%
Sikka 25.2% 31.1% 21.7% 39.2% 14.0%
p. 0.004 0.000 0.000 0.000
Iron/Zinc supplements Kupang 11.1% 7.0% 30.6% 38.7% 27.6%
TTU 27.5% 38.0% 70.0% 93.3% 65.8%
Sikka 27.7% 35.0% 15.0% 35.0% 7.3%
p. 0.002 0.000 0.000 0.000
6.4.2.3 Puskesmas
At Puskesmas there was only one service for which TTU did not have the highest percentage of ‘yes’
responses in 2017/18. Respondents in Sikka and Kupang were more likely to report that immunisation
was provided at the Puskesmas. As with Polindes there were some very large differences between
TTU and the other two districts. TTU had the largest improvement in percentage of ‘yes’ responses
for nine of the fourteen services while Kupang had the largest improvement for the other five services.
Interestingly, while Kupang had the largest improvement for five services they also had the least
improvement in seven of the other eight and the percentage of ‘yes’ responses was actually lower in
2017/18 than 2014 for four services. This suggests that there may have been substantial improvement
for services which were focused on specifically but very limited change for other services.
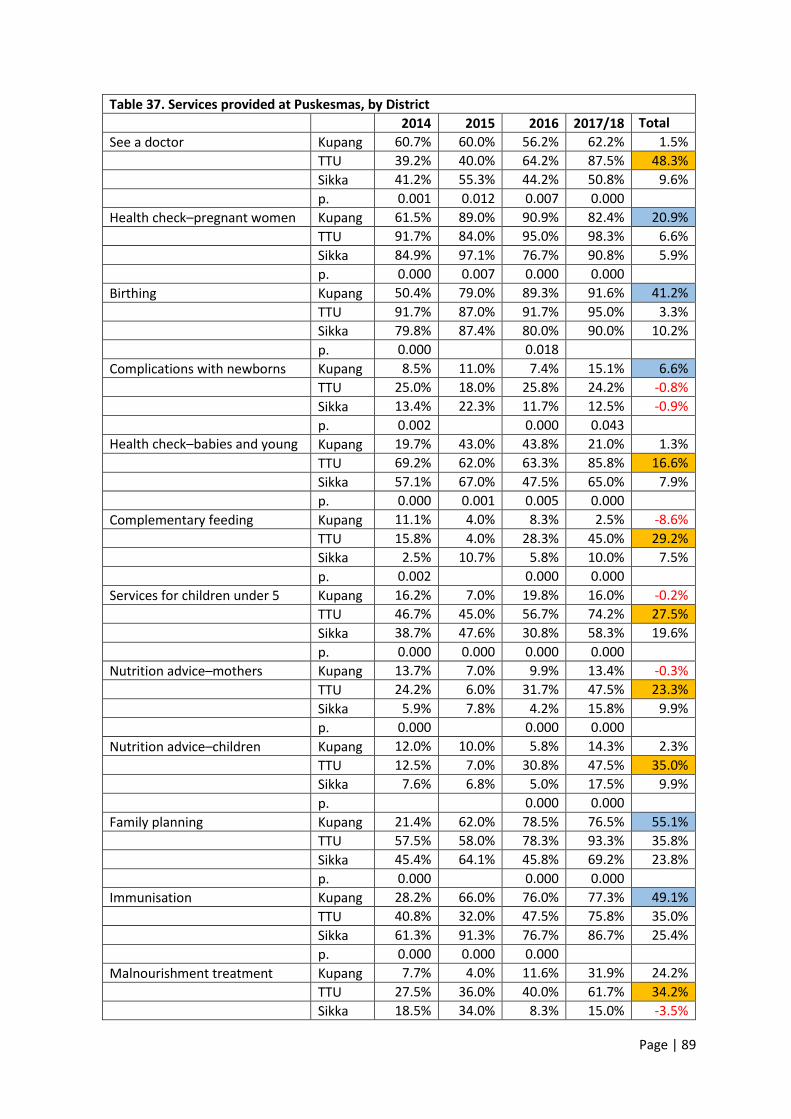
Page | 89
Table 37. Services provided at Puskesmas, by District
2014 2015 2016 2017/18 Total Diff. See a doctor Kupang 60.7% 60.0% 56.2% 62.2% 1.5%
TTU 39.2% 40.0% 64.2% 87.5% 48.3%
Sikka 41.2% 55.3% 44.2% 50.8% 9.6%
p. 0.001 0.012 0.007 0.000
Health check–pregnant women Kupang 61.5% 89.0% 90.9% 82.4% 20.9%
TTU 91.7% 84.0% 95.0% 98.3% 6.6%
Sikka 84.9% 97.1% 76.7% 90.8% 5.9%
p. 0.000 0.007 0.000 0.000
Birthing Kupang 50.4% 79.0% 89.3% 91.6% 41.2%
TTU 91.7% 87.0% 91.7% 95.0% 3.3%
Sikka 79.8% 87.4% 80.0% 90.0% 10.2%
p. 0.000 0.018
Complications with newborns Kupang 8.5% 11.0% 7.4% 15.1% 6.6%
TTU 25.0% 18.0% 25.8% 24.2% -0.8%
Sikka 13.4% 22.3% 11.7% 12.5% -0.9%
p. 0.002 0.000 0.043
Health check–babies and young children
Kupang 19.7% 43.0% 43.8% 21.0% 1.3%
TTU 69.2% 62.0% 63.3% 85.8% 16.6%
Sikka 57.1% 67.0% 47.5% 65.0% 7.9%
p. 0.000 0.001 0.005 0.000
Complementary feeding Kupang 11.1% 4.0% 8.3% 2.5% -8.6%
TTU 15.8% 4.0% 28.3% 45.0% 29.2%
Sikka 2.5% 10.7% 5.8% 10.0% 7.5%
p. 0.002 0.000 0.000
Services for children under 5 Kupang 16.2% 7.0% 19.8% 16.0% -0.2%
TTU 46.7% 45.0% 56.7% 74.2% 27.5%
Sikka 38.7% 47.6% 30.8% 58.3% 19.6%
p. 0.000 0.000 0.000 0.000
Nutrition advice–mothers Kupang 13.7% 7.0% 9.9% 13.4% -0.3%
TTU 24.2% 6.0% 31.7% 47.5% 23.3%
Sikka 5.9% 7.8% 4.2% 15.8% 9.9%
p. 0.000 0.000 0.000
Nutrition advice–children Kupang 12.0% 10.0% 5.8% 14.3% 2.3%
TTU 12.5% 7.0% 30.8% 47.5% 35.0%
Sikka 7.6% 6.8% 5.0% 17.5% 9.9%
p. 0.000 0.000
Family planning Kupang 21.4% 62.0% 78.5% 76.5% 55.1%
TTU 57.5% 58.0% 78.3% 93.3% 35.8%
Sikka 45.4% 64.1% 45.8% 69.2% 23.8%
p. 0.000 0.000 0.000
Immunisation Kupang 28.2% 66.0% 76.0% 77.3% 49.1%
TTU 40.8% 32.0% 47.5% 75.8% 35.0%
Sikka 61.3% 91.3% 76.7% 86.7% 25.4%
p. 0.000 0.000 0.000
Malnourishment treatment Kupang 7.7% 4.0% 11.6% 31.9% 24.2%
TTU 27.5% 36.0% 40.0% 61.7% 34.2%
Sikka 18.5% 34.0% 8.3% 15.0% -3.5%
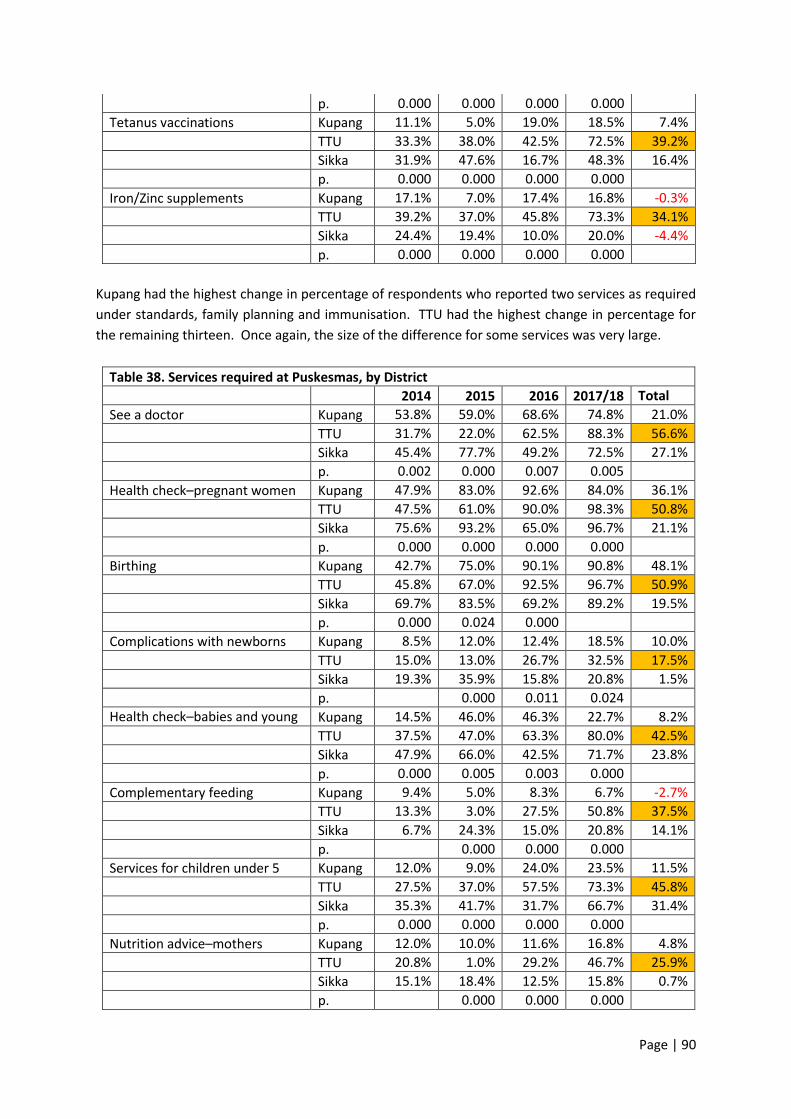
Page | 90
p. 0.000 0.000 0.000 0.000
Tetanus vaccinations Kupang 11.1% 5.0% 19.0% 18.5% 7.4%
TTU 33.3% 38.0% 42.5% 72.5% 39.2%
Sikka 31.9% 47.6% 16.7% 48.3% 16.4%
p. 0.000 0.000 0.000 0.000
Iron/Zinc supplements Kupang 17.1% 7.0% 17.4% 16.8% -0.3%
TTU 39.2% 37.0% 45.8% 73.3% 34.1%
Sikka 24.4% 19.4% 10.0% 20.0% -4.4%
p. 0.000 0.000 0.000 0.000
Kupang had the highest change in percentage of respondents who reported two services as required
under standards, family planning and immunisation. TTU had the highest change in percentage for
the remaining thirteen. Once again, the size of the difference for some services was very large.
Table 38. Services required at Puskesmas, by District
2014 2015 2016 2017/18 Total Diff. See a doctor Kupang 53.8% 59.0% 68.6% 74.8% 21.0%
TTU 31.7% 22.0% 62.5% 88.3% 56.6%
Sikka 45.4% 77.7% 49.2% 72.5% 27.1%
p. 0.002 0.000 0.007 0.005
Health check–pregnant women Kupang 47.9% 83.0% 92.6% 84.0% 36.1%
TTU 47.5% 61.0% 90.0% 98.3% 50.8%
Sikka 75.6% 93.2% 65.0% 96.7% 21.1%
p. 0.000 0.000 0.000 0.000
Birthing Kupang 42.7% 75.0% 90.1% 90.8% 48.1%
TTU 45.8% 67.0% 92.5% 96.7% 50.9%
Sikka 69.7% 83.5% 69.2% 89.2% 19.5%
p. 0.000 0.024 0.000
Complications with newborns Kupang 8.5% 12.0% 12.4% 18.5% 10.0%
TTU 15.0% 13.0% 26.7% 32.5% 17.5%
Sikka 19.3% 35.9% 15.8% 20.8% 1.5%
p. 0.000 0.011 0.024
Health check–babies and young children
Kupang 14.5% 46.0% 46.3% 22.7% 8.2%
TTU 37.5% 47.0% 63.3% 80.0% 42.5%
Sikka 47.9% 66.0% 42.5% 71.7% 23.8%
p. 0.000 0.005 0.003 0.000
Complementary feeding Kupang 9.4% 5.0% 8.3% 6.7% -2.7%
TTU 13.3% 3.0% 27.5% 50.8% 37.5%
Sikka 6.7% 24.3% 15.0% 20.8% 14.1%
p. 0.000 0.000 0.000
Services for children under 5 Kupang 12.0% 9.0% 24.0% 23.5% 11.5%
TTU 27.5% 37.0% 57.5% 73.3% 45.8%
Sikka 35.3% 41.7% 31.7% 66.7% 31.4%
p. 0.000 0.000 0.000 0.000
Nutrition advice–mothers Kupang 12.0% 10.0% 11.6% 16.8% 4.8%
TTU 20.8% 1.0% 29.2% 46.7% 25.9%
Sikka 15.1% 18.4% 12.5% 15.8% 0.7%
p. 0.000 0.000 0.000
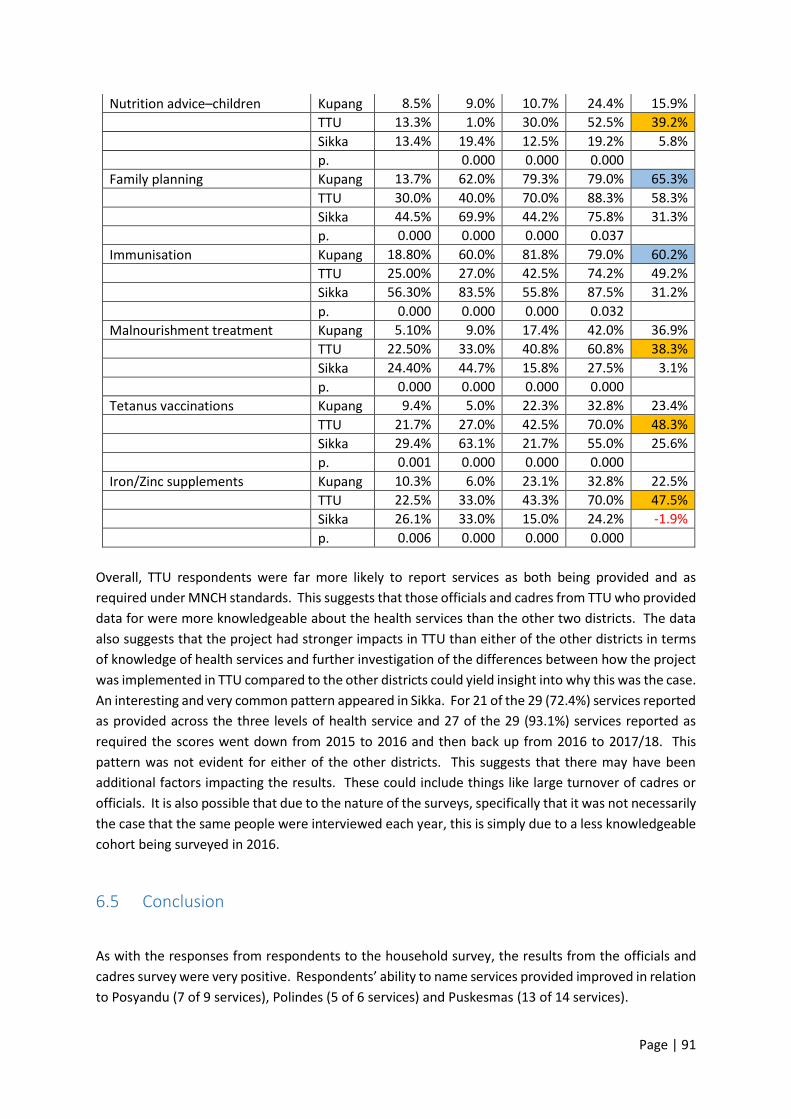
Page | 91
Nutrition advice–children Kupang 8.5% 9.0% 10.7% 24.4% 15.9%
TTU 13.3% 1.0% 30.0% 52.5% 39.2%
Sikka 13.4% 19.4% 12.5% 19.2% 5.8%
p. 0.000 0.000 0.000
Family planning Kupang 13.7% 62.0% 79.3% 79.0% 65.3%
TTU 30.0% 40.0% 70.0% 88.3% 58.3%
Sikka 44.5% 69.9% 44.2% 75.8% 31.3%
p. 0.000 0.000 0.000 0.037
Immunisation Kupang 18.80% 60.0% 81.8% 79.0% 60.2%
TTU 25.00% 27.0% 42.5% 74.2% 49.2%
Sikka 56.30% 83.5% 55.8% 87.5% 31.2%
p. 0.000 0.000 0.000 0.032
Malnourishment treatment Kupang 5.10% 9.0% 17.4% 42.0% 36.9%
TTU 22.50% 33.0% 40.8% 60.8% 38.3%
Sikka 24.40% 44.7% 15.8% 27.5% 3.1%
p. 0.000 0.000 0.000 0.000
Tetanus vaccinations Kupang 9.4% 5.0% 22.3% 32.8% 23.4%
TTU 21.7% 27.0% 42.5% 70.0% 48.3%
Sikka 29.4% 63.1% 21.7% 55.0% 25.6%
p. 0.001 0.000 0.000 0.000
Iron/Zinc supplements Kupang 10.3% 6.0% 23.1% 32.8% 22.5%
TTU 22.5% 33.0% 43.3% 70.0% 47.5%
Sikka 26.1% 33.0% 15.0% 24.2% -1.9%
p. 0.006 0.000 0.000 0.000
Overall, TTU respondents were far more likely to report services as both being provided and as
required under MNCH standards. This suggests that those officials and cadres from TTU who provided
data for were more knowledgeable about the health services than the other two districts. The data
also suggests that the project had stronger impacts in TTU than either of the other districts in terms
of knowledge of health services and further investigation of the differences between how the project
was implemented in TTU compared to the other districts could yield insight into why this was the case.
An interesting and very common pattern appeared in Sikka. For 21 of the 29 (72.4%) services reported
as provided across the three levels of health service and 27 of the 29 (93.1%) services reported as
required the scores went down from 2015 to 2016 and then back up from 2016 to 2017/18. This
pattern was not evident for either of the other districts. This suggests that there may have been
additional factors impacting the results. These could include things like large turnover of cadres or
officials. It is also possible that due to the nature of the surveys, specifically that it was not necessarily
the case that the same people were interviewed each year, this is simply due to a less knowledgeable
cohort being surveyed in 2016.
6.5 Conclusion
As with the responses from respondents to the household survey, the results from the officials and
cadres survey were very positive. Respondents’ ability to name services provided improved in relation
to Posyandu (7 of 9 services), Polindes (5 of 6 services) and Puskesmas (13 of 14 services).

Page | 92
The results were even more positive in relation to respondents’ ability to name the services required
by standards. There was a statistically significant improvement for all services at Polindes (6 of 6) and
Puskesmas (14 of 14) and all but one service at Posyandu (8 of 9).
Despite the impressive results - both in terms of the number of services for which there were changes
and the size of the changes in understanding - there remains room for improvement. Less than half
the respondents reported that that a service was being provided for 13 of the 29 services listed across
the health service levels. Less than half the respondents indicated that a service was required by the
government standards for 10 of the 29 services.
While the pattern was not as strong as for the household survey respondents, a large percentage of
the overall change occurred in the final year.
Village officials and cadres form part of the health services system in Indonesia – cadres as direct
service providers, and village officials as part-funders, supervisors and information providers.
Consequently, growth in knowledge for these cohorts is likely to support growth in knowledge for
citizens. This is supported by findings in relation to processes of change discussed in the next chapter.
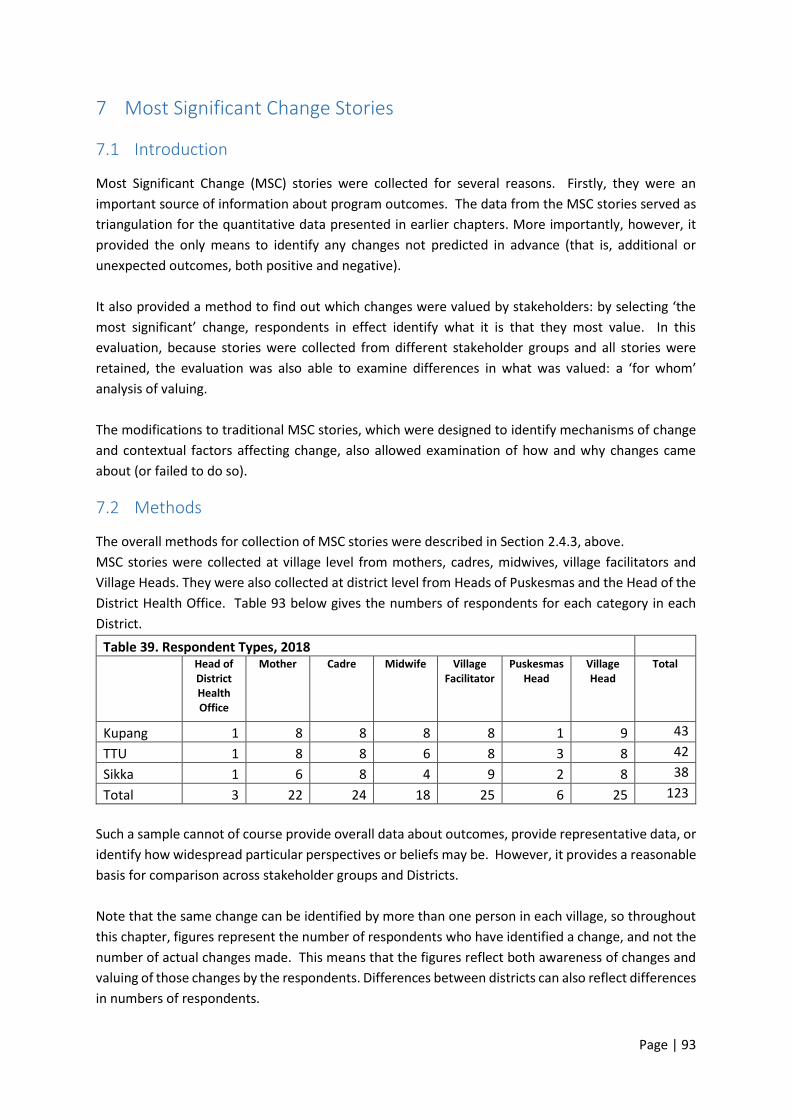
Page | 93
7 Most Significant Change Stories
7.1 Introduction
Most Significant Change (MSC) stories were collected for several reasons. Firstly, they were an
important source of information about program outcomes. The data from the MSC stories served as
triangulation for the quantitative data presented in earlier chapters. More importantly, however, it
provided the only means to identify any changes not predicted in advance (that is, additional or
unexpected outcomes, both positive and negative).
It also provided a method to find out which changes were valued by stakeholders: by selecting ‘the
most significant’ change, respondents in effect identify what it is that they most value. In this
evaluation, because stories were collected from different stakeholder groups and all stories were
retained, the evaluation was also able to examine differences in what was valued: a ‘for whom’
analysis of valuing.
The modifications to traditional MSC stories, which were designed to identify mechanisms of change
and contextual factors affecting change, also allowed examination of how and why changes came
about (or failed to do so).
7.2 Methods
The overall methods for collection of MSC stories were described in Section 2.4.3, above.
MSC stories were collected at village level from mothers, cadres, midwives, village facilitators and
Village Heads. They were also collected at district level from Heads of Puskesmas and the Head of the
District Health Office. Table 93 below gives the numbers of respondents for each category in each
District.
Table 39. Respondent Types, 2018
Head of District Health Office
Mother Cadre Midwife Village Facilitator
Puskesmas Head
Village Head
Total
Kupang 1 8 8 8 8 1 9 43
TTU 1 8 8 6 8 3 8 42
Sikka 1 6 8 4 9 2 8 38
Total 3 22 24 18 25 6 25 123
Such a sample cannot of course provide overall data about outcomes, provide representative data, or
identify how widespread particular perspectives or beliefs may be. However, it provides a reasonable
basis for comparison across stakeholder groups and Districts.
Note that the same change can be identified by more than one person in each village, so throughout
this chapter, figures represent the number of respondents who have identified a change, and not the
number of actual changes made. This means that the figures reflect both awareness of changes and
valuing of those changes by the respondents. Differences between districts can also reflect differences
in numbers of respondents.
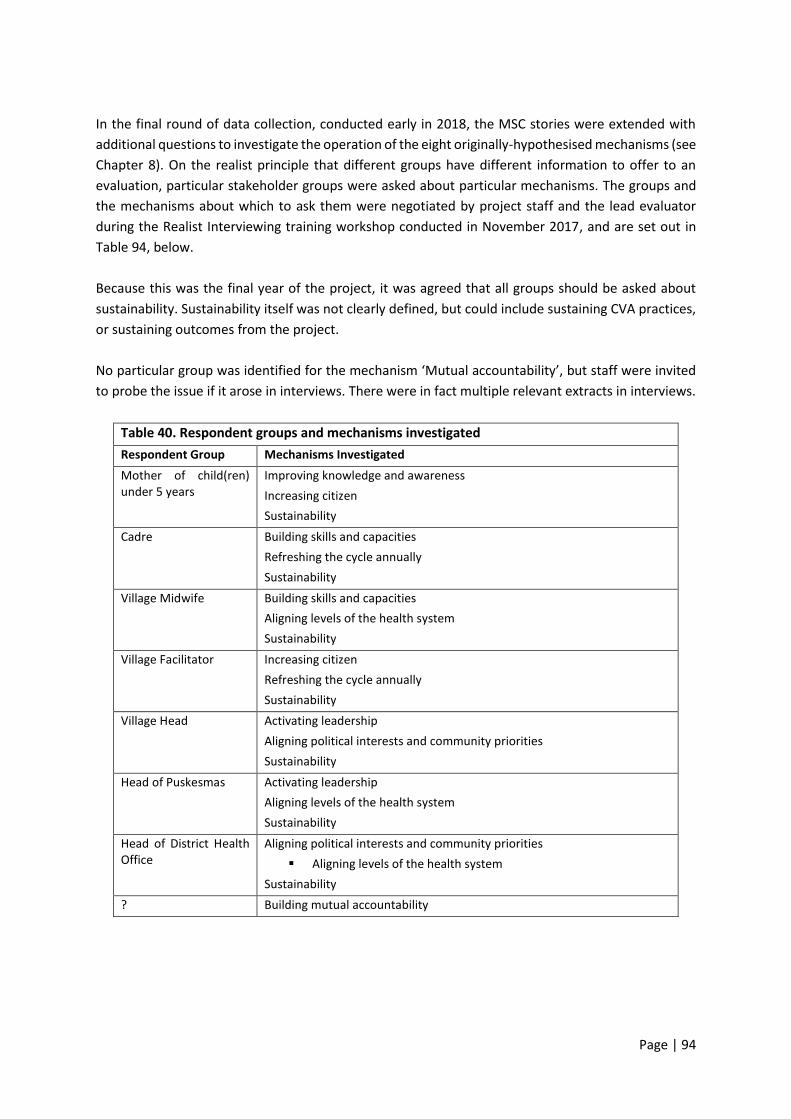
Page | 94
In the final round of data collection, conducted early in 2018, the MSC stories were extended with
additional questions to investigate the operation of the eight originally-hypothesised mechanisms (see
Chapter 8). On the realist principle that different groups have different information to offer to an
evaluation, particular stakeholder groups were asked about particular mechanisms. The groups and
the mechanisms about which to ask them were negotiated by project staff and the lead evaluator
during the Realist Interviewing training workshop conducted in November 2017, and are set out in
Table 94, below.
Because this was the final year of the project, it was agreed that all groups should be asked about
sustainability. Sustainability itself was not clearly defined, but could include sustaining CVA practices,
or sustaining outcomes from the project.
No particular group was identified for the mechanism ‘Mutual accountability’, but staff were invited
to probe the issue if it arose in interviews. There were in fact multiple relevant extracts in interviews.
Table 40. Respondent groups and mechanisms investigated
Respondent Group Mechanisms Investigated
Mother of child(ren) under 5 years
Improving knowledge and awareness
Increasing citizen
Sustainability
Cadre Building skills and capacities
Refreshing the cycle annually
Sustainability
Village Midwife Building skills and capacities
Aligning levels of the health system
Sustainability
Village Facilitator Increasing citizen
Refreshing the cycle annually
Sustainability
Village Head
Activating leadership
Aligning political interests and community priorities
Sustainability
Head of Puskesmas Activating leadership
Aligning levels of the health system
Sustainability
Head of District Health Office
Aligning political interests and community priorities
▪ Aligning levels of the health system
Sustainability
? Building mutual accountability

Page | 95
7.2.1 Quantitative analysis methods.
Quantitative analysis of MSC stories was initially undertaken by CVA project staff. Staff members
transcribed the interviews that they had done; read through the transcripts and coded each instance
(using the numeral 1) in an Excel spreadsheet of the following elements:
• changes in relation to service providers:
o policy (at village, sub-district, district, province or national levels);
o budget (at village, sub-district, district, province or national levels);
o services (midwives, other staffing, availability of services, quality of services, and service responsiveness;
o government responsiveness (at village, sub-district, district, province or national levels);
• changes in relation to service users:
o knowledge and attitude (knowledge of service availability, understanding of rights, understanding of service standards);
o use of services
o citizen participation (capacity to engage, willingness to engage, participation)
• most significant changes, using the same categories and sub-categories as above;
• higher level outcomes: service access; service quality; child health; maternal health; child development; participation and empowerment; community strengthening; community future and other;
• mechanisms: Improved knowledge or awareness, citizen engagement, mutual accountability, aligning levels of the health system, aligning political and community interests; building skills and capacities; refreshing the cycle annually, and ‘other’;
• key elements of context (a free text for important quotes).
Certain categorical data was also recorded for each interview, including the District, Village, and
respondent type. This meant that analysis could be undertaken by District and respondent type.
Quantitative data as coded by CVA project staff was then analysed and graphs were prepared by CM
staff.
7.2.2 Qualitative analysis
Because all data collection had been undertaken in Bahasa or local languages, which the independent
evaluators do not speak, and because the evaluation aimed to contribute to Wahana Visi’s capacity to
undertake realist evaluation, two processes were used for data analysis.
The first involved extraction and analysis by Wahana Visi team members during the analysis workshop.
They undertook a three-stage process. Firstly, staff members read through interviews, highlighting
and annotating significant sections as they read. Secondly, they were provided with a template for
data extraction (see Table … below). The aim was to collate data about particular topics or
mechanisms from across interviews, so that patterns or themes in the data would be more apparent.
Columns were to be left blank if there was no direct evidence in the interview.
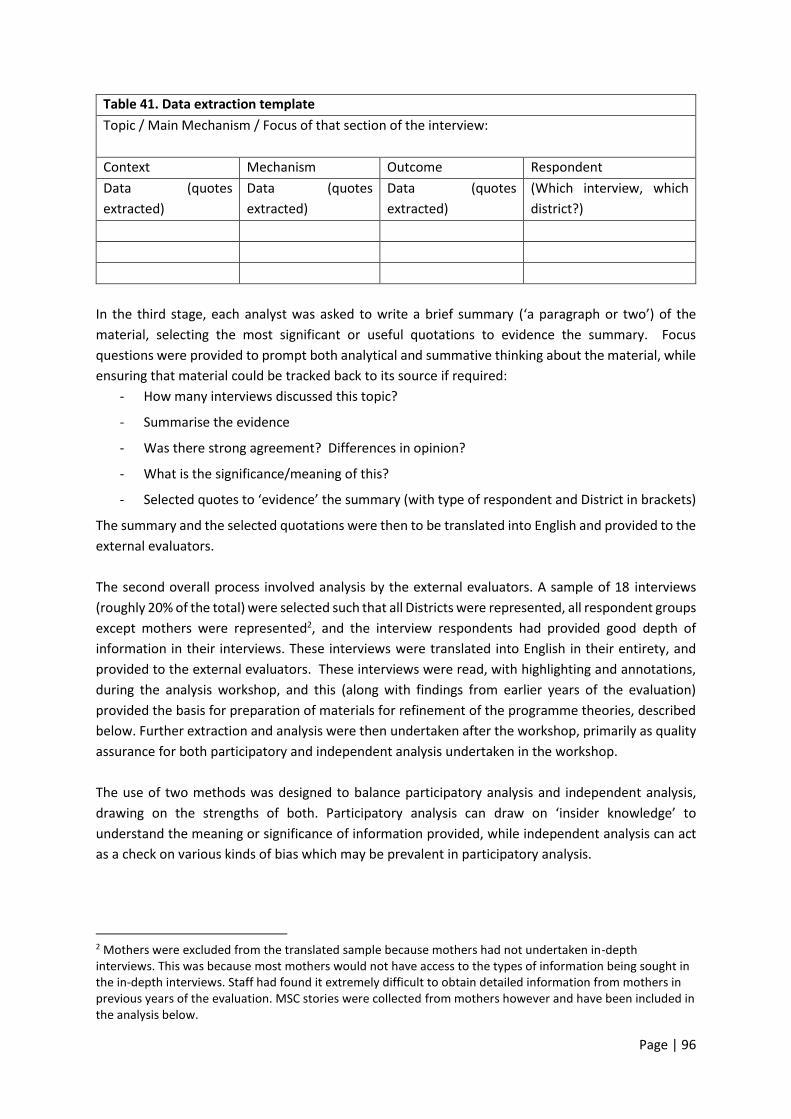
Page | 96
Table 41. Data extraction template
Topic / Main Mechanism / Focus of that section of the interview:
Context Mechanism Outcome Respondent
Data (quotes
extracted)
Data (quotes
extracted)
Data (quotes
extracted)
(Which interview, which
district?)
In the third stage, each analyst was asked to write a brief summary (‘a paragraph or two’) of the
material, selecting the most significant or useful quotations to evidence the summary. Focus
questions were provided to prompt both analytical and summative thinking about the material, while
ensuring that material could be tracked back to its source if required:
- How many interviews discussed this topic?
- Summarise the evidence
- Was there strong agreement? Differences in opinion?
- What is the significance/meaning of this?
- Selected quotes to ‘evidence’ the summary (with type of respondent and District in brackets)
The summary and the selected quotations were then to be translated into English and provided to the
external evaluators.
The second overall process involved analysis by the external evaluators. A sample of 18 interviews
(roughly 20% of the total) were selected such that all Districts were represented, all respondent groups
except mothers were represented2, and the interview respondents had provided good depth of
information in their interviews. These interviews were translated into English in their entirety, and
provided to the external evaluators. These interviews were read, with highlighting and annotations,
during the analysis workshop, and this (along with findings from earlier years of the evaluation)
provided the basis for preparation of materials for refinement of the programme theories, described
below. Further extraction and analysis were then undertaken after the workshop, primarily as quality
assurance for both participatory and independent analysis undertaken in the workshop.
The use of two methods was designed to balance participatory analysis and independent analysis,
drawing on the strengths of both. Participatory analysis can draw on ‘insider knowledge’ to
understand the meaning or significance of information provided, while independent analysis can act
as a check on various kinds of bias which may be prevalent in participatory analysis.
2 Mothers were excluded from the translated sample because mothers had not undertaken in-depth interviews. This was because most mothers would not have access to the types of information being sought in the in-depth interviews. Staff had found it extremely difficult to obtain detailed information from mothers in previous years of the evaluation. MSC stories were collected from mothers however and have been included in the analysis below.
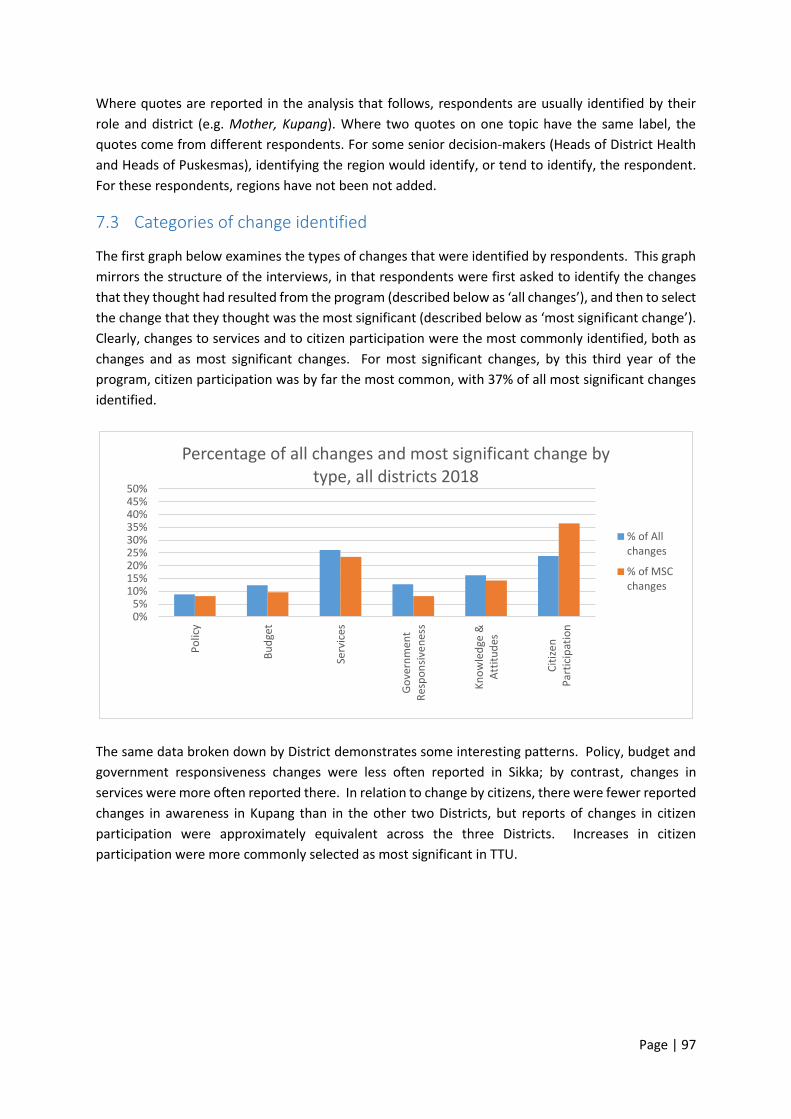
Page | 97
Where quotes are reported in the analysis that follows, respondents are usually identified by their
role and district (e.g. Mother, Kupang). Where two quotes on one topic have the same label, the
quotes come from different respondents. For some senior decision-makers (Heads of District Health
and Heads of Puskesmas), identifying the region would identify, or tend to identify, the respondent.
For these respondents, regions have not been not added.
7.3 Categories of change identified
The first graph below examines the types of changes that were identified by respondents. This graph
mirrors the structure of the interviews, in that respondents were first asked to identify the changes
that they thought had resulted from the program (described below as ‘all changes’), and then to select
the change that they thought was the most significant (described below as ‘most significant change’).
Clearly, changes to services and to citizen participation were the most commonly identified, both as
changes and as most significant changes. For most significant changes, by this third year of the
program, citizen participation was by far the most common, with 37% of all most significant changes
identified.
The same data broken down by District demonstrates some interesting patterns. Policy, budget and
government responsiveness changes were less often reported in Sikka; by contrast, changes in
services were more often reported there. In relation to change by citizens, there were fewer reported
changes in awareness in Kupang than in the other two Districts, but reports of changes in citizen
participation were approximately equivalent across the three Districts. Increases in citizen
participation were more commonly selected as most significant in TTU.
0%5%
10%15%20%25%30%35%40%45%50%
Po
licy
Bu
dge
t
Serv
ices
Go
vern
men
tR
esp
on
sive
nes
s
Kn
ow
led
ge &
Att
itu
des
Cit
ize
nP
arti
cip
atio
n
Percentage of all changes and most significant change by type, all districts 2018
% of Allchanges
% of MSCchanges
Page | 98
The levels of Government most commonly identified for policy, budget and government
responsiveness showed a remarkably clear pattern. Almost all reported changes were at the village
level. However, it is not clear the extent to which this reflects the respondent sample (the great
majority of respondents were interviewed at the village level) and to what extent it reflects actual
changes made. To the extent that respondents provided an accurate reflection of change, the findings
give reasons both for celebration and concern. Changes at the village government level clearly should
be celebrated. However, the project would appear to have had very little impact at higher levels.
Given that service funding and policy decisions are primarily made at higher levels, and that support
from those levels will be necessary for sustainability of project outcomes, this is of concern.
7.3.1 Changes in services
Improving services was a primary aim of the project. The next graphs break this category down into
more specific kinds of changes identified by respondents in relation to services. For the whole of
project level (that is, across all districts), availability and quality of services were most commonly
reported, closely followed by improvements in relation to midwives. This includes increased
0%
20%
40%
60%
80%
100%
Allchanges
MSCChanges
Allchanges
MSCChanges
Allchanges
MSCChanges
Allchanges
MSCChanges
Allchanges
MSCChanges
Allchanges
MSCChanges
Policy Budget Services GovernmentResponsiveness
Knowledge &Attitudes
CitizenParticipation
Percentage of all changes and most significant changes by type, by district 2018
Kupang TTU Sikka
0
20
40
60
80
100
Village Sub-district District Province National
Number of all changes by level of governance, all districts 2018
Policy Budget Government Responsiveness

Page | 99
employment of midwives, increased availability because more lived locally in villages, and improved
service by midwives.
The same data broken down by Districts shows that more changes were identified in relation to most
categories in Sikka: it is interesting to speculate whether the reported increase in midwives underpins
perceived improvements in both availability and quality in that region.
7.3.1.1 Changes in relation to staffing
Improvements in the availability of midwives were often directly related, by those interviewed, to the
requirements of government standards.
Then there are a lot of positives changes, including 5 heads of villages who signed [paid for]
the midwife using the village fund. (Puskesmas Head)
The placement of the village midwife is the most important (change) for me. …one of the
standards of how a Polindes meets the standards is to have a village midwife living in the
village. So we make a request to the Puskesmas and to our health department based on that
regulation (standard). (Village Facilitator, TTU)
44, 22%
26, 13%
51, 26%
51, 26%
27, 13%
Changes in relation to services, all districts 2018
Midwives
Other staffing includingcadres
Availability of services
Quality of service delivery
Service Responsiveness
0
5
10
15
20
25
Midwives Other staffingincluding cadres
Availability ofservices
Quality ofservice delivery
ServiceResponsiveness
Number of all changes in relation to services, by district, 2018
Kupang TTU Sikka
Page | 100
I think (the most important change is the availability) of the village midwife … At the meeting,
we explored the problem and then we suggested to provide the village midwife. Because in
standard one village at least have one village midwife. So the rules have asked to provide one
midwife in the village. Now the midwife has been here since October. (Mother, TTU)
In addition to midwives, respondents discussed additional nurses and other health workers.
Residents see this health service is not maximal due to shortage of health workers. So it is
proposed that there will be additional health worker ... The proposal of the villagers is
accepted ... village support by funding this additional health worker. (Cadre, Sikka)
the most important one is the placement of nurses in sub village... Before, there was no nurse
there, people … are away from the health facilities, so, it was a bit difficult. There are people
there who really need the health services by nurses or medical personnel (Village facilitator
2)
Improvements in the number, level of activity and expertise of cadres were also identified. These
outcomes were linked to increased awareness of the role and importance of monitoring maternal and
infant child health at Posyandu; provision of training for cadres; and provision of incentives payments.
In the past, health cadres here are less active. Usually, health cadres who came to Posyandu
Just 3 or 4 people, but because of the presence of Citizen Voice and Action that give
explanations about the health of mothers and children, and explanation continuously given
from the head of village to them, also add with health cadres’ incentive Rp. 150,000 per
month, now they are increasingly active. (Midwife, Kupang)
…the cadres were helped by the citizen voice and action program. In the past, the cadres did
not their tasks. Now, they have five table systems and perform it smoothly. (Head of Village,
Sikka)
Next, it is about the payment for the cadres. About the payment or incentive. It was the
government responsibility to pay the cadres but the payment was not frequent. Sometimes,
the cadres have to wait for a year to get paid. Sometimes, they did not get paid at all. This
problem occurred if the payment organized by regency. Now, it is settled. The payment is
good now. (Village Facilitator, Sikka)
Timeliness and accessibility of services were also reported.
Nowadays, the service is getting better. The counter for service is open at 09.00 a.m. in the
morning. In the past, the patients had to wait for several hours before the staff opened the
counter. Sometimes, the nurse and midwife were there, instead of opening the counter, they
were busy with they own business. Now, it is changed. The service is getting better. (Village
facilitator, Sikka)
In terms of service, we received many complaints from community such as punctuality. But,
we are becoming more punctual now. (Puskesmas Head)
The first change is about the implementation of duties. Before citizen voice and action, the
cadre did not participate actively and did not understand their duties. There were also some
midwives who did not stay in village maternity home (Polindes). (Village facilitator, Sikka)

Page | 101
In the past, the medical staff especially from the health community center rarely came to the
integrated health posts activities. After the citizen voice and action program, they come every
month. (Head of Village, Sikka)
There was also recognition in some interviews that there was still room for improvement.
"... As we saw in yesterday's standard monitoring ... they realized that this is still far from the
minimum standard of Puskesmas, so they have to fulfill it ... to support good service it must
be improved."
There was only one quote which noted a deterioration in services. It is not clear whether this was
intended to reflect a deterioration over the entire period of the project, some back-sliding after a
period of improvement, or simply an individual opinion.
…previously, Village midwife often to go to Posyandu. Now come rarely. Sometimes delayed
because there is a Posyandu schedule. … Our Head of Sub-village is less involved. Actually, he
should open Posyandu activities. Increased child nutrition is also less happening, there still
many children with poor nutrition. Parents' activity is also poor. (Mother, Sikka)
None of the other interviews for this village described deterioration in services. However, other
interviews for this village do suggest that some changes had been achieved quite recently, in 2017.
Health service staffing was the only area in which ongoing gaps were commonly reported.
Meanwhile, there is still lacks of medical assistance especially for analyst. It is necessary for
use to have a medical laboratory staff to perform laboratory analysis. (Head of Puskesmas)
However, one thing is still underrepresented at [name of] Clinic which is doctor, it was most
needed. I was expecting the doctor and have been submitted the proposal to the head of the
health department for about 7 times or 8 times, to ask for the doctor, whether by telephone,
by text, through private meeting. …If we had a doctor, it will be great and accreditation
would've been nice. (Head of Puskesmas)
…we still only have one midwife, she studying for her degree so she occasionally performs
service at community health center, if possible, we need one nurse who can helped us here,
but until now, this request has not been answered yet. (Village Facilitator, Kupung)
Referring to Permenkes No.75 (the regulation of Ministry of Health) about human resources,
we found out that we are still lacking of medical staffs. So we need to find a way to give
service under limited condition. I accept complaints. The medical staffs have to work hard
because they have to do lots of things. We do not have sufficient human resources. (Head of
Puskesmas)
It is not clear to what extent these gaps reflect shortages of qualified staff overall, shortages in
particular Districts, or inadequate funding to pay for qualified staff. In any event, it would appear that
these issues require addressing at regional or national levels. This evaluation focused primarily at local
and (to a lesser extent) District levels, and did not examine the relationships between that work and
regional or national level advocacy. It is, therefore, not possible to comment on the extent to which
higher level advocacy was undertaken and whether or how such advocacy may or may not have
influenced outcomes.

Page | 102
7.3.1.2 Changes in health service facilities
There were very frequent comments in relation to improvements in health service facilities. This
included significant investments in new buildings, upgrading buildings, and the purchase of
ambulances.
… relocating the community health center. The old building is still there but the rooms in that
community health center is inadequate. For that reason, we made a workforce collaborating
with the government, the health department, WFI and also village officials to relocate the
community health centers. (Puskesmas Head)
The most important thing for me is that there is a new Polindes building complete with tables
and chairs. It is important that if there is a Polindes building, the childbirth mother does not
need to deliver at (Polindes in the closest village). Our old Polindes building was small, narrow.
It's good if only 1 mother gave birth, but if there are 2 mother surely not enough space. The
midwife also cannot live there. So if there is an emergency case of the night, it cannot be
served by the midwife as she is not there. But now there is (new Polindes Building) with a
house for the midwife to live in. (Mother, TTU)
Another complaint was about a patient waiting room which has no roof. So, the patients find
it difficult to wait if it is raining or hot. In the Citizen Voice and Action meeting, local
government in the village decided to help. All six villages decided to donate Rp. 2.500.000 at
the end of 2016. The money from those four villages was used to build a waiting room at
general unit. The donation from two other villages was used to at the end of 2017 to build
maternal and neonatal unit and also immunization unit. (Puskesmas Head)
…. additional support facilities for mothers of infants and toddlers, including the large
demand such as the ambulance which we proposed during action plan with community health
centers, in order to serve all citizens, even in the most difficult area in [Village]. (Village
facilitator, Kupang)
… in my view, the most outstanding change is the expansion of the building of the integrated
health post. (Village Facilitator 2)
In 2017, there is a construction of Posyandu building in our sub-district. Previously, our
Posyandu building was poor and old. By 2017, we have been able to build a Posyandu that is
feasible, and we have used it (Cadre, Sikka)
We also upgraded water facilities in the integrated health posts by making water container.
(Head of Village, Sikka)
Improving health facilities was sometimes directly described as improving access. This was in part
because Posyandu services had previously conducted, in some villages, in people’s houses.
I think the construction of Posyandu building is important because if the Posyandu activities
still conducted in the house of the citizens we are difficult to access …because many people
and the chair is not enough. And also sometimes our activities disturbed by the personal
activities of the owner of the house. And often Posyandu activities are postponed because
the host is out. So by build the new Posyandu building, what we are longing for is fulfilled.
(Cadre)
Page | 103
…for the Posyandu activities we still use the citizen's houses so we feel uncomfortable during
the Posyandu activities because maybe our activities disturbed the host (Mother, Kupang)
All (changes) are important. But I have to choose one. I choose toilet construction. Because
all this time if we suddenly want to go to toilet, we had to look (at the neighbour), or to the
head of village (house). We were uncomfortable because it's private property. … Yes at that
time, we put the criteria of a good Posyandu must have a toilets, so we gave very bad score
for this. Yesterday we heard from the village head and we are relieved as our proposal finally
has been answered. … (Mother, TTU)
Improvements in staffing and facilities provided an additional benefit to Puskesmas, and thus to the
Department of Health itself. Puskesmas are required to undergo a process of accreditation.
Accreditation requires that standards are met, but also requires evidence of community consultation
and participation.
…the assessment makes health department provides standard service. This is also useful for
the accreditation of community health service (Puskesmas). Our purpose is to deliver standard
process. This allows us to make a good planning because we can refer to previous assessment
such as Citizen Voice and Action project. (Head of District)
7.3.2 Changes by citizens
The two graphs below show the breakdown of changes reported in relation to service users across the
project as a whole. The first demonstrates that knowledge about the availability of services was the
most commonly identified type of knowledge or awareness. This supports findings from the
Household Survey reported in Chapter 5.
The second graph shows that increased use of services was the most commonly reported change in
citizen behaviour. That was, however, closely followed by participation, which likely reflects
participation in CVA activities.
59, 48%
30, 24%
35, 28%
All changes in relation to knowledge and attitudes of service users, all
districts 2018
Knowledge of serviceavailability
Understanding ofrights
Understanding ofservice standards
Page | 104
All categories of respondents – midwives, Village Heads, cadres and mothers – reported increased use
of health services. A couple also reported increased use of services by fathers.
Infant/toddler’s mother now are more diligent. In the past, mother who came to weigh their
babies/toddlers in maternal and child health center was about 70 or 80% but now it is
increased to 95%. …100% is because no birth at home, they regularly come to Pustu (health
center), health facilities and health centers to check their pregnancy. There is no longer give
birth in the village. (Midwife, Kupang)
The men also participate. They drop off their babies and go back home. (Village Facilitator,
(Sikka)
Increased participation, for example in CVA activities, is discussed under mechanisms of change,
below.
7.3.3 Higher level outcomes
In addition to the specific changes described above, stories were also coded against a set of higher-
level outcomes. Access to services and quality of services were repeated at this level, because they
represent the key intended outcomes for the project. In addition, improvements to maternal health,
child health, child development, empowerment, stronger communities and improved futures for
communities could be identified at this level.
As might be expected on the basis of results already reported, access to services, improvements to
quality of services and empowerment and participation accounted for the majority of outcomes (63%
of all higher-level outcomes reported). Direct improvements to child health (12%) and maternal health
(10%) accounted for almost another quarter of higher level outcomes.
69, 38%
32, 18%22, 12%
58, 32%
All changes in relation to citizen participation, all districts 2018
Use of services
Capacity to engage
Willingness to engage
Participation
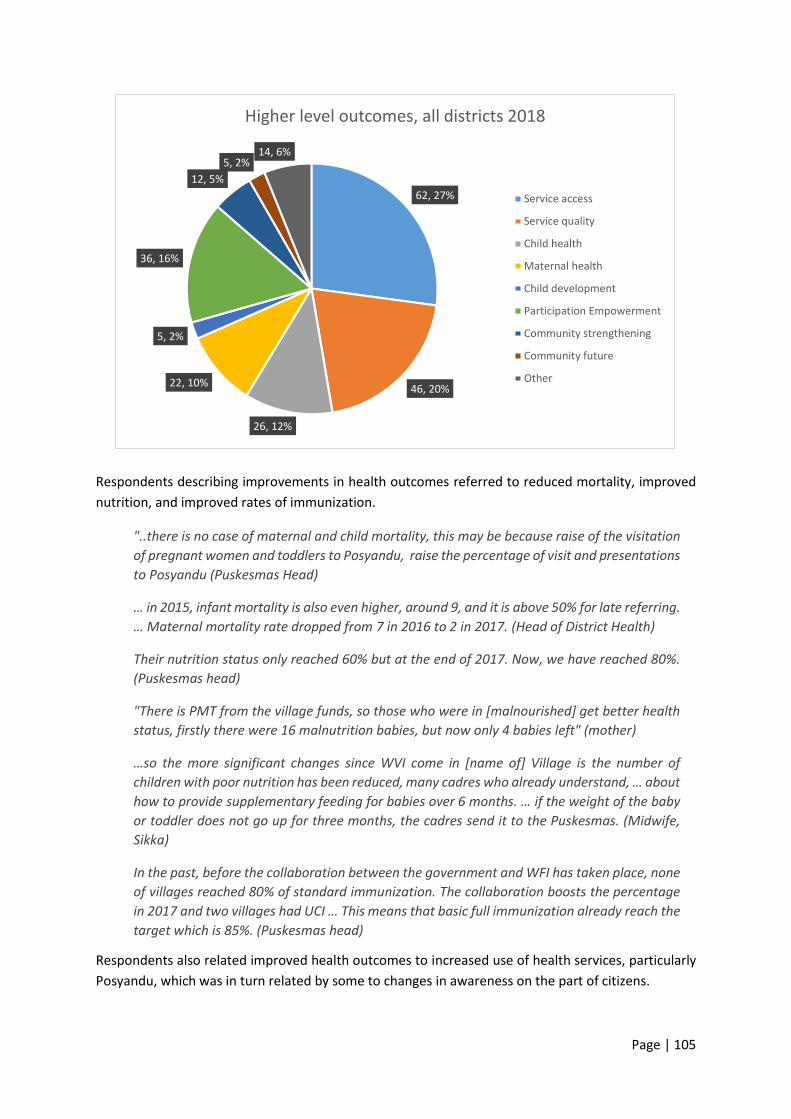
Page | 105
Respondents describing improvements in health outcomes referred to reduced mortality, improved
nutrition, and improved rates of immunization.
"..there is no case of maternal and child mortality, this may be because raise of the visitation
of pregnant women and toddlers to Posyandu, raise the percentage of visit and presentations
to Posyandu (Puskesmas Head)
… in 2015, infant mortality is also even higher, around 9, and it is above 50% for late referring.
… Maternal mortality rate dropped from 7 in 2016 to 2 in 2017. (Head of District Health)
Their nutrition status only reached 60% but at the end of 2017. Now, we have reached 80%.
(Puskesmas head)
"There is PMT from the village funds, so those who were in [malnourished] get better health
status, firstly there were 16 malnutrition babies, but now only 4 babies left" (mother)
…so the more significant changes since WVI come in [name of] Village is the number of
children with poor nutrition has been reduced, many cadres who already understand, … about
how to provide supplementary feeding for babies over 6 months. … if the weight of the baby
or toddler does not go up for three months, the cadres send it to the Puskesmas. (Midwife,
Sikka)
In the past, before the collaboration between the government and WFI has taken place, none
of villages reached 80% of standard immunization. The collaboration boosts the percentage
in 2017 and two villages had UCI … This means that basic full immunization already reach the
target which is 85%. (Puskesmas head)
Respondents also related improved health outcomes to increased use of health services, particularly
Posyandu, which was in turn related by some to changes in awareness on the part of citizens.
62, 27%
46, 20%
26, 12%
22, 10%
5, 2%
36, 16%
12, 5%
5, 2%14, 6%
Higher level outcomes, all districts 2018
Service access
Service quality
Child health
Maternal health
Child development
Participation Empowerment
Community strengthening
Community future
Other
Page | 106
I choose high participation in the Posyandu as the most important because the impact is big,
especially for the health of the baby. That's why I choose it, because it's more important things
of all. If the child is healthy mothers and fathers are also healthy, but if the child is not healthy,
automatically, mothers and fathers every night will have no sleep and not be healthy.
(Puskesmas Head 2)
However, the most important one is the visit of pregnant mother to Posyandu and Pustu.
Pregnant women's awareness to visit neighbourhood health center, Pustu and health centers
is increasing. (Midwife 1)
Giving birth at health facilities (usually Puskesmas, but sometimes Polindes) was the other very
commonly mentioned use of health services, because it reduces the risk to mothers and babies.
If I think the most important change is the delivery in health facility. Yes because it involves
human life, because the childbirth at home is very dangerous or risky. (Cadre, TTU)
The most important change is pregnant women are also now aware that childbirth at home
is at risk because there is no equipment, so have to give birth at the Puskesmas … and
midwives also accompany so safe so. (Cadre, TTU)
They finally understand that to get a safe and healthy childbirth, they must go to the
community health centre. The annual childbirth [at health centres] per year was only 43%.
Since the collaboration between the government and WFI has taken place, the childbirth
percentage in 2017 rose and reached a peak at 70%. These childbirths were assisted by
professional medical staff. (Puskesmas head)
The most important change is all Pregnant Women check routine pregnancy and childbirth at
the Health facility. Because if they not check regularly it could cause death to mother and
child (Midwife, TTU)
All quotes in relation to giving birth at health facilities were from TTU. It is not clear whether this
reflects a difference in health outcomes across the Districts, a difference in emphasis for services, or
a difference in selection of quotations by CVA staff.
7.3.4 Change over time
The next chart examines how most significant changes changed over the three years of the project. It
reveals two distinct patterns, one relating to services and the other to citizens. Note that this chart
provides the number of times changes were identified, rather than the proportion of changes that fall
in particular categories.
The first four categories below – policy, budget, services and government responsiveness – all relate
to changes on the part of those responsible for services and service provision. For those categories,
there is a clear peak of changes in the middle year of the program. Policy and budget changes were
rarely mentioned in the first year: this is to be expected as it takes some time for decisions to be made
and reflected in action. There was a marked jump for these two categories in the second year, which
stabilised for budget or dropped back a little for policy in the third year. It is possible that this reflects
necessary policy changes already having been made in many villages during the second year and there
being less need for policy change in the third year.
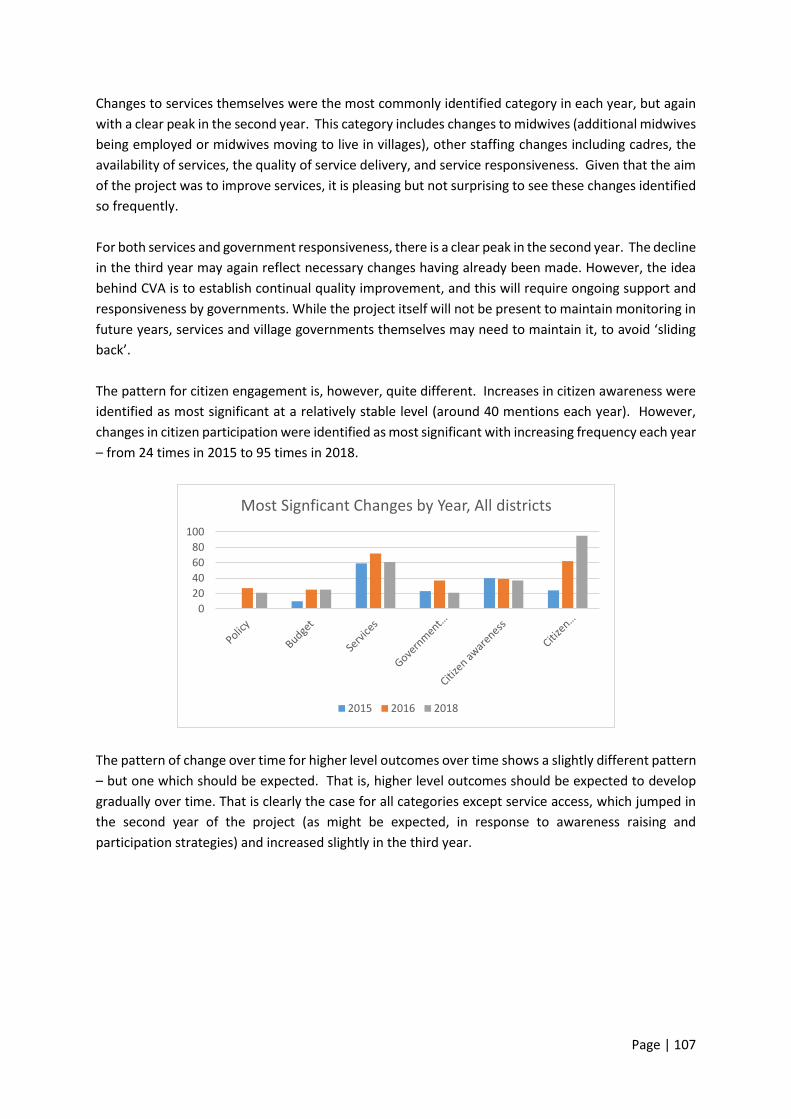
Page | 107
Changes to services themselves were the most commonly identified category in each year, but again
with a clear peak in the second year. This category includes changes to midwives (additional midwives
being employed or midwives moving to live in villages), other staffing changes including cadres, the
availability of services, the quality of service delivery, and service responsiveness. Given that the aim
of the project was to improve services, it is pleasing but not surprising to see these changes identified
so frequently.
For both services and government responsiveness, there is a clear peak in the second year. The decline
in the third year may again reflect necessary changes having already been made. However, the idea
behind CVA is to establish continual quality improvement, and this will require ongoing support and
responsiveness by governments. While the project itself will not be present to maintain monitoring in
future years, services and village governments themselves may need to maintain it, to avoid ‘sliding
back’.
The pattern for citizen engagement is, however, quite different. Increases in citizen awareness were
identified as most significant at a relatively stable level (around 40 mentions each year). However,
changes in citizen participation were identified as most significant with increasing frequency each year
– from 24 times in 2015 to 95 times in 2018.
The pattern of change over time for higher level outcomes over time shows a slightly different pattern
– but one which should be expected. That is, higher level outcomes should be expected to develop
gradually over time. That is clearly the case for all categories except service access, which jumped in
the second year of the project (as might be expected, in response to awareness raising and
participation strategies) and increased slightly in the third year.
0
20
40
60
80
100
Most Signficant Changes by Year, All districts
2015 2016 2018
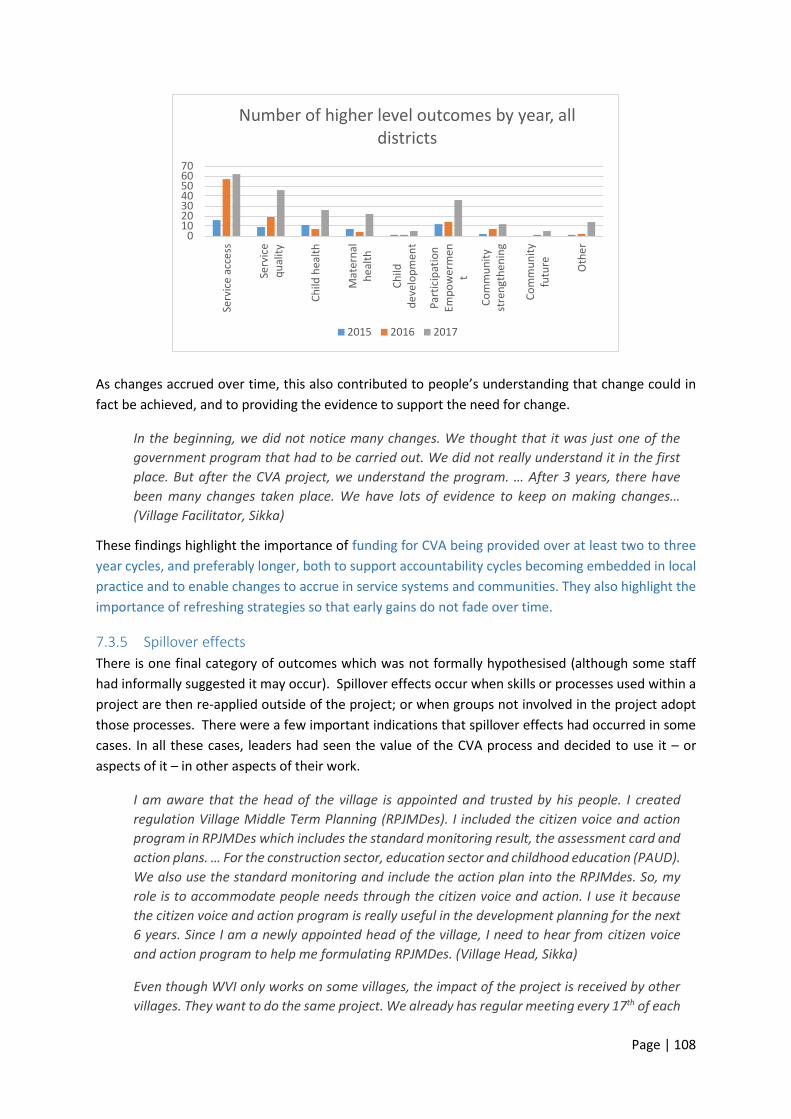
Page | 108
As changes accrued over time, this also contributed to people’s understanding that change could in
fact be achieved, and to providing the evidence to support the need for change.
In the beginning, we did not notice many changes. We thought that it was just one of the
government program that had to be carried out. We did not really understand it in the first
place. But after the CVA project, we understand the program. … After 3 years, there have
been many changes taken place. We have lots of evidence to keep on making changes…
(Village Facilitator, Sikka)
These findings highlight the importance of funding for CVA being provided over at least two to three
year cycles, and preferably longer, both to support accountability cycles becoming embedded in local
practice and to enable changes to accrue in service systems and communities. They also highlight the
importance of refreshing strategies so that early gains do not fade over time.
7.3.5 Spillover effects
There is one final category of outcomes which was not formally hypothesised (although some staff
had informally suggested it may occur). Spillover effects occur when skills or processes used within a
project are then re-applied outside of the project; or when groups not involved in the project adopt
those processes. There were a few important indications that spillover effects had occurred in some
cases. In all these cases, leaders had seen the value of the CVA process and decided to use it – or
aspects of it – in other aspects of their work.
I am aware that the head of the village is appointed and trusted by his people. I created
regulation Village Middle Term Planning (RPJMDes). I included the citizen voice and action
program in RPJMDes which includes the standard monitoring result, the assessment card and
action plans. … For the construction sector, education sector and childhood education (PAUD).
We also use the standard monitoring and include the action plan into the RPJMdes. So, my
role is to accommodate people needs through the citizen voice and action. I use it because
the citizen voice and action program is really useful in the development planning for the next
6 years. Since I am a newly appointed head of the village, I need to hear from citizen voice
and action program to help me formulating RPJMDes. (Village Head, Sikka)
Even though WVI only works on some villages, the impact of the project is received by other
villages. They want to do the same project. We already has regular meeting every 17th of each
010203040506070
Serv
ice
acce
ss
Serv
ice
qu
alit
y
Ch
ild h
ealt
h
Mat
ern
alh
eal
th
Ch
ildd
eve
lop
men
t
Par
tici
pat
ion
Emp
ow
erm
ent
Co
mm
un
ity
stre
ngt
he
nin
g
Co
mm
un
ity
futu
re Oth
er
Number of higher level outcomes by year, all districts
2015 2016 2017
Page | 109
month to coordinate and to conduct mini-workshop for cross-sectors. Other villages also join
us and we share information to them. Even, some villages use village fund to recruit midwives,
nurses, nutritionists who hold bachelor degree. This will support the development in health
sector at the villages. (Head of Puskesmas, TTU)
In many villages, billboards were used to provide information about action plans and budgets for
maternal and child health. Some villages extended the use of billboards demonstrating budgets and
expenditure to other budget areas.
…and we also make APBDes billboards so that people can know the amount of funds available
and what activities which is already implemented. (Village Secretary, Kupang)
Since citizen voice and action program taken place, people urged the village government to
be more transparent especially in budgeting. In the past, the information or project board is
not available. … Since citizen voice and action program taken place, the government has
changed. Now, we know their activities. Every activity done by the government must be
published to people. They want to get informed all the time. For example, information about
road construction is published using billboard. … If we are transparent, people will trust us
and actively involve in the development process. (Village Head, Sikka)
Village facilitators, who were all local residents, were often also active in other areas of community
life. One facilitator described adopting some aspects of CVA in aspects of his work in local church
activities:
Before CVA came, I did it already. But, I learned more from CVA on teach people to speak their
mind. For example, the people would only listen to us talking. After, CVA program, I changed
that pattern. We discussed things and I listened to them a lot. They brainstormed their own
the problems. (Village facilitator, Sikka)
The same man also described extending the principles to other aspects of village governance.
For example, in the village meeting, the people proposed to build a sidewalk. At that time, I
asked them to analyse what is the most important thing needed by our village. Some of them
suggested to build an integrated health post and some suggested building other things. At
the end, we decided to build the road because it was in really bad condition. They said to the
head of the village that if the road is not fixed, accident will happen frequently. If we do not
fix this road, the road will be swept away in the rainy season. People who live down the road
also will receive lots of garbage if we do not fix the road. No one wants his or her yard full of
garbage. They speak up about it. So, the CVA has really helped the people to participate and
speak their mind up. (Village facilitator, Sikka)
Clearly, spillover effects of this kind are both an outcome in their own right, and have the potential to
contribute to sustainability of outcomes. We return to sustainability in Section 7.5, below.
7.4 Mechanisms of change
As noted earlier in this report, there were eight main mechanisms hypothesised at the
commencement of the project. These were:
• Improving knowledge and awareness of policies and budgets affecting MNCHN. Improved understanding of rights and entitlements and improved understanding of shortfalls in
Page | 110
resources and services motivates citizens to advocate for gaps to be filled and quality to be improve
• Increasing citizen engagement in monitoring and advocacy for MNCHN services, which both increases government awareness of service delivery issues and community concerns in relation to services, and increases pressure for accountability by service providers and governments
• Building mutual accountability between service providers, governments and communities, by building agreements about actions to be taken to improve the quality and use of services and by all parties holding each other to account
• Activating leadership to implement the actions necessary to improve the quantity and quality of services at the sub-district and local level
▪ Aligning political interests & community priorities, such that elected leaders are aware that communities are monitoring their efforts to improve MNCHN in line with community priorities and will hold them to account;
• Aligning levels of the health system, so that local, sub-district and district health services are working towards common goals for MNCHN
• Building skills and capacities of service providers as identified in action plans and of community members in planning, monitoring and advocacy
• Refreshing the cycle annually through annual processes of monitoring and updating action plans, building sustainability of accountability and service improvement processes.
The coding sheet for MSC stories identified these eight mechanisms and allowed for additional, not
previously hypothesised mechanisms to be identified.
In quantitative coding, improved knowledge and awareness, citizen engagement and activating
leadership were the three most commonly identified mechanisms3. Together, they accounted for
almost three quarters of mechanisms identified.
This does not necessarily mean that they are in fact the mechanisms that account for most change, or
even that they are the ‘real’ causal forces at work. Rather, it means that they are the explanations for
change that most respondents identified.
3 Coincidentally, these are also the three mechanisms identified at the start of the project as being the primary focus for this evaluation.

Page | 111
The second graph below reflects the patterns of identification of these mechanisms over the three
‘active’ years of the project. ‘Improved knowledge and awareness’ was the most commonly identified
mechanism every year, and perhaps surprisingly, jumped again in the third year.
This contrasts with the finding demonstrated in graph … above (change in outcomes over time), that
citizen awareness was identified as a significant outcome at a slightly lower level in 2018 than in
previous years. There are two possible explanations for the increase in identification as a mechanism
in 2018. The first is that the mechanism indicator reflects increased knowledge and awareness for all
stakeholders – that is, including service providers, health service management, and village
governments – rather than residents alone, as the outcome indicator counted. The second is that it
reflects a change in the function that knowledge and awareness have played. That is, in earlier years
of the project, increased knowledge and awareness was identified primarily as an outcome. By the
final year of the project, that knowledge and awareness was seen as contributing to other outcomes,
such as citizen participation and service change.
74, 37%
46, 23%
14, 7%
27, 14%
9, 5%
11, 6%
9, 5% 5, 2% 2, 1%
Mechanisms of change, all districts 2018
Improved knowledge/awareness
Citizen engagement
Mutual accountability
Activating leadership
Aligning levels of health system
Aligning political & communityinterests
Building skills & capacities

Page | 112
The qualitative data about mechanisms discussed below provides greater understanding of what the
evidence for those mechanisms actually was, and how those mechanisms operated in practice. It also
allows for refinement of the theory of change, discussed in more detail in the next chapter.
7.4.1 Increasing knowledge and awareness
The original hypothesis proposed that it was increasing awareness of the gap between standards and
services actually provided that motivated citizens to advocate for improved standards. In fact, there
was evidence of multiple kinds of knowledge and awareness being increased, for multiple
stakeholders.
This included increasing health services managers’ awareness of needs and priorities.
To be honest, WVI helps us to focus on important things. For example, the Citizen Voice and
Action program helped use to prepare facilities needed by patients. When patients came to
get medical treatment and they need laboratory facilities, we are ready. When patients are
suffered from dengue fever, we could assess the reasons, such as limited facilities. Sometimes
the medical assistance of some cases does not exist so that people would not come to the
community health centre. (Puskesmas head)
I cannot deny it is because our cooperation, our partnership so that it became knowledge to
me. (Puskesmas Head 2)
It also included increasing Village official’s awareness of the importance of maternal and child health,
and the roles that they could play in supporting it.
In the beginning, before there is Citizen Voice and Action program activities to increase
knowledge and capacity, government officials also sometimes indifferent to MCH services,
because we think the MCH and cadres of Posyandu is part of the health department …, but
the Citizen Voice and Action program was very helpful in assisting us to understand about
MCH services (Village secretary 1)
We in the village still have less insight. So that through Citizen Voice and Action, there are
cadres and village facilitators who attend the training and come to me and we see together
01020304050607080
Imp
rove
dkn
ow
led
ge/
awar
ene
ss
Cit
ize
nen
gage
men
t
Mu
tual
acco
un
tab
ility
Act
ivat
ing
lead
ersh
ip
Alig
nin
g le
vels
of
he
alth
sys
tem
Alig
nin
g p
olit
ical
& c
om
mu
nit
yin
tere
sts
Bu
ildin
g sk
ills
&ca
pac
itie
s
Ref
resh
ing
the
cycl
e an
nu
ally
Oth
er
Number of mechanisms of change by year, all districts
2015 2016 2017

Page | 113
and then strongly agree because through this Citizen Voice and Action affect the health of
mother and child in our village for the better. (Village Head, TTU)
We were awakened, we were inspired to put budget on things that we could not see. For
example we only remembered for clean water in the community but did not remember to plan
clean water in public places such as Polindes, to replace the broken weigh stations in
Posyandu, build a Posyandu. (Village Head, TTU)
"Like the civic education in my own village, also outside the village I also participated. I joined
the activities of the Citizen Voice and Action outside my village and also the interface meetings
in the subdistricts and districts. It is solely for me to learn" (Village Head, Sikka)
There was certainly evidence of increased awareness for citizens:
I think this is all come from the citizen voice and action that people can know the SPM (service
standard) of the Puskesmas, Posyandu, Pustu, and Polindes. We, Puskesmas, have never talk
to the public about our SPM (service standard). People do not know about it. But now they
already know. And our proposal also considering community proposal. Before, we make
proposal without seeing the community (interest). (Puskesmas Head)
…they understand more about SPM, Minimum health service standards. They've already
understood! Previously they did not understand how Posyandu should be like. But thanks to
the citizen voice and action, they become more understand. (Village Head, Sikka)
Previously we did not really know about the service standard in posyandu. There was training
but we less understand about it. What we learn is how we claim our rights. (Cadre, TTU)
However, it was evident in the data from the first year that citizens were aware of their dissatisfactions
with services well before the program commenced. That is, ‘increased awareness’ is less likely to be
that ‘knowledge of standards results in awareness of gaps’ (the implication being that knowledge of
standards comes first, followed by a recognition that services do not meet those standards, which
then creates a motivation to speak up). Rather, citizens were already aware of their dissatisfaction
with services, and then learned that policies said that they were entitled to more.
Further, increased awareness was not solely about standards or gaps in services. More commonly, for
mothers, awareness related to the value of using health services.
... we were involved in the WVI meeting at the initial meeting, interface meeting and score
cards and interface meeting and dialog in district level, so then I also became more active to
come to Posyandu. In WVI activities, we are explained to visit to Posyandu monthly to take
care children and make use the health facilities in the village so we have begin to realize to
use health facilities, primarily to come to Posyandu. (Mother)
…parents [of] infant toddlers are increasingly aware because there are meetings conducted
by midwives and village government ... (Mother, Kupang)
The second thing is that because the impact of the Citizen Voice and Action program that lead
the people to open their mind. So, they understand the importance and benefit of using
medical facilities. (Puskesmas head)

Page | 114
7.4.2 The courage to speak
There were frequent comments that attributed advocacy, not to increased awareness of gaps, but to
increases in the confidence to speak up. This was reported directly by mothers in all Districts.
...the people are increasingly dare to speak up related to the existing and current health
services in [name of] village. (Mother, Kupang)
What I got from during this activity is courage. The courage to speak is due there is a law that
protects ..., so the CVA is good to make us to be brave to give opinion in village level because
currently the village government don't pay attention seriously. (Mother, Kupang)
Yes, because through Citizen Voice and Action, the community who have been hiding their
complaints can speak up. So far people do not dare to speak up. (Mother, Sikka)
People who never speak, speak. Through the Citizen Voice and Action they dare to speak up
about the things that need to be improved. At outside they are also brave. (Mother, TTU)
It is the obligation of society because we are also in command. After I am become active, the
courage began to appear, I think ‘if I do not talk we are also have loss’. (Mother, TTU)
Increased confidence was also reported by cadres and village facilitators, whose own confidence
increased.
Yeah, because with this Citizen Voice and Action of this citizen, the people can channel what
they keep in mind during this time. Before, the community did not dare to speak. (Cadre,
Sikka)
Because of Citizen Voice and Action, I can gain knowledge and have courage to speak to other
people... (Cadre, Sikka)
What I got from during this activity is courage. The courage to speak is due [to] there is a law
that protects ..., so the CVA is good to make us to be brave to give opinion in village level
because currently the village government don't pay attention seriously. (Cadre, Kupang)
"We are grateful that with WVI, especially with this CVA program, we are trained and by this
training we can be brave. Dare to speak up together. Previously, we alone and we were
scared, but with the presence of this WVI and CVA program we encouraged to perform, both
in the sub district and district we also can lift and speak what is not in accordance with our
rights ..... Recently I went to the Puskesmas and saw that there was an ambulance. And it
turns out that is the answer of the action plan, because as long as WVI here we can raise the
issue to the district level and struggle for realize it in the district level with government, health
department and DPR (House of representative). (Cadre, Kupang)
Yeah, like every stage of the Citizen Voice and Action that I following.... I feel like there's
something of value learning for me ... it's makes me able to speak in front of mothers. I used
to be afraid of appearing in front of the crowd. But through a program that I always
participate. I can speak though it might be wrong or incorrect but I've dared to perform.
(Village facilitator, TTU)
Page | 115
Midwives, village facilitators and Village Heads also commented on this increased confidence by
others, suggesting that it was widespread. One Village Head also attributed ‘remarkable ideas’ to
citizen input.
These days, the people are braver to speak their mind. If they were not satisfied, they would
say so. (Village Facilitator 3)
Each time they are present in the activities and It make them dare to express what are need
to be improved. ............ They value it is good. So there is input and there are changes.
(Midwife, TTU)
In the past, sir, as far as I knew, the people in this … village only speak out in the back but
when there is Citizens Voice and Action they are now speak at Musdus (sub-village planning
meeting) that the village (government) have to answer our request. The public has the
courage to speak out in public. " (Village facilitator, TTU)
Since citizen voice and action program took place, people have been more critical. In the past,
they did not use to speak up their needs. After citizen voice and action program from the WVI,
they know how to express their opinions. Sometimes, the village government fail to think of
any program, the villagers will come with such remarkable ideas. (Village Head, Sikka)
It is not possible to tell from the data available whether increased awareness acted as an initial trigger,
with increased confidence resulting from ‘quick wins’ (as one reviewer of this report suggested may
be the case). Both increased awareness and increased confidence were evident in data from the first
year of data collection.
Multiple interviews in that first year suggested within the same sentence that both ‘courage’ and
awareness had increased; and courage was described as relating both to the processes used and to
the presence of World Vision. Notably, the processes used did not simply increase awareness of official
standards (which deal with very objective measures, such as staffing and equipment levels), but also
organised groups of citizens to determine their own assessment criteria, and to speak collectively
about performance against those criteria. This might be conceptualised as ‘the courage that flows
from collective action’, or in more formal terms, as initial stages in shifts in power relations. As that
first report noted:
There is evidence that increased awareness of standards (that is, rights and entitlements
under policies and budgets) has contributed to increased community advocacy. From the
quotes that were translated, however, it would appear that the underlying mechanism is not
so much about awareness of discrepancies increasing motivation to speak up. Rather, it
appears that the underlying mechanism relates more to increasing the confidence to speak
up. Understanding the standards may contribute to confidence. However, confidence also
appears to relate to the presence of an external and independent party, in this case World
Vision and to the processes used. (First interim evaluation report, 2016, pp 101-102)
7.4.2.1 Feedback as input
There was a concurrent process in which service providers and managers learned to treat feedback as
constructive input, rather than personal criticism. This meant that those receiving feedback were less
likely to become angry – a previous response which had deterred and dampened citizen voice.

Page | 116
Citizens are becoming more courageous to talk about work of the midwives or cadres. And
they are not angry or offended. All receive as good input to change. (Village Facilitator, TTU)
Sometimes when they come to Pustu and I was not there, they do not get angry anymore,
because there is a schedule, made after the completion of Pustu standard monitoring
activities. …. So, if there is anything wrong, and the public protests, we were unable to
forwarded it to the Head of community health center, because he will get angry. But with
these activities, we been helped, because it can provide a room for us to discuss and find
solutions regarding maternal and child health in the village. (Midwife, Kupang)
The second, which I did not feel but I often hear from friends, they (Puskesmas staff) feared
being criticized. But with the Citizens Voice and Action, they are more open, accepting
criticism and changing. So there is no more bad feeling between the staff and the community,
because the Puskesmas staff can be more accepting of criticism. They (Puskesmas staff) do
not feel put on trial but feel that critics are given to make changes. (Head of Puskesmas)
A Village Head commented on a similar process for Village processes, noting that the collective
planning process made it easier to receive feedback, and to consider the concerns of multiple
stakeholders.
We give citizens space to convey whatever they want. Good or not please deliver, because we
did not compose (Planning) ourselves but in team form. And the representation of the team
were public figures. The budgeting in posyandu and polindes is also asked to the cadre or
midwife needs (Village Head, TTU)
Importantly, the processes used and the focus on women and children also contributed to women’s
empowerment.
… the head of this village is great, so he gathered all proposals from mothers as well as for
other programs. … previously they only hear men voice, but after they getting used to the
approach taken in the Citizen Voice and Action program, from there they do not afraid to
express things that are good or not good, they also had the courage to speak in the public
forum in the village, hamlet and village musrenbang. (Village facilitator 1).
Previously, we find less of discussion if you want to build Posyandu or other else, because the
mother and cadres are not very active, but now mothers are very active, they already know
and aware of their rights and their role in the village to contribute ideas and opinions in village
meetings, they are active in proposals for Posyandu, incentive and so on. That's important, so
we invite them to discuss together before start to do everything in the village… because before
they just hear only the fathers who talk, but after getting started with CVA approach, we are
courage to convey things that are good or not good, then followed up in the community forum
like Village Forums (musdus and musrenbang). (Village Head)
The project’s GPSA Annual Technical Report for 2018 (p17) reported on the proportions of men and
women involved in the range of project activities. There were more women than men involved in
training for village facilitators, civic education, initial meetings in villages, standards monitoring, score
card monitoring, interface meetings and dialogue with local parliaments and district governments. It
is highly likely that this has contributed to empowerment outcomes for women.

Page | 117
7.4.3 Many providers of information
Likely related to increased knowledge and awareness was a change in the nature of information
provision. In the early stages of the project, CVA staff, village facilitators and the resources that they
produced were the primary sources of new information. Increased health promotion activity was
reported by health services in the second year, although it is not clear to what extent this was a result
of the project and to what extent it was a result of government priorities for maternal and infant
health. Over the course of the project, however, a wider range of people became involved in provision
of information at the local level. By the third year, this included cadres (many of whom had been
retrained in the course of the project), village officials, and parents themselves.
We engage to provide explanation, because we've been able to understand the MCH. We also
have an ultimatum from the head of the village, minimum once a month we should visit
Posyandu. So, if there [are] people who do not know about the importance of MCH and
citizens of the newly married or newly pregnant, we as government officials involved also to
monitor and provide information about the importance of this MCH and to come to health
facilities. So those who have never heard of or participated in Citizen Voice and Action
meeting in the village office, they could hear and know about it when they come to Posyandu
(Village Secretary, Kupang)
…for example, if there is an invitation mail (regarding health activities), village mothers often
forwarded it to health cadres and midwives to join the activities. In addition, if there are
village meetings, village mothers often remind the community about the importance of
maternal and child health. (Midwife, Kupang)
I am active (at Posyandu), if there is an invitation. I come. What the village head said to us,
we follow. We are also happy because the village heard our suggestion. If we are involved we
can tell the activities that we follow to our neighbor. And I can tell also to our neighbor the
proposal that has been answered. (Mother, TTU)
Yes, there was special and cross-sector meetings with WVI at the sub-district office to
emphasize the role and responsibilities of all health workers and cadres and shamans to
deliver information to the community (Puskesmas Head)
7.4.4 Increasing community engagement
There was substantial comment on the engagement of citizens. In fact, in some cases, participation
was described as the most significant change resulting from the project.
I think the most important thing is that in making something/ decision must be through
consensus among the community. During the governance of the previous head of the village,
there is no such thing deliberation … But now, if someone want to do something to Posyandu
and especially for the health sector generally, all stakeholders have to sit together in
Musrembang, discuss how much it cost, when is the time of implementation, and everything
should be clear, we can monitor and can provide suggestion if necessary. So, it's the important
one, we invite them to sit together and agree on the decision before we make it happen.
(Village facilitator, Kupang)
…there is involvement of citizens, because they actively follow whenever there are meetings
on scorecards, they assess and they gave their voice, and there are many involved from the
fathers of the baby/ toddler, mothers of baby/toddler, government officials were also present,
Page | 118
religious figures also, and they all are engaged to give their voice through scorecards
meetings. (Village facilitator, Kupang)
Greater levels of engagement enabled improved communication, which contributed to improved
outcomes.
The most important one is how WVI facilitates a meeting among the community health
center, citizens and cross-sectors. In the past, we worked alone. Sometimes, when we shared
our problems to the village, they thought that us (the community health center) just looked
for money. In the Citizen Voice and Action meeting, we share the information about our
financial condition, limitations and challenges. So, the village knows our condition and
understands why we need a donation from the village. Everything is getting better because
the village knows our condition. So, when we ask for support from the village, the people
already know the reasons. (Head of Puskesmas).
Importantly, this was related to providing the opportunity to speak.
In the past, people have limited opportunity to express their ideas. They were not given
the space to speak about their needs. The citizen voice and action program encouraged
people to express their opinions. … Before the citizen voices and action... community
seems to have less room to speak. They are given little opportunity to voice their interests.
(Village Head, Sikka)
Equally importantly, citizen engagement was identified as bringing citizens into the service system –
changing their role from clients of services to being active agents within the system.
The citizens are not objects, but subjects or the development agents. They need to get
involved. This makes Citizen Voice and Action project brilliant. … At least, the citizens know
how important is their role as a subject. Not only as the service users but also service owners
in health community center (Puskesmas). So far, we have not received complaints from [three
locations]. This means that all problems have been solved in the health community centers
(Puskesmas). This is because the community get involved, educated and supported in a long
period of time. So, they become a part of us. (Head of District)
The most important is the participation of citizens to criticize and to support us. They care
about their health now. In the past, they just criticized us without taking care of their health.
Now, they belong to us and also put an effort to find solutions. We also do not hesitate to
share our problems with them. (Head of Puskesmas 3)
Another respondent noted the importance of government responsiveness in maintaining citizen
participation.
First, the involvement of the people. The people did not want to attend the meeting and they
are not punctual. People are disappointed with the government so they do not want to
participate. They think that the government is not serious. For example, if they propose
activities, the government never gives good responses. This makes them bored and
disappointed. (Village facilitator, Sikka)
7.4.5 Advocacy
Citizen participation at local level is the most direct expression of advocacy in CVA, and has just been
demonstrated, this project was no exception. There was also some evidence of advocacy at District

Page | 119
and higher levels. Senior leaders reported that presentation of needs and issues at the political level
was treated as more credible, and received a better response, when it was the voice of citizens that
was directly represented.
The most amazing things were the presentation to the House of Representatives (DPR),
seminar and workshop. This was a very good advocacy action because local government
especially health department and the House of Representatives (DPR) found out that our
human resources are still limited. So, we need support from legislative and executive’s
members of the house. (Head of District Health)
But with the CVA program they are brought to the district to meet the Head of District and
the DPR (house of representative) and all relevant departments (SKPD), so they (the health
department office) believe that what is proposed is so real and needed. (Head of District
Health)
It was also suggested that the complaints should not only be discussed by the leaders but also
the community. It is a good lesson for us. The head of the village, the head of the district and
cross sectors will response faster when they hear direct complaints from the community. So
they do not only hear those complaints from the community health center. (Head of
Puskesmas 3)
It is not clear whether this representation had direct outcomes: as noted elsewhere in this report, the
Indonesian government had already provided significant increases in funding for maternal and infant
health and, independently, for village governments, prior to the establishment of this program.
However, the quotes at least suggest that senior personnel believed that the advocacy was more likely
to be effective when it was driven from, and representative of, community level.
7.4.6 Activating leadership
The intent of advocacy is to change decision-making, most commonly by leaders; and ‘activating
leadership’ was therefore expected to be a significant mechanism. The most commonly identified
leaders whose decisions or activities were changed were not, as might be expected, leaders in health
services. Rather, it was village leadership, and in particular, the Heads of Villages. These are elected
positions and so it is possible that the more directly political mechanism of ‘aligning political and
community interests’ was also at play.
The Citizen Voice and Action makes the head of the village more responsive. The head of the
village makes a lot of changes in Citizen Voice and Action. …. In the past, the head of the
village did not really care about broken equipment at the village maternity home. In the
meeting which was attended by the head of the village, citizens as the service users and the
community health center; the head of the village listened to the complaints about village
maternity home and gave response to make changes. (Head of Puskesmas 3)
In terms of the (village) government. They are now active, not like the previously. Both village
officials and BPD (Village representatives board). (Cadre)
Then In the past, the head of the village never got involved in the health care service activities.
After the citizen voice and action program, they open and visit the integrated health posts
every month. Now, the scaling activities will be officially opened by the head of the sub-
village. (Head of Village, Sikka)
Page | 120
The new village head and BPD (village representative body) in 2017 have regulalrly visited
Posyandu. The former village government rarely visited Posyandu. When the new village
government come to Posyandu, they hear directly from the cadres. (Village facilitator, Sikka)
There were, however, some respondents who identified increased responsiveness from the Health
Department.
The health department also gets more responsive. They used to respond to us. But, their
response are more details now. Before, we have not had opportunity to discuss in details
about our problems with the health department. We also did not discuss with the house of
the representative (DPR). Now, they know our problems and think of the solutions together.
So, we have a good collaboration now. (Head of Puskesmas)
They wanted changes. They need new approach in delivering health care service. So, people
brought this issue up in the sub-village meeting. But their voices, were not listened. Finally,
the CVA program from WVI helped us to get a new integrated health post. (Village Head,
Sikka)
Another of the ways that leadership became more active related to internal accountability systems. It
is important to note here that in the Indonesian system, Village Heads are responsible for monitoring
and signing off on midwives’ work at village level.
I think this program is really helpful. It helps me to organize my work schedule and manage
the human resource. I place the right men on the right position, so it makes it easier for me
to monitor their work. (Puskesmas Head)
The village head gave a warning in accordance with the report of the community. In the end,
after the warning, the midwife became more and more diligent come to Posyandu. (Village
Facilitator, Sikka)
This is fact would appear to be one of the two main pathways for accountability through which CVA
works. One is the intended route of citizen voice and transparent governance – that is, ‘direct’
accountability of services and local governments to communities. The other is by triggering internal
accountability systems. That is, when leaders are aware that their work and services are being
externally monitored, they are more likely to use their internal monitoring and supervision systems to
hold staff accountable for their actions.
However, leadership did not just relate to formal leadership, but also to informal or community
leaders. The result was improved coordination and organisation:
Then for the community itself were some important components I mentioned earlier such as
the village government, BPD (village Representative Board), health cadres, youth leaders,
community leaders who are often involved in the activities of citizens voice and action. Then
they understand and what we see is the ease of the officers in the village or in the health
center to organize all the components in order to maximize service (Head of District Health)
7.4.7 Aligning political and community interests
This mechanism is the most overtly political of the eight originally proposed. It is specifically intended
to relate to elected leaders, with the assumption that they will seek re-election, and thus are more
likely to be responsive to community pressure if they know that they are being monitored.
Page | 121
…this Citizen Voice and Action program has affected citizens to actively voice their result of
monitoring government work in the village, so we must be careful because we are always
being watched (Village Secretary 1)
The Citizen Voice and Actions is affecting the community. So that every time there is a meeting
in the village, the community always proposes things that can make the village government
have a fear or have a sense of concern or responsibility to the community. Very influential is
this action. (Village Head, TTU)
This is concerning the interests of the community ... so as the head of the village I must always
think how to work to overcome critical problems on the health issues. When there is demand
or hope from community, then I will provide good response. (Village Head, Sikka)
One Village Head was overtly optimistic that responding to community concerns as manifested
through CVA would contribute to his re-election.
I have been in this position for almost one year. So far, people ideas that were voiced through
the citizen voice and action program have been implemented one by one. That is why I am
optimistic that I will get elected again in the next period. (Village Head, Sikka)
This Village Head was so impressed with the value of CVA that he wrote CVA-style processes into
village regulations for other issue areas (see Spillover effects, Section 7.3.5, above).
7.4.8 Capacity building for health services
There was comparatively little comment on capacity building, other than citizens learning to speak up.
One Head of District suggested that the health system had learned a lot.
I think this project is really helpful especially for Health Department of [District name]. We
have learnt many things from Citizen Voice and Action project. This is a learning process for
us to measure our capacity and to do self-assessment. Besides, we also review our human
resources, service to community and standard facilities. So, we learn to asses ourselves. We
also involve other sectors outside health sector. We also empower community. So, we do
collaboration between medical staff, local government and community. We want citizens to
have a sense of belonging to health facilities and service. So, the community as the service
users can criticize us. The health personnel also learn to work according to standard and to
assess their own performance. (Head of District)
Several village facilitators commented on their own increase in knowledge and skills.
There are lots of benefits. I was a bit doubtful at the beginning. After getting involved in
training and participating in all activities, I learned many things. I learned many lessons such
as becoming braver to speak and more confidence. I also know the best timing for expressing
opinions and suggestions. I know the differences of all village official activities. I gain more
knowledge [on] issues as well. (Village facilitator 3)
Yeah, like every stage of the Citizen Voice and Action that I following.... I feel like there's
something of value learning for me ... (Village Facilitator, TTU)
I'm glad because I got new knowledge from WVI. I'm also proud for the change within myself.
I don't like to talk much, especially to facilitate any meeting. But when I became village
facilitator, I have more courage to talk in front of many people. Maybe that's why I'm also

Page | 122
appointed by the village government to facilitate other activities in the village. (Village
Facilitator, Sikka)
One respondent suggested that there was still room for improvement in cadres’ skills:
Posyandu cadres who have not maximized the five-table system, because it is still not
proficient to calculate the nutritional adequacy rate and nutritional status of children, still
assisted by the midwife and health personnel from the health center / Puskesmas.
7.4.9 Incentives for increasing use of health services.
Increased use of health services was an oft-reported outcome of the project. In the initial program
theory, it had been hypothesised that this would result from increased awareness of the value of
health services, increased quality of health services, and access to health insurance.
Another mechanism which had not been anticipated at commencement of the program was the
introduction of formal incentives for parent use of services. In a number of villages, regulations were
introduced requiring pregnant women and mothers of infants to attend Posyandu and to give birth in
health facilities. In TTU, where there is a culture of village level fines for unwanted behaviours, fines
or other penalties were relatively commonly introduced for failure to abide by the regulations.
However, fines were also reported in one village in Sikka.
The percentage of attendance in the integrated health posts must reach 85%. The progress
was quite significant. in every village meeting, …we ask the villagers to make the rule so we
can solve the problems and achieve the target. (Puskesmas head)
Every month we give counselling to pregnant women to routinely check in Polindes and
delivery must be at Puskesmas. From the government there is also a regulation so that
pregnant women do not childbirth at home. There is a Village Regulation that the government
has socialized to us with a fine of Rp. 500,000 if child birth at home and at own risk (Cadre,
TTU)
I continue to accompany (the pregnant woman) and is time of delivery, we take her to
Puskesmas. And after we also do home visit. We provide continuous counselling to keep them
aware for checking pregnancy and also giving birth at the Puskesmas. From the government
there is also a village regulation: so if the childbirth is at home means a fine of Rp. 1,000,000.
It because … village is also a Village Alert. … Now there is also a Village regulation: if giving
birth at home means a fine, late check also fine (Cadre, TTU)
If the infant mother's does not come in then they will be fined. So the infant mother keep
present every month. Unless there is a report from the infant mother's mother. (Village Head,
Sikka)
As the village government is now getting tighter. Aid also increased a lot come to the villages
so we should invite those who do not come to the Polindes or Posyandu, (if not,) aid for the
village children cannot be distributed. Pregnant women who not come to check in Polindes
means cannot get support. (Mother, TTU)
One possible interpretation of the introduction of regulations relates to the idea of ‘mutual
accountability’ (see also section 7.4.11 below). If governments and service systems are accountable
for the provision of appropriate services, citizens are accountable for their appropriate use. One
Page | 123
respondent pointed out that regulations did not just affect parents, but bound a range of parties to
their respective responsibilities.
…Village regulations on health. Prior to Citizen Voice and Action, we have not a Perdes (village
regulation) on health. The Perdes binds … mothers [of children under 5], cadres, midwives,
and village government ... Binds for activities to run smoothly…When the village regulation
on health did not exist yet, the village government rarely attend the Posyandu, and the village
midwife did not stay in the Polindes... but after the existence of it (village regulation) then all
goes well.... They (citizen) saw that the health is important so that we have to make a bind,
Perdes on Health. (Village facilitator, TTU)
In other Districts, increased use of services was attributed at least in part to active monitoring and
follow-up of pregnant women.
If there is a pregnant woman who do not come to Posyandu, and we asked for a monthly
progress report on maternal and newborn infants from cadres, so we know exactly if there is
any mother who does not come to check her pregnancy, so the first time she does not come
to check, then the next month I will visit her, along with cadres. (Village secretary, Kupang)
Regarding the maternal and neonatal health, people will report the condition of pregnant
women in their village. They will let the midwife knows and they will ask her to examine the
women. So, they informed the midwife about the condition of pregnant women in their
neighbourhood (Village facilitator, Sikka)
Mothers are diligent to take toddlers to Posyandu. This is because there is extension
counselling from cadres, midwives and affirmations from village for the important of bringing
children to Posyandu. (Mother, Kupang)
A policy change on the part of health services, no longer seeking to identify the father of children of
single mothers, was also described by some respondents.
There is another strategy. Who was pregnant by accident. We will not find out about her
husband. Because before we have found out. This is so that pregnant women feel comfortable
to come check. This is to save the foetus and mother. (Puskesmas Head)
A number of respondents suggested other factors which they believed contributed to health service
use. These included:
• improved relationships between citizens and health service providers, with health workers residing in the villages contributing to those improved relationships:
The presence of health personnel permanently in the village is also one factor because it
makes people in the village believe in health workers. Regular communication with the
community and live in with the community builds trust in the community. If health workers
are often absent, it is hard to be trusted by people. (Puskesmas Head)
• a sense of responsibility to use services which have been improved in response to their own input:
Through Citizen Voice and Action program, we had opportunity to go hear from the people
themselves, especially pregnant women that rate the service and assesses a service of
Posyandu cadres, also supported by midwife. If they deliver it and that all proposal on
Page | 124
standard of service are met, then they themselves must have embarrassed too if you do not
come to health centers. (Puskesmas Head 2)
• greater willingness to use services which have adequate facilities and equipment:
Now all the Posyandu own scales equipment so that cadres and mothers and children are
diligent to go to Posyandu because the equipment is adequate. (Village secretary, Kupang)
• greater awareness of the risks of home birth:
The second, through our counselling, through the video that show the dangers of giving birth
at home that could causes infection, bleeding. It makes them afraid to give birth at home."
(Midwife, TTU)
7.4.10 Transparency
The processes involved in CVA are by their nature collective. Standards assessments are undertaken
by health staff teams in staff meetings. Score cards assessments are undertaken in village meetings.
Action plans are developed in multi-stakeholder meetings involving villagers, village governments and
health services. The collective nature of processes increases transparency in relation to concerns and
solutions, which is a necessary condition for accountability. Improvements in transparency were
applauded by a number of stakeholders.
Furthermore, there is transparency, openness of the village officials, village governments and
also midwives, and Posyandu cadres in this village. All the decision to do something, was
taken together, no longer own by own, all deliberations together. (Village facilitator, Kupang)
"What I think to the most important is transparency in making decisions, all discussed in
village forums (musdus and musdes) and generating decisions together. (Village Head)
The village has been transparent, open-minded and accountable. …So the community knows
what has been done in the village. (Village Facilitator, Sikka)
One leader suggested that transparency could trigger embarrassment which prompted change:
The reason was because we already met and discussed about the limitation; did self-
assessment and invited health department, citizens and cross-sectors to participate. So, each
of us is aware of our weaknesses and we try to solve them. This is because of citizen voice and
action. We also get embarrassed if people say that our service is bad. It is even worse if the
health department knows about our bad performance. So, we must change. (Head of
Puskesmas).
I am more open because I also have to be transparent, I must also get an assessment from
the public. Not necessarily good for me, also good for society. (Village head, TTU)
7.4.11 Mutual accountability
The original hypothesis suggested that by forming and monitoring joint action plans, stakeholders
would develop a sense of mutual accountability. Interview respondents did not describe the process
in quite those terms. However, there were multiple examples of stakeholder groups acting to hold
others accountable. In several cases, this related to changed behaviour on the part of village officials.
Page | 125
At the end of the month, the midwife and nurse make a report and it has to be signed by the
head of the village. When they ask him to sign, the head of the village ask about the project
and the content of the report. I think this is a good thing that the head of the village monitor
the performance of the midwife. (Village facilitator, Sikka)
Cadres and midwives too. If someone need his sign on some letter of recommendation, but
he/she is not active in the health and Posyandu activities, He [Village Head] does not give the
recommendation. (Village Facilitator, Kupang)
If the midwives are away or off without any prior notice, the patient will let the local
government knows. So the community immediately reports to the local government in order
to get better service. The patients will complain if the midwives are unavailable. (Village
facilitator, Sikka)
Reports to local government then translated through to the health system.
They [the community] get involved in pushing the staff to meet the standard. We do not work
alone. We have a new source of power from the citizen that supports us to meet the standard.
(Head of District)
There were also occasional examples of villages directly holding others to account.
For instance, if the cadres do not want to go to Posyandu, the village official will have been
there every month, so that we do not need to report monthly to know which cadres who did
not go to Posyandu, because we are directly supervise. Even when we do not come to
Posyandu, they will protest us, and ask why we do not come to Posyandu? We watched each
other works and it was a good cooperation in my opinion. (Village Secretary, Kupang)
The citizen, especially infant-toddler mothers, always propose to cadres, to explain them
about how the five-table system should be done. The first table is for what, the second and so
on. Citizen see this five-table system is not done properly and confused the mothers. Therefore
they conveyed in every meeting at Posyandu or in the sub-village. …I see the cadres begin to
aware. They actually have known about the five-table service. They have also participated in
training and meeting of cadres. Only they may have no intention to make it properly. After
the villagers continue talking about it, they finally make it. That's because they are aware of
their duties because of the voice and the citizens' suggestions. (Village facilitator, Sikka)
There was also one example where villagers’ own actions to ensure accountability caused some
difficulties. Discussing the construction of a new health centre, a village facilitator reported:
In [name of] village, the people were really exited in planning and executing the construction.
After finishing the construction, the people were really critical especially towards the head of
the village. This is because the people were involved at the planning stage but not in the
construction stage. The head of the village only involved the village staffs instead of the
people during the construction. … Sometimes, when the elders or village figures came to the
location of the construction to monitor, the village official did not look happy. They felt that
they were watched and intimidated. …the elders initiated to watch the construction. For
example, Mr. … (one of the local figures) often visited the location to monitor the construction
and check the quality of the cement mixtures made by the stonemason. (Village facilitator)

Page | 126
There were other examples in earlier stages of the project where those whose work was monitored
were unhappy with the process. In health services in particular, this appears to have abated over time,
as feedback was accepted more as a tool for improvement than a personal criticism.
The second one is about the attitude to criticism. I often hear from my friends that the medical
staffs at community health center were afraid to get criticized. Since citizen voice and action,
they have opened themselves to receive critics. They are also willing to change. The
relationship between community and the staffs at community health center is getting
stronger and harmonious because the staffs open to criticism. They do not think that we want
to judge them. They are aware that our critics will lead to transformation. (Head of
Puskesmas)
It seems feasible that in sectors outside of health which were not directly engaged in the formal quality
improvement process that CVA represents, this positive response to feedback would not have been
encouraged, and resentment would result. If this is the case, it highlights the importance of active
engagement of leaders in encouraging positive responses to feedback as contributing to the success
of CVA processes.
However, rather than accountability per se, many respondents talked in terms of improved
relationships which supported cooperation and collaboration.
Relation with village government is better now. Before Citizen Voice and Action activities, the
village government never came to Posyandu, but now they regularly come to Posyandu every
month. We also provide report for village government so they can monitor malnutrition cases
in the village and provide support for supplementary feeding. (Midwife, Sikka)
There are further examples of this in the next section.
7.4.12 Relationships, coordination and collaboration
A number of respondents – particularly decision-makers – commented on the way that CVA had
assisted them in developing new relationships, which in turn facilitated cooperation and collaboration
in resolving problems. Improved relationships were noted at multiple levels of the system, and
between multiple stakeholders.
Relationships and communication flows are an important aspect of system dynamics, and it is
therefore likely that improved relationships have contributed to more effective operations of the
system as a whole.
In some cases, collaboration or partnerships was described as the most significant outcome of the
project. (In realist terms, this demonstrates how outcomes at one level – here, increased collaboration
– also operates as a mechanism for a later change – here, usually improved services.) This view was
most frequently expressed by senior decision-makers.
The most important one is partnership because it has to be maintained. The support from
legislative and executive members should be maintained because health department cannot
work alone. I think this is the most difficult one. Coordination and partnership are really
important. So far, we have been performed really well because we have good partnerships. It
is not easy to maintain it. (Head of District)
Page | 127
The communication among the health community center, citizen, the health department and
the house of representative is also more effective. The house of representative never meets
us and responds to citizens’ needs. It is rare for them to discuss about health issues, listen to
complaints from community and evaluate program. I have been working for three years in
the health community centers. ... For those three years of experience, this is the first time for
me to meet the house of the representatives which was facilitated by WVI. Usually, this kind
of meeting is not designed to discuss about health issues but about building roads and other
facilities. … I think it is a good thing because the house of representatives understands our
problems. (Head of Puskesmas)
In citizens voice and action, all parties get involved such as the house of the representative
(DPR), the health department, the local midwives and the head of the village. (Head of
Puskesmas.)
Senior decision-makers on both sides also noted the importance of improved relationships and
communication between Village-level decision-makers and Health decision-makers.
Right now, they [health services] are getting more open to convey the obstacles they face to
us. And we also communicate it well to them. So far our relationship with them has improved.
(Village Head, Sikka)
... with the village government now if they want to prepare a proposal (Health proposal) they
consult with us, they used to … prepare it by themselves, as they want. But now, they can
accommodate requests from the Puskesmas to the village. For example, previously there was
no supplementary feeding for U5. Now village prepare it from the village funds. Likewise, the
procurement of medical equipment and health apprentices is using the village funds. (Head
of Puskesmas)
Importantly, some respondents noted the value of World Vision’s facilitation and capacity building in
those processes.
The first time I came here, I did not know the head of the village and did not know to approach
them. But, WVI helps to get closer to them and easier to interact with the head of the village.
I find it easier to ask for help because WVI becomes the medium of communication. (Head of
Puskesmas)
WVI plays an important role to facilitate the meeting among us. Third party facilitates the
meeting. If we conduct the meeting, the village will think that it is just for our own interest.
When third party facilitates the meeting, not only our interest will be discussed but also theirs.
Improvements were also identified between stakeholders within villages.
And specially the cooperation with the midwife, sometimes if the midwife is having difficulty
in MCH services, she will take to the village office to discuss it together in the meeting, we
always find a solution together, because now, MCH was very important. (Head of Village,
Kupang)
What I see, the government's relationship with the community is getting better. For example,
labour to build a waiting house, taken from the village itself. (the relation of) Service providers
with government are also good. The relationship between service providers and the
community is very good. For example, a Mother midwife still provide service to the residents
Page | 128
in need at night. Government relations with service providers have also been good. What the
service providers need, the village authorities quickly respond. For example, the midwife asks
for a Polindes ceiling repair then the village government responds by fixing it. People also play
a role by working to fix the Polindes ceiling. (Village facilitator, TTU)
The more we care about the children, indirectly the relationship between citizen and us is
getting closer. Parents also feel that the government also has a attention or concern for their
children. It because the children are the backbone of the future. (Village Head, TTU)
One Head of Puskesmas described in some detail the various relationships and contributions involved
in establishing a new community health centre:
I … attended the meeting with the government, WFI and the health department. The keynote
speaker at that meeting mentioned the rule of health ministry. When I get home, I read that
rule. Then, I made the letter to relocate. I talked to the head of community centre. Then, I
talked to the head of health department. Finally, he approves our relocation proposal. The
next process, I was asked to provide a new location that match the specification. In order to
locate the land, I approached the elders in [name of] village. I received good response from
them. So, they located an area for building new the community health centre. After locating
the land, the next process is to release the ownership of the land. One man that was really
helpful in this process was the head of the regency because most of the land was owned by
him. … After finishing the paperwork for the releasing the land ownership, I gave it to the
health department. Then, the health department made a proposal to the health department
in order to get funds from the ministry of health. (Puskesmas Head)
Another described how established relationships and capacity building enabled villagers to liaise
directly with the Head of Puskesmas to support their village in establishing a village task force to
support the local Posyandu.
In the past, the head of the village and health personnel used to ignore us. WVI project helps
us to plan, implement, monitor and evaluate our program. Although we still find it difficult to
involve community in the project, they want to participate if we inform them beforehand. The
community and the head the village want to get informed in advance about their roles. In
[name of] village, even though they have a new head of the village, the villagers have been
familiar with citizen voice and action. So, they do not hesitate to express their opinions. Even,
they come to me ask me to explain to them about a task force in an integrated health post
(Posyandu) and how they set the task force? So, we have conducted three meetings. The head
of the village also understands it. (Head of Puskesmas)
Another noted that coordinated work was more efficient:
[Do you work differently?] Yes, I accept a suggestion from people. If I want to work fast, I have
to coordinate with the village government and the citizens. (Head of Puskesmas)
This same respondent noted that coordination extended beyond those directly involved in CVA.
Everything running good not merely because of the work the clinic, but with the help of the
cadres and because of the cooperation with NGOs such as WVI, ACF, and UNICEF. All these
agencies with their own way come and work together to encourage people to live healthy. …
The village head support by provide incentives of cadres, build Posyandu, he recruited health
Page | 129
personnel both midwives and nurses with recommendations from health centers to help the
people there. So, this is all thanks to the cooperation of multi sector. (Puskesmas Head 2)
7.4.13 Refresh the cycle annually
The final mechanism originally hypothesised was that repeating the monitoring and planning process
annually would build an ongoing cycle of quality improvement and contribute to sustainability of
outcomes.
There were relatively few comments about this in interviews.
So it is regularly repeated every year at village maternity home and village health post in
order to remind the midwives and nurses to perform their job well. (Village facilitator, Sikka)
There are benefits (of repeating the cycle). We always see the shortage that are still in the
health field, that has not been implemented or maybe that should be urgent but we were not
able see it. So that with the repetition we can find this shortage and we can accommodate it.
…Repetitive is also very good to remind us on the importance of the problem, so that we can
make input in each of our planning. (Village facilitator, TTU)
7.5 Sustainability
Given that this was the final year of the project, both project activities and the evaluation incorporated
some focus on the future, and on sustainability. Sustainability may be interpreted either as
sustainability of processes designed to contribute to service quality improvement and accountability,
or sustainability of gains made in service quality.
Responses to questions about sustainability fell into three clear groups. The first group were pursuing
strategies to incorporate CVA-style processes in their own work (although future input from World
Vision would be welcome).
We are going to replicate the model of Citizen Voice and Action in other districts that have
not done it yet. We will also follow up Citizen Voice and Action projects that have been
implemented in some districts. [Q: Have you planned to do this replication?] We are going to
allocate some money from Health Operational Fund (BOK) to conduct a workshop with 160
head of the villages. We are going to inform our program including Citizen Voice and Action.
We are going to also share experience from the head of [name of] village and other villages
that already succeeded to improve maternal and neonatal health care service in their villages.
We already proposed it in this year budget planning. We have regular meeting with districts
leaders but we have not had regular meetings with village leaders. In this workshop, we are
going to have an exhibition of some program such as Malaria Program and Citizen Voice and
Action Project. .... This also will expand the horizon of heads of the village in managing village
funds. The head of the districts often say that the villages leaders are often get confused in
spending village funds that up to one billion rupiahs. The head of the districts should also
facilitate meetings with the head of the village so we can give them suggestions on how to
make a planning especially for health program. (District Head)
…we would like to adopt the procedure initiated by WFI. Then, we will try to develop it. The
Citizen Voice and Action has shown good results. In the future, we will develop it by adding
some creative activities. We also hope that there are some inputs or suggestions from WFI
Page | 130
even though their program has ended. We wish that WFI will never forget us here … In the
future, we would like to follow up the Citizen Voice and Action program. We will figure the
problems that have not been solved by WVI by cooperating with village officials and the
government at the regency level. (Puskesmas head)
…citizens’ education is really important. We will keep on doing it, even though WVI will leave
us soon. The head of the villages that already joined this project and WVI will help us to do
the project because they have an experience. This makes it easier to get facilitated, especially
in village and sub-village meetings. In the district level, will find it easier to map the problems
because we already know which problems need to be solved by the village and which to be
handled by the district and so on. (Head of Puskesmas)
At least one leader suggested that budgets may be a barrier to maintaining this action.
I will try to implement this project in the village for once a year. The budget must be big
because we do not only invite community leaders but also the villagers to discuss health
problems in the village. Actually, we already proposed the budget to do this project last year.
But, it was not accepted. So, we cancelled it. We were supposed to conduct meetings at the
village and to discuss the complaints. (Puskesmas Head).
There were also Village Officials who planned to maintain some level of activity.
This program is great… Even WVI is not with us anymore, we will still make citizen voice and
action meeting because we already have the village facilitators and we have understood the
process. (Head of Village, Sikka)
However, this was more commonly not in terms of citizen participation in monitoring and advocacy,
but in relation to use of health services.
When WVI is over, we will keep on doing socialization or motivation to the community to keep
our mother and child health better because WVI has told us and we will follow and keep going
as usual (Village Head, TTU)
One of the things we will do to keep the involvement of citizens in order to continue, we should
make regulation such as Village health regulation that bond all sector, because Village health
regulation is strongly tied the government official, and health workers. Secondly, it is very
important, when there is a village meeting, we will have to inform about the importance of
using the services of MCH, because healthy people can be educated, healthy people can work,
and we will inspire citizens to be aware and in the absence of WVI we will continue, because
this is very important. (Village Secretary, Kupang)
I will make a village regulation on health so that people will remain involved in health. So
when WVI has left, we will continue. This rule will bind the community. We will follow up what
WVI has made because health is very important to us all. (Village Head, TTU)
Some village facilitators saw that they could continue to contribute to citizen participation activities,
but noted that they would require other stakeholders to continue to play their roles.
We still act as village facilitator, and the village is also ready to support for the existence of
these process. The budget is not so big, however it is enough to make the Posyandu runs well,
for the cadres to work well and also the midwife could do a great job. I think the village is very

Page | 131
ready to fund it… as long as we maintain our cooperation with the local village government,
the health center, with health department, it certainly can work well. If there is no
cooperation, it certainly cannot be done. (Village Facilitator, Kupang)
I think the CVA method can be used in the future. This program could be our guideline. The
village facilitator can involve not only in this program but also other village activities and
village meetings. We are would happy to participate if are invited. We can make things better.
(Village facilitator, Sikka)
WVI will soon be leaving from our village, but the existing programs will still be implemented.
Because WVI has put the foundation. its means that even though it is no longer here. We will
work like WVI is still here. Because we as Village facilitators, we will keep working. (Village
Facilitator, TTU)
In my opinion, all stages of citizen action should be maintained. I do the education of the
residents at Posyandu or during RT (community) meetings. For standard monitoring do in
Posyandu or if the village government can accept, yes, we can do in the Village office. Score
card can be done at Posyandu because all of the U5 mothers can attend and they can judge
our new proposals to the village government. If there is already a proposal from Posyandu,
when I make a monthly report to the village head then I will convey so it can be answered.
(Village facilitator, TTU)
A couple of other facilitators did not assume ongoing participation by other stakeholders, but foresaw
a personal role.
Well sir, in the future if WVI is no longer serve our village, I will keep motivating mothers,
pregnant woman, and the community, the Posyandu target, to keep their health and use the
health services in the village... because what has been left by WVI is very useful for us and
our children. (Village Facilitator, TTU)
Even though the project will end soon, I will keep on working voluntarily to support midwives,
nurses and patients. As a village facilitator, I will keep supporting them. (Village facilitator,
Sikka)
The second main group saw it as World Vision’s responsibility to maintain the processes, or at least
believed that ongoing support was necessary for progress to be maintained. This group ranged from
a Head of Puskesmas to a mother.
From my perspective, WVI is the one that supposed to make this. If I may say, it cannot all
simultaneously withdraw from the program, if possible, we still need help to continue,
because we are also about to have accreditation, and the matters was very need of inputs
from community so that in the future it can be better. Or at least there should be one team,
the team tackling maternal and child health matter, if I may. MCH response team should
include WVI team and all, but this team should be in place here in the village (Puskesmas
Head)
…we hope that WVI will visit [name of] village to monitor our project. Maybe WVI can visit as
every three months. We still have the mobile integrated health post (mobile posyandu), so we
hope that WVI can visit and control us every three months. (Midwife, Sikka)
Page | 132
From my perspective, it has been running smoothly because with the assistance of the WVI,
that helped us through GPSA program, although the program soon will come to an end. But
we as a society that is here, not all of us were able to overcome the barrier, in this case to
speak up the voices of society and we have not been able to walk on our own, therefore, one
day, we hope WVI with this cooperation, can still help us in our time of need. (Village
facilitator, Kupang)
We hope WVI still accompanies us. If it is us by ourselves who directly say it to the village
government, I am afraid that we are not dare to do so. We may not know how to do it. We
may feel awkward to do so. But with WVI, we become more relaxed. If we talk to the
government directly we are afraid too. So yah ... if WVI is not with us anymore, it will be
difficult for us to speak to government. (Mother, Sikka)
7.6 Contexts affecting change
Relatively little new information was collected about contextual factors that may have affected the
nature and extent of change. While data was extracted in in all three districts, it was only translated
into English in two Districts. Further, much of what was extracted described the situation before
outcomes had been achieved: in effect, it was the equivalent of retrospective baseline data, rather
than identifying factors that affect whether or how mechanisms operate. Other extractions provided
detail of processes used in implementation (for example, home visiting, ‘sweeping’ for pregnant
women who were not presenting to Posyandu, and so on).
As noted in Section 7.3.1.1 above, a number of respondents noted that there were still staffing
shortages, despite the gains made during the project. Another reported that even though a midwife
had been appointed for the village, there was only one, which in effect meant that she was on call 24
hours a day.
The midwife lives in Polindes and serving for 1 x 24 hours. (Cadre TTU)
A number of other respondents commented that services were now available after hours, and many
villages only have one midwife, suggesting that this was the situation for many staff. Having a single
staff person also creates difficulties if something affects that person’s availability.
Initially we had a village midwife, but in 2015 our village midwife had to continue her studies.
So there is no health service in our village. So we ask for a replacement midwife. (Village
facilitator, TTU).
In the long term, staffing shortages and being on call 24 hours a day may tend to undermine the gains
made during the project.
Senior decision-makers were more likely to identify broader contextual factors that may have
contributed to change. They identified the provision of funding by the national government (not as a
result of the project), without which much of what was achieved would have been impossible.
The second is the opportunity. They have funds. In the past not ... if we want to make this.
there must be a funds ... Central Government is good enough to provide funds that are freely
used in accordance with existing rules. (Puskesmas Head)
Page | 133
This is entirely consistent with the finding reported in World Vision International’s ‘Project Model’
document that says that CVA is most likely to be effective when “Governments have at least some
discretionary resources to contribute to service delivery.” (p6).
They were also more likely to identify that the CVA project was only one contributor to the changes
achieved. Health promotion by health staff, activities of other NGOs, and the ‘Village Alert’ and
‘Standby Village4’ program were all identified in various interviews. Village facilitators also sometimes
mentioned the contributions of other organisations.
Besides that there are other factors, such as…the availability of the health officer. This is
actually a supporting factor. … The next one is the institutional management. Besides WVI,
PNPM and GSC also strengthen management of integrated health post and other institutions
in the villages. (Head of Puskesmas)
A couple of respondents also identified that there had been improvements in roads over the period
of the project, which facilitated access to health services.
The first thing is the road and transportation access to the health community center is better
now. The patients also have National Health Insurance (BPJS) so they get free medical check
up. They just need to pay the transportation fee because it is not included in the BPJS. (Head
of Puskesmas)
Yes maybe the transportation factor. It used to access to our village is very difficult, now is
easy. (Village facilitator, Sikka)
Finally, the overall political and legislative context during the project was very supportive of
accountability initiatives (see the project’s GPSA Grantee Annual Technical Report, 2018, for a
summary of legislation and regulations that supported the project’s operations).
7.7 Summary
MSC stories have validated data collected through other means (standards data, score card data and
survey data) in relation to outcomes from the CVA project. The most commonly reported changes
related to services and citizen participation. For services, availability and quality of services were
most commonly reported, closely followed by improvements in relation to midwives (increased
employment of midwives, increased availability because more lived locally in villages, and improved
service provision). Changes in relation to policy, budgets, services and government responsiveness
were most commonly reported in the second year of the project. For citizens, the most commonly
reported changes were improved knowledge of health services and increased use of health services.
Citizen participation increased steadily over the course of the project. It remains to be seen whether
this will turn out to be project specific, or whether citizens will continue to participate after the
project has concluded.
Importantly, the stories have also provided evidence of progress towards some higher-level
outcomes, including reductions in maternal and infant mortality and improvements in infant
nutrition, which respondents attributed at least in part to the CVA project. Some spillover effects
4 Standby village was initiated by Ministry of Health in 2006. A standby village is defined as a village that has the readiness, resources, ability and willingness to prevent and overcome health problems, disasters and emergency health care independently.
Page | 134
were also reported, where health services, villages and at least one individual have adapted CVA
processes for use in other sectors.
The stories have also provided the main basis for refining understandings of how the CVA program
has contributed to change. Improving knowledge and awareness, citizen participation and activating
leadership were the most commonly identified mechanisms. More importantly, the stories have
provided data to refine understandings of the mechanisms. For example, there is evidence to
suggest that it is not so much awareness of gaps that motivates citizen engagement, but increased
confidence to speak up. Changes in confidence related partly to increased awareness but also were
also generated by the collective processes used in the project. There is sufficient data to refine each
of the mechanisms originally hypothesised: this is the subject of the next chapter.
There was relatively little information about how contexts affect the operation of these
mechanisms. Clearly, national provision of funding for maternal and child health, and (separately) for
village level planning and service provision was very significant. Contributions by a range of
stakeholders to positive outcomes were also identified. While much has been learned about
mechanisms of change through this evaluation, a focus on contexts and how they affect the
operation of those mechanisms may make an appropriate focus for future research or evaluation of
CVA.
Page | 135
8 Refining CVA Program Theory
8.1 Introduction
Realist evaluation begins with an initial rough program theory, and ends with refined program theory.
The intention is that improving understanding of how and why programs do and do not work enables
future iterations of the program to be tailored to new contexts, and/or to improve effectiveness.
Analysis of the data across this the four years of this evaluation has allowed two kinds of refinement
of the initial program theories:
▪ Refinements of seven of the eight original hypotheses, becoming much more specific about how they have in fact worked;
▪ Development of two overarching mechanisms, not originally hypothesised. These two overarching mechanisms are at a higher level of abstraction, and form a framework within which the more detailed hypotheses can be understood.
The two overarching mechanisms were identified by the lead evaluator and presented to the final
project data analysis workshop for discussion. There was significant agreement with the mechanisms,
and some refinement of their details. After the workshop, diagrams of the two were returned to the
Project Coordinator and MEL Coordinator for further refinement. The two overarching mechanisms
were:
1. CVA works by changing power relations between citizens, service providers and local/district decision-makers
2. CVA works by systems-strengthening.
This project was undertaken in three districts and sixty villages, and has involved several groups of
stakeholders. However, in the larger scheme of things, it is a single project, implemented by one
organisation in one country, with a single project leadership team at the helm. This has precluded
analysis of many features of context that are likely to be relevant. Analysis of context and context-
mechanism interactions have also been constrained by the types of data available. Nonetheless, we
believe that the theory refinement undertaken here does represent an advance on previous theorising
of CVA, and can therefore be useful to Wahana Visi and the wider World Vision international
collaboration.
Below, we present definitions of social accountability first, because they frame discussions of how
social accountability works; then refinements of the initial hypotheses first, and then the two new
overarching mechanisms. In the third section below, the refined initial hypotheses are aligned against
the two overarching mechanisms.
8.2 Social accountability
Citizen Voice and Action is a type of community accountability program, where community
accountability is a sub-set of social accountability initiatives. The Governance and Social Development
Resource Centre notes that the definition of accountability is ‘widely contested’ but provides the
following definition taken from Menocal and Sharma (2008):

Page | 136
Accountability is a process for holding individual actors or organisations to account for their
actions. Accountability requires transparency, answerability, and enforceability between
decision makers and citizens (Combaz and Mcloughlin, 2014)
While not explicit in this definition, accountability is, in its essence, relational: it refers to the nature
of responsibilities and the relationships that ensure that responsibilities are implemented
appropriately.
In this project, accountability was pursued in relation to women’s and young children’s health. This
can be framed, in rights terms, as relating to the right to health – although the project itself aimed
only to improve the quality of services provided, on the assumption that better services would
contribute to better health.
The Committee on Economic, Social and Cultural Rights (CESCR), Office of the High Commissioner for
Human Rights (OHCHR) released General Comment No. 14, which notes that the right to health is
intrinsically linked to many other human rights including those listed in the quote below.
The right to health is closely related to and dependent upon the realization of other human
rights, as contained in the International Bill of Rights, including the rights to food, housing,
work, education, human dignity, life, non-discrimination, equality, the prohibition against
torture, privacy, access to information, and the freedoms of association, assembly and
movement. These and other rights and freedoms address integral components of the right to
health. (OHCHR, 2000)
The Committee also noted that the right to health and the right to be healthy are not the same thing.
The following was provided to add clarification to what the right to health entails.
The right to health is not to be understood as a right to be healthy. The right to health contains
both freedoms and entitlements. The freedoms include the right to control one’s health and
body, including sexual and reproductive freedom, and the right to be free from interference,
such as the right to be free from torture, non-consensual medical treatment and
experimentation. By contrast, the entitlements include the right to a system of health
protection which provides equality of opportunity for people to enjoy the highest attainable
level of health. (OHCHR, 2000)
The final point here clearly relates to the objectives of this program, that is, that the entitlement to
quality health services which would contribute to health protection. In doing so, it drew on some
other rights described above, including the right to information and freedom of assembly.
The right to health services has been summarised in terms of four standards: availability, acceptability,
accessibility and quality. The work in this project focused primarily on quality and accessibility. The
relationships between accessibility and availability, on the one hand, and between quality and
acceptability on the other, may usefully form a basis for some future investigation.
8.3 Refining the original hypotheses
In the initial rough theory of change, eight mechanisms were hypothesised as contributing to
improving the quality of health services. It was further hypothesised that all eight were necessary. No
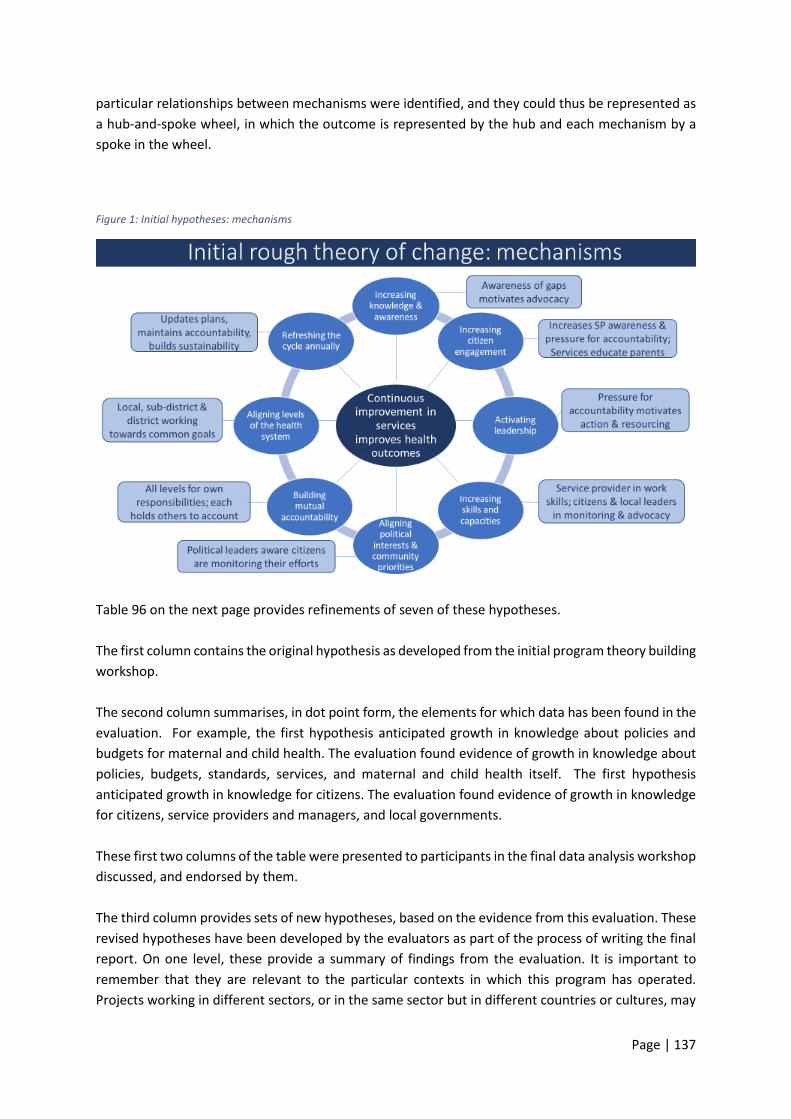
Page | 137
particular relationships between mechanisms were identified, and they could thus be represented as
a hub-and-spoke wheel, in which the outcome is represented by the hub and each mechanism by a
spoke in the wheel.
Figure 1: Initial hypotheses: mechanisms
Table 96 on the next page provides refinements of seven of these hypotheses.
The first column contains the original hypothesis as developed from the initial program theory building
workshop.
The second column summarises, in dot point form, the elements for which data has been found in the
evaluation. For example, the first hypothesis anticipated growth in knowledge about policies and
budgets for maternal and child health. The evaluation found evidence of growth in knowledge about
policies, budgets, standards, services, and maternal and child health itself. The first hypothesis
anticipated growth in knowledge for citizens. The evaluation found evidence of growth in knowledge
for citizens, service providers and managers, and local governments.
These first two columns of the table were presented to participants in the final data analysis workshop
discussed, and endorsed by them.
The third column provides sets of new hypotheses, based on the evidence from this evaluation. These
revised hypotheses have been developed by the evaluators as part of the process of writing the final
report. On one level, these provide a summary of findings from the evaluation. It is important to
remember that they are relevant to the particular contexts in which this program has operated.
Projects working in different sectors, or in the same sector but in different countries or cultures, may
Page | 138
work differently. The hypotheses therefore remain just that – hypotheses – to be tested and refined
in future projects.
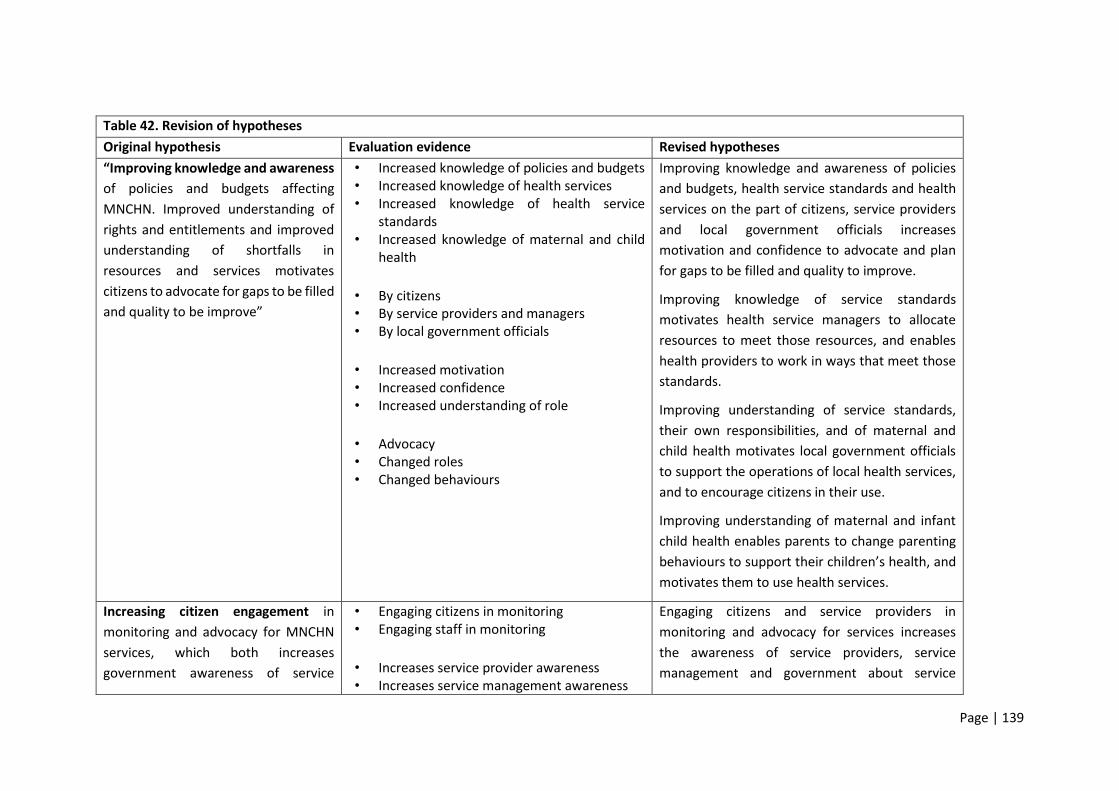
Page | 139
Table 42. Revision of hypotheses
Original hypothesis Evaluation evidence Revised hypotheses
“Improving knowledge and awareness
of policies and budgets affecting
MNCHN. Improved understanding of
rights and entitlements and improved
understanding of shortfalls in
resources and services motivates
citizens to advocate for gaps to be filled
and quality to be improve”
• Increased knowledge of policies and budgets • Increased knowledge of health services • Increased knowledge of health service
standards • Increased knowledge of maternal and child
health
• By citizens • By service providers and managers • By local government officials
• Increased motivation • Increased confidence • Increased understanding of role
• Advocacy • Changed roles • Changed behaviours
Improving knowledge and awareness of policies
and budgets, health service standards and health
services on the part of citizens, service providers
and local government officials increases
motivation and confidence to advocate and plan
for gaps to be filled and quality to improve.
Improving knowledge of service standards
motivates health service managers to allocate
resources to meet those resources, and enables
health providers to work in ways that meet those
standards.
Improving understanding of service standards,
their own responsibilities, and of maternal and
child health motivates local government officials
to support the operations of local health services,
and to encourage citizens in their use.
Improving understanding of maternal and infant
child health enables parents to change parenting
behaviours to support their children’s health, and
motivates them to use health services.
Increasing citizen engagement in
monitoring and advocacy for MNCHN
services, which both increases
government awareness of service
• Engaging citizens in monitoring • Engaging staff in monitoring
• Increases service provider awareness • Increases service management awareness
Engaging citizens and service providers in
monitoring and advocacy for services increases
the awareness of service providers, service
management and government about service
Page | 140
delivery issues and community
concerns in relation to services, and
increases pressure for accountability
by service providers and governments
• Increases multiple levels of government’s awareness
• Supports service providers and their managers in making the case for funding
• Triggers internal accountability systems • Triggers restructuring to meet needs • Increases pressure for accountability
delivery issues and community concerns about
services. Increased awareness of service delivery
issues and community concerns supports service
providers and their managers in making the case
for funding internally. It also triggers internal
accountability systems, such that managers are
prompted to reallocate resources to meet priority
needs, and to hold staff accountable for the
provision of high-quality services. Increasing
government awareness of service delivery issues
and community concerns increases pressure for
accountability, and enables local officials to
advocate to higher levels of government on behalf
of local services and communities.
Building mutual accountability
between service providers,
governments and communities, by
building agreements about actions to
be taken to improve the quality and
use of services and by all parties
holding each other to account
• Triggering internal accountability within service provider systems
• Triggering internal accountability within local government
• Introducing citizen accountability for use of services
AND
• Building relationships / partnerships / collaboration, through which different authorities bring their various resources to bear, in keeping with their responsibilities under standards
Developing relationships and partnerships
between service provider agencies and local
government facilitates development of shared
action plans. Shared action plans require services,
local government and communities to bring their
various resources to bear on agreed priorities.
Having shared action plans triggers internal
accountability processes within service provider
systems and local government systems, which
supports the implementation of plans.
Where local governments are aware of the value
of using health services in supporting maternal
and child health, and where local political systems
and norms support it, local governments may

Page | 141
introduce regulations holding citizens accountable
for the use of services.
Activating leadership to implement
the actions necessary to improve the
quantity and quality of services at the
sub-district and local level
• Activating health system leaders • Activating political / government leaders
(esp. village governments) • Activating informal leaders in communities • Activating village governments as a whole, to
take leadership role in their communities, in health promotion
• To collaborate in planning necessary actions • To take actions within their own spheres
• To improve health services • To improve health promotion • To improve health service use
Increased awareness of standards, service delivery
issues and citizens’ concerns motivates leaders in
multiple spheres: the health system, local
government and informal leaders in communities.
Leaders engage in collaborative planning, and take
actions within their own spheres of authority.
Actions may include improvements to health
services, improvements to health promotion, and
improving citizens’ use of health services.
Elected officials and representatives who are
aware of community priorities can use
transparent processes to establish priorities and
report on progress and are thus enabled to be
accountable to their constituencies. They are also
aware that their efforts are being monitored by
communities and are thus motivated to take
agreed actions.
Aligning political interests &
community priorities, such that
elected leaders are aware that
communities are monitoring their
efforts to improve MNCHN in line with
community priorities and will hold
them to account
• Existing evidence weakly supported this hypothesis. Insufficient evidence to amend the hypothesis.
No new hypotheses were created.
Page | 142
Aligning levels of the health system, so
that local, sub-district and district
health services are working towards
common goals for MNCHN
• Supportive policy and funding context • Action plans established at multiple levels of
services (Posyandu, Polindes, Puskesmas) • Quality of services improved at multiple
levels
Health services at different levels are responsible
for different types of service delivery. Where CVA
processes are undertaken at multiple levels,
improvements in quality and access may be made
at each of those levels. A variety of service needs
can thus be met, which together contribute to
better health outcomes form MNCHN
Building skills and capacities of service
providers as identified in action plans
and of community members in
planning, monitoring and advocacy
• Building skills of cadres for service provision • Building skills of service providers in
assessing services against standards • Enabling service providers to understand
requirements for their roles under the standards (rather than technical skills to undertake roles)
• Building skills of community members in assessing services against standards
• Improving skills of community members in appropriate ways of providing feedback
• Improving skills of service providers in ‘hearing’ and responding to feedback
• Building skills of village facilitators and service providers in advocating for planned actions
• Enabling service providers by ensuring appropriate facilities and equipment
CVA builds multiple kinds of capacity for multiple
stakeholders. Assessment of services identifies
skills gaps for cadres and direct service delivery
staff. Addressing gaps can be incorporated within
action plans and implementation of the plans
contributes to redressing the gaps.
Participation in standards monitoring and
advocacy processes, supported by project staff
who provide coaching and mentoring, enables
citizens, service providers and local governments
to develop skills in assessment, advocacy, giving
feedback appropriately, and responding positively
to feedback.
Participation in standards monitoring processes
increases service provider and management
understanding of the standards they are supposed
to achieve, thus enabling them to work towards
achieving those standards.

Page | 143
Implementing action plans enables gaps in
equipment and facilities to be met, which
supports service providers to meet the standards.
Refreshing the cycle annually through
annual processes of monitoring and
updating action plans, building
sustainability of accountability and
service improvement processes.
• Repetition builds confidence and skills • Multiple years of budgets, multiple
achievements possible • Building experiences of success • Building understanding, on the part of
leaders, of the value of citizen input to their health services / governments
• Building belief by citizens that participation and advocacy can contribute to change
• Time for awareness to diffuse through community
Repeating the CVA cycle annually builds
confidence and skills in monitoring, planning and
implementation of plans, which contributes to
effectiveness of the processes in later years.
Experiences of receiving constructive feedback
and improving services in response to feedback
increases leaders’ understanding of the value of
citizen input, which encourages leaders to sustain
citizen-based monitoring over time.
Experiences of success in implementation of plans
(that is, of citizen concerns being addressed)
builds belief in the value of participatory
processes, including citizen participation, which
encourages both leaders and citizens to sustain
citizen-based monitoring over time.
Repeating the CVA cycle annually provides access to resources, including budgets, over multiple years, allowing successes to accumulate and quality of services to build.
Repeating the CVA cycle annually provides time for diffusion of awareness, which supports participation in citizen-based monitoring.
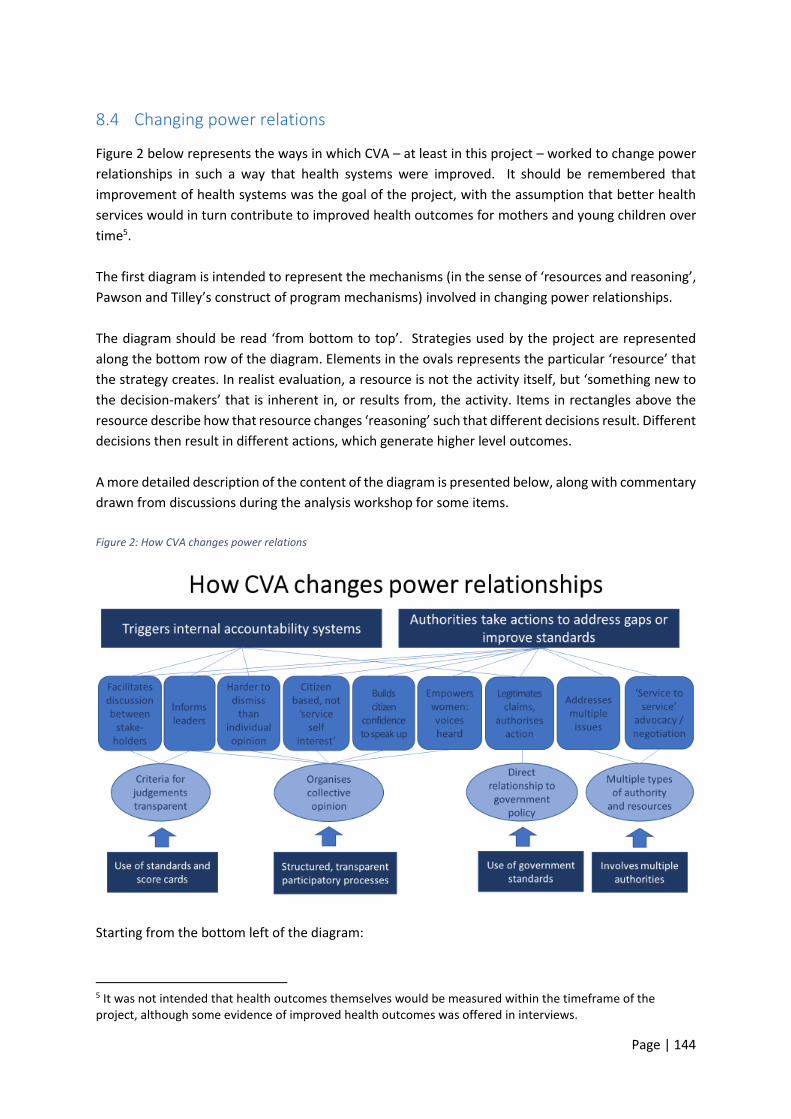
Page | 144
8.4 Changing power relations
Figure 2 below represents the ways in which CVA – at least in this project – worked to change power
relationships in such a way that health systems were improved. It should be remembered that
improvement of health systems was the goal of the project, with the assumption that better health
services would in turn contribute to improved health outcomes for mothers and young children over
time5.
The first diagram is intended to represent the mechanisms (in the sense of ‘resources and reasoning’,
Pawson and Tilley’s construct of program mechanisms) involved in changing power relationships.
The diagram should be read ‘from bottom to top’. Strategies used by the project are represented
along the bottom row of the diagram. Elements in the ovals represents the particular ‘resource’ that
the strategy creates. In realist evaluation, a resource is not the activity itself, but ‘something new to
the decision-makers’ that is inherent in, or results from, the activity. Items in rectangles above the
resource describe how that resource changes ‘reasoning’ such that different decisions result. Different
decisions then result in different actions, which generate higher level outcomes.
A more detailed description of the content of the diagram is presented below, along with commentary
drawn from discussions during the analysis workshop for some items.
Figure 2: How CVA changes power relations
Starting from the bottom left of the diagram:
5 It was not intended that health outcomes themselves would be measured within the timeframe of the project, although some evidence of improved health outcomes was offered in interviews.
Page | 145
• CVA uses existing government standards in staff workshops and citizen-developed score cards in community workshops, and these make the criteria for judgements about the quality of health services transparent. Having transparent criteria facilitates discussion between people with different views or roles;
• CVA provides information to leaders in health services and in communities that they did not previously have. This includes information about government standards and entitlements for health services, as well as information about the current situation for health services (i.e. whether standards are met) and about citizens’ concerns about, and aspirations for6 those services. Because leaders have that information, they are able to make data-informed decisions.
• The processes through which CVA is implemented are highly structured, transparent and participatory. These processes organise collective opinion, which is harder to dismiss than individual opinion. It also makes the citizen-based nature of assessments clear, which means that governments and citizens are unable to dismiss advocacy by services as representing narrow ‘self-interest’.
• Because of the focus on maternal and infant child health, the processes deliberately target mothers, which means that mothers have a say and that their voices are heard. In some villages, groups of mothers met informally prior to CVA processes to discuss the issues that they wanted to raise in meetings. In some other villages, mothers and cadres agreed in advance changes that they believed should be made, and these were presented to meetings and ratified.
In the data analysis workshop, participants noted that hearing women’s voices in decision-
making processes represented a shift in gender relations in (largely patriarchal) Indonesia.
They also reported that in some villages, there was increased attendance by fathers at
Posyandu, because agreements have been made that fathers should support mothers in
attending Posyandu. One village passed a regulation requiring that fathers should do so. In
another village, the Head of District asked fathers to become more involved, and a pattern of
mothers and fathers taking the child to Posyandu on alternate months evolved. These changes
contribute to a change in gender roles in participating villages, such that it is no longer seen
that ‘only mothers need to be taking care of young children’.
• Use of government standards relates those judgements to existing government policy, which increases perceived authority or justification for proposals. This legitimates claims made by villagers and staff and provides authorisation for decision-makers to act to meet the standards;
• CVA processes bring multiple types and multiple levels of decision-makers in to the process. On the one hand, this means that different forms of authority are available to address issues in different domains – Village Governments in relation to local regulations and expenditure of Village funds; health services in relation to health staff and expenditure of health funds; formal and informal community leaders in relation mobilising citizens, and so on.
• CVA processes bring different decision-makers together at specific points in the process. This helps to establish relationships between the stakeholders. In this project, that enabled agencies to advocate to each other (for example, the Head of Health to discuss with the Head of Village) for complementary funding to meet priority needs.
6 The only evidence for citizens’ aspirations for services lies in the elements of the score cards that were developed in the initial stages of the project.

Page | 146
8.5 Strengthening systems
The second overarching hypothesis is that CVA works by strengthening systems. This is a systems-
theory based hypothesis. It refers not just to ‘the health system’, but to the wider system that includes
the health system, the village government system, and residents themselves.
In this analysis, a system may be understood as a group of parts which work together to achieve a
function:
“A system is a regularly interacting or interdependent group of items forming an integrated
whole. Every system is delineated by its spatial and temporal boundaries, surrounded and
influenced by its environment, described by its structure and purpose and expressed in its
functioning” (Wikipedia)
Other definitions also consider the issue of boundaries in additional ways (that is, beyond the spatial
and temporal). For example,
A system’s boundary demarcates a limit to the system’s internal components and processes.
Internal to its boundary, the system has some degree of integrity, meaning the parts are
working together and this integrity gives the system a degree of autonomy.
(https://complexitylabs.io/system-boundary/)
To analyse a system, one can consider:
▪ the component parts of the system;
▪ the relationships between those parts;
▪ the resources (‘inputs’) the system needs to function;
▪ the ways that information and other resources flow through the system;
▪ the processes within the system that produce ‘resources’ for the next stage of its operations;
▪ how processes at one stage affect subsequent stages.
▪ The differing perspectives of actors in the system
The diagram on the next page represents this analysis for this GPSA CVA project. That is, it represents
how the project has operated to strengthen the maternal and infant child health system and its
environment, thus enabling it to operate more effectively.
This diagram should be read a little differently: in this one, the bottom row represents the situation
at the commencement of the project, the middle rows represent the change processes introduced by
the project, and the top row describes systems-strengthening outcomes.

Page | 147
Figure 3: How CVA strengthens systems
Firstly, CVA has expanded the boundaries of the system to include service users, and to include
relationships between communities (of service users), health services and local governments.
In relation to citizens, CVA changed the perceived role of citizens, from being simply patients or service
users to ‘a source of information that is useful to the system’ and ‘political claimants with rights’. The
effect is that they are moved from being ‘user of the systems’ to being ‘a part of the system’. The
experience of speaking up and having issues addressed as a result then motivate further involvement
and repeated actions, with the potential to generate a virtuous cycle of action.
Participants in the data analysis workshop said that this in fact went further: citizens now have power
within the system. They had moved from a position of ‘participating and being told what to do’, to
‘participating and disagreeing, or suggesting what is to be done’, and to making some decisions. Asked
whether this empowerment had been seen outside of CVA processes or was simply a matter of good
processes within it, they offered a number of specific examples outside of CVA processes:
▪ Citizens had addressed concerns about corruption in one local government;

Page | 148
▪ A village facilitator had met with a Head of District Education in a meeting (not related to CVA)
and raised concerns about repairs required to a local school. The Head agreed to investigate
the issue, did so, and the school was repaired;
▪ Community members were advised about the role of the Ombudsman during CVA processes,
and later accessed the Ombudsman for non-CVA matters.
Data was not systematically captured about examples such as these, and so it is not possible to say
how widespread they might be.
The second way in which CVA strengthened the system was by bringing existing information resources
into play as active factors in decision-making. Information about service standards, rights, budgets,
maternal and child health existed prior to the project, but many people – citizens, local government
officials and service staff – were not aware of it. Information was made accessible in many ways over
the project – from awareness-raising sessions in the project itself, putting budget information on
posters outside village offices, and providing health information to parents through service delivery
processes. Over time, additional actors become the providers of information, including parents
providing information to service staff about upcoming events. Different types of information were
used by different actors and contributed to changes in a variety of types of decisions, including
resource allocations which contributed directly to improvements in health facilities7. Resource
allocation decisions took place in a very favourable context – the Indonesian Government had made
substantial allocations of funds available to local governments for local development, and had
increased allocations specifically for maternal and infant child health. The ways in which the resources
were spent, however, was influenced by the CVA process in that it identified agreed priorities. There
were also multiple examples across the project of existing resources being allocated differently, for
example when staff rosters were changed to ensure staffing at Posyandu.
The third way that CVA strengthened the system was by building cooperative relationships across
component elements of the system – most particularly, between health services and local
governments. Both health services and local governments had responsibilities for aspects of health
service provision (local governments were responsible for funding particular aspects of Posyandu), but
processes for coordination across the two either did not exist, or were ineffective. Collaborative
processes within the project enabled joint establishment of priorities and clarity about respective
responsibilities and contributions. They also established relationships between the actors, facilitating
negotiations between them. This in turn increased the resources available, by bringing resources from
multiple sectors to bear on priority issues, and enabled resources to flow through the system, to the
points at which they were needed. There were many examples across the program of material
resources being improved – from heath facilities being built or refurbished, electricity and water
supplies improved, ambulances bought and so on.
The fourth way that CVA strengthened the system was by building capacity in collaborative action at
multiple levels. This included citizens and local service providers, citizens and local governments,
different levels within health systems, and health services and local governments. Skills were
7 One reviewer of the draft of this report suggested that information is a static resource and that consideration of knowledge production and social learning would be appropriate. These may form fruitful concepts for future research into CVA.
Page | 149
developed in consultation, representation, and advocacy; and in planning and prioritising. There were
reports of changes from hostile confrontations, ineffective complaints and passivity to respectful
advocacy and cooperative action. New skills and more positive relationships again contributed to
experiences of success, creating positive feedback loops which reinforce the system and motivate
diffusion of effective processes.
8.6 Power and the role of Wahana Visi
One of the issues not represented in the diagram – or in the original program theory – is the nature of
power and “authorising” that Wahana Visi itself brings to the table. Sources of power and authority
may include:
▪ a measure of independence from governments at all levels, which may add credibility to assessments of standards;
▪ access through the national organisation to higher levels of government, which may either tend to support the implementation of supportive national frameworks or operate to keep lower levels of government accountable;
▪ ready access to media, with the potential rewards and threats that publicity can represent to political stakeholders; and
▪ representing a large donor organisation which channels significant funding into development in the country.
It was hypothesised by the evaluators that this may be particularly important in the early stages of
CVA, or where the political and economic context is less than optimally supportive.
This hypothesis was the subject of some discussion during the analysis workshop. Some participants
did not believe that Wahana Visi had, or had exercised, power or an ‘authorising voice’ in the CVA
process. They noted that World Vision does not have overt authority to require any of the CVA
stakeholders to participate in the program, and that in some places, senior decision-makers had not
immediately accepted World Vision. In those places, Wahana Visi focused on building a positive
relationship in order to gain acceptance, rather than on any exercise of power. Of course, without
direct interviews with those decision-makers, it is impossible to know whether or not any of the above
perceptions may have played into their responses, either initially or over time.
Participants noted that Indonesia has been moving to strengthen its democratic processes and to
increase transparency and accountability, and suggested that resorting to political advocacy would be
more likely where the overarching political context was less supportive. In the Indonesian context,
they suggested that the Wahana Visi’s contribution related more to the fact that it is a credible
organisation with established relationships with government. Because of this, CVA offers an
opportunity for senior decision-makers to put their responsibilities for transparency and
accountability into practice; World Vision’s credibility and existing trust in World Vision enables them
to ‘test the water’ by participating in CVA processes. This results in two CMO hypotheses which could
be tested across the range of CVA projects in different countries, but which were not tested in this
evaluation; and a third (by implication, not discussed in the workshop) in which CVA may not be
advisable.

Page | 150
Table 43. CMOs relating to role of Wahana Visi
Context Mechanism Outcome
Democratisation; increasing
interest in accountability and
transparency
World Vision is credible
organisation with established
relationships with
government.
Decision-makers trust WV and
see CVA as a pathway to ‘test
the water’ for transparency,
citizen voice and community
accountability
Senior decision-makers
actively support and
participate in CVA
Non-democratic governments;
low interest in transparency or
accountability.
World Vision brings multiple
types of power
Governments seek to maintain
political ‘face’, compact with
citizens to govern, and goodwill
with international donors and
governments
Senior decision-makers allow
CVA; middle-level decision-
makers (who are closer to the
people) participate more
actively.
Non-democratic, coercive
governments maintaining
power through violence
Retribution against advocates /
fear of retribution
Unsafe to establish CVA
8.7 Conclusion
Having drafted revised program theory for CVA, it may be useful to reflect on the implications of the
revised theory for future iterations of CVA programs, and/or for World Vision International CVA
policies, procedures and resources.
For this, we turn to publicly available CVA documentation.
The World Vision Ghana CVA Field Guide (undated) notes that “Existing government standards are a
crucial part of CVA and provide the key distinction between traditional advocacy and advocacy using
CVA.” (p3). There is no explanation in that document, however, of how or why using existing standards
matters. The revised theory presented here proposes that existing standards matter because they
legitimise the claims for improvements.
That Guide also suggests that community members, government officials and service providers should
visit a facility to monitor it against those standards. In this project, monitoring against standards was
done by health service staff, with CVA staff facilitating. This much more restricted participation does
not seem to have harmed the project – possibly because the results were made available to other
stakeholders in later stages of the work, and possibly because having the assessment done by staff
was both less threatening and more credible than having it done by a wider group. Balancing this
Page | 151
‘internal’ process with the ‘external’ community score card process both brought a wider range of
issues into consideration, and provided the other kind of ‘legitimising’ that was important – that is,
bringing the voice of community members into the system. We have seen earlier in this report that
community voice was important to service managers because it provided a legitimate basis for their
claims for appropriate funding for services.
That Guide also says:
For CVA to succeed, we must facilitate a warm, collaborative relationship among service users
and service providers. Open communication and trust is vital, because some may feel –
especially nurses, teachers and government officials – that they are being criticized. Building
relationships is crucial to ensuring participation and political will.
There was relatively little direct comment on relationships between community members and service
providers in the qualitative materials translated for this evaluation, although there were some direct
positive comments, and the implications for relationships of other comments (for example, about
improved quality of services, or more positive responses from service providers) were also positive.
CVA staff noted that there was more evidence in other material that had not been translated. There
was much more significant discussion of the relationships built between different types of authority
holders – in particular, health services and local government. This is perhaps closer to the World Vision
International Project Model documentation for CVA, which describes CVA as “improving relationships
between citizens, government and service providers.” (p1) – but which later says that CVA “aims to
improve essential services (like health and education) by improving the relationship between
communities and government.” (p4). It seemed in this evaluation that strengthening health service
provider relationships with local authorities, who had some responsibility for health service funding
and monitoring, was particularly important. It does appear that CVA does generally support
relationship development across stakeholder groups – but it may also be that relationships between
parties with direct and indirect responsibilities for services might be a particularly important pathway
to improved services. It seems feasible that it may involve two mechanisms operating concurrently.
The first is that community accountability triggers internal accountability processes within each of the
parties with responsibility for the service, such that the organisations are holding their own staff to
account for their own responsibilities. The second is that of improving relationships between the
parties, such that they can and do coordinate to meet those responsibilities. If that is the case, some
further attention to supporting these relationships may be important in other CVA projects.
Finally, the Project Model suggests that CVA tends to become self-sustaining.
Once communities see the success they can have, they usually begin the monitoring process
again and focus on increasingly complex and challenging issues. As they mature in their CVA
practice, communities also shift their focus from one sector to another. For example, a
community might work on improving health services in the first year, and then move on to
improve education or water and sanitation services. Thus, the CVA project model is designed
to function cyclically and sustain a new working relationship between communities and
governments over the long-term. (p 9)
There was very limited evidence in this evaluation of this being the case. As described in section 7.5
above, there were some individuals who intended to do what they could to maintain CVA processes,
and a couple of them were in key strategic positions to do so within their own spheres of influence.
Page | 152
However, there was little evidence of communities organising to sustain CVA-style processes or
transferring them to other sectors. Of course, this evaluation could not assess the extent to which it
is in fact ‘usual’ that such diffusion and self-organisation takes place. However, if it is common, and
yet has not occurred in this otherwise very successful project, further investigation may provide
important learning for World Vision going forward. A retrospective research project investigating the
circumstances in which diffusion does and does not occur could provide lessons to be incorporated
into future CVA initiatives, with a view to strengthening diffusion and impact.
Page | 153
9 References Combaz, E. & Mcloughlin, C., (2014). Voice, Empowerment and Accountability: Topic Guide.
Birmingham, UK: GSDRC, University of Birmingham.
Committee on Economic, Social and Cultural Rights, Office of the High Commissioner for Human Rights
(2000) CESCR General Comment No. 14: The Right to the Highest Attainable Standard of Health (Art.
12)
Pawson, R. and Tilley, N. (1997) Realistic Evaluation. Sage.
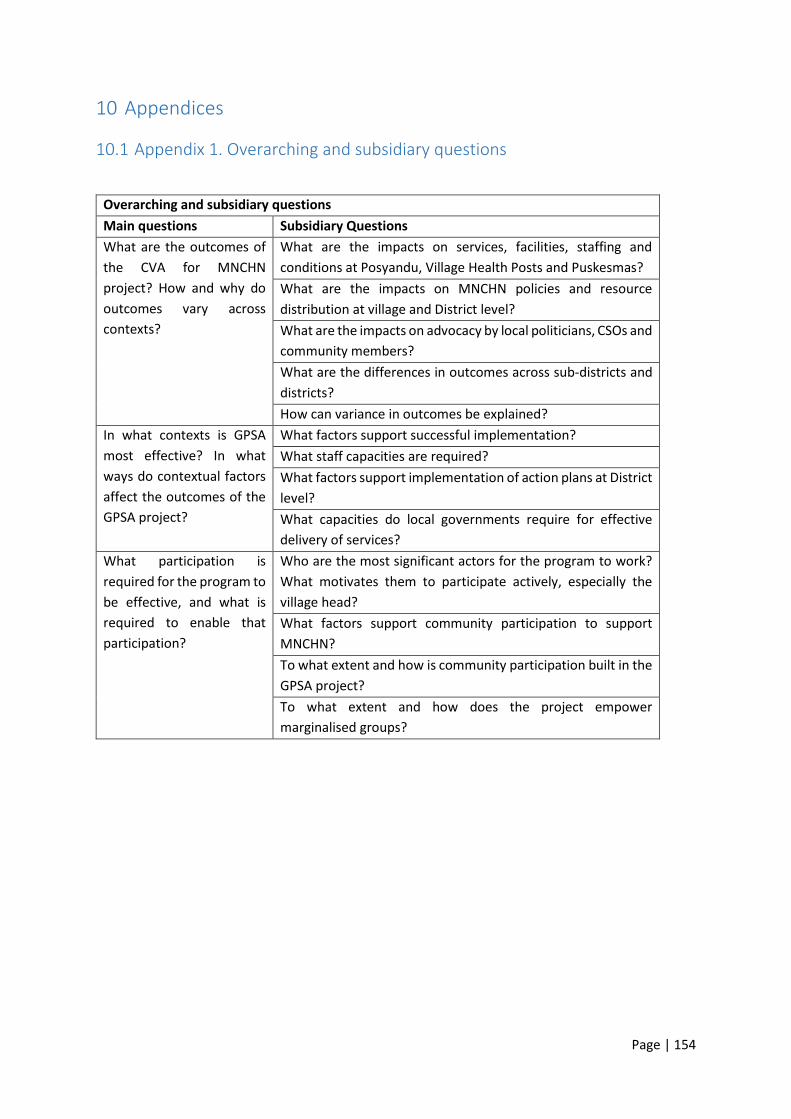
Page | 154
10 Appendices
10.1 Appendix 1. Overarching and subsidiary questions
Overarching and subsidiary questions
Main questions Subsidiary Questions
What are the outcomes of
the CVA for MNCHN
project? How and why do
outcomes vary across
contexts?
What are the impacts on services, facilities, staffing and
conditions at Posyandu, Village Health Posts and Puskesmas?
What are the impacts on MNCHN policies and resource
distribution at village and District level?
What are the impacts on advocacy by local politicians, CSOs and
community members?
What are the differences in outcomes across sub-districts and
districts?
How can variance in outcomes be explained?
In what contexts is GPSA
most effective? In what
ways do contextual factors
affect the outcomes of the
GPSA project?
What factors support successful implementation?
What staff capacities are required?
What factors support implementation of action plans at District
level?
What capacities do local governments require for effective
delivery of services?
What participation is
required for the program to
be effective, and what is
required to enable that
participation?
Who are the most significant actors for the program to work?
What motivates them to participate actively, especially the
village head?
What factors support community participation to support
MNCHN?
To what extent and how is community participation built in the
GPSA project?
To what extent and how does the project empower
marginalised groups?
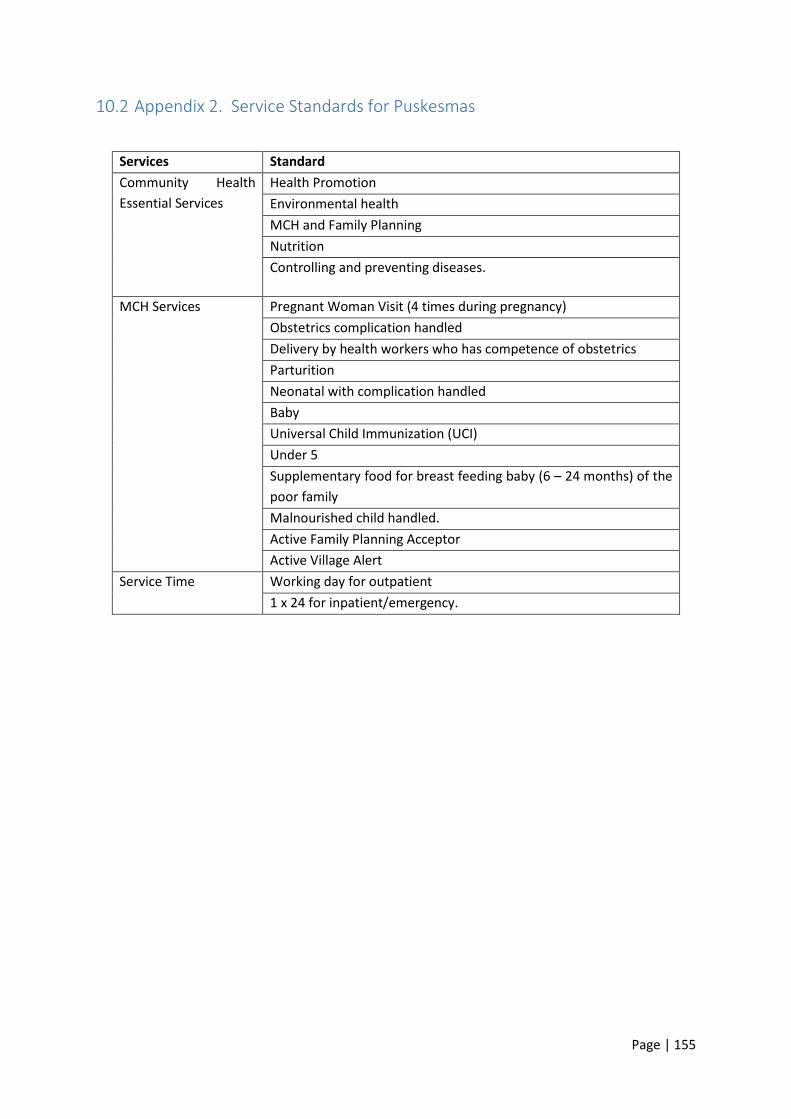
Page | 155
10.2 Appendix 2. Service Standards for Puskesmas
Services Standard
Community Health
Essential Services
Health Promotion
Environmental health
MCH and Family Planning
Nutrition
Controlling and preventing diseases.
MCH Services
Pregnant Woman Visit (4 times during pregnancy)
Obstetrics complication handled
Delivery by health workers who has competence of obstetrics
Parturition
Neonatal with complication handled
Baby
Universal Child Immunization (UCI)
Under 5
Supplementary food for breast feeding baby (6 – 24 months) of the
poor family
Malnourished child handled.
Active Family Planning Acceptor
Active Village Alert
Service Time
Working day for outpatient
1 x 24 for inpatient/emergency.

Page | 156
Equipment Standard
Equipment - MCH-Family Planning-Immunization Room
Mother health check set
Child health check set
Family Planning Set
Immunization set
Single use material
Supplies
Furniture
Medical record and report: MCH, Family Planning, immunization
Equipment - Childbirth Room
Obstetrics and gynaecology set
IUD Set
Resuscitation set
Single use material
Supplies
Furniture
Record and report
Equipment – Parturition Room
Parturition set
Single use material
Supplies
Furniture
Record and report
Equipment - Breast Feeding Room
Breast feeding set
Single use material
Supplies
Furniture
Record and report
Equipment - Puskesmas Outdoor services
Immunization kit
Midwife kit
Posyandu Kit
Other Standard
Coverage Minimum: one Puskesmas per one sub-district
Supporting Facility Housing facility for health personnel
Infrastructure Puskesmas should have (at least:):
Sanitation System
Electricity System
Mobile service vehicle
Ambulance
Health Personnel (number and type)
Outpatient Inpatient
1 doctor 2 doctors
5 nurses 8 nurses
4 midwives 7 midwives
1 nutritionist
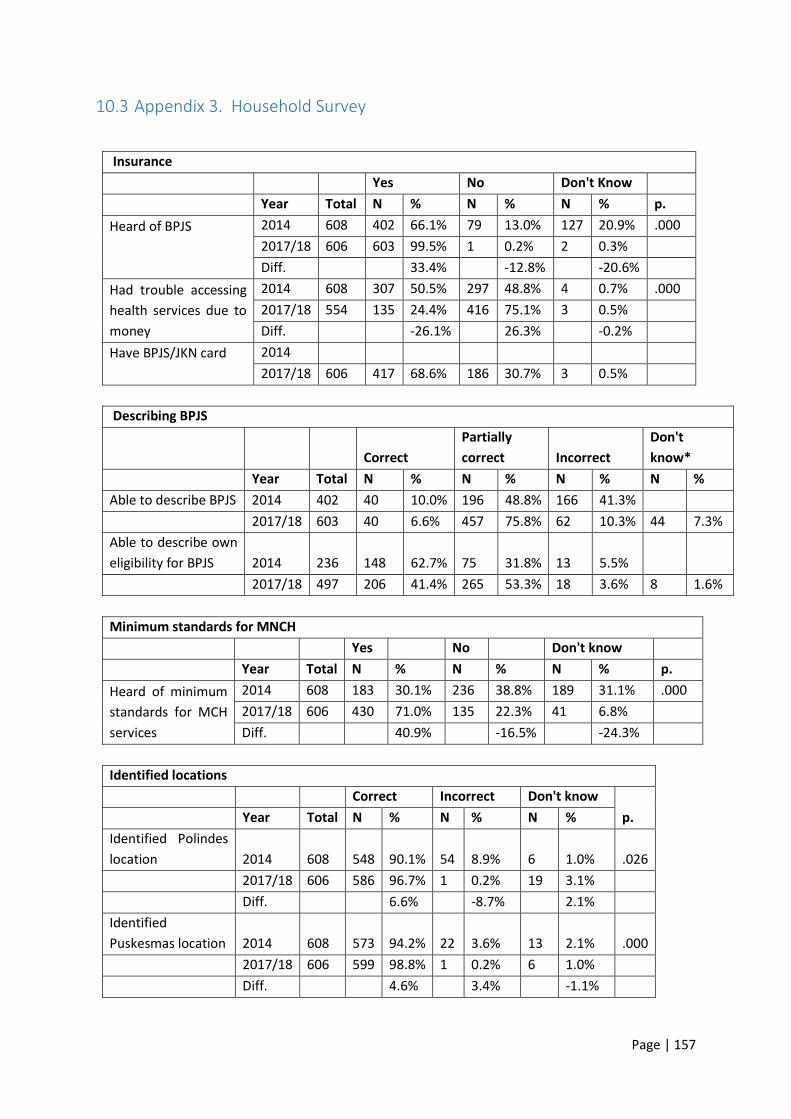
Page | 157
10.3 Appendix 3. Household Survey
Insurance
Yes No Don't Know Year Total N % N % N % p.
Heard of BPJS
2014 608 402 66.1% 79 13.0% 127 20.9% .000
2017/18 606 603 99.5% 1 0.2% 2 0.3%
Diff. 33.4% -12.8% -20.6%
Had trouble accessing
health services due to
money
2014 608 307 50.5% 297 48.8% 4 0.7% .000
2017/18 554 135 24.4% 416 75.1% 3 0.5%
Diff. -26.1% 26.3% -0.2%
Have BPJS/JKN card
2014
2017/18 606 417 68.6% 186 30.7% 3 0.5%
Describing BPJS
Correct
Partially
correct Incorrect
Don't
know*
Year Total N % N % N % N %
Able to describe BPJS 2014 402 40 10.0% 196 48.8% 166 41.3%
2017/18 603 40 6.6% 457 75.8% 62 10.3% 44 7.3%
Able to describe own
eligibility for BPJS 2014 236 148 62.7% 75 31.8% 13 5.5%
2017/18 497 206 41.4% 265 53.3% 18 3.6% 8 1.6%
Minimum standards for MNCH
Yes No Don't know
Year Total N % N % N % p.
Heard of minimum
standards for MCH
services
2014 608 183 30.1% 236 38.8% 189 31.1% .000
2017/18 606 430 71.0% 135 22.3% 41 6.8%
Diff. 40.9% -16.5% -24.3%
Identified locations
Correct Incorrect Don't know Year Total N % N % N % p.
Identified Polindes
location 2014 608 548 90.1% 54 8.9% 6 1.0% .026
2017/18 606 586 96.7% 1 0.2% 19 3.1%
Diff. 6.6% -8.7% 2.1%
Identified
Puskesmas location 2014 608 573 94.2% 22 3.6% 13 2.1% .000
2017/18 606 599 98.8% 1 0.2% 6 1.0%
Diff. 4.6% 3.4% -1.1%

Page | 158
Received services
Yes No Year Total N % N % p.
Received service at
Polindes 2014 608 516 84.9% 92 15.1% .013
2017/18 606 543 89.6% 63 10.4%
Diff. 4.7% -4.7%
Received service at
Puskesmas 2014 608 539 88.7% 69 11.3% .000
2017/18 606 580 95.7% 26 4.3%
Diff. 7.0% -7.0%
Satisfaction with services
Very
satisfied Satisfied Unsatisfied
Very
unsatisfied
Year Total N % N % N % N % p.
Satisfaction
with Posyandu
service
2014 600 28 4.7% 482 80.3% 82 13.7% 8 1.3% .000
2017/18 602 109 18.1% 470 78.1% 22 3.7% 1 0.2%
Diff. 13.4% -2.2% -10.0% -1.1%
Satisfaction
with Polindes
service
2014 516 21 4.1% 393 76.2% 99 19.2% 3 0.6% .000
2017/18 543 95 17.5% 426 78.5% 22 4.1% 0 0.0%
Diff. 13.4% 2.3% -15.1% -0.6%
Satisfaction
with
Puskesmas
service
2014 539 17 3.2% 458 85.0% 63 11.7% 1 0.2% .000
2017/18 580 118 20.3% 448 77.2% 14 2.4% 0 0.0%
Diff. 17.1% -7.8% -9.3% -0.2%
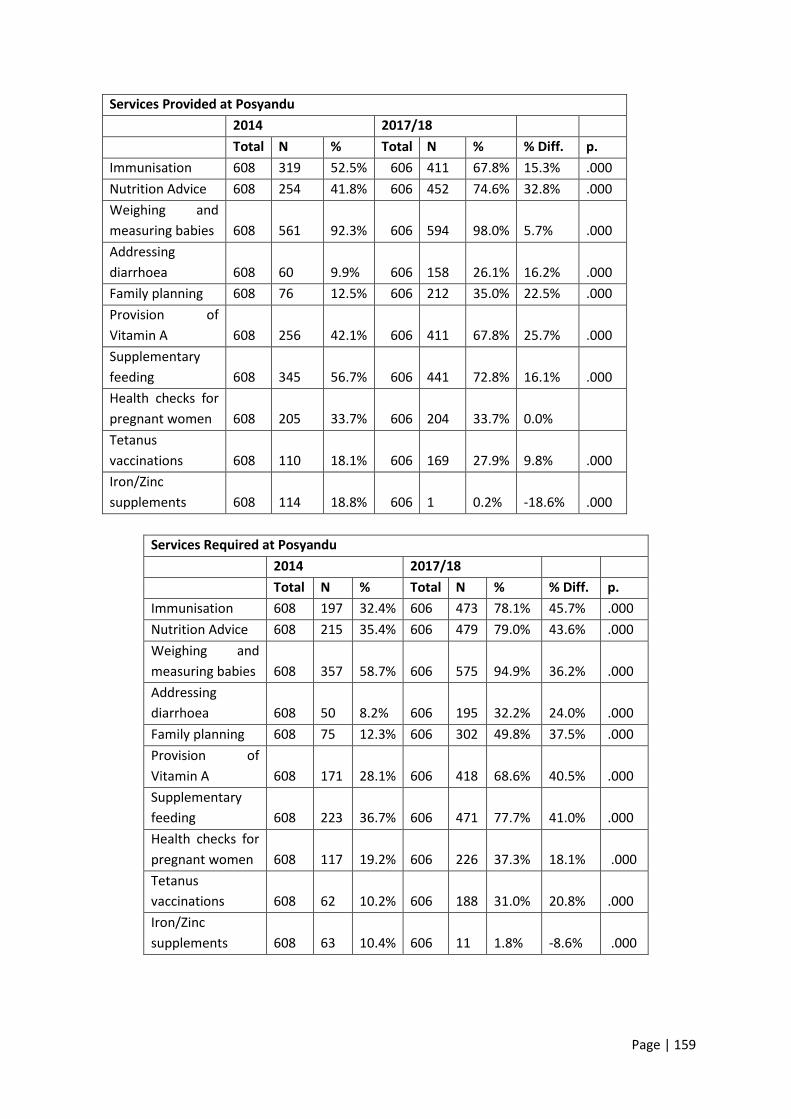
Page | 159
Services Provided at Posyandu
2014 2017/18
Total N % Total N % % Diff. p.
Immunisation 608 319 52.5% 606 411 67.8% 15.3% .000
Nutrition Advice 608 254 41.8% 606 452 74.6% 32.8% .000
Weighing and
measuring babies 608 561 92.3% 606 594 98.0% 5.7% .000
Addressing
diarrhoea 608 60 9.9% 606 158 26.1% 16.2% .000
Family planning 608 76 12.5% 606 212 35.0% 22.5% .000
Provision of
Vitamin A 608 256 42.1% 606 411 67.8% 25.7% .000
Supplementary
feeding 608 345 56.7% 606 441 72.8% 16.1% .000
Health checks for
pregnant women 608 205 33.7% 606 204 33.7% 0.0%
Tetanus
vaccinations 608 110 18.1% 606 169 27.9% 9.8% .000
Iron/Zinc
supplements 608 114 18.8% 606 1 0.2% -18.6% .000
Services Required at Posyandu
2014 2017/18 Total N % Total N % % Diff. p.
Immunisation 608 197 32.4% 606 473 78.1% 45.7% .000
Nutrition Advice 608 215 35.4% 606 479 79.0% 43.6% .000
Weighing and
measuring babies 608 357 58.7% 606 575 94.9% 36.2% .000
Addressing
diarrhoea 608 50 8.2% 606 195 32.2% 24.0% .000
Family planning 608 75 12.3% 606 302 49.8% 37.5% .000
Provision of
Vitamin A 608 171 28.1% 606 418 68.6% 40.5% .000
Supplementary
feeding 608 223 36.7% 606 471 77.7% 41.0% .000
Health checks for
pregnant women 608 117 19.2% 606 226 37.3% 18.1% .000
Tetanus
vaccinations 608 62 10.2% 606 188 31.0% 20.8% .000
Iron/Zinc
supplements 608 63 10.4% 606 11 1.8% -8.6% .000
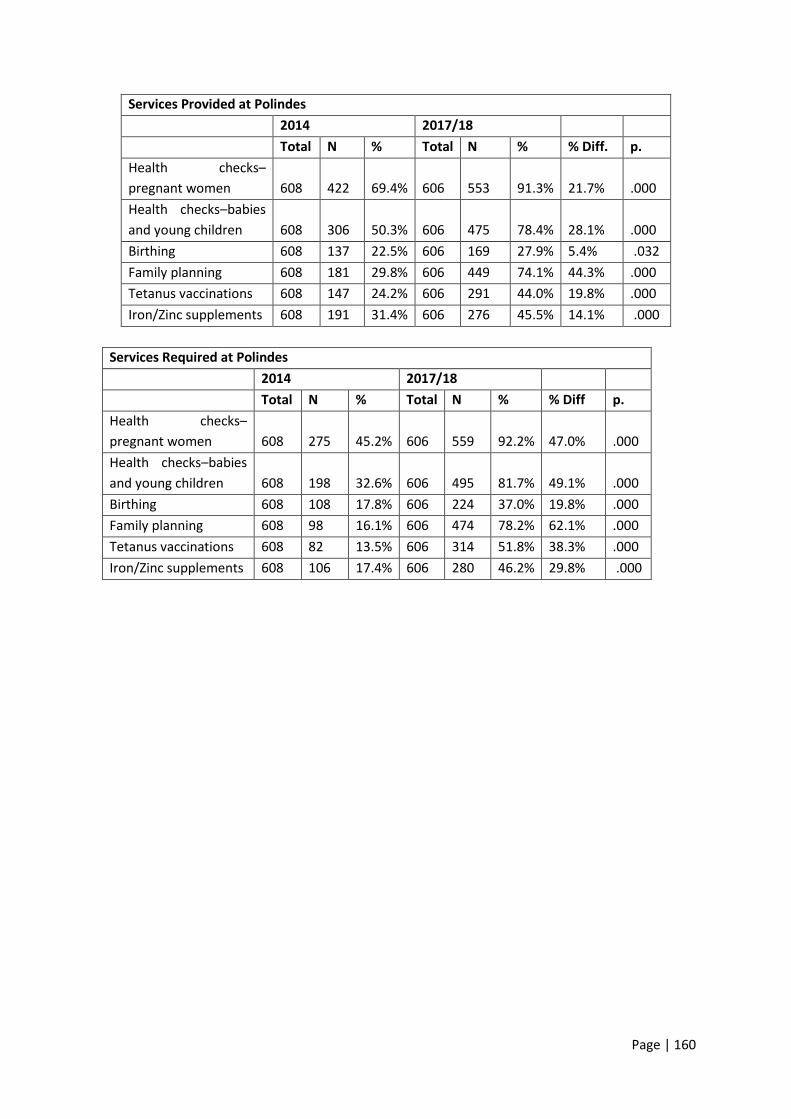
Page | 160
Services Provided at Polindes
2014 2017/18 Total N % Total N % % Diff. p.
Health checks–
pregnant women 608 422 69.4% 606 553 91.3% 21.7% .000
Health checks–babies
and young children 608 306 50.3% 606 475 78.4% 28.1% .000
Birthing 608 137 22.5% 606 169 27.9% 5.4% .032
Family planning 608 181 29.8% 606 449 74.1% 44.3% .000
Tetanus vaccinations 608 147 24.2% 606 291 44.0% 19.8% .000
Iron/Zinc supplements 608 191 31.4% 606 276 45.5% 14.1% .000
Services Required at Polindes
2014 2017/18 Total N % Total N % % Diff p.
Health checks–
pregnant women 608 275 45.2% 606 559 92.2% 47.0% .000
Health checks–babies
and young children 608 198 32.6% 606 495 81.7% 49.1% .000
Birthing 608 108 17.8% 606 224 37.0% 19.8% .000
Family planning 608 98 16.1% 606 474 78.2% 62.1% .000
Tetanus vaccinations 608 82 13.5% 606 314 51.8% 38.3% .000
Iron/Zinc supplements 608 106 17.4% 606 280 46.2% 29.8% .000

Page | 161
Services Provided at Puskesmas
2014 2017/18
Total N % Total N % % Diff p.
See a doctor 608 252 41.4% 606 405 66.8% 25.4% .002
Health check–pregnant
women 608 408 67.1% 606 540 89.1% 22.0% .000
Birthing 608 360 59.2% 606 539 88.9% 29.3% .000
Complications with
newborns 608 51 8.4% 606 87 14.4% 6.0% .001
Health check–babies
and young children 608 246 40.5% 606 339 55.9% 15.4% .000
Complementary
feeding 608 38 6.3% 606 93 15.3% 9.0% .000
Services for children
under 5 608 164 27.0% 606 282 46.5% 19.5% .000
Nutrition advice–
mothers 608 50 8.2% 606 140 23.1% 14.9% .000
Nutrition advice–
children 608 38 6.3% 606 143 23.6% 17.3% .000
Family planning 608 174 28.6% 606 444 74.3% 45.7% .000
Immunisation 606 440 72.6%
Malnourishment
treatment 606 129 21.3%
Tetanus vaccinations 608 143 23.5% 606 261 43.1% 19.6% .000
Iron/Zinc supplements 608 158 26.0% 606 186 30.7% 4.7%
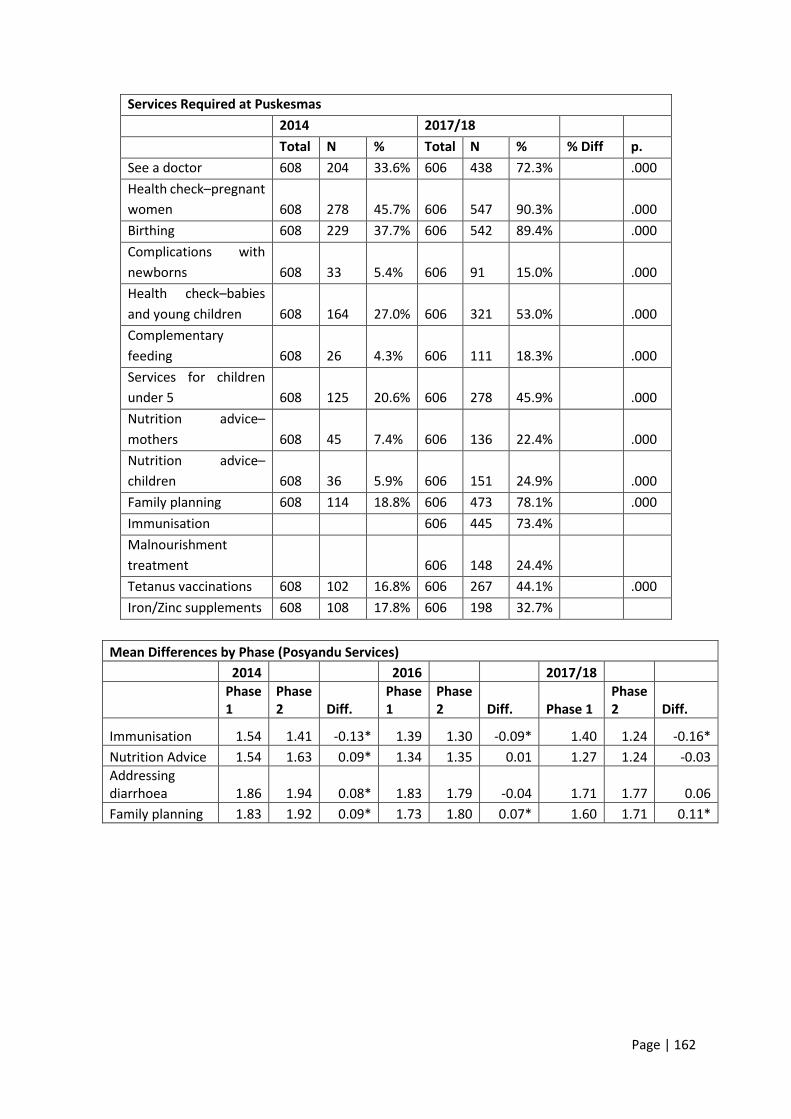
Page | 162
Services Required at Puskesmas
2014 2017/18
Total N % Total N % % Diff p.
See a doctor 608 204 33.6% 606 438 72.3% .000
Health check–pregnant
women 608 278 45.7% 606 547 90.3% .000
Birthing 608 229 37.7% 606 542 89.4% .000
Complications with
newborns 608 33 5.4% 606 91 15.0% .000
Health check–babies
and young children 608 164 27.0% 606 321 53.0% .000
Complementary
feeding 608 26 4.3% 606 111 18.3% .000
Services for children
under 5 608 125 20.6% 606 278 45.9% .000
Nutrition advice–
mothers 608 45 7.4% 606 136 22.4% .000
Nutrition advice–
children 608 36 5.9% 606 151 24.9% .000
Family planning 608 114 18.8% 606 473 78.1% .000
Immunisation 606 445 73.4%
Malnourishment
treatment 606 148 24.4%
Tetanus vaccinations 608 102 16.8% 606 267 44.1% .000
Iron/Zinc supplements 608 108 17.8% 606 198 32.7%
Mean Differences by Phase (Posyandu Services)
2014 2016 2017/18
Phase 1
Phase 2 Diff.
Phase 1
Phase 2 Diff. Phase 1
Phase 2 Diff.
Immunisation 1.54 1.41 -0.13* 1.39 1.30 -0.09* 1.40 1.24 -0.16*
Nutrition Advice 1.54 1.63 0.09* 1.34 1.35 0.01 1.27 1.24 -0.03
Addressing diarrhoea 1.86 1.94 0.08* 1.83 1.79 -0.04 1.71 1.77 0.06
Family planning 1.83 1.92 0.09* 1.73 1.80 0.07* 1.60 1.71 0.11*
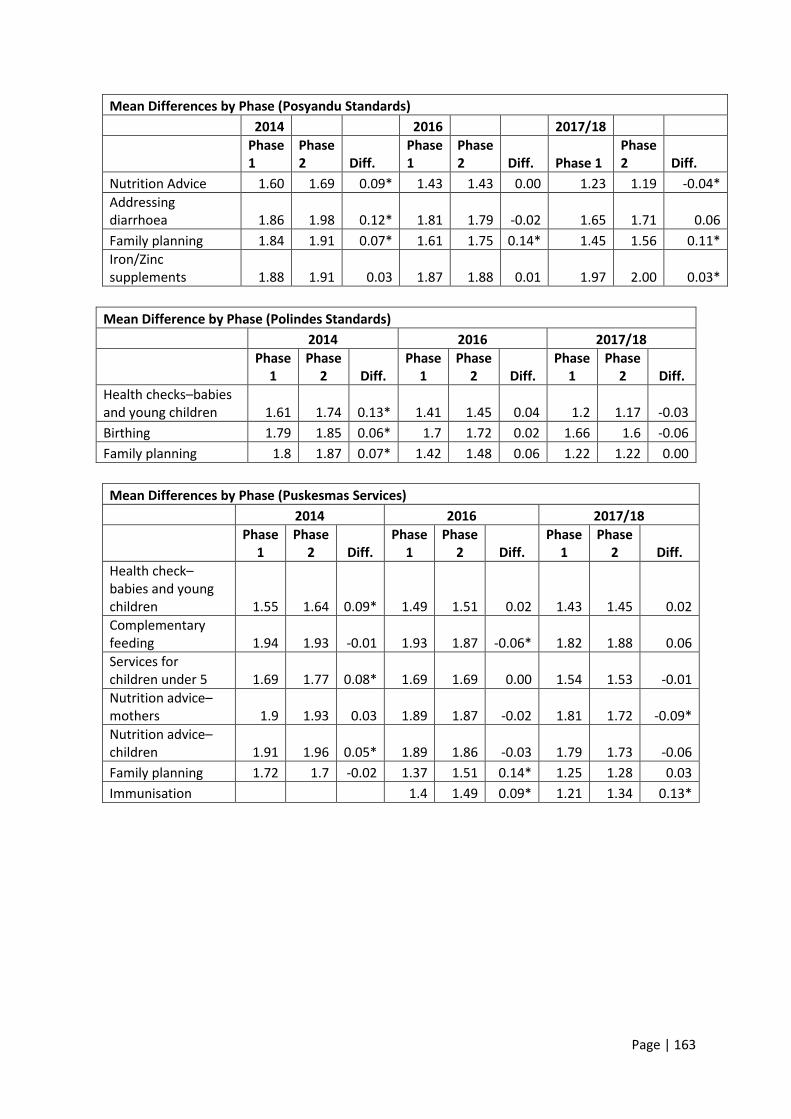
Page | 163
Mean Differences by Phase (Posyandu Standards)
2014 2016 2017/18
Phase 1
Phase 2 Diff.
Phase 1
Phase 2 Diff. Phase 1
Phase 2 Diff.
Nutrition Advice 1.60 1.69 0.09* 1.43 1.43 0.00 1.23 1.19 -0.04*
Addressing diarrhoea 1.86 1.98 0.12* 1.81 1.79 -0.02 1.65 1.71 0.06
Family planning 1.84 1.91 0.07* 1.61 1.75 0.14* 1.45 1.56 0.11*
Iron/Zinc supplements 1.88 1.91 0.03 1.87 1.88 0.01 1.97 2.00 0.03*
Mean Difference by Phase (Polindes Standards)
2014 2016 2017/18
Phase
1 Phase
2 Diff. Phase
1 Phase
2 Diff. Phase
1 Phase
2 Diff.
Health checks–babies and young children 1.61 1.74 0.13* 1.41 1.45 0.04 1.2 1.17 -0.03
Birthing 1.79 1.85 0.06* 1.7 1.72 0.02 1.66 1.6 -0.06
Family planning 1.8 1.87 0.07* 1.42 1.48 0.06 1.22 1.22 0.00
Mean Differences by Phase (Puskesmas Services)
2014 2016 2017/18
Phase
1 Phase
2 Diff. Phase
1 Phase
2 Diff. Phase
1 Phase
2 Diff.
Health check–babies and young children 1.55 1.64 0.09* 1.49 1.51 0.02 1.43 1.45 0.02
Complementary feeding 1.94 1.93 -0.01 1.93 1.87 -0.06* 1.82 1.88 0.06
Services for children under 5 1.69 1.77 0.08* 1.69 1.69 0.00 1.54 1.53 -0.01
Nutrition advice–mothers 1.9 1.93 0.03 1.89 1.87 -0.02 1.81 1.72 -0.09*
Nutrition advice–children 1.91 1.96 0.05* 1.89 1.86 -0.03 1.79 1.73 -0.06
Family planning 1.72 1.7 -0.02 1.37 1.51 0.14* 1.25 1.28 0.03
Immunisation 1.4 1.49 0.09* 1.21 1.34 0.13*

Page | 164
Mean Differences (Standards)
2014 2016 2017/18
Phase
1 Phase
2 Diff. Phase
1 Phase
2 Diff. Phase
1 Phase
2 Diff.
See a doctor 1.62 1.71 0.09* 1.5 1.53 0.03 1.25 1.31 0.06
Birthing 1.58 1.66 0.08* 1.31 1.33 0.02 1.1 1.11 0.01
Health check–babies and young children 1.69 1.78 0.09* 1.56 1.58 0.02 1.48 1.46 -0.02
Services for children under 5 1.75 1.83 0.08* 1.72 1.75 0.03 1.56 1.52 -0.04
Nutrition advice–mothers 1.91 1.94 0.03 1.88 1.89 0.01 1.81 1.74 -0.07*
Nutrition advice–children 1.92 1.96 0.04* 1.9 1.9 0.00 1.77 1.73 -0.04
Family planning 1.8 1.83 0.03 1.43 1.51 0.08* 1.24 1.2 -0.04
Immunisation 1.47 1.59 0.12* 1.23 1.3 0.07
Percentage who had heard of minimum standards Percentage who had heard of BPJS
Kupang TTU Sikka p. Kupang TTU Sikka p.
2014 28.4% 26.5% 35.3% .016 2014 52.0% 59.5% 86.8% .000
2015 39.0% 43.0% 48.5% 2015 91.0% 92.0% 98.0%
2016 56.2% 84.6% 52.3% .000 2016 99.0% 99.0% 96.5%
2017 62.6% 76.5% 74.0% .000 2017 98.5% 100.0% 100.0%
Percentage who were able to describe own eligibility for BPJS Percentage had trouble accessing BPJS
Kupang TTU Sikka p. Kupang TTU Sikka p.
2014 72.9% 69.7% 51.5% .016 2014 43.1% 51.5% 56.9% .022
2015 59.0% 59.7% 45.5% 2015 14.1% 30.8% 42.1% .001
2016 76.6% 37.2% 20.9% .000 2016 14.5% 39.1% 39.8% .000
2017 47.0% 58.2% 19.2% .000 2017 15.7% 23.0% 33.9% .000

Page | 165
Percentage of respondents reporting service being provided at Posyandu
2014 2015 2016 2017 Total Diff.
Immunisation Kupang 51.5% 72.0% 83.3% 77.7% 26.2
TTU 92.0% 85.0% 92.5% 99.0% 7.0
Sikka 14.7% 3.0% 19.6% 26.5% 11.8
p. .000 .000 .000 .000
Nutrition advice Kupang 18.1% 36.0% 47.3% 45.1% 27.0
TTU 46.0% 70.0% 85.0% 91.0% 45.0
Sikka 61.3% 65.3% 64.8% 88.5% 27.2
p. .000 .000 .000 .000
Weighing and measuring babies Kupang 80.4% 98.0% 100.0% 96.1% 15.7
TTU 98.5% 98.0% 99.5% 100.0% 1.5
Sikka 98.0% 99.0% 94.0% 98.0% 0.0
p. .000 .000 .019
Addressing diarrhoea Kupang 7.4% 1.0% 8.4% 14.1% 6.7
TTU 11.5% 27.0% 30.5% 53.0% 41.5
Sikka 10.8% 20.8% 17.1% 11.5% 0.7
p. .000 .000 .000
Family planning Kupang 7.8% 18.0% 25.6% 26.7% 18.9
TTU 15.5% 16.0% 34.5% 51.5% 36.0
Sikka 14.2% 19.8% 10.1% 27.0% 12.8
p. .044 .000 .000
Vitamin A distribution Kupang 24.0% 28.0% 34.0% 41.3% 17.3
TTU 64.0% 68.0% 76.0% 95.5% 31.5
Sikka 38.7% 37.6% 18.6% 67.5% 28.8
p. .000 .000 .000 .000
Supplementary feeding Kupang 41.2% 35.0% 44.3% 49.0% 7.8
TTU 66.5% 67.0% 70.5% 78.0% 11.5
Sikka 62.7% 64.4% 75.4% 92.0% 29.3
p. .000 .000 .000 .000
Health checks for pregnant women Kupang 20.1% 6.0% 14.1% 7.8% -12.3
TTU 57.0% 37.0% 59.0% 86.5% 29.5
Sikka 24.5% 4.0% 5.5% 7.5% -17.0
p. .000 .000 .000 .000
TT injection for pregnant mothers Kupang 7.4% 2.0% 12.3% 8.3% 0.9
TTU 43.0% 14.0% 29.0% 63.0% 20.0
Sikka 4.4% 3.0% 5.5% 13.0% 8.6
p. .000 .000 .000 .000
Iron/Zinc Kupang 15.7% 0.0% 0.5% 0.5% -15.2
TTU 33.0% 0.0% 0.0% 0.0% -33.0
Sikka 7.8% 1.0% 1.0% 0.0% -7.8
p. .000
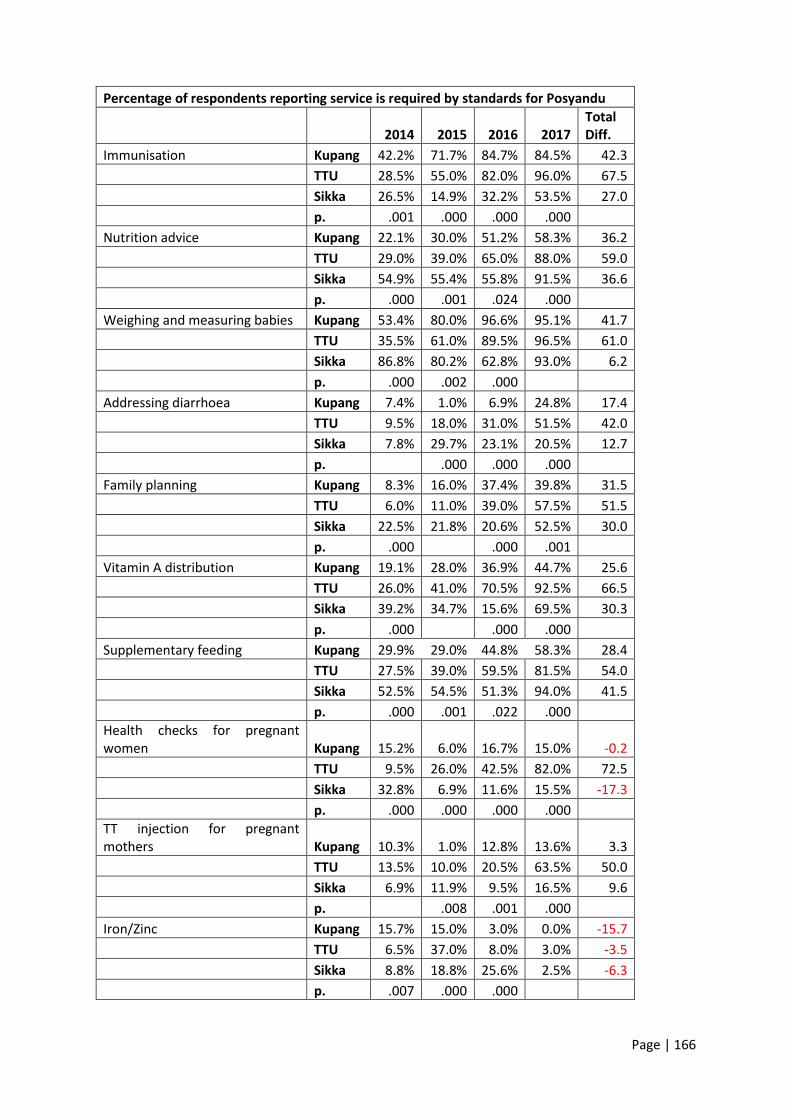
Page | 166
Percentage of respondents reporting service is required by standards for Posyandu
2014 2015 2016 2017 Total Diff.
Immunisation Kupang 42.2% 71.7% 84.7% 84.5% 42.3
TTU 28.5% 55.0% 82.0% 96.0% 67.5
Sikka 26.5% 14.9% 32.2% 53.5% 27.0
p. .001 .000 .000 .000
Nutrition advice Kupang 22.1% 30.0% 51.2% 58.3% 36.2
TTU 29.0% 39.0% 65.0% 88.0% 59.0
Sikka 54.9% 55.4% 55.8% 91.5% 36.6
p. .000 .001 .024 .000
Weighing and measuring babies Kupang 53.4% 80.0% 96.6% 95.1% 41.7
TTU 35.5% 61.0% 89.5% 96.5% 61.0
Sikka 86.8% 80.2% 62.8% 93.0% 6.2
p. .000 .002 .000
Addressing diarrhoea Kupang 7.4% 1.0% 6.9% 24.8% 17.4
TTU 9.5% 18.0% 31.0% 51.5% 42.0
Sikka 7.8% 29.7% 23.1% 20.5% 12.7
p. .000 .000 .000
Family planning Kupang 8.3% 16.0% 37.4% 39.8% 31.5
TTU 6.0% 11.0% 39.0% 57.5% 51.5
Sikka 22.5% 21.8% 20.6% 52.5% 30.0
p. .000 .000 .001
Vitamin A distribution Kupang 19.1% 28.0% 36.9% 44.7% 25.6
TTU 26.0% 41.0% 70.5% 92.5% 66.5
Sikka 39.2% 34.7% 15.6% 69.5% 30.3
p. .000 .000 .000
Supplementary feeding Kupang 29.9% 29.0% 44.8% 58.3% 28.4
TTU 27.5% 39.0% 59.5% 81.5% 54.0
Sikka 52.5% 54.5% 51.3% 94.0% 41.5
p. .000 .001 .022 .000
Health checks for pregnant women Kupang 15.2% 6.0% 16.7% 15.0% -0.2
TTU 9.5% 26.0% 42.5% 82.0% 72.5
Sikka 32.8% 6.9% 11.6% 15.5% -17.3
p. .000 .000 .000 .000
TT injection for pregnant mothers Kupang 10.3% 1.0% 12.8% 13.6% 3.3
TTU 13.5% 10.0% 20.5% 63.5% 50.0
Sikka 6.9% 11.9% 9.5% 16.5% 9.6
p. .008 .001 .000
Iron/Zinc Kupang 15.7% 15.0% 3.0% 0.0% -15.7
TTU 6.5% 37.0% 8.0% 3.0% -3.5
Sikka 8.8% 18.8% 25.6% 2.5% -6.3
p. .007 .000 .000
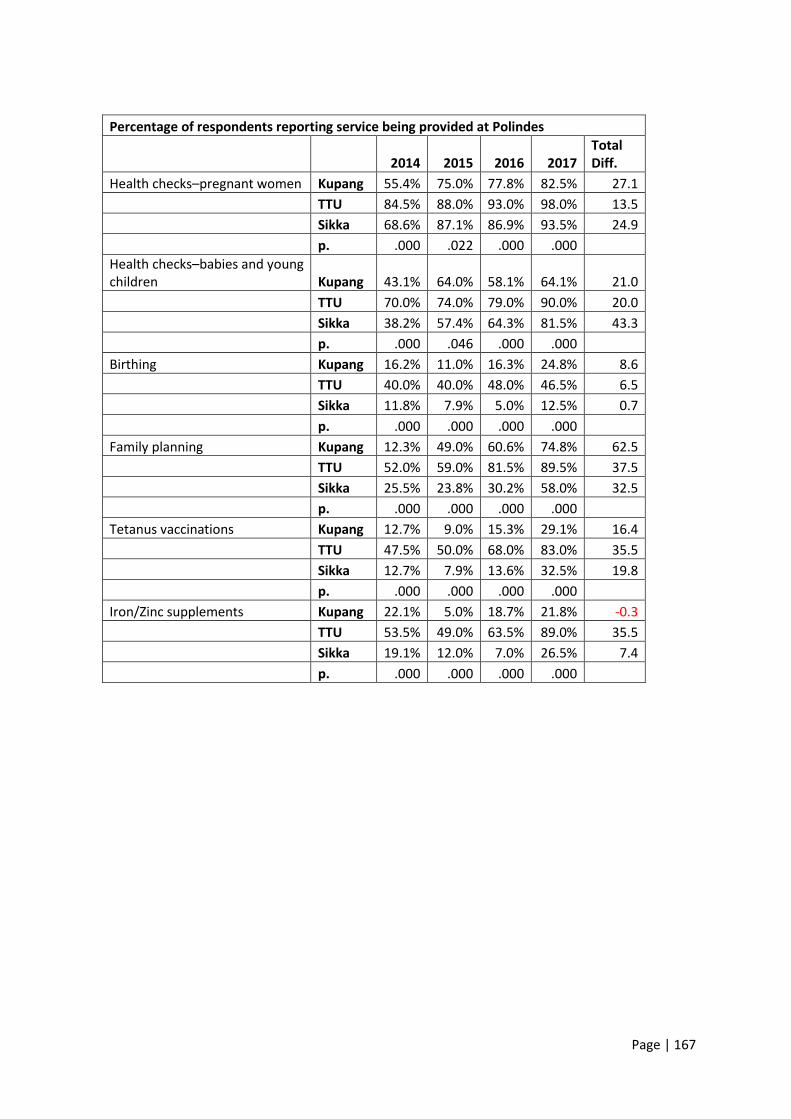
Page | 167
Percentage of respondents reporting service being provided at Polindes
2014 2015 2016 2017 Total Diff.
Health checks–pregnant women Kupang 55.4% 75.0% 77.8% 82.5% 27.1
TTU 84.5% 88.0% 93.0% 98.0% 13.5
Sikka 68.6% 87.1% 86.9% 93.5% 24.9
p. .000 .022 .000 .000
Health checks–babies and young children Kupang 43.1% 64.0% 58.1% 64.1% 21.0
TTU 70.0% 74.0% 79.0% 90.0% 20.0
Sikka 38.2% 57.4% 64.3% 81.5% 43.3
p. .000 .046 .000 .000
Birthing Kupang 16.2% 11.0% 16.3% 24.8% 8.6
TTU 40.0% 40.0% 48.0% 46.5% 6.5
Sikka 11.8% 7.9% 5.0% 12.5% 0.7
p. .000 .000 .000 .000
Family planning Kupang 12.3% 49.0% 60.6% 74.8% 62.5
TTU 52.0% 59.0% 81.5% 89.5% 37.5
Sikka 25.5% 23.8% 30.2% 58.0% 32.5
p. .000 .000 .000 .000
Tetanus vaccinations Kupang 12.7% 9.0% 15.3% 29.1% 16.4
TTU 47.5% 50.0% 68.0% 83.0% 35.5
Sikka 12.7% 7.9% 13.6% 32.5% 19.8
p. .000 .000 .000 .000
Iron/Zinc supplements Kupang 22.1% 5.0% 18.7% 21.8% -0.3
TTU 53.5% 49.0% 63.5% 89.0% 35.5
Sikka 19.1% 12.0% 7.0% 26.5% 7.4
p. .000 .000 .000 .000
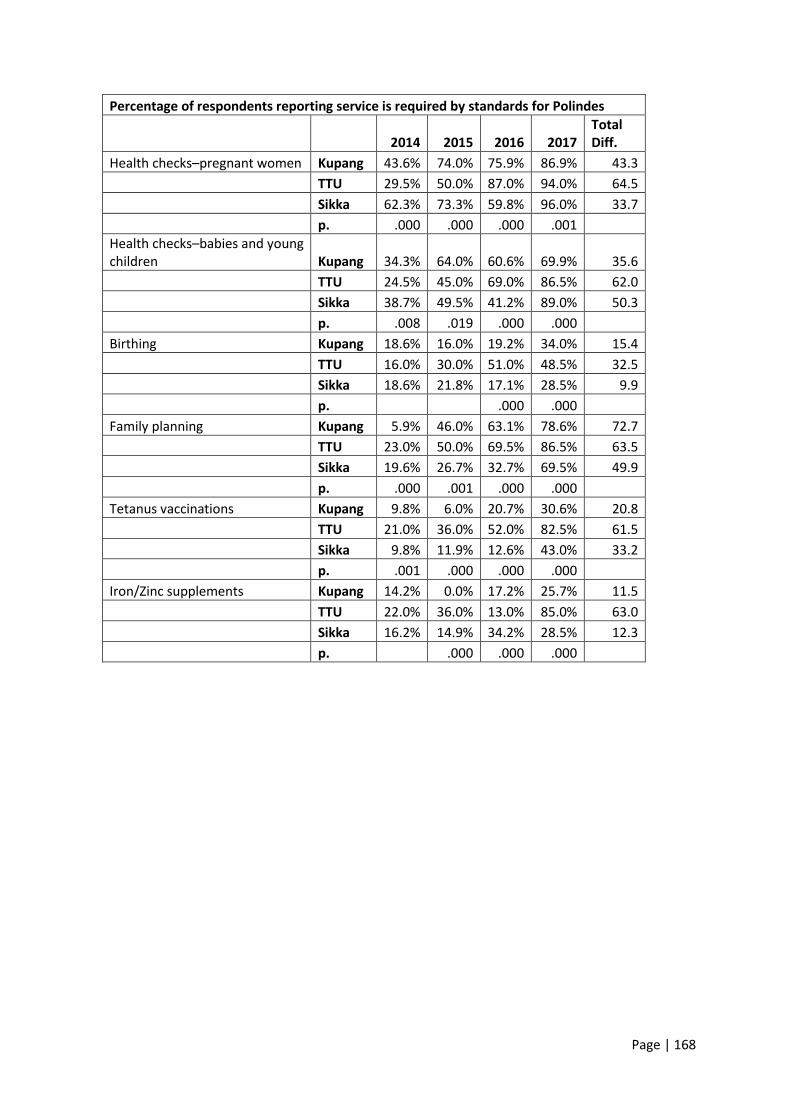
Page | 168
Percentage of respondents reporting service is required by standards for Polindes
2014 2015 2016 2017 Total Diff.
Health checks–pregnant women Kupang 43.6% 74.0% 75.9% 86.9% 43.3
TTU 29.5% 50.0% 87.0% 94.0% 64.5
Sikka 62.3% 73.3% 59.8% 96.0% 33.7
p. .000 .000 .000 .001
Health checks–babies and young children Kupang 34.3% 64.0% 60.6% 69.9% 35.6
TTU 24.5% 45.0% 69.0% 86.5% 62.0
Sikka 38.7% 49.5% 41.2% 89.0% 50.3
p. .008 .019 .000 .000
Birthing Kupang 18.6% 16.0% 19.2% 34.0% 15.4
TTU 16.0% 30.0% 51.0% 48.5% 32.5
Sikka 18.6% 21.8% 17.1% 28.5% 9.9
p. .000 .000
Family planning Kupang 5.9% 46.0% 63.1% 78.6% 72.7
TTU 23.0% 50.0% 69.5% 86.5% 63.5
Sikka 19.6% 26.7% 32.7% 69.5% 49.9
p. .000 .001 .000 .000
Tetanus vaccinations Kupang 9.8% 6.0% 20.7% 30.6% 20.8
TTU 21.0% 36.0% 52.0% 82.5% 61.5
Sikka 9.8% 11.9% 12.6% 43.0% 33.2
p. .001 .000 .000 .000
Iron/Zinc supplements Kupang 14.2% 0.0% 17.2% 25.7% 11.5
TTU 22.0% 36.0% 13.0% 85.0% 63.0
Sikka 16.2% 14.9% 34.2% 28.5% 12.3
p. .000 .000 .000
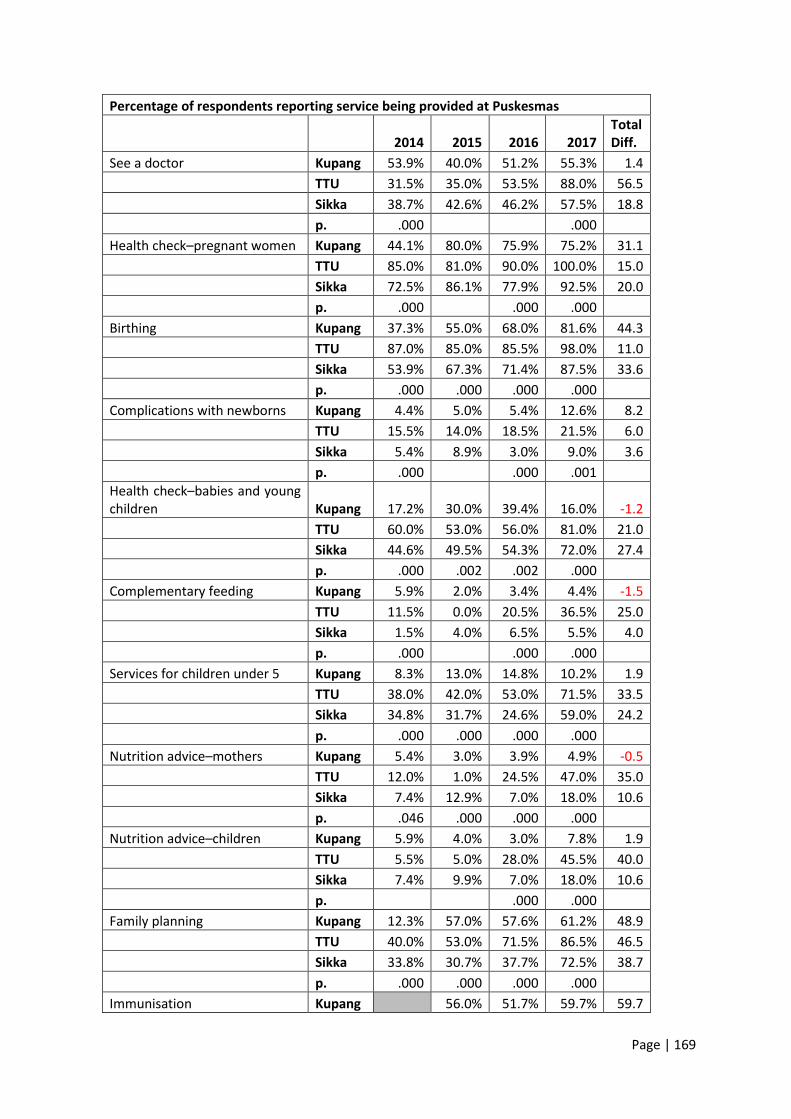
Page | 169
Percentage of respondents reporting service being provided at Puskesmas
2014 2015 2016 2017 Total Diff.
See a doctor Kupang 53.9% 40.0% 51.2% 55.3% 1.4
TTU 31.5% 35.0% 53.5% 88.0% 56.5
Sikka 38.7% 42.6% 46.2% 57.5% 18.8
p. .000 .000
Health check–pregnant women Kupang 44.1% 80.0% 75.9% 75.2% 31.1
TTU 85.0% 81.0% 90.0% 100.0% 15.0
Sikka 72.5% 86.1% 77.9% 92.5% 20.0
p. .000 .000 .000
Birthing Kupang 37.3% 55.0% 68.0% 81.6% 44.3
TTU 87.0% 85.0% 85.5% 98.0% 11.0
Sikka 53.9% 67.3% 71.4% 87.5% 33.6
p. .000 .000 .000 .000
Complications with newborns Kupang 4.4% 5.0% 5.4% 12.6% 8.2
TTU 15.5% 14.0% 18.5% 21.5% 6.0
Sikka 5.4% 8.9% 3.0% 9.0% 3.6
p. .000 .000 .001
Health check–babies and young children Kupang 17.2% 30.0% 39.4% 16.0% -1.2
TTU 60.0% 53.0% 56.0% 81.0% 21.0
Sikka 44.6% 49.5% 54.3% 72.0% 27.4
p. .000 .002 .002 .000
Complementary feeding Kupang 5.9% 2.0% 3.4% 4.4% -1.5
TTU 11.5% 0.0% 20.5% 36.5% 25.0
Sikka 1.5% 4.0% 6.5% 5.5% 4.0
p. .000 .000 .000
Services for children under 5 Kupang 8.3% 13.0% 14.8% 10.2% 1.9
TTU 38.0% 42.0% 53.0% 71.5% 33.5
Sikka 34.8% 31.7% 24.6% 59.0% 24.2
p. .000 .000 .000 .000
Nutrition advice–mothers Kupang 5.4% 3.0% 3.9% 4.9% -0.5
TTU 12.0% 1.0% 24.5% 47.0% 35.0
Sikka 7.4% 12.9% 7.0% 18.0% 10.6
p. .046 .000 .000 .000
Nutrition advice–children Kupang 5.9% 4.0% 3.0% 7.8% 1.9
TTU 5.5% 5.0% 28.0% 45.5% 40.0
Sikka 7.4% 9.9% 7.0% 18.0% 10.6
p. .000 .000
Family planning Kupang 12.3% 57.0% 57.6% 61.2% 48.9
TTU 40.0% 53.0% 71.5% 86.5% 46.5
Sikka 33.8% 30.7% 37.7% 72.5% 38.7
p. .000 .000 .000 .000
Immunisation Kupang 56.0% 51.7% 59.7% 59.7
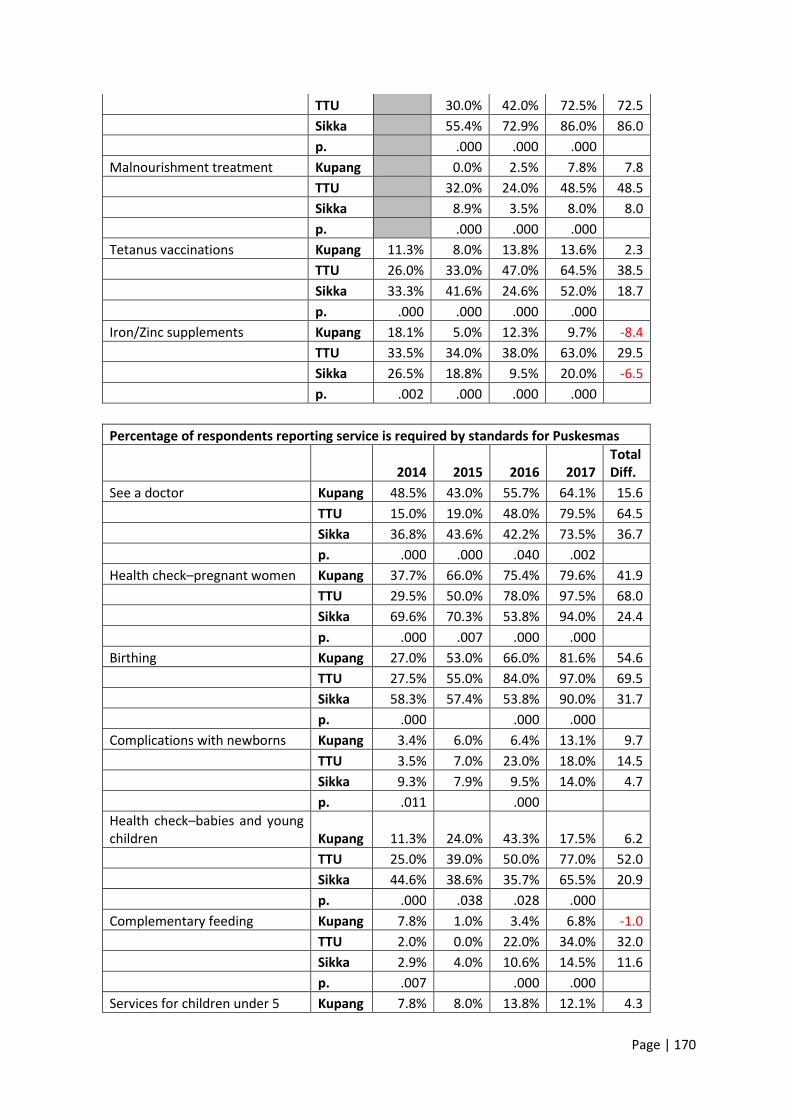
Page | 170
TTU 30.0% 42.0% 72.5% 72.5
Sikka 55.4% 72.9% 86.0% 86.0
p. .000 .000 .000
Malnourishment treatment Kupang 0.0% 2.5% 7.8% 7.8
TTU 32.0% 24.0% 48.5% 48.5
Sikka 8.9% 3.5% 8.0% 8.0
p. .000 .000 .000
Tetanus vaccinations Kupang 11.3% 8.0% 13.8% 13.6% 2.3
TTU 26.0% 33.0% 47.0% 64.5% 38.5
Sikka 33.3% 41.6% 24.6% 52.0% 18.7
p. .000 .000 .000 .000
Iron/Zinc supplements Kupang 18.1% 5.0% 12.3% 9.7% -8.4
TTU 33.5% 34.0% 38.0% 63.0% 29.5
Sikka 26.5% 18.8% 9.5% 20.0% -6.5
p. .002 .000 .000 .000
Percentage of respondents reporting service is required by standards for Puskesmas
2014 2015 2016 2017 Total Diff.
See a doctor Kupang 48.5% 43.0% 55.7% 64.1% 15.6
TTU 15.0% 19.0% 48.0% 79.5% 64.5
Sikka 36.8% 43.6% 42.2% 73.5% 36.7
p. .000 .000 .040 .002
Health check–pregnant women Kupang 37.7% 66.0% 75.4% 79.6% 41.9
TTU 29.5% 50.0% 78.0% 97.5% 68.0
Sikka 69.6% 70.3% 53.8% 94.0% 24.4
p. .000 .007 .000 .000
Birthing Kupang 27.0% 53.0% 66.0% 81.6% 54.6
TTU 27.5% 55.0% 84.0% 97.0% 69.5
Sikka 58.3% 57.4% 53.8% 90.0% 31.7
p. .000 .000 .000
Complications with newborns Kupang 3.4% 6.0% 6.4% 13.1% 9.7
TTU 3.5% 7.0% 23.0% 18.0% 14.5
Sikka 9.3% 7.9% 9.5% 14.0% 4.7
p. .011 .000
Health check–babies and young children Kupang 11.3% 24.0% 43.3% 17.5% 6.2
TTU 25.0% 39.0% 50.0% 77.0% 52.0
Sikka 44.6% 38.6% 35.7% 65.5% 20.9
p. .000 .038 .028 .000
Complementary feeding Kupang 7.8% 1.0% 3.4% 6.8% -1.0
TTU 2.0% 0.0% 22.0% 34.0% 32.0
Sikka 2.9% 4.0% 10.6% 14.5% 11.6
p. .007 .000 .000
Services for children under 5 Kupang 7.8% 8.0% 13.8% 12.1% 4.3
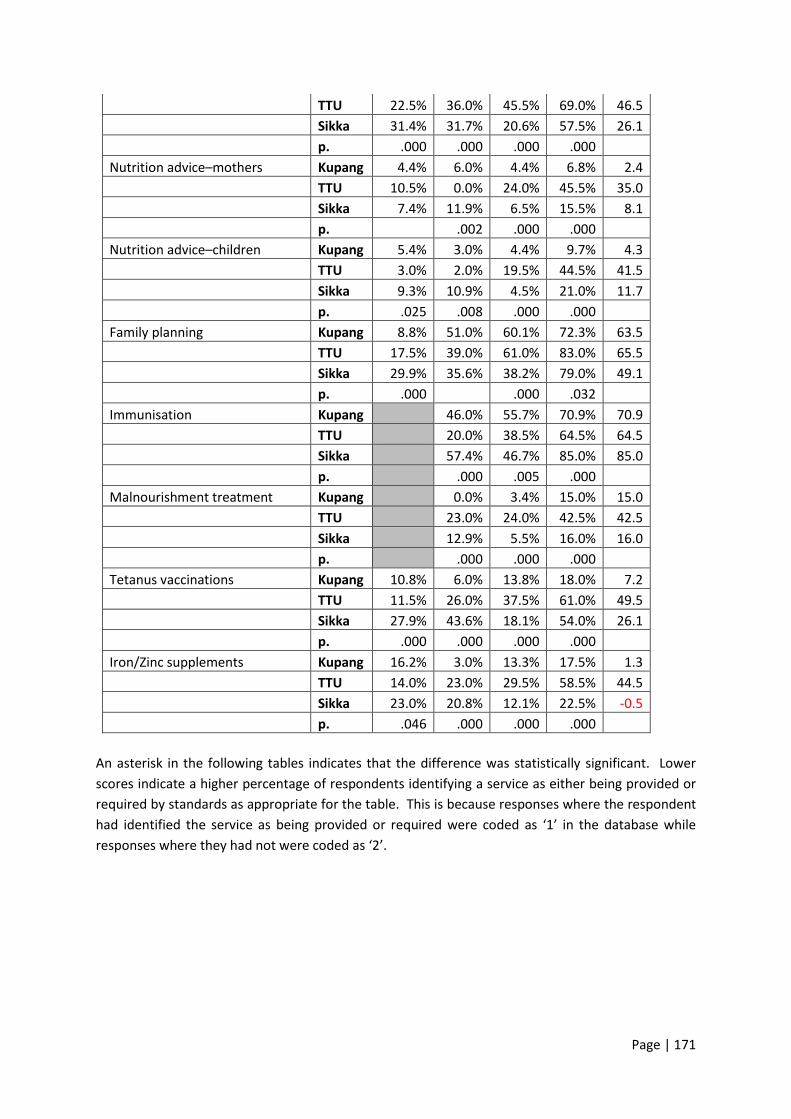
Page | 171
TTU 22.5% 36.0% 45.5% 69.0% 46.5
Sikka 31.4% 31.7% 20.6% 57.5% 26.1
p. .000 .000 .000 .000
Nutrition advice–mothers Kupang 4.4% 6.0% 4.4% 6.8% 2.4
TTU 10.5% 0.0% 24.0% 45.5% 35.0
Sikka 7.4% 11.9% 6.5% 15.5% 8.1
p. .002 .000 .000
Nutrition advice–children Kupang 5.4% 3.0% 4.4% 9.7% 4.3
TTU 3.0% 2.0% 19.5% 44.5% 41.5
Sikka 9.3% 10.9% 4.5% 21.0% 11.7
p. .025 .008 .000 .000
Family planning Kupang 8.8% 51.0% 60.1% 72.3% 63.5
TTU 17.5% 39.0% 61.0% 83.0% 65.5
Sikka 29.9% 35.6% 38.2% 79.0% 49.1
p. .000 .000 .032
Immunisation Kupang 46.0% 55.7% 70.9% 70.9
TTU 20.0% 38.5% 64.5% 64.5
Sikka 57.4% 46.7% 85.0% 85.0
p. .000 .005 .000
Malnourishment treatment Kupang 0.0% 3.4% 15.0% 15.0
TTU 23.0% 24.0% 42.5% 42.5
Sikka 12.9% 5.5% 16.0% 16.0
p. .000 .000 .000
Tetanus vaccinations Kupang 10.8% 6.0% 13.8% 18.0% 7.2
TTU 11.5% 26.0% 37.5% 61.0% 49.5
Sikka 27.9% 43.6% 18.1% 54.0% 26.1
p. .000 .000 .000 .000
Iron/Zinc supplements Kupang 16.2% 3.0% 13.3% 17.5% 1.3
TTU 14.0% 23.0% 29.5% 58.5% 44.5
Sikka 23.0% 20.8% 12.1% 22.5% -0.5
p. .046 .000 .000 .000
An asterisk in the following tables indicates that the difference was statistically significant. Lower
scores indicate a higher percentage of respondents identifying a service as either being provided or
required by standards as appropriate for the table. This is because responses where the respondent
had identified the service as being provided or required were coded as ‘1’ in the database while
responses where they had not were coded as ‘2’.

Page | 172
Mean scores by phase - BPJS and Minimum standards, all districts
2014 2016 2017
Phase 1
Phase 2 Diff.
Phase 1
Phase 2 Diff.
Phase 1
Phase 2 Diff.
Heard of BPJS 1.50 1.59 0.09 1.01 1.04 0.03 1.01 1.01 0.00
Had trouble accessing health services due to money 1.52 1.48 -0.04 1.67 1.70 0.03 1.73 1.80 0.07
Have BPJS/JKN card 1.27 1.42 0.15* 1.25 1.39 0.14*
Heard of minimum standards for MCH services 2.01 2.01 0.00 1.45 1.45 0.00 1.34 1.38 0.04
Mean Scores for services provided at Posyandu, all districts
2014 2016 2017
Phase 1
Phase 2 Diff.
Phase 1
Phase 2 Diff.
Phase 1
Phase 2 Diff.
Immunisation 1.54 1.41 -0.13* 1.39 1.30 -0.09* 1.40 1.24 -.0.16*
Nutrition Advice 1.54 1.63 0.09* 1.34 1.35 0.01 1.27 1.24 -0.03
Weighing and measuring babies 1.09 1.07 -0.02 1.01 1.03 0.02 1.03 1.01 -0.02
Addressing diarrhoea 1.86 1.94 0.08* 1.83 1.79 -0.04 1.71 1.77 0.06
Family planning 1.83 1.92 0.09* 1.73 1.80 0.07* 1.60 1.71 0.11*
Provision of Vitamin A 1.57 1.59 0.02 1.55 1.59 0.04 1.29 1.36 0.07
Supplementary feeding 1.41 1.46 0.05 1.34 1.40 0.06 1.24 1.31 0.07
Health checks for pregnant women 1.67 1.65 -0.02 1.76 1.71 -0.05 1.66 1.67 0.01
Tetanus vaccinations 1.84 1.80 -0.04 1.86 1.82 -0.04 1.72 1.72 0.00
Iron/Zinc supplements 1.83 1.80 -0.03 1.99 2.00 0.01 2.00 2.00 0.00

Page | 173
Mean scores for whether services are required by standards for Posyandu, all districts
2014 2016 2017
Phase 1
Phase 2 Diff.
Phase 1
Phase 2 Diff.
Phase 1
Phase 2 Diff.
Immunisation 1.67 1.68 0.01 1.35 1.32 -0.03 1.28 1.16 -0.12
Nutrition Advice 1.60 1.69 0.09* 1.43 1.43 0.00 1.23 1.19 -0.04*
Weighing and measuring babies 1.38 1.44 0.06 1.17 1.17 0.00 1.07 1.03 -0.04
Addressing diarrhoea 1.86 1.98 0.12* 1.81 1.79 -0.02 1.65 1.71 0.06
Family planning 1.84 1.91 0.07* 1.61 1.75 0.14* 1.45 1.56 0.11*
Provision of Vitamin A 1.69 1.75 0.06 1.60 1.58 -0.02 1.31 1.32 0.01
Supplementary feeding 1.61 1.66 0.05 1.46 1.50 0.04 1.24 1.20 -0.04
Health checks for pregnant women 1.78 1.83 0.05 1.77 1.76 -0.01 1.62 1.63 0.01
Tetanus vaccinations 1.90 1.89 -0.01 1.86 1.85 -0.01 1.71 1.67 -0.04
Iron/Zinc supplements 1.88 1.91 0.03 1.87 1.88 0.01 1.97 2.00 0.03*
Mean Scores for services provided at Polindes, all districts
2014 2016 2017
Phase 1
Phase 2 Diff.
Phase 1
Phase 2 Diff.
Phase 1
Phase 2 Diff.
Health checks–pregnant women 1.33 1.28 -0.05 1.14 1.14 0.00 1.09 1.09 0.00
Health checks–babies and young children 1.47 1.53 0.06 1.3 1.36 0.06 1.23 1.2 -0.03
Birthing 1.78 1.77 -0.01 1.77 1.77 0.00 1.76 1.68 -0.08
Family planning 1.68 1.72 0.04 1.37 1.48 0.11 1.25 1.27 0.02
Tetanus vaccinations 1.74 1.78 0.04 1.69 1.67 -0.02 1.5 1.55 0.05
Iron/Zinc supplements 1.68 1.7 0.02 1.7 1.7 0.00 1.53 1.56 0.03
Mean scores for whether services are required by standards for Polindes, all districts
2014 2016 2017
Phase 1
Phase 2 Diff.
Phase 1
Phase 2 Diff.
Phase 1
Phase 2 Diff.
Health checks–pregnant women 1.52 1.57 0.05 1.25 1.26 0.01 1.09 1.07 -0.02
Health checks–babies and young children 1.61 1.74 0.13* 1.41 1.45 0.04 1.2 1.17 -0.03
Birthing 1.79 1.85 0.06* 1.7 1.72 0.02 1.66 1.6 -0.06
Family planning 1.8 1.87 0.07* 1.42 1.48 0.06 1.22 1.22 0.00
Tetanus vaccinations 1.84 1.89 0.05 1.72 1.71 -0.01 1.46 1.51 0.05
Iron/Zinc supplements 1.8 1.85 0.05 1.79 1.79 0.00 1.52 1.56 0.04
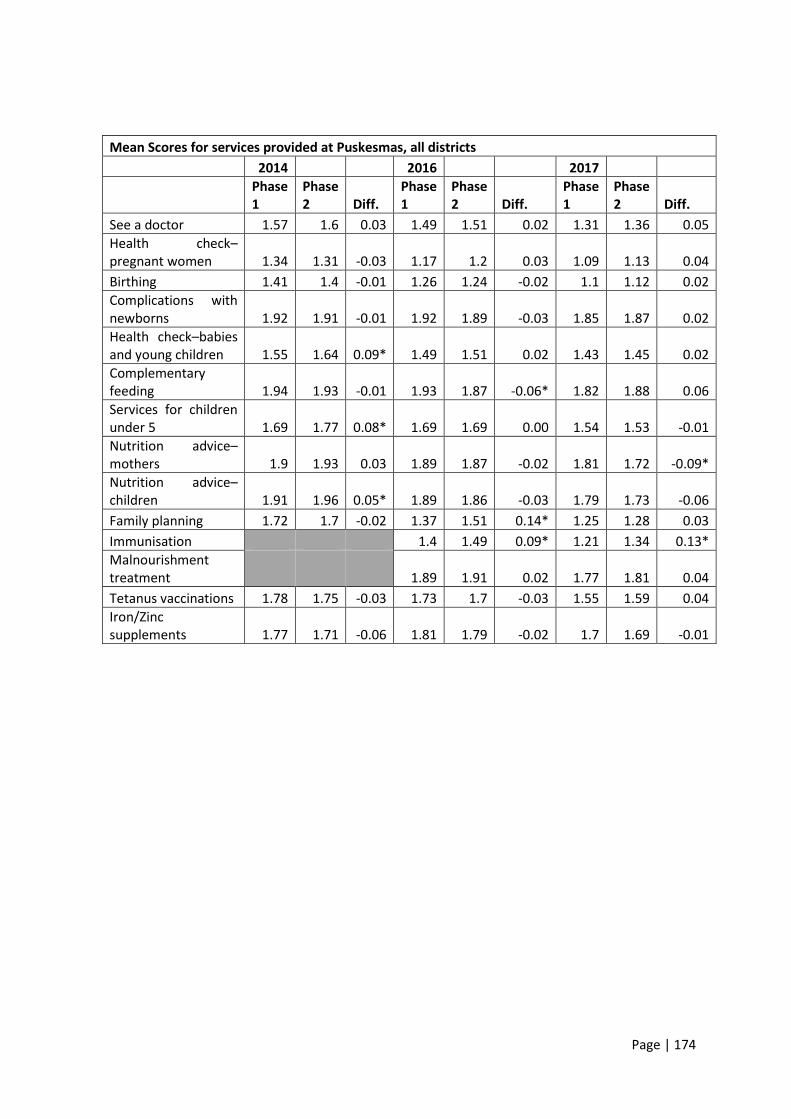
Page | 174
Mean Scores for services provided at Puskesmas, all districts
2014 2016 2017
Phase 1
Phase 2 Diff.
Phase 1
Phase 2 Diff.
Phase 1
Phase 2 Diff.
See a doctor 1.57 1.6 0.03 1.49 1.51 0.02 1.31 1.36 0.05
Health check–pregnant women 1.34 1.31 -0.03 1.17 1.2 0.03 1.09 1.13 0.04
Birthing 1.41 1.4 -0.01 1.26 1.24 -0.02 1.1 1.12 0.02
Complications with newborns 1.92 1.91 -0.01 1.92 1.89 -0.03 1.85 1.87 0.02
Health check–babies and young children 1.55 1.64 0.09* 1.49 1.51 0.02 1.43 1.45 0.02
Complementary feeding 1.94 1.93 -0.01 1.93 1.87 -0.06* 1.82 1.88 0.06
Services for children under 5 1.69 1.77 0.08* 1.69 1.69 0.00 1.54 1.53 -0.01
Nutrition advice–mothers 1.9 1.93 0.03 1.89 1.87 -0.02 1.81 1.72 -0.09*
Nutrition advice–children 1.91 1.96 0.05* 1.89 1.86 -0.03 1.79 1.73 -0.06
Family planning 1.72 1.7 -0.02 1.37 1.51 0.14* 1.25 1.28 0.03
Immunisation 1.4 1.49 0.09* 1.21 1.34 0.13*
Malnourishment treatment 1.89 1.91 0.02 1.77 1.81 0.04
Tetanus vaccinations 1.78 1.75 -0.03 1.73 1.7 -0.03 1.55 1.59 0.04
Iron/Zinc supplements 1.77 1.71 -0.06 1.81 1.79 -0.02 1.7 1.69 -0.01
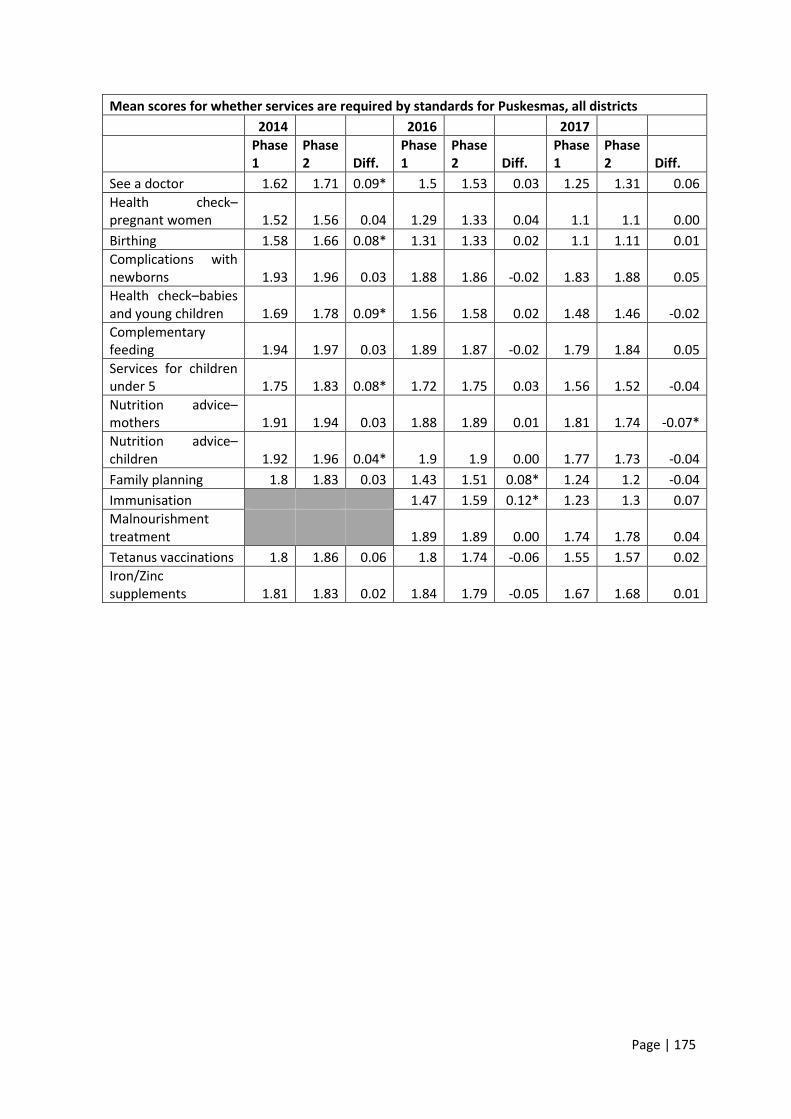
Page | 175
Mean scores for whether services are required by standards for Puskesmas, all districts
2014 2016 2017
Phase 1
Phase 2 Diff.
Phase 1
Phase 2 Diff.
Phase 1
Phase 2 Diff.
See a doctor 1.62 1.71 0.09* 1.5 1.53 0.03 1.25 1.31 0.06
Health check–pregnant women 1.52 1.56 0.04 1.29 1.33 0.04 1.1 1.1 0.00
Birthing 1.58 1.66 0.08* 1.31 1.33 0.02 1.1 1.11 0.01
Complications with newborns 1.93 1.96 0.03 1.88 1.86 -0.02 1.83 1.88 0.05
Health check–babies and young children 1.69 1.78 0.09* 1.56 1.58 0.02 1.48 1.46 -0.02
Complementary feeding 1.94 1.97 0.03 1.89 1.87 -0.02 1.79 1.84 0.05
Services for children under 5 1.75 1.83 0.08* 1.72 1.75 0.03 1.56 1.52 -0.04
Nutrition advice–mothers 1.91 1.94 0.03 1.88 1.89 0.01 1.81 1.74 -0.07*
Nutrition advice–children 1.92 1.96 0.04* 1.9 1.9 0.00 1.77 1.73 -0.04
Family planning 1.8 1.83 0.03 1.43 1.51 0.08* 1.24 1.2 -0.04
Immunisation 1.47 1.59 0.12* 1.23 1.3 0.07
Malnourishment treatment 1.89 1.89 0.00 1.74 1.78 0.04
Tetanus vaccinations 1.8 1.86 0.06 1.8 1.74 -0.06 1.55 1.57 0.02
Iron/Zinc supplements 1.81 1.83 0.02 1.84 1.79 -0.05 1.67 1.68 0.01
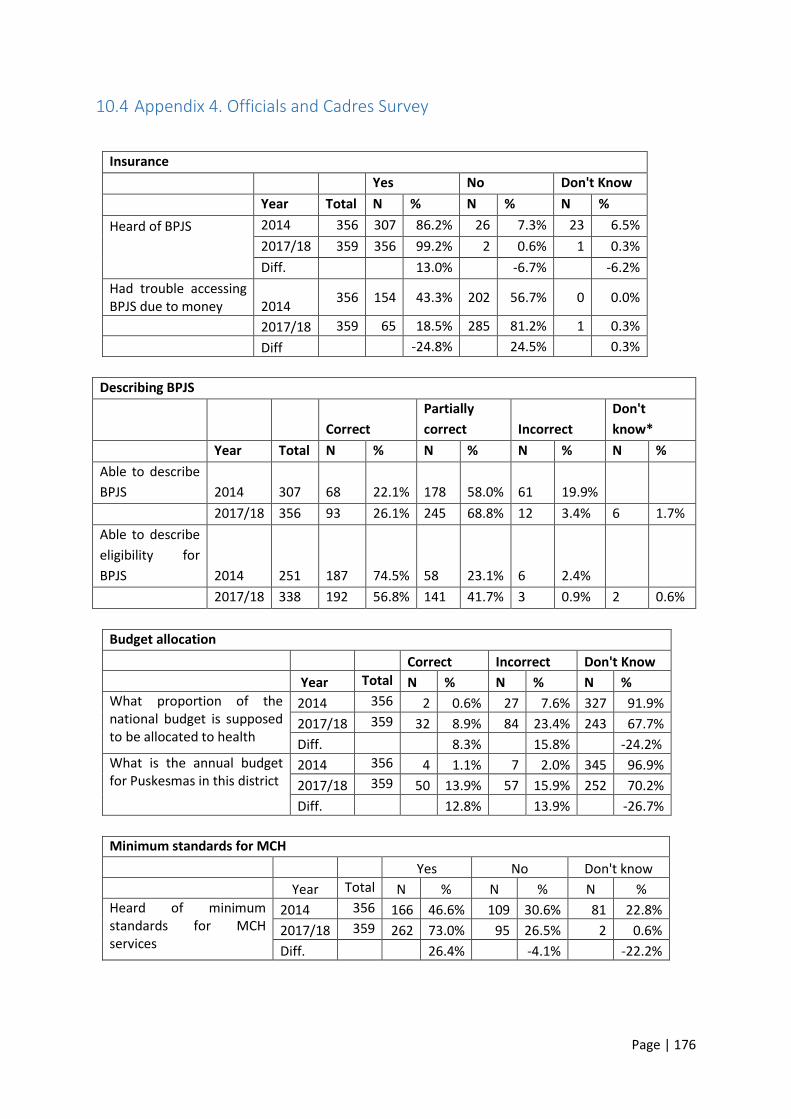
Page | 176
10.4 Appendix 4. Officials and Cadres Survey
Insurance
Yes No Don't Know
Year Total N % N % N %
Heard of BPJS
2014 356 307 86.2% 26 7.3% 23 6.5%
2017/18 359 356 99.2% 2 0.6% 1 0.3%
Diff. 13.0% -6.7% -6.2%
Had trouble accessing BPJS due to money 2014
356 154 43.3% 202 56.7% 0 0.0%
2017/18 359 65 18.5% 285 81.2% 1 0.3%
Diff -24.8% 24.5% 0.3%
Describing BPJS
Correct
Partially
correct Incorrect
Don't
know*
Year Total N % N % N % N %
Able to describe
BPJS 2014 307 68 22.1% 178 58.0% 61 19.9%
2017/18 356 93 26.1% 245 68.8% 12 3.4% 6 1.7%
Able to describe
eligibility for
BPJS 2014 251 187 74.5% 58 23.1% 6 2.4%
2017/18 338 192 56.8% 141 41.7% 3 0.9% 2 0.6%
Budget allocation
Correct Incorrect Don't Know
Year Total N % N % N %
What proportion of the national budget is supposed to be allocated to health
2014 356 2 0.6% 27 7.6% 327 91.9%
2017/18 359 32 8.9% 84 23.4% 243 67.7%
Diff. 8.3% 15.8% -24.2%
What is the annual budget for Puskesmas in this district
2014 356 4 1.1% 7 2.0% 345 96.9%
2017/18 359 50 13.9% 57 15.9% 252 70.2%
Diff. 12.8% 13.9% -26.7%
Minimum standards for MCH
Yes No Don't know
Year Total N % N % N %
Heard of minimum standards for MCH services
2014 356 166 46.6% 109 30.6% 81 22.8%
2017/18 359 262 73.0% 95 26.5% 2 0.6%
Diff. 26.4% -4.1% -22.2%
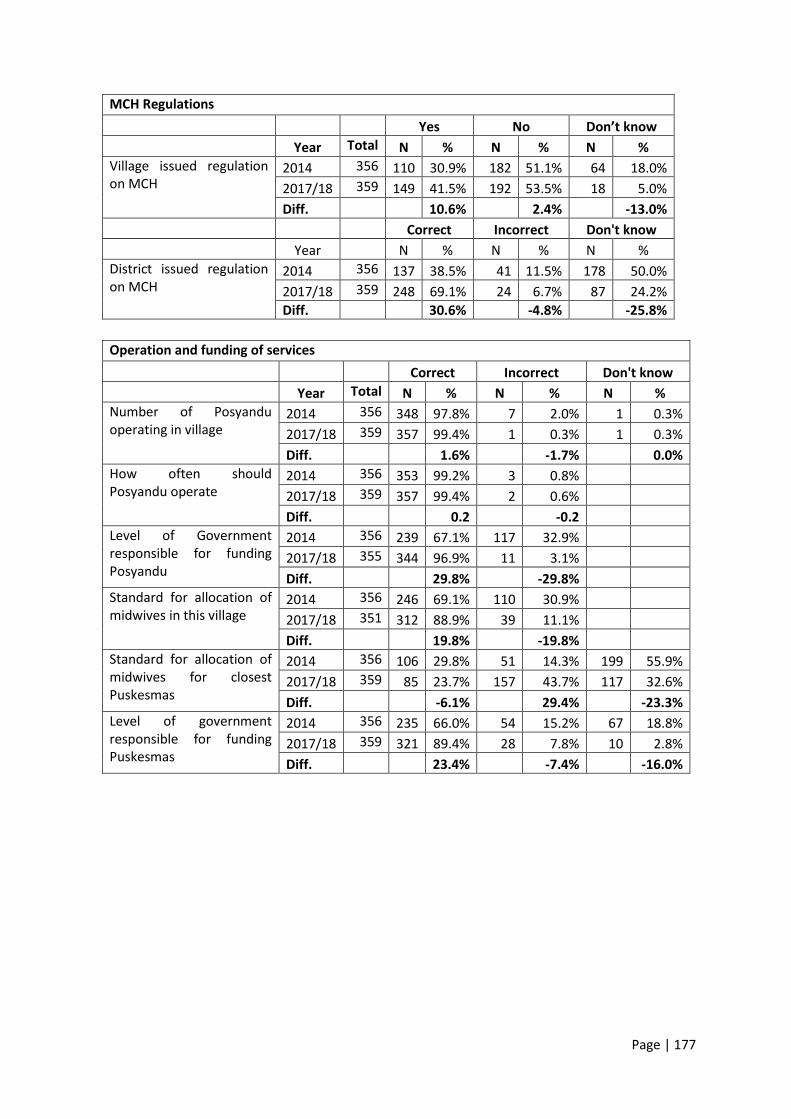
Page | 177
MCH Regulations
Yes No Don’t know
Year Total N % N % N %
Village issued regulation on MCH
2014 356 110 30.9% 182 51.1% 64 18.0%
2017/18 359 149 41.5% 192 53.5% 18 5.0%
Diff. 10.6% 2.4% -13.0%
Correct Incorrect Don't know
Year N % N % N %
District issued regulation on MCH
2014 356 137 38.5% 41 11.5% 178 50.0%
2017/18 359 248 69.1% 24 6.7% 87 24.2%
Diff. 30.6% -4.8% -25.8%
Operation and funding of services
Correct Incorrect Don't know
Year Total N % N % N %
Number of Posyandu operating in village
2014 356 348 97.8% 7 2.0% 1 0.3%
2017/18 359 357 99.4% 1 0.3% 1 0.3%
Diff. 1.6% -1.7% 0.0%
How often should Posyandu operate
2014 356 353 99.2% 3 0.8%
2017/18 359 357 99.4% 2 0.6%
Diff. 0.2 -0.2
Level of Government responsible for funding Posyandu
2014 356 239 67.1% 117 32.9%
2017/18 355 344 96.9% 11 3.1%
Diff. 29.8% -29.8%
Standard for allocation of midwives in this village
2014 356 246 69.1% 110 30.9%
2017/18 351 312 88.9% 39 11.1%
Diff. 19.8% -19.8%
Standard for allocation of midwives for closest Puskesmas
2014 356 106 29.8% 51 14.3% 199 55.9%
2017/18 359 85 23.7% 157 43.7% 117 32.6%
Diff. -6.1% 29.4% -23.3%
Level of government responsible for funding Puskesmas
2014 356 235 66.0% 54 15.2% 67 18.8%
2017/18 359 321 89.4% 28 7.8% 10 2.8%
Diff. 23.4% -7.4% -16.0%
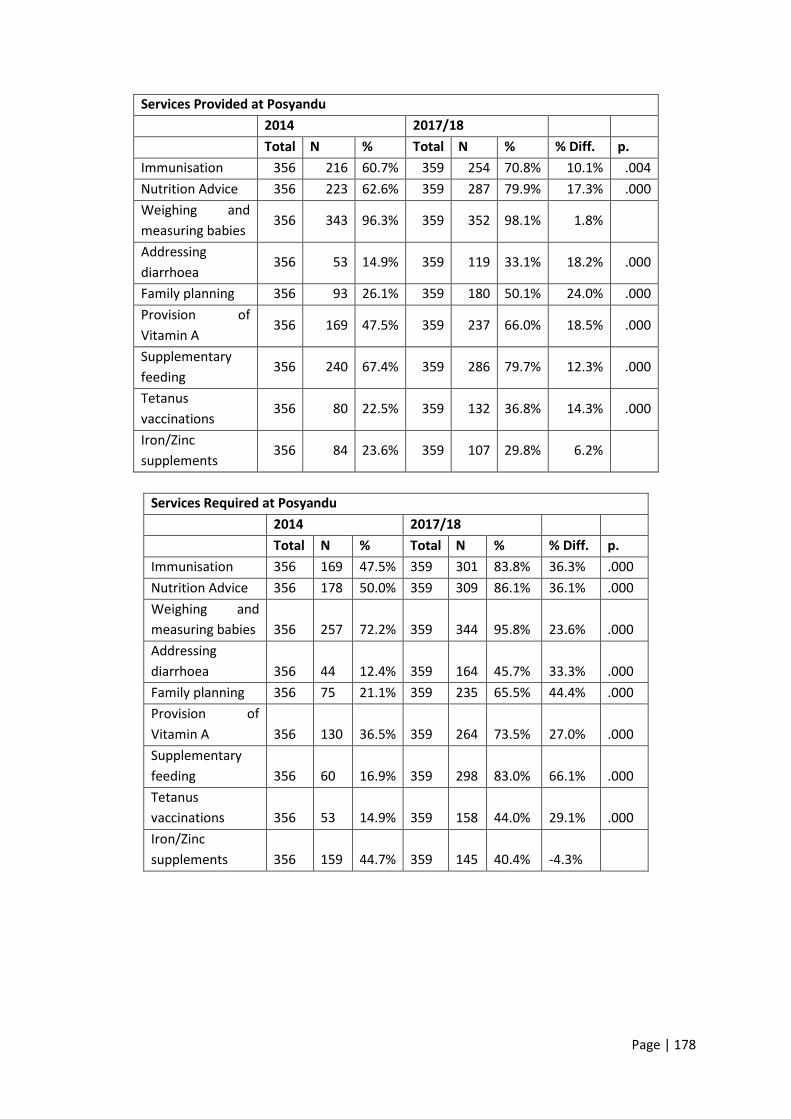
Page | 178
Services Provided at Posyandu
2014 2017/18
Total N % Total N % % Diff. p.
Immunisation 356 216 60.7% 359 254 70.8% 10.1% .004
Nutrition Advice 356 223 62.6% 359 287 79.9% 17.3% .000
Weighing and
measuring babies 356 343 96.3% 359 352 98.1% 1.8%
Addressing
diarrhoea 356 53 14.9% 359 119 33.1% 18.2% .000
Family planning 356 93 26.1% 359 180 50.1% 24.0% .000
Provision of
Vitamin A 356 169 47.5% 359 237 66.0% 18.5% .000
Supplementary
feeding 356 240 67.4% 359 286 79.7% 12.3% .000
Tetanus
vaccinations 356 80 22.5% 359 132 36.8% 14.3% .000
Iron/Zinc
supplements 356 84 23.6% 359 107 29.8% 6.2%
Services Required at Posyandu
2014 2017/18 Total N % Total N % % Diff. p.
Immunisation 356 169 47.5% 359 301 83.8% 36.3% .000
Nutrition Advice 356 178 50.0% 359 309 86.1% 36.1% .000
Weighing and
measuring babies 356 257 72.2% 359 344 95.8% 23.6% .000
Addressing
diarrhoea 356 44 12.4% 359 164 45.7% 33.3% .000
Family planning 356 75 21.1% 359 235 65.5% 44.4% .000
Provision of
Vitamin A 356 130 36.5% 359 264 73.5% 27.0% .000
Supplementary
feeding 356 60 16.9% 359 298 83.0% 66.1% .000
Tetanus
vaccinations 356 53 14.9% 359 158 44.0% 29.1% .000
Iron/Zinc
supplements 356 159 44.7% 359 145 40.4% -4.3%
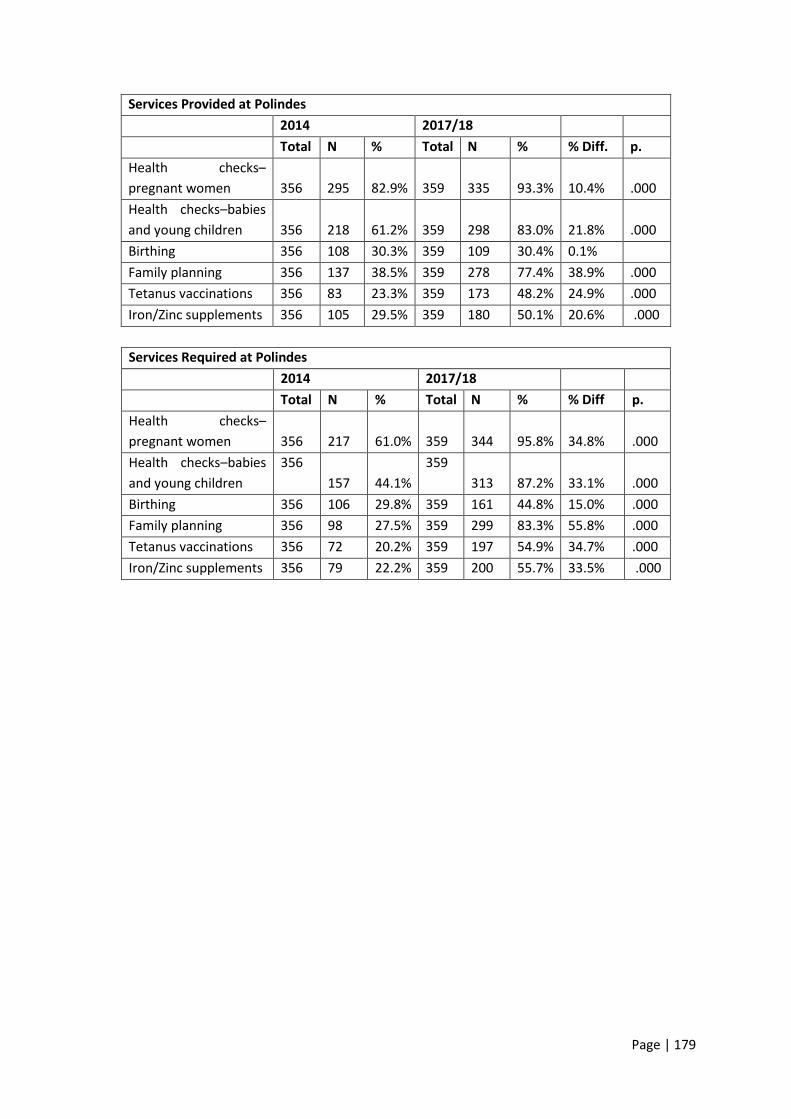
Page | 179
Services Provided at Polindes
2014 2017/18 Total N % Total N % % Diff. p.
Health checks–
pregnant women 356 295 82.9% 359 335 93.3% 10.4% .000
Health checks–babies
and young children 356 218 61.2% 359 298 83.0% 21.8% .000
Birthing 356 108 30.3% 359 109 30.4% 0.1%
Family planning 356 137 38.5% 359 278 77.4% 38.9% .000
Tetanus vaccinations 356 83 23.3% 359 173 48.2% 24.9% .000
Iron/Zinc supplements 356 105 29.5% 359 180 50.1% 20.6% .000
Services Required at Polindes
2014 2017/18 Total N % Total N % % Diff p.
Health checks–
pregnant women 356 217 61.0% 359 344 95.8% 34.8% .000
Health checks–babies
and young children
356
157 44.1%
359
313 87.2% 33.1% .000
Birthing 356 106 29.8% 359 161 44.8% 15.0% .000
Family planning 356 98 27.5% 359 299 83.3% 55.8% .000
Tetanus vaccinations 356 72 20.2% 359 197 54.9% 34.7% .000
Iron/Zinc supplements 356 79 22.2% 359 200 55.7% 33.5% .000

Page | 180
Services Provided at Puskesmas
2014 2017/18
Total N % Total N % % Diff p.
See a doctor 356 167 46.9% 359 240 66.9% 20.0% .000
Health check–pregnant
women 356 283 79.5% 359 325 90.5% 11.0% .000
Birthing 356 264 74.2% 359 331 92.2% 18.0% .000
Complications with
newborns 356 56 15.7% 359 62 17.3% 1.6%
Health check–babies
and young children 356 174 48.9% 359 206 57.4% 8.5% .023
Complementary
feeding 356 35 9.8% 359 69 19.2% 9.4% .000
Services for children
under 5 356 121 34.0% 359 178 49.6% 15.6% .000
Nutrition advice–
mothers 356 52 14.6% 359 92 25.6% 9.0% .000
Nutrition advice–
children 356 38 10.7% 359 95 26.5% 15.8% .000
Family planning 356 148 41.6% 359 286 79.7% 38.1% .000
Immunisation 356 155 43.5% 359 287 79.9% 36.4% .000
Malnourishment
treatment 356 64 18.0% 359 130 36.2% 18.2% .000
Tetanus vaccinations 356 91 25.6% 359 167 46.5% 20.9% .000
Iron/Zinc supplements 356 96 27.0% 359 132 36.8% 9.8% .005
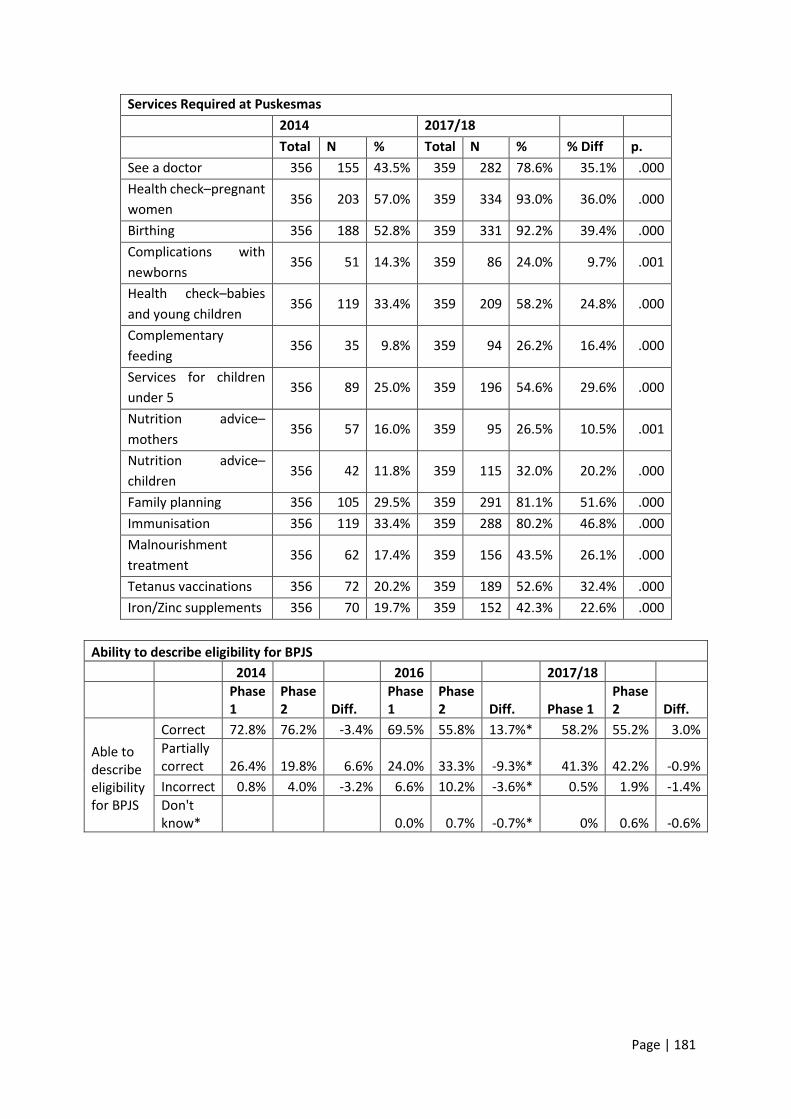
Page | 181
Services Required at Puskesmas
2014 2017/18
Total N % Total N % % Diff p.
See a doctor 356 155 43.5% 359 282 78.6% 35.1% .000
Health check–pregnant
women 356 203 57.0% 359 334 93.0% 36.0% .000
Birthing 356 188 52.8% 359 331 92.2% 39.4% .000
Complications with
newborns 356 51 14.3% 359 86 24.0% 9.7% .001
Health check–babies
and young children 356 119 33.4% 359 209 58.2% 24.8% .000
Complementary
feeding 356 35 9.8% 359 94 26.2% 16.4% .000
Services for children
under 5 356 89 25.0% 359 196 54.6% 29.6% .000
Nutrition advice–
mothers 356 57 16.0% 359 95 26.5% 10.5% .001
Nutrition advice–
children 356 42 11.8% 359 115 32.0% 20.2% .000
Family planning 356 105 29.5% 359 291 81.1% 51.6% .000
Immunisation 356 119 33.4% 359 288 80.2% 46.8% .000
Malnourishment
treatment 356 62 17.4% 359 156 43.5% 26.1% .000
Tetanus vaccinations 356 72 20.2% 359 189 52.6% 32.4% .000
Iron/Zinc supplements 356 70 19.7% 359 152 42.3% 22.6% .000
Ability to describe eligibility for BPJS
2014 2016 2017/18
Phase 1
Phase 2 Diff.
Phase 1
Phase 2 Diff. Phase 1
Phase 2 Diff.
Able to describe eligibility for BPJS
Correct 72.8% 76.2% -3.4% 69.5% 55.8% 13.7%* 58.2% 55.2% 3.0%
Partially correct 26.4% 19.8% 6.6% 24.0% 33.3% -9.3%* 41.3% 42.2% -0.9%
Incorrect 0.8% 4.0% -3.2% 6.6% 10.2% -3.6%* 0.5% 1.9% -1.4%
Don't know* 0.0% 0.7% -0.7%* 0% 0.6% -0.6%
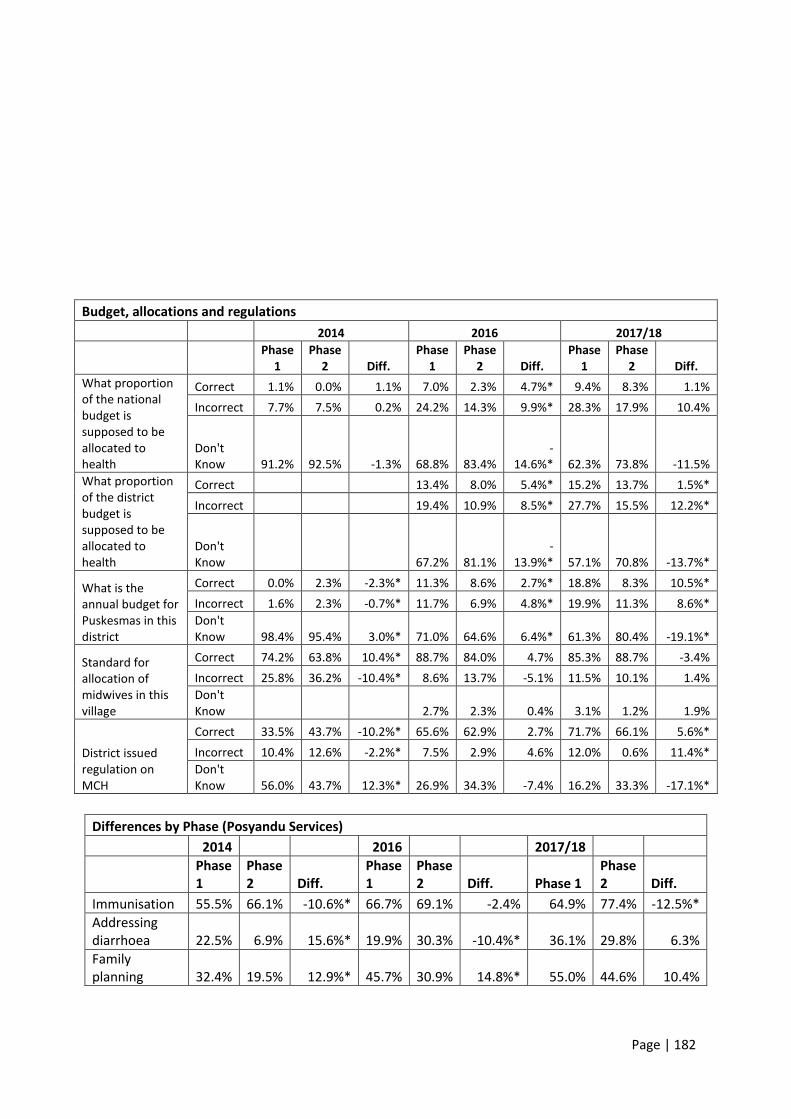
Page | 182
Budget, allocations and regulations
2014 2016 2017/18
Phase
1 Phase
2 Diff. Phase
1 Phase
2 Diff. Phase
1 Phase
2 Diff.
What proportion of the national budget is supposed to be allocated to health
Correct 1.1% 0.0% 1.1% 7.0% 2.3% 4.7%* 9.4% 8.3% 1.1%
Incorrect 7.7% 7.5% 0.2% 24.2% 14.3% 9.9%* 28.3% 17.9% 10.4%
Don't Know 91.2% 92.5% -1.3% 68.8% 83.4%
-14.6%* 62.3% 73.8% -11.5%
What proportion of the district budget is supposed to be allocated to health
Correct 13.4% 8.0% 5.4%* 15.2% 13.7% 1.5%*
Incorrect 19.4% 10.9% 8.5%* 27.7% 15.5% 12.2%*
Don't Know 67.2% 81.1%
-13.9%* 57.1% 70.8% -13.7%*
What is the annual budget for Puskesmas in this district
Correct 0.0% 2.3% -2.3%* 11.3% 8.6% 2.7%* 18.8% 8.3% 10.5%*
Incorrect 1.6% 2.3% -0.7%* 11.7% 6.9% 4.8%* 19.9% 11.3% 8.6%*
Don't Know 98.4% 95.4% 3.0%* 71.0% 64.6% 6.4%* 61.3% 80.4% -19.1%*
Standard for allocation of midwives in this village
Correct 74.2% 63.8% 10.4%* 88.7% 84.0% 4.7% 85.3% 88.7% -3.4%
Incorrect 25.8% 36.2% -10.4%* 8.6% 13.7% -5.1% 11.5% 10.1% 1.4%
Don't Know 2.7% 2.3% 0.4% 3.1% 1.2% 1.9%
District issued regulation on MCH
Correct 33.5% 43.7% -10.2%* 65.6% 62.9% 2.7% 71.7% 66.1% 5.6%*
Incorrect 10.4% 12.6% -2.2%* 7.5% 2.9% 4.6% 12.0% 0.6% 11.4%*
Don't Know 56.0% 43.7% 12.3%* 26.9% 34.3% -7.4% 16.2% 33.3% -17.1%*
Differences by Phase (Posyandu Services)
2014 2016 2017/18
Phase 1
Phase 2 Diff.
Phase 1
Phase 2 Diff. Phase 1
Phase 2 Diff.
Immunisation 55.5% 66.1% -10.6%* 66.7% 69.1% -2.4% 64.9% 77.4% -12.5%*
Addressing diarrhoea 22.5% 6.9% 15.6%* 19.9% 30.3% -10.4%* 36.1% 29.8% 6.3%
Family planning 32.4% 19.5% 12.9%* 45.7% 30.9% 14.8%* 55.0% 44.6% 10.4%

Page | 183
Differences by Phase (Posyandu Standards)
2014 2016 2017/18
Phase 1
Phase 2 Diff.
Phase 1
Phase 2 Diff. Phase 1
Phase 2 Diff.
Addressing diarrhoea 19.2% 5.2% 14.0%* 31.7% 36.6% -4.9% 50.3% 40.5% 9.8%
Family planning 24.2% 17.8% 6.4% 59.1% 44.0% 15.1%* 74.4% 55.4% 19.0%*
Provision of Vitamin A 41.2% 31.6% 9.6% 46.8% 57.7% -10.9%* 72.8% 74.4% -1.6%
Tetanus vaccinations 18.7% 10.9% 7.8%* 38.2% 32.6% 5.6% 46.6% 41.1% 5.5%
Difference by Phase (Polindes Services)
2014 2016 2017/18
Phase 1
Phase 2 Diff.
Phase 1
Phase 2 Diff. Phase 1
Phase 2 Diff.
Health checks–
pregnant women 83.5% 82.2% 1.3% 88.7% 94.9% -6.2%* 92.1% 94.6% -2.5%
Health checks–babies and young children 65.4% 56.9% 8.5% 74.7% 83.4% -8.7%* 83.8% 82.1% 1.7%
Family planning 39.6% 37.4% 2.2% 70.4% 65.7% 4.7% 82.2% 72.0% 10.2%*
Difference by Phase (Polindes Standards)
2014 2016 2017/18
Phase 1
Phase 2 Diff.
Phase 1
Phase 2 Diff. Phase 1
Phase 2 Diff.
Iron/Zinc supplements 26.4% 17.8% 8.6% 39.2% 37.7% 1.5% 61.3% 49.4% 11.9%*
Differences by Phase (Puskesmas Services)
2014 2016 2017/18
Phase 1
Phase 2 Diff.
Phase 1
Phase 2 Diff. Phase 1
Phase 2 Diff.
See a doctor 53.3% 40.2% 13.1%* 53.2% 56.6% -3.4% 66.5% 67.3% -0.8%
Health check-pregnant women 79.7% 79.3% 0.4% 91.4% 83.4% 8.0%* 92.7% 88.1% 4.6%
Health check–babies and young children 49.5% 48.3% 1.2% 57.0% 45.7% 11.3%* 56.5% 58.3% -1.8%
Nutrition advice–children 11.5% 9.8% 1.7% 14.5% 13.1% 1.4% 21.5% 32.1% -10.6%*
Family planning 39.6% 43.7% -4.1% 72.6% 62.3% 10.3%* 82.2% 76.8% 5.4%
Immunisation 37.9% 49.4% -11.5%* 71.5% 61.7% 9.8%* 84.8% 74.4% 10.4%
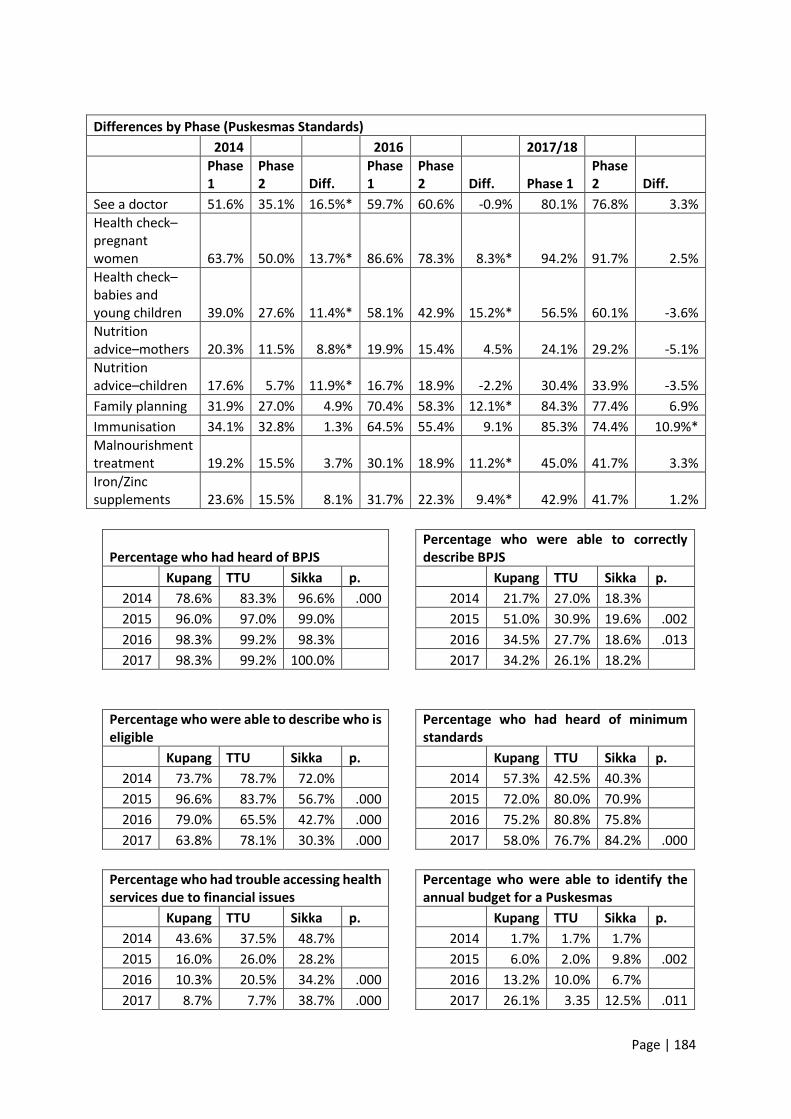
Page | 184
Differences by Phase (Puskesmas Standards)
2014 2016 2017/18
Phase 1
Phase 2 Diff.
Phase 1
Phase 2 Diff. Phase 1
Phase 2 Diff.
See a doctor 51.6% 35.1% 16.5%* 59.7% 60.6% -0.9% 80.1% 76.8% 3.3%
Health check–pregnant women 63.7% 50.0% 13.7%* 86.6% 78.3% 8.3%* 94.2% 91.7% 2.5%
Health check–babies and young children 39.0% 27.6% 11.4%* 58.1% 42.9% 15.2%* 56.5% 60.1% -3.6%
Nutrition advice–mothers 20.3% 11.5% 8.8%* 19.9% 15.4% 4.5% 24.1% 29.2% -5.1%
Nutrition advice–children 17.6% 5.7% 11.9%* 16.7% 18.9% -2.2% 30.4% 33.9% -3.5%
Family planning 31.9% 27.0% 4.9% 70.4% 58.3% 12.1%* 84.3% 77.4% 6.9%
Immunisation 34.1% 32.8% 1.3% 64.5% 55.4% 9.1% 85.3% 74.4% 10.9%*
Malnourishment treatment 19.2% 15.5% 3.7% 30.1% 18.9% 11.2%* 45.0% 41.7% 3.3%
Iron/Zinc supplements 23.6% 15.5% 8.1% 31.7% 22.3% 9.4%* 42.9% 41.7% 1.2%
Percentage who had heard of BPJS
Percentage who were able to correctly describe BPJS
Kupang TTU Sikka p. Kupang TTU Sikka p.
2014 78.6% 83.3% 96.6% .000 2014 21.7% 27.0% 18.3%
2015 96.0% 97.0% 99.0% 2015 51.0% 30.9% 19.6% .002
2016 98.3% 99.2% 98.3% 2016 34.5% 27.7% 18.6% .013
2017 98.3% 99.2% 100.0% 2017 34.2% 26.1% 18.2%
Percentage who were able to describe who is eligible
Percentage who had heard of minimum standards
Kupang TTU Sikka p. Kupang TTU Sikka p.
2014 73.7% 78.7% 72.0% 2014 57.3% 42.5% 40.3%
2015 96.6% 83.7% 56.7% .000 2015 72.0% 80.0% 70.9%
2016 79.0% 65.5% 42.7% .000 2016 75.2% 80.8% 75.8%
2017 63.8% 78.1% 30.3% .000 2017 58.0% 76.7% 84.2% .000
Percentage who had trouble accessing health services due to financial issues
Percentage who were able to identify the annual budget for a Puskesmas
Kupang TTU Sikka p. Kupang TTU Sikka p.
2014 43.6% 37.5% 48.7% 2014 1.7% 1.7% 1.7%
2015 16.0% 26.0% 28.2% 2015 6.0% 2.0% 9.8% .002
2016 10.3% 20.5% 34.2% .000 2016 13.2% 10.0% 6.7%
2017 8.7% 7.7% 38.7% .000 2017 26.1% 3.35 12.5% .011

Page | 185
Percentage who were able to identify to proportion of the national budget allocated to health
Percentage who were able to identify to proportion of the district budget allocated to health
Kupang TTU Sikka p. Kupang TTU Sikka p.
2014 13.7% 3.3% 1.7% 2014
2015 5.0% 13.0% 2.9% .000 2015 1.05% 1.0% 2.9% .000
2016 9.9% 3.3% 0.8% 2016 17.4% 8.3% 6.7% .026
2017 16.8% 5.0% 5.0% .040 2017 24.4% 7.5% 11.7% .027
Percentage who were able to identify the allocation of midwives to the village
Percentage who were able to identify the allocation of midwives to the Puskesmas
Kupang TTU Sikka p. Kupang TTU Sikka p.
2014 77.8% 66.7% 63.0% .038 2014 31.6% 26.7% 31.1%
2015 78.0% 91.0% 83.5% 2015 5.0% 11.0% 11.7% .029
2016 83.5% 87.5% 88.3% 2016 12.4% 20.0% 9.2% .000
2017 82.4% 92.5% 85.8% .019 2017 23.5% 34.2% 13.3% .000
Percentage who were able to identify if the village had issued regulations
Percentage who were able to identify if the district had issued regulations
Kupang TTU Sikka p. Kupang TTU Sikka p.
2014 30.8% 35.8% 26.1% .014 2014 39.3% 53.3% 22.7% .000
2015 31.0% 45.0% 30.1% .004 2015 49.0% 78.0% 26.2% .000
2016 19.0% 48.3% 32.5% .000 2016 61.2% 91.7% 40.0% .000
2017 41.2% 34.2% 49.2% 2017 78.2% 73.3% 55.8% .018
Percentage able to identify the level of government responsible for funding Posyandu
Percentage able to identify the level of government responsible for funding Puskesmas
Kupang TTU Sikka p. Kupang TTU Sikka p.
2014 38.5% 77.5% 84.9% .000 2014 55.6% 74.2% 68.1% .001
2015 46.0% 94.0% 90.3% .000 2015 57.0% 82.0% 77.75 .000
2016 84.3% 97.5% 94.2% .000 2016 88.4% 90.8% 77.5%
2017 90.8% 100.0% 96.7% .003 2017 85.7% 96.7% 85.8% .006
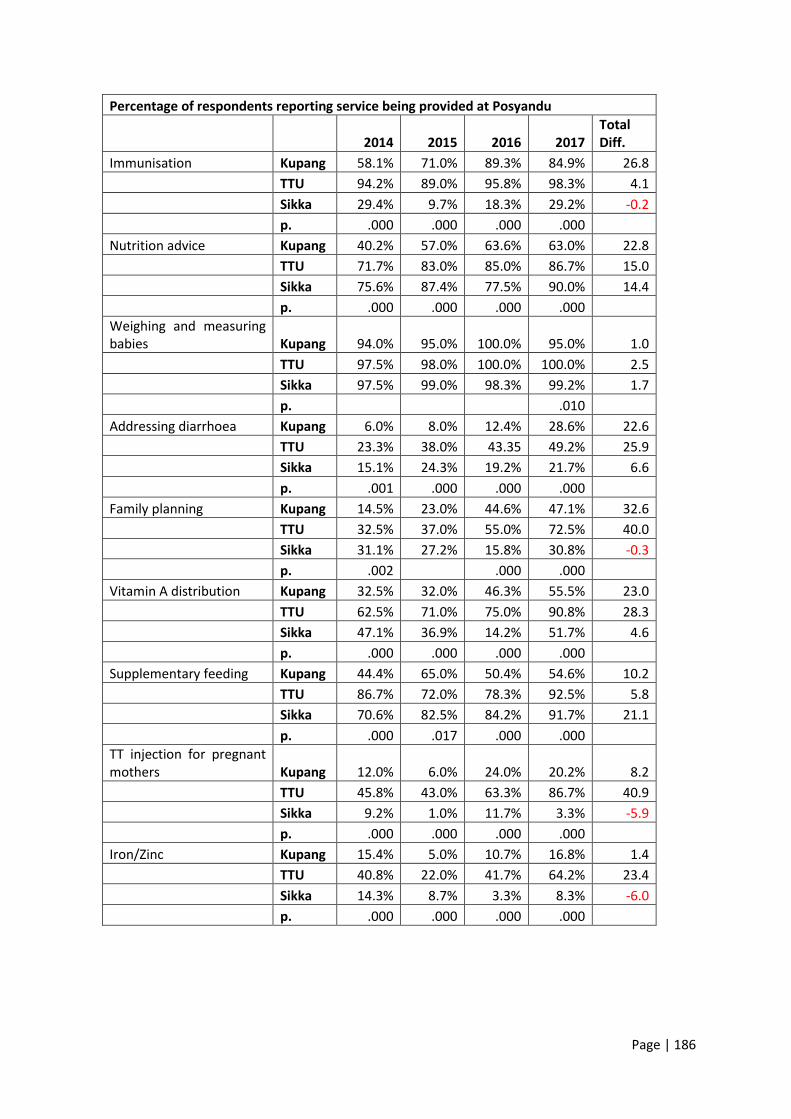
Page | 186
Percentage of respondents reporting service being provided at Posyandu
2014 2015 2016 2017 Total Diff.
Immunisation Kupang 58.1% 71.0% 89.3% 84.9% 26.8
TTU 94.2% 89.0% 95.8% 98.3% 4.1
Sikka 29.4% 9.7% 18.3% 29.2% -0.2
p. .000 .000 .000 .000
Nutrition advice Kupang 40.2% 57.0% 63.6% 63.0% 22.8
TTU 71.7% 83.0% 85.0% 86.7% 15.0
Sikka 75.6% 87.4% 77.5% 90.0% 14.4
p. .000 .000 .000 .000
Weighing and measuring babies Kupang 94.0% 95.0% 100.0% 95.0% 1.0
TTU 97.5% 98.0% 100.0% 100.0% 2.5
Sikka 97.5% 99.0% 98.3% 99.2% 1.7
p. .010
Addressing diarrhoea Kupang 6.0% 8.0% 12.4% 28.6% 22.6
TTU 23.3% 38.0% 43.35 49.2% 25.9
Sikka 15.1% 24.3% 19.2% 21.7% 6.6
p. .001 .000 .000 .000
Family planning Kupang 14.5% 23.0% 44.6% 47.1% 32.6
TTU 32.5% 37.0% 55.0% 72.5% 40.0
Sikka 31.1% 27.2% 15.8% 30.8% -0.3
p. .002 .000 .000
Vitamin A distribution Kupang 32.5% 32.0% 46.3% 55.5% 23.0
TTU 62.5% 71.0% 75.0% 90.8% 28.3
Sikka 47.1% 36.9% 14.2% 51.7% 4.6
p. .000 .000 .000 .000
Supplementary feeding Kupang 44.4% 65.0% 50.4% 54.6% 10.2
TTU 86.7% 72.0% 78.3% 92.5% 5.8
Sikka 70.6% 82.5% 84.2% 91.7% 21.1
p. .000 .017 .000 .000
TT injection for pregnant mothers Kupang 12.0% 6.0% 24.0% 20.2% 8.2
TTU 45.8% 43.0% 63.3% 86.7% 40.9
Sikka 9.2% 1.0% 11.7% 3.3% -5.9
p. .000 .000 .000 .000
Iron/Zinc Kupang 15.4% 5.0% 10.7% 16.8% 1.4
TTU 40.8% 22.0% 41.7% 64.2% 23.4
Sikka 14.3% 8.7% 3.3% 8.3% -6.0
p. .000 .000 .000 .000
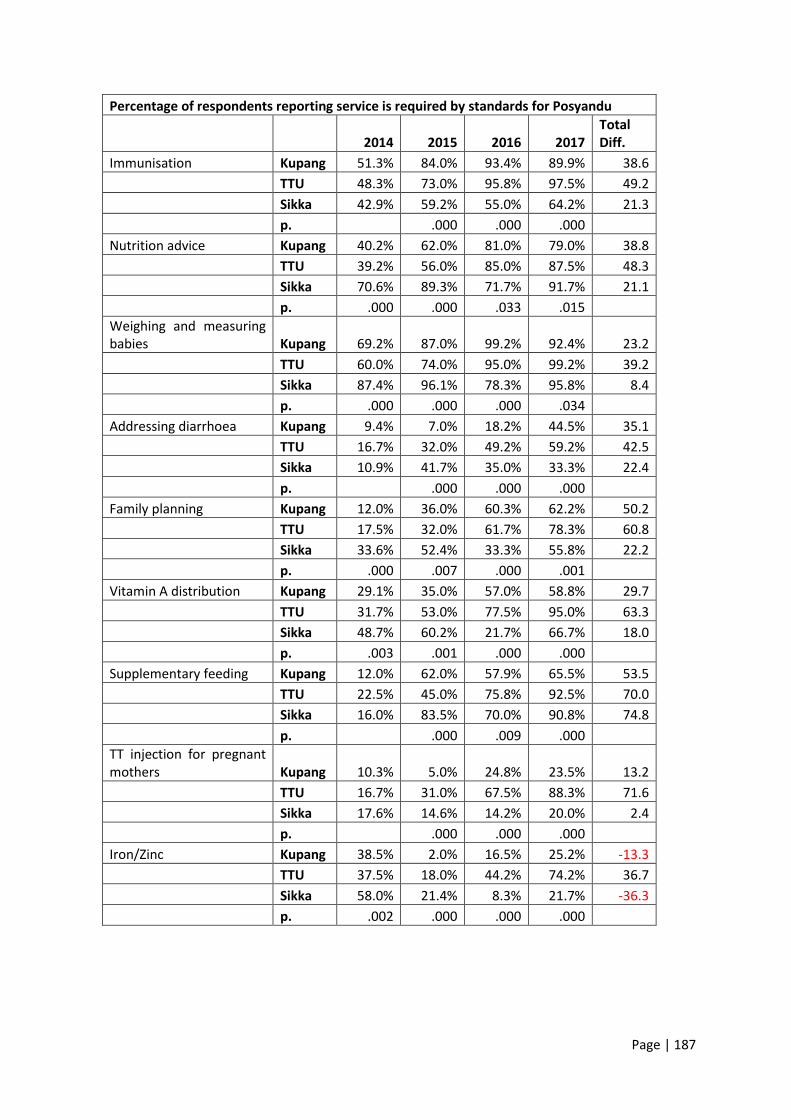
Page | 187
Percentage of respondents reporting service is required by standards for Posyandu
2014 2015 2016 2017 Total Diff.
Immunisation Kupang 51.3% 84.0% 93.4% 89.9% 38.6
TTU 48.3% 73.0% 95.8% 97.5% 49.2
Sikka 42.9% 59.2% 55.0% 64.2% 21.3
p. .000 .000 .000
Nutrition advice Kupang 40.2% 62.0% 81.0% 79.0% 38.8
TTU 39.2% 56.0% 85.0% 87.5% 48.3
Sikka 70.6% 89.3% 71.7% 91.7% 21.1
p. .000 .000 .033 .015
Weighing and measuring babies Kupang 69.2% 87.0% 99.2% 92.4% 23.2
TTU 60.0% 74.0% 95.0% 99.2% 39.2
Sikka 87.4% 96.1% 78.3% 95.8% 8.4
p. .000 .000 .000 .034
Addressing diarrhoea Kupang 9.4% 7.0% 18.2% 44.5% 35.1
TTU 16.7% 32.0% 49.2% 59.2% 42.5
Sikka 10.9% 41.7% 35.0% 33.3% 22.4
p. .000 .000 .000
Family planning Kupang 12.0% 36.0% 60.3% 62.2% 50.2
TTU 17.5% 32.0% 61.7% 78.3% 60.8
Sikka 33.6% 52.4% 33.3% 55.8% 22.2
p. .000 .007 .000 .001
Vitamin A distribution Kupang 29.1% 35.0% 57.0% 58.8% 29.7
TTU 31.7% 53.0% 77.5% 95.0% 63.3
Sikka 48.7% 60.2% 21.7% 66.7% 18.0
p. .003 .001 .000 .000
Supplementary feeding Kupang 12.0% 62.0% 57.9% 65.5% 53.5
TTU 22.5% 45.0% 75.8% 92.5% 70.0
Sikka 16.0% 83.5% 70.0% 90.8% 74.8
p. .000 .009 .000
TT injection for pregnant mothers Kupang 10.3% 5.0% 24.8% 23.5% 13.2
TTU 16.7% 31.0% 67.5% 88.3% 71.6
Sikka 17.6% 14.6% 14.2% 20.0% 2.4
p. .000 .000 .000
Iron/Zinc Kupang 38.5% 2.0% 16.5% 25.2% -13.3
TTU 37.5% 18.0% 44.2% 74.2% 36.7
Sikka 58.0% 21.4% 8.3% 21.7% -36.3
p. .002 .000 .000 .000
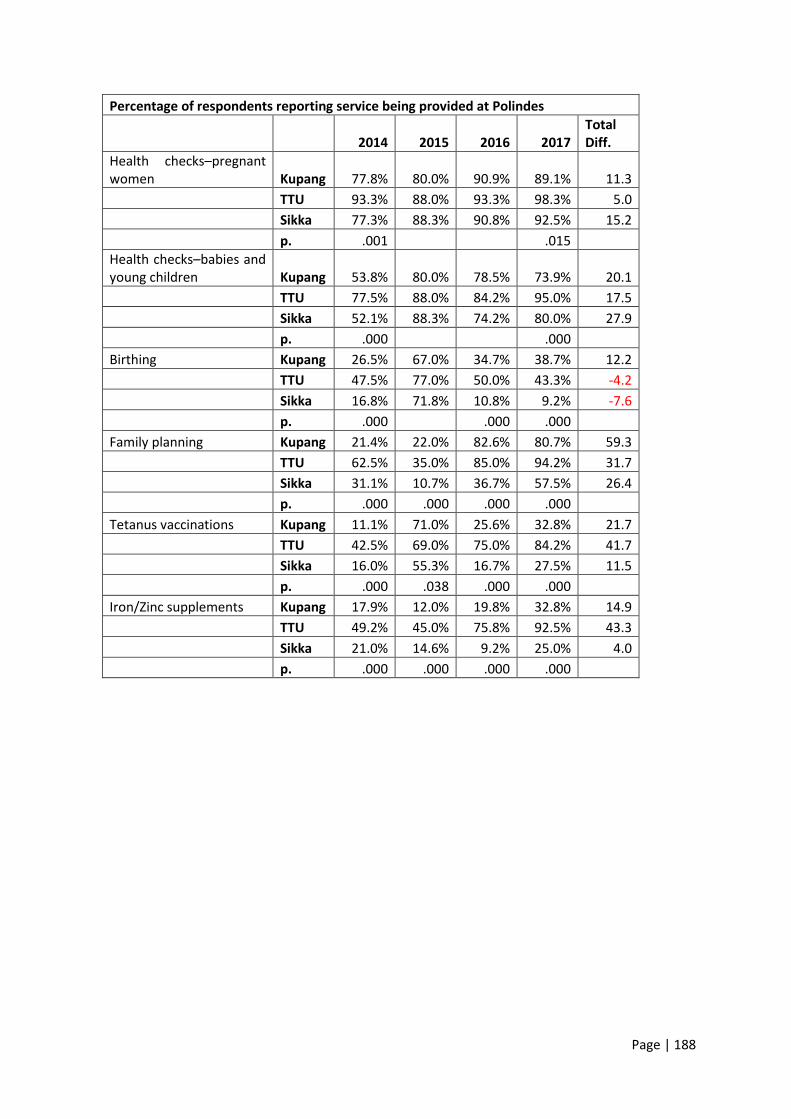
Page | 188
Percentage of respondents reporting service being provided at Polindes
2014 2015 2016 2017 Total Diff.
Health checks–pregnant women Kupang 77.8% 80.0% 90.9% 89.1% 11.3
TTU 93.3% 88.0% 93.3% 98.3% 5.0
Sikka 77.3% 88.3% 90.8% 92.5% 15.2
p. .001 .015
Health checks–babies and young children Kupang 53.8% 80.0% 78.5% 73.9% 20.1
TTU 77.5% 88.0% 84.2% 95.0% 17.5
Sikka 52.1% 88.3% 74.2% 80.0% 27.9
p. .000 .000
Birthing Kupang 26.5% 67.0% 34.7% 38.7% 12.2
TTU 47.5% 77.0% 50.0% 43.3% -4.2
Sikka 16.8% 71.8% 10.8% 9.2% -7.6
p. .000 .000 .000
Family planning Kupang 21.4% 22.0% 82.6% 80.7% 59.3
TTU 62.5% 35.0% 85.0% 94.2% 31.7
Sikka 31.1% 10.7% 36.7% 57.5% 26.4
p. .000 .000 .000 .000
Tetanus vaccinations Kupang 11.1% 71.0% 25.6% 32.8% 21.7
TTU 42.5% 69.0% 75.0% 84.2% 41.7
Sikka 16.0% 55.3% 16.7% 27.5% 11.5
p. .000 .038 .000 .000
Iron/Zinc supplements Kupang 17.9% 12.0% 19.8% 32.8% 14.9
TTU 49.2% 45.0% 75.8% 92.5% 43.3
Sikka 21.0% 14.6% 9.2% 25.0% 4.0
p. .000 .000 .000 .000
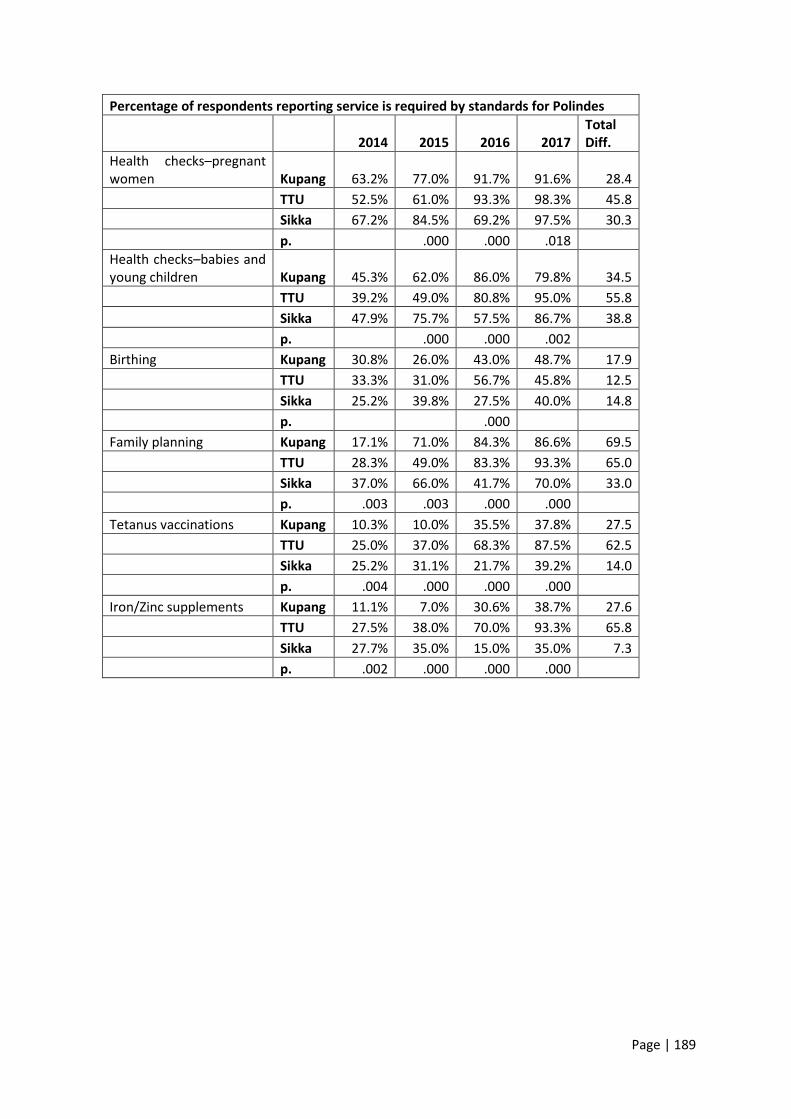
Page | 189
Percentage of respondents reporting service is required by standards for Polindes
2014 2015 2016 2017 Total Diff.
Health checks–pregnant women Kupang 63.2% 77.0% 91.7% 91.6% 28.4
TTU 52.5% 61.0% 93.3% 98.3% 45.8
Sikka 67.2% 84.5% 69.2% 97.5% 30.3
p. .000 .000 .018
Health checks–babies and young children Kupang 45.3% 62.0% 86.0% 79.8% 34.5
TTU 39.2% 49.0% 80.8% 95.0% 55.8
Sikka 47.9% 75.7% 57.5% 86.7% 38.8
p. .000 .000 .002
Birthing Kupang 30.8% 26.0% 43.0% 48.7% 17.9
TTU 33.3% 31.0% 56.7% 45.8% 12.5
Sikka 25.2% 39.8% 27.5% 40.0% 14.8
p. .000
Family planning Kupang 17.1% 71.0% 84.3% 86.6% 69.5
TTU 28.3% 49.0% 83.3% 93.3% 65.0
Sikka 37.0% 66.0% 41.7% 70.0% 33.0
p. .003 .003 .000 .000
Tetanus vaccinations Kupang 10.3% 10.0% 35.5% 37.8% 27.5
TTU 25.0% 37.0% 68.3% 87.5% 62.5
Sikka 25.2% 31.1% 21.7% 39.2% 14.0
p. .004 .000 .000 .000
Iron/Zinc supplements Kupang 11.1% 7.0% 30.6% 38.7% 27.6
TTU 27.5% 38.0% 70.0% 93.3% 65.8
Sikka 27.7% 35.0% 15.0% 35.0% 7.3
p. .002 .000 .000 .000
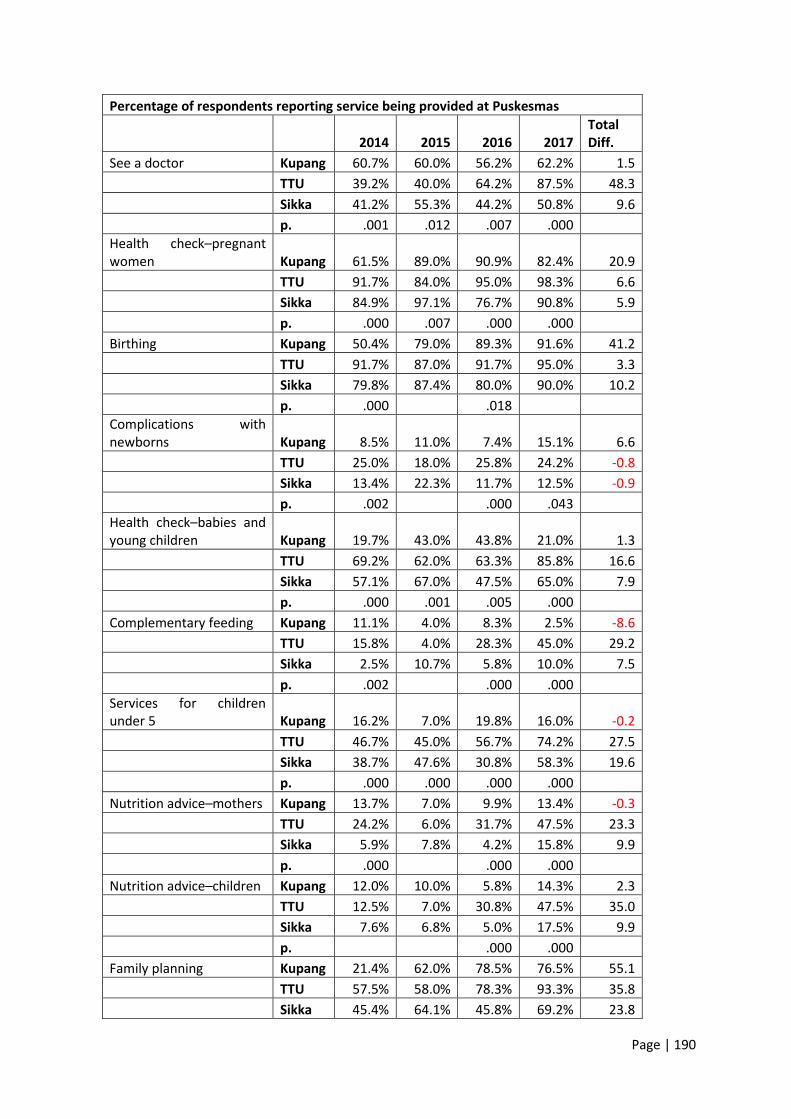
Page | 190
Percentage of respondents reporting service being provided at Puskesmas
2014 2015 2016 2017 Total Diff.
See a doctor Kupang 60.7% 60.0% 56.2% 62.2% 1.5
TTU 39.2% 40.0% 64.2% 87.5% 48.3
Sikka 41.2% 55.3% 44.2% 50.8% 9.6
p. .001 .012 .007 .000
Health check–pregnant women Kupang 61.5% 89.0% 90.9% 82.4% 20.9
TTU 91.7% 84.0% 95.0% 98.3% 6.6
Sikka 84.9% 97.1% 76.7% 90.8% 5.9
p. .000 .007 .000 .000
Birthing Kupang 50.4% 79.0% 89.3% 91.6% 41.2
TTU 91.7% 87.0% 91.7% 95.0% 3.3
Sikka 79.8% 87.4% 80.0% 90.0% 10.2
p. .000 .018
Complications with newborns Kupang 8.5% 11.0% 7.4% 15.1% 6.6
TTU 25.0% 18.0% 25.8% 24.2% -0.8
Sikka 13.4% 22.3% 11.7% 12.5% -0.9
p. .002 .000 .043
Health check–babies and young children Kupang 19.7% 43.0% 43.8% 21.0% 1.3
TTU 69.2% 62.0% 63.3% 85.8% 16.6
Sikka 57.1% 67.0% 47.5% 65.0% 7.9
p. .000 .001 .005 .000
Complementary feeding Kupang 11.1% 4.0% 8.3% 2.5% -8.6
TTU 15.8% 4.0% 28.3% 45.0% 29.2
Sikka 2.5% 10.7% 5.8% 10.0% 7.5
p. .002 .000 .000
Services for children under 5 Kupang 16.2% 7.0% 19.8% 16.0% -0.2
TTU 46.7% 45.0% 56.7% 74.2% 27.5
Sikka 38.7% 47.6% 30.8% 58.3% 19.6
p. .000 .000 .000 .000
Nutrition advice–mothers Kupang 13.7% 7.0% 9.9% 13.4% -0.3
TTU 24.2% 6.0% 31.7% 47.5% 23.3
Sikka 5.9% 7.8% 4.2% 15.8% 9.9
p. .000 .000 .000
Nutrition advice–children Kupang 12.0% 10.0% 5.8% 14.3% 2.3
TTU 12.5% 7.0% 30.8% 47.5% 35.0
Sikka 7.6% 6.8% 5.0% 17.5% 9.9
p. .000 .000
Family planning Kupang 21.4% 62.0% 78.5% 76.5% 55.1
TTU 57.5% 58.0% 78.3% 93.3% 35.8
Sikka 45.4% 64.1% 45.8% 69.2% 23.8
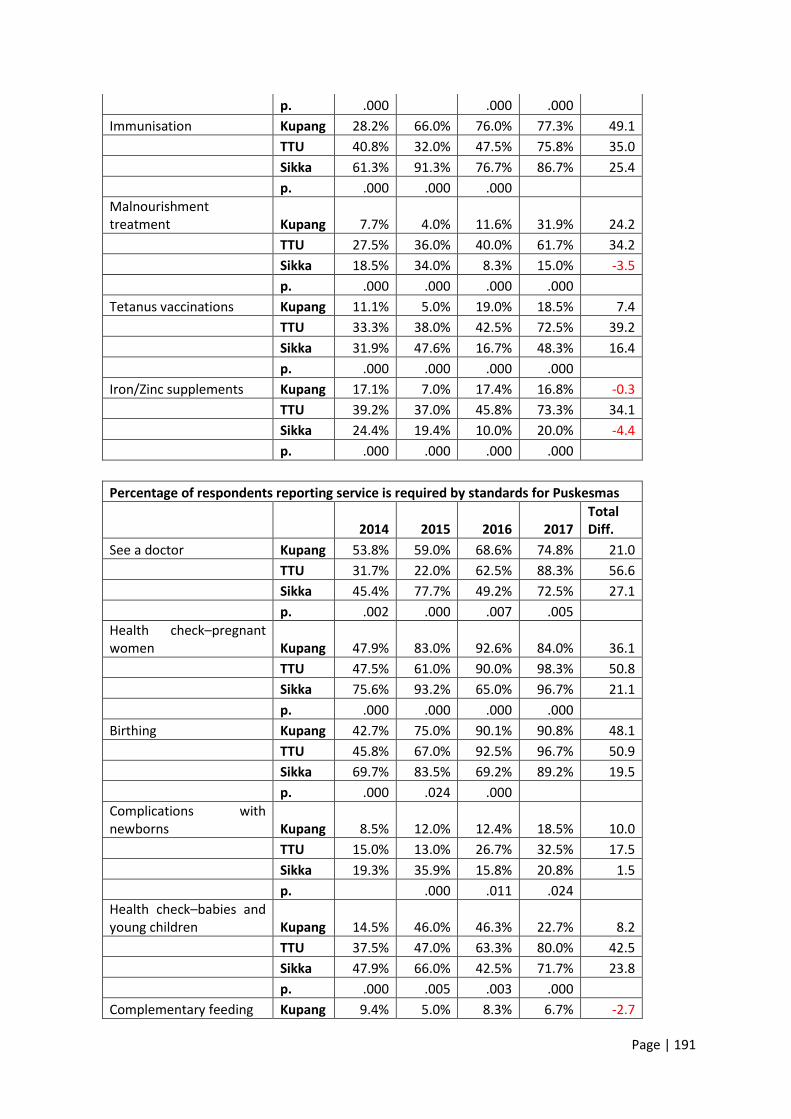
Page | 191
p. .000 .000 .000
Immunisation Kupang 28.2% 66.0% 76.0% 77.3% 49.1
TTU 40.8% 32.0% 47.5% 75.8% 35.0
Sikka 61.3% 91.3% 76.7% 86.7% 25.4
p. .000 .000 .000
Malnourishment treatment Kupang 7.7% 4.0% 11.6% 31.9% 24.2
TTU 27.5% 36.0% 40.0% 61.7% 34.2
Sikka 18.5% 34.0% 8.3% 15.0% -3.5
p. .000 .000 .000 .000
Tetanus vaccinations Kupang 11.1% 5.0% 19.0% 18.5% 7.4
TTU 33.3% 38.0% 42.5% 72.5% 39.2
Sikka 31.9% 47.6% 16.7% 48.3% 16.4
p. .000 .000 .000 .000
Iron/Zinc supplements Kupang 17.1% 7.0% 17.4% 16.8% -0.3
TTU 39.2% 37.0% 45.8% 73.3% 34.1
Sikka 24.4% 19.4% 10.0% 20.0% -4.4
p. .000 .000 .000 .000
Percentage of respondents reporting service is required by standards for Puskesmas
2014 2015 2016 2017 Total Diff.
See a doctor Kupang 53.8% 59.0% 68.6% 74.8% 21.0
TTU 31.7% 22.0% 62.5% 88.3% 56.6
Sikka 45.4% 77.7% 49.2% 72.5% 27.1
p. .002 .000 .007 .005
Health check–pregnant women Kupang 47.9% 83.0% 92.6% 84.0% 36.1
TTU 47.5% 61.0% 90.0% 98.3% 50.8
Sikka 75.6% 93.2% 65.0% 96.7% 21.1
p. .000 .000 .000 .000
Birthing Kupang 42.7% 75.0% 90.1% 90.8% 48.1
TTU 45.8% 67.0% 92.5% 96.7% 50.9
Sikka 69.7% 83.5% 69.2% 89.2% 19.5
p. .000 .024 .000
Complications with newborns Kupang 8.5% 12.0% 12.4% 18.5% 10.0
TTU 15.0% 13.0% 26.7% 32.5% 17.5
Sikka 19.3% 35.9% 15.8% 20.8% 1.5
p. .000 .011 .024
Health check–babies and young children Kupang 14.5% 46.0% 46.3% 22.7% 8.2
TTU 37.5% 47.0% 63.3% 80.0% 42.5
Sikka 47.9% 66.0% 42.5% 71.7% 23.8
p. .000 .005 .003 .000
Complementary feeding Kupang 9.4% 5.0% 8.3% 6.7% -2.7
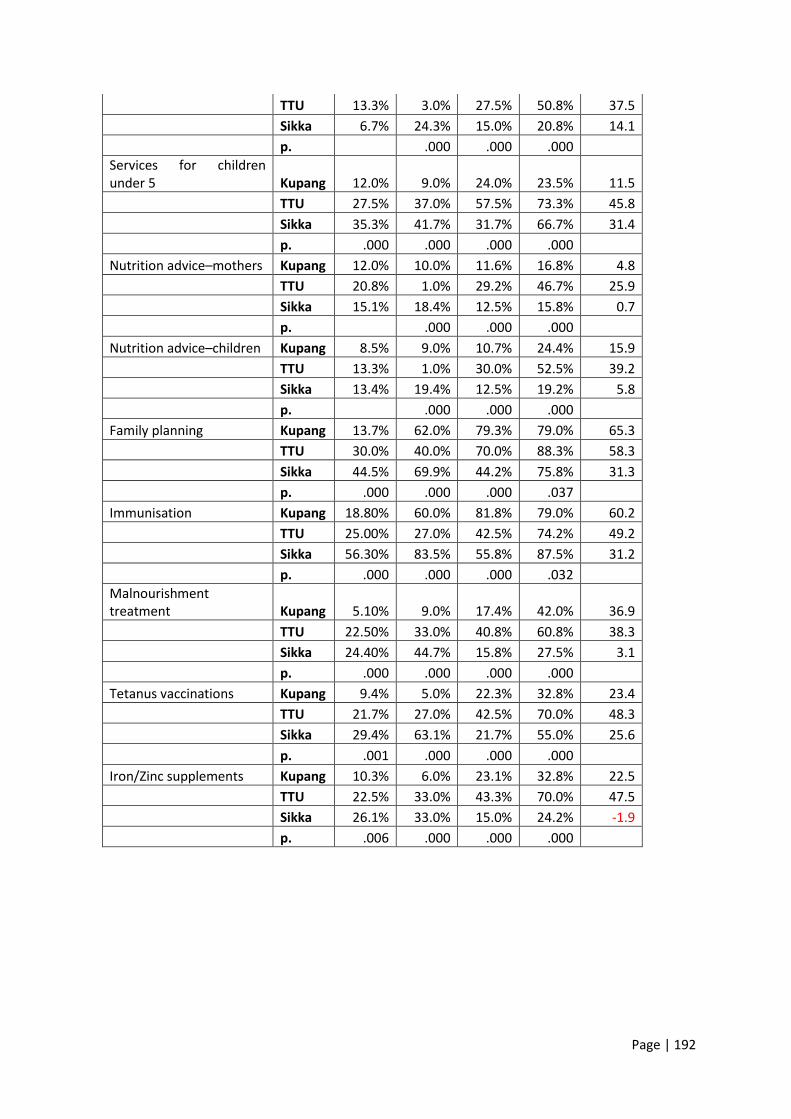
Page | 192
TTU 13.3% 3.0% 27.5% 50.8% 37.5
Sikka 6.7% 24.3% 15.0% 20.8% 14.1
p. .000 .000 .000
Services for children under 5 Kupang 12.0% 9.0% 24.0% 23.5% 11.5
TTU 27.5% 37.0% 57.5% 73.3% 45.8
Sikka 35.3% 41.7% 31.7% 66.7% 31.4
p. .000 .000 .000 .000
Nutrition advice–mothers Kupang 12.0% 10.0% 11.6% 16.8% 4.8
TTU 20.8% 1.0% 29.2% 46.7% 25.9
Sikka 15.1% 18.4% 12.5% 15.8% 0.7
p. .000 .000 .000
Nutrition advice–children Kupang 8.5% 9.0% 10.7% 24.4% 15.9
TTU 13.3% 1.0% 30.0% 52.5% 39.2
Sikka 13.4% 19.4% 12.5% 19.2% 5.8
p. .000 .000 .000
Family planning Kupang 13.7% 62.0% 79.3% 79.0% 65.3
TTU 30.0% 40.0% 70.0% 88.3% 58.3
Sikka 44.5% 69.9% 44.2% 75.8% 31.3
p. .000 .000 .000 .037
Immunisation Kupang 18.80% 60.0% 81.8% 79.0% 60.2
TTU 25.00% 27.0% 42.5% 74.2% 49.2
Sikka 56.30% 83.5% 55.8% 87.5% 31.2
p. .000 .000 .000 .032
Malnourishment treatment Kupang 5.10% 9.0% 17.4% 42.0% 36.9
TTU 22.50% 33.0% 40.8% 60.8% 38.3
Sikka 24.40% 44.7% 15.8% 27.5% 3.1
p. .000 .000 .000 .000
Tetanus vaccinations Kupang 9.4% 5.0% 22.3% 32.8% 23.4
TTU 21.7% 27.0% 42.5% 70.0% 48.3
Sikka 29.4% 63.1% 21.7% 55.0% 25.6
p. .001 .000 .000 .000
Iron/Zinc supplements Kupang 10.3% 6.0% 23.1% 32.8% 22.5
TTU 22.5% 33.0% 43.3% 70.0% 47.5
Sikka 26.1% 33.0% 15.0% 24.2% -1.9
p. .006 .000 .000 .000