cirp construct reports
TRANSCRIPT
1.1
CIRP Construct ReportsFirst-time, Full-time Freshmen
Comparison group 1: Public UniversitiesComparison group 2: All universities
2020 CIRP Freshman Survey
University of California-San Diego

Table of Contents
1. CIRP Construct Mean ReportsHow to Read the CIRP Construct Mean Reports H1
a. Habits of Mind 1Ab. Academic Self-Concept 1Bc. Social Self-Concept 1Cd. Pluralistic Orientation 1De. Social Agency 1Ef. Civic Engagement 1Fg. College Reputation Orientation 1Gh. Likelihood of College Involvement 1Hi. Science Self-Efficacy 1Ij. Science Identity 1J
2. CIRP Construct Percentage ReportsHow to Read the CIRP Construct Percentage Reports H2
a. Habits of Mind 2Ab. Academic Self-Concept 2Bc. Social Self-Concept 2Cd. Pluralistic Orientation 2De. Social Agency 2Ef. Civic Engagement 2Fg. College Reputation Orientation 2Gh. Likelihood of College Involvement 2Hi. Science Self-Efficacy 2Ij. Science Identity 2J
2020 CIRP Freshman Survey CIRP Construct Reports

H1
Sample University Your Inst Comp 1 Comp 2 Your Inst Comp 1 Comp 2 Your Inst Comp 1 Comp 2 Your Inst Comp 1 Comp 2Total (n) 619 21,085 42,939 300 10,706 19,535 319 10,379 23,404 19 105 214Mean 48.4 49.6 49.3 48.8 50.2 49.7 48.0 49.1 48.9 47.8 48.1 48.0Standard Deviation 8.74 8.55 8.85 8.67 8.67 8.97 8.80 8.41 8.74 8.80 8.41 8.74Significance - *** * - ** - * - * Effect Size - -0.14 -0.10 - -0.16 -0.10 - -0.12 -0.10 - -0.12 -0.1025th percentile 41.9 43.5 43.0 42.8 44.1 43.0 40.6 43.0 42.8 40.2 43.0 42.875th percentile 54.0 55.3 54.8 54.1 56.4 56.1 53.5 54.1 54.2 53.5 53.6 53.9
How to Read the CIRP Construct Mean Report
Total Men/Trans men Genderqueer*
Academic Self-Concept – is a unified measure of students’ beliefs about their abilities and confidence in academic environments.
CIRP Constructs are designed to capture the experiences and outcomes institutions are often interested in understanding, but that present a measurement challenge because of their complex and multifaceted nature. To measure these broad underlying areas more precisely, we use Item Response Theory (IRT) to combine individual survey items into global measures that capture these areas. CIRP Constructs are more than a summation of related items; IRT uses response patterns to derive construct score estimates while simultaneously giving greater weight in the estimation process to survey items that tap into the construct more directly. This results in more accurate construct scores. Constructs are particularly useful for benchmarking. They allow you to determine if the experiences and outcomes for your students differ from your comparison groups. Two reports are generated for each CIRP Construct. The Mean Score Report shows comparative information based on the mean score of a construct. The Percentage Report shows comparative information based on the percentage of students who score in the high, average, and low score groups of a construct. We suggest you use the report that best fits your needs as an institution. Both CIRP Construct reports are generated for first-time, full-time freshman, which we define as those respondents who first entered college in 2020 and are currently enrolled full-time. For more information about IRT and the CIRP Construct development process, see the CIRP Constructs Technical Report at www.heri.ucla.edu.
Women/Trans women
* Academic ability (3.52)* Self-confidence - (intellectual) (1.22)
Comp 1 – The first comparison group is based on your institution's type, control, and selectivity.
Comp 2 – The second comparison group is based on your institution's type and control.
Mean – The arithmetic mean is computed for each CIRP Construct based on the construct score. CIRP Constructs are scored on a z-score metric and rescaled for a mean of approximately 50 and standard deviation of 10.
Effect Size – Determines the practical significance of the mean difference between your institution and the comparison group. It is calculated by dividing the mean difference by the standard deviation of the comparison group. Generally, an effect size of .2 is considered small, .5 medium, and .8 large. A positive sign indicates that your institution’s mean is greater than the mean of the comparison group; a negative sign indicates your mean is smaller than the mean of the comparison group.
CIRP Construct Definition – Summarizes the theoretical rationale for creating the construct.
Standard Deviation – Measures the variability around the mean. A small standard deviation indicates that the responses for the construct tend to be very close to the mean, whereas a large standard deviation indicates that the responses are spread over a larger range of response options.
Statistical Significance – Uses t-test to examine the difference between the mean construct score for your institution and the comparison group. Constructs with mean differences that are larger than would be expected by chance are noted with one, two, or three stars, which correspond to the three standard levels of significance (*p< .05, **p< .01, and ***p< .001). Statistical significance measures the extent to which a difference is occurring by chance, not the extent to which a difference is practically important. Large sample sizes (like those in the comparison groups) tend to generate statistical significance even though the magnitude of the difference may be small and not practically significant. In order to provide additional context to statistical significance, effect sizes are provided.
* Drive to achieve (0.95)* Mathematical ability (1.22)
Survey Items and Estimation "Weights" – The survey items used in the creation of the CIRP Construct are presented in the order in which they contribute to the construct along with the estimation weights generated in IRT. Items that tap into a trait more effectively are given greater weight in the estimation process.
Charts – Provide a visual display of relevant construct scores for your institution and two comparison groups. The Y axis is defined by the highest and lowest possible construct score. Mean scores are represented by blue circles. The numbers at the top and bottom of the vertical line are values for the 75th and 25th percentiles.
Note: Significance * p<.05, ** p<.01, *** p<.001
Survey items and estimation "weights": Rate yourself on each of the following traits as compared with the average person your age:
41.9 43.5 43.0
54.0 55.3 54.8
48.4 49.6 49.3
35.4
75.3
Your Inst Comp 1 Comp 2
Acad
emic
Self-
Conc
ept
Mean
Total
42.8 44.1 43.0
54.156.4 56.1
48.8 50.2 49.7
35.4
75.3
Your Inst Comp 1 Comp 2
Acad
emic
Self-
Conc
ept
Mean
Men/Trans men
40.6 43.0 42.8
53.5 54.1 54.2
48.0 49.1 48.9
35.4
75.3
Your Inst Comp 1 Comp 2
Acad
emic
Self-
Conc
ept
Mean
Women/Trans women
40.2 43.0 42.8
53.5 53.6 53.9
47.8 48.1 48.0
35.4
75.3
Your Inst Comp 1 Comp 2
Acad
emic
Self-
Conc
ept
Mean
Genderqueer*

1A
University of California-San Diego Your Inst Comp 1 Comp 2 Your Inst Comp 1 Comp 2 Your Inst Comp 1 Comp 2 Your Inst Comp 1 Comp 2Total (n) 2,850 5,020 17,058 1,180 2,053 6,291 1,565 2,774 10,020 96 174 666Mean 49.3 50.2 50.7 50.3 51.1 51.5 48.5 49.6 50.2 50.6 50.4 50.5Standard Deviation 8.77 8.53 8.33 8.70 8.58 8.34 8.68 8.39 8.24 9.32 8.88 8.78Significance - *** *** - * *** - *** *** - Effect Size - -0.10 -0.16 - -0.09 -0.14 - -0.13 -0.21 - 0.02 0.0225th percentile 43.0 44.4 45.1 43.9 45.2 46.0 41.9 43.8 44.9 43.6 43.7 44.275th percentile 55.3 56.2 56.4 56.3 56.7 56.8 54.4 54.8 55.5 56.3 56.3 56.4
* Seek solutions to problems and explain them to others (2.17) * Ask questions in class (1.26)* Support your opinions with a logical argument (1.81) * Explore topics on your own, even though it was not required for a class (1.09)* Look up scientific research articles and resources (1.71) * Evaluate the quality or reliability of information you received (1.13)* Take a risk because you felt you had more to gain (1.68) * Seek alternative solutions to a problem (1.14)* Accept mistakes as part of the learning process (1.24) * Analyze multiple sources of information before coming to a conclusion (0.98)* Take on a challenge that scares you (1.20)
Note: Significance * p<.05, ** p<.01, *** p<.001
Genderqueer*
Habits of Mind - is a unified measure of the behaviors and traits associated with academic success. These learning behaviors are seen as the foundation for lifelong learning.
2020 CIRP Freshman SurveyFirst-time, Full-time Freshmen
Habits of MindCIRP Construct Mean Report
Survey items and estimation "weights": How often in the past year did you:
Total Men/Trans men Women/Trans women
* Includes non-binary, genderqueer, gender non-conforming, identity not listed
43.0 44.4 45.1
55.3 56.2 56.4
49.3 50.2 50.7
13.0
70.0
Your Inst Comp 1 Comp 2
Habi
ts of
Min
dM
ean
Total
43.9 45.2 46.0
56.3 56.7 56.8
50.3 51.1 51.5
13.0
70.0
Your Inst Comp 1 Comp 2
Habi
ts of
Min
dM
ean
Men/Trans men
41.9 43.8 44.9
54.4 54.8 55.5
48.5 49.6 50.2
13.0
70.0
Your Inst Comp 1 Comp 2
Habi
ts of
Min
dM
ean
Women/Trans women
43.6 43.7 44.2
56.3 56.3 56.4
50.6 50.4 50.5
13.0
70.0
Your Inst Comp 1 Comp 2
Habi
ts of
Min
dM
ean
Genderqueer*
1B
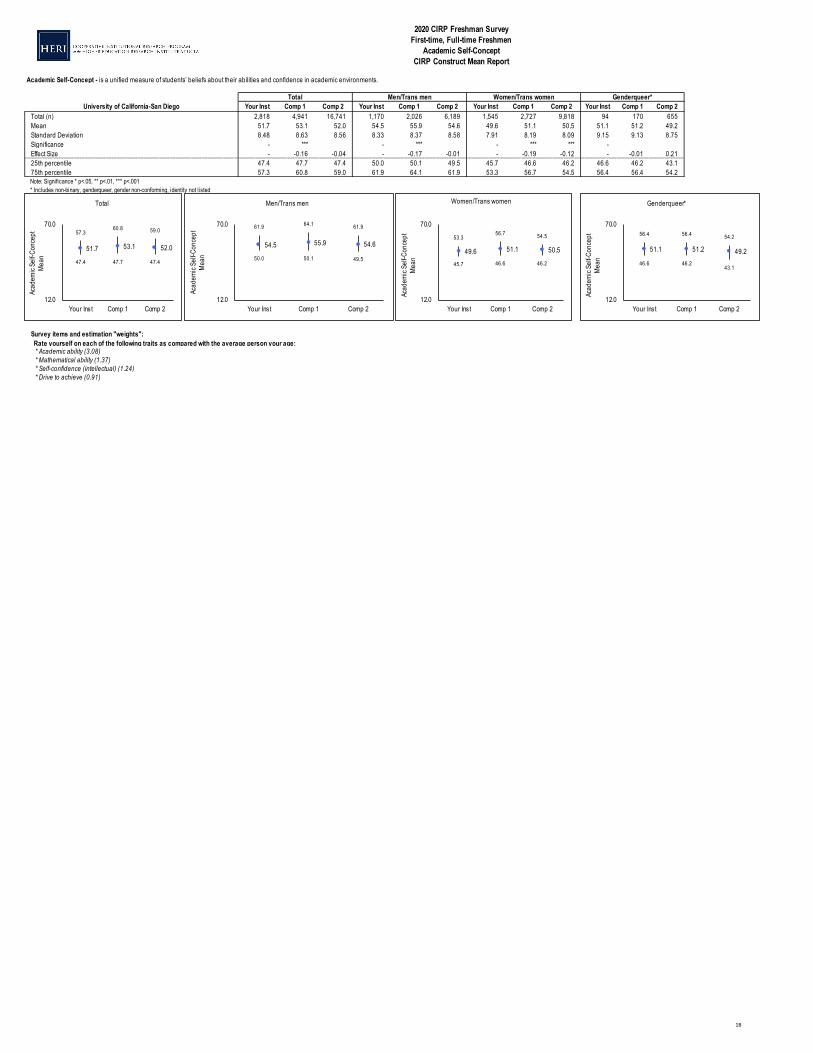
University of California-San Diego Your Inst Comp 1 Comp 2 Your Inst Comp 1 Comp 2 Your Inst Comp 1 Comp 2 Your Inst Comp 1 Comp 2Total (n) 2,818 4,941 16,741 1,170 2,026 6,189 1,545 2,727 9,818 94 170 655Mean 51.7 53.1 52.0 54.5 55.9 54.6 49.6 51.1 50.5 51.1 51.2 49.2Standard Deviation 8.48 8.63 8.56 8.33 8.37 8.58 7.91 8.19 8.09 9.15 9.13 8.75Significance - *** - *** - *** *** - Effect Size - -0.16 -0.04 - -0.17 -0.01 - -0.19 -0.12 - -0.01 0.2125th percentile 47.4 47.7 47.4 50.0 50.1 49.5 45.7 46.6 46.2 46.6 46.2 43.175th percentile 57.3 60.8 59.0 61.9 64.1 61.9 53.3 56.7 54.5 56.4 56.4 54.2
* Academic ability (3.08)* Mathematical ability (1.37)* Self-confidence (intellectual) (1.24)* Drive to achieve (0.91)
Genderqueer*
2020 CIRP Freshman SurveyFirst-time, Full-time Freshmen
Academic Self-ConceptCIRP Construct Mean Report
Survey items and estimation "weights": Rate yourself on each of the following traits as compared with the average person your age:
Note: Significance * p<.05, ** p<.01, *** p<.001
Academic Self-Concept - is a unified measure of students’ beliefs about their abilities and confidence in academic environments.
Total Men/Trans men Women/Trans women
* Includes non-binary, genderqueer, gender non-conforming, identity not listed
47.4 47.7 47.4
57.360.8 59.0
51.7 53.1 52.0
12.0
70.0
Your Inst Comp 1 Comp 2
Acad
emic
Self-
Conc
ept
Mea
n
Total
50.0 50.1 49.5
61.9 64.1 61.9
54.5 55.9 54.6
12.0
70.0
Your Inst Comp 1 Comp 2
Acad
emic
Self-
Conc
ept
Mea
nMen/Trans men
45.7 46.6 46.2
53.356.7 54.5
49.6 51.1 50.5
12.0
70.0
Your Inst Comp 1 Comp 2
Acad
emic
Self-
Conc
ept
Mea
n
Women/Trans women
46.6 46.243.1
56.4 56.4 54.2
51.1 51.2 49.2
12.0
70.0
Your Inst Comp 1 Comp 2
Acad
emic
Self-
Conc
ept
Mea
n
Genderqueer*

1C
University of California-San Diego Your Inst Comp 1 Comp 2 Your Inst Comp 1 Comp 2 Your Inst Comp 1 Comp 2 Your Inst Comp 1 Comp 2Total (n) 2,817 4,940 16,740 1,170 2,026 6,189 1,545 2,727 9,819 94 170 655Mean 47.7 48.5 49.7 48.7 49.4 50.7 46.9 47.7 49.1 48.5 48.7 49.3Standard Deviation 8.47 8.44 8.39 8.73 8.79 8.56 8.13 8.09 8.20 9.36 8.89 8.67Significance - *** *** - * *** - ** *** - Effect Size - -0.09 -0.24 - -0.08 -0.23 - -0.10 -0.27 - -0.02 -0.0925th percentile 42.1 42.1 44.6 42.1 43.4 44.6 41.3 42.1 44.3 42.1 42.1 43.775th percentile 52.2 53.7 54.8 54.8 54.8 56.4 52.2 52.2 54.8 54.8 54.5 54.8
* Includes non-binary, genderqueer, gender non-conforming, identity not listed
Genderqueer*
2020 CIRP Freshman SurveyFirst-time, Full-time Freshmen
Social Self-ConceptCIRP Construct Mean Report
Social Self-Concept - is a unified measure of students’ beliefs about their abilities and confidence in social situations.
Note: Significance * p<.05, ** p<.01, *** p<.001
Total Men/Trans men Women/Trans women
Survey items and estimation "weights": Rate yourself on each of the following traits as compared with the average person your age:
* Public speaking ability (1.90)
* Self-confidence (social) (1.55)* Leadership ability (2.43)
42.1 42.1 44.6
52.2 53.7 54.8
47.7 48.5 49.7
17.0
70.1
Your Inst Comp 1 Comp 2
Socia
l Sel
f-Con
cept
Mea
n
Total
42.1 43.4 44.6
54.8 54.8 56.4
48.7 49.4 50.7
17.0
70.1
Your Inst Comp 1 Comp 2
Socia
l Sel
f-Con
cept
Mea
nMen/Trans men
41.3 42.1 44.3
52.2 52.2 54.8
46.9 47.7 49.1
17.0
70.1
Your Inst Comp 1 Comp 2
Socia
l Sel
f-Con
cept
Mea
n
Women/Trans women
42.1 42.1 43.7
54.8 54.5 54.8
48.5 48.7 49.3
17.0
70.1
Your Inst Comp 1 Comp 2
Socia
l Sel
f-Con
cept
Mea
n
Genderqueer*
1D
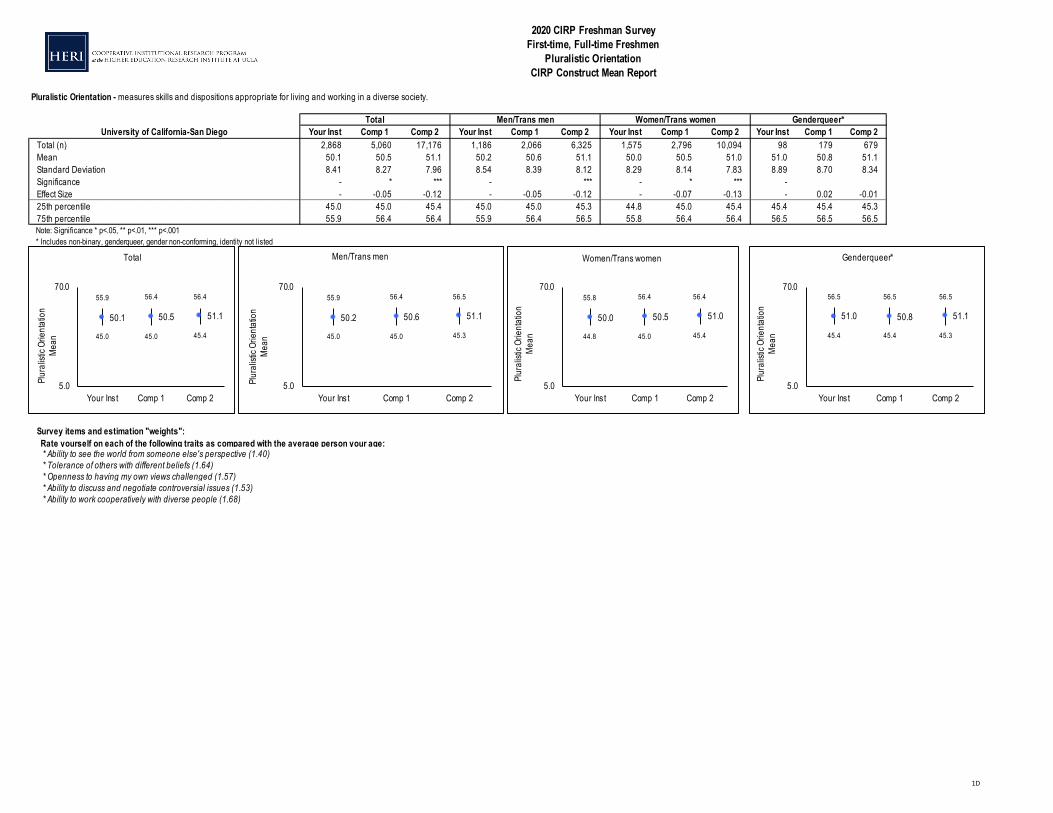
University of California-San Diego Your Inst Comp 1 Comp 2 Your Inst Comp 1 Comp 2 Your Inst Comp 1 Comp 2 Your Inst Comp 1 Comp 2Total (n) 2,868 5,060 17,176 1,186 2,066 6,325 1,575 2,796 10,094 98 179 679Mean 50.1 50.5 51.1 50.2 50.6 51.1 50.0 50.5 51.0 51.0 50.8 51.1Standard Deviation 8.41 8.27 7.96 8.54 8.39 8.12 8.29 8.14 7.83 8.89 8.70 8.34Significance - * *** - *** - * *** - Effect Size - -0.05 -0.12 - -0.05 -0.12 - -0.07 -0.13 - 0.02 -0.0125th percentile 45.0 45.0 45.4 45.0 45.0 45.3 44.8 45.0 45.4 45.4 45.4 45.375th percentile 55.9 56.4 56.4 55.9 56.4 56.5 55.8 56.4 56.4 56.5 56.5 56.5
Genderqueer*
2020 CIRP Freshman SurveyFirst-time, Full-time Freshmen
Pluralistic OrientationCIRP Construct Mean Report
Pluralistic Orientation - measures skills and dispositions appropriate for living and working in a diverse society.
Total Men/Trans men Women/Trans women
Note: Significance * p<.05, ** p<.01, *** p<.001
Survey items and estimation "weights": Rate yourself on each of the following traits as compared with the average person your age:
* Tolerance of others with different beliefs (1.64)* Ability to see the world from someone else's perspective (1.40)
* Openness to having my own views challenged (1.57)
* Ability to work cooperatively with diverse people (1.68)* Ability to discuss and negotiate controversial issues (1.53)
* Includes non-binary, genderqueer, gender non-conforming, identity not listed
45.0 45.0 45.4
55.9 56.4 56.4
50.1 50.5 51.1
5.0
70.0
Your Inst Comp 1 Comp 2
Plur
alist
ic Or
ient
atio
nM
ean
Total
45.0 45.0 45.3
55.9 56.4 56.5
50.2 50.6 51.1
5.0
70.0
Your Inst Comp 1 Comp 2
Plur
alist
ic Or
ient
atio
nM
ean
Men/Trans men
44.8 45.0 45.4
55.8 56.4 56.4
50.0 50.5 51.0
5.0
70.0
Your Inst Comp 1 Comp 2
Plur
alist
ic Or
ient
atio
nM
ean
Women/Trans women
45.4 45.4 45.3
56.5 56.5 56.5
51.0 50.8 51.1
5.0
70.0
Your Inst Comp 1 Comp 2
Plur
alist
ic Or
ient
atio
nM
ean
Genderqueer*
1E
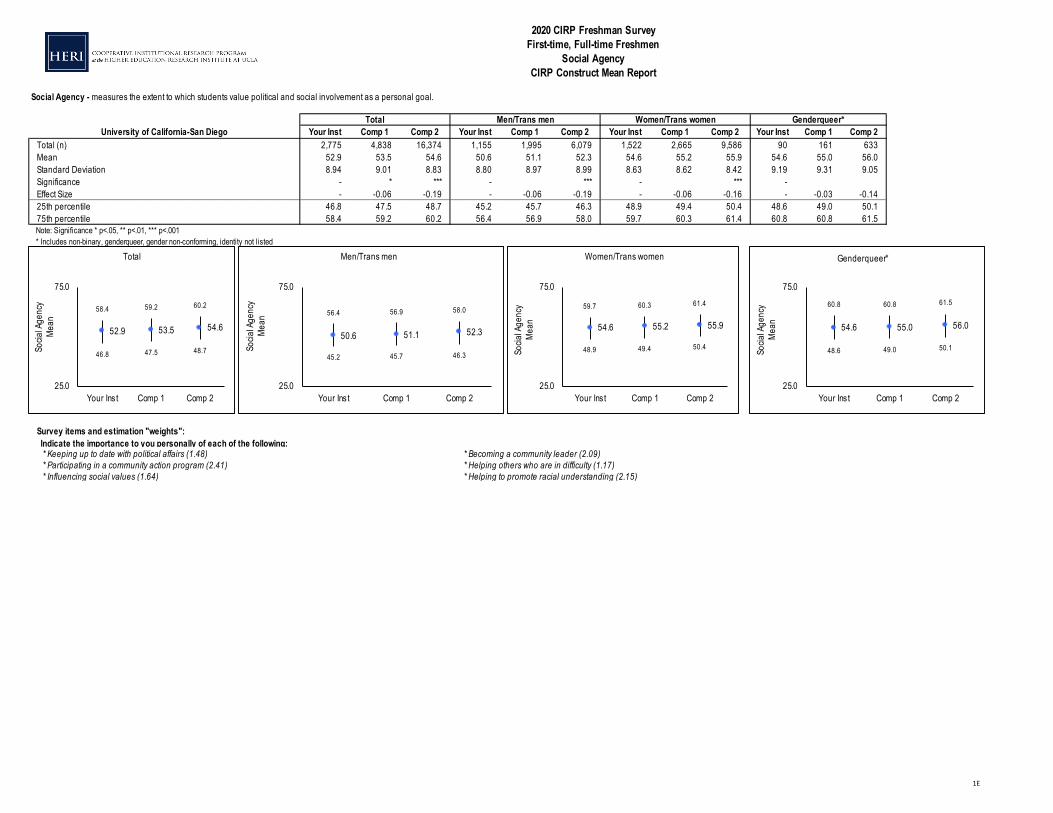
University of California-San Diego Your Inst Comp 1 Comp 2 Your Inst Comp 1 Comp 2 Your Inst Comp 1 Comp 2 Your Inst Comp 1 Comp 2Total (n) 2,775 4,838 16,374 1,155 1,995 6,079 1,522 2,665 9,586 90 161 633Mean 52.9 53.5 54.6 50.6 51.1 52.3 54.6 55.2 55.9 54.6 55.0 56.0Standard Deviation 8.94 9.01 8.83 8.80 8.97 8.99 8.63 8.62 8.42 9.19 9.31 9.05Significance - * *** - *** - *** - Effect Size - -0.06 -0.19 - -0.06 -0.19 - -0.06 -0.16 - -0.03 -0.1425th percentile 46.8 47.5 48.7 45.2 45.7 46.3 48.9 49.4 50.4 48.6 49.0 50.175th percentile 58.4 59.2 60.2 56.4 56.9 58.0 59.7 60.3 61.4 60.8 60.8 61.5
Genderqueer*
2020 CIRP Freshman SurveyFirst-time, Full-time Freshmen
Social AgencyCIRP Construct Mean Report
Social Agency - measures the extent to which students value political and social involvement as a personal goal.
* Keeping up to date with political affairs (1.48) * Becoming a community leader (2.09)
Note: Significance * p<.05, ** p<.01, *** p<.001
Total Men/Trans men Women/Trans women
* Includes non-binary, genderqueer, gender non-conforming, identity not listed
* Participating in a community action program (2.41)* Helping to promote racial understanding (2.15)* Influencing social values (1.64)* Helping others who are in difficulty (1.17)
Survey items and estimation "weights": Indicate the importance to you personally of each of the following:
46.8 47.5 48.7
58.4 59.2 60.2
52.9 53.5 54.6
25.0
75.0
Your Inst Comp 1 Comp 2
Socia
l Age
ncy
Mea
n
Total
45.2 45.7 46.3
56.4 56.9 58.0
50.6 51.1 52.3
25.0
75.0
Your Inst Comp 1 Comp 2
Socia
l Age
ncy
Mea
nMen/Trans men
48.9 49.4 50.4
59.7 60.3 61.4
54.6 55.2 55.9
25.0
75.0
Your Inst Comp 1 Comp 2
Socia
l Age
ncy
Mea
n
Women/Trans women
48.6 49.0 50.1
60.8 60.8 61.5
54.6 55.0 56.0
25.0
75.0
Your Inst Comp 1 Comp 2
Socia
l Age
ncy
Mea
n
Genderqueer*
1F
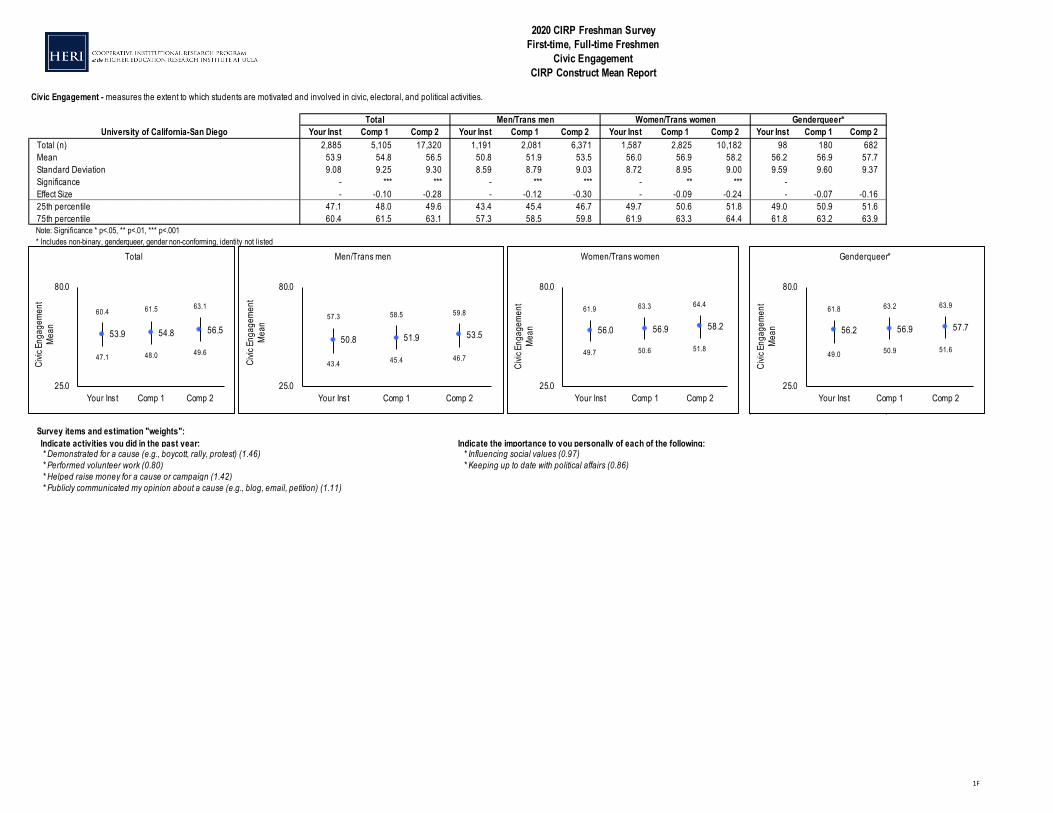
University of California-San Diego Your Inst Comp 1 Comp 2 Your Inst Comp 1 Comp 2 Your Inst Comp 1 Comp 2 Your Inst Comp 1 Comp 2Total (n) 2,885 5,105 17,320 1,191 2,081 6,371 1,587 2,825 10,182 98 180 682Mean 53.9 54.8 56.5 50.8 51.9 53.5 56.0 56.9 58.2 56.2 56.9 57.7Standard Deviation 9.08 9.25 9.30 8.59 8.79 9.03 8.72 8.95 9.00 9.59 9.60 9.37Significance - *** *** - *** *** - ** *** - Effect Size - -0.10 -0.28 - -0.12 -0.30 - -0.09 -0.24 - -0.07 -0.1625th percentile 47.1 48.0 49.6 43.4 45.4 46.7 49.7 50.6 51.8 49.0 50.9 51.675th percentile 60.4 61.5 63.1 57.3 58.5 59.8 61.9 63.3 64.4 61.8 63.2 63.9
Genderqueer*
2020 CIRP Freshman SurveyFirst-time, Full-time Freshmen
Civic EngagementCIRP Construct Mean Report
Civic Engagement - measures the extent to which students are motivated and involved in civic, electoral, and political activities.
Genderqueer*
Note: Significance * p<.05, ** p<.01, *** p<.001
Total Men/Trans men Women/Trans women
* Includes non-binary, genderqueer, gender non-conforming, identity not listed
* Publicly communicated my opinion about a cause (e.g., blog, email, petition) (1.11)
Survey items and estimation "weights": Indicate activities you did in the past year:
Indicate the importance to you personally of each of the following:
* Helped raise money for a cause or campaign (1.42)
* Demonstrated for a cause (e.g., boycott, rally, protest) (1.46) * Influencing social values (0.97)* Performed volunteer work (0.80) * Keeping up to date with political affairs (0.86)
47.1 48.0 49.6
60.4 61.5 63.1
53.9 54.8 56.5
25.0
80.0
Your Inst Comp 1 Comp 2
Civic
Eng
agem
ent
Mea
n
Total
43.4 45.4 46.7
57.3 58.5 59.8
50.8 51.9 53.5
25.0
80.0
Your Inst Comp 1 Comp 2
Civic
Eng
agem
ent
Mea
nMen/Trans men
49.7 50.6 51.8
61.9 63.3 64.4
56.0 56.9 58.2
25.0
80.0
Your Inst Comp 1 Comp 2
Civic
Eng
agem
ent
Mea
n
Women/Trans women
49.0 50.9 51.6
61.8 63.2 63.9
56.2 56.9 57.7
25.0
80.0
Your Inst Comp 1 Comp 2
Civic
Eng
agem
ent
Mea
n
Genderqueer*

1G
University of California-San Diego Your Inst Comp 1 Comp 2 Your Inst Comp 1 Comp 2 Your Inst Comp 1 Comp 2 Your Inst Comp 1 Comp 2Total (n) 2,790 4,881 16,521 1,162 2,011 6,133 1,529 2,690 9,670 91 163 642Mean 50.8 51.9 52.0 49.8 51.0 51.2 51.6 52.6 52.6 49.6 50.6 51.4Standard Deviation 8.14 7.90 7.66 8.13 7.96 7.77 8.00 7.71 7.51 9.07 8.98 8.10Significance - *** *** - *** *** - *** *** - *Effect Size - -0.13 -0.15 - -0.15 -0.18 - -0.13 -0.13 - -0.11 -0.2325th percentile 44.0 46.0 46.0 44.0 46.0 46.0 46.0 46.0 46.0 43.3 44.0 46.075th percentile 60.3 60.3 60.3 60.3 60.3 60.3 60.3 60.3 60.3 60.3 60.3 60.3
Genderqueer*
2020 CIRP Freshman SurveyFirst-time, Full-time FreshmenCollege Reputation OrientationCIRP Construct Mean Report
College Reputation Orientation - measures the degree to which students value academic reputation and future career potential as a reason for choosing this college.
* This college's graduates gain admission to top graduate/professional schools (2.10)
Total Men/Trans men Women/Trans women
* Includes non-binary, genderqueer, gender non-conforming, identity not listed
* This college has a very good academic reputation (1.48)
* This college's graduates get good jobs (4.90)
Survey items and estimation "weights": How important was each reason in your decision to come here?
Note: Significance * p<.05, ** p<.01, *** p<.001
44.046.0 46.0
60.3 60.3 60.3
50.8 51.9 52.0
30.0
65.0
Your Inst Comp 1 Comp 2
Colle
ge R
eput
ation
Mea
n
Total
44.046.0 46.0
60.3 60.3 60.3
49.8 51.0 51.2
30.0
65.0
Your Inst Comp 1 Comp 2
Colle
ge R
eput
ation
Mea
nMen/Trans men
46.0 46.0 46.0
60.3 60.3 60.3
51.6 52.6 52.6
30.0
65.0
Your Inst Comp 1 Comp 2
Colle
ge R
eput
ation
Mea
n
Women/Trans women
43.3 44.046.0
60.3 60.3 60.3
49.6 50.6 51.4
30.0
65.0
Your Inst Comp 1 Comp 2
Colle
ge R
eput
ation
Mea
n
Genderqueer*
1H
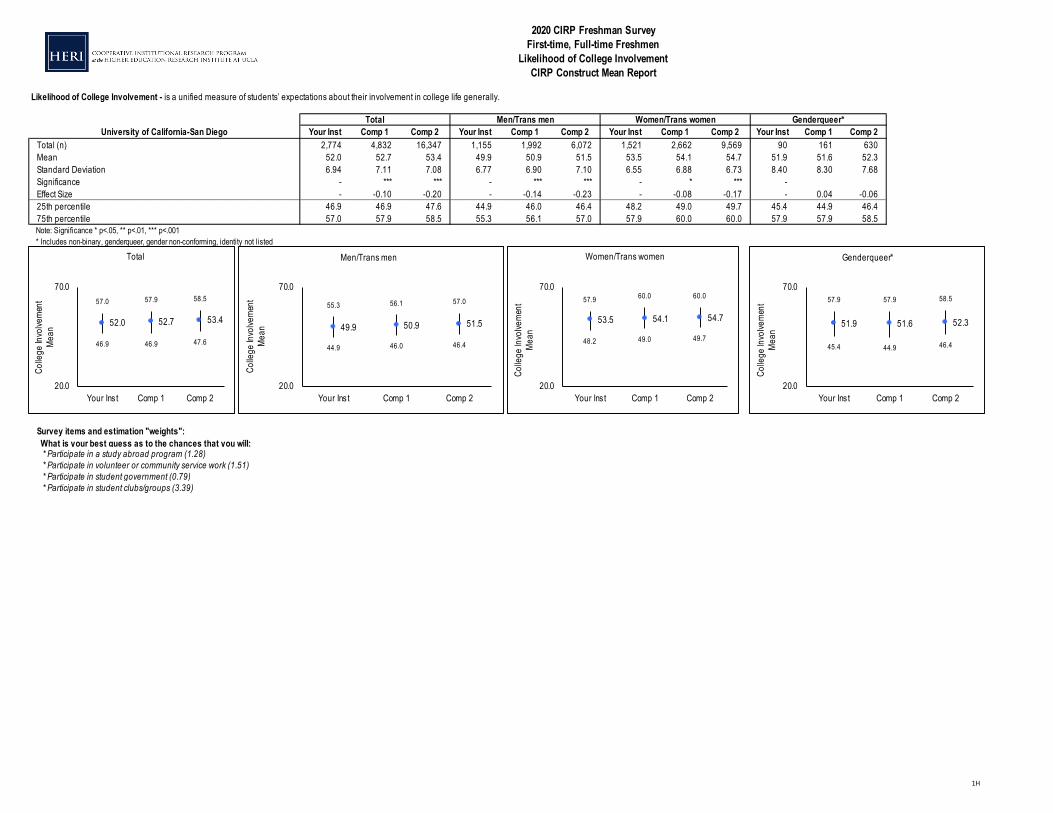
University of California-San Diego Your Inst Comp 1 Comp 2 Your Inst Comp 1 Comp 2 Your Inst Comp 1 Comp 2 Your Inst Comp 1 Comp 2Total (n) 2,774 4,832 16,347 1,155 1,992 6,072 1,521 2,662 9,569 90 161 630Mean 52.0 52.7 53.4 49.9 50.9 51.5 53.5 54.1 54.7 51.9 51.6 52.3Standard Deviation 6.94 7.11 7.08 6.77 6.90 7.10 6.55 6.88 6.73 8.40 8.30 7.68Significance - *** *** - *** *** - * *** - Effect Size - -0.10 -0.20 - -0.14 -0.23 - -0.08 -0.17 - 0.04 -0.0625th percentile 46.9 46.9 47.6 44.9 46.0 46.4 48.2 49.0 49.7 45.4 44.9 46.475th percentile 57.0 57.9 58.5 55.3 56.1 57.0 57.9 60.0 60.0 57.9 57.9 58.5
Survey items and estimation "weights": What is your best guess as to the chances that you will:
* Participate in student government (0.79)* Participate in student clubs/groups (3.39)
* Participate in volunteer or community service work (1.51)
Note: Significance * p<.05, ** p<.01, *** p<.001 * Includes non-binary, genderqueer, gender non-conforming, identity not listed
* Participate in a study abroad program (1.28)
Men/Trans men Women/Trans women Genderqueer*
2020 CIRP Freshman SurveyFirst-time, Full-time Freshmen
Likelihood of College InvolvementCIRP Construct Mean Report
Likelihood of College Involvement - is a unified measure of students’ expectations about their involvement in college life generally.
Total
46.9 46.9 47.6
57.0 57.9 58.5
52.0 52.7 53.4
20.0
70.0
Your Inst Comp 1 Comp 2
Colle
ge In
volve
men
tM
ean
Total
44.9 46.0 46.4
55.3 56.1 57.0
49.9 50.9 51.5
20.0
70.0
Your Inst Comp 1 Comp 2
Colle
ge In
volve
men
tM
ean
Men/Trans men
48.2 49.0 49.7
57.9 60.0 60.0
53.5 54.1 54.7
20.0
70.0
Your Inst Comp 1 Comp 2
Colle
ge In
volve
men
tM
ean
Women/Trans women
45.4 44.9 46.4
57.9 57.9 58.5
51.9 51.6 52.3
20.0
70.0
Your Inst Comp 1 Comp 2
Colle
ge In
volve
men
tM
ean
Genderqueer*

1I
University of California-San Diego Your Inst Comp 1 Comp 2 Your Inst Comp 1 Comp 2 Your Inst Comp 1 Comp 2 Your Inst Comp 1 Comp 2Total (n) 2,834 4,977 16,866 1,175 2,039 6,236 1,555 2,747 9,892 95 172 658Mean 51.5 52.5 52.4 53.2 53.9 53.7 50.3 51.5 51.7 51.6 52.3 51.4Standard Deviation 9.53 9.43 9.26 9.58 9.48 9.18 9.24 9.18 9.17 10.38 10.47 9.82Significance - *** *** - * - *** *** - Effect Size - -0.10 -0.10 - -0.07 -0.05 - -0.14 -0.16 - -0.07 0.0125th percentile 45.0 46.3 46.4 46.4 47.3 47.6 44.3 45.5 45.8 43.3 44.6 44.675th percentile 56.3 57.7 57.5 57.9 59.0 58.6 55.0 56.6 56.8 57.9 57.5 56.6
* Includes non-binary, genderqueer, gender non-conforming, identity not listed
Genderqueer*
2020 CIRP Freshman SurveyFirst-time, Full-time Freshmen
Science Self-EfficacyCIRP Construct Mean Report
Science Self-Efficacy - is a measure of students' confidence in their ability to conduct scientific research
Note: Significance * p<.05, ** p<.01, *** p<.001
Total Men/Trans men Women/Trans women
* Explain the results of a study (2.87) * Understand scientific concepts (2.40)* Use scientific literature to guide research (2.70) * See connections between different areas of science and mathematics (1.90)
Survey items and estimation "weights": How confident are you that you can:
* Use technical science skills (use of tools, instruments, and/or techniques) (1.49) * Integrate results from multiple studies (2.79)* Generate an answerable research question (2.33) * Ask relevant questions (1.73)* Determine how to collect appropriate data (2.82) * Identify what is known and not known about a problem (1.95)
45.0 46.3 46.4
56.3 57.7 57.5
51.5 52.5 52.4
10.0
75.0
Your Inst Comp 1 Comp 2
Scie
nce
Self-
Effic
acy
Mea
n
Total
46.4 47.3 47.6
57.9 59.0 58.6
53.2 53.9 53.7
10.0
75.0
Your Inst Comp 1 Comp 2
Scie
nce
Self-
Effic
acy
Mea
nMen/Trans men
44.3 45.5 45.8
55.0 56.6 56.8
50.3 51.5 51.7
10.0
75.0
Your Inst Comp 1 Comp 2
Scie
nce
Self-
Effic
acy
Mea
n
Women/Trans women
43.3 44.6 44.6
57.9 57.5 56.6
51.6 52.3 51.4
10.0
75.0
Your Inst Comp 1 Comp 2
Scie
nce
Self-
Effic
acy
Mea
n
Genderqueer*

1J
University of California-San Diego Your Inst Comp 1 Comp 2 Your Inst Comp 1 Comp 2 Your Inst Comp 1 Comp 2 Your Inst Comp 1 Comp 2Total (n) 2,779 4,855 16,408 1,158 2,000 6,088 1,522 2,675 9,607 91 163 639Mean 54.2 54.1 50.9 55.2 55.0 52.1 53.5 53.5 50.2 53.8 52.6 49.8Standard Deviation 7.72 8.05 9.03 7.34 7.76 8.70 7.87 8.14 9.14 8.34 8.98 9.28Significance - *** - *** - *** - ***Effect Size - 0.02 0.37 - 0.03 0.37 - 0.00 0.36 - 0.13 0.4325th percentile 50.0 49.3 44.8 51.6 50.7 46.7 49.1 48.6 43.3 48.9 46.7 43.075th percentile 59.5 59.5 57.2 59.5 60.0 57.9 58.7 58.9 56.8 59.5 59.4 56.8
* Includes non-binary, genderqueer, gender non-conforming, identity not listed
Genderqueer*
2020 CIRP Freshman SurveyFirst-time, Full-time Freshmen
Science IdentityCIRP Construct Mean Report
Science Identity - measures the extent to which students conceive of themselves as scientists.
Note: Significance * p<.05, ** p<.01, *** p<.001
Total Men/Trans men Women/Trans women
* I feel like I belong in the field of science (4.43)
Survey items and estimation "weights": To what extent are the following statements true of you:
* I have a strong sense of belonging to a community of scientists (3.52)* I derive great personal satisfaction from working on a team that is doing important research (1.78)* I think of myself as a scientist (5.54)
50.0 49.344.8
59.5 59.557.2
54.2 54.150.9
30.0
75.0
Your Inst Comp 1 Comp 2
Scie
nce
Iden
tityM
ean
Total
51.6 50.746.7
59.5 60.0 57.9
55.2 55.052.1
30.0
75.0
Your Inst Comp 1 Comp 2
Scie
nce
Iden
tityM
ean
Men/Trans men
49.1 48.643.3
58.7 58.9 56.8
53.5 53.550.2
30.0
75.0
Your Inst Comp 1 Comp 2
Scie
nce
Iden
tityM
ean
Women/Trans women
48.9 46.743.0
59.5 59.456.8
53.8 52.6 49.8
30.0
75.0
Your Inst Comp 1 Comp 2
Scie
nce
Iden
tityM
ean
Genderqueer*
H2
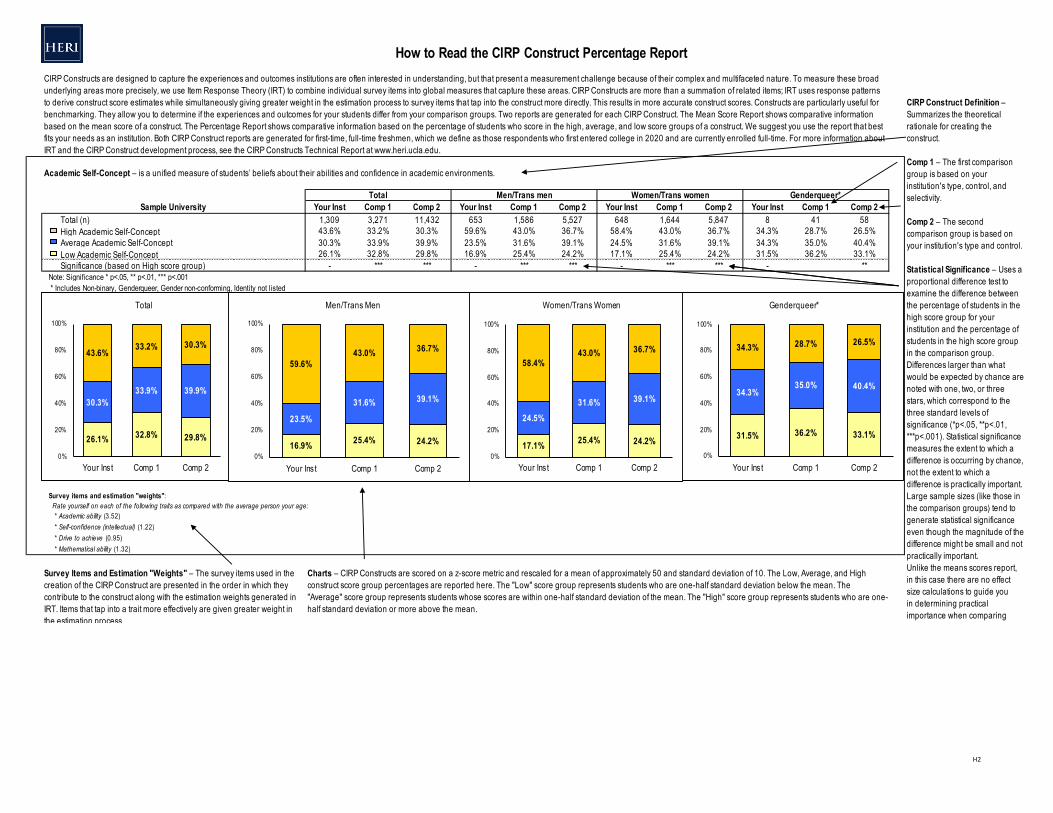
Sample University Your Inst Comp 1 Comp 2 Your Inst Comp 1 Comp 2 Your Inst Comp 1 Comp 2 Your Inst Comp 1 Comp 2Total (n) 1,309 3,271 11,432 653 1,586 5,527 648 1,644 5,847 8 41 58High Academic Self-Concept 43.6% 33.2% 30.3% 59.6% 43.0% 36.7% 58.4% 43.0% 36.7% 34.3% 28.7% 26.5%Average Academic Self-Concept 30.3% 33.9% 39.9% 23.5% 31.6% 39.1% 24.5% 31.6% 39.1% 34.3% 35.0% 40.4%Low Academic Self-Concept 26.1% 32.8% 29.8% 16.9% 25.4% 24.2% 17.1% 25.4% 24.2% 31.5% 36.2% 33.1%Significance (based on High score group) - *** *** - *** *** - *** *** - **
Survey Items and Estimation "Weights" – The survey items used in the creation of the CIRP Construct are presented in the order in which they contribute to the construct along with the estimation weights generated in IRT. Items that tap into a trait more effectively are given greater weight in the estimation process.
How to Read the CIRP Construct Percentage Report
Note: Significance * p<.05, ** p<.01, *** p<.001
CIRP Constructs are designed to capture the experiences and outcomes institutions are often interested in understanding, but that present a measurement challenge because of their complex and multifaceted nature. To measure these broad underlying areas more precisely, we use Item Response Theory (IRT) to combine individual survey items into global measures that capture these areas. CIRP Constructs are more than a summation of related items; IRT uses response patterns to derive construct score estimates while simultaneously giving greater weight in the estimation process to survey items that tap into the construct more directly. This results in more accurate construct scores. Constructs are particularly useful for benchmarking. They allow you to determine if the experiences and outcomes for your students differ from your comparison groups. Two reports are generated for each CIRP Construct. The Mean Score Report shows comparative information based on the mean score of a construct. The Percentage Report shows comparative information based on the percentage of students who score in the high, average, and low score groups of a construct. We suggest you use the report that best fits your needs as an institution. Both CIRP Construct reports are generated for first-time, full-time freshmen, which we define as those respondents who first entered college in 2020 and are currently enrolled full-time. For more information about IRT and the CIRP Construct development process, see the CIRP Constructs Technical Report at www.heri.ucla.edu.
CIRP Construct Definition – Summarizes the theoretical rationale for creating the construct.
Comp 1 – The first comparison group is based on your institution's type, control, and selectivity.
Comp 2 – The second comparison group is based on your institution's type and control.
Statistical Significance – Uses a proportional difference test to examine the difference between the percentage of students in the high score group for your institution and the percentage of students in the high score group in the comparison group. Differences larger than what would be expected by chance are noted with one, two, or three stars, which correspond to the three standard levels of significance (*p<.05, **p<.01, ***p<.001). Statistical significance measures the extent to which a difference is occurring by chance, not the extent to which a difference is practically important. Large sample sizes (like those in the comparison groups) tend to generate statistical significance even though the magnitude of the difference might be small and not practically important.Unlike the means scores report,in this case there are no effectsize calculations to guide youin determining practicalimportance when comparingproportional differences.
Academic Self-Concept – is a unified measure of students’ beliefs about their abilities and confidence in academic environments.
Total Men/Trans men Genderqueer*
Charts – CIRP Constructs are scored on a z-score metric and rescaled for a mean of approximately 50 and standard deviation of 10. The Low, Average, and High construct score group percentages are reported here. The "Low" score group represents students who are one-half standard deviation below the mean. The "Average" score group represents students whose scores are within one-half standard deviation of the mean. The "High" score group represents students who are one-half standard deviation or more above the mean.
* Mathematical ability (1.32)
Survey items and estimation "weights": Rate yourself on each of the following traits as compared with the average person your age:
* Academic ability (3.52)* Self-confidence (intellectual) (1.22)* Drive to achieve (0.95)
Women/Trans women
* Includes Non-binary, Genderqueer, Gender non-conforming, Identity not listed
26.1% 32.8% 29.8%
30.3%33.9% 39.9%
43.6% 33.2% 30.3%
0%
20%
40%
60%
80%
100%
Your Inst Comp 1 Comp 2
Total
26.1% 32.8% 29.8%
30.3%33.9% 39.9%
43.6% 33.2% 30.3%
0%
20%
40%
60%
80%
100%
Your Inst Comp 1 Comp 2
Total
16.9% 25.4% 24.2%
23.5%
31.6% 39.1%
59.6%43.0% 36.7%
0%
20%
40%
60%
80%
100%
Your Inst Comp 1 Comp 2
Men/Trans Men
31.5% 36.2% 33.1%
34.3%35.0% 40.4%
34.3% 28.7% 26.5%
0%
20%
40%
60%
80%
100%
Your Inst Comp 1 Comp 2
Genderqueer*
17.1% 25.4% 24.2%
24.5%31.6% 39.1%
58.4%43.0% 36.7%
0%
20%
40%
60%
80%
100%
Your Inst Comp 1 Comp 2
Women/Trans Women
2A
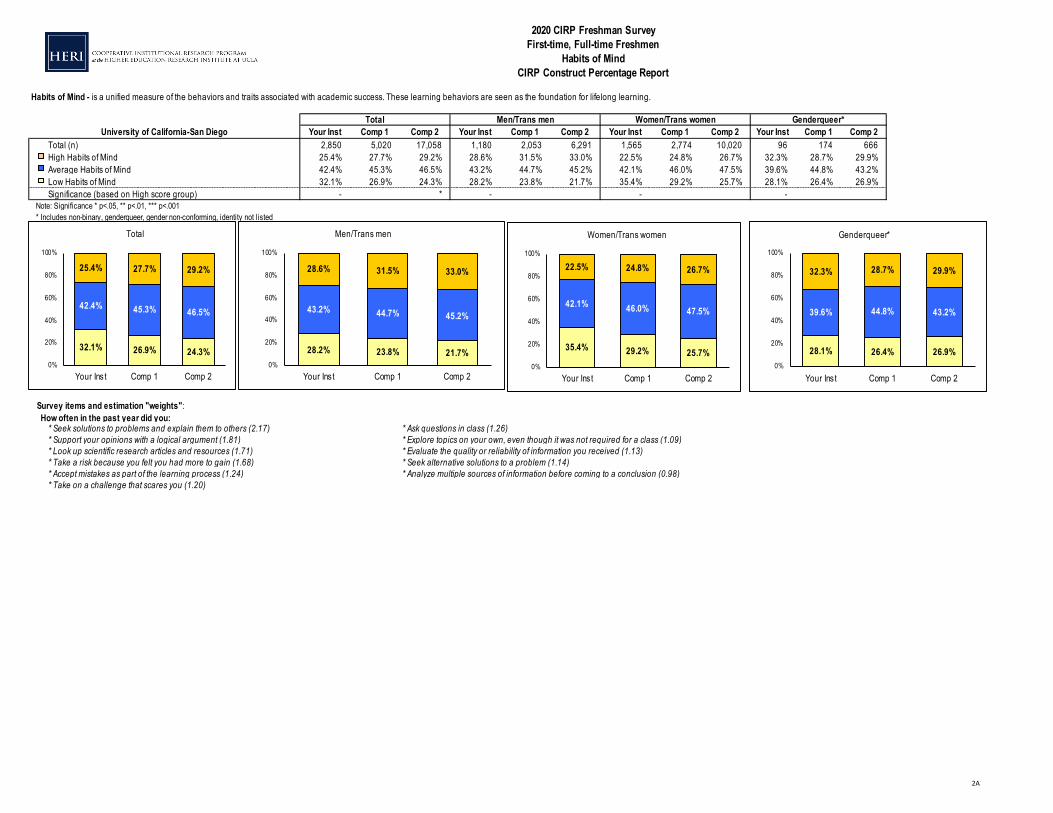
University of California-San Diego Your Inst Comp 1 Comp 2 Your Inst Comp 1 Comp 2 Your Inst Comp 1 Comp 2 Your Inst Comp 1 Comp 2Total (n) 2,850 5,020 17,058 1,180 2,053 6,291 1,565 2,774 10,020 96 174 666High Habits of Mind 25.4% 27.7% 29.2% 28.6% 31.5% 33.0% 22.5% 24.8% 26.7% 32.3% 28.7% 29.9%Average Habits of Mind 42.4% 45.3% 46.5% 43.2% 44.7% 45.2% 42.1% 46.0% 47.5% 39.6% 44.8% 43.2%Low Habits of Mind 32.1% 26.9% 24.3% 28.2% 23.8% 21.7% 35.4% 29.2% 25.7% 28.1% 26.4% 26.9%Significance (based on High score group) - * - - -
* Seek solutions to problems and explain them to others (2.17) * Ask questions in class (1.26)* Support your opinions with a logical argument (1.81) * Explore topics on your own, even though it was not required for a class (1.09)* Look up scientific research articles and resources (1.71) * Evaluate the quality or reliability of information you received (1.13)* Take a risk because you felt you had more to gain (1.68) * Seek alternative solutions to a problem (1.14)* Accept mistakes as part of the learning process (1.24) * Analyze multiple sources of information before coming to a conclusion (0.98)* Take on a challenge that scares you (1.20)
Genderqueer*
2020 CIRP Freshman SurveyFirst-time, Full-time Freshmen
Habits of MindCIRP Construct Percentage Report
Habits of Mind - is a unified measure of the behaviors and traits associated with academic success. These learning behaviors are seen as the foundation for lifelong learning.
Note: Significance * p<.05, ** p<.01, *** p<.001
Survey items and estimation "weights": How often in the past year did you:
* Includes non-binary, genderqueer, gender non-conforming, identity not listed
Total Men/Trans men Women/Trans women
32.1% 26.9% 24.3%
42.4% 45.3% 46.5%
25.4% 27.7% 29.2%
0%
20%
40%
60%
80%
100%
Your Inst Comp 1 Comp 2
Total
28.2% 23.8% 21.7%
43.2% 44.7% 45.2%
28.6% 31.5% 33.0%
0%
20%
40%
60%
80%
100%
Your Inst Comp 1 Comp 2
Men/Trans men
35.4% 29.2% 25.7%
42.1% 46.0% 47.5%
22.5% 24.8% 26.7%
0%
20%
40%
60%
80%
100%
Your Inst Comp 1 Comp 2
Women/Trans women
28.1% 26.4% 26.9%
39.6% 44.8% 43.2%
32.3% 28.7% 29.9%
0%
20%
40%
60%
80%
100%
Your Inst Comp 1 Comp 2
Genderqueer*
2B
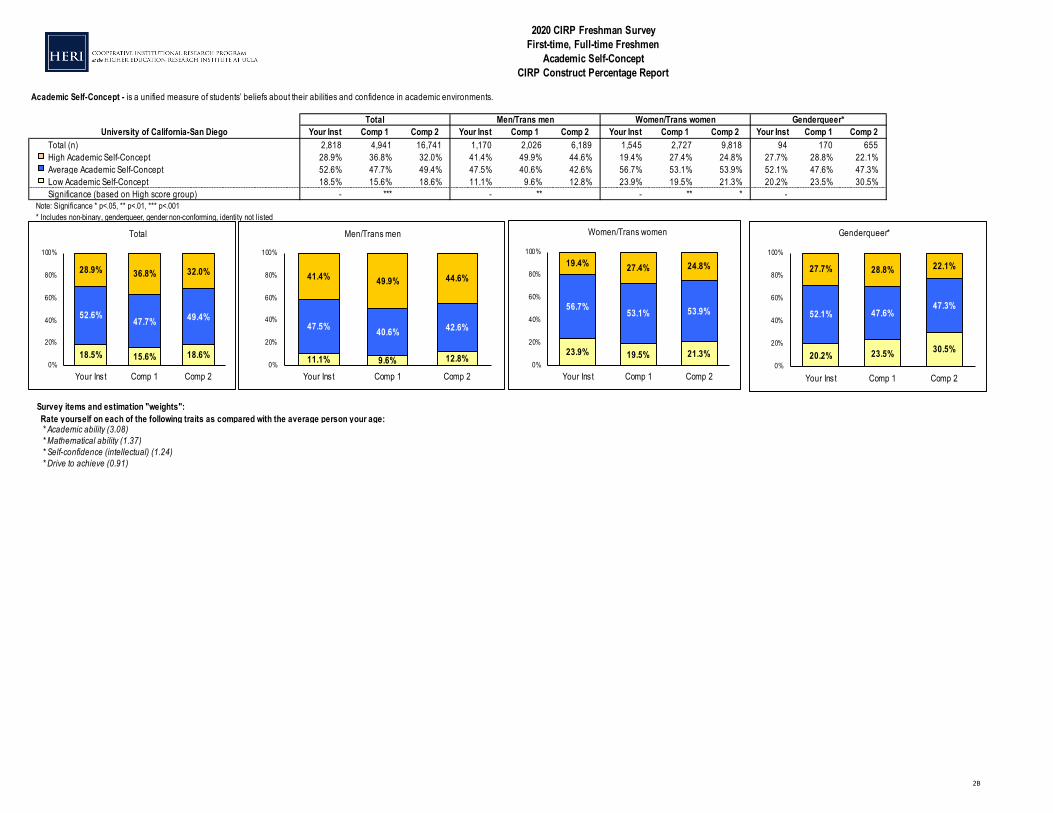
University of California-San Diego Your Inst Comp 1 Comp 2 Your Inst Comp 1 Comp 2 Your Inst Comp 1 Comp 2 Your Inst Comp 1 Comp 2Total (n) 2,818 4,941 16,741 1,170 2,026 6,189 1,545 2,727 9,818 94 170 655High Academic Self-Concept 28.9% 36.8% 32.0% 41.4% 49.9% 44.6% 19.4% 27.4% 24.8% 27.7% 28.8% 22.1%Average Academic Self-Concept 52.6% 47.7% 49.4% 47.5% 40.6% 42.6% 56.7% 53.1% 53.9% 52.1% 47.6% 47.3%Low Academic Self-Concept 18.5% 15.6% 18.6% 11.1% 9.6% 12.8% 23.9% 19.5% 21.3% 20.2% 23.5% 30.5%Significance (based on High score group) - *** - ** - ** * -
* Academic ability (3.08)* Mathematical ability (1.37)* Self-confidence (intellectual) (1.24)* Drive to achieve (0.91)
Genderqueer*
Academic Self-Concept - is a unified measure of students’ beliefs about their abilities and confidence in academic environments.
2020 CIRP Freshman SurveyFirst-time, Full-time Freshmen
Academic Self-ConceptCIRP Construct Percentage Report
Total Men/Trans men Women/Trans women
Note: Significance * p<.05, ** p<.01, *** p<.001
Survey items and estimation "weights": Rate yourself on each of the following traits as compared with the average person your age:
* Includes non-binary, genderqueer, gender non-conforming, identity not listed
18.5% 15.6% 18.6%
52.6% 47.7% 49.4%
28.9% 36.8% 32.0%
0%
20%
40%
60%
80%
100%
Your Inst Comp 1 Comp 2
Total
11.1% 9.6% 12.8%
47.5% 40.6% 42.6%
41.4% 49.9% 44.6%
0%
20%
40%
60%
80%
100%
Your Inst Comp 1 Comp 2
Men/Trans men
23.9% 19.5% 21.3%
56.7% 53.1% 53.9%
19.4% 27.4% 24.8%
0%
20%
40%
60%
80%
100%
Your Inst Comp 1 Comp 2
Women/Trans women
20.2% 23.5% 30.5%
52.1% 47.6%47.3%
27.7% 28.8% 22.1%
0%
20%
40%
60%
80%
100%
Your Inst Comp 1 Comp 2
Genderqueer*

2C
University of California-San Diego Your Inst Comp 1 Comp 2 Your Inst Comp 1 Comp 2 Your Inst Comp 1 Comp 2 Your Inst Comp 1 Comp 2Total (n) 2,817 4,940 16,740 1,170 2,026 6,189 1,545 2,727 9,819 94 170 655High Social Self-Concept 15.2% 18.5% 23.2% 18.4% 22.4% 27.2% 12.2% 15.3% 20.8% 22.3% 22.4% 21.4%Average Social Self-Concept 43.3% 43.7% 44.7% 43.5% 42.8% 44.2% 43.5% 44.6% 45.2% 36.2% 38.8% 42.1%Low Social Self-Concept 41.5% 37.9% 32.1% 38.1% 34.8% 28.6% 44.3% 40.2% 34.0% 41.5% 38.8% 36.5%Significance (based on High score group) - *** - ** - ** -
Genderqueer*
2020 CIRP Freshman SurveyFirst-time, Full-time Freshmen
Social Self-ConceptCIRP Construct Percentage Report
Social Self-Concept - is a unified measure of students’ beliefs about their abilities and confidence in social situations.
Total Men/Trans men Women/Trans women
Survey items and estimation "weights": Rate yourself on each of the following traits as compared with the average person your age:
* Self-confidence (social) (1.55)
Note: Significance * p<.05, ** p<.01, *** p<.001
* Leadership ability (2.43)* Public speaking ability (1.90)
* Includes non-binary, genderqueer, gender non-conforming, identity not listed
41.5% 37.9% 32.1%
43.3% 43.7% 44.7%
15.2% 18.5% 23.2%
0%
20%
40%
60%
80%
100%
Your Inst Comp 1 Comp 2
Total
38.1% 34.8% 28.6%
43.5% 42.8% 44.2%
18.4% 22.4% 27.2%
0%
20%
40%
60%
80%
100%
Your Inst Comp 1 Comp 2
Men/Trans men
44.3% 40.2% 34.0%
43.5% 44.6% 45.2%
12.2% 15.3% 20.8%
0%
20%
40%
60%
80%
100%
Your Inst Comp 1 Comp 2
Women/Trans women
41.5% 38.8% 36.5%
36.2% 38.8% 42.1%
22.3% 22.4% 21.4%
0%
20%
40%
60%
80%
100%
Your Inst Comp 1 Comp 2
Genderqueer*

2D
University of California-San Diego Your Inst Comp 1 Comp 2 Your Inst Comp 1 Comp 2 Your Inst Comp 1 Comp 2 Your Inst Comp 1 Comp 2Total (n) 2,868 5,060 17,176 1,186 2,066 6,325 1,575 2,796 10,094 98 179 679High Pluralistic Orientation 28.6% 30.2% 31.8% 29.3% 30.5% 32.6% 27.7% 29.7% 31.2% 33.7% 34.1% 33.6%Average Pluralistic Orientation 46.4% 47.0% 48.0% 46.0% 46.2% 47.2% 46.8% 47.8% 48.7% 42.9% 44.7% 45.1%Low Pluralistic Orientation 25.0% 22.8% 20.2% 24.7% 23.3% 20.2% 25.5% 22.5% 20.2% 23.5% 21.2% 21.4%Significance (based on High score group) - - - -
Genderqueer*
2020 CIRP Freshman SurveyFirst-time, Full-time Freshmen
Pluralistic OrientationCIRP Construct Percentage Report
Pluralistic Orientation - measures skills and dispositions appropriate for living and working in a diverse society.
* Ability to discuss and negotiate controversial issues (1.53)
* Includes non-binary, genderqueer, gender non-conforming, identity not listed
* Ability to work cooperatively with diverse people (1.68)
Total Men/Trans men Women/Trans women
Note: Significance * p<.05, ** p<.01, *** p<.001
Survey items and estimation "weights": Rate yourself on each of the following traits as compared with the average person your age:
* Openness to having my own views challenged (1.57)* Tolerance of others with different beliefs (1.64)* Ability to see the world from someone else's perspective (1.40)
25.0% 22.8% 20.2%
46.4% 47.0% 48.0%
28.6% 30.2% 31.8%
0%
20%
40%
60%
80%
100%
Your Inst Comp 1 Comp 2
Total
24.7% 23.3% 20.2%
46.0% 46.2% 47.2%
29.3% 30.5% 32.6%
0%
20%
40%
60%
80%
100%
Your Inst Comp 1 Comp 2
Men/Trans men
25.5% 22.5% 20.2%
46.8% 47.8% 48.7%
27.7% 29.7% 31.2%
0%
20%
40%
60%
80%
100%
Your Inst Comp 1 Comp 2
Women/Trans women
23.5% 21.2% 21.4%
42.9% 44.7% 45.1%
33.7% 34.1% 33.6%
0%
20%
40%
60%
80%
100%
Your Inst Comp 1 Comp 2
Genderqueer*

2E
University of California-San Diego Your Inst Comp 1 Comp 2 Your Inst Comp 1 Comp 2 Your Inst Comp 1 Comp 2 Your Inst Comp 1 Comp 2Total (n) 2,775 4,838 16,374 1,155 1,995 6,079 1,522 2,665 9,586 90 161 633High Social Agency 40.5% 43.0% 47.7% 30.2% 32.7% 37.3% 47.9% 50.3% 53.8% 48.9% 49.7% 54.7%Average Social Agency 42.7% 41.0% 39.5% 46.1% 44.1% 43.5% 40.3% 38.7% 37.2% 40.0% 39.8% 35.7%Low Social Agency 16.7% 16.0% 12.8% 23.7% 23.3% 19.2% 11.8% 11.0% 9.0% 11.1% 10.6% 9.6%Significance (based on High score group) - *** - * - ** -
Genderqueer*
2020 CIRP Freshman SurveyFirst-time, Full-time Freshmen
Social AgencyCIRP Construct Percentage Report
Social Agency - measures the extent to which students value political and social involvement as a personal goal.
* Influencing social values (1.64) * Helping to promote racial understanding (2.15)
* Keeping up to date with political affairs (1.48) * Becoming a community leader (2.09)* Participating in a community action program (2.41) * Helping others who are in difficulty (1.17)
Note: Significance * p<.05, ** p<.01, *** p<.001
Survey items and estimation "weights": Indicate the importance to you personally of each of the following:
Total Men/Trans men Women/Trans women
* Includes non-binary, genderqueer, gender non-conforming, identity not listed
16.7% 16.0% 12.8%
42.7% 41.0% 39.5%
40.5% 43.0% 47.7%
0%
20%
40%
60%
80%
100%
Your Inst Comp 1 Comp 2
Total
23.7% 23.3% 19.2%
46.1% 44.1% 43.5%
30.2% 32.7% 37.3%
0%
20%
40%
60%
80%
100%
Your Inst Comp 1 Comp 2
Men/Trans men
11.8% 11.0% 9.0%
40.3% 38.7% 37.2%
47.9% 50.3% 53.8%
0%
20%
40%
60%
80%
100%
Your Inst Comp 1 Comp 2
Women/Trans women
11.1% 10.6% 9.6%
40.0% 39.8% 35.7%
48.9% 49.7% 54.7%
0%
20%
40%
60%
80%
100%
Your Inst Comp 1 Comp 2
Genderqueer*

2F
University of California-San Diego Your Inst Comp 1 Comp 2 Your Inst Comp 1 Comp 2 Your Inst Comp 1 Comp 2 Your Inst Comp 1 Comp 2Total (n) 2,885 5,105 17,320 1,191 2,081 6,371 1,587 2,825 10,182 98 180 682High Civic Engagement 45.6% 49.8% 56.3% 31.2% 36.1% 42.6% 55.8% 59.5% 64.5% 55.1% 56.7% 62.8%Average Civic Engagement 36.0% 34.0% 31.8% 40.9% 40.0% 39.1% 32.8% 29.9% 27.5% 30.6% 30.0% 26.7%Low Civic Engagement 18.4% 16.2% 11.9% 28.0% 23.8% 18.3% 11.4% 10.6% 8.0% 14.3% 13.3% 10.6%Significance (based on High score group) - * *** - *** - *** -
Genderqueer*
2020 CIRP Freshman SurveyFirst-time, Full-time Freshmen
Civic EngagementCIRP Construct Percentage Report
Civic Engagement - measures the extent to which students are motivated and involved in civic, electoral, and political activities.
* Helped raise money for a cause or campaign (1.42)* Publicly communicated my opinion about a cause (e.g., blog, email, petition) (1.11)
Note: Significance * p<.05, ** p<.01, *** p<.001
Total Men/Trans men Women/Trans women
Survey items and estimation "weights": Indicate activities you did in the past year:
Indicate the importance to you personally of each of the following:
* Performed volunteer work (0.80)* Demonstrated for a cause (e.g., boycott, rally, protest) (1.46) * Influencing social values (0.97)
* Keeping up to date with political affairs (0.86)
* Includes non-binary, genderqueer, gender non-conforming, identity not listed
18.4% 16.2% 11.9%
36.0% 34.0% 31.8%
45.6% 49.8% 56.3%
0%
20%
40%
60%
80%
100%
Your Inst Comp 1 Comp 2
Total
28.0% 23.8% 18.3%
40.9% 40.0% 39.1%
31.2% 36.1% 42.6%
0%
20%
40%
60%
80%
100%
Your Inst Comp 1 Comp 2
Men/Trans men
11.4% 10.6% 8.0%
32.8% 29.9% 27.5%
55.8% 59.5% 64.5%
0%
20%
40%
60%
80%
100%
Your Inst Comp 1 Comp 2
Women/Trans women
14.3% 13.3% 10.6%
30.6% 30.0% 26.7%
55.1% 56.7% 62.8%
0%
20%
40%
60%
80%
100%
Your Inst Comp 1 Comp 2
Genderqueer*
2G
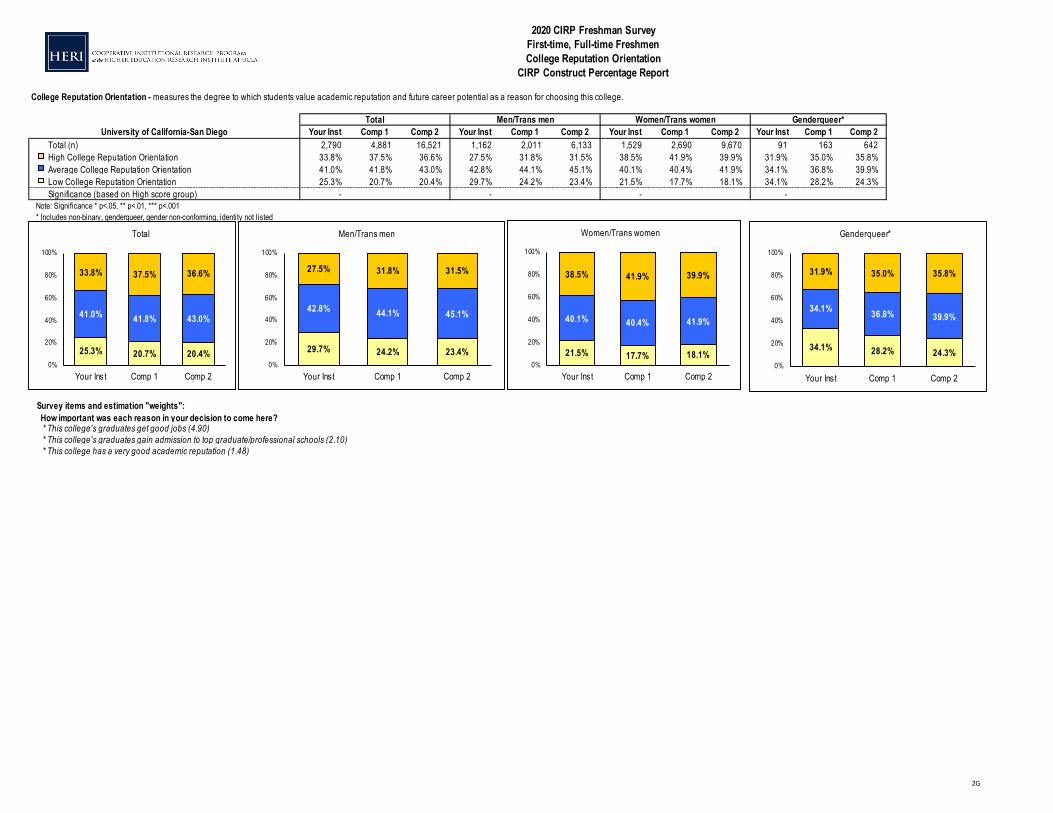
University of California-San Diego Your Inst Comp 1 Comp 2 Your Inst Comp 1 Comp 2 Your Inst Comp 1 Comp 2 Your Inst Comp 1 Comp 2Total (n) 2,790 4,881 16,521 1,162 2,011 6,133 1,529 2,690 9,670 91 163 642High College Reputation Orientation 33.8% 37.5% 36.6% 27.5% 31.8% 31.5% 38.5% 41.9% 39.9% 31.9% 35.0% 35.8%Average College Reputation Orientation 41.0% 41.8% 43.0% 42.8% 44.1% 45.1% 40.1% 40.4% 41.9% 34.1% 36.8% 39.9%Low College Reputation Orientation 25.3% 20.7% 20.4% 29.7% 24.2% 23.4% 21.5% 17.7% 18.1% 34.1% 28.2% 24.3%Significance (based on High score group) - - - -
Genderqueer*
2020 CIRP Freshman SurveyFirst-time, Full-time FreshmenCollege Reputation Orientation
CIRP Construct Percentage Report
College Reputation Orientation - measures the degree to which students value academic reputation and future career potential as a reason for choosing this college.
* This college has a very good academic reputation (1.48)
Note: Significance * p<.05, ** p<.01, *** p<.001
Survey items and estimation "weights": How important was each reason in your decision to come here?
* This college's graduates get good jobs (4.90)* This college's graduates gain admission to top graduate/professional schools (2.10)
Total Men/Trans men Women/Trans women
* Includes non-binary, genderqueer, gender non-conforming, identity not listed
25.3% 20.7% 20.4%
41.0% 41.8% 43.0%
33.8% 37.5% 36.6%
0%
20%
40%
60%
80%
100%
Your Inst Comp 1 Comp 2
Total
29.7% 24.2% 23.4%
42.8% 44.1% 45.1%
27.5% 31.8% 31.5%
0%
20%
40%
60%
80%
100%
Your Inst Comp 1 Comp 2
Men/Trans men
21.5% 17.7% 18.1%
40.1% 40.4% 41.9%
38.5% 41.9% 39.9%
0%
20%
40%
60%
80%
100%
Your Inst Comp 1 Comp 2
Women/Trans women
34.1% 28.2% 24.3%
34.1% 36.8% 39.9%
31.9% 35.0% 35.8%
0%
20%
40%
60%
80%
100%
Your Inst Comp 1 Comp 2
Genderqueer*

2H
University of California-San Diego Your Inst Comp 1 Comp 2 Your Inst Comp 1 Comp 2 Your Inst Comp 1 Comp 2 Your Inst Comp 1 Comp 2Total (n) 2,774 4,832 16,347 1,155 1,992 6,072 1,521 2,662 9,569 90 161 630High Likelihood of College Involvement 38.0% 43.1% 48.3% 25.8% 31.4% 36.0% 47.1% 52.0% 56.5% 37.8% 38.5% 42.4%Average Likelihood of College Involvement 44.8% 41.2% 38.7% 48.7% 47.3% 44.9% 42.1% 37.0% 34.7% 40.0% 36.0% 39.4%Low Likelihood of College Involvement 17.2% 15.7% 13.0% 25.5% 21.3% 19.1% 10.7% 11.0% 8.8% 22.2% 25.5% 18.3%Significance (based on High score group) - ** *** - *** - * *** -
* Includes non-binary, genderqueer, gender non-conforming, identity not listed
Genderqueer*
2020 CIRP Freshman SurveyFirst-time, Full-time Freshmen
Likelihood of College InvolvementCIRP Construct Percentage Report
Likelihood of College Involvement - is a unified measure of students’ expectations about their involvement in college life generally.
Note: Significance * p<.05, ** p<.01, *** p<.001
Total Men/Trans men Women/Trans women
Survey items and estimation "weights": What is your best guess as to the chances that you will:
* Participate in a study abroad program (1.28)* Participate in volunteer or community service work (1.51)* Participate in student government (0.79)* Participate in student clubs/groups (3.39)
17.2% 15.7% 13.0%
44.8% 41.2% 38.7%
38.0% 43.1% 48.3%
0%
20%
40%
60%
80%
100%
Your Inst Comp 1 Comp 2
Total
25.5% 21.3% 19.1%
48.7% 47.3% 44.9%
25.8% 31.4% 36.0%
0%
20%
40%
60%
80%
100%
Your Inst Comp 1 Comp 2
Men/Trans men
10.7% 11.0% 8.8%
42.1% 37.0% 34.7%
47.1% 52.0% 56.5%
0%
20%
40%
60%
80%
100%
Your Inst Comp 1 Comp 2
Women/Trans women
22.2% 25.5% 18.3%
40.0% 36.0% 39.4%
37.8% 38.5% 42.4%
0%
20%
40%
60%
80%
100%
Your Inst Comp 1 Comp 2
Genderqueer*

2I
University of California-San Diego Your Inst Comp 1 Comp 2 Your Inst Comp 1 Comp 2 Your Inst Comp 1 Comp 2 Your Inst Comp 1 Comp 2Total (n) 2,834 4,977 16,866 1,175 2,039 6,236 1,555 2,747 9,892 95 172 658High Science Self-Efficacy 29.4% 34.1% 33.6% 35.1% 39.6% 37.9% 25.1% 30.2% 31.1% 30.5% 32.6% 29.9%Average Science Self-Efficacy 45.5% 44.9% 46.3% 43.9% 42.9% 46.0% 47.1% 46.7% 46.7% 38.9% 40.7% 44.1%Low Science Self-Efficacy 25.1% 21.0% 20.1% 20.9% 17.6% 16.1% 27.8% 23.1% 22.3% 30.5% 26.7% 26.0%Significance (based on High score group) - * * - - * -
* Includes non-binary, genderqueer, gender non-conforming, identity not listed
Genderqueer*
2020 CIRP Freshman SurveyFirst-time, Full-time Freshmen
Science Self-EfficacyCIRP Construct Percentage Report
Science Self-Efficacy - is a measure of students' confidence in their ability to conduct scientific research
Note: Significance * p<.05, ** p<.01, *** p<.001
Total Men/Trans men Women/Trans women
* Explain the results of a study (2.87) * Understand scientific concepts (2.40)* Use scientific literature to guide research (2.70) * See connections between different areas of science and mathematics (1.90)
Survey items and estimation "weights": How confident are you that you can:
* Use technical science skills (use of tools, instruments, and/or techniques) (1.49) * Integrate results from multiple studies (2.79)* Generate an answerable research question (2.33) * Ask relevant questions (1.73)* Determine how to collect appropriate data (2.82) * Identify what is known and not known about a problem (1.95)
25.1% 21.0% 20.1%
45.5% 44.9% 46.3%
29.4% 34.1% 33.6%
0%
20%
40%
60%
80%
100%
Your Inst Comp 1 Comp 2
Total
20.9% 17.6% 16.1%
43.9% 42.9% 46.0%
35.1% 39.6% 37.9%
0%
20%
40%
60%
80%
100%
Your Inst Comp 1 Comp 2
Men/Trans men
27.8% 23.1% 22.3%
47.1% 46.7% 46.7%
25.1% 30.2% 31.1%
0%
20%
40%
60%
80%
100%
Your Inst Comp 1 Comp 2
Women/Trans women
30.5% 26.7% 26.0%
38.9% 40.7% 44.1%
30.5% 32.6% 29.9%
0%
20%
40%
60%
80%
100%
Your Inst Comp 1 Comp 2
Genderqueer*

2J
University of California-San Diego Your Inst Comp 1 Comp 2 Your Inst Comp 1 Comp 2 Your Inst Comp 1 Comp 2 Your Inst Comp 1 Comp 2Total (n) 2,779 4,855 16,408 1,158 2,000 6,088 1,522 2,675 9,607 91 163 639High Science Identity 47.2% 47.6% 35.2% 51.9% 51.7% 38.7% 44.0% 44.9% 33.3% 42.9% 39.3% 30.2%Average Science Identity 41.8% 40.0% 38.9% 40.3% 38.8% 40.7% 43.0% 41.0% 37.8% 40.7% 39.9% 38.3%Low Science Identity 10.9% 12.4% 25.9% 7.8% 9.6% 20.6% 12.9% 14.1% 28.9% 16.5% 20.9% 31.5%Significance (based on High score group) - *** - *** - *** -
* Includes non-binary, genderqueer, gender non-conforming, identity not listed
Genderqueer*
2020 CIRP Freshman SurveyFirst-time, Full-time Freshmen
Science IdentityCIRP Construct Percentage Report
Science Identity - measures the extent to which students conceive of themselves as scientists.
Note: Significance * p<.05, ** p<.01, *** p<.001
Total Men/Trans men Women/Trans women
* I feel like I belong in the field of science (4.43)
Survey items and estimation "weights": To what extent are the following statements true of you:
* I have a strong sense of belonging to a community of scientists (3.52)* I derive great personal satisfaction from working on a team that is doing important research (1.78)* I think of myself as a scientist (5.54)
10.9% 12.4%25.9%
41.8% 40.0%38.9%
47.2% 47.6% 35.2%
0%
20%
40%
60%
80%
100%
Your Inst Comp 1 Comp 2
Total
7.8% 9.6% 20.6%
40.3% 38.8%40.7%
51.9% 51.7%38.7%
0%
20%
40%
60%
80%
100%
Your Inst Comp 1 Comp 2
Men/Trans men
12.9% 14.1%28.9%
43.0% 41.0%37.8%
44.0% 44.9% 33.3%
0%
20%
40%
60%
80%
100%
Your Inst Comp 1 Comp 2
Women/Trans women
16.5% 20.9% 31.5%
40.7% 39.9%38.3%
42.9% 39.3% 30.2%
0%
20%
40%
60%
80%
100%
Your Inst Comp 1 Comp 2
Genderqueer*