circadian field photometry -...
TRANSCRIPT
Circadian field photometry December 1, 2006
PETTERI TEIKARI [email protected] PROJECT WORK OF MEASUREMENT SCIENCE AND TECHNOLOGY F OR THE COURSE
“S-108.3120 PROJECT WORK”
Course credits: ECTS Points
Grade (1-5):
Supervisor’s signature:
M.Sc. Tuomas Hieta
Symbols and abbreviations................................................................................................. 3
1. Introduction............................................................................................................ 4
2. Circadian photobiology ......................................................................................... 6
2.1 Circadian rhythms .........................................................................................................7 2.2 Circadian clock mechanism ..........................................................................................8 2.3 Physiology of the eye ....................................................................................................9
2.3.1 Ophthalmological optics ..................................................................................................... 12 2.3.2 Pupil pathways .................................................................................................................... 15 2.3.3 Eye movements ................................................................................................................... 17
2.4 Light characteristics ....................................................................................................19 2.4.1 Spectrum ............................................................................................................................. 19 2.4.2 Spatial distribution .............................................................................................................. 22 2.4.3 Intensity............................................................................................................................... 23 2.4.4 Timing................................................................................................................................. 24 2.4.5 Duration .............................................................................................................................. 25 2.4.6 Photic history ...................................................................................................................... 26 2.4.7 Polarization ......................................................................................................................... 26
3. Eye and photometric measurements .................................................................. 27
3.1 Electrical activity ........................................................................................................27 3.1.1 Electroretinogram (ERG) .................................................................................................... 27 3.1.2 Electooculogram (EOG)...................................................................................................... 29
3.2 Eye tracking ................................................................................................................30 3.2.1 Pelz et al. (2000, 2004) ....................................................................................................... 32 3.2.2 Li et al. (2006): openEyes ................................................................................................... 33
3.3 Pupil size .....................................................................................................................37 3.3.1 Video-driven infrared pupillography .................................................................................. 38 3.3.2 Photorefractometry.............................................................................................................. 40 3.3.3 Digital photography ............................................................................................................ 41
3.4 Digital-imaging circadian photometry ........................................................................43 3.4.1 Circadian-weighed luminancephotometers (Gall et al., 2004) ............................................43 3.4.2 Digital photography (Hollan et al., 2004) ........................................................................... 45
3.5 Dosimeters ..................................................................................................................47 3.5.1 LichtBlick (Hubalek et al., 2004)........................................................................................ 48 3.5.2 Daysimeter (Bierman et al., 2005) ...................................................................................... 49
4. Dosimeter design and simulation........................................................................ 54
4.1 Eyetracker and/or pupil size measurement..................................................................54 4.2 Dosimeter ....................................................................................................................56
4.2.1 Photodiode-based dosimeter ............................................................................................... 56 4.2.2 Spectroradiometer-based..................................................................................................... 61
5. Conclusions ........................................................................................................... 63
6. References ............................................................................................................. 65

Symbols and abbreviations 3
SYMBOLS AND ABBREVIATIONS
λ wavelength λmax peak wavelength µW/cm2 microwatt per square centimeter A/Hz½ amperes per root hertz A/W amperes per watt
acv circadian action factor Ap pupil area Ar area of the image at the retina As source area B noise bandwidth [Hz] B(λ) action spectra for blue light hazard (ICNIRP) B(λ) “biological/circadian” action spectra b-lx blue-lx, unit for blue-colored illuminance BYλ hypothetical luminous efficiency function for
circadian responses. c(λ) circadian action function cd/m2 candelas per square meter, unit for luminance dB decibel DC direct current dp pupil diameter dr diameter of the image at the retina ds diameter of the source E Energy Ec corneal irradiance en noise voltage density Er retinal irradiance f frequency f focal length g gram h Planck’s constant Hg high-pressure mercury Hz Hertz, unit for frequency Id dark current If feedback (gain) current Ijn Johnson noise current In noise current in noise current density In,e noise current from en in,e noise current density from en Ip photocurrent Itot total noise current J/cm2 Joules per square centimeter K Kelvin, unit for (color) temperature kB Boltzmann constant kbauds/s kilobauds per second lm/w lumens per watt, unit for luminous efficacy Ls source radiance lx lx, unit for illuminance mA milliampere mAh milliampere hour MB megabyte Mbps megabits per second MHz megahertz mm millimeter Mλ melanopsin-containing retinal ganglion cell
spectral efficiency nm nanometer, normal unit for wavelength nV nanovolt pA picoampere Pr retinal power Pλ spectral irradiance at the eye [W/m2/nm] Rf feedback (gain) resistance Rsh shunt resistance Rλ photosensitivity Sλ S cone spectral efficiency T temperature [K] V(λ) spectral sensitivity curve for photopic vision V/Hz½ volts per root hertz V’ λ rod spectral efficiency function V10 photopic spectral sensitivity for centrally fixated
large target
VDC volts, direct current W watt Xec circadian radiation quantity Xv photometric radiation quantity α angular subtense of the source τ lens transmittance Φ luminous flx [lm] Φe,λ Spectral radiance [W·m-2] Ω ohm, unit for resistance Ωs solid angle [sr]
Symbols and abbreviations 4
+/+ wild type mice ADC analog-to-digital converter AgCl silver chloride CBT core body temperature CBTmin core body temperature minimum CCD charge-coupled device CCT correlated color temperature CD compact disc CIE International Commission on Illumination CMOS complementary metal oxide semiconductor CP constant posture CR constant routine CRH corticotropin-releasing hormone CT circadian time DLMO dim light melatonin onset DLMOff dim ligh melatonin offset DLMOn dim light melatonin onset DMH dorsomedial hypothalamic nucleus dmSCN dorsomedial suprachiasmatic nucleus dSPZ dorsal subparaventricular zone EB eye blink ECG electrocardiogram EEG electroencephalogram EOG electrooculogram ERG electroretinogram ERP early-receptor potential EW Edinger-Westphal nucleus fMRI functional magnetic resonance imaging FOV field of view FWHM full width at half maximum GNU GNU's Not Unix GPL General Public License GTP ganosine triphosphate hbw half bandwidth hbw half bandwidth IC integrated circuit IEEE-1394 Institute of Electrical and Electronics Engineers,
standard 1394 (FireWire, i.LINK) INL inner nuclear layer ipRGC intrinsically photosensitive retinal ganglion cell IR infrared IRC intensity response curve IRED infrared LED KRG potassiumretinogram LASIK laser-assisted in situ keratomileusis LCD liquid crystal display LED light emitting diode LGN lateral geniculate nucleus LRP late-receptor potential MPO medial preoptic region mRGC melanopsin-containing retinal ganglion cells M-RGC magno-retinal ganglion cells NIF non-image forming ONL outer nuclear level PF prefrontal PLR pupillary light reflex PPRF paramedine pontine reticular formation PRC phase response curve P-RGC parvo-retinal ganglion cells PRK photorefractive keratectomy PU Pupillary Unrest PUI Pupillary Unrest Index RANSAC Random Sample Consensus REM rapid eye movement sleep RGC retinal ganglion cell RHT retino-hypothalamic tract RI retinal illuminace RMS root-mean-square RS-232 a standard for serial binary data interconnection SCN suprachiasmatic nucleus SD standard deviation SEM slow eye movement SEM standard error of the mean SPD spectral power distribution USB Universial Serial Bus
UV ultraviolet VDT video display terminals VDU video display unit VLPO ventrolateral preoptic nucleus vlSCN ventrolateral suprachiasmatic nucleus vSPZ ventral subparaventricular zone
Introduction 5
1. INTRODUCTION
Over 150 years since the discovery of the retinal rod and cone photoreceptors in 1834, it has been believed that, both visual and biological effects induced by light would be dependent on those two traditional photoreceptors. However in 2002, through the discovery of a novel photoreceptor in the eye by David Berson et al. [1] views have changed on how human vision system works. The novel photoreceptor, intrinsically photosensitive retinal ganglion cell (ipRGC) is one of the known ~20 ganglion cells in human retina. It has been estimated that of all retinal ganglion cells (RGC), 0.25% are photosensitive ipRGCs [2]. It was found [3] that the novel photoreceptor is responsible mainly for regulating light-induced human biological rhythms (circadian rhythms) by synchronizing body to environmental light/dark-cycle. It has also been proposed [4] to mediate light-induced increase in alertness, pupillary responses, and as a possible target for seasonal depression treatment. This novel photoreceptor may have many consequences for practical applications both in general lighting and lighting for special groups (e.g. elderly, shift workers, patients suffering from seasonal depression) so it has become a great interest of research in the lighting community [5]. However, the characteristics of non-image forming (NIF) visual system differ from the conventional visual system based on cones and rods. The NIF visual system has a higher threshold for activation, requires longer exposures for activation, depends on the location of light source in the visual field, and most importantly has different spectral characteristics with the peak wavelength (λmax=480 nm) shifted towards the blue part of visible spectrum. Given that the spectral characteristics are different with the NIF visual system; conventional photometric illuminance can not be used to quantify the NIF responses in humans. As the temporal characteristics (duration and timing of light exposure) differ from visual system, simple measurement of task illuminance is not sufficient to determine the NIF effective light response for example during normal office work. Measurement situations with NIF effective lighting can be divided roughly into two categories: measurement in strictly controlled laboratory studies and to field studies and workplace measurements. This work addresses the problems measuring the NIF effective light exposure by means of a literature review in field conditions using a portable head-mounted light dosimeter. However given that the biological effects of given light exposure are not completely unknown, the simple measurement of light exposure is not sufficient to produce new knowledge on the NIF visual system. Both in field and laboratory studies physiological measurements are needed to study the causality between biological effects and light. Within the scope of this work the physiological measures are only briefly reviewed. In reality when designing a dosimeter, the simultaneous measurement of measures such as ERG, EOG, EEG and ECG with light exposure should be taken into account (e.g. electromagnetic compatibility and space/weight restrictions). For a review of the physiology related to light exposure and NIF responses, the Master’s thesis of the author is suggested [6]. In this work chapter 2 reviews briefly the circadian photobiology that is needed to understand the needs of the new measurement device needed to quantify the NIF responses. Chapter 3 reviews the literature on existing technologies for measuring NIF effective light exposure and the related measurements such as pupil size, eye tracking, electrical activity of eye, and NIF effective ambient luminosity distribution. In Chapter 4 the possible improvements and cost-cutting methods for the measurement are reviewed with some basic signal-to-noise ratio comparisons.

Circadian photobiology 6
2. CIRCADIAN PHOTOBIOLOGY
The whole concept of circadian rhythm is the most essential point of this work so it’s essential to clarify what it really means. Circadian (circa, meaning approximately and dies, meaning day) clock exists practically in every organism starting from cyanobacteria to humans [7-10]. Genuine circadian rhythms are generated totally endogenously without external cues (zeitgebers=time givers) like light. Light is thought to be the strongest zeitgeber, but in reality some weaker zeitgebers (nonphotic entrainment) can have even greater effect on human circadian rhythms in certain special cases. These weaker zeitgebers include social interaction, sleep/wake schedules, food, drugs, auditory and olfactory stimuli, temperature, and exercise [11]. In general circadian rhythms are advantageous to organisms to anticipate changes in the environment, such as the rising and setting of the sun. Other rhythms that affect our bodies include ultradian, which are cycles that are shorter than day, for example, the milliseconds it takes for a neuron to fire, or a 90-minute sleep cycle. There’s also infradian, referring to cycles longer than 24 hours like monthly menstruation for example. There are also seasonal rhythms (photoperiod) like those in hibernation, and reproduction [12]. People have noted the existence of daily rhythms throughout the history. In 1729, Jean Jacques D’Ortous de Mairan, a French astronomer, had a sharp insight into how to test whether a daily rhythm is internal or completely dictated by external stimulus [13]. He studied this by keeping a heliotrope (plant) in the dark and noticed that its leaves kept opening and closing despite the lack of light. De Mairan however didn’t conduct any further experiments on this subject. In the 1850s Karl von Frisch, Gustav Kramer and Colin Pittendrigh each independently discovered compelling evidence for internal clocks in animals [14]. These investigations were the beginning of the modern field of circadian photobiology. In the 1960s Jürgen Aschoff, a German researcher conducted a human study on circadian rhythms [15]. He built a bunker in which volunteers lived for several weeks. Most of the time they were totally isolated from real world without any sunlight, and occasionally the door to bunker was opened revealing the real world. Aschoff noticed in his study that even though volunteers were isolated, their sleep-wake cycles persisted. But he also found that their biological clock got desynchronized with the real world because their endogenous cycle wasn’t exactly 24 hours, average periodicity being 24.5 hours. Aschoff’s final conclusion was that when the door was reopened, the subjects readjusted their clocks meaning that it was possible to reset their circadian clock by external cues. Still Aschoff didn’t know how this circadian clock works, and whether it could be located in a particular part of the body. Normally animals have been divided into nocturnal (active during night) and diurnal (active during day), but there exists also some adaptability to environmental situation at circadian level, which is the case with Finnish bats which are nocturnal mainly during the warm months of the summer. However, in the spring and fall, when environmental factors no longer favor night flight (fewer insects to eat during the colder nights, and fewer birds to compete with and to prey on bats during the day), their activity cycle shifts to the daylight hours [16,17]. In the 1970s scientists demonstrated that the mammalian clock is located in a part of the brain called hypothalamus, specifically in a set of neurons on each side of the
Figure 1. Rhythm of Finnish bats. The gray region indicates the night period and the black bars show the actual activity time for the bats on each day [17].

Circadian photobiology 7
brain called the suprachiasmatic nucleus (SCN). It was noticed that when removing the SCN from rats and hamsters, the animals lost their normal biological rhythms. However when transplanting the SCN back to into hamsters, the normal rhythms were restored. Recently experiments have shown that the SCN can be completely isolated from the animal and still measure chemical and physiological signals from it in vitro conditions. Later SCN and the other hypothalamic nuclei involved in regulation of circadian rhythms will be reviewed. 2.1 CIRCADIAN RHYTHMS
Cyclical fluctuations around 37°C in core body temperature (CBT) are perhaps the best documented circadian rhythm. Gierse [18] had already shown in 1842 that his own oral temperature revealed a maximum temperature in the early evening and minimum in the early morning. Aschoff et al. [19,20] showed that circadian rhythm is caused both by changes in heat production and changes in heat loss, and concluded that heat production undergoes a circadian rhythm which is phase advanced by 1.2 h with respect to the circadian rhythm of heat loss, and this delay is caused by body’s inertia and because transport of heat takes time. This individual regulation of the heat production and heat loss results in much finer tuning of the CBT rhythm than if only one of these components were regulated [21]. It has been proposed [22] that body temperature represents the underlying mechanism regulating performance. The speed of thinking and performance depends on the level of metabolic processes in neurons in the cerebral cortex. However, the interrelationship between thermoregulatory and sleepiness/performance regulatory mechanisms is rather complex and not fully understood [21]. CBT can be easily measured continuously by using a rectal thermistor (e.g. Harvard Apparatus YSI 400 Series [23]). Another common circadian rhythm measured in chronobiological studies, is the circadian rhythm of melatonin hormone. Melatonin (C13H16N2O2; molecule weight≈232,278 g/mol), 5-methoxy-N-acetyltryptamine, is a hormone produced primarily by pinealocytes in the pineal gland (located in the brain) [24]. It can be considered to be a reliable marker of the circadian phase as it is secreted in very strict circadian manner peaking during the night. It is synthesized and secreted at night in both day-active and night-active species [25], thereby acting as a signal for the length of day and night. Despite its robust circadian behavior many mechanisms of melatonin are still unclear [26]. Abnormal melatonin levels caused by lighting at wrong biological time in night-shift workers have been connected to increased risk of breast cancer in women [27-30]. The typical circadian variations of plasma melatonin and core body temperature are seen in Figure 2 [31]. Melatonin levels are usually used as a
Figure 3. Relative (%) circadian phase markers using melatonin. DLMO, dim-light melatonin onset, DLMOFF dim-light melatonin offset [33].
Figure 2. Plots of (A) endogenous plasma melatonin, and (B) core body temperature with data folded at endogenous circadian period as determined by core body temperature for each subject. Abscissa refers to biological time which corresponds different clock time in every individual. In average minimum in CBT (CBTmin) occurs around 04:00 hours [31].

Circadian photobiology 8
marker for the phase shifts in circadian rhythms. This phase-shift in practice means that light exposure can delay or advance the onset of nocturnal melatonin rhythm [32]. Typical methods to assess the time of nocturnal melatonin surge can be seen in Figure 3 [33]. Other circadian rhythms include the diurnal rhythms of cortisol [34], thyrotropin (TSH) [35], prolactin [36], vasopressin [37], and growth hormone (GH) [38] among many others. 2.2 CIRCADIAN CLOCK MECHANISM
In this chapter different brain regions and the hormones involved in the regulation of circadian rhythms are briefly reviewed. The information presented here should be taken with caution as all the presented areas require further research. Hypothalamus is a structure in the brain located below the thalamus and it regulates various metabolic and autonomic processed [39]. Given its central position in the brain and it’s proximity to the pituitary (Figure 4) it is involved as an integrator of both sensory and contextual information. Hypothalamus consists of various nuclei (Figure 5). A lot about the hypothalamus is still unknown, but some actions are at least partially understood and can be described at basic level. Suprachiasmatic nuclei (plural form of nucleus) are nuclei in the hypothalamus situated immediately above the optic chiasm (Figure 5) on either side of the third ventricle in anterior hypothalamus. The SCN is one of
four nuclei that receive nerve signals directly from the retina through retinohypothalamic tract (RHT, Figure 4); the others are lateral geniculate nucleus (LGN), the superior colliculus and the pretectum. In the 1970s the biological clock was located in SCN [40,41], and it was shown that SCN contain genetically driven clock mechanism that ensures a nearly 24 hour cycle [42]. Precise estimation of the periods of the endogenous circadian rhythms of melatonin, core body temperature, and cortisol in healthy individuals living in carefully controlled lighting conditions indicates that the intrinsic period of the human circadian pacemaker averages 24.18 hours with a tight distribution that is consistent with other species [43]. Circadian rhythmicity is abolished by SCN lesions [41] and restored by SCN transplants [44]. Traditionally SCN has been subdivided into a dorsomedial shell (dmSCN) and a ventrolateral core (vlSCN) based on retinal innervation and phenotypically distinct cell
Figure 5. The hypothalamus, showing the location of the suprachiasmatic nucleus (SCN), which in mammals is the primary “biological clock.” [39]
Figure 4. Schematic summary of targets influenced by photosensitive retinal ganglion cells. Projections to the SCN from the retinohypothalamic tract (RHT) [39].

Circadian photobiology 9
types [45,46], while this subdivision has also been criticized for simplifying the SCN structure [47]. Intrinsically rhythmic cells are largely confined to the SCN shell [48], receive little retinal innervation [46], and displays delayed clock gene expression following phase-shifting light exposure [49]. Cells in the SCN core receive direct retinal innervation [50] and express c-fos, Per1 and Per2 in response to phase-shifting light pulses [51-53]. Cells in the SCN core oscillate in response to light stimulus. Light exposure always increases firing rates in SCN neurons [54], although light induces clock gene expression in the SCN only during the night [55]. The simplified assumption that SCN is responsible solely for circadian rhythms is inadequate for in-depth understanding of the human circadian rhythms. Currently human circadian rhythms are thought to be controlled via multioscillator organization hypothalamic nuclei [56-58]. SCN provides three major output pathways. One pathway runs into the medial preoptic region (MPO) and then up into paraventricular nucleus of thalamus. A second pathway runs to the retrochiasmatic area and the capsule of the ventromedial nucleus. The third pathway, which contains the largest portion of the SCN efferent (going away, opposite is afferent) flow, runs mainly to vSPZ and dSPZ with smaller proportion terminating to the DMH. Also small numbers of SCN axons innervate directly the areas that are involved in feeding, wake-sleep cycles and secretion of hormones such as melatonin (presumably through dorsal parvicellular portion of the paraventricular nucleus [59]) and corticotrophin-releasing hormone (CRH) [60]. The further examination of circadian clock mechanism is beyond the scope of this work. 2.3 PHYSIOLOGY OF THE EYE
The simplified anatomy of an eye is shown n Figure 6 [61]. The pupil allows light to enter the eye. It appears dark because of the absorbing pigments in the retina. The pupil is surrounded by beautifully pigmented iris, which is a circular muscle controlling the amount of light entering the eye. Both pupil and the iris are covered by a transparent external surface called the cornea. This is the first and most powerful lens of the optical system of the eye and allows, together with the crystalline lens the production of a sharp image at the retinal photoreceptor level. The purpose of the lens is to focus light onto the back of the eye. The lens is encased in a capsular-like bag and suspended within the eye by tiny guy
wires called zonules. The cornea is continuous with the sclera, the “white of the eye”, which forms part of the supporting wall of the eyeball. Furthermore this external covering of the eye is in continuity with the dura of the central nervous system. The sclera and the cornea form the external layer of eye.
Figure 6. a) Vertical, and b) horizontal sagittal section of the adult human eye [61].
a) b)
Circadian photobiology 10
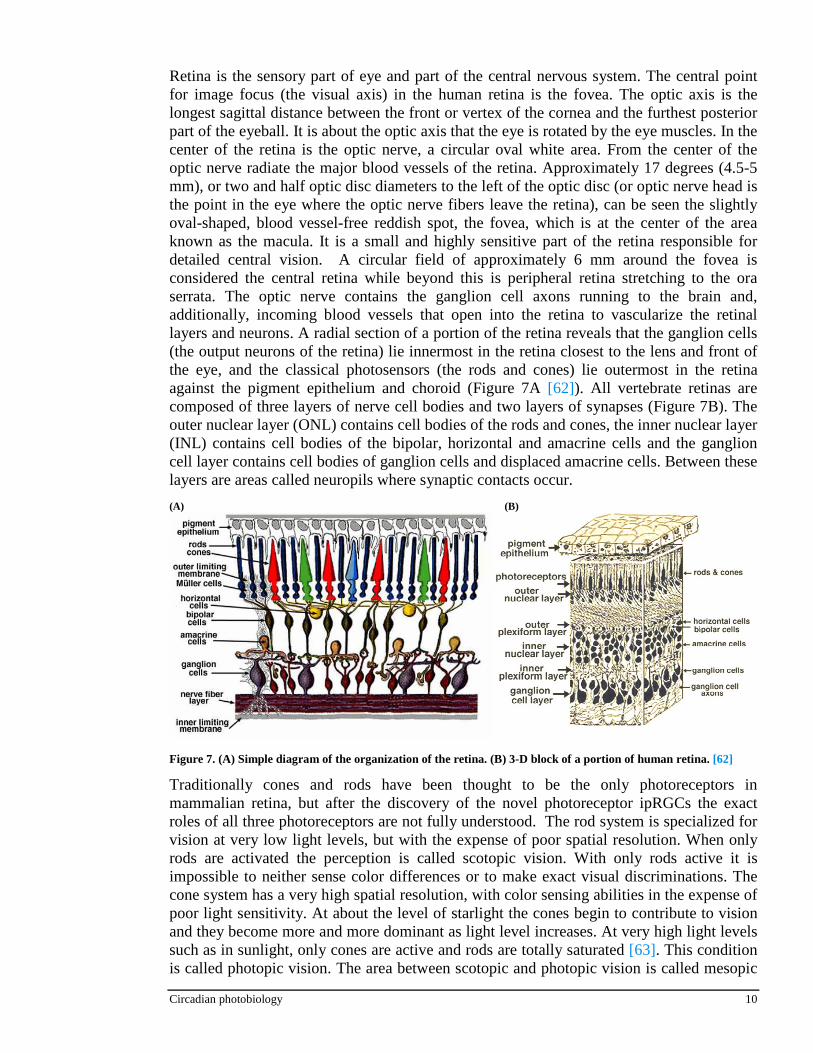
Retina is the sensory part of eye and part of the central nervous system. The central point for image focus (the visual axis) in the human retina is the fovea. The optic axis is the longest sagittal distance between the front or vertex of the cornea and the furthest posterior part of the eyeball. It is about the optic axis that the eye is rotated by the eye muscles. In the center of the retina is the optic nerve, a circular oval white area. From the center of the optic nerve radiate the major blood vessels of the retina. Approximately 17 degrees (4.5-5 mm), or two and half optic disc diameters to the left of the optic disc (or optic nerve head is the point in the eye where the optic nerve fibers leave the retina), can be seen the slightly oval-shaped, blood vessel-free reddish spot, the fovea, which is at the center of the area known as the macula. It is a small and highly sensitive part of the retina responsible for detailed central vision. A circular field of approximately 6 mm around the fovea is considered the central retina while beyond this is peripheral retina stretching to the ora serrata. The optic nerve contains the ganglion cell axons running to the brain and, additionally, incoming blood vessels that open into the retina to vascularize the retinal layers and neurons. A radial section of a portion of the retina reveals that the ganglion cells (the output neurons of the retina) lie innermost in the retina closest to the lens and front of the eye, and the classical photosensors (the rods and cones) lie outermost in the retina against the pigment epithelium and choroid (Figure 7A [62]). All vertebrate retinas are composed of three layers of nerve cell bodies and two layers of synapses (Figure 7B). The outer nuclear layer (ONL) contains cell bodies of the rods and cones, the inner nuclear layer (INL) contains cell bodies of the bipolar, horizontal and amacrine cells and the ganglion cell layer contains cell bodies of ganglion cells and displaced amacrine cells. Between these layers are areas called neuropils where synaptic contacts occur.
Traditionally cones and rods have been thought to be the only photoreceptors in mammalian retina, but after the discovery of the novel photoreceptor ipRGCs the exact roles of all three photoreceptors are not fully understood. The rod system is specialized for vision at very low light levels, but with the expense of poor spatial resolution. When only rods are activated the perception is called scotopic vision. With only rods active it is impossible to neither sense color differences or to make exact visual discriminations. The cone system has a very high spatial resolution, with color sensing abilities in the expense of poor light sensitivity. At about the level of starlight the cones begin to contribute to vision and they become more and more dominant as light level increases. At very high light levels such as in sunlight, only cones are active and rods are totally saturated [63]. This condition is called photopic vision. The area between scotopic and photopic vision is called mesopic
(A)
Figure 7. (A) Simple diagram of the organization of the retina. (B) 3-D block of a portion of human retina. [62]
(B)

Circadian photobiology 11
vision, which is characterized by contribution of both rods and cones. The estimated upper luminance limit for mesopic vision is 3-10 cd/m2 [64]. Spectral sensitivities for photopic, mesopic and scotopic vision can be seen in Figure 8 [65]. The retina contains about 20 different retinal ganglion cells (RGCs) [66], which basically are responsible for the output of visual data to the brain. At the basic level ganglion cells can be divided in two ways, either by their receptive field with the division to magno (M-) and parvo (P-) cells, or by their polarization response to light (ON and OFF cells). M-RGCs terminate in the magnocellular layer of the lateral geniculate nucleus (LGN) of the thalamus, and P-RGCs terminate in the parvocellular layer of the LGN. The conventional view was that ganglion cells got their “commands” from rods and cones, and ganglion cells did not have any light-sensitive properties themselves [1]. In the beginning of 1980s, however, behavioral studies especially those of Foster and colleagues, began to challenge this model [67]. Photic entrainment exhibited high thresholds, low-pass temporal filtering and long-term temporal integration that seemed difficult to explain with the conventional model of cones and rods. This was backed up by studies made with blind mice [68-70] with severe degeneration of classical photoreceptors as well as studies done with certain blind humans [71]. However, it was not clear at all that the receptor for circadian phase would be found from the eye. In non-mammalian animals light penetrating directly to brains acts as circadian pacemaker. In mammals, however, many studies were made and no impact on circadian phase could be shown after eye removal [72-75]. Interestingly, one study reported a bright light behind the knee phase-shifting circadian rhythm [76], but the results could not be replicated [77,78] making this explanation a bit unlikely at the moment. The discovery of “circadian photoreceptor” was at last made by David M. Berson et al. [1]. The novel photoreceptor is abbreviated as ipRGC (intrinsically photosensitive retinal ganglion cells), or as mRGC (melanopsin-containing retinal ganglion cell, mRGC) due to the photopigment responsible for the noticed non-image forming (NIF) effects. Melanopsin was first discovered by Ignacio Provencio and his colleagues [79,80], and is named by the cells in which it first was isolated: the dermal melanophores of frog skin. The two main differences of ipRGCs compared to cones and rods, are that light depolarizes ipRGC while the opposite happens with rods and cones; and ipRGCs are far more sluggish compared to rod and cones, response latencies being as long as a minute. The results are not consistent about the peak wavelength of melanopsin-pigment. Qiu et al. [81], and Panda et al. [82] show that melanopsin λmax is very close to 480 nm, but Melyan et al. [83] and Newman et al. [84] suggest that melanopsin has λmax closer to 420-430nm. The most likely explanation for this kind of large difference was that Newman et al. [84] were the only ones who determined the direct absorption spectrum of melanopsin in vitro conditions whereas all the other studies were done in vivo conditions [85]. Peak absorption spectrum of 420-430 nm might well be the intrinsic peak wavelength for melanopsin, but it would not be the actual peak wavelength responsible of the wide range of the biological effects mediated by ipRGCs. There is also some preliminary evidence that some cones contain also melanopsin and are involved in circadian phototransduction [86].
Figure 8. Spectral sensitivity functions of the eye. In photopic vision, when cones are active, the sensitivity follows the function V(λλλλ) with a peak wavelength of 555nm. At very low light levels only rods are active, and spectral sensitivity follows V’( λλλλ)-function with a peak wavelength of 505nm. The Vmes(λλλλ) is one example of the possible mesopic spectral sensitivity as no consensus exists on it yet. The V10(λλλλ) is is the photopic spectral sensitivity for centrally fixated large target [65].
Circadian photobiology 12
2.3.1 Ophthalmological optics
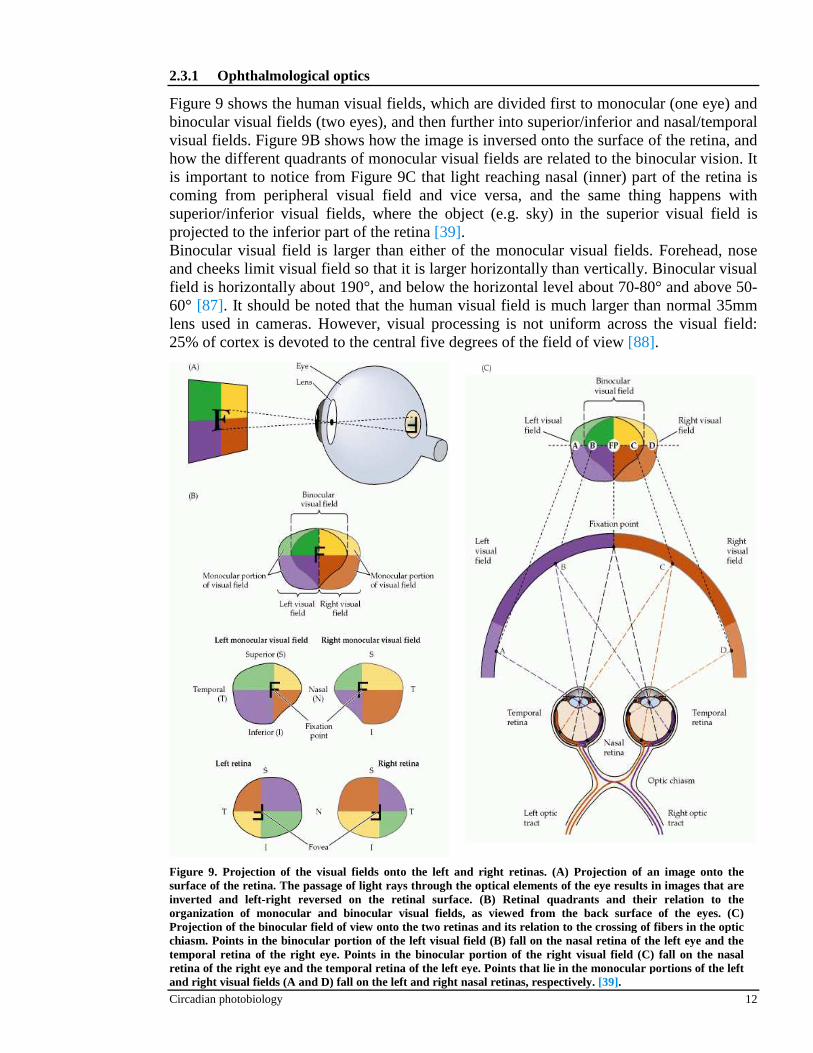
Figure 9 shows the human visual fields, which are divided first to monocular (one eye) and binocular visual fields (two eyes), and then further into superior/inferior and nasal/temporal visual fields. Figure 9B shows how the image is inversed onto the surface of the retina, and how the different quadrants of monocular visual fields are related to the binocular vision. It is important to notice from Figure 9C that light reaching nasal (inner) part of the retina is coming from peripheral visual field and vice versa, and the same thing happens with superior/inferior visual fields, where the object (e.g. sky) in the superior visual field is projected to the inferior part of the retina [39]. Binocular visual field is larger than either of the monocular visual fields. Forehead, nose and cheeks limit visual field so that it is larger horizontally than vertically. Binocular visual field is horizontally about 190°, and below the horizontal level about 70-80° and above 50-60° [87]. It should be noted that the human visual field is much larger than normal 35mm lens used in cameras. However, visual processing is not uniform across the visual field: 25% of cortex is devoted to the central five degrees of the field of view [88].
Figure 9. Projection of the visual fields onto the left and right retinas. (A) Projection of an image onto the surface of the retina. The passage of light rays through the optical elements of the eye results in images that are inverted and left-right reversed on the retinal surface. (B) Retinal quadrants and their relation to the organization of monocular and binocular visual fields, as viewed from the back surface of the eyes. (C) Projection of the binocular field of view onto the two retinas and its relation to the crossing of fibers in the optic chiasm. Points in the binocular portion of the left visual field (B) fall on the nasal retina of the left eye and the temporal retina of the right eye. Points in the binocular portion of the right visual field (C) fall on the nasal retina of the right eye and the temporal retina of the left eye. Points that lie in the monocular portions of the left and right visual fields (A and D) fall on the left and right nasal retinas, respectively. [39].
Circadian photobiology 13
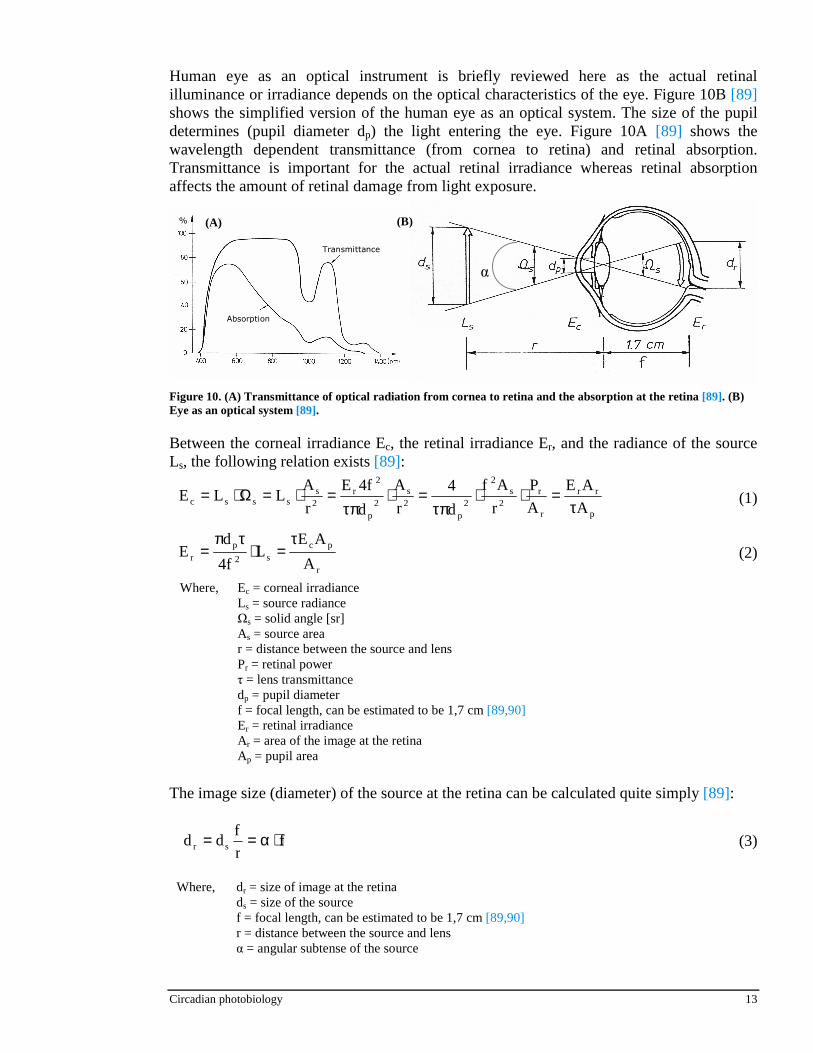
Human eye as an optical instrument is briefly reviewed here as the actual retinal illuminance or irradiance depends on the optical characteristics of the eye. Figure 10B [89] shows the simplified version of the human eye as an optical system. The size of the pupil determines (pupil diameter dp) the light entering the eye. Figure 10A [89] shows the wavelength dependent transmittance (from cornea to retina) and retinal absorption. Transmittance is important for the actual retinal irradiance whereas retinal absorption affects the amount of retinal damage from light exposure.
Between the corneal irradiance Ec, the retinal irradiance Er, and the radiance of the source Ls, the following relation exists [89]:
p
rr
r
r2
s2
2p
2s
2p
2r
2s
sssc A
AE
A
P
r
Af
d
4
r
A
d
f4E
r
ALLE
τ=⋅⋅
τπ=⋅
τπ=⋅=Ω⋅= (1)
r
pcs2
pr A
AEL
f4
dE
τ=⋅
τπ= (2)
Where, Ec = corneal irradiance Ls = source radiance Ωs = solid angle [sr] As = source area r = distance between the source and lens Pr = retinal power τ = lens transmittance dp = pupil diameter f = focal length, can be estimated to be 1,7 cm [89,90] Er = retinal irradiance Ar = area of the image at the retina Ap = pupil area
The image size (diameter) of the source at the retina can be calculated quite simply [89]:
fr
fdd sr ⋅α== (3)
Where, dr = size of image at the retina ds = size of the source f = focal length, can be estimated to be 1,7 cm [89,90] r = distance between the source and lens α = angular subtense of the source
Transmittance
Absorption
%
Figure 10. (A) Transmittance of optical radiation from cornea to retina and the absorption at the retina [89]. (B) Eye as an optical system [89].
(A) (B)
α

Circadian photobiology 14
The size of the image at the retina depends on distance between the source and lens. In practice the retinal irradiance can de different while the corneal irradiance is the same. Larger angular subtense produces smaller retinal irradiance and smaller α then consequently produces larger retinal irradiance [91]. This is why the corneal irradiance (or illuminance) should always be controlled when conducting experiments by neutral density filter rather than moving light sources further from eye as circadian responses ultimately depend on the retinal irradiance. Figure 12 shows the wavelength dependent average transmittance of human lens [92-95]. It can be seen that in the visible part of spectrum newborn lens does not have significant wavelength dependence. In the age group of 20-29 years the transmittance of the blue part of the visible spectrum is slightly attenuated, and in the age group 60-69 years the attenuation is really significant due to yellowing of the lens. In visual responses the human brain can compensate the attenuation of the blue light in a manner that the world does not appear to be less blue for the older people [96,97]. The transmittance of the human lens in different age groups accompanied with the spectral transmittance of intraocular lens (used after cataract removal surgery) [98], the proposed melatonin suppression curve, and the cornea is shown in Figure 11 [99]. Corneal spectral transmittance remains relatively constant in aging as supported by the study by Beems et al. [100] that the corneal transmission for donors younger than 45 yr (n = 3, 22–43 yr) did not differ significantly from that of donors older than 45 yr (n = 5, 67–87 yr) at any wavelength.
Figure 12. The average transmittance of human lenses for three different age groups as a function of wavelength [92,95].
WAVELENGTH
%
Figure 11. Transmittance data for lens: 14 years (); 49 years (+); 92 years () (after Weale, 1985 [93]); mean lens data (X) (after Stockman and Sharpe, 2000 [63]); intraocular lens (*) (after Mainster, 1986 [98]); cornea (∆) (after Beems and van Best, 1990 [100]). The heavy continuous curve shows the relative sensitivity of the presumed photopigment (after Thapan et al., 2001 [116]. Graph from Charman [99].
Circadian photobiology 15
2.3.2 Pupil pathways
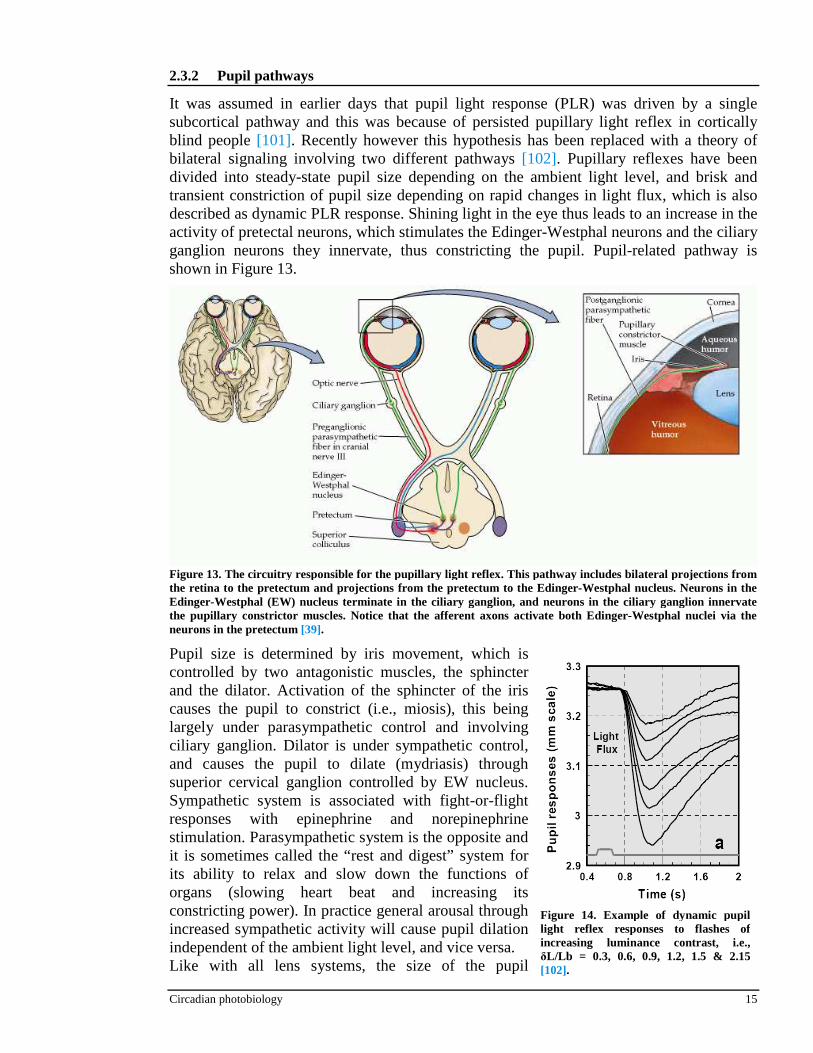
It was assumed in earlier days that pupil light response (PLR) was driven by a single subcortical pathway and this was because of persisted pupillary light reflex in cortically blind people [101]. Recently however this hypothesis has been replaced with a theory of bilateral signaling involving two different pathways [102]. Pupillary reflexes have been divided into steady-state pupil size depending on the ambient light level, and brisk and transient constriction of pupil size depending on rapid changes in light flux, which is also described as dynamic PLR response. Shining light in the eye thus leads to an increase in the activity of pretectal neurons, which stimulates the Edinger-Westphal neurons and the ciliary ganglion neurons they innervate, thus constricting the pupil. Pupil-related pathway is shown in Figure 13.
Pupil size is determined by iris movement, which is controlled by two antagonistic muscles, the sphincter and the dilator. Activation of the sphincter of the iris causes the pupil to constrict (i.e., miosis), this being largely under parasympathetic control and involving ciliary ganglion. Dilator is under sympathetic control, and causes the pupil to dilate (mydriasis) through superior cervical ganglion controlled by EW nucleus. Sympathetic system is associated with fight-or-flight responses with epinephrine and norepinephrine stimulation. Parasympathetic system is the opposite and it is sometimes called the “rest and digest” system for its ability to relax and slow down the functions of organs (slowing heart beat and increasing its constricting power). In practice general arousal through increased sympathetic activity will cause pupil dilation independent of the ambient light level, and vice versa. Like with all lens systems, the size of the pupil
Figure 13. The circuitry responsible for the pupillary light r eflex. This pathway includes bilateral projections from the retina to the pretectum and projections from the pretectum to the Edinger-Westphal nucleus. Neurons in the Edinger-Westphal (EW) nucleus terminate in the ciliary ganglion, and neurons in the ciliary ganglion innervate the pupillary constrictor muscles. Notice that the afferent axons activate both Edinger-Westphal nuclei via the neurons in the pretectum [39].
Figure 14. Example of dynamic pupil light reflex responses to flashes of increasing luminance contrast, i.e., δL/Lb = 0.3, 0.6, 0.9, 1.2, 1.5 & 2.15 [102].

Circadian photobiology 16
(aperture) determines the amount of light entering to retina (retinal illuminance, RI). Pupil size also controls the aberrations and depth of the field of the eye in the same manner as in camera. A smaller aperture (larger f-value) will enhance depth of field and reduce aberrations [103]. PLR response can be divided into steady-state and transient (dynamic) component. The steady-state component is determined by ambient light level and is characterized by neural mechanisms that response to overall light flux changes, large dynamic range and exhibit large spatial summation. Dynamic PLR response is very rapid to rapid light flux change as seen in Figure 14 [102]. Observed transient constriction would need from neurons the following properties: limited spatial summation, band-pass temporal response characteristic, and high contrast gain. A light stimulus always depends on both components, but the relative contribution each component makes to constriction will depend on size of the stimulus, its luminance contrast, onset temporal characteristics and location in the visual field. As observed in Figure 14 pupil constriction is greater with higher luminance contrast, when pupil response is more dominated by steady-state component. Participation of steady-state component could be even further increased with larger stimulus size. Despite involvement of both rod and cone photoreceptors in determining pupil size [104-106], there is an increasing amount of evidence pointing out that ipRGCs play some role in pupillary controls as functional pupillary light reflex (PLR) has been shown to be retained in rodent models of retinal generation (impaired cone/rod function) [107-111]. The results of the spectral sensitivity for the pupillary reflex obtained by Alpern and Campbell [105] can be seen in Figure 15. It can be seen that photopic pupil response is close to the photopic spectral efficiency curve V(λ) and the scotopic pupil response curve is close to the scotopic spectral efficiency curve V’( λ). However, pupil size has been noticed to be smaller under light with higher CCT [136] (8000 K) compared to light sources with CCT=4100 K slightly in contrast with the curves presented in Figure 15. Pupil responses have also been noticed to be larger on exposure of the nasal part of the retina (temporal visual field) [112], having similar spatial characteristics as melatonin suppression (as later noticed) [150].
Figure 15. (A) Mean spectral sensitivity curve for the photopic pupil response (λmax ≈ 550 nm) of two subjects. Differential threshold measurements () are plotted for 2 sec flashes of a 2° test patch centrally fixated and seen against a continuous blue background. Interrupted line, CIE photopic luminosity curve; solid line, mean results of psychophysical measurements of photopic luminosity (flicker photometry) on the same two subjects with the same apparatus. (B) Solid line-Deviations of the pupil results under scotopic conditions (λmax ≈ 500 nm) from the CIE spectral sensitivity data (25 µV criterion) and corrected for the absorption in the eye media (double passage); , the b-wave of the ERG of the dark-adapted eye. Mean results from two observers [105].
(A) (B)
Circadian photobiology 17
2.3.3 Eye movements
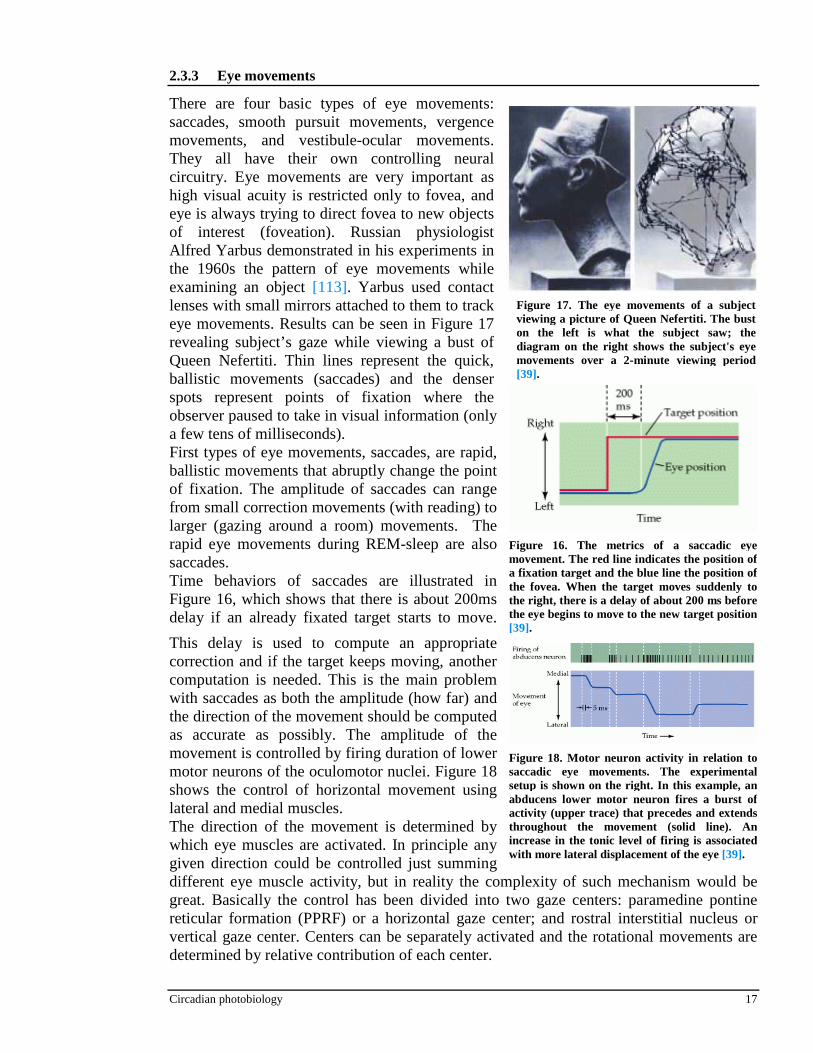
There are four basic types of eye movements: saccades, smooth pursuit movements, vergence movements, and vestibule-ocular movements. They all have their own controlling neural circuitry. Eye movements are very important as high visual acuity is restricted only to fovea, and eye is always trying to direct fovea to new objects of interest (foveation). Russian physiologist Alfred Yarbus demonstrated in his experiments in the 1960s the pattern of eye movements while examining an object [113]. Yarbus used contact lenses with small mirrors attached to them to track eye movements. Results can be seen in Figure 17 revealing subject’s gaze while viewing a bust of Queen Nefertiti. Thin lines represent the quick, ballistic movements (saccades) and the denser spots represent points of fixation where the observer paused to take in visual information (only a few tens of milliseconds). First types of eye movements, saccades, are rapid, ballistic movements that abruptly change the point of fixation. The amplitude of saccades can range from small correction movements (with reading) to larger (gazing around a room) movements. The rapid eye movements during REM-sleep are also saccades. Time behaviors of saccades are illustrated in Figure 16, which shows that there is about 200ms delay if an already fixated target starts to move.
This delay is used to compute an appropriate correction and if the target keeps moving, another computation is needed. This is the main problem with saccades as both the amplitude (how far) and the direction of the movement should be computed as accurate as possibly. The amplitude of the movement is controlled by firing duration of lower motor neurons of the oculomotor nuclei. Figure 18 shows the control of horizontal movement using lateral and medial muscles. The direction of the movement is determined by which eye muscles are activated. In principle any given direction could be controlled just summing different eye muscle activity, but in reality the complexity of such mechanism would be great. Basically the control has been divided into two gaze centers: paramedine pontine reticular formation (PPRF) or a horizontal gaze center; and rostral interstitial nucleus or vertical gaze center. Centers can be separately activated and the rotational movements are determined by relative contribution of each center.
Figure 17. The eye movements of a subject viewing a picture of Queen Nefertiti. The bust on the left is what the subject saw; the diagram on the right shows the subject's eye movements over a 2-minute viewing period [39].
Figure 16. The metrics of a saccadic eye movement. The red line indicates the position of a fixation target and the blue line the position of the fovea. When the target moves suddenly to the right, there is a delay of about 200 ms before the eye begins to move to the new target position [39].
Figure 18. Motor neuron activity in relation to saccadic eye movements. The experimental setup is shown on the right. In this example, an abducens lower motor neuron fires a burst of activity (upper trace) that precedes and extends throughout the movement (solid line). An increase in the tonic level of firing is associated with more lateral displacement of the eye [39].

Circadian photobiology 18
Computation of the movements does not take place at gaze centers as they get their input from the superior colliculus of the midbrain and region called frontal eye field (Brodmann’s area 8) as seen in Figure 19. Both areas respond to visual stimuli and have specific visual and motor maps equivalent to retinotopic mapping. The responses of superior colliculus are better known than frontal eye field. The simplified relation between superior colliculus and frontal eye field is the following: the frontal eye field projects to the superior colliculus and the superior colliculus projects to the PPRF on the contralateral side (Figure 19), as it does also to vertical gaze center which is excluded from the picture for the sake of clarity. The frontal eye field then controls the eye movements by activating selected populations of superior colliculus neurons. It can also project directly to PPRF and control eye movements independently of the superior colliculus. Frontal eye field is also responsible for systematic scanning of visual field to locate an object of interest from background “noise”. It was thought in early 1970s when the collicular maps were found that saccadic movements could be easily estimated using visual/motor map matching. However later it has been found that saccade movements don’t necessarily even need visual stimuli. As seen in Figure 20, nonvisual stimuli like auditory or somatic stimuli can activate motor neurons and produce saccade movements. Also it has been discovered that animals can be trained not to make saccades when an object appeared to visual field, which led to a development of more complex models as seen in Figure 20. We can see that there’s a direct connection between motor and visual neurons, which probably provide the substance for the very short latency (~100ms) reflex-like “express saccades”, which have been notices even after the destruction of the frontal eye fields. The second type of eye movement, smooth pursuit movements are much slower tracking movements designed to keep a moving stimulus on the fovea. Smooth pursuing movements are under voluntary control as person can decide whether to follow some object or not. However only highly trained individuals can make smooth pursuing movement without actual moving target to follow, in reality most people just end up making a saccade. Traditionally these movements were tested placing a subject inside a rotating cylinder with vertical stripes, but nowadays same test can be done using a screen with series of horizontally moving vertical stripes. The eyes follow the stripe end of their excursion followed by a quick saccade to opposite direction for a pursuit of new stripe. This kind of mixed fast and slow movement of the eyes is called optokinetic nystagmus. This is illustrated in Figure 22, where after a quick saccade eyes are able to follow the moving target smoothly. Vergence movements align the fovea of each eye with targets located at different distances from the
Figure 19. The relationship of the frontal eye field in the right cerebral hemisphere (Brodmann's area 8) to the superior colliculus and the horizontal gaze center (PPRF) [39].
Figure 20. The superior colliculus receives visual input from the retina and sends a command signal to the gaze centers to initiate a saccade. The terminals of the visual neuron are located in the same region as the dendrites of the motor neuron [39].

Circadian photobiology 19
observer. But unlike other eye movements, vergence movements are disconjugate (or disjunctive) meaning that eyes move to opposite directions, converging for close objects and diverging for far objects. Convergence caused by near-field stimuli (or near reflex triad) involves also pupillary constriction to increase depth of field. Vergence movements are the slowest speed eye movement although latency being less than with saccades. They are also very small in amplitude, typically a few degrees. The last types of eye movements, vestibulo-ocular movements, mean the compensation of eyes to movement of head. When tilting your head you notice that your fixating point remains more or
less at same point of your retina. The name vestibulo comes from vestibular system, which main element is vestibular nuclei that is situated in inner ear acting as accelerometer and spatial position guide. The system extends through a large part of the brainstem; simple clinical tests like the vestibulo-ocular response can be used to determine brainstem involvement and possible damages, even on comatose patients. The vestibular system detects brief, transient changes in head position and produces rapid corrective eye movements. However it is relatively insensitive for slow changes. For example if the vestibulo-ocular reflex is tested with continuous rotation and without visual cues about the movement of the image (i.e., eyes closed), the compensatory eye movements cease after only about 30 seconds. A person with vestibular damage finds it difficult or impossible to fixate on visual targets while the head is moving, a condition called oscillopsia (“bouncing vision”).
2.4 L IGHT CHARACTERISTICS
In this chapter the light characteristics linked to the novel photoreceptor are reviewed in regard to human circadian rhythms. The basic understanding of this chapter is essential in designing the measurement equipment for light exposure. 2.4.1 Spectrum
The peak wavelength of circadian responses is shifted towards the blue end of the spectrum compared to the traditional visual spectral sensitivities for photopic (V(λ), λmax=555nm), mesopic (λmax between photopic and scotopic peak wavelengths) and scotopic (V’(λ), λmax=508nm) vision. According to current knowledge, the peak wavelength seems to be around 480 nm [2] for ipRGCs. A series of action spectra are presented in Table 1 concurrent with the discovery of melanopsin (Provencio et al. [114], 1998) and ipRGCs (Berson et al. [1], 2002).
Figure 22. The metrics of smooth pursuit eye movements. These traces show eye movements (blue lines) tracking a stimulus moving at three different velocities (red lines). After a quick saccade to capture the target, the eye movement attains a velocity that matches the velocity of the target [39].
Figure 21. Vestibulo-ocular eye movement (slow) resulting from head rotation. This slow component is also called physiological nystagmus, Fast eye movement are saccades that reset the eye position [39].

Circadian photobiology 20
Table 1. Analytic action spectra for circadian, ipRGC, and ocular responses (modified from Brainard, 2006 [85]).
Species Biological responses Stimuli tested Peak λ [nm]
First Author Year
Human (Homo sapiens) Plasma melatonin suppression
8 fluence-response curves (hbw 10-15nm)
Est. λmax=464 (446-477)
Brainard [115] 2001
Human (Homo sapiens) Plasma melatonin suppression
6 fluence-response curves (hbw 5-13nm)
Est. λmax=480 (457-462)
Thapan [116] 2001
Mouse (Mus musculus) Pupillary light reflexes 6 fluence-response curves (+/+) (hbw ≤ 10nm) (rd/rd cl)
Est. λmax=480 or 508
Lucas [117] 2001
Human (Homo sapiens) Cone cell ERG-wave 7 fluence-response curves (hbw ≤ 10nm) Est. λmax=479
Hankins [118] 2002
Rat (Rattus norvegicus) ipRGC cellular depolarization
6/10 fluence-response curves (hbw 10nm) Est. λmax=484
Berson [1] 2002
Mouse (Mus musculus) Circadian phase shift 7 fluence-response curves (rd/rd cl) (hbw 10nm) Est. λmax=481
Hattar [119] 2003
Mouse (Mus musculus), purified mouse melanopsin in vitro
Melanopsin-catalyzed GTP-γ-35S uptake
Single irradiances of 4 restricted bandwidths (hbw 10-30nm)
Est. λmax=424 (420-44)
Newman [84] 2003
Monkey (Macaque nemestrina)
ipRGC cellular depolarization
10 fluence-response curves (hbw 15-20nm) Est. λmax=482
Dacey [2] 2005
Wild-type and retinally degenerate strains are indicated by (+/+) and (rd/rd cl). Est. = Estimated λmax from fitting data to spectral sensitivity curves or to visual photopigment nomograms. hbw =half-bandwidth (hbw smaller than 10nm is considered monochromatic). The recent range for λmax of circadian responses has been from 459 to 484 nm with the clear exception of 420 nm by Newman et al. [84], which study was done in vitro conditions and does not necessarily represent the in vivo behavior of melanopsin as already reviewed with melanopsin. Neither the study by Lucas et al. [117] does not identify a λmax in the blue part of the spectrum in pupillary responses of wild-type (+/+) mice, which was also found in earlier studies [120-122] for phase shifting locomotor activity. It could be that the intact rodent retina combines input from ipRGCs and classic visual photoreceptors (cones more likely) for phase shifting and pupillary responses. In contrast when mice do not have functional cones or rods, their retinal sensitivity appear to shift towards shorter wavelengths [119,122,123]. In photometry, Abney's Law for additivity [124] has been used as a hypothesis for the linear behavior of luminance perception. Additivity means that the total luminance of a non-monochromatic light is the sum of the weighted spectral radiations of the component wavelengths. However, additivity does not hold for all lighting conditions. Additivity failures occur both in photopic and mesopic vision [125], also referred as the Abney Effect [126], that recognizes the failure of the basic law. To make things even more complex this Abney’s Effect is known to be in error also [127]. In photopic vision, additivity failure called sub-additivity occurs when the perceived brightness is less than the sum of the component perceived brightnesses. This phenomenon is apparently due mainly to non-linear cone-cone interactions and is also called the Helmholtz-Kohlrausch effect [128]. For example mixing monochromatic red light with monochromatic green light of equal brightness can be seen less bright than either of the two lights alone [129]. In mesopic vision only the magnocellular channel appears to obey Abney's law of additivity [130]. The first research by Figueiro et al. [131] studying the circadian spectral opponency in humans compared the melatonin suppression effects of blue light emitting diodes (LEDs) and clear mercury (Hg) vapor lamps. Blue LEDs produced an illuminance of 18 lx (29

Circadian photobiology 21
µW/cm2) at subjects’ eyes when the 175 W Hg lamp produced an illuminance of 450 lx (170 µW/cm2) at the eye. The radiant power of polychromatic Hg lamp was set to produce at least equal or higher melatonin suppression than the blue LED if additivity was to exist in circadian response, following the univariance principle [132]. Results revealed a statistically significant difference between the LED and Hg lighting conditions, with the LED condition resulting stronger melatonin suppression in contrast to the theory of additivity. The best-fitting function from the results is shown Figure 23 which are relatively close match to the empirical action spectrum for melatonin suppression by Brainard et al. [225] (r2=0,86) and by Thapan et al. [116] (r2=0,84) both from 2001. In conclusion the larger melatonin suppression by photopically less-powered LED would indicate that spectral opponency exists in human circadian system, and the results from studies done with monochromatic light sources could not be generalized to normal polychromatic sources used in architectural lighting. The first circadian phototransduction model to incorporate the suggested spectral opponency [131] was presented by Rea et al. [133] in 2005. Compared to the previous models [91,134,356], it is much more ambitious while still maintaining relatively simple mathematical format. It is not limited on modeling the ipRGCs or melanopsin, but it incorporates the basic mechanisms of other retinal neurons involved in circadian phototransduction, as cones and rods are also been proposed to be involved in circadian responses [119,135]. However, while the model is based upon a synthesis of a wide range of existing literature in neuroanatomy, electrophysiology, and psychophysics, main emphasis is on the results got on melatonin suppression. Rea et al. [133] admit that this model is highly likely to be changed as it lacks the more advanced features of circadian phototransduction, but it still is a large step towards more realistic models. Figure 24 shows the action spectra of the proposed model. The proposed model [133] was later tested by the same authors [136] with the results showing a relatively good fit to the proposed model when tested with two polychromatic light sources. The conventional views has been after the discovery of ipRGCs that all non-image forming (NIF) functions have the same action spectra as it for example found that short-wavelength light (460 nm) is more effective in alertness-promoting than light at 550nm [137-139], but a recent study by Revell et al. [140] revealed that light at 420 nm was more effective in alertness-promoting than light at 470 nm. This would mean that the action spectrum presented for melatonin suppression [116,133,225] would not be accurate for alertness promotion. This could mean that human melanopsin could be really most sensitive to short wavelengths at 420-430
Figure 23. Hypothetical opponent action spectrum for melanopsin consistent with the present [131] and previous results [116,225]. Curve from Figuiero et al. [131].
Figure 24. Predictions of the model to the constant criterion spectral sensitivity data of Brainard et al. [225] and of Thapan et al. [116]. Graph by Real et al. [133].

Circadian photobiology 22
nm as shown in some studies [83,84]. However, this peak wavelength of 420-430 nm is in contrast with the other data from melanopsin action spectrum [2,81,82], cone ERG [118], and circadian phase shifting [141]. Human eye undergoes age-related changes in total and in wavelength-dependent transmittance. It would be natural to assume that these changes would have some kind of impact to circadian phototransduction as well. As in both early studies by Brainard et al. [225] and Thapan et al. [116] the action spectra were corrected for absorption in the lens (as authors wanted to obtain an action spectrum that applies to the irradiance level at the retina), it is reasonable to study what are the real differences in circadian responses due to properties of cornea, aqueous, lens and vitreous, which light has to pass before reaching the retina. As noticed already in Figure 11, corneal transmittance is relatively constant between the range of 400 nm to 600 nm and above all the corneal transmittance does not differ significantly as a function of age at any wavelength [100]. Although absorption and scatter in humours may have minor effects, the most relevant part of the human eye is the crystalline lens as it has been noted to yellow with age thus attenuating short-wavelength light. Another significant age-related change in ophthalmologic optics is the senile miosis [142], where pupil diameter changes with age under both light-adapted (diameter decreases) and dark-adapted (diameter increases) conditions. The relative pupil area has its maximum value at the age of about 15 years and is reduced throughout adult [99], and it this factor alone reduces the retinal illuminance to half in the eye of a 70-year-old. The following equation can be used to calculate the relative efficiency of light for suppression of melatonin with regard to the age according to Charman et al. [99]:
∫ λ⋅⋅λ⋅λ⋅λ= λ dλ )S(A)(T)(T)(ER LC (4)
Where, R = effective irradiance at the retina Eλ(λ) = spectral irradiance of the source at the cornea TC(λ) = transmission of the cornea (near-axial path) TL(λ) = transmission of the lens (near-axial path) A = pupil diameter (near-axial path) S(λ) = melatonin action spectrum
According to this formula, the efficiency of light should decrease with increasing age; however an experimental study failed to verify this assumption [143] and concluded that there is no correlation between efficiency of melatonin suppression and age of the subjects. No gender-related differences in melatonin suppression have been yet discovered [144]. The values of TC(λ), TL(λ) and A are measured when light enters the eye along a near-axial path assuming that no effects of the Stiles-Crawford type [145,146] will occur, as the ganglion cells lie anterior to the outer segments of the receptors which are responsible for any waveguiding effects. 2.4.2 Spatial distribution
Relatively little is known about the spatial distribution of melanopsin-containing ganglion cells (ipRGCs) in human eye. This knowledge is important in knowing where to place the lights in order to produce the maximal biological responses. The results from various studies [147-150] indicate that a significant gradient in density of melanopsin-containing retinal ganglion cells is present both in the horizontal and in the vertical direction. The highest density of melanopsin-containing retinal ganglion cells (ipRGCs) would seem to occur in the inferior nasal area of the retina corresponding to upper (superior) temporal (lateral) visual field. The ratio between temporal retina and nasal retina for melatonin

Circadian photobiology 23
suppression was 0.54 in the study by Visser et al. [147] and 0.59 in the study by Rüger et al. [150]. The difference was even larger between upper (superior) and lower (inferior) retina in the study by Glickman et al. [149] where melatonin suppression was ~6,3% for upper retina whereas it was ~29,1% after a 90 minute 200 lx polychromatic light exposure (percentages plotted from the graphs). This would indicate a ratio of 0.22 between upper and lower ratio. 2.4.3 Intensity
Despite of the relatively large amount of studies on circadian phototransduction, only a few systematic studies [157,192] have been done on the influence of light intensity on the phase shifting and melatonin suppression. The early studies done with subjects which allowed to self-select their sleep-wake cycle showed that only bright light could affect human circadian rhythms [151,152], one study reporting a threshold of 1500 lx [153] and the others showed a significant phase shift with illuminances as high as 4000 lx [154] and 5000 lx [155]. In the human study by Boivin et al. [156] the phase resetting response was reported to increase with light intensity in a nonlinear manner. In the study by Zeitzer et al. [157] the intensity response curve (IRC) between illuminance and the phase resetting response was also found to be nonlinear. This found nonlinearity is consistent with a cube-root compression of illuminance as a function of the illuminance and (phase resetting) response, reported previously for visual perception [158]. In non-human mammals, the intensity dependence of both phase shifting of the circadian pacemaker and acute suppression of melatonin have been well characterized [159-161]. In general, the results obtained by Zeitzer et al. [157] are the most commonly used as a reference for the light intensity required for melatonin phase shift (Figure 25A) and melatonin suppression (Figure 25B). As little as ~100 lx of (corneal) light could produce half of the maximal phase delay shift found at 10’000 lx and that 90% of the asymptotic maximum response could be achieved with 550 lx. This would indicate that human circadian pacemaker is highly sensitive to ordinary room light and that minor changes in room light intensity could have a major impact on entrainment of the human circadian pacemaker. This is not consistent with some previous studies [154,162,163] which failed to
Figure 25. Illuminance—response curve of the human circadian pacemaker. The shift in the phase of the melatonin rhythm (A), as assessed on the day following exposure to a 6·5 h experimental light stimulus, has been fitted with a four parameter logistic model using a nonlinear least squares analysis. Acute suppression of plasma melatonin (B) during the light exposure also has been fitted with a four parameter logistic model using a nonlinear least squares analysis. The logistic models predict an inflection point of the curve (i.e. the sensitivity of the system) at •120 lx. Saturation of the phaseshift response is predicted to occur with •550 lx and saturation of the melatoninsuppression response is predicted to occur with •200 lx. Individual subjects are represented by , the model by the continuous line, and the 95% confidence intervals by the dotted lines [157].
Circadian photobiology 24
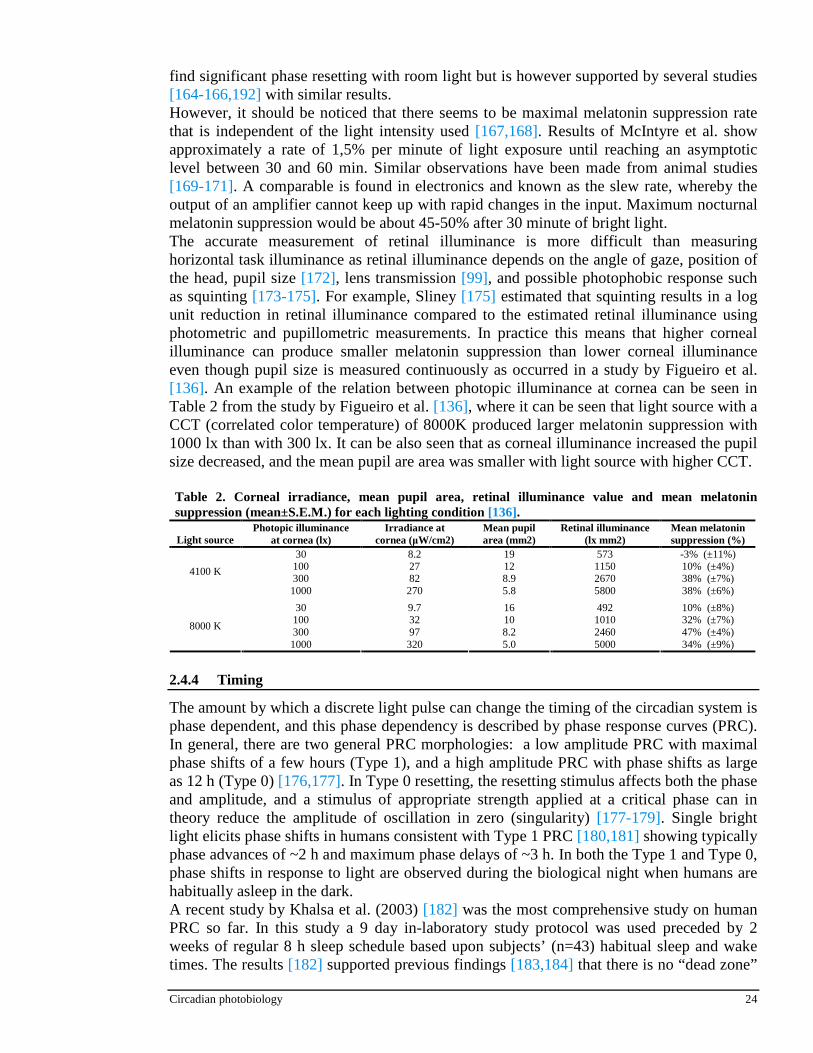
find significant phase resetting with room light but is however supported by several studies [164-166,192] with similar results. However, it should be noticed that there seems to be maximal melatonin suppression rate that is independent of the light intensity used [167,168]. Results of McIntyre et al. show approximately a rate of 1,5% per minute of light exposure until reaching an asymptotic level between 30 and 60 min. Similar observations have been made from animal studies [169-171]. A comparable is found in electronics and known as the slew rate, whereby the output of an amplifier cannot keep up with rapid changes in the input. Maximum nocturnal melatonin suppression would be about 45-50% after 30 minute of bright light. The accurate measurement of retinal illuminance is more difficult than measuring horizontal task illuminance as retinal illuminance depends on the angle of gaze, position of the head, pupil size [172], lens transmission [99], and possible photophobic response such as squinting [173-175]. For example, Sliney [175] estimated that squinting results in a log unit reduction in retinal illuminance compared to the estimated retinal illuminance using photometric and pupillometric measurements. In practice this means that higher corneal illuminance can produce smaller melatonin suppression than lower corneal illuminance even though pupil size is measured continuously as occurred in a study by Figueiro et al. [136]. An example of the relation between photopic illuminance at cornea can be seen in Table 2 from the study by Figueiro et al. [136], where it can be seen that light source with a CCT (correlated color temperature) of 8000K produced larger melatonin suppression with 1000 lx than with 300 lx. It can be also seen that as corneal illuminance increased the pupil size decreased, and the mean pupil are area was smaller with light source with higher CCT. Table 2. Corneal irradiance, mean pupil area, retinal illuminance value and mean melatonin suppression (mean±S.E.M.) for each lighting condition [136].
Light source Photopic illuminance
at cornea (lx) Irradiance at
cornea (µW/cm2) Mean pupil area (mm2)
Retinal illuminance (lx mm2)
Mean melatonin suppression (%)
30 8.2 19 573 -3% (±11%) 100 27 12 1150 10% (±4%) 300 82 8.9 2670 38% (±7%)
4100 K
1000 270 5.8 5800 38% (±6%)
30 9.7 16 492 10% (±8%) 100 32 10 1010 32% (±7%) 300 97 8.2 2460 47% (±4%)
8000 K
1000 320 5.0 5000 34% (±9%)
2.4.4 Timing
The amount by which a discrete light pulse can change the timing of the circadian system is phase dependent, and this phase dependency is described by phase response curves (PRC). In general, there are two general PRC morphologies: a low amplitude PRC with maximal phase shifts of a few hours (Type 1), and a high amplitude PRC with phase shifts as large as 12 h (Type 0) [176,177]. In Type 0 resetting, the resetting stimulus affects both the phase and amplitude, and a stimulus of appropriate strength applied at a critical phase can in theory reduce the amplitude of oscillation in zero (singularity) [177-179]. Single bright light elicits phase shifts in humans consistent with Type 1 PRC [180,181] showing typically phase advances of ~2 h and maximum phase delays of ~3 h. In both the Type 1 and Type 0, phase shifts in response to light are observed during the biological night when humans are habitually asleep in the dark. A recent study by Khalsa et al. (2003) [182] was the most comprehensive study on human PRC so far. In this study a 9 day in-laboratory study protocol was used preceded by 2 weeks of regular 8 h sleep schedule based upon subjects’ (n=43) habitual sleep and wake times. The results [182] supported previous findings [183,184] that there is no “dead zone”

Circadian photobiology 25
(when no phase shift is elicited by bright light) in the human PRC. Three different PRCs from the study can be seen in Figure 26, which differ by the phase markers used. Figure 26A uses melatonin midpoint, Figure 26B dim light melatonin onset (DLMOn), and Figure 26C dim light melatonin offset (DLMOff) as the phase marker for circadian rhythm (for phase marker details see Figure 3). The transition from delays to advances in the critical region (CT 0) is rapid, while the transition from phase advances to phase delays during the subjective day is more gradual. The phase shifts measured by DLMOff are smaller than those measured by DLMOn [182], which is consistent with the results obtained from rodent studies. It has been hypothesized that there may be two coupled oscillators, an evening or E oscillator associated with melatonin onset, and a morning or M oscillator associated with melatonin offset [185-188].
2.4.5 Duration
Traditionally bright light experiments have consisted of 2 to 8 hour continuous exposures [189-192], based on the assumption that bright light exposure is consistent with the Bunsen-Roscoe law that states that the effect is independent (within a certain general time frame) of the duration of exposure as long as the radiant exposure is the same [91,193]. However evidence from animal experiments [194-196] would suggest that the same phase-shifting than with continuous exposure could be achieved with intermittent light exposure with less radiant energy. The response of human circadian system has not been very well quantified even though the exposure to bright light is typically intermittent in everyday life [197-200]. Kronauer et al. [201,202] have proposed a revisal model for the resetting effect of light. The model is partly based on experiments comparing the effects of continuous and intermittent bright light stimuli (~9 500 lx) over a ~5-h period. The results of a study by Rimmer et al. [203], designed to test the model of Kronauer et al. [201,202], suggest that an intermittent bright light stimulus, interrupted by intervals of complete darkness that exceed the light exposure can significantly phase shift the human circadian pacemaker. When bright light occupied only 31% of the total stimulus, 70% of the median resetting response was observed. Furthermone, when bright light occupied 63% of the total stimulus, nearly 90% of the median resetting response was preserved. These findings also indicate that the brief intermittent exposures to bright light that are normally encountered in everyday life (during the night and day) [197,199,200] may have a greater impact on circadian entrainment than was previously recognized [198-200,204,205]. Studies by Boivin and James [206], by Baehr [207], and Gronfier et al. [208] also support this
Figure 26. Phase advances (positive values) and delays (negative values) are plotted against the timing of the centre of the light exposure relative to the melatonin on the pre-stimulus CR (defined to be 22 h), with the core body temperature minimum assumed to occur 2 h later at 0 h. Using A) melatonin midpoint, B) dim light melatonin onset (DLMOn), and C) dim light melatonin offset (DLMOff) as marker for circadian phase. Data points from circadian phases 6–18 are double plotted. The filled circles represent data from plasma melatonin, and the open circle represents data from salivary melatonin in one subject. The solid curve is a dual harmonic function fitted through all of the data points. The horizontal dashed line represents the anticipated 0.54 h average delay drift of the pacemaker between the pre- and post-stimulus phase assessments. The fitted peak-to-trough amplitude of the DLMOn PRC (5.41 h) appears slightly larger than that of the DLMOff PRC (4.60 h) [182].
C B A
Circadian photobiology 26
proposed model [201,202] indicating that sustained periods of intensely bright light are not necessary for resetting the human circadian system. 2.4.6 Photic history
It has been shown that resetting response of circadian pacemaker can be attenuated by a preceding nonsaturating stimulus in animals [209], and phase shifting in mammalian has been shown to be maximal after prolonged exposure to complete darkness before a stimulus [210,211]. Also a study by Hebert et al. [212] made in humans showed significant differences (with large inter-individual variability) differences in melatonin suppression after different (dim vs. bright) light history. These studies would suggest that the light-mediated melatonin suppression could also be modulated by prior photic history. Study by Smith et al. [213] revealed a significant difference in melatonin suppression between two lighting history conditions, with a mean suppression of 71,2% (±7,1%) in the approximately 200 lx prior light history condition vs. a mean suppression of 85,7% (±6,5%) in the approximately 0,5 lx prior light history condition. The results [213] demonstrate that a prior light history alters light-mediated melatonin suppression, while it is impossible to determine whether dim background potentiates or relatively bright background diminishes the strength. It would seem important always to control the prior light history when examining melatonin suppression. Findings suggest that a controlled photic history of 63 hours before a light stimulus is sufficient to change the suppression effect of the subsequent light stimulus. However it is not possible to determine the exact time from this study [213] to be a sufficient control time and further investigation is needed for more quantitative results. 2.4.7 Polarization
The differences between nonpolarized and vertically polarized light to melatonin suppression were investigated by Brainard et al. [214] in 2000. Six subjects participated in the study and they were exposed to four different light intensities: 20, 40, 80 and 3200 lx (for saturation response) with their pupils dilated with cyclopentolate HCl. The results of the study [214] revealed hat there is a significant correlation between the light intensity used and melatonin suppression, but no significant differences between nonpolarized and polarized light.

Eye and photometric measurements 27
3. EYE AND PHOTOMETRIC MEASUREMENTS
Literature review is done on the available methods to measure eye movement, pupil size and light entering the eye for proper quantification of “circadian effective” light exposure. Also the electrical activity recordings of the eye ERG and/or EOG are reviewed as they can be used for further quantification of physiological responses of light. Even though within the scope of this work they are not integrated to the dosimeter device but the possible recording of EOG/ERG should be taken account when designing the dosimeter. 3.1 ELECTRICAL ACTIVITY
Two the most typical measurements of the electrical activity of the eye are electroretinogram (ERG) and electrooculogram (EOG). ERG is more clinical utility used for the diagnostics of various eye diseases but it can also be used to measure circadian responses as done by Hankins et al. [215]. EOG is commonly used in studies measuring changes in alertness as well as in EEG (electroencephalography) studies for the elimination of the eye blink artifacts in EEG recordings. 3.1.1 Electroretinogram (ERG)
Electroretinogram (ERG) is a device measuring the electrical activity of the eye. Figure 27A [216] shows schematically the basic measurement setting with a special saline filled contact lens with an Ag/AgCl electrode placed on top of cornea As it is shown in Figure 27B [216], light pulse induces a potential change and four common ERG waveforms (the a, b, c, and d waves) are marked to the picture. It should be noted that notations can differ in literature.
The first (a) component is early-receptor potential (ERP), which appears almost instantaneously after onset of light. The amplitude of the ERP depends directly upon stimulus intensity and the concentration of visual pigment in the outer segments of the photoreceptors. Therefore, the ERP is believed to reflect dipole changes in the visual pigment molecules due to conformational changes that are elicited by photon absorption. The ERP has been used in research to follow non-invasively the concentration of the visual pigment during light adaptation and in the dark following an exposure to bright light that causes substantial pigment bleaching [217]. This is followed by (b) late-receptor potential (LRP), which has a small latency (1-5ms) and is found to be maximal near the synaptic endings of the photoreceptors therefore
Figure 27. (A) The transparent contact lens contains one electrode, shown here on horizontal section of the right eye. Reference electrode is placed on the right temple. (B) Typical vertebrate ERG waveform in response to a 2 s light flash [216].
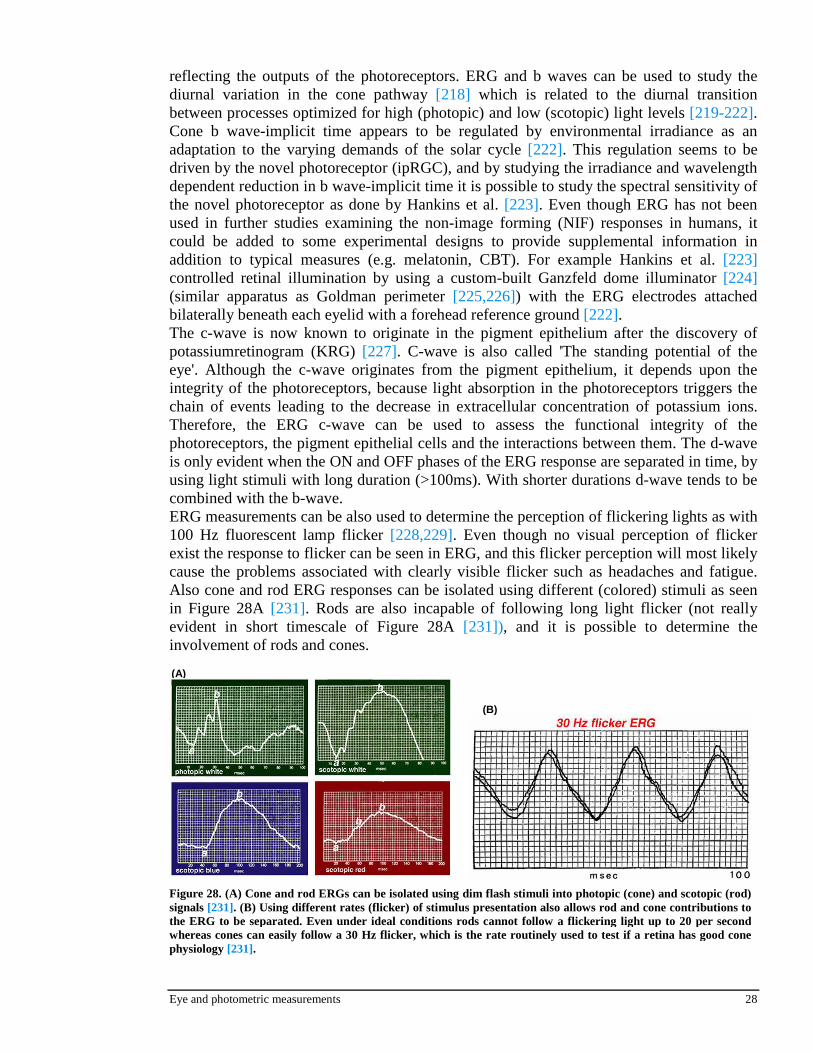
Eye and photometric measurements 28
reflecting the outputs of the photoreceptors. ERG and b waves can be used to study the diurnal variation in the cone pathway [218] which is related to the diurnal transition between processes optimized for high (photopic) and low (scotopic) light levels [219-222]. Cone b wave-implicit time appears to be regulated by environmental irradiance as an adaptation to the varying demands of the solar cycle [222]. This regulation seems to be driven by the novel photoreceptor (ipRGC), and by studying the irradiance and wavelength dependent reduction in b wave-implicit time it is possible to study the spectral sensitivity of the novel photoreceptor as done by Hankins et al. [223]. Even though ERG has not been used in further studies examining the non-image forming (NIF) responses in humans, it could be added to some experimental designs to provide supplemental information in addition to typical measures (e.g. melatonin, CBT). For example Hankins et al. [223] controlled retinal illumination by using a custom-built Ganzfeld dome illuminator [224] (similar apparatus as Goldman perimeter [225,226]) with the ERG electrodes attached bilaterally beneath each eyelid with a forehead reference ground [222]. The c-wave is now known to originate in the pigment epithelium after the discovery of potassiumretinogram (KRG) [227]. C-wave is also called 'The standing potential of the eye'. Although the c-wave originates from the pigment epithelium, it depends upon the integrity of the photoreceptors, because light absorption in the photoreceptors triggers the chain of events leading to the decrease in extracellular concentration of potassium ions. Therefore, the ERG c-wave can be used to assess the functional integrity of the photoreceptors, the pigment epithelial cells and the interactions between them. The d-wave is only evident when the ON and OFF phases of the ERG response are separated in time, by using light stimuli with long duration (>100ms). With shorter durations d-wave tends to be combined with the b-wave. ERG measurements can be also used to determine the perception of flickering lights as with 100 Hz fluorescent lamp flicker [228,229]. Even though no visual perception of flicker exist the response to flicker can be seen in ERG, and this flicker perception will most likely cause the problems associated with clearly visible flicker such as headaches and fatigue. Also cone and rod ERG responses can be isolated using different (colored) stimuli as seen in Figure 28A [231]. Rods are also incapable of following long light flicker (not really evident in short timescale of Figure 28A [231]), and it is possible to determine the involvement of rods and cones.
(A)
(B)
Figure 28. (A) Cone and rod ERGs can be isolated using dim flash stimuli into photopic (cone) and scotopic (rod) signals [231]. (B) Using different rates (flicker) of stimulus presentation also allows rod and cone contributions to the ERG to be separated. Even under ideal conditions rods cannot follow a flickering light up to 20 per second whereas cones can easily follow a 30 Hz flicker, which is the rate routinely used to test if a retina has good cone physiology [231].

Eye and photometric measurements 29
3.1.2 Electooculogram (EOG)
The electrooculogram measures the potential that exists between the cornea and Bruch's membrane at the back of the eye. The potential produces a dipole field with the cornea approximately 5 millivolts positive compared to the back of the eye, in a normally illuminated room. Although the origin of the EOG is the pigment epithelium of the retina, the light rise of the potential requires both a normal pigment epithelium and normal mid-retinal function. Elwin Marg named the electrooculogram in 1951 and Geoffrey Arden [230] developed the first clinical application [231]. It far less invasive method compared to ERG as seen in Figure 30 [231]. The electrodes of the EOG are normally placed at the outer canthi of each eye, one slightly above the cantomeatal place, the other slightly below [232]. EOG is also the abbreviation for electro-olfactogram, which is used to determine electrical responses of different smells and scents, and thus is totally different device [233]. EOG is frequently the method of choice for recording eye movements in sleep and dream research [234], in recording eye movements from infants and children, and in evaluating reading ability and visual fatigue. And the most important application within this work is its use in slow eye movement (SEM) measurement with EEG to assess alertness. Figure 29 [231] shows a 10-second periods of eye movement back and forth between two red LED lights placed 30 degrees apart inside a Ganzfeld measurement device. After training the patient in the eye movements, the lights are turned off. About every minute a sample of eye movement is taken as the patient is asked to look back and forth between the two lights. As various types of eyelid and eye movement patterns have been shown to respond to sleep loss and to correlate with sleepiness in a variety of protocols [235-237] indicating that EOG could be in theory used to assess sleepiness objectively [238]. However, in practice the EOG recordings have shown too large inter-individual differences making objective alertness assessment still a thing of the future [239-241]. Aserinsky and Kleitman [242] described SEMs during drowsiness preceding sleep onset and during light sleep. Kuhol and Lehmann [243] found that SEMs became larger and more regularly sinusoidal when simultaneous showing of the EEG was noted during sleep onset. Slow (0,25 Hz), pendular, horizontal eye movements were seen as the first sign of drowsiness in 50,5% of the 200 US Air Force flight
Figure 30. Placement of the electrodes for recording an EOG [231].
Figure 29. EOG eye movement recordings. Light-adapted pre-EOG, dark adaptation phase and light-rise phase [231].
Figure 31. An illustration of the electro-oculogram (EOG) signal generated by horizontal movement of the eyes. The polarity of the signal is positive at the electrode to which the eye is moving [245].
Figure 32. Recording in a normal control (upper), an atypical (middle-continuous line) and a melancholic patient (lower-dotted line). The control subject has Arden ratio = 224, the melancholic Arden ratio = 295, and the atypical patient Arden ratio = 248 [246].

Eye and photometric measurements 30
personnel in a field study by Maulsby et al. [244]. Furthermore, wake-sleep transition was characterized by the disappearance of large eye blinks (EBs) and fast eye movements [235]. An illustration of EOG signal generated by horizontal movement of the eyes can be seen in Figure 31 [245]. The movement of the eyes produces a change of potential, which is recorded by the electrodes. After the recording of several movements of the eyes, the averaging of potentials gives the mean potential for the given conditions (interaction of time with lighting conditions, Figure 32 [246]). There is no difference of the recorded EOG curves between the two eyes [247]. The most widely used indices for the interpretation of the EOG are the Arden ratio [248,249]:
100troughdark
peaklightRatioArden ∗
−−= (5)
The normal values of this index lie between 162 and 228, but values under 180 should be considered as borderline. Another index, which also takes into consideration the baseline potential is the A criterion [250]:
( ) ( )[ ]hdark troug91,0potential baseline61 0,-peaklight CriterionA ⋅+⋅= (6)
Over 70% of healthy subjects have A-Criterion values over 80 and all over zero [247]. 3.2 EYE TRACKING
Eye movements or eye tracking has been used as a tool over hundred years to study variety of cognitive processes in humans [251]. Eye tracking research has been divided chronologically into four different eras [252]. The first (ca. 1879-1920) was defined by the discovery of many basic eye movement facts (saccade suppression and latency, perceptual span); the second (ca. 1930-1958) was characterized by a more applied research focus, coinciding with the behaviorist movement in experimental psychology; the third (1970-1998) was characterized by improvements in eye recording systems. The fourth era that the research is entering is distinguished by the emergence of interactive applications. Eye tracking applications can be broadly categorized as diagnostic or interactive. Diagnostic applications are typically represented by the unobtrusive use of the eye-tracking device, whereas interactive system must respond to user’s behavior which requires online computing power. Such interactive systems can be further divided into two subtypes: selective and gaze-contingent. Selective systems use the point of gaze as pointing devices (e.g. mouse), whereas gaze-contingent system uses the gaze information to facilitate the rapid rendering of complex displays (e.g. graphical environment) which can be further divided in terms of display processing, as seen in [251]. Eye trackers are used diagnostically for example in neuroscience, psychology, industrial engineering, and marketing among others [251]. In lighting research, eye tracking can be for example used to define the direction the worker is normally looking at in an office environment. This data can be then used to quantify the light exposure over the day when the illuminance distribution is known in an office environment measured for example with a luminancephotometer. This can be further weighed mathematically or with a fixed “circadian optical filter” to assess the “circadian dose” of light that a worker experiences during the day as studied by Hubalek et al. [253]. Eye tracker algorithm could be also
Figure 33. Hierarchy of eye-tracking applications [251].

Eye and photometric measurements 31
modified to primarily measure only pupil size and either measure eye movements as secondary parameters or not measure them at all, which would make the system cheaper as no scene camera would be needed. The study of saccade eye movements is indispensable in obtaining a complete understanding of the human vision [254,255]. A study with monkeys showed that some of the V1 neurons carry information about saccadic occurrences and directions, whereas other neurons code details of the retinal image [256]. A eye tracking study by Asaad et al. [257] found support for the evidence that prefrontal (PF) cortex would be the central to the ability to shift attention and choose actions appropriate according to specific sensory, motor, and cognitive demands. Furthermore Özyurt et al. [258] used eye movement recording with functional brain imaging (fMRI) to track a subject’s fixation point while simultaneously recording cortical activity during attentional tasks. The results of Özyurt et al. [258] revealed significant task-related activity in the striate and extrastriate cortex, the frontal eye fields, the supplementary motor area, the parietal cortex and angular gyrus, the frontal operculum, and the right prefrontal area 10. This type of research is helpful in identifying the functional brain structures in attentional mechanisms. In psychology, eye tracking is used to in reading processing [259], scene perception [252,260,261], perception of art [261,262-265], generation of aesthetically pleasing art by computers [266], perception of film [267], visual search tasks [252,268], auditory language processing [269,270]; and in natural tasks such as making tea [271], food preparation [272], mathematics [252], and sports [252] among others. The applications in industrial engineering and human factors include aviation [251,273], driving [251,274,275], and visual inspection [251,276] among others. In marketing, eye tracking have been used to study copy testing [277] and print advertising [278,279] among others. Eye tracking have been used in interactive computer interfaces [280], including eye typing [281], drawing of pictures [282], icon selection [283], object selection [284], and in virtual reality applications [285,286] among others. Two types of imaging approaches are typically used in eye tracking, visible and infrared spectrum imaging [287]. Visible spectrum imaging is a passive technology that uses ambient light reflecting from the eye. In this type of imaging it is best to use the contour between iris and the sclera known as the limbus (Figure 53). The disadvantage of visible spectrum imaging is that uncontrolled ambient light can contain multiple specular and diffuse components. Infrared imaging eliminates uncontrolled specular reflection by actively illuminating the eye with uniform and controlled infrared light. The further benefit of infrared imaging is that the pupil, rather than limbus is the strongest feature of the contour in the image. Both the sclera and the iris strongly reflect infrared light while only the sclera strongly reflects visible light. Pupil is a preferable parameter as its contour is smaller and more sharply defined than the limbus and due to its size is less likely to be occluded by the eye lids. However, infrared imaging cannot be used outdoors during daytime due to the ambient infrared illumination [288]. Infrared eye tracking typically uses either a bright-pupil or dark-pupil technique [288] (or combined use of them both [289]). The bright-pupil technique illuminates the eye with a source that is on or very near the axis of the camera, the results is a clearly demarcated bright pupil region due to the photoreflective nature of the back of the eye. In dark-pupil technique, the eye is illuminated with an off-axis source so that the pupil is the darkest region in the image, while the sclera, iris and eye lids all reflect relatively more illumination [288]. Both visible and infrared imaging techniques have been used in remote video-based eye tracking. The main reason to use remote eye-tracking system that it can be completely unobtrusive compared to more obtrusive techniques like electrooculography, magnetic eye-coil tracking [290]. Several promising remote eye tracking approaches exist

Eye and photometric measurements 32
[288,291] but at the moment it seems that a head-mounted system has a greater potential to achieve a reasonable compromise between cost, flexibility and quality [288]. 3.2.1 Pelz et al. (2000, 2004)
Pelz et al. [292,293] have developed a lightweight head-mounted video-based eyetracking device. Recent improvement in commercially available micro-lens cameras and other parts have made portable eyetrackers even cheaper and more widely used in behavioral studies [294-297]. Previously, the problems with eyetrackers have been the high price ranging from 5,000 to 40,000 US dollars, limiting their use to high-end specialty products. Typically commercial products have also been platform specific and difficult to use. An open-source system would virtually allow anyone to explore eyetracking in many ways. This is partly accomplished by Pelz et al. [292,293] while their system requires high-cost proprietary equipment. The prototype of Pelz et al. [292,293] using dark-pupil technology can be seen in Figure 34. The scene and eye cameras are mounted to a low-cost pair of safety glasses with most of the plastic lens cut away. The nose bridge in glasses provides the best stability, preventing large movements of the headgear during use. The prototype uses one small infrared LED (IRED) for the illumination of the eye, positioned next to the eye camera as shown in Figure 35. The IRED (Ø=5mm, λmax=940 nm) is off-axis with respect to the camera’s focal axis so that the resulting pupil image is dark as illustrated in Figure 36. It is important to drive the IRED at the proper forward voltage (Vout) which is achieved by using an adjustable voltage regulator (LMT317T) with a 5k potentiometer and Vout of 1,2 volts for the IRED. It is also critical to limit the irradiance of IRED on the eye to a safe level. An irradiance (mW/cm2) level less than 10 mW/cm2 is considered safe for chronic IR exposure in the 720 – 1400 nm range [298-300]. The IR illuminator in the prototype produces adequate illumination for the camera with an irradiance of only 0.8 mW/cm2. The chosen micro-lens video camera is Supercircuits PC206XP, which houses a 0.36cm black and white CMOS imager with 380 lines of resolution. The camera measures only 0.95cm square by 1.6cm so its occlusion of the subject’s field of view is minimal. Despite its size, it is able to provide adequate image quality for threshold and edge detection algorithms. The focusable lens provides an 80 degree field of view, and the camera is powered with 12 volts DC at 20 mA. In order to avoid visible light from entering the camera sensor, Kodak’s 87c Wratten filter is placed on top of sensor after unscrewing the eye-camera lens. The color Supercircuits PC53XS
Figure 34. Dark-pupil eyetracking headgear [293].
Figure 36. Dark-pupil illumination[293].
Figure 35. Closeup of the IRED, eye, and scene cameras [293].

Eye and photometric measurements 33
CMOS scene camera was one of the smallest commercially available color cameras. The camera provides a frame of reference by capturing the scene from the observer’s point of view. It weighs 9,5 grams and consumes 50 mA at 12 volts DC. The base of the camera is 1.62cm square, with a lens extending to 2.67cm. Video-based commercial eyetracking systems, such as Applied Science Laboratories and ISCAN, use regular grid of calibration points for calibration. In this system, a laser diode and 2D diffraction grating are used to split the laser beam into a grid of 9-points that can be projected onto a wall or a flat surface in front of the person wearing the headgear. The 9-point grid is imaged by the scene camera and thus provides a reference for calibrating the eye position with respect to the scene image. The system uses a Digikey 3B-102-ND adjustable focus laser diode (17.25 x 6.4 mm) coupled with a 13,500 lines per inch double-axis diffraction grating (www.rainbowsymphony.com). The diffraction grating is sandwiched against the lens of the laser diode after the desired beam is adjusted. Also it should be noted that voltage regulator (3 V in this system) is needed for the proper function of laser diode. The mounted laser module and a conceptual projection of the 9-point target are seen in Figure 37. The other components needed depend on whether eyetracking is done in real-time or offline. Real-time eyetracking is required when the data is used for some interactive task as described earlier, whereas in other cases raw video can be captured and processed through the eyetracking algorithm later. Offline analysis requires that both the eye and scene cameras images be stored, then synchronized on playback. The system uses offline eye and scene capture housed in a back bag as illustrated in Figure 38. The backpack with an additional recording box include a small LCD display, and external laptop battery, a Sony DCR-TVR19 Digital Video Camera, and a video splitter that combines the eye and scene images into a single video image. The benefit of offline processing is that parameters such as field-averaging, region-of-interest windowing, and threshold values can be done more freely and changed more accurately during the recording. Offline processing also makes calibration easier as it is possible to “freeze-frame” to ensure a stable eye and scene image for proper calibrations which in online processing can fail due to a blink for example. The prototype meets the need for low-cost eyetracker for research even though price could have been pressed down a bit more.
3.2.2 Li et al. (2006): openEyes
Li et al. [288] further developed the idea of a low-cost head-mounted eyetracking solution of Pelz et al. [292,293]. Their [288] open-source system is called openEyes, which consists of low-cost off-the-shelf components and a set of open-source software tools for digital image capture, manipulation, and analysis in eye-tracking applications. The total cost of the
Figure 37. (A) Close up of the laser diode. (B) Illustration of laser projection system (note that the points must be projected onto a flat surface, i.e. a wall, table, etc.) [293].
Figure 38. Off-line eye and scene capture housed in a backpack [293].

Eye and photometric measurements 34
system by Pelz et al. [292,293] was not given in their publication, but Li et al. [288] claim that their system is much cheaper. Aside from a desktop or laptop computer to process video, the system costs approximately 350 US dollars to construct. Authors have also developed a novel video-based eyetracking algorithm called Starburst [301], provided both as a cross-platform Matlab implementation and as a C implementation for Linux platforms. Both the hardware construction plans and the software that implements the algorithm are freely available (http://hcvl.hci.iastate.edu/openEyes/). The hardware design (Figure 39) of Li et al. [288] is similar to the one by Pelz et al. [292,293] with the eye and the scene camera mounted to a low-cost pair of safety glasses. It also uses dark-pupil technique (Figure 39, right). It would be also possible to place the cameras either above the eyes, on top of the head or above the ears but that configuration would require the integration of mirror or prism in the camera’s optical path and that would make the system more expensive. It could be argued that in lighting research where the eye tracking device is shading the ambient lighting that is to be measured, an indirect approach with optical components could be more accurate in quantifying the light exposure. However, as the components are attached to the head gear and thus static in the user’s visual field, they are easily ignored as normal eye glasses are ignored [288]. Li et al. settled upon using an inexpensive (~100 US dollars [302]) Unibrain Fire-I IEEE-1394 web camera [303] with Sony ICX098BQ CCD sensor [304]. The bandwidth of these cameras (400Mbit/sec) is sufficient to capture video simultaneously from two cameras at a resolution of 640x480 pixels with a frame rate of 30 Hz. Additional benefits of IEEE-1394 compared to USB 2.0, was that IEEE-1394 cameras on the same bus will automatically synchronize themselves and that the IEEE-1394 is well supported under Linux. The infrared LED (IRED) was powered from a free USB port on the laptop. The infrared blocking filter was removed from the original lens from the camera and replaced with an 87c Wratten filter to block visible light and allow only infrared light to pass. Original 4.5 mm lens with a field of view (FOV) of 111˚ was replaced with a 12 mm lens with a FOV of 56˚ and significantly less radial distortion typical of wide field of view lenses. The new lens allowed tracking eye movements with an accuracy of approximately 1 degree of visual angle. In contrast to the dependence of an offline hardware and software processing purchased from a production house in the system by Pelz et al. [292,293], Li et al. [288] use totally open-source approach referred as Starburst algorithm [301]. Typically eye-tracking algorithms can be classified into two approaches: feature-based and model-based approaches [301]. Feature-based approaches detect and localize image features related to the position of the eye. The tracked features vary widely depending on the application but normally intensity levels or intensity
Figure 39. (left, center) 4th generation of openEyes, a low-cost head-mounted eye-tracking solution. (right) The image captured using infrared illumination. Note that the infrared illum ination strongly differentiates the pupil from the the iris in the image. Also note the presence of a specular reflection of the LED. This is an important benefit as the corneal reflection can be tracked and used to compensate for head gear slippage [288].
Figure 40. Schematic diagram of Starburst algorithm [301].

Eye and photometric measurements 35
gradients are used. For example, in infrared images created with the dark-pupil technique, an appropriately set intensity threshold can be used to extract the region corresponding to the pupil. The intensity gradient can be used to detect the limbus in visible spectrum images [305] or the pupil contour in infrared spectrum images [306]. Model-based approaches find the best fitting model that is consistent with the image rather than explicitly detecting features. For example, integro-differential operators can be used to find the best-fitting circle [307] or ellipse [308] for the limbus and pupil contour. The model-based approach is capable of producing a more precise estimate of the pupil center than a feature-based approach given that a feature-defining criteria is not applied to the image data. However, a gain in accuracy of a model-based approach is obtained at a significant cost in terms of computational speed and flexibility. Notably however, the use of multi-scale image processing methods [309] in combination with a model-based approach hold promise for real-time performance [310]. The Starburst algorithm [301] combines feature-based and model-based approaches to achieve a good tradeoff between run-time performance and accuracy for dark-pupil infrared illumination. The algorithm consists of six different phases: noise reduction; corneal reflection detection, localization and removal; pupil contour detection; ellipse fitting; model-based optimization; and homographic mapping and calibration as seen in Figure 40. The noise reduction is needed due to the use of low-cost cameras. The shot noise is reduced applying a 5 x 5 Gaussian filter with a standard deviation of 2 pixels. The spurious line noise and it can be optionally reduced by applying a normalization factor line by line to shift the mean intensity of the line to the running average derived from previous frames. Line noise reduction is not necessarily needed when the algorithm is used in combination with an eye tracker capable of capturing less noisy images. The corneal reflection then corresponds to one of the brightest regions in the eye image (Figure 36). Thus the corneal reflection can be obtained through thresholding. Adaptive thresholding technique is used in each frame instead of a constant threshold technique. The ratio between largest candidate region (the brightest region) and the average area of other regions is calculated as the threshold is lowered. At first, the ratio will increase because the corneal reflection will grow in size faster than other areas, and at some point ratio will start to drop as false candidates become more prominent. The threshold that generates the highest ratio is chosen as the threshold. Radial interpolation is then used to remove the corneal reflection. First, the central pixel of the identified corneal reflection region is set to the average of the intensities along the contour of the region. Then for each pixel between the center and the contour, the pixel intensity is determined via linear interpolation. An example of this process is seen in Figure 43 (compare a and b). Authors [301] have also developed a novel algorithm feature-based method to detect the pupil contour (pseudo code seen in Figure 41). Normally feature-based approaches apply edge detection to the entire image which is computationally wasteful as the pupil contour occupies typically very little of the image. In
Figure 41. Feature-point detection method.

Eye and photometric measurements 36
Starburst algorithm only edges along a limited number of rays are detected that extend from central best guess of the pupil center (Figure 42a). This method takes advantage of the high-contrast elliptical profile of the pupil contour present in dark-pupil technique images. Feature points are found computing the derivatives along rays extending radially until threshold is exceeded. In the first stage, the candidate feature points are detected from a starting point. In the second stage, for each of the candidate feature points, the feature-detection process is repeated using the candidate feature points as the starting point. The second stage tends to increase ratio of the number of feature points on the pupil contour over the number of feature points not on the pupil contour. This two-stage process iterates by replacing the starting point with the center of the detected feature points until the position of the center converges. The second stage improves the robustness of the process especially with the images obtained at low frame rates (e.g. 30 Hz) when the eye can rapidly change positions from frame to frame. Given a set of candidate feature points, the next step of the algorithm is to find the best fitting ellipse. Other algorithms commonly use least-squares fitting of an ellipse to all the feature points (e.g. [311]) where gross errors made in feature detection stage can strongly influence the accuracy of the results. To address this issue, authors [301] have chosen to apply Random Sample Consensus (RANSAC) paradigm for model fitting [312]. RANSAC is frequently used in computer-vision problems [313], but according to the authors this is the first time when it is used in eye tracking applications. RANSAC is an effective iterative procedure for model fitting in the presence of a large but unknown percentage of outliers in a measurement sample. An inlier is a sample in the data attributable to the mechanism being modeled whereas an outlier is a sample generated through error and is attributable to another mechanism not under consideration. In our application, inliers are all of those detected feature points that correspond to the pupil contour and outliers are feature points that correspond to other contours, such as that between the eye lid and the eye. While the accuracy of the RANSAC fit may be sufficient for many eye tracking applications, the result of ellipse fitting can be improved through a model-based optimization that does not rely on feature detection. At last, in order to calculate the point of gaze of the user in the scene image, a mapping between locations in the scene and an eye-position measure (e.g. the vector difference between the pupil center and the corneal reflection) must be determined. Typically this is achieved during a calibration procedure [314], where the user is required to look at a number of scene points for which the positions in the scene image are known (Figure 41). The whole algorithm procedure is illustrated in Figure 43. Authors [301] still would like to improve the robustness of the algorithm to variations of its free parameters. Other possible improvements could be to ignore corneal reflection removal as it can be computationally heavy, use a Kalman filter to predict the pupil center, and the implementation of automatic
Figure 42. Feature detection. (a) Pupil contour edge candidates are detected along the length of a series of rays extending from a best guess of the pupil center. Pupil contour candidates are marked using crosses. Note that two contour candidates are incorrect -one ray reaches the border and does not generate a candidate. (b) For each pupil contour candidate another set of a rays are generated that create a second set of pupil contour candidates (c) pupil contour candidates not on the pupil contour can lead to additional feature points not on the contour however these are typically not consistent with any single ellipse.

Eye and photometric measurements 37
calibration as manual calibration can become tiresome. Given that the source code is freely available under the GNU public license (GPL), it could be in theory modified to measure only the pupil size as it is more important parameter in measuring the light exposure.
3.3 PUPIL SIZE
As the biological responses of light depend on the illuminance coming to the retina, and the amount of light reaching retina depends also the pupil size it would be useful somehow to measure the pupil size. Measuring pupil diameter is becoming also increasingly important in many optometry and ophthalmological applications such as in refractive surgery (LASIK, PRK), corneal transplantation and advanced contact lens fitting [315]. For example it has been noted that the outcome of refractive surgery is worse in patients with large pupils [316]. The importance of pupil size in ophthalmological applications also mean that there is a clear driving force to develop even better measurements devices which will ultimately benefit the measurements done in illumination engineering. Traditionally pupil size has been estimated using specially designed millimeter rulers or gauges and a method called Rosenbaum card, in which the pupil diameter is estimated with a series of increasing half-circle diameters. This have proved to be inaccurate and underestimating the real pupil size [317] as well as depending largely on the examiner itself. More sophisticated methods are infrared pupillometers such as hand-held Colvard pupillometers (Figure 49A [318]) or a video-driven infrared pupillometers (Figure 49B [318]). Latest emerged method has been the use of standard consumer digital photography in pupil size determination. Also it is possible to use technique called photoretinoscopy, which is used in human factor applications [319] (driving, etc.) to measure ocular accommodation. As the traditional rulers and Rosenbaum cards have been proved to be inaccurate, and the Colvard pupillometer would require very close measuring distance to the eye, we won’t examine them any further. There is also a need for continuous measurement in mesopic and circadian lighting measurements, which is not possible with the traditional methods. That leaves us then video-driven infrared pupillometer, digital photography and photoretinoscopy. Other main problem in addition to inaccuracy in pupil size measurements have been the individual variability. It is possible to get significantly different results from same condition when done by skilled technician compared to inexperienced trainee. This
Figure 43. (a) The original image with noise reduction. (b) The image with the corneal reflection removed. (c) Candidate feature points. (d) Ellipse fitted using least-square method. (e) The inliers (green crosses) and outliers (red crosses) differentiated by RANSAC. (f) Another example with many more outliers. (g) Best-fit ellipse using only inliers. (h) Best-fit ellipse using model-based minimization.
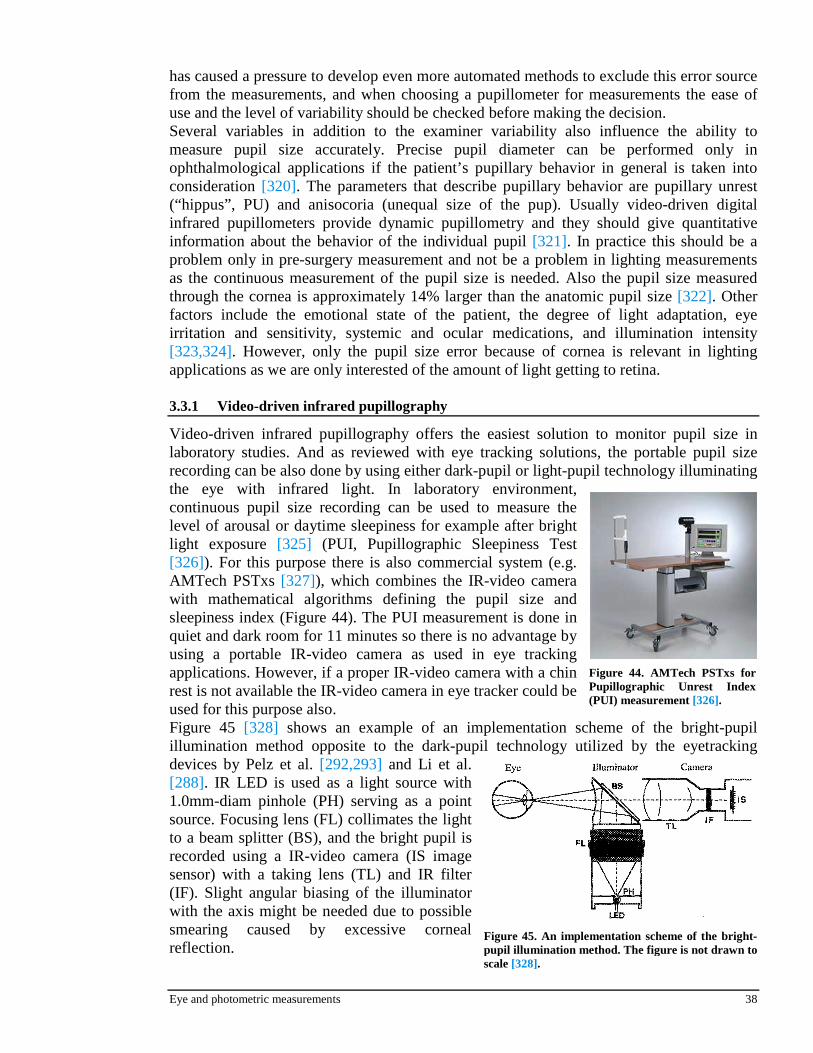
Eye and photometric measurements 38
has caused a pressure to develop even more automated methods to exclude this error source from the measurements, and when choosing a pupillometer for measurements the ease of use and the level of variability should be checked before making the decision. Several variables in addition to the examiner variability also influence the ability to measure pupil size accurately. Precise pupil diameter can be performed only in ophthalmological applications if the patient’s pupillary behavior in general is taken into consideration [320]. The parameters that describe pupillary behavior are pupillary unrest (“hippus”, PU) and anisocoria (unequal size of the pup). Usually video-driven digital infrared pupillometers provide dynamic pupillometry and they should give quantitative information about the behavior of the individual pupil [321]. In practice this should be a problem only in pre-surgery measurement and not be a problem in lighting measurements as the continuous measurement of the pupil size is needed. Also the pupil size measured through the cornea is approximately 14% larger than the anatomic pupil size [322]. Other factors include the emotional state of the patient, the degree of light adaptation, eye irritation and sensitivity, systemic and ocular medications, and illumination intensity [323,324]. However, only the pupil size error because of cornea is relevant in lighting applications as we are only interested of the amount of light getting to retina. 3.3.1 Video-driven infrared pupillography
Video-driven infrared pupillography offers the easiest solution to monitor pupil size in laboratory studies. And as reviewed with eye tracking solutions, the portable pupil size recording can be also done by using either dark-pupil or light-pupil technology illuminating the eye with infrared light. In laboratory environment, continuous pupil size recording can be used to measure the level of arousal or daytime sleepiness for example after bright light exposure [325] (PUI, Pupillographic Sleepiness Test [326]). For this purpose there is also commercial system (e.g. AMTech PSTxs [327]), which combines the IR-video camera with mathematical algorithms defining the pupil size and sleepiness index (Figure 44). The PUI measurement is done in quiet and dark room for 11 minutes so there is no advantage by using a portable IR-video camera as used in eye tracking applications. However, if a proper IR-video camera with a chin rest is not available the IR-video camera in eye tracker could be used for this purpose also. Figure 45 [328] shows an example of an implementation scheme of the bright-pupil illumination method opposite to the dark-pupil technology utilized by the eyetracking devices by Pelz et al. [292,293] and Li et al. [288]. IR LED is used as a light source with 1.0mm-diam pinhole (PH) serving as a point source. Focusing lens (FL) collimates the light to a beam splitter (BS), and the bright pupil is recorded using a IR-video camera (IS image sensor) with a taking lens (TL) and IR filter (IF). Slight angular biasing of the illuminator with the axis might be needed due to possible smearing caused by excessive corneal reflection.
Figure 44. AMTech PSTxs for Pupillographic Unrest Index (PUI) measurement [326].
Figure 45. An implementation scheme of the bright-pupil illumination method. The figure is not drawn to scale [328].

Eye and photometric measurements 39
(A) (B)
Figure 49. (A) The Colvard pupillometer. The device is held 5-8 cm from the eye, and a millimeter ruler is superimposed by a reticule in the device, which allows direct measurement [318]. (B) The VIVA (Video Vision Analyzer, Fortune Optical). Three images of the pupil size are taken by infrared light. The photographs are taken with room light, although the measurements in this study were taken under low-light conditions [318].
Figure 48. Measurement of pupil diameter using an infrared video-computer system. The image was obtained with an infrared video camera. It was then captured, and the pupil diameter was measured using a computer program [340].
Figure 47. Instruments used for pupil measurements: (A) Digital camera; (B) infrared video camera (behind digital camera); (C) fiber-optic illuminator.
Figure 46. (A) Photoretinoscopy setting with PowerRefractor. (B) plusoptiX PowerRef II [329].
(A)
(B)

Eye and photometric measurements 40
3.3.2 Photorefractometry
Last and maybe the most promising method for lighting practices is the infrared photorefractor. It is a unique technique allowing to measurement of accommodation, vergence, refractive errors and pupil size in both eyes simultaneously, objectively, remotely (typical distance between subject and camera is 1 meter as illustrated in Figure 46 [329] and Figure 50B [330].) and continuously [319]. It was first introduced already in 1974 [331] when it suffered from poor accuracy and limited range, and was only limited to static refractive error measurements. However the situation has changed drastically after the introduction of commercially available photorefractometer PowerRefractor (PlusoptiX, Erlangen, Germany) of which current brand name is plusoptiX PowerRef II, and plusoptiX S04 especially for measurements with children.
PowerRefractor uses eccentric [332] technique of photorefraction (other being orthogonal [331] and isotropic [333]), with an infrared light source located on the edge of a mask, eccentric to the optical axis of the camera as seen in Figure 50A [330]. The infrared light is reflected from the eye and the camera can calculate refraction, pupil size, gaze direction and interpupillary distance from the reflection, an example output can be seen in Figure 51 [330]. The “adult” model not shown in pictures essentially has the same specifications. What is also interesting about the PowerRefractor that it can record pupil information in video mode with a sample rate of 25 Hz (or 25 frames per second) however only for 10 seconds. However other light sources in the room can disturb the measurement [334] making it unsuitable for bright circadian measurements but probably suitable for mesopic conditions. Also the apparatus can be used successfully by ophthalmologically unskilled personnel with special training [335]. And as it intended mainly for refraction measurements there is practically no research done in regard to its accuracy in pupil size determination; and the research is limited to its accuracy in refraction [334-337]. That can be partly because many ophthalmological pupil size measurements do not necessarily require long distance or continuous measurement.
Figure 51. Readings: Refraction in Sphere, Cylinder and axis; Pupil size in mm; Gaze charts, visualization of the optic axis. 45mm is the interpupillary distance with the angle [330].
(B) (A)
Figure 50. (A) Picture of S04. Fixation lights are needed to attract the child's attention towards the camera. Loudspeakers are for sound signals to enhance the fixation lights. Infrared LEDs are responsible for the actual measurement and the lens is placed in the centre of the camera. (B) Measurement can be done without headrestonly with the aid of a laptop computer while headrest would maybe give a better accuracy [330].

Eye and photometric measurements 41
It would be interesting to see a research where PowerRefractor is compared to infrared video and digital photography measurements. Pupil size could be estimated also by using a slit lamp or videokeratoscope [338], but slit lamp is not suitable for lighting measurements and the accuracy of videokeratoscope have been questioned for eyes with dark irides [339] and they were not reviewed here. 3.3.3 Digital photography
In a study by Twa et al. [340] it was studied how well digital photography compared to infrared video system. Normal consumer digital camera (Nikon 990) was used to determine the pupil size (Figure 47), Sony XC-ST70 being the compared infrared video camera. Photographs of the pupil were taken with auto-flash function and 8ms exposure, which was shorter than the 180ms minimum latent period of the pupillary response to the flash [323]. Camera was handheld at a preset focal distance, which caused some unsuccessful photos (12/270 photos) due to misalignment. Photos were then graded (pixel to millimeter transformation, example in Figure 48 [340]) manually with Adobe Photoshop 5.5 while also other suitable software existed for this task like NIH Image (Mac) and it’s Windows equivalent Scion Image. Figure 52 shows the variability in photographing between two examiners (A) and between two graders (B) (manual pixel to millimeter transformation). There was some variability in taking the photograph while there was a good repeatability in grading, which was also evident with the infrared video method (not shown here). The differences between different methods were compared and the results are shown in Table 3. It shows that there were no significant differences between digital photography and infrared video at any illumination level. However the repeatability was better with infrared video especially under bright light conditions than digital photography. In conclusion the digital photography method provided an inexpensive and accurate method of pupil measurement while better suited for clinical research in which accuracy and repeatability have priority over speed and simplicity. And while the camera is not capable of continuous tracking of the pupil size it is not that essential in circadian measurements as there is more relevant to know the long-term integration of light and 1-2 s intervals in picture taking should provide sufficient information on pupil behavior. And the fact that normal digital camera could be
Table 3. Comparison of mean pupil size estimations with each measurement method by illumination level. Values are means SD. Statistically significant results are indicated in bold (P<0,01). Template=Rosenbaum card [340].
Figure 52. (A) Difference between 2 examiners’ digital photographic observations. (B) Difference between 2 graders’ pupil measurements from digital photographs [340].
(B) (A)
Figure 53. Limbus, thin area that connects the cornea and the sclera [345].
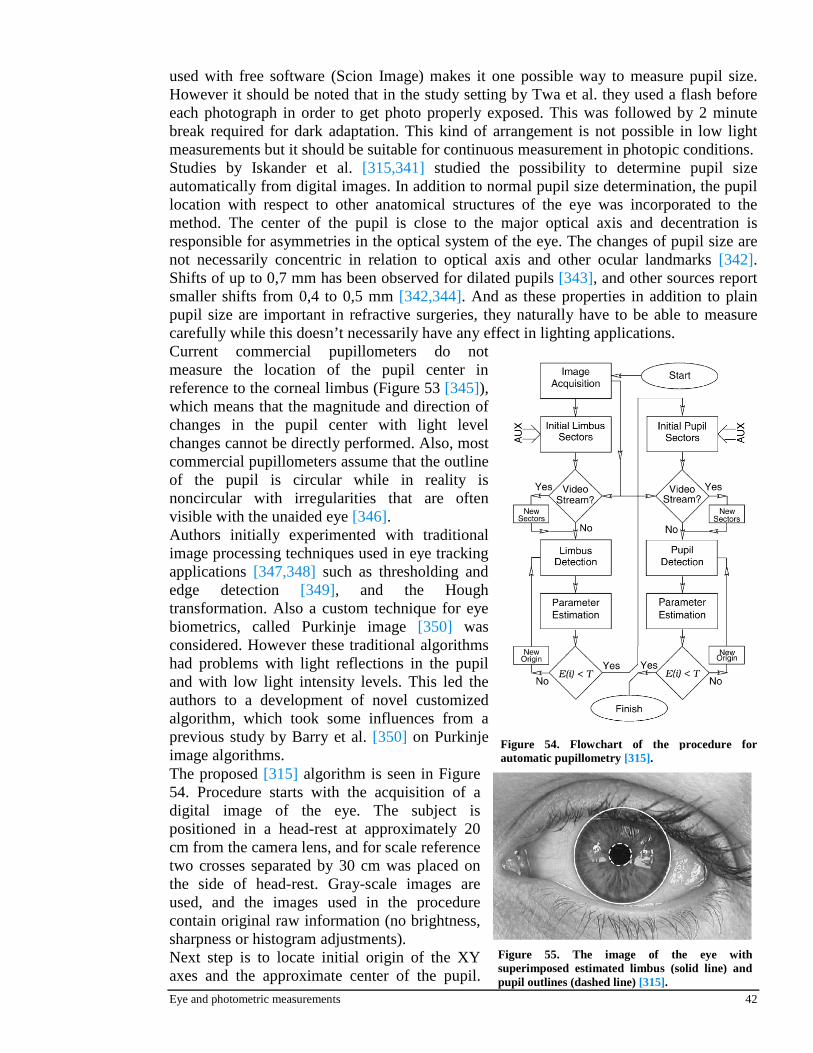
Eye and photometric measurements 42
used with free software (Scion Image) makes it one possible way to measure pupil size. However it should be noted that in the study setting by Twa et al. they used a flash before each photograph in order to get photo properly exposed. This was followed by 2 minute break required for dark adaptation. This kind of arrangement is not possible in low light measurements but it should be suitable for continuous measurement in photopic conditions. Studies by Iskander et al. [315,341] studied the possibility to determine pupil size automatically from digital images. In addition to normal pupil size determination, the pupil location with respect to other anatomical structures of the eye was incorporated to the method. The center of the pupil is close to the major optical axis and decentration is responsible for asymmetries in the optical system of the eye. The changes of pupil size are not necessarily concentric in relation to optical axis and other ocular landmarks [342]. Shifts of up to 0,7 mm has been observed for dilated pupils [343], and other sources report smaller shifts from 0,4 to 0,5 mm [342,344]. And as these properties in addition to plain pupil size are important in refractive surgeries, they naturally have to be able to measure carefully while this doesn’t necessarily have any effect in lighting applications. Current commercial pupillometers do not measure the location of the pupil center in reference to the corneal limbus (Figure 53 [345]), which means that the magnitude and direction of changes in the pupil center with light level changes cannot be directly performed. Also, most commercial pupillometers assume that the outline of the pupil is circular while in reality is noncircular with irregularities that are often visible with the unaided eye [346]. Authors initially experimented with traditional image processing techniques used in eye tracking applications [347,348] such as thresholding and edge detection [349], and the Hough transformation. Also a custom technique for eye biometrics, called Purkinje image [350] was considered. However these traditional algorithms had problems with light reflections in the pupil and with low light intensity levels. This led the authors to a development of novel customized algorithm, which took some influences from a previous study by Barry et al. [350] on Purkinje image algorithms. The proposed [315] algorithm is seen in Figure 54. Procedure starts with the acquisition of a digital image of the eye. The subject is positioned in a head-rest at approximately 20 cm from the camera lens, and for scale reference two crosses separated by 30 cm was placed on the side of head-rest. Gray-scale images are used, and the images used in the procedure contain original raw information (no brightness, sharpness or histogram adjustments). Next step is to locate initial origin of the XY axes and the approximate center of the pupil.
Figure 55. The image of the eye with superimposed estimated limbus (solid line) and pupil outlines (dashed line) [315].
Figure 54. Flowchart of the procedure for automatic pupillometry [315].

Eye and photometric measurements 43
Traditionally pupil location is assumed to be the image area of low intensity but this has proven to be inaccurate method. Instead they use a technique introduced by the authors called quadruple axes symmetry indicator (QSI) [351], while other more sophisticated methods based on multiple light sources [352] and curvature algorithms existed [353]. The next step is to set the initial limbus area sectors, which is defined as an image area where the transition from the iris to the sclera is visible. Thus, the limbus sector depends on the individual properties and its direction of gaze, and is emphasized by authors these sectors could be different for left and right eyes or for Caucasian versus Asian eyes. For most application it is sufficient to model the limbus outline with a circle [354,355] as the authors have chosen to do. The pupil outline detection is similar to limbus extraction while eyes with dark irides, this transition may not be clear and cause extra problems to the algorithm. In simple cases it is sufficient to use a circular model for iris, but a better estimate can be obtained using more detailed analysis, a finite Fourier series [346]. The simple estimate with circular limbus and pupil can be seen in Figure 55. Original publication [315] provides the more exact mathematical details of the process but within this paper we won’t go into details. In conclusion, according to the authors they were able to develop a robust algorithm for pupil and limbus size estimation. The model could have been improved by applying more advanced edge detection techniques, but it was proposed that this wouldn’t necessarily brought the desired improvements as each human eye have very unique features which are often hard to generalize. The method is currently under clinical studies and can provide an efficient way to measure pupil size easily and accurately without any manual grading. 3.4 DIGITAL -IMAGING CIRCADIAN PHOTOMETRY
As noticed with Figure 10 the retinal illuminance depends on the size of the light source and the distance from eye, and equal corneal illuminance can correspond to different retinal illuminances. This means that the ambient luminance (or radiance) distribution should be known for proper quantification of circadian responses of light. This can be achieved in practice using either a standard luminancephotometer with a “circadian” optical filter weighing the normal photopic spectral sensitivity V(λ), non-scientific digital camera or by using the scene camera of the eye tracker device. The first two methods have been studies and are reviewed here. The use of scene camera for luminance distribution is in practice limited by the poor quality and resolution of the recorded video but could be possible in future as technology develops. 3.4.1 Circadian-weighed luminancephotometers (Gall et al., 2004)
Model of circadian action spectra was presented by Gall et al. [356] in 2004. Its basic idea is the same as with Rea et al. to provide a circadian action function c(λ) based on the findings of Thapan [116] and Brainard [225] (Figure 56), which enables the derivation of circadian quantities from photometric quantities using a circadian action factor acv. The measurement of values is possible by using either spectroradiometers, c(λ)-adapted detectors or as a first approximation the CIE standard colored on the peak wavelength of 460 nm suggested by Thapan et al. [103] and Brainard et al. [225], and does not take into account the proposed spectral opponency.
Figure 56. Averaged circadian action function c(λ) [356] based on the findings of Thapan [103] and Brainard [225].

Eye and photometric measurements 44
By using circadian action function c(λ), it is possible to calculate circadian radiation quantities Xec: (constant K = 1)
∫ λλ= λ d)(cXKX eec (7)
Where, Xeλ = Le,λ= Spectral radiance
sr,nm,2
m
W
The ratio of the integrals of the circadian and the photometric quantities is called by Gall and Lapuente [357] the circadian action factor acv:
∫∫
λλ
λλ=
λ
λ
d)(VX
d)(cXa
e
e
cv (8)
Where, V(λ) = Photopic spectral luminous efficiency function
This action factor allows a comparison of different light spectra. The relation between circadian quantities and photometric quantities Xv is as follow:
vm
cvec X
K
aX = (9)
Where, Km = Maximum spectral luminous efficacy 683
W
lm.
These equations can be used to calculate the circadian quantities from the spectral power distribution measured by spectroradiometers. It would also be possible to manufacture a custom c(λ)-filter for a measurement camera. Authors have used luminancephotometer LMK color [358], which gives graphic distribution of acv-values within an area of measurement (Figure 57A). The first approximation with the CIE standard color-matching function λz , the acv circadian action can also be measured. For example, a tristimulus
colorimeter can be used with the Y-detector to measure the photometric quantity, where x, y, and z are CIE color coordinates:
y
yx1
y
z
d)(VX
d)(zXa
e
e
cv
−−==λλ
λλ≈∫∫
λ
λ (10)
Figure 57B shows the lines with similar acv-values in the CIE standard chromaticity diagram. This enables the circadian evaluation of the light sources with correlated color temperature (CCT). As the circadian response depends heavily on the illuminance at the eye rather than on task areas, the final response can be calculated taking into account the reflectance characteristics of the environment. Even though the chosen peak wavelength seems to be wrong according to latest information [359] and the spectral opponency is not included in the model, these results could be as one possible basis when developing better models. One benefit of this model would be that it allows direct transformation from photometric quantities to circadian quantities measured with traditional lighting measurement devices or with spectroradiometers. However the model is lacking the data on pupil size.

Eye and photometric measurements 45
3.4.2 Digital photography (Hollan et al., 2004)
The measurement of circadian effective luminance can be also done with “non-scientific” cameras that offer raw format. Hollan [360] compared two commercial digital cameras (Fuji S5000 and Canon EOS D60) for the match of the sensitivity of blue pixels to the action spectrum of the non-imaging forming (NIF) human visual system. The action spectrum used in the study was a compound graph (Figure 58) modeled from the results by Brainard et al. [225], Thapan et al. [103], and Hankins and Lucas [223]. Left wing of the curve was corrected with the les transmissivity curve taken from Stockman et al. [361]. The modeled formula consists of two parts, for violet (V) and green (G) wing separately. The wings match at the maximum sensitivity (in the energy domain, not a photon domain) at a wavelength of maxS nanometers, maxS = 460. For x = wavelength / 1 nm,
( ) ( )32 maxSxbVmaxSxaV)x(actspV −∗+−∗= (11)
( ) ( )32 maxSxbGmaxSxaG)x(actspG −∗+−∗= (12)
the constants are, aV = -7.57e – 5 bV = 5.59e – 6 aG = -1.30e – 4 bG = 3.06e - 7
Figure 57. (A) The distribution of acv-values within an area of measurement.. (B) acv-values in the CIE standard chromaticity diagram [356].
(A) (B)
Circadian action factor in the CIE standard chromaticity diagram.
Figure 58. Action spectrum of melatonin suppression by light after Brainard et al. [225], Thapan et al. [103], Hankins and Lucas [223], corrected for lens absorption after Stockman et al. [361]. Graph from Hollan [360].

Eye and photometric measurements 46
The examined cameras were calibrated using a solar spectrum. The images have been taken (Figure 59) with the appropriate angular height of the Sun in the sky, so that its light went through 1,5 times the thickness of the atmosphere. A CD-based cardboard spectroscope (with a lit from two razors) had been used, after a series of attempts. Solar spectrum has a lower intensity at a handful of wavelengths, so-called spectral lines. After processing the images, the solar spectrum graph as recorded by the three types of camera pixels has been obtained. The results can be seen in Figure 60, with the comparison of CCD-colors (Fuji S5000, Figure 60A) and CMOS-colors (Canon EOS D60, Figure 60B) to the three sensitivity functions (photopic, scotopic, “metabolic” or circadian).
From the two graphs, it can be seen that at least some CCD cameras can measure melatonin-affecting light rather well. All the needed software is available at http://amper.ped.muni.cz/light/luminance for calibration of the camera. However, it is pointed out that it is not easy to use, but what is important that the effective amount of radiation affecting melatonin secretion can be documented for further use. It should be also noticed that the spectral sensitivity curve for circadian visual system and the blue CCD-sensor differ significantly from the shape of the sensitivity curve proposed by Rea et al. [133] (Figure 24). This could be naturally corrected with specific optical filters placed in front of the lens. But given the uncertainty of proper spectral sensitivity curve for circadian visual system and the possible spectral differences in alertness promotion [140] and melatonin suppression [116,133,225] makes this kind of measurement inflexible. At the moment, it would seem better approach to use spectroradiometer for the measurement of irradiance, as the spectral data could be then weighed mathematically to match current knowledge. This approach would also allow the re-analysis of the raw spectral data when knowledge increases on the spectral sensitivity curves for different non-image forming (NIF) functions. The examples of the b-luminance (blue = circadian effective luminance) measurements with Fuji S5000 digital camera can be seen in Figure 61. The b-luminance distribution illustrated using color-coding. As the study by Hollan [360] was a part of scotobiology (the study of biology as affected by darkness [362]) research, the introduced method could be used to quantify the light pollution affecting human and animal physiology as this area is relatively unknown [363,364]. For example 5% of Czech population perceives unwanted artificial light from outdoors as one of the two main causes of their sleep problems [365].
(B) (A)
Figure 60. Comparison of the camera sensors to photopic, scotopic and proposed “metabolic” (circadian) spectral sensitivity function. (A) Fuji S5000 CCD-sensitivity, and (B) Canon EOS D60 CMOS-sensitivity. The photopic and scotopic curves are taken from Stockman and Sharpe [63]. Graph from Hollan [360].
Figure 59. Calibrating the cameras using a solar spectrum [360].

Eye and photometric measurements 47
3.5 DOSIMETERS
Dosimeters in regard to this work refer to a device that records the light exposure experienced by a single person [366]. A decade before the discovery of the novel photoreceptor, Koller et al. [367] studied the correlation of photopic illuminance and alertness in day and night watches using a light dosimeter mounted on a frame of spectacles. This type of simple dosimeter is usually implemented to actigraphic measurements in people with sleeping disorders and in circadian studies [368,369]. Actigraph is a small measurement device that has been used to record movement and light exposure. Actigraph is basically an accelerometer measuring movement via acceleration changes. The use of actigraph wrist
Figure 62. (A) BASIC Mini-Motionlogger actigraph. Movement sensor is a piezo-electric beam with capability of detection in all three axes. Dimensions are 4.44 x 3.30 x 0.96 cm, 57 grams with 32 kB memory. Uses easily replacable lithium batteries for run time of up to 30 days. (B) Wireless single sensor (temperature, light, sound) units. Light sensor records only ambent light with a 1 part in 256 resolution and a range of 0-4,096 lx. 32 kB memory allows for 27 days of light recording. [370].
(B) (A)
(A) (B)
Figure 61. Examples of showing and summing color-coded b-luminances (blue) of scene in a logarithmic scale taken with Fuji S5000. Middle of the red colour range corresponds to 1 cd/m2, the green to 10 cd/m2, yellow to 100 cd/m2 etc. Luminance of the face around the eyes is about one candela per square metre (or one nit, using a convenient non-SI name of the unit). (A) A scene from Childhood Leukemia Conference. The black spot means oversaturated pixels. Average luminances of the tiles are given at their bottom, the number in the centre is the average green pixels raw reading. (B) Westiminster Abbey. Its luminances are in one nit and one decinit range. Note the obsolete glaring luminaires at right (the only light which should be visible is the red traffic light [360].

Eye and photometric measurements 48
monitors (e.g. Figure 62A [370]) enables the automated sleep score recording compared to the option that subjects would manually write down the wake and sleep onset times.. The scores from the raw data can be calculated using validated algorithms [371,372]. Typically the light sensor is worn like a medallion and does not quantify the light exposure very well, and in addition to light sensor additional temperature and sound sensors [373] can be connected to the actigraph to get more comprehensive recordings. 3.5.1 LichtBlick (Hubalek et al., 2004)
LichtBlick [253] was a project focusing on the statistical data of exposed illuminances at work places, and the frequency distributions of eye movements associated with luminance distributions at work places. Authors developed 10 low-cost measurement devices to record the illuminance as well as the effective irradiance regarding circadian effects. Two different sensors, one with photopic spectral sensitivity [V(λ)] and other with approximative circadian spectral sensitivity [c(λ)], are fixed at the frame of the glasses (Figure 64). Only the sensors are carried on the head, and via twisted cable they are connected to a control unit and the data recording mini-computer, worn in a bag around the waist. Thus, the measuring unit is light-weight and easily worn all day long. Sample rate for the light recording is 5 Hz, and values range from 0 to 5,000 lx and from 0 to 700 µW/cm2. The f1‘-error (the degree to which the relative spectral responsivity matches V(λ) is characterized by means of the error f1’ [374]) for the V(λ) sensor is 9 % at 0° angle of incidence. Both sensors have a cosine corrected hemispherical sensitivity with a f2-error for V(λ) of 19 % and of 17 % for c(λ). To consider people wearing glasses, all measured data values were decreased by about 10 % – a value based on measurements and literature [375]. While effective facial irradiance can be measured with the developed system, the conversion of retinal to facial data is not possible with a single multiplier [376]. As light from upper temporary visual field has turned out to be most effective in circadian sense [149,150] the proper quantification of retinal irradiance becomes even more difficult. An example of the recording can be seen in Figure 63, As the effective retinal irradiance (see Figure 10) depends on the size of the light source, the illuminance
Figure 64. The two sensors are fixed at the frame of the glasses. On the right side the graph shows the spectral distribution of c(λ) and V(λ) together with the spectral response of the two sensors at an angle of light incident of 0°(data from manufacturer HAMAMATSU) [253].
Figure 63. Data from subject 05 for the time at work only. Top down: illuminance in lx, blue-sensor data in µW/cm2 and the ratio acv [356] of both. Clearly visible is the sun turning towards West and thus into the office. During lunch break more light came into the subjects face. Also the blue-sensor shows higher values. The elevation of the acv is quite remarkable: it drops down below 1.0 at 13:00 hrs. This indicates that the person might have stayed in a zone with less daylight and more artificial light [253].
Figure 65. The dark-pupil eyetracking device (SMI iViewX HED) is shown at the left hand side. Aside are images from the eye tracker video, showing from left to right the gaze to the monitor, to the keyboard and to a paper [253].

Eye and photometric measurements 49
measurement solely does not give information about the distribution of the effective irradiance on the retina. For this purpose luminance measurements (e.g. Figure 57) need to be carried out, and LMK Mobile Rollei d31flex videophotometer [377] was used for this purpose Furthermore, head movements need to be distinguished from eye movements. Therefore, it turned out to be reasonable, to collect data about the gaze position – the point in the subject’s field of vision where the eye is actually focused. For this purpose, authors [253] used commercially available dark-pupil eyetracking device SMI iViewX Hed [378] with an ability to record video at a frame rate of 25 Hz. With the luminance camera, fish-eye photographs with an angle of 180˚ were taken, and based on these photographs a fragmentation into different sectors (linked to objects such as telephone and monitor) has been carried out (Figure 66A). Four different tasks were carried out by the subject (Figure 66B): 3 VDU (Visual Display Unit) task totaling about 8 minutes (top left), 2 VDU with scripture totaling about 8 minutes (top right), 4 times with desk work totaling about 15 minutes (bottom left) and 2 telephone calls totaling about 9 minutes (bottom right). It can be seen that the line of vision concentrates pretty much on the used artifact as with the VDU task the monitor draws the attention of 69,6% of the gaze duration. Conversely VDU with the scripture draws only 39,2 % of the gaze duration to the monitor. While the gaze in telephone task seems to be related to the conducted work task, the eye movements start rambling being mostly attracted by the big plant on the right hand side. Authors [253] hypothesize that differences in eye movements depend on luminance variance and degree of contrast intensity. Indications of the study could be then used to design visually comfortable luminance environment that does not constrain eye movements. 3.5.2 Daysimeter (Bierman et al., 2005)
In Lighting Research center of Rensselaer Polytechnic Institute (USA), a device called Daysimeter was developed by Bierman et al. [379] to address the problems [380] in circadian photometry and the lack of proper measurement devices. As noticed earlier, the circadian phototransduction differs in terms of quantity [157,381], spectrum [133,137-140], spatial distribution [149,150], duration [203,206], timing [182], and the significance of previous photic history [212,213] from conventional photometry including photopic, scotopic, and mesopic lighting conditions. The name Daysimeter comes from its ability to record circadian optical radiation in the sense of quantity and duration for 24 hours for its memory. Figure 69 shows the basic schematics and photograph of Daysimeter. The key functionalities include photopic and estimated circadian radiation exposure measurements, head angle and activity measurements and data logging.
(A)
(B)
Figure 66. (A) The fish-eye photograph shows the office work place of one subject with closed Venetian blinds. Aside the used fragmentation of the scene is presented. (B) Frequency of gaze durations on different plains conducting different tasks [253].

Eye and photometric measurements 50
Two photosensors separately measure photopic and “blue” signals where “blue” is used to estimate the circadian radiation exposure. Figure 67 illustrates the instrument’s photopic and blue spectral response curves (characterized using a grating monochromator) along with the photopic luminous efficiency function [V(λ)] and a circadian spectral response function defined by Rea et al. [382]. It should be noticed that the spectral response curve was derived from the studies by Thapan et al. [116] and Brainard et al. [225] which do not seem to perfectly represent spectral dependency of circadian or non-image forming (NIF) effects of light (see review by Brainard et al. [85]). The blue spectral sensitivity function is a linear function although Figueiro et al. [131] had shown that circadian system responds to light through a non-linear, sub-additive mechanism that cannot be modeled with a simple additive function as shown in Figure 67. However, an additive spectral response was utilized for the blue sensor with the expectation that in future, post-detector processing could be employed to correct the linear function to non-linear function. The photopic sensor used is a Hamamatsu S1223-01 silicone photodiode [383] in a hermetic package. Its relatively large 13 mm2 area provides a bare cell sensitivity of 0,13 µA per lux for Illuminant A [384]. A multi-element substractive glass filter matches the silicon cell response to the photopic luminous efficiency function. An opal glass diffuser is used to modify the spatial characteristics of the sensor to be Lambertian (Figure 68 [385]),
Figure 69. Schematic and photograph of the prototype Daysimeter [379].
Figure 68. Spatial response of the Daysimeter’s light sensors [385].
Figure 67. Shown as solid and dashed lines are the photopic luminous efficiency function (Vλ) and a spectral response of the human circadian system reported by Rea et al. [382], respectively, normalized for equal output when integrated over wavelength with CIE Illuminant A as a light source [379].
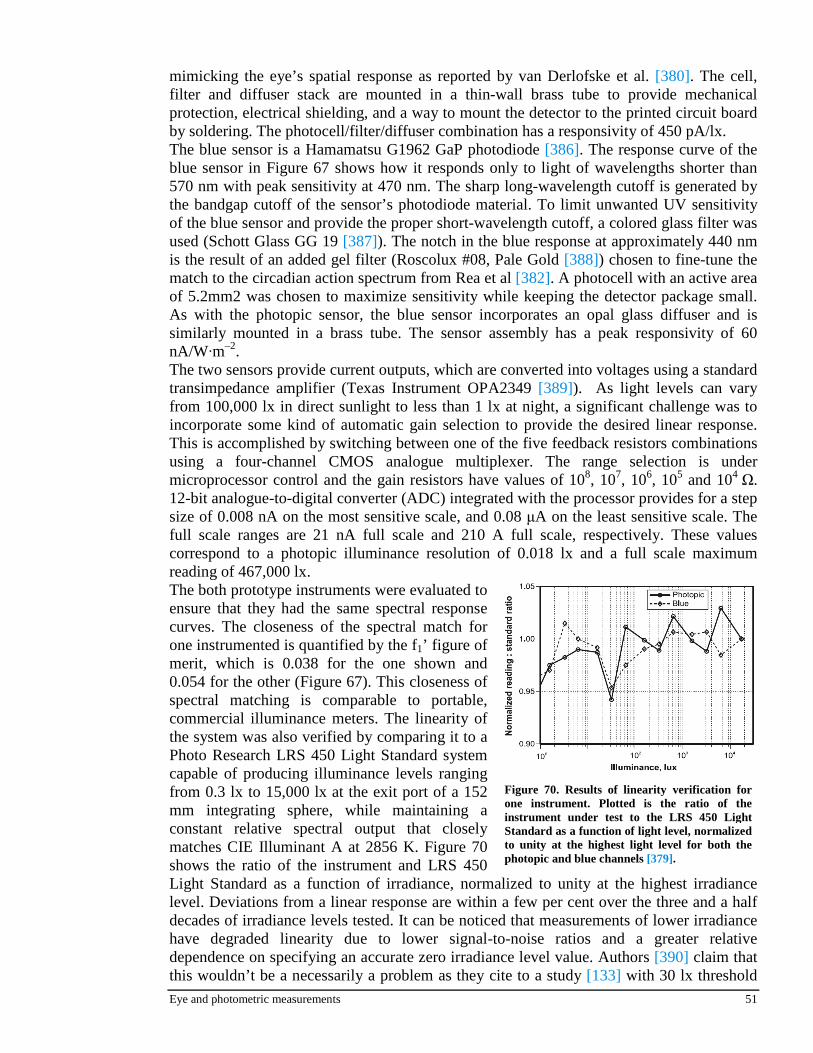
Eye and photometric measurements 51
mimicking the eye’s spatial response as reported by van Derlofske et al. [380]. The cell, filter and diffuser stack are mounted in a thin-wall brass tube to provide mechanical protection, electrical shielding, and a way to mount the detector to the printed circuit board by soldering. The photocell/filter/diffuser combination has a responsivity of 450 pA/lx. The blue sensor is a Hamamatsu G1962 GaP photodiode [386]. The response curve of the blue sensor in Figure 67 shows how it responds only to light of wavelengths shorter than 570 nm with peak sensitivity at 470 nm. The sharp long-wavelength cutoff is generated by the bandgap cutoff of the sensor’s photodiode material. To limit unwanted UV sensitivity of the blue sensor and provide the proper short-wavelength cutoff, a colored glass filter was used (Schott Glass GG 19 [387]). The notch in the blue response at approximately 440 nm is the result of an added gel filter (Roscolux #08, Pale Gold [388]) chosen to fine-tune the match to the circadian action spectrum from Rea et al [382]. A photocell with an active area of 5.2mm2 was chosen to maximize sensitivity while keeping the detector package small. As with the photopic sensor, the blue sensor incorporates an opal glass diffuser and is similarly mounted in a brass tube. The sensor assembly has a peak responsivity of 60 nA/W·m–2. The two sensors provide current outputs, which are converted into voltages using a standard transimpedance amplifier (Texas Instrument OPA2349 [389]). As light levels can vary from 100,000 lx in direct sunlight to less than 1 lx at night, a significant challenge was to incorporate some kind of automatic gain selection to provide the desired linear response. This is accomplished by switching between one of the five feedback resistors combinations using a four-channel CMOS analogue multiplexer. The range selection is under microprocessor control and the gain resistors have values of 108, 107, 106, 105 and 104
Ω. 12-bit analogue-to-digital converter (ADC) integrated with the processor provides for a step size of 0.008 nA on the most sensitive scale, and 0.08 µA on the least sensitive scale. The full scale ranges are 21 nA full scale and 210 A full scale, respectively. These values correspond to a photopic illuminance resolution of 0.018 lx and a full scale maximum reading of 467,000 lx. The both prototype instruments were evaluated to ensure that they had the same spectral response curves. The closeness of the spectral match for one instrumented is quantified by the f1’ figure of merit, which is 0.038 for the one shown and 0.054 for the other (Figure 67). This closeness of spectral matching is comparable to portable, commercial illuminance meters. The linearity of the system was also verified by comparing it to a Photo Research LRS 450 Light Standard system capable of producing illuminance levels ranging from 0.3 lx to 15,000 lx at the exit port of a 152 mm integrating sphere, while maintaining a constant relative spectral output that closely matches CIE Illuminant A at 2856 K. Figure 70 shows the ratio of the instrument and LRS 450 Light Standard as a function of irradiance, normalized to unity at the highest irradiance level. Deviations from a linear response are within a few per cent over the three and a half decades of irradiance levels tested. It can be noticed that measurements of lower irradiance have degraded linearity due to lower signal-to-noise ratios and a greater relative dependence on specifying an accurate zero irradiance level value. Authors [390] claim that this wouldn’t be a necessarily a problem as they cite to a study [133] with 30 lx threshold
Figure 70. Results of linearity verification for one instrument. Plotted is the ratio of the instrument under test to the LRS 450 Light Standard as a function of light level, normalized to unity at the highest light level for both the photopic and blue channels [379].
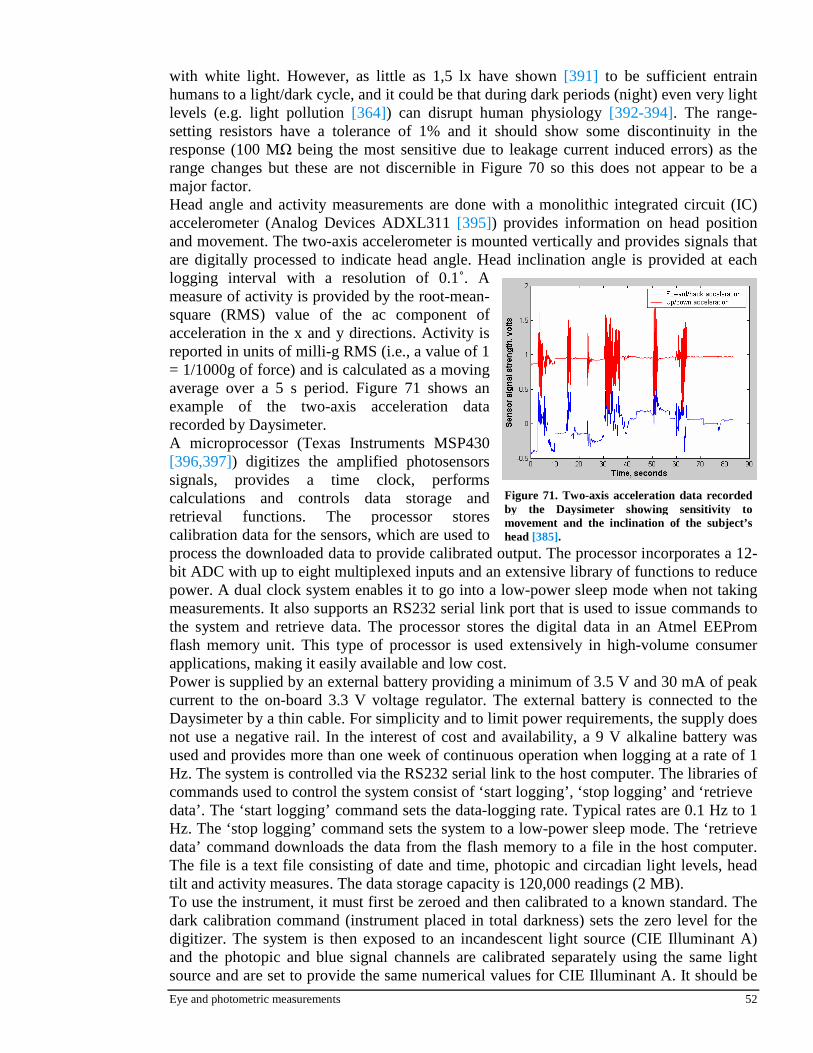
Eye and photometric measurements 52
with white light. However, as little as 1,5 lx have shown [391] to be sufficient entrain humans to a light/dark cycle, and it could be that during dark periods (night) even very light levels (e.g. light pollution [364]) can disrupt human physiology [392-394]. The range-setting resistors have a tolerance of 1% and it should show some discontinuity in the response (100 MΩ being the most sensitive due to leakage current induced errors) as the range changes but these are not discernible in Figure 70 so this does not appear to be a major factor. Head angle and activity measurements are done with a monolithic integrated circuit (IC) accelerometer (Analog Devices ADXL311 [395]) provides information on head position and movement. The two-axis accelerometer is mounted vertically and provides signals that are digitally processed to indicate head angle. Head inclination angle is provided at each logging interval with a resolution of 0.1˚. A measure of activity is provided by the root-mean-square (RMS) value of the ac component of acceleration in the x and y directions. Activity is reported in units of milli-g RMS (i.e., a value of 1 = 1/1000g of force) and is calculated as a moving average over a 5 s period. Figure 71 shows an example of the two-axis acceleration data recorded by Daysimeter. A microprocessor (Texas Instruments MSP430 [396,397]) digitizes the amplified photosensors signals, provides a time clock, performs calculations and controls data storage and retrieval functions. The processor stores calibration data for the sensors, which are used to process the downloaded data to provide calibrated output. The processor incorporates a 12-bit ADC with up to eight multiplexed inputs and an extensive library of functions to reduce power. A dual clock system enables it to go into a low-power sleep mode when not taking measurements. It also supports an RS232 serial link port that is used to issue commands to the system and retrieve data. The processor stores the digital data in an Atmel EEProm flash memory unit. This type of processor is used extensively in high-volume consumer applications, making it easily available and low cost. Power is supplied by an external battery providing a minimum of 3.5 V and 30 mA of peak current to the on-board 3.3 V voltage regulator. The external battery is connected to the Daysimeter by a thin cable. For simplicity and to limit power requirements, the supply does not use a negative rail. In the interest of cost and availability, a 9 V alkaline battery was used and provides more than one week of continuous operation when logging at a rate of 1 Hz. The system is controlled via the RS232 serial link to the host computer. The libraries of commands used to control the system consist of ‘start logging’, ‘stop logging’ and ‘retrieve data’. The ‘start logging’ command sets the data-logging rate. Typical rates are 0.1 Hz to 1 Hz. The ‘stop logging’ command sets the system to a low-power sleep mode. The ‘retrieve data’ command downloads the data from the flash memory to a file in the host computer. The file is a text file consisting of date and time, photopic and circadian light levels, head tilt and activity measures. The data storage capacity is 120,000 readings (2 MB). To use the instrument, it must first be zeroed and then calibrated to a known standard. The dark calibration command (instrument placed in total darkness) sets the zero level for the digitizer. The system is then exposed to an incandescent light source (CIE Illuminant A) and the photopic and blue signal channels are calibrated separately using the same light source and are set to provide the same numerical values for CIE Illuminant A. It should be
Figure 71. Two-axis acceleration data recorded by the Daysimeter showing sensitivity to movement and the inclination of the subject’s head [385].
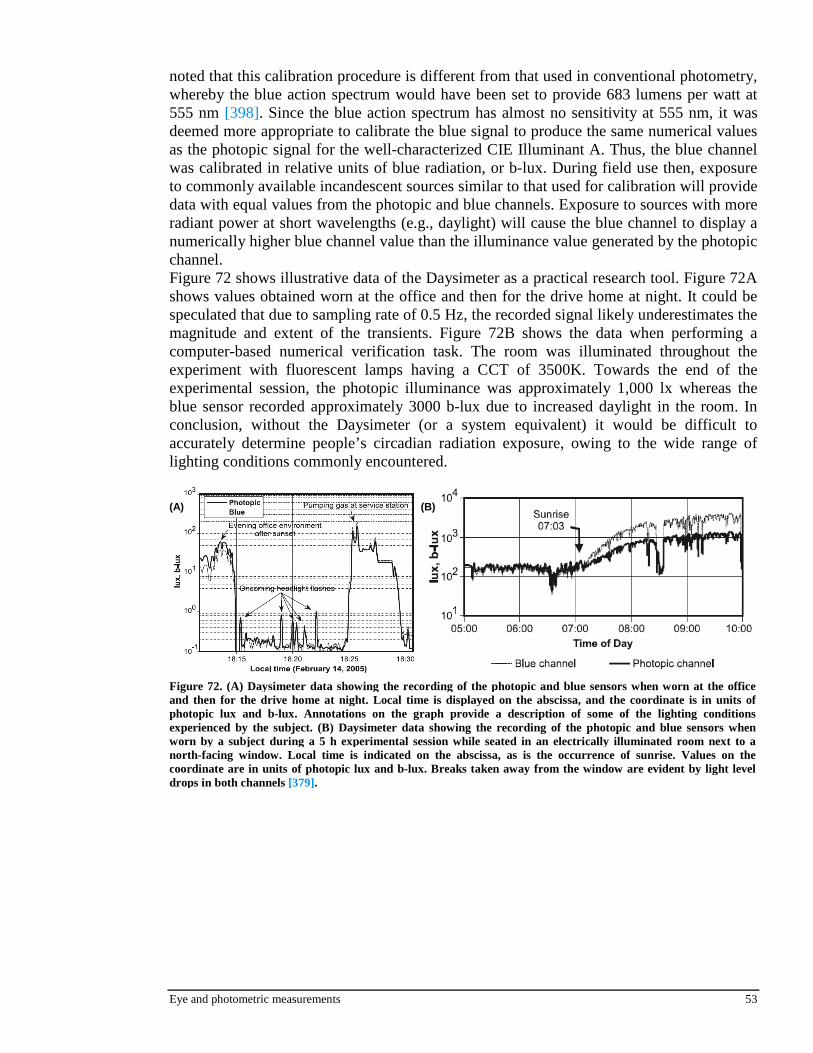
Eye and photometric measurements 53
noted that this calibration procedure is different from that used in conventional photometry, whereby the blue action spectrum would have been set to provide 683 lumens per watt at 555 nm [398]. Since the blue action spectrum has almost no sensitivity at 555 nm, it was deemed more appropriate to calibrate the blue signal to produce the same numerical values as the photopic signal for the well-characterized CIE Illuminant A. Thus, the blue channel was calibrated in relative units of blue radiation, or b-lux. During field use then, exposure to commonly available incandescent sources similar to that used for calibration will provide data with equal values from the photopic and blue channels. Exposure to sources with more radiant power at short wavelengths (e.g., daylight) will cause the blue channel to display a numerically higher blue channel value than the illuminance value generated by the photopic channel. Figure 72 shows illustrative data of the Daysimeter as a practical research tool. Figure 72A shows values obtained worn at the office and then for the drive home at night. It could be speculated that due to sampling rate of 0.5 Hz, the recorded signal likely underestimates the magnitude and extent of the transients. Figure 72B shows the data when performing a computer-based numerical verification task. The room was illuminated throughout the experiment with fluorescent lamps having a CCT of 3500K. Towards the end of the experimental session, the photopic illuminance was approximately 1,000 lx whereas the blue sensor recorded approximately 3000 b-lux due to increased daylight in the room. In conclusion, without the Daysimeter (or a system equivalent) it would be difficult to accurately determine people’s circadian radiation exposure, owing to the wide range of lighting conditions commonly encountered.
Figure 72. (A) Daysimeter data showing the recording of the photopic and blue sensors when worn at the office and then for the drive home at night. Local time is displayed on the abscissa, and the coordinate is in units of photopic lux and b-lux. Annotations on the graph provide a description of some of the lighting conditions experienced by the subject. (B) Daysimeter data showing the recording of the photopic and blue sensors when worn by a subject during a 5 h experimental session while seated in an electrically illuminated room next to a north-facing window. Local time is indicated on the abscissa, as is the occurrence of sunrise. Values on the coordinate are in units of photopic lux and b-lux. Breaks taken away from the window are evident by light level drops in both channels [379].
(B) (A)

Dosimeter design and simulation 54
4. DOSIMETER DESIGN AND SIMULATION
In this chapter the possible improvements and general design principles involved in light dosimeters are discussed. The cost of components is also considered as in field studies many dosimeters are simultaneously needed and the cost of individual device gets important. The main difference in the proposed dosimeter compared to the previous dosimeters is the implementation of pupil measurement to the dosimeter. The main goal of this chapter is to briefly overview the requirements of the measurement device while not going in details of the electronics design. 4.1 EYETRACKER AND /OR PUPIL SIZE MEASUREMENT
Like already mentioned with eye trackers, their main function in circadian photometry is not necessarily to track eye movements but to record pupil size. Given that the openEyes concept (Figure 73) by Li et al. [288] provided the software and hardware freely available, it can be used as a basis for the pupil size measurement device. Step-by-step instructions for the hardware construction were also provided [399]. The detailed component with the prices paid by the authors can be seen in Table 4-Table 11 [400]. The total price of all components is ≈$530 (≈417€) with the video cameras (eye and scene) being the most expensive components. If the scene camera is removed enabling only pupil recording, the cost can be reduced as the components Table 8 and Table 9 typed in italics become unnecessary. With the unnecessary components removed, new cost estimation for the system is ≈$350 (≈275€). x Table 4. Radioshack (http://www.radioshack.com/). Total $27.53 [400].
Item Part No. Price 33 Ohm Resistor 271-1104 $0.99 14 pin dip socket (4 @ $1.20) 900-7243 $4.80 IR LED 276-143 $1.79 Aluminum Project Enclosures (2 @ $2.99) 270-238 $5.98 Electrical Tape 64-2375 $3.19 Solder 64-009 $8.39 Heat Shring Tubbing 278-1627 $2.39
Table 5. 9th Tee Enterprises (http://www.9thtee.com/zipties.htm). Total $11.55 [400].
Item Part No. Price Zip Ties ZIPTIEASST1000 $11.55
Table 6. RAM electronics (http://www.ramelectronics.net/catalogbyProdID.asp?prodid=mem-90072). Total $15.90 [400].
Item Part No. Price 10' Cable, DB15 Male to Female (2 @ $7.95) MEM-90072 $15.90
Table 7. McMaster-Carr (http://www.mcmaster.com/). Total $30.18 [400].
Item Part No. Price Aluminum Wire (14 gauge, 1/4 lbs coil) 8904K73 $5.91 Aluminum Wire (9 gauge, 1/4 lbs coil) 8904K75 $8.89 DB15 Female Connectors (package of 6) 2146T13 $7.69 DB9 male Connectors (package of 6) 2146T11 $7.69
Figure 73. openEyes, eyetracking solution [399].
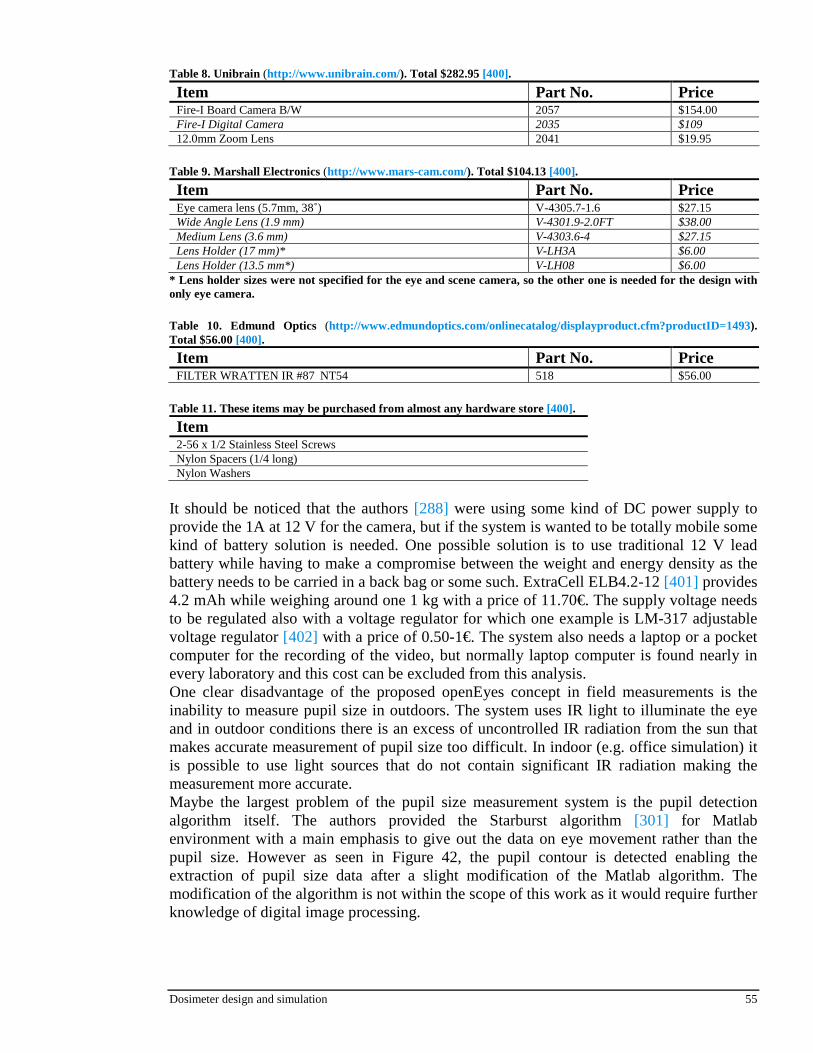
Dosimeter design and simulation 55
Table 8. Unibrain (http://www.unibrain.com/ ). Total $282.95 [400].
Item Part No. Price Fire-I Board Camera B/W 2057 $154.00 Fire-I Digital Camera 2035 $109 12.0mm Zoom Lens 2041 $19.95
Table 9. Marshall Electronics (http://www.mars-cam.com/). Total $104.13 [400].
Item Part No. Price Eye camera lens (5.7mm, 38˚) V-4305.7-1.6 $27.15 Wide Angle Lens (1.9 mm) V-4301.9-2.0FT $38.00 Medium Lens (3.6 mm) V-4303.6-4 $27.15 Lens Holder (17 mm)* V-LH3A $6.00 Lens Holder (13.5 mm*) V-LH08 $6.00
* Lens holder sizes were not specified for the eye and scene camera, so the other one is needed for the design with only eye camera. Table 10. Edmund Optics (http://www.edmundoptics.com/onlinecatalog/displayproduct.cfm?productID=1493). Total $56.00 [400].
Item Part No. Price FILTER WRATTEN IR #87 NT54 518 $56.00
Table 11. These items may be purchased from almost any hardware store [400].
Item 2-56 x 1/2 Stainless Steel Screws Nylon Spacers (1/4 long) Nylon Washers
It should be noticed that the authors [288] were using some kind of DC power supply to provide the 1A at 12 V for the camera, but if the system is wanted to be totally mobile some kind of battery solution is needed. One possible solution is to use traditional 12 V lead battery while having to make a compromise between the weight and energy density as the battery needs to be carried in a back bag or some such. ExtraCell ELB4.2-12 [401] provides 4.2 mAh while weighing around one 1 kg with a price of 11.70€. The supply voltage needs to be regulated also with a voltage regulator for which one example is LM-317 adjustable voltage regulator [402] with a price of 0.50-1€. The system also needs a laptop or a pocket computer for the recording of the video, but normally laptop computer is found nearly in every laboratory and this cost can be excluded from this analysis. One clear disadvantage of the proposed openEyes concept in field measurements is the inability to measure pupil size in outdoors. The system uses IR light to illuminate the eye and in outdoor conditions there is an excess of uncontrolled IR radiation from the sun that makes accurate measurement of pupil size too difficult. In indoor (e.g. office simulation) it is possible to use light sources that do not contain significant IR radiation making the measurement more accurate. Maybe the largest problem of the pupil size measurement system is the pupil detection algorithm itself. The authors provided the Starburst algorithm [301] for Matlab environment with a main emphasis to give out the data on eye movement rather than the pupil size. However as seen in Figure 42, the pupil contour is detected enabling the extraction of pupil size data after a slight modification of the Matlab algorithm. The modification of the algorithm is not within the scope of this work as it would require further knowledge of digital image processing.

Dosimeter design and simulation 56
4.2 DOSIMETER
The dosimeter design can be based either low-cost photodiodes or high-cost spectroradiometers. The authors with Daysimeter [379] had chosen the photodiode approach which allows cheap production of many dosimeters to be used in field experiments. Given that in laboratory studies it seems better to use Ganzfeld dome or Goldman perimeter based study settings [149,225] with the retinal light exposure known, the spectroradiometer-based light dosimeter do not appear very appealing. 4.2.1 Photodiode-based dosimeter
The design by Bierman et al. [379] of Daysimeter can be chosen as the basis for the design of improved dosimeter or the dosimeter part of a larger measurement system incorporating also pupil size and eye tracking measurements. The authors [379] themselves did not provide a cost estimate for the Daysimeter, but this can be done by using the internet as components were given, and the estimated cost is given in Table 12 for main components. It can be seen that the “circadian photodiode” is clearly the most expensive component. Table 12. Estimate of the cost of Daysimeter excluding passive components (like resistors and capacitances), cables and circuit board.
Item Price € Refs Hamamatsu S1223-01 (“photopic photodiode”) 8,33 [403]
Hamamatsu G1962 GaP (“circadian photodiode”) 46,67 [386]
Texas Instruments OPA2349 op amp (x2) 0.62 /1000pcs [404]
Texas Instruments MSP430 microcontroller 3.75-10.35 /1000pcs [405]
Atmel EEProm flash memory unit, e.g. AT29C020-90PI 5.00 [406]
4-channel CMOS analogue multiplexer, e.g. MAX4694 1.02 /1000pcs [407]
1,2 V voltage reference, e.g. TI TL431CLP 0.45 [408]
3,3 V voltage regulator, e.g. AS1351 1.10 [409]
> 3.5 V battery, e.g. GP17R8H NiMH 9V 170mAh 7.40 [410]
Analog Devices ADXL311 accelerometer 3.35 /1000pcs [411]
Opal diffuser (x2), e.g. RPC Photonics HiLAM 6.90 [412,413]
Photopic filter for S1223-01, e.g. UGQ (Ø=12,5mm) 58.00* [414]
Schott Glass GG 19 UV-filter (Ø=25,4mm) 17.30 [387]
Roscolux #08, Pale Gold (50 x 60 cm sheet) 4.45 [388,415]
= 113.86 € + 58.00* € * In reality the used photopic filter was more likely cheaper than the 58.00€ listed as an example Authors [379] had used unspecified opal diffusers in front of the photodiodes to transform to photodiode response to Lambertian (Figure 68) even though this is not very likely the case with circadian responses as seen in chapter 2.4.2. It would seem more accurate to use opal diffuser with a selective transmissivity according to the results obtained from melatonin suppression studies. However, this is slightly complicated as the studies have been done comparing only four different retina regions (upper-temporal, upper-nasal, lower-temporal, lower-nasal) to full retinal exposure meaning that a diffuser with specific transmissivity gradient could not be manufactured. In theory if the melanopsin-containing cell distribution in the retina was known with supporting melatonin suppression data, a custom neural density filter could be placed between photodiode and opal diffuser. The losses in the optical system (diffuser and filters) should be naturally taken account into when determining the actual retinal light exposure.

Dosimeter design and simulation 57
When measuring low light levels, the noise and thus the low signal-to-noise ration (SNR) can become a limiting factor in accurate measurements. Figure 74A [416] shows the circuit for the photodiode and operational amplifier (op amp) system along with the equivalent circuit modeling the noise sources in Figure 74B [416].
Photodiode’s shot noise Isn is given by:
( ) ( )BIPRq2BIIq2I ddpsn +=+= λ (13)
Where, Isn is photodiode’s shot noise [A] q is charge of an electron, 1.6×10⁻¹⁹ C Ip is photocurrent [A] Id is dark current [A] B is noise bandwidth [Hz] P is light intensity [W] Rλ is photosensitivity [A/W]
Johnson noise Ijn of the photodiode’s shunt resistance is given by:
sh
Bjn R
TBk4I = (14)
Where, Ijn is shunt resistance’s Johnson noise [A] kB is Boltzman constant, 1.38×10⁻²³ J/K T is temperature [K] Rsh is shunt resistance [Ω]
Johnson noise If of the feedback (gain) resistance is given by:
f
Bf R
TBk4I = (15)
Where, If is feedback resistance’s Johnson noise [A] Rf is feedback resistance [Ω]
(B) (A)
Figure 74. (A) Simple circuit of the photodiode-based light measurement [416]. (B) Equivalent circuit to (A) with the noise sources modeled as current and voltage sources [416].

Dosimeter design and simulation 58
Noise current In of the op amp is given by:
BiI nn ×= (16)
Where, In is noise current [A] in is noise current density given by the manufacturer [A/Hz½]
Noise current In,e from en of op amp is given by:
BRR
RReBiI
fsh
fshne,ne,n
+×=×= (17)
Where, In,e is noise current from en [A] in,e is noise current density from en [A/Hz½] en is input voltage noise density given by the manufacturer [V/Hz½]
As every noise current source is independent from each other, the total noise current can be given as a square of sum.
2e,n
2n
2f
2jn
2tot,n IIIIII sn ++++= (18)
Where, In,tot is total noise current [A]
The signal-to-noise ratio is then the logarithm of the relation of measured light intensity and total noise current:
++++
×=
= λ
2e,n
2n
2f
2jn
2tot,n
p
IIIII
RPlog20
I
Ilog20SNR
sn
(19)
Where, SNR is signal-to-noise ratio [dB]
The value of feedback (gain) resistance depends on the measured or maximum photocurrent and the maximum output voltage that is wanted from the circuit:
λ
==RP
V
I
VR
max
max
max,p
maxf (20)
Where, Vmax is maximum output voltage [V] Ip,max is maximum photocurrent [A] Pmax is maximum light intensity [W]
Table 13 shows the typical values for noise (current and voltage) components among some low-cost and low-noise op amps. It depends on the application whether current or voltage noise is more important parameter when choosing an op amp. Table 13. Operational amplifiers comparison.
Op amp in [pA/Hz½] en [nV/Hz½] Price € Refs LT1028 4,7 1 20.20 /1pcs [417] [418] OP07 0,32 10 0.46-1.27 /1000pcs [419] [420] OP27 1,7 3,5 0.75-24.16 /1000pcs [421] [422] OP497 0,02 17 2.87-4.61 /1000pcs [423] [424] OPA2349 (Daysimeter) 0,004 300 0.62 /1000pcs [425] [389]

Dosimeter design and simulation 59
Table 13 shows the technical specifications needed for noise calculation of some photodiodes. Hamamatsu S7686 (Figure 76) and OSI Optoelectronics PIN-10AP are directly suitable for photopic measurements as their response is according to V(λ). Hamamatsu G6262 was chosen as a cheaper alternative for Hamamatsu G1962 with relatively similar spectral response (Figure 75) to the proposed spectral sensitivity for melatonin suppression (Figure 24) by Rea et al. [133]. It naturally needs to be corrected using off-to-shelf optical filters in a similar manner as the authors [379] with Daysimeter had done. Table 14. Photodiode comparison [379].
Photodiode Id [pA] Rsh [MΩ]
Rλ(550nm) [A/W]
Rλ(480nm) [A/W]
Price € Refs
Hamamatsu G1962 (Daysi.)+ 2,5 40 0 0,05 46,67 [386] Hamamatsu G6262 50 80 0,02 0,18 15,00 [426]
Hamamatsu S1223-01 (Daysi.)* 200 ? 0,35 0,27 8,33 [403] Hamamatsu S1337-1010BQ 200 200 0,3 0,24 85,33 [427] Hamamatsu S7686 2 ? 0,38 0,05 16,67 [428] OSI Optoelectronics PIN-10AP ? 20 0,27 ? ? [429]
* Photopic photodiode, + “circadian” photodiode in Daysimeter
Using the equation 19, the signal-to noise ratio (SNR) can be simulated easily for example with MS Excel. The used 6 different feedback (gain) resistors have the same values of 108, 107, 106, 105 and 104
Ω as with Daysimeter. The resistor switching as a function of light intensity is determined by using the equation 20. Temperature T is chosen to be a constant 298 K and noise bandwidth B as 10 Hz. Figure 78 shows the results of the SNR simulation for different photodiodes when using OPA2349 op amp. It can be seen that the differences between different photodiodes is minimal in regard to noise performance and the linearity in regard to physiological spectral response seems to be more important parameter which is not simulated here. Figure 77 shows the similar SNR simulation comparing the different op amps when using Hamamatsu S7686 photodiode. Significant differences in low light levels
Figure 76. Spectral response of Hamamatsu S7686 silicon photodiode. Spectral response similar to human sensitivity, high-speed response, For illuminator, luminance meter [428].
Figure 75. Spectral response of Hamamatsu G6262 GaAsP photodiode accompanied by G7169 and G5645 which both share similar spectral characteristics [426].

Dosimeter design and simulation 60
can be seen with OP497 and OPA2349 providing the best SNR as their noise current density is the lowest in compared op amps. The significance of voltage current density would be larger if smaller feedback (gain) resistors were used in low light levels.
Figure 78. SNR simulation of different photodiodes as a function of light intensity when using OPA2349 op amp.
Photodiode SNR Comparison With 6 fixed feedback (gain) resistors
-30,00
0,00
30,00
60,00
90,00
120,00
150,00
180,00
210,00
240,00
1,0E-12 1,0E-10 1,0E-08 1,0E-06 1,0E-04 1,0E-02 1,0E+00 1,0E+02
Light intensity [W]
SN
R [
dB
]
S1223-01
S1337-1010BQ
S7686
PIN-10AP
G6262
G1962
Figure 77. SNR simulation of different op amps as a function of light intensity when using S7686 photodiode.
OpAmp Comparison Practical situation w ith 6 fixed feedback (gain) resistors while using S7686 photodiode
-90,00
-60,00
-30,00
0,00
30,00
60,00
90,00
120,00
150,00
180,00
210,00
240,00
1,0E-12 1,0E-10 1,0E-08 1,0E-06 1,0E-04 1,0E-02 1,0E+00 1,0E+02
Light intensity [W]
SN
R [
dB
]
LT1028
OP07
OP27
OP497
OPA2349

Dosimeter design and simulation 61
Table 15 shows a new cost estimate for the light dosimeter after slight modification. The change from Hamamatsu S1223-01 to Hamamatsu S7686 eliminated the need for a separate photopic filter as the S7686 has a V(λ) responsivity. The change in “circadian photodiode” from G1962 to G6262 cut the costs with about 30€, and it would be possible to cut costs even further if chosen a photodiode with a responsivity only between 400-600nm as no UV-filter would be needed. In the Hamamatsu product range there are e.g. G1735 [430] GaAsP photodiode with a spectral responsivity between 400-760 nm (λmax=710nm). However, the shape of spectral response curve differs largely from the proposed spectral sensitivity curve so that G1735 would most likely require a custom filter to produce similar spectral response and that would increase the costs but could produce more accurate response. It can be seen that the optical components and photodiodes are the most expensive components in the light dosimeter and no other major savings can be achieved. The cost of prototype dosimeter naturally can be dropped by asking samples from the manufacturers when doing designing the actual dosimeter as a project work, Bachelor’s thesis or some such. Table 15. Cost estimate of the modified Daysimeter. * Estimate of the needed “correction filter” to create the notch around 500nm
Item Price € Refs Hamamatsu S7686 (“photopic photodiode” with V(λ) responsivity) 16.67 [428]
Hamamatsu G6262 (“circadian photodiode”) 15.00 [426]
Texas Instruments OPA2349 op amp (x2) 0.62 /1000pcs [404]
Texas Instruments MSP430 microcontroller 3.75-10.35 /1000pcs [405]
Atmel EEProm flash memory unit, e.g. AT29C020-90PI 5.00 [406]
4-channel CMOS analogue multiplexer, e.g. MAX4694 1.02 /1000pcs [407]
1,2 V voltage reference, e.g. TI TL431CLP 0.45 [408]
3,3 V voltage regulator, e.g. AS1351 1.10 [409]
> 3.5 V battery, e.g. GP17R8H NiMH 9V 170mAh 7.40 [410]
Analog Devices ADXL311 accelerometer 3.35 /1000pcs [411]
Opal diffuser (x2) 6.90 [412,413]
Schott Glass GG 19 UV-filter (Ø=25,4mm) 17.30 [387]
Roscolux #08, Pale Gold (50 x 60 cm sheet)* 4.45 [388,415]
≈ 83.63 €
4.2.2 Spectroradiometer-based
The more expensive and more flexible alternative to photodiode-based dosimeter is a spectroradiometer-based dosimeter. The benefit of a spectroradiometer is the recording of raw spectral radiation which can be freely weighed mathematically using a computer after the actual measurement in contrast to photodiode-based system where the weighing is done with an optical filter in front of a photodiode. This naturally provides greater flexibility as there is no final certainty about the action spectrum of non-image forming (NIF) responses and it could even be that the spectral dependency is different for alertness promotion and melatonin suppression [140]. However, given the high cost (> 790€) of a spectroradiometer, only some commercial options are shortly reviewed and left unsimulated for noise and overall performance. It should be noticed that even though that the compact spectroradiometers are relatively large, they could be simply be mounted to a waist bag or back bag and use optical fiber as the primary detector mounted on safety glasses for example enabling very light-weight design.
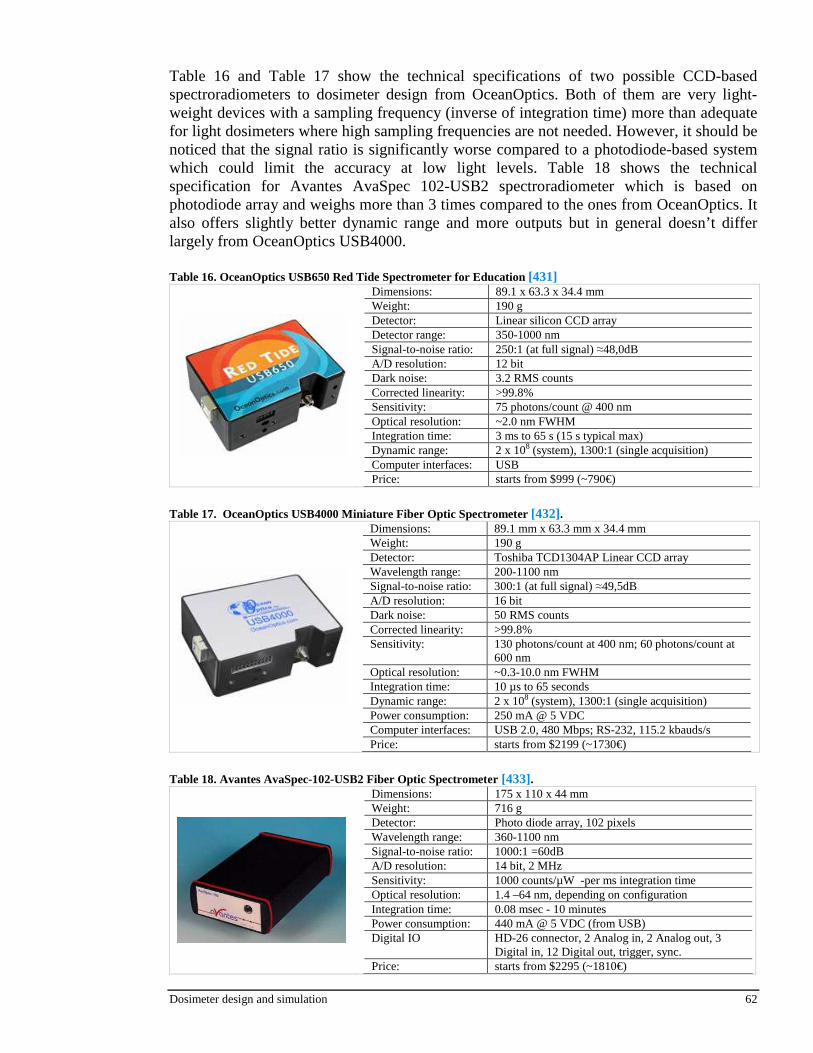
Dosimeter design and simulation 62
Table 16 and Table 17 show the technical specifications of two possible CCD-based spectroradiometers to dosimeter design from OceanOptics. Both of them are very light-weight devices with a sampling frequency (inverse of integration time) more than adequate for light dosimeters where high sampling frequencies are not needed. However, it should be noticed that the signal ratio is significantly worse compared to a photodiode-based system which could limit the accuracy at low light levels. Table 18 shows the technical specification for Avantes AvaSpec 102-USB2 spectroradiometer which is based on photodiode array and weighs more than 3 times compared to the ones from OceanOptics. It also offers slightly better dynamic range and more outputs but in general doesn’t differ largely from OceanOptics USB4000. Table 16. OceanOptics USB650 Red Tide Spectrometer for Education [431]
Dimensions: 89.1 x 63.3 x 34.4 mm Weight: 190 g Detector: Linear silicon CCD array Detector range: 350-1000 nm Signal-to-noise ratio: 250:1 (at full signal) ≈48,0dB A/D resolution: 12 bit Dark noise: 3.2 RMS counts Corrected linearity: >99.8% Sensitivity: 75 photons/count @ 400 nm Optical resolution: ~2.0 nm FWHM Integration time: 3 ms to 65 s (15 s typical max) Dynamic range: 2 x 10⁸ (system), 1300:1 (single acquisition) Computer interfaces: USB Price: starts from $999 (~790€)
Table 17. OceanOptics USB4000 Miniature Fiber Optic Spectrometer [432].
Dimensions: 89.1 mm x 63.3 mm x 34.4 mm Weight: 190 g Detector: Toshiba TCD1304AP Linear CCD array Wavelength range: 200-1100 nm Signal-to-noise ratio: 300:1 (at full signal) ≈49,5dB A/D resolution: 16 bit Dark noise: 50 RMS counts Corrected linearity: >99.8% Sensitivity: 130 photons/count at 400 nm; 60 photons/count at
600 nm Optical resolution: ~0.3-10.0 nm FWHM Integration time: 10 µs to 65 seconds Dynamic range: 2 x 10⁸ (system), 1300:1 (single acquisition) Power consumption: 250 mA @ 5 VDC Computer interfaces: USB 2.0, 480 Mbps; RS-232, 115.2 kbauds/s Price: starts from $2199 (~1730€)
Table 18. Avantes AvaSpec-102-USB2 Fiber Optic Spectrometer [433].
Dimensions: 175 x 110 x 44 mm Weight: 716 g Detector: Photo diode array, 102 pixels Wavelength range: 360-1100 nm Signal-to-noise ratio: 1000:1 =60dB A/D resolution: 14 bit, 2 MHz Sensitivity: 1000 counts/µW -per ms integration time Optical resolution: 1.4 –64 nm, depending on configuration Integration time: 0.08 msec - 10 minutes Power consumption: 440 mA @ 5 VDC (from USB) Digital IO HD-26 connector, 2 Analog in, 2 Analog out, 3
Digital in, 12 Digital out, trigger, sync. Price: starts from $2295 (~1810€)

Conclusions 63
5. CONCLUSIONS
In this work, the technology available for circadian photometric field measurements was reviewed. The complete system needed for the proper quantification of “circadian” light exposure consisted of a light dosimeter, pupil size measurement with a video camera, eyetracker video camera. In addition to these a luminancephotometer or a digital camera was needed for the measurement of the ambient light distribution for example in office environments. The field measurement device is important to be as cheap as possible while still allowing adequate measurement accuracy. Given that many field measurements can be done without eye tracking function, the scene camera recording the task area can be removed from the very low-cost design. In device’s basic version, the pupil size measurement could also be removed to further cut costs. However, this would limit significantly the usefulness of the device when measuring simultaneously physiological markers such as melatonin suppression as the effective retinal illuminance affecting melatonin levels depends on the pupil size [136]. In theory, the eye camera recording the pupil size could be used to record photophobic behavior (such as squinting) with proper algorithms as for example can further reduce the retinal illuminance by one log unit compared to the value received from pupil size measurement [136]. However, according to current knowledge of the author, this type of algorithm does not exist as yet and it should be further developed for example using the Starburst algorithm by Li et al. [301] as a basis for the development. The measurement of photophobic behavior would also help to design optimal lighting for example for alertness-promoting purposes. It does not seem beneficial to increase the vertical illuminance if it at the same time increases photophobic behavior, thus reducing the effective retinal illuminance as implied by the results by Figueiro et al. [136]. The difficulty in converting facial illuminance to retinal illuminance [376] also complicates the accurate measurement of retinal illuminance as retinal illuminance depends on the distance and the size of the light source (Figure 10). Given the uncertainty of the measurement of retinal illuminance, the proposed light dosimeter is poorly suitable for accurate laboratory studies measuring the physiological responses of light exposure. However, the cheap light dosimeter can be used for relatively accurate estimation of the light exposure experienced for example by a normal office worker. The conversion error when converting facial illumination to retinal illumination can be reduced by measuring the “circadian” ambient light distribution in workplace and using an eyetracker allowing fairly accurate estimation of the size of the light source in the visual field. Also the poor control of environmental variables (e.g. temperature, noise, food, sleep) in field studies makes practically impossible to study accurately the possible biological effects of light with the light dosimeter. Normally constant routine (CR) procedure [434,435] is used in circadian experiments to eliminate all periodic changes in behavior, in addition to maintaining a constant environment. The large amount of these interfering factors in field studies (such as office work simulation) can distort or hide light-induced (or other measured variables) effects, and are called masking factors. Another large shortcoming of the proposed measurement device is the action spectrum for non-image forming (NIF) effects of light used in the design. There is yet no consensus on the actual action spectrum for NIF effects as the involvement of different photoreceptors is not known [133], and it seems possible that light-induced alertness has a different action spectrum than melatonin suppression for example [140]. Given that the proposed light dosimeter uses fixed filters to correct the sensitivity of the photodiode according to proposed action spectrum, it cannot simultaneously quantify both alertness-promoting
Conclusions 64
effects of light and melatonin suppression. One possible solution for this problem would to incorporate a third photodiode to measure the light exposure being the most effective in promoting alertness (λmax=480 nm [140]), and to measure the light affecting melatonin suppression with the other “circadian” photodiode. More sophisticated method to correct this problem would be to use a portable spectroradiometer, but given the relatively high cost (minimum of ~800€) this possibility does not go along with the low-cost approach. However, the use of spectroradiometer would allow the measurement of raw spectral radiation which could be then mathematically weighed for photopic and various NIF effects, with the possibility to change the weighing curves as more knowledge is gained on the action spectra of NIF functions. In conclusion, the measurement device design reviewed in this work is best suitable for circadian field photometric measurements for rough estimates of the experienced light exposure. The approximative cost for the light dosimeter without pupil size recording is around 85€ and with the pupil size recording capability around 360€ using the cheapest components available while still maintaining adequate measurement accuracy. The added pupil size recording capability (possibly with the measurement of photophobic behavior) significantly improves the versatility of light dosimeter compared to the Daysimeter concept proposed by Bierman et al. [379]. Due to possible inaccuracy in measuring effective retinal irradiance, the proposed system can not be used in laboratory studies examining for example the action spectrum of physiological responses (melatonin suppression, phase shifting, pupillary light response or light-induced alertness). In laboratory studies, better approach is to use either Ganzfeld dome or Goldman perimeter which allows more accurate measurement of effective retinal illuminance as well as the spectral power distribution (SPD) [149,225].

References 65
6. REFERENCES
1 Berson, DM, Dunn FA, Takao M. 2002. Phototransduction by retinal ganglion cells that set the circadian clock.
Science 295:10.
2 Dacey DM, Liao HW, Peterson BB, Robinson FR, Smith VC, Pokorny J, Yau KW, Gamlin PD. 2005. Melanopsin-expressing ganglion cells in primate retina signal colour and irradiance and project to the LGN. Nature 433:749-754.
3 Gooley JJ, Lu J, Fischer D, Saper CB. 2003. A broad role for melanopsin in nonvisual photoreception. J Neurosci. 23(18):7093-7106.
4 Duffy JF, Wright KP Jr. 2005. Entrainment of the human circadian system by light. J Biol Rhythms. 20(4):326-338.
5 Pauley SM. 2004. Lighting for the Human Circadian Clock. Recent research indicates that lighting has become a public health issue. Online article. Available from: http://www.darkskysociety.org/handouts/pauley.pdf [August 18 2006].
6 Teikari P. 2006. Biological effects of light. Master’s thesis. Helsinki University of Technology, Lighting Laboratory.
7 Glass L, Mackey MC. 1988. From clocks to chaos: The rhythms of life. Princeton, NJ: Princeton University Press.
8 Moore-Ede MC, Sulzman FM, Fuller CA. 1982. The clocks that time us. Cambridge, MA: Harvard University Press.
9 Moser M, Fruhwirth M, Penter R, Winker R. 2006. Why life oscillates--from a topographical towards a functional chronobiology. Cancer Causes Control. 2006 17(4):591-599.
10 Dawson KA. 2004. Temporal organization of the brain: Neurocognitive mechanisms and clinical implications. Brain Cogn. 54(1):75-94.
11 Mistlberger RE, Skene DJ. 2005. Nonphotic entrainment in humans? J Biol Rhythms. 20(4):339-352.
12 Reiter RJ. 1980. Photoperiod: its importance as an impeller of pineal and seasonal reproductive rhythms [Abstract]. Int J Biometeorol. 24(1):57-63.
13 de Mairan JJD. 1729. Observation botanique. Histoire de l’Académie Royale des Sciences. Pp. 35-36.
14 Rosbash M, Takahashi JS. Clockwork genes, Discoveries in biological time. Teacher's guide. Howard Hughes Medical Institute. Available from: http://www.hhmi.org/biointeractive/clocks/clockwork.pdf [2006 April 11].
15 Aschoff J, Wever R. 1962. Spontanperiodik des Menschen bei Ausschluss aller Zeitgeber. Die Naturwissenshaften 49:337-342.
16 Nyholm H. 1955. Zur Ökologie von Myotis mystacinus (Leisl.) und M. daubentoni (Leisl.). Ann.Zool.Fenn. 2:77–123.
17 Daan S. 1981. Adaptive strategies in behavior. In: J. Aschoff, Editor, Biological Rhythms. Handbook of Behavioral Neurobiology 4, Plenum, pp. 275–298.
18 Gierse A. 1842. Quaeniam sit ratio caloris organici, M. D. Thesis, Halle.
19 Aschoff J. 1982. The circadian rhythm of body temperature as a function of body size. In: Taylor R, Johanson K, Bolis L (eds) A comparison for animal physiology. Cambridge University Press, Cambridge, pp. 173–189.
20 Aschoff J, Heise A. 1972. Thermal conductance in man: its dependence on time of day and on ambient temperature. In: Itoh S,Ogata K,Yoshimura H (eds) Advances in Climatic physiology. Igako Shoin, Tokyo, pp. 334–348.
21 Kräuchi K, Cajochen C, Wirz-Justice A. 2005. Thermophysiologic aspects of the three-process-model of sleepiness regulation. Clin Sports Med. 24(2):287-300.
22 Kleitman N. 1987. Sleep and wakefulness. The University of Chicago Press, Chicago, USA.
23 Anon. Harvard Apparatus. Thermometers and Probes. YSI 400 Series Thermistor Probes. Online catalog. Available from: https://www.harvardapparatus.com/wcsstore/ConsumerDirect/images/site/hai/techdocs/BS4_D_28.pdf [2006 June 29].
24 Claustrat B, Brun J, Chazot G. 2005. The basic physiology and pathophysiology of melatonin. Sleep Med Rev 9:11–24.
25 Sancar A. 2000. Cryptochrome: the second photoactive pigment in the eye and its role in circadian photoreception. Annu. Rev. Biochem. 69:31–67.
26 Ekmekcioglu C. 2006. Melatonin receptors in humans: biological role and clinical relevance. Biomedicine & Pharmacotherapy 60:97-108.
27 Stevens RG, Rea MS. 2001. Light in the built environment: potential role of circadian disruption in endocrine disruption and breast cancer. Cancer Causes Control 12:279–287.

References 66
28 Pukkala E, Ojamo M, Rudanko SL, Stevens RG, Verkasalo PK. 2006. Does incidence of breast cancer and prostate
cancer decrease with increasing degree of visual impairment. Cancer Causes Control 17:573-576.
29 Jasser SA, Blask DE, Brainard GC. 2006. Light during darkness and cancer: relationships in circadian photoreception and tumor biology. Cancer Causes Control 17(4):515-523.
30 Bullough JD, Rea MS, Figueiro MG. 2006. Of mice and women: Light as a circadian stimulus in breast cancer research. Cancer Causes and Control 17(4):375-383.
31 Wyatt JK, Ritz-De Cecco A, Czeisler CA, Dijk D-J. 1999. Circadian temperature and melatonin rhythms, sleep, and neurobehavioral function in humans living on a 20-h day. Am J Phjysiol Regul Integr Comp Physiol 277:R1152-1163.
32 Revell VL, Arendt J, Terman M, Skene DJ. 2005. Short-wavelength sensitivity of the human circadian system to phase-advancing light. J Biol Rhythms. 20(3):270-272.
33 Benloucif S, Guico MJ, Reid KJ, Wolfe LF, L’Hermite-Balériaux M. Zee PC. 2005. Stability of melatonin and temperature as circadian phase markers and their relation to sleep times in humans. Journal of Biological Rhythms 20(2):178-188.
34 Chrousos GP, Gold PW. 1998. A Healthy Body in a Healthy Mind—and Vice—The Damaging Power of Uncontrollable Stress. The Journal of Clinical Endocrinology & Metabolism 83(6):1842-1845.
35 Allan S, Czeisler CA. 1994. Persistence of the Circadian Thyrotropin Rhythm under Constant Conditions and after Light-induced Shifts of Circadian Phase. Journal of Clinical Endocrinology and Metabolism. 79(2):508-512.
36 Sanchez de La Pena S. 1993. The feed-sideward of cephalo-adrenal immune interactions. Chronobiologia 20:1-52.
37 Hofman MA, Swaab DF. 1995. Influence of Aging on the Seasonal Rhythm of the Vasopressin-Expressing Neurons in the Human Suprachiasmatic Nucleus. Neurobiology of Agin 16(6):965-971.
38 Pettorborg LJ, Thalen B-E, Kjellman BF, Wetterberg L. 1989. Effect of melatonin replacement on hormone patterns in a patient lacking endogenous melatonin. Proc 71st Meeting of the Endocrine Soc. 392.
39 Purves D, Fitzpatrick D, Augustine GJ, Katz LC, Lawrence C, LaMantia AS, McNamara JO, Mark WS. 2001. Neuroscience. 2nd edition. Sunderland. Sinauer Associates, Inc.
40 Moore RY, Lenn NJ. 1972. A retinohypothalamic projection in the rat. J. Comp. Neurol. 146:1–14.
41 Stephan FK, Zucker I. 1972. Circadian rhythms in drinking behavior and locomotor activity of rats are eliminated by hypothalamic lesions. Proc. Natl. Acad. Sci. U. S. A. 69:1583–1586.
42 Reppert SM, Weaver DR. 2002. Coordination of circadian timing in mammals. Nature 418:935–941.
43 Czeisler CA, Duffy JF, Shanahan TL, Brown EN, Mitchell JF, Rimmer DW, Ronda JM, Silva EJ, Allan JS, Emens JS, Dijk DJ, Kronauer RE. 1999. Stability, precision, and near-24-hour period of the human circadian pacemaker. Science. 284(5423):2177-2181.
44 Ralph MR, Foster RG, Davis FC, Menaker M. 1990. Transplanted suprachiasmatic nucleus determines circadian period. Science 247:975–978.
45 Moore RY. 1996. Entrainment pathways and the functional organization of the circadian system. Prog. Brain Res. 111:103–119.
46 Moore RY, Speh JC, Leak RK. 2002. Suprachiasmatic nucleus organization. Cell Tissue Res. 309:89–98.
47 Morin LP, Allen CN. 2005. The circadian visual system, 2005. Brain Research Reviews 51(1):1-60.
48 Hamada T, Antle MC, Silver R. 2004. Temporal and spatial expression patterns of canonical clock genes and clock-controlled genes in the suprachiasmatic nucleus. Eur. J. Neurosci. 19:1741–1748.
49 Hamada T, LeSauter J, Venuti JM, Silver R. 2001. Expression of Period genes: rhythmic and nonrhythmic compartments of the suprachiasmatic nucleus pacemaker. J. Neurosci. 21:7742–7750.
50 Bryant DN, LeSauter J, Silver R, Romero MT. 2000. Retinal innervation of calbindin-D28K cells in the hamster suprachiasmatic nucleus: ultrastructural characterization. J. Biol. Rhythms 15:103–111.
51 Silver R, Romero MT, Besmer HR, Leak R, Nunez JM, LeSauter J. 1996. Calbindin-D28K cells in the hamster SCN express light-induced Fos. NeuroReport 7:1224–1228.
52 Romijn HJ, Sluiter AA, Pool CW, Wortel J, Buijs RM. 1996. Differences in colocalization between Fos and PHI, GRP, VIP and VP in neurons of the rat suprachiasmatic nucleus after a light stimulus during the phase delay versus the phase advance period of the night. J. Comp. Neurol. 372:1–8.
53 Yan L, Silver R. 2002. Differential induction and localization of mPer1 and mPer2 during advancing and delaying phase shifts. Eur. J. Neurosci. 16:1531–1540.
54 Meijer JH, Rusak B, Ganshirt G. 1992. The relation between light-induced discharge in the suprachiasmatic nucleus and phase shifts of hamster circadian rhythms. Brain Res. 598:257–263.
55 Hamada T, LeSauter J, Lokshin M, Romero MT, Yan L, Venuti JM, Silver R. 2003. Calbindin influences response to photic input in suprachiasmatic nucleus. J. Neurosci. 23:8820-8826.

References 67
56 Strogatz SH. 2001. Exploring complex networks. Nature. 410(6825):268-276.
57 Aton SJ, Herzog ED. 2005. Come together, right...now: synchronization of rhythms in a mammalian circadian clock. Neuron. 48(4):531-534.
58 Leise T, Siegelmann H. 2006. Dynamics of a Multistage Circadian System. Journal of Biological Rhythms 21(4):314-323.
59 Vrang N, Larsen PJ, Mikkelsen JD. 1995. Direct projection from the suprachiasmatic nucleus to hypophysiotrophic corticotropin-releasing factor immunoreactive cells in the paraventricular nucleus of the hypothalamus demonstrated by means of Phaseolus vulgaris-leucoagglutinin tract tracing. Brain Res. 684:61–69.
60 Saper CB, Lu J, Chou TC, Goolet J. 2005. The hypothalamic integrator for circadian rhythms. Trends Neurosci. 28:152-157.
61 Kolb H, Fernandez E, Nelson R.. Webvision. Gross Anatomy of the Eye. Online article. Available from: http://webvision.med.utah.edu/anatomy.html [2006 June 04]
62 Kolb H, Fernandez E, Nelson R. Webvision: Simple Anatomy of the Retina. Available from: http://webvision.med.utah.edu/sretina.html [2006 April 9].
63 Stockman A, Sharpe LT. 2000. Spectral sensitivities of the middle- and long-wavelength-sensitive cones derived from measurements of observers of known genotype. Vision Res. 40:1711-1737. The photopic sensitivity data, together with the standard CIE scotopic data, can be downloaded at http://cvision.ucsd.edu/.
64 Kokoschka S. 1997. Das V(λ)- Dilemma in der Photometrie. Proceedings of 3. Internationales Forum fur den lichttechnischen Nachswuchs, TU Ilmenau, Ilmenau.
65 Eloholma M, Ketomäki J, Halonen L. 2004. Luminances and visibility in road lighting - conditions, measurements and analysis. Report 30. Helsinki University of Technology, Lighting Laboratory. 27 p.
66 Kolb H. 2003. How the Retina works. Online article. Available from: http://webvision.med.utah.edu/2003-01Kolb.pdf#How%20the%20Retina%20Works [April 21 2006].
67 Foster RG. 2002. Keeping an eye on the time: the Cogan Lecture. Invest. Ophthalmol. Vis. Sci. 43:1286–1298.
68 Ebihara S, Tsuji K. 1980 Entrainment of the circadian activity rhythm to the light cycle: effective light intensity for a Zeitgeber in the retinal degenerate C3H mouse and the normal C57BL mouse. Physiol. Behav. 24:523–527.
69 Foster RG, Provencio I, Hudson D, Fiske S, De Grip W, Menaker M. 1991. Circadian photoreception in the retinally degenerate mouse (rd/rd). J. Comp. Physiol. [A] 169:39–50.
70 Foster RG. 1998. Shedding light on the biological clock. Neuron 20:829–832.
71 Klerman EB, Shanhan TL, Brotman DJ, Rimmer DW, Emens JS, Rizzo JF 3rd, Czeisler CA. 2002. Photic resetting of the human circadian pacemaker in the absence of conscious vision. J. Biol. Rhythms 17:548–555.
72 Czeisler CA, Shanahan TL, Kleirman EB, Martens H, Brotman DJ, Emens JS, Klein T, Rizzo JF 3rd. 1995. Suppression of melatonin secretion in some blind patients by exposure to bright light. N. Engl. J. Med. 332:6–11.
73 Lockley SW, Skene DJ, Arendt J, Tabandeh AC, Bird AC, Defrance R. 1997. Relationship between melatonin rhythms and visual loss in the blind. J. Clin. Endocrinol. Metab. 82:3763–3770.
74 Nelson RJ, Zucker I. 1981. Absence of extra-ocular photoreception in diurnal and nocturnal rodents exposed to direct sunlight. Comp. Biochem. Physiol. A 69:145–148.
75 Yamazaki S, Goto M, Menaker M. 1999. No evidence for extraocular photoreceptors in the circadian system of the Syrian hamster. J. Biol. Rhythms 14:197–201.
76 Campbell SS, Murphy PJ. 1998. Extraocular circadian phototransduction in humans. Science 279:396–399.
77 Wright KP Jr, Czeisler CA. 2002. Absence of circadian phase resetting in response to bright light behind the knees. Science. 297(5581):571.
78 Rüger M, Gordijn MC, Beersma DG, de Vries B, Daan S. 2003. Acute and phase-shifting effects of ocular and extraocular light in human circadian physiology. J Biol Rhythms 18:409-419.
79 Provencio I, Rodriguez IR, Jiang G, Hayes WP, Moreira RF, Rollag MD. 2000. A novel human opsin in the inner retina. J. Neurosci. 20:600–605.
80 Provencio I, Jiang Gm De Grip WJ, Hayes WP, Rollag MD. 1998. Melanopsin: An opsin in melanophores, brain, and eye. Proc. Natl. Acad. Sci. U. S. A. 95:340–345.
81 Qiu X, Kumbalasin T, Carlson SM, Wong KY, Krishna V, Provencio I, Berson DM. 2005. Induction of photosensitivity by heterologous expression of melanopsin. Nature 433(7027):745-749.
82 Panda S, Nayak SK, Campo B, Walker JR, Hogenesch JB, Jegla T. 2005. Illumination of the melanopsin signaling pathway. Science 28(5709):600-604.
83 Melyan Z, Tarttelin EE, Bellingham J, Lucas RJ, Hankins MW. 2005. Addition of human melanopsin renders mammalian cells photoresponsive. Nature 433:741-745.

References 68
84 Newman LA, Walker MT, Brown RL, Cronin TW, Robinson PR. 2003. Melanopsin forms a functional short-
wavelength photopigment. Biochemistry. 42(44):12734-12738.
85 Brainard GC, Hanifin JP. 2006. Photons, clocks, and consciousness. Journal of Biological Rhythms 20(4):314-325.
86 Dkhissi-Benyahya O, Rieux C, Hut RA, Cooper HM. 2006. Immunohistochemical evidence of a Melanopsin Cone in Human Retina. Investigative Ophthalmology & Visual Science. 47(4):1636-1641.
87 Anon. 2005. Helsinki University of Technology (TKK). Illumination Engineering and Electric Installations. Lecture handouts. Not available online.
88 Malik J. 2004. University of California at Berkeley. Recognizing People, Objects and Actions Lecture : Human Visual System. Online article. Available from: http://www.cs.berkeley.edu/~malik/cs294/lecture2-RW.pdf [2006 August 10].
89 Jokela K. 2005. Helsinki University of Technology (TKK). Biological Effects and Measurements of Electromagnetic Fields and Optical Radiation–course. Lecture handouts. Not available online.
90 Henderson R, Schulmeister K. 2004. Laser safety. IoP-Publishing, 71 ,2004.
91 Weber M, Schulmeister K, Schernhammer E. 2004. Temporal and radiometrical aspects of light-induced melatonin suppression. CIE Symposium ’04 “Light and Health”, pp. 116-128.
92 Barker FM, Brainard GC. 1991. The Direct Spectral Transmittance of the Excised Human Lens as a Function of Age (FDA 785345 0090 RA), U.S. Food and Drug Administration, Washington, DC.
93 Weale RA. 1985. Human lenticular fluorescence and transmissivity, and their effects on vision. Exp. Eye Res. 41:457-473.
94 Verriest G. 1971. L’influence de l’age sur les fonctions visuelles de l’homme. Bull. Acad. Roy. Med. Belg. 11:527-577.
95 Brainard GC, Rollag MD, Hanifin JP. 1997. Photic regulation of melatonin in humans: ocular and neural signal transduction. J Biol Rhythms 12:537–546.
96 Schefrin BE, Werner JS. 1990. Loci of spectral unique hues throughout the life span. J Opt Soc Am A. 7(2):305-311.
97 Shinomori K. 2000. Senescent changes in color discrimination and color appearance. J. Light & Vis. Env. 24(2):40-44.
98 Mainster MA. 1986. The spectra, classification, and rationale of ultra-violet protective intraocular lenses. Am. J. Ophthalmol. 102:727-732.
99 Charman WN. 2003. Age, lens transmittance, and the possible effects of light on melatonin suppression. Ophthal. Physiol. Opt., 23(2):181-187.
100 Beems EM, Van Best JA. 1990. Light transmission of the cornea in whole human eyes. Exp Eye Res. 50(4):393-395.
101 Brindley GS, Gautier-Smith PC, Lewin W. 1969. Cortical blindness and the functions of non-geniculate fibres of the optic tracts. J.Neurol.Neurosurg.Psychiatr. 32:259-264.
102 Barbur JL. 2004. Learning from the pupil - studies of basic mechanisms and clinical applications. In The Visual Neurosciences, Eds. L.M. Chalupa and J.S. Werner, Cambridge, MA: MIT Press, Vol. 1, p641-656.
103 Purves D, Fitzpatrick D, Augustine GJ, Katz LC, Lawrence C, LaMantia AS, McNamara JO, Mark WS. 2001. Neuroscience. 2nd edition. Sunderland. Sinauer Associates, Inc.
104 Trejo LJ, Cicerone CM. 1982. Retinal sensitivity measured by the pupillary light reflex in RCS and albino rats. Vision Res. 22:1163–1171.
105 Alpern M, Campbell FW. 1962. The spectral sensitivity of the consensual light reflex. J. Physiol. 164:478–507.
106 Ohba N, Alpern M. 1972. Adaptation of the pupil light reflex. Vision Res. 12:953–967.
107 Keeler CE. 1927. Iris movements in blind mice. Am. J. Physiol. 81:107–112.
108 Kovalevsky G, DiLoreto D Jr, Wyatt J, del Cerro C, Cox C, del Cerro M. 1995. The intensity of the pupillary light reflex does not correlate with the number of retinal photoreceptor cells. Exp. Neurol. 133:43–49.
109 Whiteley SJO, Litchfield TM, Coffey PJ, Lund RD. 1996. Improvement of the pupillary light reflex of Royal College of Surgeons rats following RPE cell grafts. Exp. Neurol. 140:100–104.
110 Whiteley SJO, Sauve Y, Aviles-Trigueros M, Vidal-Sanz M, Lund RD. 1998. Extent and duration of recovered pupillary light reflex following retinal ganglion cell axon regeneration through peripheral nerve grafts directed to the pretectum in adult rats. Exp. Neurol. 154:560–572.
111 Lucas RJ, Douglas RH, Foster RG. 2001. Characterization of an ocular photopigment capable of driving pupillary constriction in mice. Nature Neuroscience. 4:621-626.

References 69
112 Kardon RH, Kirkali PA, Thompson HS. 1991. Automated pupil perimetry: Pupil field mapping in patients and
normal subjects. Ophthalmology 98:485-496.
113 Yarbus AL. 1967. Eye Movements and Vision. Basil Haigh (trans.). New York: Plenum Press.
114 Provencio I, Jiang Gm De Grip WJ, Hayes WP, Rollag MD. 1998. Melanopsin: An opsin in melanophores, brain, and eye. Proc. Natl. Acad. Sci. U. S. A. 95:340–345.
115 Brainard GC, Hanifin JP, Barker FM, Sanford B, Stetson MH. 2001. Influence of near ultraviolet radiation on reproductive and immunological development in juvenile male siberian hamsters. J Exp Biol 204:2535-2541.
116 Thapan K, Arendt J, Skene DJ. 2001. An action spectrum for melatonin suppression: evidence for a novel non-rod, non-cone photoreceptor system in humans. J. Physiol. 535(1):261–267.
117 Lucas RJ, Douglas RH, Foster RG. 2001. Characterization of an ocular photopigment capable of driving pupillary constriction in mice. Nature Neuroscience. 4:621-626.
118 Hankins MW, Lucas RJ. 2002. The primary visual pathway in humans is regulated according to long-term light exposure through the action of a nonclassical photopigment. Curr Biol. 12:191-198.
119 Hattar S, Lucas RJ, Mrosovsky N, Thompson S, Douglas RH, Hankins MW, Lem J, Biel M, Hofmann F, Foster RG. 2003. Melanopsin and rod-cone photoreceptive systems account for all major accessory visual functions in mice. Nature 424:76-81.
120 Provencio I, Foster RG. 1995. Circadian rhythms in mice can be regulated by photoreceptors with cone-like characteristics. Brain Res 694:183-190.
121 Takahashi JS, DeCOursey PJ, Bauman L, Menaker M. 1984. Spectral sensitivity of a novel photoreceptive system mediating entrainment of mammalian circadian rhythms. Nature 308:186-188.
122 Yoshimura T, Ebihara S. 1996. Spectral sensitivity of photoreceptors mediating phase-shifts of circadian rhythms in retinally degenerate CBA/J (rd/rd) and normal CBA/N (+/+) mice. J Comp Physiol [A] 178:797-802.
123 Takahashi JS, DeCOursey PJ, Bauman L, Menaker M. 1984. Spectral sensitivity of a novel photoreceptive system mediating entrainment of mammalian circadian rhythms. Nature 308:186-188.
124 Anon. Webvision. The Perception of Color. Online article. Available from: http://webvision.med.utah.edu/KallColor.html [2006 August 23].
125 Anon. 1978. CIE, Light as a true visual quantity; Principles of measurement, CIE Central bureau CIE 41.
126 Burns SA, Elsner AE, Pokorny J, Smith VC. 1984. The Abney effect: chromaticity coordinates of unique and other constant hues. Vision Res. 24(5):479-89.
127 Anon. 2003. Preface to processes in biological vision. Online article. Available from: http://www.4colorvision.com/files/preface.htm [2006 July 03].
128 Nayatani Y. 1997. Simple estimation methods for the Helmholtz - Kohlrausch effect. Col Res Appl. 22:385-401.
129 Guth SL, Massof RW, Benzschawel T. 1980. Vector model for normal and dichromatic color vision. J Opt Soc Am 70:197-212.
130 Alferdinck JW. 2006. Target detection and driving behaviour measurements in a driving simulator at mesopic light levels. Ophthalmic Physiol Opt. 26(3):264-280.
131 Figueiro MG, Bullough JD, Parsons RH, Rea MS. 2004. Preliminary evidence for spectral opponency in the suppression of melatonin by light in humans. Neuroreport 15(2):313-316.
132 Rushton WAH. 1972. Visual pigments in man. In: Dartnall HJA (ed.), Handbook of Sensory Physiology. Vol VII/1. New York: Springer-Verlag, pp. 364-394.
133 Rea MS, Figueiro MG, Bullough JD, Bierman A. 2005. A model of phototransduction by the human circadian system. Brain Res Brain Res Rev. 50(2):213-228.
134 Rea MS, Figueiro MG, Bullough JD. 2002. Circadian photobiology: an emerging framework for lighting practice and research. Lighting Research and Technology 34(3):177-190.
135 Panda S, Provencio I, Tu DC, Pires SS, Rollag MD, Castrucci AM, Pletcher MT, Sato TK, Wiltshire T, Andahazy M, Kay SA, Van Gelder RN, Hogenesch JB. 2003. Melanopsin is required for non-image-forming photic responses in blind mice, Science 301:525– 527.
136 Figueiro MG, Rea MS, Bullough JD. 2006. Circadian effectiveness of two polychromatic lights in suppressing human nocturnal melatonin. Neuroscience Letters 406:293-297.
137 Münch, M., Kobialka, S., Steiner, R., Oelhafen, P., Wirz-Justice, A., Cajochen, C., 2005. Wavelength-dependent Effects of Evening Light Exposure on Sleep Architecture and Sleep EEG Power Density in Men. Am J Physiol Regul Integr Comp Physiol. 290, R1421-R1428.
138 Cajochen, C., Münch, M., Kobialka, S., Kräuchi, K., Steiner, R., Oelhafen, P., Orgül, S., Wirz-Justice, A., 2005. High sensitivity of human melatonin, alertness, thermoregulation, and heart rate to short wavelength light. J. Clin. Endocrinol. Metab. 90, 1311-1316.

References 70
139 Lockley, S.W., Evans, E.E., Scheer, F.A., Brainard, G.C., Czeisler, C.A., Aeschbach, D., 2006. Short-wavelength
sensitivity for the direct effects of light on alertness, vigilance, and the waking electroencephalogram in humans. Sleep. 29(2), 161-168.
140 Revell, V.L., Arendt, J., Fogg, L.F., Skene, D.J., 2006. Alerting effects of light are sensitive to very short wavelengths. Neurosci Lett. 399(1-2), 96-100.
141 Revell, V.L., Arendt, J., Terman, M., Skene, D.J., 2005. Short-wavelength sensitivity of the human circadian system to phase-advancing light. J Biol Rhythms. 20(3), 270-272.
142 Weale RA. 1982. A Biography of the Eye – Development, Growth, Age, HK Lewis & Co., London.
143 Nathan PJ, Burrows GD, Norman TR. 1999. The effect of age and pre-light melatonin concentration on the melatonin sensitivity to dim light. International clinical Psychopharmacology 14:189-192.
144 Nathan PJ, Wyndham EL, Burrows GD, Norman TR. 2000. The effect of gender on the melatonin suppression by light: a dose response relationship. J Neural Transm. 107(3):271-279.
145 Stiles WS, Crawford BH. 1933. The luminous efficiency of rays entering the eye pupil at different points. Proc R Soc Lond B Biol Sci. 112:428–450.
146 Applegate RA, Lakshminarayanan V. 1993. Parametric representation of Stiles–Crawford functions: normal variation of peak location and directionality. J. Opt. Soc. Am. A. 10(7):1611-1623.
147 Visser EK, Beersma DG, Daan S. 1999. Melatonin suppression by light in humans is maximal when the nasal part of the retina is illuminated. J Biol Rhythms 14(2):116-121.
148 Lasko TA, Kripke DF, Elliot JA. 1999. Melatonin suppression by illumination of upper and lower visual fields. J Biol Rhythms. 14(2):122-125.
149 Glickman G, Hanifin JP, Rollag MD, Wang J, Cooper H, Brainard GC. 2003. Inferior retinal light exposure is more effective than superior retinal exposure in suppressing melatonin in humans. J. Biol. Rhythms 18:71-79.
150 Rüger M, Gordijn MC, Beersma DG, de Vries B, Daan S. 2005. Nasal versus temporal illumination of the human retina: effects on core body temperature, melatonin, and circadian phase. J Biol Rhythms 20(1):60-70.
151 Aschoff J, Hoffmann K, Pohl H, Wever R. 1975. Re-entrainment of circadian rhythms after phase-shifts of the Zeitgeber. Chronobiologia 2:23-78.
152 Wever RA. 1979. The Circadian System of Man: Results of Experiments Under Temporal Isolation. New York: Springer-Verlag.
153 Wever RA, Polasek J, Wildgruber CM. 1983. Bright light affects human circadian rhythms. Pflügers Arch. 396:85-87.
154 Wever RA. 1989. Light effects on human circadian rhythms: A review of recent Andechs experiments. Journal of Biological Rhythms 4:161-185.
155 Honma K, Honma S, Wada T. 1987. Entrainment of human circadian rhythms by artificial bright light cycles. Experientia 43:572-574.
156 Boivin DB, Duffy JF, Kronauer RE, Czeisler CA. 1996. Dose-response relationships for resetting of human circadian clock by light. Nature 379:540–542.
157 Zeitzer JM, Dijk DJ, Kronauer R, Brown E, Czeisler C. 2000. Sensitivity of the human circadian pacemaker to nocturnal light: melatonin phase resetting and suppression. J Physiol. 526(Pt 3):695-702.
158 Stevens SS. 1961. To honor Fechner and repeal his law. Science 133:80-86.
159 Brainard GC, Richardson BA, King TS, Matthews SA, Reiter RJ. 1983. The suppression of pineal melatonin content and N-acetyltransferase activity by different light irradiances in the Syrian hamster: a dose—response relationship. Endocrinology 113:293-296.
160 Nelson DE, Takahashi JS. 1991. Sensitivity and integration in a visual pathway for circadian entrainment in the hamster (Mesocricetus auratus). Journal of Physiology 439:115-145.
161 Bauer MS. 1992. Irradiance responsivity and unequivocal type1 phase responsivity of rat circadian activity rhythms. American Journal of Physiology 263:R1110-1114.
162 Wever R. 1970. Zur Zeitgeber-Stärke eines Licht-Dunkel-Wechsels für die circadiane Periodik des Menschen. Pflügers Archiv 321:133-142.
163 Aschoff J, Fatranská M, Giedke H, Doerr P, Stamm D, Wisser H. 1971. Human circadian rhythms in continuous darkness: Entrainment by social cues. Science 171:213-215.
164 Boivin DB, Czeisler CA. 1998. Resetting of circadian melatonin and cortisol rhythms in humans by ordinary room light. Neuroreport. 9(5): 779-82.
165 Waterhouse J, Minors D, Folkard S, Owens D, Atkinson G, MacDonald I, Reilly T, Sytnik N, Tucker P. 1998. Light of domestic intensity produces phase shifts of the circadian oscillator in humans. Neuroscience Letters 245:97-100.

References 71
166 Czeisler CA, Richardson GS, Zimmerman JC, Moore-Ede MC, Weitzman ED. 1981. Entrainment of human
circadian rhythms by light-dark cycles: a reassessment. Photochemistry and Photobiology 34:239-247.
167 Lewy AJ, Wehr TA, Goodwin FK, Newsome DA, Markey SP. 1980. Light suppresses melatonin secretion in humans, Science 210:1267–1269.
168 McIntyre IM, Norman TR, Burrows GD, Armstrong TM. 1989. Human melatonin suppression by light is intensity dependent, J. Pineal Res. 6:149–156.
169 Brainard GC, Richardson BA, Petterborg LJ, Reiter RJ. 1982. The effect of different light intensities on pineal melatonin content, Brain Res. 233:75–81.
170 Reiter RJ. 1980. Action spectra, dose-response relationships, and temporal aspects of light’s effects on the pineal gland, Ann. N.Y. Acad. Sci. 453:215–230.
171 Webb SM, Champney TH, Lewinski AK, Reiter RJ. 1985. Photoreceptor damage and eye pigmentation: influence on the sensitivity of rat pineal n-acetyltransferase activity and melatonin levels to light at night, Neuroendocrinology 40:205–209.
172 Gaddy JR, Rollag MD, Brainard GC. 1993. Pupil size regulation of threshold of light-induced melatonin suppression. J Clin Endocrinol Metab 77:1398–1401.
173 Sheedy JE, Gowrisankaran S, Hayes JR. 2005. Blink rate decreases with eyelid squint, Optomet. Vis. Sci. 82:905-911.
174 Sheedy JE, Truong SD, Hayes JR. 2003. What are the benefits of eyelid squinting? Optomet. Vis. Sci. 80:740–744.
175 Sliney DH. 2001. Photoprotection of the eye: UV radiation and sunglasses, J. Photochem. Photobiol. B 64:166–175.
176 Hastings JW, Sweeney BM. 1958. A persistent diurnal rhyhtm of luminescence in Gonyaulax polyedra. Biol Bull 115:440-458.
177 Winfree AT. 1980. The Geometry of Biological Time. New York: Springer-Verlag.
178 Kronauer RE, Jewett ME, Czeisler CA. 1993. Commentary: The human circadian response to light – Strong and weak resetting. J Biol Rhythms 8:351-360.
179 Lakin-Thomas PL. 1993. Commentary: The human circadian response to light – Strong or weak phase resetting by light pulses in humans? J Biol Rhythms 14:227-236.
180 Minors DS, Waterhouse JM, Wirz-Justice A. 1991. A human phase-response curve to light. Neurosci Lett 133: 36–40.
181 Honma K, Honma S. 1988. A human phase response curve for bright light pulses. Jpn J Psychiatry Neurol. 42:167-168.
182 Khalsa SB, Jewett ME, Cajochen C, Czeisler CA. 2003. A phase response curve to single bright light pulses in human subjects. J Physiol. 549(Pt 3):945-952.
183 Hashimoto S, Kohsaka M, Nakamura K, Honma H, Honma S, Honma KI. 1997. Midday exposure to bright light changes the circadian organization of plasma melatonin rhythms in humans. Neurosci Lett 221:89-92.
184 Jewett ME, Rimmer DW, Duffy JF, Klerman EB, Kronauer RE, Czeisler CA. 1997. Human circadian pacemaker is sensitive to light throughout subjective day without evidence of transients. Am J Physiol 42:1800–1809.
185 Pittendrigh CS, Daan S. 1976. A functional analysis of circadian pacemakers in nocturnal rodents V. Pacemaker structure: a clock for all seasons. J Comp Physiol [A] 106:333–355.
186 Illnerová H, Vanecek J. 1982. Two-oscillator structure of the pacemaker controlling the circadian rhythm of N-acetyltransferase in the rat pineal gland. J Comp Physiol [A] 145:539–548.
187 Elliott JA, Tamarkin L. 1994. Complex circadian regulation of pineal melatonin and wheel-running in Syrian hamsters. J Comp Physiol [A] 174:469–484.
188 Illnerová H, Sumová A. 1997. Photic entrainment of the mammalian rhythm in melatonin production. J Biol Rhythms 12:547–555.
189 Boulos Z, Campbell SS, Lewy AJ, Terman M, Dijk D-J, Eastman CI. 1995. Light treatment for sleep disorders: consensus report. VII. Jet lag. J Biol Rhythms 10:167–176.
190 Czeisler CA, Kronauer RE, Johnson MP, Allan JS, Johnson TS, Dumont M. 1989. Action of light on the human circadian pacemaker: treatment of patients with circadian rhythm sleep disorders. In: Sleep ’88, edited by Horne J. Stuttgart, Germany: Gustav Fischer Verlag, p. 42–47.
191 Jewett ME, Kronauer RE, and Czeisler CA. 1991. Light-induced suppression of endogenous circadian amplitude in humans. Nature 350:59–62.
192 Boivin DB, Duffy JF, Kronauer RE, Czeisler CA. 1996. Dose-response relationships for resetting of human circadian clock by light. Nature 379:540–542.
193 Ostwald W. 1892. Photochemische Untersuchungen von R. Bunsen un H.E. Roscoe (1855-1859). Verlag Wilhlem Engelman, Leipzig.

References 72
194 Nelson DE, Takahashi JS. 1991. Sensitivity and integration in a visual pathway for circadian entrainment in the
hamster (Mesocricetus auratus). Journal of Physiology 439:115-145.
195 Peterson EL. 1980. A limit cycle interpretation of a mosquito circadian oscillator. J Theor Biol. 84:281-310.
196 Van den Pol AN, Cao V, Heller HC. 1998. Circadian system of mice integrates brief light stimuli. Am J Physiol Regulatory Integrative Comp Physiol 275:R654–R657.
197 Hébert M, Dumont M, Paquet J. 1998. Seasonal and diurnal patterns of human illumination under natural conditions. Chronobiol Int 15:59–70.
198 Kripke DF, Gregg LW. 1990. Circadian effects of varying environmental light. In: Medical Monitoring in the Home and Work Environment, edited by Miles LE and Broughton RJ. New York: Raven, p. 187–195.
199 Okudaira N, Kripke DF, Webster JB. 1983. Naturalistic studies of human light exposure. Am J Physiol Regulatory Integrative Comp Physiol 245:R613–R615.
200 Savides TJ, Messin S, Senger C, Kripke DF. 1986. Natural light exposure of young adults. Physiol Behav 38:571-574.
201 Kronauer RE, Forger DB, Jewett ME. 1999. Quantifying human circadian pacemaker response to brief, extended, and repeated light stimuli over the photopic range. J Biol Rhythms 14:500–515.
202 Kronauer RE, Forger DB, Jewett ME. 2000. Erratum: quantifying human circadian pacemaker response to brief, extended, and repeated light stimuli over the photopic range. J Biol Rhythms 15:184–186.
203 Rimmer DW, Boivin DB, Shanahan TL, Kronauer RE, Duffy JF, Czeisler CA. 2000. Dynamic resetting of the human circadian pacemaker by intermittent bright light. Am J Physiol Regul Integr Comp Physiol. 279(5):R1574-1579.
204 Wever RA, Polasek J, Wildgruber CM. 1983. Bright light affects human circadian rhythms. Pflügers Arch. 396:85-87.
205 Espiritu RC, Kripke DF, Ancoli-Israel S, Mowen MA, Mason WJ, Fell RL, Klauber MR, Kaplan OJ. 1994. Low illumination experienced by San Diego adults: association with atypical depressive symptoms. Biol Psychiatry 35:403–407.
206 Boivin DB, James FO. 2005. Review article: Light treatment and circadian adaptation to shift work. Industrial Health 43:34-48.
207 Baehr EK, Fogg LF, Eastman CI. 1999. Intermittent bright light and exercise to entrain human circadian rhythms to night work. Am J Physiol 277:1598–1604.
208 Gronfier C, Kronauer RE, Wright KP, Czeisler CA. 2000. Phase-shifting effectiveness of intermittent light pulses: relationship to melatonin suppression. Seventh Meeting of the Society for Research on Biological Rhythms. Jacksonville: Society for Research on Biological Rhythms.
209 Nelson DE, Takahashi JS 1999. Integration and saturation within the circadian photic entrainment pathway of hamsters. Am J Physiol 277:R1351–R1361
210 Shimomura K, Menaker M 1994 Light-induced phase shifts in τ mutant hamsters. J Biol Rhythms 9:97–110.
211 Refinetti R 2003. Effects of prolonged exposure to darkness on circadian photic responsiveness in the mouse. Chronobiol Int 20:417–440.
212 Hebert M, Martin SK, Lee C, Eastman CI. 2002. The effects of prior light history on the suppression of melatonin by light in humans. J Pineal Res 33:198–203
213 Smith KA, Schoen MW, Czeisler CA. 2004. Adaptation of human pineal melatonin suppression by recent photic history. J Clin Endocrinol Metab. 89(7):3610-3614.
214 Brainard GC, Rollag MD, Hanifin JP, van den Beld G, Sanford B. 2000. The effect of polarized nonpolarized light on melatonin regulation in humans. Photochemistry and photobiology 71(6):766-770.
215 Hankins MW, Lucas RJ. 2002. The primary visual pathway in humans is regulated according to long-term light exposure through the action of a nonclassical photopigment. Curr Biol. 12:191-198.
216 Webster JG. 1998. Medical Instrumentation – Application and Desing. 3rd edition. John Wiley & Sons, Inc.
217 Hodgkin AL, O'Bryan P. 1977. Internal recordings of the early receptor potential in turtle retina. Journal of Physiology (London) 267:737-766.
218 Stockton RA, Slaughter MM. 1989. B-wave of the electroretinogram. A reflection of ON bipolar cell activity. J. Gen. Physiol. 93:101.122.
219 Birch DG, Berson EL, Sandberg MA. 1984. Diurnal rhythm in the human rod ERG. Invest. Opthalmool. Vis. Sci. 25:236-238.
220 Bassi C, Powers M. 1986. Daily fluctuations in the detectability of dim lights by humans. Physiol. Behav. 38:871-877.

References 73
221 Roenneberg T, Lotze M, von Steinbuchel N. 1992. Diurnal variation in human visual sensitivity determined by
incremental thresholds. CLin. Vis. Sci. 7:83-91.
222 Hankins MW, Jones RJ, Ruddock KH. 1998. Diurnal variations in the b-wave implicit time of the human electroretinogram. Vis. Neurosci. 15:55-67.
223 Hankins MW, Lucas RJ. 2002. The primary visual pathway in humans is regulated according to long-term light exposure through the action of a nonclassical photopigment. Curr Biol. 12:191-198.
224 Hankins MW, Jones S, Jenkins A, Morland A. 2001. Diurnal daylight phase affects the temporal properties of both the b-wave and d-wave of the human electroretinogram. Brain Res. 889:339-343.
225 Brainard GC, Hanifin JP, Greeson JM, Byrne B, Glickman G, Gerner E, Rollag MD. 2001. Action spectrum for melatonin regulation in humans: evidence for a novel circadian photoreceptor. J. Neurosci. 21:6405-6412.
226 Anon. Lighting Laboratory, Helsinki University of Technology (TKK). Facilities: Goldman Perimeter. Available from: http://www.lightinglab.fi/facilities/GoldmanPerimeter/index.html [2006 November 04].
227 Oakley BI, Green DG. 1976. Correlation of light-induced changes in retinal extracellular potassium concentration with c-wave of the electroretinogram. Journal of Neurophysiology 39:1117-1133.
228 Berman SM, Greenhouse DS, Bailey IL, Clear RD, Raasch TW. 1991. Human electroretinogram responses to video displays, fluorescent lighting, and other high frequency sources. Optom Vis Sci. 68(8):645-662.
229 Brainard DH, Calderone JB, Nugent AK, Jacobs GH. 1999. Flicker ERG Responses to Stimuli Parametrically Modulated in Color Space. Investigative Ophthalmology & Visual Science 40(12):2840-2847.
230 Arden GB, Barrada A, Kelsy JH. 1962. New clinical test of retinal function based on the standing potential of the eye. Brit. J. Ophthalmol. 46:449-467.
231 Kolb H, Fernandez E, Nelson R. Webvision. Clinical Electrophyiology. Available from: http://webvision.med.utah.edu/sretina.html [2006 June 27].
232 Cajochen C, Khalsa SB, Wyatt JK, Czeisler CA, Dijk DJ. 1999. EEG and ocular correlates of circadian melatonin phase and human performance decrements during sleep loss. Am J Physiol. 277(3 Pt 2):R640-649.
233 Knecht M, Hummel T. 2004. Recording of the human electro-olfactogram. Physiol Behav. 83(1):13-19.
234 Dement WC. 1964. Eye movements during sleep. In: M. B. Bender (Ed.) The Oculomotor System. Hoeber Medical Division, Harper & Row, New York, 366–416.
235 Santamaria J, Chiappa KH. 1987. The EEG of drowsiness in normal adults. J. Clin. Neurophysiol. 4:327–382.
236 De Gennaro L, Ferrara M, Ferlazzo F, Bertini M. 2000. Slow eye movements and EEG power spectra during wake-sleep transition. Clin Neurophysiol. 111(12):2107-2115.
237 De Gennaro L, Devoto A, Lucidi F, Violani C. 2005. Oculomotor changes are associated to daytime sleepiness in the multiple sleep latency test. J Sleep Res. 14(2):107-112.
238 Hyoki K, Shigeta M, Tsuno N, Kawamuro Y, Kinoshita T. 1998. Quantitative electro-oculography and electroencephalography as indices of alertness. Electroencephalogr Clin Neurophysiol. 106(3):213-219.
239 Svensson U. 2004. Blink behaviour based drowsiness detection–method development and validation. M.Sc. thesis, Biomedical Engineering, University of Linköping.
240 Thorslund B. 2001. Electrooculogram Analysis and Development of a System for Defining Stages of Drowsiness. Statens väg- och transportforskningsinstitut, Linköping (Sweden)/ Linköping University, Department of Biomedical Engineering (Sweden) 2004. 52 p. Report No.: 355A.
241 Marmor MF, Wu KH. 2005. Alcohol- and light-induced electro-oculographic responses: variability and clinical utility. Doc Ophthalmol. 110(2-3):227-236.
242 Aserinksy E., Kleitman N. 1955. Two types of ocular motility occuring in sleep. J. Appl. Physiol. 8:1–10.
243 Kuhlo W, Lehmann D. 1964. Das Einschlafen und seine neurophysiologischen Korrelate. Archiv fu¨ r Psychiatrie und Nervenkrankheiten 205:687–716.
244 Maulsby RL, Kellaway P, Graham M, Frost JD, Proler ML, Low MD, North RR. 1968. The normative electroencephalographic data reference library. National Aeronautic and Space Adminstration, p. 172.
245 Malmivuo J, Plonsey R. 2002. Bioelectromagnetism. Online version of book. Available from: http://butler.cc.tut.fi/~malmivuo/bem/bembook/28/28.htm [2006 July 10].
246 Fountoulakis KN, Fotiou F, Iacovides A, Kaprinis G. 2005. Is there a dysfunction in the visual system of depressed patients? Ann Gen Psychiatry 4: 7.
247 Pinckers A. 1979. Clinical Electro-Oculography. Acta Ophthalmol 623-632.
248 Arden GB, Kelsey JH. 1962. Changes Produced by Light in the Standing Potential of the Human Eye. J Physiol 189-202.
249 Marmor M, Zrenner E. 1993. Standard for Clinical Electro-Oculography. Arch Ophthalmol. 601-604.

References 74
250 Armington JC, Johnson EP, Riggs LA. 1952. The scotopic a-wave in the electrical response of the human retina. J
Physiol. 289-298.
251 Duchowski A. 2002. A breadth-first survey of eye-tracking applications. Behavior Research Methods, Instruments and Computers 34(4):455-470.
252 Rayner K. 1998. Eye movements in reading and information processing: 20 years of research. Psychol Bull. 124(3):372-422.
253 Hubalek S, Schierz C. 2004. LichtBlick – photometrical situation and eye movements at VDU work places. CIE Symposium ’04 “Light and Health”, pp. 322-324.
254 Robinson DA. 1968. The oculomotor control system: A review. Proceedings of the IEEE 56:1032-1049.
255 Findlay JM, Walker R. 1999. A model of saccade generation based on parallel processing and competitive inhibition. Behavioral & Brain Sciences 22:661-721.
256 Snodderly DM, Kagan I, Gur M. 2001. Selective activation of visual cortex neurons by fixational eye movements: Implications for neural coding. Visual Neuroscience 18:259-277.
257 Asaad WF, Rainer G, Miller EK. 2000. Task-specific neural activity in the primate prefrontal cortex. Neurophysiology 84:451-459.
258 Özyurt J, Rutschmann RM, Greenlee MW. 2006. Cortical activation during memory-guided saccades. Neuroreport 17(10):1005-1009.
259 Reichle ED, Pollatsek A, Fisher DL, Rayner K. 1998. Toward a model of eye movement control in reading. Psychological Review 105:125-157.
260 Rayner K, Pollatsek A. 1992. Eye movements and scene perception. Canadian Journal of Psychology 46:342-376.
261 Henderson JM, Hollingworth A. 1998. Eye movements during scene viewing: An overview. In G. Underwood (Ed.), Eye guidance in reading and scene perception (pp. 269-294). Amsterdam: Elsevier.
262 Buswell GT. 1935. How people look at pictures. Chicago: University of Chicago Press.
263 Molnar F. 1981. About the role of visual exploration in aesthetics. In H. Day (Ed.), Advances in intrinsic motivation and aesthetics. New York: Plenum.
264 Solso RL. 1999. Cognition and the visual arts (3rd ed.). Cambridge, MA: MIT Press.
265 Wooding DS. 2002. Fixation maps: Quantifying eye-movement traces. In Proceedings of the symposium on eye tracking research & applications (ETRA), pp. 31-36. New York: ACM Press.
266 DeCarlo D, Santella A. 2002. Stylization and abstraction of photographs. Transaction on Graphics 21:769-776.
267 d’Ydewalle G, Desmet G, Van Rensbergen J. 1998. Film perception: The processing of film cuts. In G. Underwood (Ed.), Eye guidance in reading and scene perception, pp. 357-368. Amsterdam: Elsevier.
268 Bertera JH, Rayner K. 2000. Eye movements and the span of the effective stimulus in visual search. Perception & Psychophysics 62:576-585.
269 Cooper RM. 1974. The control of eye fixation by the meaning of spoken language: A new methodology for the real-time investigation of speech perception, memory, and language processing. Cognitive Psychology 6;84-107.
270 Allopenna PD, Magnuson JS, Tanenhaus MK. 1998. Tracking the time course of spoken word recognition using eye movements: Evidence for continuous mapping models. Journal of Memory & Language 38:419-439.
271 Land MF, Mennie N, Rusted J. 1999. The roles of vision and eye movements in the control of activities of daily living. Perception 28:1307-1432.
272 Land MF, Hayhoe M. 2001. In what ways do eye movements contribute to everyday activities. Vision Research 41:3559-3565.
273 Anders, G. 2001. Pilot’s attention allocation during approach and landing–eye- and head-tracking research in an A330 full flight simulator. In Proceedings of the 11th International Symposium on Aviation Psychology. Available from: http://www.geerdanders.de/literatur/2001_ohio.html [2006 October 28].
274 Dishart DC, Land MF. 1998. The development of the eye movement strategies of learner drivers. In G. Underwood (Ed.), Eye guidance in reading and scene perception, pp. 419-430. Amsterdam: Elsevier.
275 Ho G, Scialfa CT, Caird JK, Graw T. 2001. Visual search for traffic signs: The effects of clutter, luminance, and aging. Human Factors 43:194-207.
276 Megaw ED, Richardson J. 1979. Eye movements and industrial inspection. Applied Ergonomics 10:145-154.
277 Lohse GL. 1997. Consumer eye movement patterns on Yellow Pages advertising. Journal of Advertising 26:61-73.
278 Wedel M, Pieters R. 2000. Eye fixations on advertisements and memory for brands: A model and findings. Marketing Science 19:297-312.
279 Rayner K, Rotello CM, Stewart AJ, Keir J, Duffy SA. 2001. Integrating text and pictorial information: Eye movements when looking at print advertisements. Journal of Experimental Psychology Applied 7:219-226.

References 75
280 Jacob R. 1991. The use of eye movements in human-computer interaction techniques: what you look at is what you
get. ACM Transactions on Information Systems 9(2):152-169.
281 Majaranta P, Räihä K. 2002. Twenty years of eye typing: systems and design issues. In Proceedings of the symposium on Eye tracking research and applications, 15-22.
282 Hornof AJ, Cavender A, Hoselton R. 2004. Eyedraw: A system for drawing pictures with eye movements. In ACM SIGACCESS Conference on Computers and Accessibility, Atlanta, Georgia, 86-93.
283 Sibert L, Jacob R. 2000. Evaluation of eye gaze interaction. In Proceedings of the SIGCHI conference on Human factors in computing systems, 281-288.
284 Tanriverdi V, Jacob B. 2000. Interacting with eye movements in virtual environments. In Proceedings of the SIGCHI conference on Human factors in computing systems, 265-272.
285 Parkhurst D, Niebur E. 2002. Variable resolution displays: a theoretical, practical and behavioral evaluation. Human Factors 44(4):611-629.
286 Parkhurst D, Niebur E. 2004. A feasibility test for perceptually adaptive level of detail rendering on desktop systems. In Proceedings of the ACM Applied Perception in Graphics and Visualization Symposium, 105-109.
287 Hamsen D, Pece A. 2005. Eye tracking in the wild. Computer Vision and Image Understanding 98(1):155-181.
288 Li D, Babcock J, Parkhurst DJ. 2006. openEyes: a low-cost head-mounted eye-tracking solution. Eye Tracking Research & Application, Proceedings of the 2006 symposium on Eye tracking research & applications, pp. 95-100.
289 Morimoto C, Amir A, Flickner M. 2002. Detecting eye position and gaze from a single camera and 2 light sources. In Proceedings. 16th International Conference on Pattern Recognition 314-317.
290 Young L, Sheena D. 1975. Survey of eye movement recording methods. Behavior Research Methods and Instrumentation 7:397-429.
291 Haro A., Flickner M, Essa I. 2000. Detecting and tracking eyes by using their physiological properties, dynamics, and appearance. In Proceedings IEEE Conference on Computer Vision and Pattern Recognition 163-168.
292 Pelz J, Canosa R, Babcock J, Kucharczyk D, Silver A, Konno D. 2000. Portable eyetracking: A study of natural eye movements. In Proceedings of the SPIE, Human Vision and Electronic Imaging, 566-582.
293 Babcock J, Pelz J. 2004. Building a lightweight eyetracking headgear. In Eye Tracking Research & Applications Symposium, 109-114.
294 Land MF, Furneaux S. 1997. The knowledge base of the oculomotor system. Phil Trans R Soc Lond, B 352:1231-1239.
295 Land MF, Mennie N, Rusted J. 1999. The roles of vision and eye movements in the control of activities of daily living. Perception 28:1311-1328.
296 Pelz JB, Canosa RL. 2001. Oculomotor behavior and perceptual strategies in complex tasks. Vision Research, 41:3587-3596.
297 Babcock JS, Lipps M, Pelz JB. 2002. How people look at pictures before, during and after scene capture: Buswell revisited. In B.E.Rogowitz and T. N. Pappas (Eds.), Human Vision and Electronic Imaging V, SPIE Proceedings, 4662:34-47.
298 Sliney D, Wolbarst M. 1980. Safety with Lasers and Other Optical Sources, New York: Plenum Press, p.147.
299 ICNIRP Guidelines. 1997. Guidelines on Limits of Exposure to Broad-Band Incoherent Optical Radiation (0.38 to 3µm). Health Physics Vol. 73(3):539-554.
300 ICNIRP Guidelines. 2000. Light-Emitting Diodes (LEDS) and Laser Diodes: Implications for Hazard Assessment. Health Physics Vol. 78(6,):744-752.
301 Li D, Winfield D, Parkhurst DJ. 2005. Starburst: A hybrid algorithm for video-based eye tracking combining feature-based and model-based approaches. Vision for Human-Computer Interaction Workshop, IEEE Computer Vision and Pattern Recognition conference.
302 Anon. PCNation.com. Online store. Available from: http://www.pcnation.com/web/details.asp?affid=301&item=677258 [2006 October 25].
303 Anon. Unibrain Fire-i digital camera, technical specifications. Available online: http://www.unibrain.com/Products/VisionImg/tSpec_Fire_i_DC.htm [2006 October 25].
304 Anon. Sony ICX098BQ, CCD Datasheet. Available online: http://www.unibrain.com/download/pdfs/Fire-i_Board_Cams/ICX098BQ.pdf [2006 October 25].
305 Ohno T, Mukawa N, Yoshikawa A. 2002. Freegaze: a gaze tracking system for everyday gaze interaction, in Eye tracking research and applications symposium, March 2002, pp. 15–22.
306 Zhu J, Yang J. 2002. Subpixel eye gaze tracking, in IEEE Conference on Automatic Face and Gesture Recognition, May 2002, pp. 124–129.

References 76
307 Daugman J. 1993. High confidence visual recognition of persons by a test of statistical independence. IEEE
Transactions on Pattern Analysis and Machine Intellegence 15(11):1148–1161.
308 Nishino K, Nayar S. 2004. Eyes for relighting. ACM SIGGRAPH 23(3):704–711.
309 Burt P, Adelson E. 1983. A multiresolution spline with application to image mosaics. ACM Transactions on Graphics. 2(4):217–236.
310 Hansen D, Pece A. 2005. Eye tracking in the wild. Computer Vision and Image Understanding. 98(1):155–181.
311 Zhu D, Moore S, Raphan T. 1999. Robust pupil center detection using a curvature algorithm. Computer Methods and Programs in Biomedicine 59(3):145–157.
312 Fischler M, Bolles R. 1981. Random sample consensus: a paradigm for model fitting with applications to image analysis and automated cartography. Communicationsof the ACM 24(6):381–395.
313 Hartley R, Zisszerman A. 2000. Multiple view geometry in computer vision. Cambridge, UK: Cambridge University Press.
314 Stampe D. 1993. Heuristic filtering and reliable calibration methods for video-based pupil-tracking systems. Behavior Research Methods, Instruments, and Computers 25(2): 137–142.
315 Iskander DR, Collins MJ, Mioschek S, Trunk M. 2004. Automatic pupillometry from digital images. Biomedical Engineering, IEEE Transactions on 51(9):1619-1627.
316 Applegate RA, Hilmantel G, Howland HC, Tu EY, Starck T, Zayac EJ.. 2000. Corneal first surface optical aberrations and visual performance. J Refract Surg 16:507-514.
317 Boxer Wachler BS, Krueger RR. 1999. Agreement and repeatability of infrared pupillometry and comparison method. Ophthalmology 106:319-323.
318 Schnitzler EM, Baumeister M, Kohnen T. 2000. Scotopic measurement of normal pupils - Colvard versus Video Vision Analyzer infrared pupillometer. J Cataract Refract Surg. 26(6):859-866.
319 Wolffsohn JS, Hunt OA; Gilmartin B. 2002. Continuous measurement of accommodation in human factor applications. Ophthalmic and Physiological Optics 22(5):380-384(5).
320 Rosan ES, Gore CL, Taylor D. 2002. Use of a digital infrared pupillometer to assess patient suitability for refreactive surgery. J Cataract Refract Surg 28:1433-1438.
321 Kohnen T, Terzi E, Buhren J, Kohnen EM. 2003. Comparison of a digital and a handheld infrared pupillometer for determining scotopic pupil diameter. J Cataract Refract Surg. 29(1):112-117.
322 Uozato H, Guyton DL. 1987. Centering corneal surgical procedures. Am J Ophthalmol 103:264–275; correction, 852.
323 Lowenfeld IE. 1993. The Pupil; Anatomy, Physiology, and Clinical Applications. Ames IA, Iowa State University Press.
324 Hammond CJ, Snieder H, Spector TD, Gilbert CE. 2000. Factors affecting pupil size after dilatation: the Twin Eye Study. Br J Ophthalmol 84:1173–1176.
325 Teikari et al.
326 Wilhelm B. 2002. Pupillography detects daytime sleepiness. Online article. Available from: http://www.eagosh.com/articles_presentations_and_useful_informations/sleepiness/wilhelm_barbara/hazards_of_sleepiness.pdf [2006 November 18].
327 Anon. AMTech - Pupillographic Sleepiness Test PSTxs. Available from: http://www.amtech.de/htm/english/pst.htm [2006 November 18].
328 Watanabe T, Ikeda M, Suzuki T, Nakamura F. 1990. Infrared television pupillometer revised: Bright-pupil illumination and computer automation. Review of Scientific Instruments 61(1):36-41.
329 Anon. plusoptiX PowerRef II. Online brochure. Available from: http://www.plusoptix.de/english/02products/02products03.html [2006 June 28].
330 Anon. plusoptiX S04. Instruction manual, version 4.4.9. Available online from: http://www.plusoptix.de/08links/Instruction_manual_4_4_9.pdf [2006 June 28].
331 Howland HC, Howland B. 1974. Photorefraction: a technique for study of refractive status at distance. J Opt Soc Am 64:240–249.
332 Bobier WR, Bradick OJ. 1985. Eccentric photorefraction: Optical analysis and empherical measures. Am J Optom Physiol Opt 2:614–620.
333 Howland H, Braddick O, Atkinson J. 1983. Optics of photorefraction: orthogonal and isotropic methods. J Opt Soc Am 73:1701-1708.
334 Schimitzek T, Lagrèze WA. 2005. Accuracy of a new photorefractometer in young and adult patients. Graefe's Archive for Clinical and Experimental Ophthalmology 243(7):637-645.

References 77
335 Abrahamsson M, Ohlsson J, Björndahl M, Abrahamsson H. 2003. Clinical evaluation of an eccentric infrared
photorefractor: the PowerRefractor. Acta Ophthalmologica Scandinavica 81(6):605-610.
336 Choi M, Weiss S, Schaeffel F, Seidemann A, Howland H, Wilhelm B & Wilhelm H. 2000. Laboratory, clinical and kindergarten tests of a new eccentric infrared photorefractor. Optom Vis Sci 77:537–748.
337 Hunt OA, Wolffsohn JS, Gilmartin B. 2003. Evaluation of the measurement of refractive error by the PowerRefractor: a remote, continuous and binocular measurement system of oculomotor function. British Journal of Ophthalmology 87:1504-1508.
338 Periman LM, Ambrosio R Jr, Harrison DA, Wilson SE. 2003. Correlation of pupil sizes measured with a mesopic infrared pupillometer and a photopic topographer. J Refract Surg. 19(5):555-559.
339 Fogla R, Kao SK. 2000. Pupillometry using videokeratography in eyes with dark brown irides. J Cataract Refract Surg. 26(9):1266-1267.
340 Twa MD, Bailey MD, Hayes J, Bullimore M. 2004. Estimation of pupil size by digital photography. J Cataract Refract Surg. 30(2):381-389.
341 Iskander DR. 2006. A parametric approach to measuring limbus corneae from digital images. Biomedical Engineering, IEEE Transactions on 53(6):1134-1140.
342 Walsh G. 1988. The effect of mydriasis on the pupillary centration of the human eye. Ophthal. Physiol. Opt. 8(4):178–182.
343 Fray AM, Trokel SL, Myers JA. 1992. Pupil diameter and the principal ray. J Cataract Refract Surg. 18(7):348-351.
344 Wilson MA, Campbell MCW, Simonet P. Change of pupil centration with change of illumination and pupil size. Optom. Vis. Sci. 69(2):129–136.
345 Anon. Bond Eye Associates. Procedures: Limbal Relaxing Incisions (LRIs). Online article. Available from: http://www.bondeye.com/index.cfm/procedures/limbalrelaxingincisions [2006 June 28].
346 Wyatt HJ. 1995. The form of the human pupil. Vis. Res.35(14): 2021–2036.
347 Wang JG, Sung E. 2002. Study on eye gaze estimation. IEEE Trans. Syst. Man Cybern. B 32:332–350
348 Ser PK, Siu WC. Novel detection of conics using 2-D hough planes. Proc. Inst. Elect. Eng. -Vision, Image and Signal Processing, 142(5):262–270.
349 Gonzalez RC, Woods RE. 2002. Digital Image Processing, 2nd ed. Englewood Cliffs, NJ: Prentice-Hall.
350 Barry JC, Pongs UM, Hillen W. 1997. Algorithm for Purkinje images I and IV and limbus centre localization. Comput. Biol. Medicine 27(6):515–531.
351 Iskander DR, Mioschek S, Trunk M, Werth W. 2003 Detecting eyes in digital images. Proc. 7th Int. Symp. Signal Processing and its Applications vol. II, Paris, France, pp. 21–24.
352 Morimoto CH, Koons D, Amir A, Flickner M. Pupil detection and tracking using multiple light sources. Image Vis. Comput 18:331–335.
353 Zhu D, Moore ST, Raphan T. 1999. Robust pupil centre detection using a curvature algorithm. Comput. Methods and Programs in Biomed. 59:145–157.
354 Morelande MR, Iskander DR, Collins MJ, Franklin R. 2002. Automatic estimation of corneal limbus in videokeratoscopy. IEEE Trans. Biomed. Eng. 49:1617–1625.
355 Mandell RB. 1996. A guide to videokeratography. Int. Contact Lens Clinic 23(6):205–228.
356 Gall D, Bieske K. 2004. Definition and measurement of circadian radiometric quantities. CIE Symposium ’04 “Light and Health”, pp. 129-132.
357 Gall D, Lapuente V. 2002. Beleuchtungsrelevante Aspekte bei der Auswahl eines förderlichen Lampenspektrums. Licht 54:860-871.
358 Anon. LMK (98-3) Color. Online brochure. Available from: http://www.technoteam.de/products/luminance_measurement_technique/lmk_98_3_color/index_eng.html [2006 July 05].
359 Smith VC, Pokorny J, Gamlin PD, Packer OS, Peterson BB, Dacey DM. 2003. Functional architecture of the photoreceptive ganglion cell in primate retina: spectral sensitivity and dynamics of the intrinsic responses. Association for Research in Vision Meeting 2003: Abstract 5185.
360 Hollan J. 2004. Metabolism-influencing light: measurement by digital cameras. Poster at Cancer and Rhythm, Oct 14-16, Graz, Austria, 2004. Available from: http://amper.ped.muni.cz/noc/english/canc_rhythm/g_camer.pdf [03 November 2006].
361 Stockman A, Sharpe LT, Fach CC, 1999, The spectral sensitivity of the human short-wavelength cones. Vision Research, 39, 2901-2927. The lens tranmissivity data can be downloaded at http://cvision.ucsd.edu/ [03 November 2006].

References 78
362 Anon. Ecology of the Night Symposium. Scotobiology. Online article. Available from:
http://www.muskokaheritage.org/ecology-night/scotobiology.asp [2006 November 03].
363 Posch T, Hollan J, Kerschbaum F, Bleha M. 2004. Poster at Cancer and Rhythm, Oct 14-16, Graz, Austria, 2004. Available from: [03 November 2006].
364 Lyytimäki J. 2006. Unohdetut ympäristöongelmat [In Finnish: Forgotten environmental problems], Gaudeamus, Helsinki, Finland.
365 Forejt M, Hollan J, Skočovský, Skotnice R. 2004. Sleep disturbances by light at night: two queries made in 2003 in Czechia. Poster at Cancer and Rhythm, Oct 14-16, Graz, Austria, 2004. Available from: http://amper.ped.muni.cz/noc/english/canc_rhythm/g_sleep.pdf [03 November 2006].
366 Matthes R, Sliney D, Didomenico S, Murray P, Phillips R, Wengraitis S (eds). 1999. Measurements of Optical Radiation Hazards. ICNIRP, Munchen, Germany, pp 1–762.
367 Koller M, Kundi M, Stidl HG, Zidek T, Haider M. 1993. Personal light dosimetry in permanent night and day workers. Chronobiol Int. 10(2):143-155.
368 Loving RT, Kripke DF, Elliott JA, Knickerbocker NC, Grandner MA. 2005. Bright green light treatment of depression for older adults [ISRCTN55452501]. BMC Psychiatry 5:41-54.
369 Iwata T, Hasebe T, Kubota M. 2003. Study on exposed illuminance in daily life and circadian rhythm. Paper presented at the 25th Session of the CIE, San Diego.
370 Anon. Ambulatory Monitoring, Inc. BASIC Mini-Motionlogger Actigraph. Online brochure. Available from: http://www.ambulatory-monitoring.com/basic_mini.html [2006 July 06].
371 Jean-Louis G, Kripke DF, Cole RJ, Assmus JD, Langer RD. 2001. Sleep detection with an accelerometer actigraph: comparisons with polysomnography. Physiol Behav 72:21-28.
372 Jean-Louis G, Kripke DF, Mason WJ, Elliott JA, Youngstedt SD. 2001. Sleep estimation from wrist movement quantified by different actigraphic modalities. J Neurosci Methods 105:185-191.
373 Anon. Ambulatory Monitoring, Inc. Product Catalog. Online brochure. Available from: http://www.ambulatory-monitoring.com/catalog_AMI.pdf [2006 July 06].
374 Anon. KonicaMinolta: Light Meters. Online Brochure. Available from: http://se.konicaminolta.us/products/product_brochures/t_10.pdf [2006 November 18].
375 Diepes H, Blendowske R. 2002. Optik und Technik der Brille. Heidelberg: Optische Fachveröffentlichung GmbH.
376 Aries M, Begemann S, Zonneveldt L, Tenner A. 2002. Retinal illuminance from vertical daylight openings in office spaces. Paper presented at the Right Light 5.
377 Anon. LMK Mobile Videophotometer. Online brochure. Available from: http://perso.orange.fr/scientec/html_en/departement/photometrie/lmk_mobil_en.htm [2006 November 01].
378 Anon. SMI, SensoMotoric Instruments. iView X System. Online brochure. Available from: http://www.smi.de/iv/index.html [2006 November 01].
379 Bierman A, Klein TR, Rea MS. 2005 The Daysimeter: a device for measuring optical radiation as a stimulus for human circadian system. Meas. Sci. Technol. 16:2292-2299.
380 Van Derlofske J, Bierman A, Rea MS, Ramanath J, Bullough JD. 2002. Design and optimization of a retinal flux density meter. Meas. Sci. Technol. 13:821-828.
381 Zeitzer JM, Khalsa SB, Boivin DB, Duffy JF, Shanahan TL, Kronauer RE, Czeisler CA. 2005. Temporal dynamics of late-night photic stimulation of the human circadian timing system. Am J Physiol Regul Integr Comp Physiol. 289(3):R839-844.
382 Rea MS, Bullough JD, Figueiro MG. 2002. Phototransduction for human melatonin suppression. J Pineal Res. 32(4):209-213.
383 Anon. Hamamatsu. S1223-01 Datasheet. Available from: http://www.sales.hamamatsu.com/assets/pdf/parts_S/S1223_series.pdf [2006 November 02].
384 Rea MS (ed). 2000. IESNA Lighting Handbook: Reference and Application 9th edn (New York: Illuminating Engineering Society of North America).
385 Bierman et al. 2004. Daysimeter Development Report. Online Article. Available from: http://www.lrc.rpi.edu/programs/daylighting/pdf/appendixE.pdf [2006 November 02].
386 Anon. Hamamatsu G1962 GaP photodiode datasheet. Available from: http://www.ortodoxism.ro/datasheets/hamamatsu/G1962.pdf [2006 November 06].
387 Anon. Ealing Catalog. Optics. Online Catalog. Available from: http://64.143.63.33/pdf/Filters.pdf [2006 November 14].
388 Anon. Rosco US : Filters : Roscolux. Available from: http://www.rosco.com/us/filters/roscolux.asp [2006 November 14].

References 79
389 Anon. Texas Instruments OP2349 datasheet. Available from:
http://www.ortodoxism.ro/datasheets/texasinstruments/opa2349.pdf [2006 November 06].
390 Bierman A, Klein TR, Rea MS. 2005 The Daysimeter: a device for measuring optical radiation as a stimulus for human circadian system. Meas. Sci. Technol. 16:2292-2299.
391 Wright HR, Lack LC. 2001. Effect of light wavelength on suppression and phase delay of the melatonin rhythm. Chronobiol. Int. 18:801-808.
392 Buxton OM, L'Hermite-Balériaux M, Turek FW, van Cauter E. 2000. Daytime naps in darkness phase shift the human circadian rhythms of melatonin and thyrotropin secretion. Am J Physiol Regulatory Integrative Comp Physiol 278:373-382.
393 Van Cauter, E., Moreno-Reyes R, Akseki E, L’Hermite-Balériaux M, Hirschfeld U, Leproult R, Copinschi G. 1998. Rapid phase advance of the 24-h melatonin profile in response to afternoon dark exposure. Am. J. Physiol. Endocrinol. Metab. 275:E48–E54.
394 Horowitz TS, Cade BE, Wolfe JM, Czeisler CA. 2001. Efficacy of bright light and sleep/darkness scheduling in alleviating circadian maladaptation to night work. Am J Physiol Endocrinol Metab. 281(2):E384-391.
395 Anon. Hamamatsu. [2006 November 02].
396 Anon. MSP430 Ultra-Low-Power Microcontrollers Brochure 2H 2006 (Rev. L). Available from: http://focus.ti.com/lit/ml/slab034l/slab034l.pdf [2006 November 02].
397 Anon. fi.Wikipedia. TI MSP430. Available from: http://fi.wikipedia.org/wiki/TI_MSP430 [in Finnish, 2006 November 14].
398 Commission Internationale de l’Èclairage 1994 Light as a True Visual Quantity: Principles of Measurement (Vienna: Commission Internationale de l’Èclairage).
399 Anon. Constructing a Low-Cost Mobile Eye Tracker. Online article. Available from: http://hcvl.hci.iastate.edu/cgi-bin/openEyeswiki/index.cgi?MobileEyeTrackerConstruction [2006 November 13].
400 Anon. openEyes: DetailedParts. Hardware component listing. Available from: http://hcvl.hci.iastate.edu/cgi-bin/openEyeswiki/index.cgi?DetailedParts [2006 November 13].
401 Anon. Yleiselektroniikka. ExtraCell ELB4.2-12 Lead battery (Pb). 12V DC/4.2Ah. Available from: http://www.yleiselektroniikka.fi/index.php?main=64&productCat=1179&productID=13641 [2006 November 14].
402 Anon. National Semiconductor LM317 - 3-Terminal Adjustable Regulator. Available from: http://www.national.com/pf/LM/LM317.html [2006 November 14].
403 Anon. Hamamatsu S1223-01. Si PIN photodiode. Datasheet. Available from: http://sales.hamamatsu.com/assets/pdf/parts_S/S1223_series.pdf [2006 November 06].
404 Anon. 2000 Burr-Brown Product Selection Guide. Available from: http://www.ortodoxism.ro/datasheets/BurrBrown/mXxttvy.pdf [2006 November 13].
405 Anon. Texas Instruments. MSP430 Ultra-Low Power Microcontrollers Products. Available from: http://focus.ti.com/paramsearch/docs/parametricsearch.tsp?sectionId=95&tabId=1200&familyId=342&family=mcu [2006 November 14].
406 Anon. Yleiselektroniikka. Atmel AT29C020-90PI, 2 MB Flash 90ns DIP 5V. Available from: http://www.yleiselektroniikka.fi/index.php?main=64&productCat=2141&productID=3988 [2006 November 14].
407 Anon. Dallas Semiconductor. Maxim. MAX4964 low-voltage CMOS analog IC. Available from: http://www.maxim-ic.com/quick_view2.cfm/qv_pk/2474 [2006 November 13].
408 Anon. TI TL431CLP, Shunt regulator TO226(TO92). Available from: http://www.yleiselektroniikka.fi/index.php?main=64&productCat=1510&productID=10134 [2006 November 14].
409 Anon. AustriaMicro AS1351, Progr. LDO 2x200mA 1.8-3.3V. Available from: http://www.yleiselektroniikka.fi/index.php?main=64&productCat=868&productID=11503 [2006 November 14].
410 Anon. Yleiselektroniikka. GP17R8H NiMH 9V 170mAh. Available from: http://www.yleiselektroniikka.fi/index.php?main=64&productCat=895&productID=5733 [2006 November 14].
411 Anon. Analog Devices ADXL311 Accelerometer. Available from: http://www.analog.com/en/prod/0%2C2877%2CADXL311%2C00.html [2006 November 13].
412 Anon. RPC Photonics. HiLAM, High-efficiency Lambertian Diffusers. Available from: http://www.rpcphotonics.com/hilam.htm [2006 November 14].
413 Anon. Edmund Optics. Opal Diffusing Glass. Diffuser Opal 5-12,5mm Diamerer. Available from: http://www.edmundoptics.com/onlinecatalog/DisplayProduct.cfm?productid=1671 [2006 November 14].
414 Anon. UQG Optical Product Catalogue. Photopic filter 12.5mm diamater. Available from: http://www.uqgoptics.com/product_stock.asp?cid=2&scid=29 [2006 November 14].

References 80
415 Anon. B&H Photo. Rosco Roscolux #08 Filter - Pale Gold - 20x24" sheet. Available from:
http://www.bhphotovideo.com/bnh/controller/home?O=Search&A=details&Q=&sku=43702&is=REG&addedTroughType=search [2006 November 14].
416 Anon. Electronic Measurements (S-108.2010 Elektroniset mittaukset in Finnish). Helsinki University of Technology (TKK). Home assignment 2/5 2006. Available from: http://metrology.hut.fi/courses/S-108.2010/Kotitentti%202%20ratkaisu.pdf [2006 November 16].
417 Anon. Elfa Electronics. LT1028. Available from: http://www.elfa.se/elfa-bin/setpage.pl?http://www.elfa.se/elfa-bin/dyndok.pl?dok=218390.htm [2006 November 13].
418 Anon. Linear Technology. LT1028 Datasheet. Available from: http://www.linear.com/pc/productDetail.do?navId=H0,C1,C1154,C1009,C1021,P1234 [2006 November 06].
419 Anon. Analog Devices OP07. Available from: http://www.analog.com/jp/prod/0,,759_786_OP07,00.html [2006 November 13].
420 Anon. Analog Devices. OP07 Datasheet. Available from: http://www.analog.com/UploadedFiles/Data_Sheets/39161232478959OP07_c.pdf [2006 November 06].
421 Anon. Analog Devices OP27. Available from: http://www.analog.com/jp/prod/0,,759_786_OP27,00.html [2006 November 13].
422 Anon. OP27 Datasheet. Available from: http://web.mit.edu/6.301/www/OP27c.pdf [2006 November 06].
423 Anon. Analog Devices OP497. Available from: http://www.analog.com/jp/prod/0,,759_786_OP497,00.html [2006 November 13].
424 Anon. Analog Devices. OP497 Datasheet. Available from: http://www.analog.com/UploadedFiles/Data_Sheets/OP497.pdf [2006 November 06].
425 Anon. 2000 Burr-Brown Product Selection Guide. Available from: http://www.ortodoxism.ro/datasheets/BurrBrown/mXxttvy.pdf [2006 November 13].
426 Anon. Hamamatsu G6262 GaP Photodiode datasheet. Available from: http://sales.hamamatsu.com/assets/pdf/parts_G/G5645_etc.pdf [2006 November 06].
427 Anon. Hamamatsu S1337-1010BQ Datasheet. Available from: http://sales.hamamatsu.com/assets/pdf/parts_S/S1337_series.pdf [2006 November 06].
428 Anon. Hamamatsu S7686 Silicon photodiode datasheet. Available from: http://sales.hamamatsu.com/assets/pdf/parts_S/S7686.pdf [2006 November 06].
429 Anon. OSI Optoelectronics. PIN-10AP Detector-Filter combination fitted for CIE photopic curve. Datasheet available from: http://www.osioptoelectronics.com/products/35-36_DetecFiltComb_OSIOpto.pdf [2006 November 06].
430 Anon. Hamamatsu G1735. Available from: http://sales.hamamatsu.com/en/products/solid-state-division/compound-semiconductors/gaasp,-gap/g1735.php [2006 November 18].
431 Anon. OceanOptics USB4000 USB650 Red Tide Spectrometer for Education Spectrometer. Online brochure. Available from: http://www.oceanoptics.com/Products/usb650.asp [2006 November 13].
432 Anon. OceanOptics USB4000 Miniature Fiber Optic Spectrometer. Online brochure. Available from: http://www.oceanoptics.com/products/usb4000.asp [2006 November 13].
433 Anon. Avantes AvaSpec-102-USB2 Fiber Optic Spectrometer. Online Brochure. Available from: http://www.avantes.com/Spectrometers/AvaSpec102.htm [2006 November 13].
434 Aschoff J. 1995. An attempt toward a “constant routine”: 50 years ago. Bulletin of the Society for Light Treatment and Biological Rhythms 7:39.
435 Youngstedt SD, Kripke DF, Elliott JA, Rex KM. 2005. Circadian phase-shifting effects of a laboratory environment: a clinical trial with bright and dim light. J Circadian Rhythms. 3:11.