chunya district socio-economic profile - … · the united republic of tanzania chunya district...
TRANSCRIPT

THE UNITED REPUBLIC OF TANZANIA
CHUNYA DISTRICTSOCIO-ECONOMIC PROFILE
Joint Publication by:THE PLANNING COMMISSION
DAR ES SALAAMand
CHUNYA DISTRICT COUNCILMBEYA
i
TABLE OF CONTENTS Page
FOREWORD.......................................................................................................................v
SECTION I.......................................................................................................................... 1
1.0 LAND, PEOPLE, CLIMATE AND AGRO ECONOMIC ZONES ...................... 1
1.1 GEOGRAPHICAL LOCATION.........................................................................................1 1.2 LAND AREA....................................................................................................................1 1.3 ADMINISTRATIVE UNITS ........................................................................................4 1.4 DEMOGRAPHIC CHARACTERISTICS ....................................................................5
1.4.1 Ethnic Groups: Chunya District is inhabited by the following ethnic groups: ........................................................................................................................... 5
POPULATION SIZE AND GROWTH........................................................................... 7
1.4.3 POPULATION DENSITY..........................................................................................8 1.4.4 POPULATION DISTRIBUTION ............................................................................12 1.5 CLIMATE AND VEGETATION:...............................................................................18 1.6 TOPOGRAPHY............................................................................................................19 1.7 AGRO - ECONOMIC ZONES ....................................................................................20 1.7.1 GOLD MINE ZONE..................................................................................................20 1.7.2 MIOMBO WOODLAND ZONE.............................................................................20 1.7.3 RUKWA BASIN.......................................................................................................21 1.8 TYPES OF SOIL...........................................................................................................23
SECTION II.......................................................................................................................24
2.0 SOCIAL SERVICES.................................................................................................24
2.1 PRIMARY EDUCATION ...........................................................................................24 2.1.1 GROSS ENROLMENT: (PRIMARY SCHOOL ENROLMENT) ...............................31 2.1.2 STD 1 ENROLMENT...............................................................................................37 2.1.3 PROBLEMS FACING PRIMARY SCHOOL EDUCATION................................41 2.1.4 PRIMARY SCHOOL LEAVERS.............................................................................45 2.1.5 SECONDARY SCHOOL EDUCATION.................................................................48 2.1.6 ADULT EDUCATION.............................................................................................54

ii
2.2 WATER SECTOR........................................................................................................56 2.2.1 INTRODUCTION .....................................................................................................56 2.2.2 WATER SUPPLY SITUATION IN CHUNYA ISTRICT .....................................58 2.2.3 SANITATION...........................................................................................................61 2.2.3 PROBLEMS FACING RURAL WATER SUPPLY...............................................61 2.3 HEALTH SECTOR......................................................................................................62 2.3.1 INTRODUCTION .....................................................................................................62 2.3.2 EXISTING HEALTH FACILITIES .........................................................................62 2.3.3 HEALTH PERSONNEL............................................................................................65 2.3.4 MORBIDITY AND MORTALITY.........................................................................67 2.3.4.1 INFANT MORTALITY RATE............................................................................73 2.3.4.2 MATERNAL MORTALITY RATE....................................................................74 2.3.5 HIV - INFECTION AND AIDS DISEASES ...........................................................76 2.3.6 IMMUNIZATION (PERCENTAGE) COVERAGE IN CHUNYA DISTRICT 1985 AND 1996 ..................................................................................................................78
SECTION III .....................................................................................................................80
3.0 ECONOMIC INFRASTRUCTURE.........................................................................80
3.1 ROADS .........................................................................................................................80 3.2 AIR TRANSPORT.......................................................................................................83 3.3 MARINE TRANSPORT .............................................................................................83 3.4 TELECOMMUNICATIONS.......................................................................................83 3.5 ENERGY........................................................................................................................84 3.5.1 ELECTRICITY...........................................................................................................85 3.5.2 FIREWOOD/CHARCOAL......................................................................................86 3.5.3 OTHER ENERGY POTENTIALS............................................................................86
SECTION IV.....................................................................................................................87
4.0 PRODUCTIVE SECTORS...........................................................................................87 4.1 DISTRICT ECONOMY...............................................................................................87 4.1.1 INTRODUCTION .....................................................................................................87 4.1.2 DISTRICT GDP AND PER CAPITA INCOME....................................................88 4.1.3 EMPLOYMENT........................................................................................................91 4.2.0 AGRICULTURE........................................................................................................92 4.2.1 FOOD CROPS...........................................................................................................94 4.2.2 CASH CROPS .........................................................................................................102 4.2.3 FARM IMPLEMENTS...........................................................................................107

iii
4.1.4 FARM INPUTS.......................................................................................................109 4.2.5 IRRIGATION SCHEMES.......................................................................................111 4.2.6 FOOD STORAGE FACILITIES ............................................................................112 4.3.0 LIVESTOCK DEVELOPMENT.............................................................................114 4.3.1 LIVESTOCK INFRASTRUCTURE.......................................................................119 4.3.2 BEEF CATTLE PRODUCTION............................................................................120 4.3.3 FOOD ADEQUACY AND NUTRITIONAL STATUS......................................120 4.4.1 FOREST...................................................................................................................122 4.4.2 FOREST PRODUCTS.............................................................................................123 4.4.3 BEEKEEPING..........................................................................................................125 4.4.4 FISHERIES...............................................................................................................129 4.4.1 PROBLEMS FACING FISHING INDUSTRY......................................................131 4.5.0 TOURISM................................................................................................................131 4.6.0 MINING...................................................................................................................133 4.6.1 PROBLEMS FACING THE MINING INDUSTRY..............................................135 4.6.2 THE ADVERSE IMPACTS OF MINING.............................................................135 4.6.3 GOLD MINING POTENTIAL...............................................................................136
ANNEX ............................................................................................................................137
1.0 GENERAL INFORMATION ABOUT TANZANIA...........................................137
AREA OF MAINLAND .................................................................................................137 TANZANIA MAINLAND AREA BY REGIONS (SQ KM)......................................137
POPULATION...............................................................................................................138
TOTAL POPULATION AND LIFE EXPECTANCY FOR TANZANIA - BY REGIONS, 1967, 1978, 1988, 1996.........................................................................138
LAND USE......................................................................................................................139
ARABLE LAND.............................................................................................................139
LAKES .............................................................................................................................139
MOUNTAIN SUMMITS (METRES ABOVE SEA LEVEL).....................................139
CLIMATE........................................................................................................................141

iv
(A) RAINFALL ..................................................................................................................141
1.2 SOCIAL SERVICES ...............................................................................................143
HEALTH FACILITIES ....................................................................................................143 EDUCATION: ENROLMENT RATES 1990 COMPARED WITH OTHER EAST AFRICA
COUNTRIES.......................................................................................................................143
NATIONAL PARKS .....................................................................................................144

v
FOREWORD 1.0 In the Fiscal Year 1996/97 the Government started to
implement its decision of restructuring regional administration and putting in place Local Authorities which are well performing in the way of championing development and delivering of economic and social services to the people. Hitherto (July 1997), the Local Authorities in the country are fragmented, not clear about their mission and as a matter of fact lack skilled manpower, financial resources and basic working equipment.
2.0 Thus, the government move is in the right direction, aimed
at bringing closer to the people the decision making process which entails genuine participation, democracy and self governance as well as the implementation of various development programmes. This is a major shift from the traditional approach of regional focus to current the district focus planning and implementation with final goal of devolving powers to ward and village levels.
3.0 In order to ensure an effective devolution of power, the
Local Authorities have to be provided with well trained and qualified staff and the necessary support needed at that level. Staffed with the competent personnel, the Local Authorities are expected as hinted above to prepare and implement their own development plans, which by and large will make use of the existing, locally available resources.
vi
4.0 The availability of reliable, adequate, qualitative and relevant data and information at district level is a prerequite for the success of the Local Authorities in their new role of formulating, planning, implementing, monitoring and evaluating their development programmes. The publication of District Socio- Profiles Series by the Planning Commission in close collaboration with relevant Local Authorities should be viewed as modest attempt towards finding solutions to the existing problem of data and information gap at local levels.
5.0 I would like to take this opportunity to acknowledge with
thanks, the financial support of the Royal Danish Embassy which facilitated the preparation of Chunya District Socio-Economic Profile. I would also like to thank both the Planning Commission and Chunya Council staff who devoted a lot of effort into ensuring the successful completion of this assignment.
Nassoro W. Malocho (MP)
MINISTER OF STATE PLANNING AND PARASTATAL SECTOR REFORM

vii
September, 1997
Dar es Salaam

1
SECTION I
1.0 LAND, PEOPLE, CLIMATE AND AGRO ECONOMIC ZONES
1.1 Geographical Location
Chunya district is located in the North - Western part of Mbeya
Region. The district is among the seven (7) districts of Mbeya region and it lies between 7o and 9o Latitudes South of the Equator, and between 32o and 34o Longitudes East of Greenwich.
The district is bordered by Singida and Tabora regions to the
North; Iringa region and Mbarali districts to the East; Mbozi and Mbeya districts to the South; Rukwa region and lake Rukwa to the West.
1.2 Land Area
The district has a total area of 29,219 sq.kms. (29,219,000 ha.) of
which 28,114 sq.kms. (28,114,000 ha.) is land and 1,705 sq.kms. (1,705,000 ha.) is covered with water including rivers Songwe, Lupa, Zira and Part of Lake Rukwa which constitute the inland water bodies. The total land area of the district is classified as shown in Tables I(a), I(b) and charts 1 and 2 below:
TABLE I (a): LAND CLASSIFICATION IN CHUNYA DISTRICT

2
Classification Area in Sq. Kms.
Area in Ha.
Area Share (%)
Arable land Game Reserves Forest
Reserves
Water bodies Others
23,005 2,000 396.4
1,105 2,712.6
3,005,000 2,000,000
396,400 1,105,000 2,712,600
78.73 6.85 1.36 3.78 9.28
Source: Chunya district Council
Chart 1: Land Classification in Sq. Km in Chunya District

3
Game reserves7%
Arable land79%
Water bodies4%
Others9%
Forest reserves1%
Table I (a) shows that, more than 3/4 of the district land is arable
land, while in table I (b) indicates that Chunya district is the largest district in Mbeya region compared to other districts.
Table I: (b) DISTRICTS OF MBEYA REGION AND THEIR AREA
District Area in Sq.kms Regional share (%)
Chunya Mbeya Urban Kyela Ileje Rungwe Mbozi Mbeya Rural
29,219 185
1,322 1,908 2,211 9,679
19,098
46.0 0.3 2.0 3.0 3.5
15.2 30.0
Total 63,622 100.0

4
Source: Mbeya Regional Socio - Economic profile.
Chart 2: Distribution of Land use in Mbeya Region by District
Chunya 45.9%
Mbeya Urb .3%
Kyela 2.1%
Ileje 3%
Rungwe 3.5%
Mbozi 15.2%
Mbeya Rur 30%
1.3 ADMINISTRATIVE UNITS
Administratively, Chunya district is divided into four (4) divisions
namely: Kiwanja, Kipembawe, Kwimba and Songwe. The four divisions are sub - divided into 22 wards in total, and the wards are further sub-divided into 69 villages, as Table II below depicts.
Table II (a): LAND AREA AND ADMINISTRATIVE UNITS
Divisions Land area Sq.kms.
Number of
Wards
Number of Villages

5
Kiwanja Kipembawe Kwimba Songwe
4,383 8,766
10,226 5,844
6 6 5 5
19 15 14 21
Total 29,219 22 69
Source: Chunya District Council.
1.4 DEMOGRAPHIC CHARACTERISTICS
1.4.1 Ethnic Groups : Chunya District is inhabited by the following ethnic groups:
(i) Kimbu: Occupying North - West of the district, in Kwimba and
Kipembawe divisions. (ii) Bungu: In the South - West, Songwe division. (iii) Guruka (Semi - Wasafwa): In the South - East of the district,
most of Kiwanja and Kipembawe divisions. (iv) Others:Most of these are settlers from other parts of the
neighbouring districts and regions, which include Nyakyusa, Nyamwezi, Sukuma and Hehe.
The following table II(b) shows their locations with their main
occupations. TABLE II (b): ETHNIC GROUP, THEIR LOCATIONS AND
MAIN ECONOMIC ACTIVITIES:

6
Ethnic Group Locations Main Economic Activities
1. Kimbu - Wasongwe
Along Rukwa Basin (North-West Chunya)
Fishing, Livestock keeping
2. Bungu South-West - along Songwe and Zira River Valleys
Agriculture, Livestock keeping; (Cotton growers)
3. Guruka- Assimilated Wasafwa
East and South-East - Kiwanja and Kipembawe
Agriculture and Mining
4. Mixed ribes - Nyakyusa - Nyamwezi - Hehe - Sukuma etc.
These are found in all district Settlement areas - especially in mining areas, Tobacco and Cotton growing areas and in Urban Settlements.
These fit in a variety of socio-economic activities (agriculture, herdsmanship, bee-keeping, mining and trading.
Source: Chunya District Council.
7
POPULATION SIZE AND GROWTH According to 1967, 1978 and 1988 National Population Census
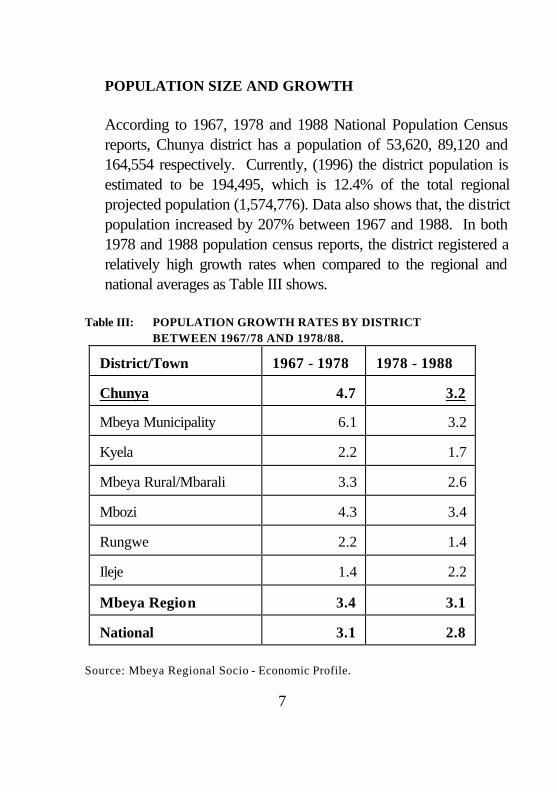
reports, Chunya district has a population of 53,620, 89,120 and 164,554 respectively. Currently, (1996) the district population is estimated to be 194,495, which is 12.4% of the total regional projected population (1,574,776). Data also shows that, the district population increased by 207% between 1967 and 1988. In both 1978 and 1988 population census reports, the district registered a relatively high growth rates when compared to the regional and national averages as Table III shows.
Table III: POPULATION GROWTH RATES BY DISTRICT BETWEEN 1967/78 AND 1978/88.
District/Town 1967 - 1978 1978 - 1988
Chunya 4.7 3.2
Mbeya Municipality 6.1 3.2
Kyela 2.2 1.7
Mbeya Rural/Mbarali 3.3 2.6
Mbozi 4.3 3.4
Rungwe 2.2 1.4
Ileje 1.4 2.2
Mbeya Region 3.4 3.1
National 3.1 2.8 Source: Mbeya Regional Socio - Economic Profile.

8
Chart 3: Population Growth Rates by District between 1967/78 and 1978/88 in Mbeya Region
0
2
4
6
8
1967 - 1978 1978 - 1988
The 1988 population census also shows that the district average
household size was 5.0 which was slightly higher than the regional average of 4.9 persons per household, but lower than the national average of 5.2 persons.
1.4.3 POPULATION DENSITY Compared with other districts in Mbeya region, Chunya is the least
populated district with the population density of six (6) persons per sq.km. (See Table IV(a) and Chart 3 below). Generally speaking Chunya may be one of the least populated district in Tanzania. This parameter other things being equal indicates that, the district has

9
enough potential land for farming, livestock keeping and other economic activities.

10
Table IV (a): POPULATION DENSITY BY DISTRICT IN MBEYA REGION
District
Area (Sq.kms) Population 1988 Popul-ation
Density 1988
Population
Estimate 1995 Popul-ation
Density 1995
Chunya 29,219 164,554 6 194,495 7
Ileje 1,908 88,436 47 103,328 54
Mbeya (R) Mbarali
19,098 332,430 17 339,379 18
Mbeya (U) 185 152,199 826 190,005 1,027
Mbozi 9,679 330,282 34 420,771 43
Kyela 1,322 135,645 103 152,022 115
Rungwe 2,211 272,008 123 299,379 135
Total 63,622 1,476,345 23 1,759,814 28
Source:Mbeya Regional Socio - Economic profile.
Chart 4: Population 1988 and Population Estimate 1995 by District in Mbeya Region Thousands
11
Chunya Ileje Mbeya (R) Mbeya (U) Mbozi Kyela Rungwe0
100
200
300
400
500Population 1988
Population Estimate 1995
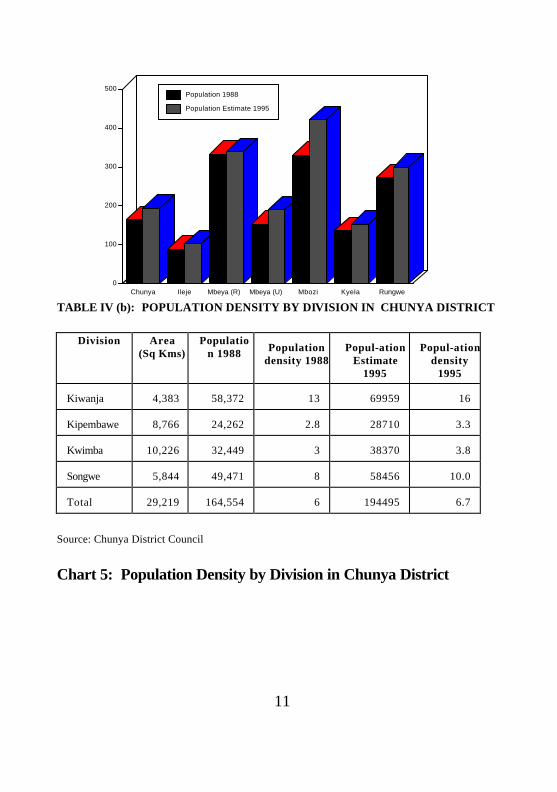
TABLE IV (b): POPULATION DENSITY BY DIVISION IN CHUNYA DISTRICT
Division Area (Sq Kms)
Population 1988 Population
density 1988Popul-ation
Estimate 1995
Popul-ation density
1995
Kiwanja 4,383 58,372 13 69959 16
Kipembawe 8,766 24,262 2.8 28710 3.3
Kwimba 10,226 32,449 3 38370 3.8
Songwe 5,844 49,471 8 58456 10.0
Total 29,219 164,554 6 194495 6.7
Source: Chunya District Council
Chart 5: Population Density by Division in Chunya District

12
Kiwanja Kipembawe Kwimba Songwe
0
3
6
9
12
15
Table IV (b) above indicates gradual changes in population densities. Kiwanja division shows the highest densities due to mining activity in the division - which has drawn in many people from within and outside the district.
Chunya shows a pronounced effect of the immigration process. It is now a common phenomenon that new settlements are being established in Songwe and Kipembawe divisions by the incoming of herdsmen and Cotton/Tobacco growers from Tabora, Shinyanga, Singida and Arusha regions. Movements from the Southern Regions are normally seasonal. Farmers open up new land for cotton and tobacco growing whereas herdsmen move into wooded grassland areas - both changing the natural environment of the district.
1.4.4 POPULATION DISTRIBUTION
13
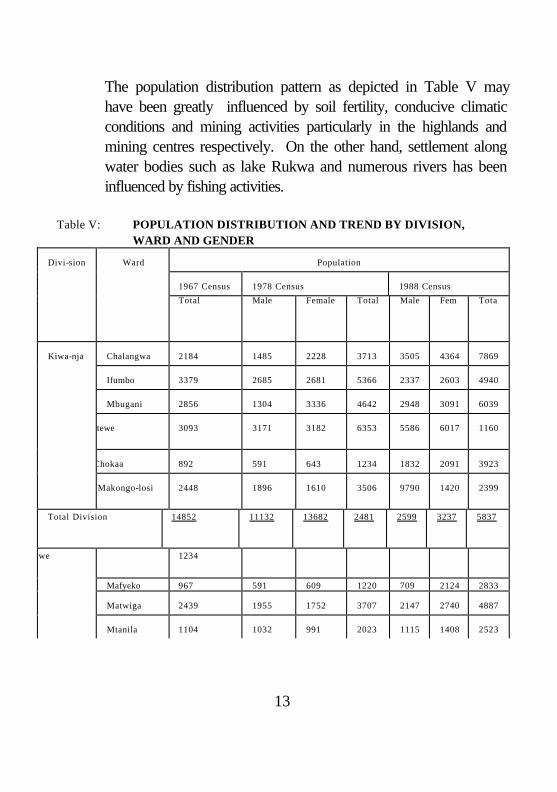
The population distribution pattern as depicted in Table V may have been greatly influenced by soil fertility, conducive climatic conditions and mining activities particularly in the highlands and mining centres respectively. On the other hand, settlement along water bodies such as lake Rukwa and numerous rivers has been influenced by fishing activities.
Table V: POPULATION DISTRIBUTION AND TREND BY DIVISION,
WARD AND GENDER
Divi-sion Ward Population
1967 Census 1978 Census 1988 Census
Total Male Female Total Male Fem Tota
Kiwa-nja Chalangwa 2184 1485 2228 3713 3505 4364 7869
Ifumbo 3379 2685 2681 5366 2337 2603 4940
Mbugani 2856 1304 3336 4642 2948 3091 6039
Itewe 3093 3171 3182 6353 5586 6017 1160
Chokaa 892 591 643 1234 1832 2091 3923
Makongo-losi 2448 1896 1610 3506 9790 1420 2399
Total Division 14852 11132 13682 2481 2599 3237 5837
mbawe 1234
Mafyeko 967 591 609 1220 709 2124 2833
Matwiga 2439 1955 1752 3707 2147 2740 4887
Mtanila 1104 1032 991 2023 1115 1408 2523

14
Divi-sion Ward Population
1967 Census 1978 Census 1988 Census
Total Male Female Total Male Fem Tota
L/Tinga-tinga
3805 3874 4078 7952 4608 4649 9257
Luwalaje 1550 1060 966 2036 1958 2195 4153
Total Division 11099 9248 9217 1846 9292 1497 2426
Kwi-mba Ngwala 772 474 491 965 570 641 1211
Gua 2397 1748 1869 3617 1767 1919 3586
Kapalala 2482 1913 1811 3724 2007 2129 4136
Mbangala 1611 1119 1080 2199 1661 1695 3356
Mkwajuni 3408 3413 3714 7127 9896 1026 2016
Total division 10670 8667 8965 1763 1590 1654 3244
Songwe Namkukwe 2669 2145 2154 4299 3445 3817 7292
Totowe 3064 2632 2587 5219 3689 3733 7422
Mbuyuni 4307 3387 3652 7039 5501 5844 1134
Galula 2944 2407 2636 5043 5281 5796 1107
Kanga 4013 3304 3304 6608 6086 6249 1238
Total Division 16997 13875 14333 2820 2403 2543 4947

15
Divi-sion Ward Population
1967 Census 1978 Census 1988 Census
Total Male Female Total Male Fem Tota
Total District 53,618 42,992 46,197 89,11 75,2 89,3 164,5
Source: Population Census 1978 and 1988.
Table VI: POPULATION EXPANSION AND PROJECTION BY DIVISION & WARDS 1967 - 1995
Division Wards Census Project-ion
1967 1978 1998 1995
Kiwanja Chalongwa 2184 3713 7869 9285
Ifumbo 3379 5366 4940 5829
Mbugani 2856 4642 6039 7126
Itewe 3093 6353 11603 13773
Chokaa 892 1234 3923 4629
Makongolos i
2448 3506 23998 28317
Total Division 14852 24814 58372 69959
Kipembawe K/Katoto 1234 1557 2762 3259

16
Division Wards Census Project-ion
1967 1978 1998 1995
Mafyeko 967 1220 2833 3043
Matwiga 2439 3707 4887 5066
Mtanila 1104 2023 2523 2777
L/Tingatinga
3805 7952 9257 10023
Luwalaje 1550 2026 4153 4542
Total Division 11099 18465 24262 28710
Kwimba
Ngwala 772 965 1211 1511
Gua 2397 3617 3586 4231
Kapalala 2482 3724 4136 4880
Mbangala 1611 2199 3356 3960
Mkwajuni 3408 7127 20160 23788
Total Division 10670 17632 32449 38370
Namkukwe 2669 4299 7292 8628
Totowe 3064 5219 7422 8757
Mbuyuni 4307 7039 11345 13387
Galala 2944 5043 11077 13070
Kanga 4013 6608 12385 14614
Songwe Division 16997 28208 49471 58456

17
Division Wards Census Project-ion
1967 1978 1998 1995
Total district 53,618 89,119 164,554 194,495
Source: Population Census 1978, 1988. Table V shows that, both 1978 and 1988 population censuses, Chunya district had more women than men. About 51.8% and 54.3% of the total population in 1978 and 1988 respectively were women. Table VI shows that, the most densely populated wards include: Kanga, Mbuyuni, Galula, L/Tingatinga, Itewe and Mbuyuni.
Table VII: POPULATION DISTRIBUTION BY BROAD AGE GROUPS
1978 1988 1995
Age Group (Years)
Total % Total % Total %
0 - 5 14,705 16.5 27,974 17 36,760 18.9
6 - 15 24,062 27 42,784 26 67,101 34.5
16 - 25 13,724 15.4 29,620 18 31,119 16
26 - 55 25,934 29.1 49,696 30.2 50,374 25.9
Over 55 10,694 12 14,480 8.8 9,141 4.7
Total 89,119 100 164,554 100 194,495 100

18
Chart 6: Population Distribution by Broad Age Groups (Years)
Thousands
0 - 5 6 - 15 16 - 25 26 - 55 Over 55
0
20
40
60
80
1978 1988 1995
1
Table VII and Chart 4 above shows that about 18% of Chunya district population were youth aged between 16 and 25 years (1988) whereas the dependent group (0 - 15) and people who are over 55 years old constitute 8.8% of the total population (1988) while 30.2% comprises the working group age (26 - 55 years).
1.5 CLIMATE AND VEGETATION:
The district average temperature ranges between 21o centigrade
and 23o centigrade annually and this is very much influenced by physiography and altitude. Mean annual rainfall ranges from 600 mm. and 1000 mm. Normally the peak period of heavy rains is recorded during the months of December and March almost every

19
year. Despite the fact that about 78% of the total land is arable it is estimated that only 2% of the land is currently under cultivation. This indicates that, a large portion of land is still covered by natural vegetation. The most predominant natural vegetation is miombo woodlands, with vast areas in Kwimba and Kipembawe Divisions. Common vegetative species include those of branchystigea, dalbegia, Pteracarpus. Overgrazing, gold mining and agriculture have seriously reduced the natural ecology of the district. Settled areas are now coming up with siamea (mijohoro) trees.
1.6 TOPOGRAPHY
Chunya district is characterized by a hilly landscape (Stretching
from Mbeya hills with a gentle slope mostly covering the Kiwanja division) with thick forests, miombo woodlands, scattered trees, bush and thickets. Also the district has flat low lands along lake Rukwa basin; and plateau between Ibagu plains and that of lake Rukwa and Chunya mountain range. The main permanent drainage system include rivers Songwe, Lupa and Zira all originating from Mbeya hills. On the other hand 18 non -permanent rivers (seasonal) exist and mostly flow during rainy season. Commonly known sources of those rivers include Chunya mountain range and Mbeya hills.

20
1.7 AGRO - ECONOMIC ZONES The district has been classified into three Agro - Economic Zones,
namely:
1.7.1 GOLD MINE ZONE
Location This zone covers Kiwanja and part of Kwimba divisions - i.e. the
central part of Chunya and Msangani Plateau. General features It is characterized by hills and gentle slopes. Economic activities Main economic activities carried out here include agriculture which
is characterized by growing of maize, beans, millet, cassava potatoes sorghum, groundnuts and sunflower. Other activities are livestock keeping, mining (Gold) and forest products (timber, honey and beeswax).
1.7.2 MIOMBO WOODLAND ZONE
Location This zone covers the Kipembawe division and part of Kwimba
division - i.e. the North Chunya Plain.

21
General features The area is characterized by thick forests, miombo woodlands,
scattered trees, bush and thickets. Economic activities Major crops grown are tobacco, sunflower, maize, beans, millet,
cassava, potatoes, groundnuts and sorghum. Other activities include livestock keeping and forest products.
1.7.3 RUKWA BASIN
Location This includes the whole area of Songwe division, forming what is
called the Rukwa Rift Valley. General features The zone is characterized by flat low lands drained by rivers from
the Gold Mine zone and flows into lake Rukwa. Economic activities

22
Major crops grown are cotton, sunflower, sorghum, maize, beans, millet, cassava, potatoes and groundnuts. Other economic activities are livestock keeping, fishing and forest products.

23
1.8 TYPES OF SOIL
Agro-Economic
Zone
Mean Altitude
(Masl) RAINFAL
Soil Types
Mean Ann-ual (mm)
No. of Wet
Months
GOLD MINE ZONE -The Central Chunya and Msangaji Plateau. (Kwimba and Kipem-bawe Divisions)
1000 - 1500 600 - 900 4 - 5 Sandy with low fertility soils of traces of ferralic arenosols and red sand. • Suitable for tobacco, maize, sorghum, fingermillet, cassava, groundnuts - along with beekeeping and hunting activities.
RUKWA BASIN -The Rukwa Rift Valley Basin (Kwimba, Songwe, Kiwanja Divisions)
800 - 1200 750 - 800 4 - 5 Sandy, Sodic, low and/or medium fertility, with Eutric Regosols, Coarse textured with entric cambisols and eutric fluvisols. These are suitable for maize, sorghum, fingermillet, cotton, cowpeas, groundnuts, cassava, and keeping of cattle, pigs, goats and fishing from Lake Rukwa.
MIOMBO WOODLAND ZONE -The Central Chunya and Msangaji Plateau. (Kwimba, Songwe and Kiwanja Divisions) or The Chunya Plain.
1400 - 1800 750 4 - 6 Shallow stony with low fertility. These have deep quarts dominated sands of Albic Arenosols with Orthic ferralsols, Ferralic Arenosols and Ferralic Cambisols. They occur as red sand, pale sand, good for flue-cured tobacco, maize, sorghum, fingermillet, sweet potatoes, cassava, groundnuts along with cattl and beekeeping and gold mining. - Have wooded grasslands of: Acacia commiphora bushlands and of Brachystegia Julbernadia woodland.

24
SECTION II
2.0 SOCIAL SERVICES 2.1 PRIMARY EDUCATION By the end of 1995 there were 71 registered primary schools in
Chunya district solely owned by Government. This shows an increase of approximately 1 school on average annually from 1965. On the other hand, in 1995, 23,135 pupils were enrolled. This indicates an increase of approximately 537 pupils on average annually from 1965. Tables VIII(a), VIII(b), IX and Chart 5 below indicates expansion of primary education in Chunya district.
Table VIII (a): EXPANSION OF PRIMARY EDUCATION
Year Number of
Schools Regist-
ered
Number of pupils Ownership
Boys Girls Total
1965 33 4122 2891 7013 Mission and Government
1975 44 7863 6898 14761 Government
1985 51 9816 8134 17950 Government
1995 71 11931 11204 23135 Government Source: District Education Office - Chunya 1996.

25
Chart 7: Expansion of Primary Education by Sex, 1965, 1975, 1985 and 1995
Thousands
1965 1975 1985 19950
3
6
9
12
Boys Girls
Table VII (a) depicts that, between 1975 and 1985 Chunya District had relatively slow increase in number of primary schools (15%). Equally within the same period there was a relatively slow increase in the number of pupils enrolled (21%).

26
TABLE VIII (b): EXPANSION OF PRIMARY EDUCATION BY DIVISION Division
1965 1975
Boys Girls Total Boys Girls Total
Kiwanja 1213 722 1935 2165 2527 4692
Kipembawe 1677 666 2343 1918 2188 4106
Kwimba 1314 811 2125 1968 1511 2479
Songwe 918 692 1610 1812 1672 2484
Total District
4122 2891 7013 7863 6898 14761
Kiwanja 3781 3982 7763 3394 2578 5972
Kipembawe 2295 2181 4476 2307 2359 4666
Kwimba 2128 2164 4292 2577 2305 4882
Songwe 2612 1917 4529 3653 3962 7615
Total District 9816 8134 17950 11931 1120 23135
Division No of Schools
1965 1975 1985 1995
Kiwanja 13 14 14 21
Kipembawe 6 10 12 17
Kwimba 8 10 13 15
Songwe 6 10 12 18

27
Total District
33 44 51 71
Source: District Education Office - Chunya
Table VIII (b) shows that, Kiwanja division was leading in 1995 in both the number of primary schools and the total number of pupils enrolled followed by Songwe division.
Table IX: PRIMARY SCHOOL ENROLMENT TREND IN
STANDARD I BY SEX FOR 1990 - 1995
Year
Eligible Actual Enrolment Not
Enrolled
Boys Girls Total
1990 1,885 811 821 1,632 253
1991 1,966 834 863 1,697 269
1992 1,986 811 777 1,588 398
1993 1,993 932 879 1,811 182
1994 2,585 1,110 1,374 2,484 101
1995 3,606 1,304 1,303 2,607 998
Source: District Education Office - Chunya 1996. Chart 8: Primary School Enrolment Trend in Standard I by Sex for 1990 - 1995 in Chunya District

28
1990 1991 1992 1993 1994 19950
300
600
900
1200
1500
Boys
Girls
Chart 9: Comparison between Eligible and Actual Enrolment Trend in Chunya Standard I Enrolment; 1990 - 1995
1990 1991 1992 1993 1994 19950
1000
2000
3000
4000
Eligible
Actual Enrolment
It is observed in table IX that in 1995 that the number of pupils
who were eligible, but not enrolled, increased sharply from 101 in 1994 to 998 in 1995. Such a sharp rise could be attributed to a number of reasons such as inadequate allocation of financial resources, acute shortage of teachers' houses, classrooms, teaching materials and text books etc.

29

30
TABLE X: PRIMARY SCHOOL ENROLMENT TREND IN STD I BY SEX AND DIVISION, 1990-1995
Division 1990 1991
Boys Girls Total Boys Girls Total
Kiwanja 231 215 446 225 232 457
Kipembawe 235 226 461 134 165 397
Kwimba 181 249 430 241 225 466
Songwe 234 231 465 234 241 475 Division 1992 1993
Boys Girls Total Boys Girls Total
Kiwanja 234 254 488 242 241 483
Kipembawe 226 165 391 354 200 554
Kwimba 215 155 370 200 201 401
Songwe 246 203 449 236 237 473
Division 1994 1995
Boys Girls Total Boys Girls Total
Kiwanja 341 351 692 336 43333 76969
Kipembawe 251 336 587 304 303 607
Kwimba 296 533 829 331 334 665
Songwe 322 354 676 433 333 766
Source: District Education Office - Chunya
Table IX (b) indicates that in 1990 Songwe division enrolled more
standard one pupils than other division, while in 1995 Kiwanja division enrolled more pupils than other divisions.

31
2.1.1 GROSS ENROLMENT: (Primary School Enrolment) For the country as a whole, Gross Enrolment Rate which is defined
as the number of children in school divided by the number of children in the School age group. The data shows that, gross national enrolment rose rapidly from 1974 and reached its climax of about 90% in 1981 and remaining stable at that level for four consecutive years (1984).
By the year 1996 the total enrolment rate for the whole country had
declined to an average level of 74%. Mbeya region with 826 primary schools is capable of enrolling 372,375 pupils in classes I - VII with a total of 8,275 streams against the actual enrolment of 282,860 pupils (1995).
In Chunya district, for example, only 71.4% of the available places
in its 71 primary schools has been utilized effectively. Table XI indicates that, places in primary schools are being more effectively utilized in Mbeya Municipality (86.5%), Mbozi (80%), and Rungwe (81%) districts compared to Chunya, Ileje, Kyela districts whose utilization capacities in 1995 are estimated at 71.4%, 73.5% and 71.3% respectively.

32
Table XI: PRIMARY SCHOOL TOTAL ENROLMENT RATES BY DISTRICT IN MBEYA REGION, 1995
District No. of
Schools Streams Enrolment
Capacity Pupils
Enrolled Utilization
% Chunya 71 720 32,400 23,135 71.4
Ileje 74 630 28,350 20,836 70.5
Kyela 91 845 38,010 27,100 71.3
Mbeya (U) 44 880 39,600 34,244 86.5
Mbeya (R) 179 1,680 75,600 57,271 75.8
Mbozi 177 1,772 79,740 63,622 80
Rungwe 190 1,748 78,660 56,652 81
Total 826 8,275 372,375 282,860 76 Source: Planning Commission Compiled Data - Regional Education Office.
Chart 10: Primary School Enrolment Rates by District in Mbeya Region, 1995
Thousands
Chunya Ileje Kyela Mbeya (U) Mbeya (R) Mbozi Rungwe
0
20
40
60
80
100
Enrolment Capacity
Pupils Enrolled

33
Table XII below shows that in Mbeya region, enrolment was fairly balanced for both sexes. However, contrary to other districts like Mbozi and Mbeya (R), table XII shows that, Chunya district enrolled more boys from standard I - VII in 1995 than girls.
Table XII: PUBLIC PRIMARY SCHOOL ENROLMENT IN MBEYA
REGION BY DISTRICT, SEX AND CLASS - 1995
District SEX STD I STD II - STD VII
Total
Chunya M 2,288 9,694 11,982
F 2,128 9,025 11,153
Ileje M 1,778 8,589 10,367
F 1,719 8,750 10,469
Kyela M 2,985 1,165 14,750
F 2,873 10,659 13,532
Mbeya (U) M 3,016 13,211 16,227
F 3,199 14,818 18,017
Mbeya (R) M 5,335 23,306 28,614
F 5,308 17,971 28,657
Mbozi M 5,981 25,801 31,782
F 6,047 25,793 31,840
Rungwe M 5,384 23,191 28,575
F 5,244 22,836 28,080
Total M 52,46 230,393 282,860
Source: Regional Education Office - Mbeya.

34
Chart 11: Public Primary School Enrolment in Chunya District by Sex and Class - 1995
Std I Std II - Std VII0
2000
4000
6000
8000
10000
Male Female
TABLE XIII: PRIMARY SCHOOL TOTAL ENROLMENT RATES BY DIVISION IN CHUNYA DISTRICT, 1995
Division
No of
Schools
Streams
Enrol-ment
capacity
Pupils
Enrolled
Utili-
zation %
Kikwanja 21 232 10440 8519 81.6
Kipembawe 17 144 6480 3680 56.8
Kwimba 15 176 7920 5060 63.9
Songwe 18 168 7560 5876 77.7
Total Districts
71 720 32400 23135 71.4

35
Source: District Education Office - Chunya
Chart 12: Primary Scholl Total Enrolment by Division in Chunya District, 1995
Kikwanja Kipembawe Kwimba Songwe0
2
4
6
8
10
Enrolment Pupils Enrolled
It is noted in Table XIII that Kiwanja division had the highest
percentage utilization of its enrolment capacity (81.6%) followed by Songwe division (77.7%).

36
Table XIV: PRIMARY SCHOOL ENROLMENT IN CHUNYA DISTRICT BY CLASS AND SEX 1995
Class
Boys
Girls
% of Girls
Total
STD I 2308 2206 48.9 4514
STD II 2023 1865 47.9 3888
STD III 1799 1554 46.3 3353
STD IV 1767 1554 46.8 3321
STD V 1570 1548 49.6 3118
STD VI 1231 1196 49.3 2427
STD VII 1304 1308 50.1 2612
Total 11982 11153 48.2 23135
Source: Mbeya Regional Socio - Economic Profile.
Chart 13: Primary School Enrolment in Chunya District by Class and Sex 1995

37
Std I Std II Std III Std IV Std V Std VI Std VII
0
500
1000
1500
2000
2500
Boys Girls
2.1.2 STD 1 ENROLMENT
Table XV indicate that, out of 66,759 children who were eligible to
join standard I in Mbeya region in the year 1995 only 53,285 which is 79.8% were registered. Chunya and Ileje districts seem to have the lowest enrolment rates of 67.4% and 63.3% respectively.

38
TABLE XV: STD ONE ENROLMENT RATE BY DISTRICTS IN MBEYA REGION, 1995
District Registered Eligible Enrolment %
Boys Girls Total
Ileje 1778 1719 3497 5521 63.3
Kyela 2985 2873 5858 8604 68.1
Mbozi 5981 6047 12028 13379 89.9
Chunya 2288 2128 4416 5760 76.7
Rungwe 5384 5244 10628 11880 89.5
Mbeya (U) 3016 3199 6215 6633 93.7
Mbeya (R) 5335 5308 10643 14190 75.0
Region 26,767 26,518 53,383 66,759 79.8
Source: Planning Commission Compiled Data based Mbeya Regional Socio - Economic Profile and District Education Offices.
Chart 14: Distribution of Std I Enrolement by District in Mbeya Region, 1995
Ileje 11.3%
Kyela 12.2%
Mbozi 16.2%
Chunya 13.8%
Rungwe 16.2%
Mbeya (U) 16.9%
Mbeya (R) 13.5%

39
TABLE XVI: STANDARD I SCHOOL ENROLMENT BY WARD AND SEX - 1995
Ward
No. of Children Eligible
No. of Actual Registered
Enrolment Rate (%)
Boys Girls
Total
Boys Girls
Total
KIWANJA:
Chalangwa 134 188 322 163 158 321 99.6
Ifumbo 82 63 145 72 52 124 85.5
Mbugani 112 92 204 88 103 191 93.6
Itewe 200 192 392 117 135 252 64.6
Chokaa 122 157 279 128 127 255 91.5
Makongolosi 252 182 434 242 264 506 116.5
KIPEMBAWE:
Kambikatoto 27 38 65 26 27 53 81.5
Mafyeko 75 70 145 54 60 114 78.6
Matwiga 142 94 236 64 77 141 59.7
Mtanila 97 78 175 23 14 37 21.1
Lupa-Tingatinga
166 169 335 197 200 397 118.5
Luwalaje 34 58 92 43 40 83 90.2
KWIMBA:
Ngwala 39 34 73 35 34 69 94.5
Gua 40 38 78 49 40 89 114.1
Kapalala 79 65 144 69 61 130 90.2

40
Ward
No. of Children Eligible
No. of Actual Registered
Enrolment Rate (%)
Boys Girls
Total
Boys Girls
Total
Mbangala 49 38 87 38 44 82 94.2
Mkwajuni 221 218 439 222 205 427 97.2
SONGWE:
Namkukwe 104 91 195 81 58 139 71.2
Totowe 127 99 226 158 119 277 122.5
Mbuyuni 279 216 495 112 105 217 43.6
Galula 143 97 240 118 109 227 94.5
Kanga 160 148 308 209 174 383 124.5
Total 2688 2426 5114 2308 2206 4514 88.3
Source:District Education Office - Chunya. TABLE XVII: STD ONE ENROLMENT RATE FROM 1991 - 96 IN CHUNYA DISTRICT
Division
Eligible children Registered Pupils Enrolment %
Boys Girls Total
1991 2127 2628 5355 Boys
Girls Total
62.4
1721 1622 3343
1992 2633 2407 5040 2235 2008 4243 84.2
1993 2302 2333 4635 1823 1854 3671 79.2

41
1994 2589 2454 5130 2026 1978 4004 78.0
1995 2688 2426 5114 2308 2206 4514 88.3
1996 2463 2442 4905 2093 2072 4165 84.9
Source: District Education Office - Chunya
Chart 15: Eligible Children in Std I by Sex from 1991 - 1996 in Chunya District
Thousamds
1991 1992 1993 1994 1995 1996
0
1
2
3
4
Boys Girls
2.1.3 PROBLEMS FACING PRIMARY SCHOOL EDUCATION (i) Inadequate Education facilities The size and the quality of Primary Education in the district has
been falling mainly because of deteriorating school infrastructure as a major problem facing most of primary schools in the district. This poor performance of the Education Sector in the district was also

42
identified by the Inspectorate Division in its report as Table XVI below shows.
2 Table XVIII: PRIMARY SCHOOL EDUCATION FACILITIES IN CHUNYA DISTRICT YEAR 1996
Main Facilities Required Available Defici % Deficit
Classrooms 310 170 140 45
Teachers Houses 285 202 83 29
Toilets/Pit hole/Latrines
2880 1289 1591 55
Desks 4591 3121 1470 32
Tables 430 359 71 16
Chairs 479 310 169 35
Grade III A Teachers
382 191 191 50
Grade III B Teachers
486 396 90 19
Source: Chunya District Education Office - Inspectorate Division.
Chart 16: Primary School Education Requirements in Chunya District, 1996

43
100
1100
2100
3100
4100
As shown in Table XVI the district has a shortfall of 191 Grade III
A teachers (50%). The district has also a shortage of 1470 desks (32%), 140 classrooms (45%) and 83 teachers houses (29%). The (5%) shortage of Grade III A teachers and 32% shortage of desks means that less teaching materials are covered and most pupils, are taking notes while sitting on the floor or bricks/stones. The acute shortage of classrooms and teaching materials has negatively affected the performance of students which is also reflected in the numbers of those who are selected to join secondary schools. Table XIX: EDUCATION FACILITIES AND SERVICE RATIO IN CHUNYA DISTRICT 1996
Relationship National Standard Ratio
District Ratio
Pupils/Teachers 45:1 39:1
Pupils/Classrooms 45:1 136:1
Teachers/Staff quarters 1:1 3:1

44
Pupils/School desks 3:1 7:1
Source: District Education Office - Chunya.
Table XIX above indicates that, the district pupils/teachers ratio is
better (39:1) than the national standard ratio of (45:1). On the other hand, the district pupils/classrooms ratio is worse (136:1) than the national standard ratio (45:1).
(ii) Drop - Outs The problem of drop - outs in primary schools in the district is 4%
on average between 1990 - 1995. According to the available data in 1995, about 606 girls and 497 boys could not manage to continue with their primary education. The main reasons for high dropouts could be attributed to as; early marriages, truancy, pregnancies, petty trading, nomadic type of life especially for livestock keepers in the Usangu Basin etc. Table XX shows that primary school drop outs among girls rose from 44.1% in 1990 to 54.9% in 1995 while that of boys fell from 55.9% in 1990 to 45.1% in 1995.
3 Table XX: DROP OUTS BY SEX BETWEEN 1990 - 1995
Year Total Boys % Girls %
1990 553 309 55.9 244 44.1
1991 588 324 55.1 264 44.9
1992 398 237 59.6 161 40.5
1993 182 96 52.7 56 30.8
1994 211 100 47.4 111 52.6
1995 1099 492 44.8 607 55.2
Source: District Education office - Chunya

45
Chart 17: Primary School Drop-outs by Sex in Chunya District, 1990 - 1995
1990 1991 1992 1993 1994 19950
200
400
600
800
Boys Girls
2.1.4 PRIMARY SCHOOL LEAVERS
With only 3 private secondary schools in the district only few
standard seven leavers are able to secure a place in form one within the district. Table XX shows that, in 1990, 1991 and 1992 for the whole region, 4.2%, 4.1% and 4.1% of the standard seven leavers were selected to join form one in public Secondary schools respectively. Corresponding figures for Chunya district during the period were only 0.98%, 0.94% and 6.17%.
In the early 1990's Chunya District had only one Government
Secondary School and three private secondary schools. The number of vacancies available for primary school leavers therefore, is very limited. Information available shows that in 1990 only 0.99% of primary school leavers were selected to join secondary

46
schools while in 1991 and 1992 it was 0.94% and 6.17% respectively. It is obvious that with the exception of 1992 Chunya had very low percentage of selection as compared to the regional total which was 4.2%, 4.1% and 4.1% for the years 1990, 1991, and 1992 respectively.

47
4Table XXI: PUPILS SELECTED TO JOIN FORM I BY SEX IN THE DISTRICT (PUBLIC SECONDARY SCHOOLS)
Year No. of Candidates Actual Selected Selected %
Boys Girls Total Boys Girls Total
1990 810 610 1622 11 5 16 0.98
1991 834 863 1697 11 5 16 0.94
1992 811 777 1588 68 30 98 6.17
1993 982 879 1861 64 56 124 6.66
1994 1264 1110 1374 59 55 114 8.29
1995 1304 1308 2612 62 57 119 4.56
Source: District Education Office - Chunya.
Chart 18: Pupils Selected to Form I in Chunya District 1990 - 1995
1990 1991 1992 1993 1994 19950
1000
2000
3000
Candidates
Actual Selected

48
It is noted that, the percentage increase in standard VII leavers who were selected in 1993/94 and 1994/95 to join Form I has been influenced by the expansion of streams in the existing Secondary schools.
Table XXII: PUPILS SELECTED TO JOIN FORM I BETWEEN 1990 - 1995 IN MBEYA REGION
Year No. of Candidates
Selected to join form I
%
1990 22,059 923 4.2
1991 26,411 1,084 4.1
1992 26,521 1,083 4.1
1993 27,857 1,180 4.2
1994 27,609 1,202 4.3
1995 30,364 1,213 4.0
Source: Regional Education Office - Mbeya.
2.1.5 SECONDARY SCHOOL EDUCATION Chunya District is among those districts which has the least number
of Secondary Schools as compared to well off district such as Rungwe in Mbeya Region and Mwanga district in Kilimanjaro region which have more than 30 secondary schools each. Chunya district has 4 secondary schools, out of those one is a government school and the other three are private owned.

49
Table XXIII: DISTRIBUTION OF SECONDARY SCHOOLS BY DIVISION
Division Ownership No. of
Schools Location
Kiwanja private 1 Itewe
Public -
Total Division 1
Kipembawe Private 1 Mtamula
Public -
Total Division 1
Kwimba Private 1 Mkwajuni
Public -
Total Division 1
Songwe Private -
Public 1 Kanga
Total Division 1
District 4
Table XXIV and table XXV show enrolment in secondary school
students by sex. It is observed that the number of boys enrolled in form I to IV exceed that of girls with the exception of Form II where girls exceeded boys by one student only.

50
Table XXIV: ENROLMENT BY CLASS AND SEX 1995
Cla-ss Public Private Private Public
Boy Girls Total Boy Girl Tota Boy Girls Tota
I 40 35 75 83 72 155 123 107 230
II 40 40 80 66 67 133 106 107 213
III 40 40 80 50 40 90 90 80 170
IV 40 40 80 38 23 61 78 63 141
Tot-al 160 175 335 237 202 439 397 357 754
Source: District Education Office - Chunya.
Chart 19: Enrolment by Class and Sex in Public Schools, 1995
I II III IV0
20
40
60
80
100
Boys Girls

51
Chart 20: Enrolment by Class and Sex in Private Schools, 1995
I II III IV0
20
40
60
80
100
Boys Girls
Chart 21: Enrolment by Class and Sex in Private Public Schools, 1995
I II III IV0
30
60
90
120
150
Boys Girls

52
Table XXV: TOTAL ENROLMENT (FORM I - IV) BY SEX 1990 - 1995 IN CHUNYA DISTRICT
Year Boys Girls Total
1990 40 35 75
1991 84 67 151
1992 102 98 200
1993 135 129 264
1994 160 160 320
1995 397 376 773 Source: District Education Office - Chunya
Chart 22: Total Enrolment (Form I - IV) by Sex in Chunya District 1990 - 1995
1990 1991 1992 1993 1994 19950
100
200
300
400 Boys
Girls

53
TABLE XXVI: FORM I ENROLMENT BY SEX FOR 1990-95 IN CHUNYA SECONDARY SCHOOLS
Year Boys Girls Total
1990 11 5 16
1991 11 5 16
1992 68 50 118
1993 68 56 124
1994 59 55 114
1995 62 57 119 Source:District Education Office-Chunya
Chart 23: Form I Enrolment by Sex for 1990 - 1995 in Chunya Secondary Schools
1990 1991 1992 1993 1994 19950
20
40
60
80
Boys Girls
5

54
2.1.6 ADULT EDUCATION Table XXVII shows that, Chunya district has an average of 32.9%
illiteracy rate. When compared to other districts Chunya could be one of the leading districts in the region having the highest illiteracy rate in the region. However, Mkwajuni L/Tingatinga and Makongolozi wards have the least illiteracy rate as compared to other wards in the district.
Table XXVII: ADULT EDUCATION COVERAGE FOR 1985
Division Ward 1995 Population Estimates
No. of Literacy
lliterates (Adult) %
KIWANJA Chalangwa 285 6389 31.2
Ifumbo 5829 3915 32.8
Mbugani 7126 4730 33.6
Itewe 13773 9615 30.2
Chokaa 4629 3453 25.4
Makongolosi 28317 24756 12.6
K/Katoto 3259 1800 44.8
KIPEMBAWE Mafyeko 3043 1515 50.2
Matwiga 5066 3756 25.9
Mtamila 2777 1957 29.5
L/Tingatinga 10023 8957 10.6

55
Luwalaje 4542 3701 18.5
KWIMBA
Ngwala 1511 815 46.1
Gua 4231 2790 34.1
Kapalala 4880 3815 21.8
Mbgangala 3960 2815 28.9
Mkwajuni 23788 21900 7.9
SONGWE
Nakukwe 8628 5715 33.8
Totowe 8757 6715 23.3
Mbuyuni 13387 11815 11.5
Galula 13070 10915 16.5
kanga 14614 11916 18.5
Total District Total 194,495 153,755 20.9
Source: District Education Office.
TABLE XXVIII: NURSERY/PRE-PRIMARY SCHOOLS IN CHUNYA - 1995
Centre
No of Pupils Attending No of
Teachers
Boys Girls Total
Lutheran Centre 50 59 109 2 (Untrained)

56
Total 50 59 109 2
Source: District Education Office - Chunya.
2.2 WATER SECTOR
2.2.1 INTRODUCTION
The National Water Policy of 1971 formulated a long term
programme which states that every person should have access to clean and safe water within a distance of not more than 400 metres from their homesteads by the year 2002. It is estimated that about 46.3% of the rural and 68.5% of the Urban population of Tanzania to date are saved with clean and safe water.
Contrary to other arid regions like Singida, Shinyanga and
Dodoma, Mbeya region is by far better - off in terms of reliability and adequacy of water supply. This has been the case because of existing permanent sources of water eg. river Songwe, Mbarali, Lulufino, Rungwe and Greater Ruaha river. Also the two lakes, Nyasa and Rukwa have contributed to this permanent source of inland water bodies, to a greater extend.
Table XXIX: depicts that 44% of the rural population in this region
by 1995 were accessible to clean safe and potable water within a reasonable distance.

57
Table XXIX: RURAL WATER SUPPLY IN MBEYA REGION 1995
District 1995 Population Estimates
Population Served
% of Population
served
Mbeya 399,642 239,785 60
Mbozi 420,771 130,439 31
Chunya 194,495 70059 36
Ileje 108,467 37,963 35
Kyela 152,022 95,685 63
Rungwe 299,379 113,764 38
Total 1,574,776 687695 44
Source: Mbeya Region Socio - Economic Profile.
Chart 24: Population Served by rural water supply in Mbeya Region by District, 1995
Thousands
Mbeya Mbozi Chunya Ileje Kyela Rungwe0
50
100
150
200
250

58
2.2.2 WATER SUPPLY SITUATION IN CHUNYA ISTRICT The major water sources in the district are various rivers, streams,
ponds and springs. Others include boreholes, shallow wells and small dams and Lake Rukwa. Since, only a few schemes are in operation, the majority of the people in the district depend upon traditional water sources for their domestic and livestock purposes/uses.
Table XXX: AVAILABLE WATER SCHEMES IN CHUNYA DISTRICT
Division Type of scheme Location
Kiwanja 4 pump boreholes 2 Gravity Schemes
- 3 pump borehole at Chunya township
- 1 pump borehole at Kiwanja - 1 gravity scheme at
Chalangwatu Mbugani and 1 at Ifumbo
Kipembawe 22 hand pumps water schemes
- 4 at Kambikatoto, 2 at Biti Manyanga
- 2 at Mafyeko, 3 at Kipembawe,
5 at Lupatingatinga, 3 at Nkungungu and 3 at Mamba
Kwimba 2 - gravity schemes 1 -pumping schemes
1- Gravity at Ngwala 1 Spring gravity at Mwambani 1 pumping scheme at
Mkwajuni
Songwe 2 - Pumps boreholes I - gravity scheme
1 pump borehole at Magamba
1 pump bore hole at Mbuyuni
Ileya, Tete, Kanga and Ifuko.
Source: District water Engineer Office - Chunya.

59
Recent survey indicates that about 36% of 194,495 (1995
projection) population living in Chunya district has access to clean and safe water. However, in practice only 20 villages out of 68 have access to fairly clean and safe water, serving a population of 70059 people. Out of the existing 31 Water Supply systems, 7 are not working.
Table XXXI indicates the number of villages and population served
with clean and safe water by wards. TABLE XXXI: NUMBER OF PEOPLE SERVED WITH CLEAN AND SAFE WATER IN 1995
Division Ward No of
Village
served
Population Estimate
1995
No of people served 1995
% Popul-ation
served
KIWANJA
Chalangwa Ifumba Mbugani Itewe Chokaa Makongolosi
1 1 1 1 1 1
9285 5829 7126
13773 4629
28317
4289 3497 3207 6743 2268
14156
46 60 45 47 49 50
KIPEMBAWE
Kambikatoto Mafyeko Matwiga Mtanila Lupatingating
a Lualaje
1 2 - - 3 -
3259 3043 5066 2777
10023 4542
1193 1522
- -
6014 -
34.7 50
0 0
60 0
KWIMBA
Ngwala Gua Kapalala Mbangala Mkwajuni
1 - - - 2
1511 4231 4880 3960
23788
1284 - - -
9515
85 - - -
40

60
Namkukwe Totowe Mbuyuni Galula Kanga
- - 1 - 4
8628 8757
13387 13070 14614
- -
3949 -
12422
- -
29.5 -
85
TOTAL 20 194495 70059 36
Source: District Water Engineer Office - Chunya

61
2.2.3 SANITATION The problem of water pollution which is caused by many factors for
example less use of latrine, industrial activities etc. is still facing Chunya people. About 30 percent of the population in rural areas have permanent latrines, 60 percent have temporary and 10 percent have no latrines. On the other hand, 10 percent of Urban population have VIP latrines, while 90% have permanent pit latrines.
2.2.3 PROBLEMS FACING RURAL WATER SUPPLY Basically as already mentioned, the majority of the people in
Chunya district depend on traditional water sources as their major source of water supply. Acute water problems facing the people in Chunya include the following:-
(i) Water Contamination: As these source of water are not well
secured and protected people do sometimes share water sources with animals, and at the same the people themselves bathe and wash clothes near these water sources.
(ii) High operational cost for motorized schemes: It has become
difficult for villagers themselves to operate these schemes by using their own funds. The Government, on the other hand, has not managed to support fully the operational cost for these schemes.
(iii) Unreliable water supply: Most of water sources are traditional
uneven distributed to the population and villages. As a the result, during the dry season, some villagers are forced to walk long

62
distances looking for water. For instance, it is estimated that more than 39% of the population have to walk more than 400 metres from their homesteads to fetch water.
2.3 HEALTH SECTOR
2.3.1 INTRODUCTION
Each division in Chunya has a health facility. However, services
delivered by these facilities has critically been affected by shortage of medicament and limited funding which ultimately has lead to poor maintenance of buildings, supply of equipments and other vital accessories.
This situation signals the need of rehabilitation of the old buildings
and supply of new equipments and medicaments in order to restore again the required health services and facilities to standard.
2.3.2 EXISTING HEALTH FACILITIES
Table XXXII indicates that, Chunya district has 1 hospital, 3 health
centres, 29 dispensaries and 29 village Health Posts. The only district hospital is owned by mission and is situated at Mwambani, some 72 kms. from the district Headquarters.

63
Table XXXII:DISTRIBUTION OF RURAL HEALTH FACILITIES IN THE DISTRICT BY DIVISION AND WARD 1996
Division Ward Health Centres
Dispensaries
Village Health Posts
KIWANJA Chalangwa 2
Ifumbo 1
Mbugani
Itewe 1
Chokaa 2
Makongolosi 3
Total Division 1 8
KIPEMBAWE K/Katoto 1
Mafyeko 1
Matwiga 1
Mtanila -
L/Tingatinga 3
Luwalaje 1 1
Total Division 1 7
KWIMBA Ngwala 2 1
Gua 1 1
Kapalala 2 3
Mbangala 1 2

64
Division Ward Health Centres
Dispensaries
Village Health Posts
Mkwajuni 1 6
Total Division 7 13
SONGWE Nakukwe 1 3
Totowe 1 3
Mbuyuni 0 3
Galula 1 2 3
Kanga 3 4
1 7 16
TOTAL DISTRICT 3 29 29
Source: District Medical Office - Chunya.
Table XXXIII shows the ratio between Chunya population and the
available facilities. Data presented in the table shows that, the district hospital, RHC, medical doctors dispensaries and Hospital beds are well below the recommended national standard ratio. Those ratios tells us that, Chunya district requires additional health facilities with the exception of dispensaries. However, the supply of medicaments is still inadequate.

65
Table XXXIII: HEALTH FACILITIES RATIO IN CHUNYA DISTRICT 1995 COMPARED TO REGIONAL AND NATIONAL STANDARDS
Facility Quantity District Ratio
Regional Ratio
National Ratio
Hospital 1 1:194,495 1:157,478 1:100,000
Hospital bed 150 1:1296 1:1,135 1:800
RHC 3 1:64,831 1:87,893 1:50,000
Dispensaries 29 1:6706 1:7,890 1:10,000
Medical Doctors
3 1:64831 1:68,468 1:48,000
2.3.3 HEALTH PERSONNEL
As is the case with most of health centres in the whole country,
Chunya Health Centres have a shortage of health personnel specifically MCHA, PHN, 'A' and 'B' and medical assistants as R medical Aids and MCH Aids are dying cadres.

66
Table XXXIV: CHUNYA HEALTH CENTRES PERSONNEL ESTABLISHMENT, ACTUAL STRENGTH AND SHORTFALL IN 1995
Health
Centre Staff Category Establis
hment
Strength
Shortfall
Chunya
Assistant Medical Officers
1 - 2
Medical Assistants 5 5 -
District MCH Coordinators
1 1 -
Nurse/Midwives 2 1 1
RMAS 3 1 2
Public Health Nurses
6 2 4
MCH 3 2 1
Trained Nurses 3 1 2
Dental Assistants 1 1 -
Health Assistants 5 3 2
Nurse Attendants 30 - 30
Lab. Assistants 1 1 -
Mbuyuni :
Medical Assistants
2 1 1
Assistant Medical Officers
1 - 1
RMAS 3 2 1

67
Trained Nurses 1 1 -
MCHA 3 2 1
Nurse/Midwives 2 0 2
Nurse Attendants
8 5 3
Lab. Attendants 2 1 1
Mtanila
Assistant Medical Officers
1 0 1
Medical Officers 1 0 1
RMAS 3 3 0
Trained Nurses 1 0 1
MCHA 3 1 2
Nurse/Midwives 2 1 1
Nurse Attendants 8 3 5
Lab. Attendants 2 0 2
Source: District Medical Office - Chunya.
2.3.4 MORBIDITY AND MORTALITY
The leading killer diseases in Chunya district are malaria followed
by URT. The available data reveals that, occurrence of malaria and URT on average is 51.5% and 15.9% respectively. These two percentages are higher than the regional and national averages.

68
Other common ten top diseases includes: diarrhoea Pneumonia, eye diseases etc as table XXXV below indicates.

69
Table XXXV: TEN TOP DISEASES IN CHUNYA DISTRICT (1996) COMPARED WITH THE REGIONAL AND NATIONAL AVERAGES
Type of Disease
District Occurrence Average %
Regional Occurrence Average %
National Occurrence Average %
Malaria 51.5 25.4 31.0
Diarrhoea 8.9 11.1 8.1
URT 15.9 12.0 11.0
Pneumonia 4.9 4.8 4.4
STD 3.8 3.3 1.5
Schistomiasis
0.9 8.7 8.6
Skin diseases
3.7 5.5 3.7
Eye diseases 3.2 2.7 4.6
Dental Caries 2,4 3.5 7.6
Ascariasis 3.6 5.6 2.7
Other Diagnoses
1.2 17.4 16.8
Total 100 100 100
Source: Planning Commission compiled data based on Reports from DMO -
Chunya and Ministry of Health, Health Statistics Abstract 1995.

70
6

71
Table XXXVI: WARD BASED HEALTH UNIT RECORD OF TOP TEN DISEASES AND THEIR OCCURRENCES IN THE DISTRICT 1996
Ward/Disease Ward/Disease Malaria Diarrhoea URT Pneumonia ST
KIWANJA Chalangwa 1008 414 385 45 22
Ifumbo 2849 909 546 187 61
Mbugani - - - - -
Itewe - - - - -
Chokaa 4086 785 1151 471 644
Makongolosi 4569 1147 1144 167 474
KIPEMBAWE Kambikatoto 549 123 584 87 62
Mafyeko 801 268 562 225 56
Matwiga 2006 148 851 696 24
Mtanila 1492 319 506 182 30
L/Tingatinga 2214 284 714 135 102
Luwalaje 983 254 402 115 60
KWIMBA Ngwala 4985 467 806 143 212
Gua 985 84 793 98 16
Kapalalala 777 127 198 101 30
Mbangala 985 83 793 102 15
Mkwajuni 9517 1142 2236 414 111
SONGWE Namkukwe 2257 404 307 208 67
Totowe 985 85 793 73 16
Mbuyuni 3557 819 839 913 300
Galula 986 82 793 60 13
Kanga 3631 546 526 207 178
Total District 48673 8,490 14,996 4,629 3,4966

72
Ward/ Disease
Ward/ Disease
Skin Diseases
Eye Diseases
Dental caries Ascariases
KIWANJA Chalangwa 159 292 0 71
Ifumbo 237 131 0 96
Mbugani - - - -
Itewe - - - -
Chokaa 498 326 565 305
Makongolosi 672 219 138 340
KIPEMBAWE Kambikatoto 19 123 0 58
Mafyeko 59 250 0 190
Matwiga 389 300 0 430
Mtanila 65 125 299 101
L/Tingatinga 262 285 0 126
Luwalaje 75 169 0 51
KWIMBA Ngwala 382 413 0 406
Gua 30 120 0 131
Kapalalala 29 59 0 76
Mbangala 25 57 0 115
Mkwajuni 790 514 0 190
SONGWE Namkukwe 66 372 0 87
Totowe 42 45 0 140
Mbuyuni 98 56 0 206
Galula 35 62 0 150
Kanga 205 219 0 133
Total District 3,495 4,137 1,002 3,402

73
Source: DMO - Chunya
Table XXXII shows that, the most common disease in Chunya
District is malaria followed by URT. Malaria cases are very high in Kwimba division followed by Songwe and Kiwanja. Mbugani and Itewe wards are served at Chokaa (Chunya health Centre) as the wards do not have health facilities.
2.3.4.1 INFANT MORTALITY RATE
TABLE XXXVII: SHOWS INFANT MORTALITY RATES AND UNDER
FIVE MORTALITY RATES IN MBEYA REGION COMPARED TO THE NATIONAL AVERAGES.
Year
IMR U5MR
Mbeya National Average
Mbeya National Average
1975 161 137 267 231
1985 124 115 209 191
1995 96 96 163 158
Source: MOH: Health Statistics Abstract 1995.
Table XXXVII indicates that IMR in Mbeya region declined by
40.3% between 1975 and 1995 while U5MR declined by 38.9% during the same period. Table XXXVIII depicts that the IMR and

74
U5MR of Chunya district were 101 and 106 on average respectively by the end of 1995.
Table XXXVIII: IMR AND U5MR IN CHUNYA DISTRICT COMPARED WITH
REGIONAL AND NATIONAL AVERAGE 1995
Parameter District Average
Regional Average
National Average
IMR 101 96 96
U5MR 106 163 158
Source: Mbeya Regional Socio - Economic Profile.
2.3.4.2 MATERNAL MORTALITY RATE
It is observed from table XXXIX that, the MMR of Chunya district
between 1992 and 1994 was improving while that of the region was increasing. However, the district MMR for the year 1994 was far below national average.
TABLE XXXIX:MATERNAL MORTALITY RATES IN THE DISTRICT
COMPARED WITH REGIONAL AND NATIONAL AVERAGES
1992 1993 1994
Chunya District 88 76 70
Mbeya Region 67 361 436

75
National Average 199 211 197
Source: Planning Commission Compiled Data based on: MOH- Health Statistical Abstract and DMO-Chunya

76
Chart 25: Maternal Mortality Rates in the Chunya District compared with Regional and National Averages from 1992 - 1994
Chunya District Mbeya Region National Average
0
100
200
300
400
500
1992 1993 1994
2.3.5 HIV - INFECTION AND AIDS DISEASES
It has been established that, the first Aids victim in Chunya district
was recognized in 1987. Since then the number of affected people has kept increasing. The exact number of people affected is not yet known due to the fact that many HIV and Aids cases are not reported. However, by 1995 a cumulative total of 154 victims has been reported in the district.
Table XL shows that Aids and HIV patients in the region are on the
increase although Chunya and Ileje districts are the least affected. Table XL: HIV INFECTION AND AIDS DISEASES IN

77
MBEYA REGION 1987 - 1994
District 1987 1988 1989 1990
C D C D C D C D
Mbeya (U) 11 4 214 21 582 6 618 63
Mbeya (R) 6 3 70 2 22 0 87 12
Kyela 1 1 51 15 79 15 143 2
Rungwe 0 0 65 15 309 7 577 11
Mbozi 6 1 100 6 238 14 294 0
Chunya 1 1 27 2 35 0 53 9
Ileje 0 0 14 0 55 0 32 1
Region 23 10 541 61 1320 42 1804 98
District 1991 1992 1993 1994 C D D C D C D C
Mbeya (U) 574 14 317 0 739 0 1300 31 Mbeya (R) 149 0 41 0 824 0 158 4 Kyela 267 8 13 3 130 8 165 32 Rungwe 406 3 494 0 280 31 763 373 Mbozi 330 0 323 0 215 0 740 16 Chunya 63 9 162 0 394 11 154 47 Ileje 64 1 62 0 n.a n.a 25 2 Region 1853 35 1551 3 2188 39 3305 505
Source: Regional Medical Office, Mbeya. Key C=HIV Cases D=Deaths from Aids.

78
Chart 26: Comparative Trend in HIV Cases, Chunya District and Mbeya Region
1987 1988 1989 1990 1991 1992 1993 1994
0
500
1000
1500
2000
2500
3000
3500
Chunya District
Mbeya Region
2.3.6 IMMUNIZATION (PERCENTAGE) COVERAGE IN CHUNYA DISTRICT 1985 AND 1996 The immunization is given as percentage coverage in the district
between 1985 and 1996 as table XLI depicts.

79
Table XLI: IMMUNIZATION (PERCENTAGE) COVERAGE IN CHUNYA DISTRICT 1985 AND 1996
Type of Vaccine 1985 1990 1996
BCG 75% 85% 87%
Measles 87% 60% 55%
DPT1 71% 85% 86%
DPT3 87% 76% 74%
Polio 2 80% 71% 70%
Polio 3 80% 72% 72%
TT1 55% 50% 60%
TT2 41% 50% 50%
Source: District Medical Office - Chunya.
Table XLI shows that the immunization coverage for the BCG,
DPT1, TT1 and TT2 Vaccination increased while those of Measles,
DPT3, Polio 2 and Polio 3 decreased between 1985 and 1996.

80
SECTION III 3.0 ECONOMIC INFRASTRUCTURE
3.1 ROADS
Chunya district has a road network length of 705.9 kms.
categorized into four main groups namely, Trunk, Regional, District and feeder roads. Out of 705.9 kms, 250 kms, 65.5 kms., 322.4 kms and 68 kms are trunk, regional, district and feeder works respectively. Table XLII shows distribution of these type of roads in the district by divisions.
Table XLII: PROFILE OF THE DISTRICT ROADS SPECIFYING THEIR SURFACE LASSIFICATION, DISTRIBUTION BY DIVISION AND LENGTH.
Division type
Gravel kms.
Gravel/Earth (kms.)
Earth surface (kms.)
Total length
1. Kiwanja division - Trunk road - Reg. roads - District roads - Feeder roads
84
- - -
-
12 - -
- -
65.5 24
84 12
65.5 24
Total division
2. Kipembawe division - Trunk roads - Reg. roads - District roads - Feeder roads
166
- - -
- - - -
- -
38 24
166
- 38 24

81
Division type
Gravel kms.
Gravel/Earth (kms.)
Earth surface (kms.)
Total length
Total Division
3. Kwimba division - Trunk roads - Reg. roads - District roads - Feeder roads
- - - -
-
34 - -
- -
148 -
-
34 148
-
Total division
4. Songwe division - Trunk roads - Reg. roads - District roads - Feeder roads
- - - -
-
19.5 - -
- -
70.9 20
-
19.5 70.9
20
Total division
Total District 250 65.5 390.4 705.9
Source: District Engineer Office - Chunya

82
Table XLIII: DESCRIPTION OF TYPE OF ROADS EXISTING IN CHUNYA DISTRICT AND THEIR COVERAGE.
Type road Description of road Distance (kms.)
1. Trunk roads Chalangwa - Rungwa (Gravel) 100 kms - good 150 kms - fair
250
Total 250
2. Regional roads Makongolosi - DB Mbeya (Grave/Earth) 65.5 kms. - fair
65.5
Total 65.5
3. District roads a) Saza - Kapalala (Earth) - poor b) Galula - Namkukwe (Earth) - poor c) Kiwanja - Ifumbo (Earth) - poor d) Kapalala - Ngwala (Earth) - Poor e) Kapalala - Gua (Earth) - poor f) Lupa - Luwalaje (Earth) - poor g) Kapalala - Udindo (Earth) - poor h) Kanga - Ifwenkenya " - poor i) Isenyela - Sangambi (Earth) - poor j) Chunya - Mapogoro (Earth) - poor k) Chunya town - loop (Earth) - fair
57 56.6
30 48 35 38 8
14.3 16 12 7.5
Total 322.4
4. Feeder roads - Isangawana - Matwiga - poor - Lupa - Nkungungu - poor - Ifumbo - Ifwenkenya - poor - Totowe - Megamba - poor - Sangambi - Shoga - poor
13 11 15 12 17
Total 68
Grand Total 705.9
Source: District Engineers Office - Chunya.

83
Table XLIII above depicts that almost all the district road network
condition is generally poor, particularly district and feeder roads. It is established that, lack of regular maintenance and poor usage has contributed a lot to this poor condition of roads in the district.
3.2 AIR TRANSPORT
Chunya district is served by three (3) airstrips located at Kiwanja,
Mwipa and Miwanga villages. The two airstrips at Mwipa and Miwanga are specifically for hunting Tourists. These airstrips are mostly accessed by light private charter aircraft and not scheduled passenger flights.
3.3 MARINE TRANSPORT As already mentioned out of 2,921,989 kms. of the total district
area, 1.105 sq. kms. are covered with a water body. Some portion of this water body forms Lake Rukwa. Although the exact number of vessels playing in the Lake is not known. However, there is regular passenger and cargo transportation between Chunya District and Rukwa Region.
3.4 TELECOMMUNICATIONS
Chunya district telecommunication system is inadequate due to the
fact that, the district has only 54 telephone lines, 1 postal office and 3 radio calls owned by the police force despite of it being the

84
largest district area wise in Mbeya region. This is shown in Table XLIV.
Table XLIV: TELECOMMUNICATION SERVICES IN CHUNYA DISTRICT
Facility Number Location
Telephone lines 61 Chunya Township
Radio calls (Police Force)
3 Chunya Mkwajuni and Galula
Postal Office 1 Chunya Township
Source: Postal Services and Tanzania Telephone Company.
3.5 ENERGY
The major source of energy available in Chunya district up to 1996
for both domestic and industrial use include: firewood/charcoal, thermal/hydro electricity and oil (petroleum) products. Before 1994 the entire population of Chunya district depended on firewood/charcoal and petroleum as their main source of power. However, most of the rural population depend on firewood and charcoal as their major source of energy since rural electrification has not taken place. The available electricity and petroleum products as sources of energy are mainly used by the Urban population.

85
3.5.1 ELECTRICITY Table XLV: ELECTRICITY SUPPLY AND DEMAND 1994 AND 1996
Year Installed Capacity megawatt
Demand Megawatt
Source
1994 0.1 0.05 Hydroelectricity
1995 0.4 0.2 Hydroelectricity
1996 0.55 0.3 "
1997 0.6 0.3 "
Source: Tanesco - Chunya.
Chart 28: Supply and Demand of Electricty in Chunya District
Megawatts
1994 1995 1996 19970
.2
.4
.6
Supply Demand
Table XLV and Chart 15 indicates that the available electricity is far above Chunya's demand. This implies that, there is a need for

86
the Tanesco to distribute this excess supply to the needy people particularly the rural people in order to stimulate the establishment of income generating concerns in the rural areas.
3.5.2 FIREWOOD/CHARCOAL
Firewood and charcoal are the main source of energy as they
satisfy about 80 - 90% of the total energy requirement in Chunya District. The total consumption of fuelwood annually amounts to 2,246,847.2 M2. If this rate of consumption is left unchecked, Chunya District will sooner or later become a desert. It is therefore imperative that alternative sources of energy like rural electrification, biogas, solar, should be explored to check the speed of decertification in the district.
3.5.3 OTHER ENERGY POTENTIALS
Experience has shown that solar energy can easily be tapped for
domestic and small industrial purposes. Roman Catholic Missionaries have ever used a small solar energy unit (32 volts) for their centre before grid like was installed. The same therefore can be introduced for use in other institutions and settlement centres.

87
SECTION IV 4.0 PRODUCTIVE SECTORS 4.1 DISTRICT ECONOMY 4.1.1 INTRODUCTION The district's major economic activities are farming and animal
husbandry. It is estimated that these two sectors constitute about 50 - 95 percent of the district GDP. Other sectors include: fishing, forest activities and beekeeping. The latter are estimated to contribute about 10 - 20% of the district GDP. Small scale industries and trading activities are estimated to contribute insignificant amount to the GDP.
Tobacco is the leading cash crop. Other cash crops in the district
include, cotton sorghum and paddy. Main food crops grown are; maize, beans, millet, cassava and sweet potatoes. Despite the existence of abundant arable land and good climatic conditions the district has no large scale farmers. The main reason may be the difficulties encountered in accessing to markets due to poor road network for crop haulage.
The district has also a good number of livestock ranging from cattle,
goats, sheep and pigs. Most of the livestock kept are of indigenous breed, followed by a few improved breed.

88
4.1.2 DISTRICT GDP AND PER CAPITA INCOME The problem of unreliable and insufficient data in most of sectors in
Tanzania is also facing Chunya district. This has made it difficult to determine precisely the district GDP and per capita GDP. However, the crude available data shows that, the district GDP was Tsh. 15,317 million and Tsh. 68,000 per capita in 1995.
Table XLVI and Chart 16 shows GDP and per capita for the
district compared with other districts, regional and national averages.
The district economy is predominantly subsistence, hence the
difficult to incorporating it in the calculation of GDP. As the informal sector is gaining momentum and taking the biggers share of the economy, we anticipate that it will become even more difficult to get timely, accurate and reliable figures for the calculation of GDP.
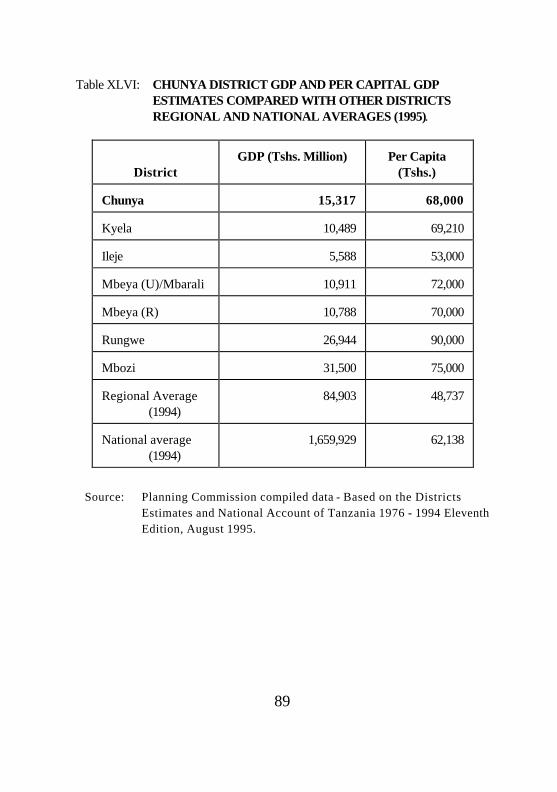
89
Table XLVI: CHUNYA DISTRICT GDP AND PER CAPITAL GDP ESTIMATES COMPARED WITH OTHER DISTRICTS REGIONAL AND NATIONAL AVERAGES (1995).
District
GDP (Tshs. Million) Per Capita (Tshs.)
Chunya 15,317 68,000
Kyela 10,489 69,210
Ileje 5,588 53,000
Mbeya (U)/Mbarali 10,911 72,000
Mbeya (R) 10,788 70,000
Rungwe 26,944 90,000
Mbozi 31,500 75,000
Regional Average (1994)
84,903 48,737
National average (1994)
1,659,929 62,138
Source: Planning Commission compiled data - Based on the Districts
Estimates and National Account of Tanzania 1976 - 1994 Eleventh Edition, August 1995.

90
Table XLVII:THE DISTRICT GROSS DOMESTIC PRODUCT (GDP) 1991 - 1996 AT CURRENT PRICE (TSHS. 000')
Year GDP(at current
prices) Per Capita
(T.Shs.) % change
1991 11,325 60,200
1992 12,215 62,067 7.9
1993 13,172 63,981 7.8
1994 14,204 65,960 7.8
1995 15,317 68,600 7.8
1996 18,828 88,400 22
Chart 29: GDP and Per Capita in Mbeya Region by District, 1995
T.Shs(Thousands)
0
20
40
60
80
100
GDP
Per Capita

91
Chart 30: Chunya GDP and Per Capita at Current Prices 1991 - 1996
1991 1992 1993 1994 1995 19960
20
40
60
80
100
GDP Per Capita
TShs.(Thousand)
Error! Switch argument not specified.
4.1.3 EMPLOYMENT The district employment capacity is distributed between four main
socio-economic activities as follows: • Agriculture - occupying 60% of
population • Small Scale Mining - occupying 22% of
population • Fishing - occupying 10% of
population and

92
• Small scale Industries - occupying 0.8% of and Trades population.
Different from other districts in Mbeya Region, the economic
potentials of Chunya district do not directly contribute to its development. Much of its wealth is drained out.
4.2.0 AGRICULTURE Agriculture is the major economic activity for the Chunya people.
The district has arable land of 23,005 sq. kms. suitable/ideal for agriculture and animal husbandry. However, only 512 sq. kms. of arable land is under cultivation (2.2%). It is estimated that 10% of the arable land (2300.5 sq. kms.) is ideal for Irrigation. Food crops grown are: maize, bananas, beans, millet, cassava, sorghum, sweet potatoes, groundnuts and paddy.
Table XLVIII shows that the production of these crops in the
district is low on average and fluctuated from year to year depending on the availability of agricultural inputs and rainfall. Farming seasons commence between October and November for season one, and January to April for season two. The Table also indicates the production of major food crops in Chunya district compared to regional total production in 1993/94.
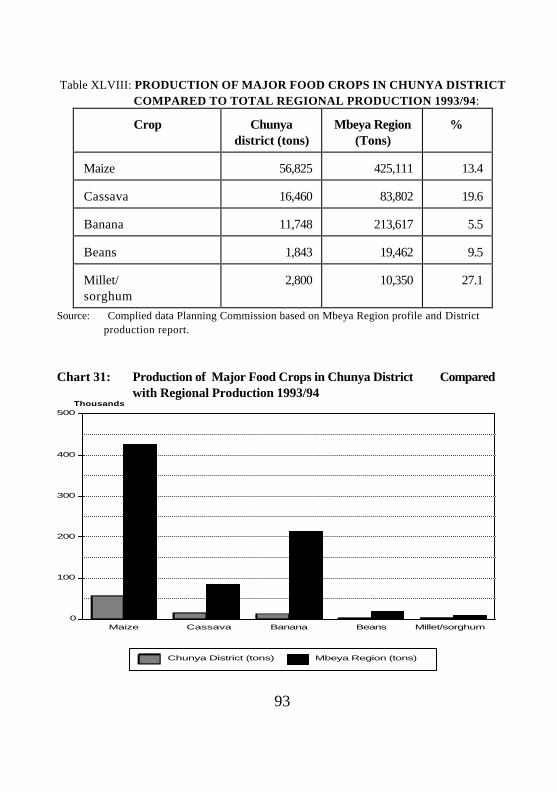
93
Table XLVIII: PRODUCTION OF MAJOR FOOD CROPS IN CHUNYA DISTRICT COMPARED TO TOTAL REGIONAL PRODUCTION 1993/94:
Crop Chunya district (tons)
Mbeya Region (Tons)
%
Maize 56,825 425,111 13.4
Cassava 16,460 83,802 19.6
Banana 11,748 213,617 5.5
Beans 1,843 19,462 9.5
Millet/ sorghum
2,800 10,350 27.1
Source: Complied data Planning Commission based on Mbeya Region profile and District production report.
Chart 31: Production of Major Food Crops in Chunya District Compared with Regional Production 1993/94
Maize Cassava Banana Beans Millet/sorghum0
100
200
300
400
500
Chunya District (tons) Mbeya Region (tons)
Thousands

94
4.2.1 FOOD CROPS Sorghum/Millet: Based on the estimated production data in the
district sorghum is the most important food crop. The crop grown by small holders in most of the villages. However, Table XLIX and Chart 17 indicates that, the total district sorghum contribution to the total region is fairly small compared to other districts. With the exception of 1993/94 when it produced 25% of the total regional production.
Error! Switch argument not specified. Table XLIX: ESTIMATED SORGHUM PRODUCTION IN
CHUNYA DISTRICT COMPARED WITH A REGIONAL AVERAGE.
Season/ Year
Total Regional production(tons)
Estimated production Chunya
district (tons)
%
1990/91 37,969 1,100 2.9
1991/92 28,404 2,200 7.7
1992/93 32,474 2,400 7.4
1993/94 10,350 2,600 25.1
1994/95 17,300 2,800 16.2
Source: Planning Commission compiled data based on Mbeya Region
Socio-Economic Profile and District Production Report.

95

96
CASSAVA According to estimated data, Chunya District ranks second after
Mbozi District in cassava production. Cassava is mainly used in periods of food shortage in the district. The Tables L(a), L(b) and Chart 18 below presents an estimated cassava yield in Mbeya Region by District for the for the years from 1991/92 to 1993/94.
Error! Switch argument not specified. Table L (a): ESTIMATED PRODUCTION OF CASSAVA IN MBEYA
REGION BY DISTRICT 1991/92 - 1993/94.
District 1991/92
(Tons)
% 1992/93
(Tons)
% 1993/94 (Tons
%
Chunya 14,430 26 13,370 27.3 16,460 25,8
Kyela 1,332 2.4 1,224 2.5 1,467 2.3
Ileje 2,498 4.5 2,884 5.9 3,448 5.4
Mbeya 6,548 11.8 5,242 10.7 5,551 8.7
Tukuyu 5,162 9.3 5,094 10.4 7,911 12.4
Mbozi 25,530 46.0 21,158 43.2 28,965 45.4
Regional Total
55,500 100 48,977 100 63,802 100
Source: Planning Commission Compiled data based on Mbeya Region socio Economic profile
and District Production Report.

97
Chart 32: Estimated Production of Cassava in Chunya District 1991/92 - 1993/94
1991/92 1992/93 1993/940
4
8
12
16Thousands tons
TABLE L (b): ESTIMATED CASSAVA PRODUCTION BY DIVISION IN
CHUNYA DISTRICT
Division 1991/92 1992/93 1993/94
(Tons) % Tons % Tons %
Kiwanja 1,003.75 6.9 1,071.25 8.0 2,000.50 12
Kipembawe 2,603.75 18.1 2,271.25 16.9 2062.5 12.5
Kwimba 7,215 50.0 6,685 50 8272 50.2
Songwe 3,607.5 25.0 3,342.50 25.1 4125 25.3
Total District 14,430 100 13,370 100 16,460 100
Source: District Agricultural and Livestock office-Chunya

98
Table L (b) shows that, Kwimba division is famous for cassava production, producing 50% or so of the total district production.
BEANS In Chunya district, production of beans ranks is fourth after
sorghum, cassava and maize (See the trend in Chart 19). It is also observed that actual production of beans doesn't meet the actual demand. Consequently the district residents are forced to import beans from other districts with surplus such as Tukuyu and Mbozi to bridge the gap.
Chart 33: Estimated Production of Beans in Mbeya Region by District 1992/93 - 1993/94
Chunya Mbeya Mbozi Tukuyu Kyela Ileje
0
2
4
6
8
10
1992/93 1993/94 1994/95
Thousands
Error! Switch argument not specified.

99
Table LI (a): ESTIMATED PRODUCTION OF BEANS IN MBEYA REGION BY DISTRICT 1992/93 - 1993/94 District 1992/93 (tons) % 1993/94 (tons) % 1994/95 (tons) %
Chunya 2294 6 1843 6 2070 7
Mbeya 8565 24 7282 24 7266 24
Mbozi 8206 23 7251 24 7449 24
Tukuyu 6702 19 5962 19 5625 18
Kyela 4658 13 3779 12 3953 13
Ileje 5411 15 4608 15 4542 15
Region 35836 100 30725 100 30909 100
Source: Planning Commission compiled data based on Mbeya region socio - economic profile and District Production Reports.
TABLE LI (b): ESTIMATED BEANS PRODUCTION BY
DIVISION IN CHUNYA DISTRICT
Division 1992/93 1993/94 1994/94
Tons % Tons % Tons %
Kiwanja 473.5 20.6 600.75 32.6 400.5 19.3
Kipembawe 1720.5 75.0 1132.25 61.4 1552.5 55.7
Kwimba 100 4.4 110 6.0 117.0 25.0
Songwe Nil - Nil Nil Nil Nil
Total 2294 100 1843 100 2070 100
Source: District Agricultural and Livestock office - Chunya.
100
It is observed in Table LI (b) that, Kipembawe division produced more beans during 1992/93-1994/95 season than other divisions followed by Kiwanja division in 1992/93- 1993/94.
BANANAS Out of the five leading crops produced in Chunya district, banana
ranks the fifth. When compared to other district percentage wise, Chunya district is estimated to produce between 4% and 5% of the total regional annual production. However, it is extremely difficult to have actual production data since most of banana is produced for home consumption. A very small proportion of the production goes through the cash market/economy while the major part of it is for subsistence and consumed as food and fruits and also in form of banana wine. Banana is grown mainly in Songwe division the area along Lake Rukwa basin.
Chart 34: Estimated Production of Bananas in Mbeya Region by District 1992/93 - 1994/95

101
Chunya Kyela Tukuyu Mbozi Mbeya (R) Ileje0
30
60
90
120
1992/93 1993/94 1994/95
Thousands tons
Error! Switch argument not specified.

102
Table LII: ESTIMATED PRODUCTION OF BANANAS IN MBEYA REGION BY DISTRICT 1990/91 - 1993/94:
District 1992/93 (tons) % 1993/94 (tons) % 1994/95 (tons) %
Chunya 9,453 5.2 9,466 4.8 11,748 5.5
Kyela 43,267 23.8 43,387 22 78,611 25.3
Tukuyu 101,079 55.6 110,442 56 115,353 54
Mbozi 1,636 0.9 1,577 0.8 2,136 1
Mbeya (R) 22,542 12.4 25,638 13 23,497 11
Ileje 3,818 2.1 6,706 3.4 6,985 3.2
Region 181,798 100 197,217 100 213,617 100
Source: The Planning Commission Compiled data based on Mbeya Region Socio - Economic profile and District Production Reports.
4.2.2 CASH CROPS The leading cash crops produced in Chunya district include
Tobacco and cotton. Table LIII (a) and LIV (a) show that about 75 - 85% and 55 - 65% of the total regional production of tobacco and cotton respectively are produced in Chunya district.
TOBACCO Tobacco as a cash crop is mainly grown in Chunya and Mbozi
districts. As derived from the table below in 1993/94; 79.5% of the tobacco was produced in Chunya district while the remaining 20.5% was produced in Mbozi district. On average Chunya

103
contributes 4.5% of the national annual production. There is still much land potential given adequate supply of inputs, favourable climatic conditions and good market conditions. Matwiga and Lupatingatinga are the leading producer wards in the district.
Error! Switch argument not specified.
Table LIII: (a) ESTIMATED TOBACCO PRODUCTION IN MBEYA REGION BY DISTRICT 1990/91 - 1993/94
Distric
t
1990/91
tons
% 1991/92
tons
% 1992/93
tons
% 1993/94
tons
%
Chunya 680 85 1,296 80 1,467 81.5 1,285 79.5
Mbozi 120 25 324 20 333 18.5 332 20.5
Region 800 100 1,620 100 1,800 100 1,617 100
Source: Compiled data Planning Commission based on Mbeya Region Socio - Economic profile
and Districts Production Reports.
Chart 35: Estimated Tobacco Production in Chunya Dfistrict 1990/91 - 1993/95
1990/91 1991/92 1992/93 1993/940
300
600
900
1200
1500
Tons

104
TABLE LIII (b): E STIMATED TOBACCO PRODUCTION BY DIVISION IN
CHUNYA DISTRICT
Division
1991/92 1992/93 1993/94
Tons % Tons % Tons %
Kiwanja Nil - Nil - Nil -
Kipembawe 962 74.2 1160.25 79.1 963.75 75
Kwimba 334 25.8 306.75 20.9 321.25 25
Songwe Nil - Nil - Nil -
Total District 1,296 100 1467 100 1285 100
Source: District Agricultural and Livestock Office - Chunya.
Table LIII (b) shows that the two divisions namely Kipembawe and
Kwimba are the major producer of tobacco significantly in Chunya district.
COTTON Production of cotton ranks second from tobacco production in
Chunya district. However, compared to other districts in Mbeya region Chunya is leading. For example in 1991/92 about 66% of the total production was produced in the district. The present production level is over 7000 tons. Chunya district has much potential for cotton production-due to its available suitable land and well organised present marketing system.

105
Chart 36: Estimated Cotton Production in Chunya District 1990/91 - 1993/94
1990/91 1991/92 1992/93 1993/940
2000
4000
6000
8000
Tons
Error! Switch argument not specified.
Table LIV (a) ESTIMATED COTTON PRODUCTION IN MBEYA REGION BY DISTRICT 1990/91 - 1993/94.
Distric
t
1990/91
(tons)
% 1991/92
(tons)
% 1992/93
(tons)
% 1993/94
(tons)
%
Chuny
a
1,644 64.9 3,498 66 4,271 58.5 6,002 65.7
Mbeya 506 20 1,145 21.6 1,416 19.4 1,964 21.5
Mbozi 380 15.1 657 12.4 1,613 22.1 1,169 12.8
Region 2,530 100 5,300 100 7,300 100 9,135 100

106
Source: Compiled data - Planning Commission based on Region Socio - Economic profile - Mbeya and Districts Production Reports.

107
TABLE LIV (b): ESTIMATED COTTON PRODUCTION BY DIVISION IN CHUNYA DISTRICT
Division
1991/92 1992/93 1993/94
Tons % Tons % Tons %
Kiwanja Nil - Nil - Nil -
Kipembawe 237.25 6.9 333.875 7.8 244.25 4.1
Kwimba Nil - Nil - Nil -
Songwe 3260.75 93.1 3937.125 92.2 5757.75 95.9
Total District 3498 100 4271 100 6002 100
Source: District Agricultural and Livestock Office - Chunya.
Table LIV (b) indicates that, only two divisions in Chunya district
which are significantly producing cotton. Songwe division is more famous in cotton production than Kipembawe division.
4.2.3 FARM IMPLEMENTS It is observed that in 1995/96, the distribution of farm implements
on average for Chunya district was poor compared to other districts with the exception of oxcarts. For example, the district had 14 tractors, 4 harrows and had neither cultivator nor ridger. This was equivalent to 5.4%, 2.9% of the available tractors and harrow respectively in the region. Also the district has 90,854 hand hoes which indicates that most of the farming activities are still carried out by hand tools. In order to increase production of both food and cash crops, it is necessary to engage some improved or appropriate thus adopting agricultural mechanization step by step.
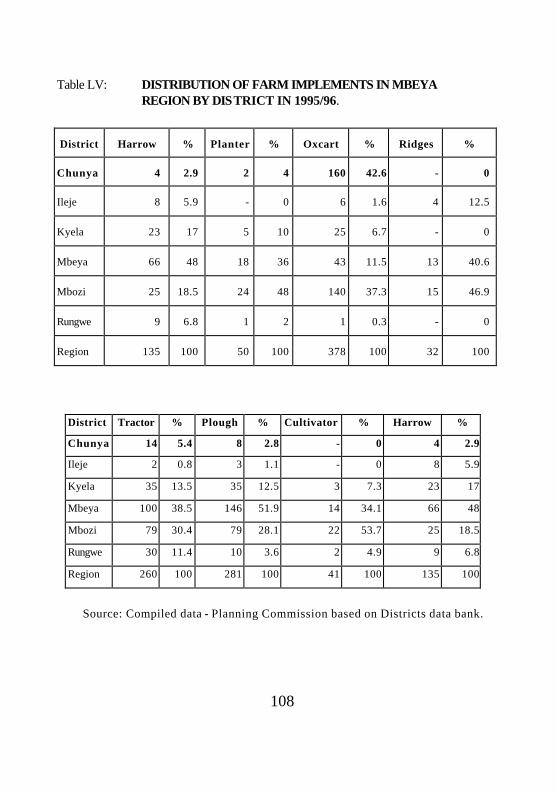
108
Table LV: DISTRIBUTION OF FARM IMPLEMENTS IN MBEYA REGION BY DISTRICT IN 1995/96.
District Harrow % Planter % Oxcart % Ridges %
Chunya 4 2.9 2 4 160 42.6 - 0
Ileje 8 5.9 - 0 6 1.6 4 12.5
Kyela 23 17 5 10 25 6.7 - 0
Mbeya 66 48 18 36 43 11.5 13 40.6
Mbozi 25 18.5 24 48 140 37.3 15 46.9
Rungwe 9 6.8 1 2 1 0.3 - 0
Region 135 100 50 100 378 100 32 100
District Tractor % Plough % Cultivator % Harrow %
Chunya 14 5.4 8 2.8 - 0 4 2.9
Ileje 2 0.8 3 1.1 - 0 8 5.9
Kyela 35 13.5 35 12.5 3 7.3 23 17
Mbeya 100 38.5 146 51.9 14 34.1 66 48
Mbozi 79 30.4 79 28.1 22 53.7 25 18.5
Rungwe 30 11.4 10 3.6 2 4.9 9 6.8
Region 260 100 281 100 41 100 135 100
Source: Compiled data - Planning Commission based on Districts data bank.

109
4.1.4 FARM INPUTS Application of farm inputs has been hindered generally by time and
quantity factors. For instance, most of these inputs are not supplied at the right time and in sufficient quantities. This has caused frequently increase in prices which has resulted into falling productivity.
Table LVI:TREND OF FARM INPUTS 1985/86 - 1994/95 IN
CHUNYA DISTRICT Year Improved seed (tons) Fertilizer (tons)
Deman Suppl Shortage (%)
Dema Suppl Shortage (%)
1985/8 5.0 2.0 60% 2424.5 2047. 15.4%
1986/8 3.0 0.5 83.3% 2727.6 2131. 21.9%
1897/8 3.0 1.5 50% 2760.0 2061. 25.3%
1988/8 3.0 1.2 60% 2244.1 1767. 21.2%
1989/9 3.5 2.0 42.9% 1872.0 994.1 46.9%
1990/9 3.5 2.0 42.9% 2226.0 1981. 10.9%
1991/9 6.0 2.5 58.9% 1,984. 1637. 17.5%
1992/9 5.0 4.0 20.0% 3,143. 2143. 31.8%
1993/9 5.0 4.0 20.0% 3,513. 2445. 30.4%
1994/9 5 4.7 6% 4,317. 4642. +7%

110
Year Improved seed (tons) Fertilizer (tons)
Deman Suppl Shortage (%)
Dema Suppl Shortage (%)
Total 42 24.4 41.9% 27,213 21,85 19.7%
Source: Compiled data - Planning Commission based on District data bank.
Chart 37: Chunya Farm Inputs Supply and Demand, 1985/86 - 1994/95
1985/86 86/87 87/88 88/89 89/90 90/91 91/92 92/93 93/94 1994/950
2
4
6
Demand Supply
Error! Switch argument not specified. Chart 38: Chunya Fertilizer Supply and Demand, 1985/86 - 1994/95

111
1985/86 86/87 87/88 88/89 89/90 90/91 91/92 92/93 93/94 94/950
1
2
3
4
5
Demand Supply
Tons (Thousands)
Error! Switch argument not specified.4.2.5 IRRIGATION SCHEMES The district has 2.300.50 of potential land for irrigation. This is
equivalent to 10% of the total arable land. Most of this potential land (for Irrigation) is situated along lake Rukwa basin at Songwe division. Currently, no large scale irrigation farming takes place in Chunya district. Only small individual plots are found along river banks and within small valleys producing green vegetables. Table LVII (b) shows potential areas for Irrigation in Chunya district.
TABLE LVII (b): POTENTIAL LAND AREAS FOR IRRIGATION BY
DIVISION IN CHUNYA DISTRICT
Division
Potential land area
for irrigation
(Ha)
Estimated land area
under irrigation
(Ha)
Utiliz-
ation %
Crops grown
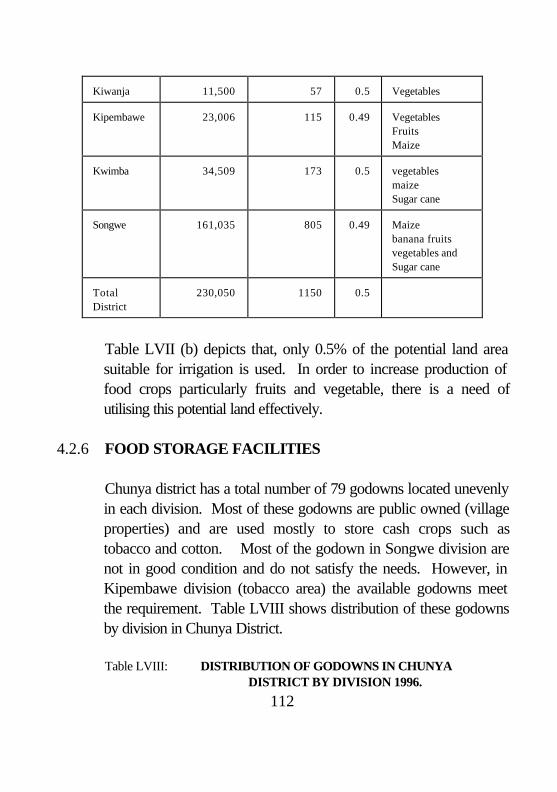
112
Kiwanja 11,500 57 0.5 Vegetables
Kipembawe 23,006 115 0.49 Vegetables Fruits Maize
Kwimba 34,509 173 0.5 vegetables maize Sugar cane
Songwe 161,035 805 0.49 Maize banana fruits vegetables and Sugar cane
Total District
230,050 1150 0.5
Table LVII (b) depicts that, only 0.5% of the potential land area
suitable for irrigation is used. In order to increase production of food crops particularly fruits and vegetable, there is a need of utilising this potential land effectively.
4.2.6 FOOD STORAGE FACILITIES Chunya district has a total number of 79 godowns located unevenly
in each division. Most of these godowns are public owned (village properties) and are used mostly to store cash crops such as tobacco and cotton. Most of the godown in Songwe division are not in good condition and do not satisfy the needs. However, in Kipembawe division (tobacco area) the available godowns meet the requirement. Table LVIII shows distribution of these godowns by division in Chunya District.
Table LVIII: DISTRIBUTION OF GODOWNS IN CHUNYA
DISTRICT BY DIVISION 1996.
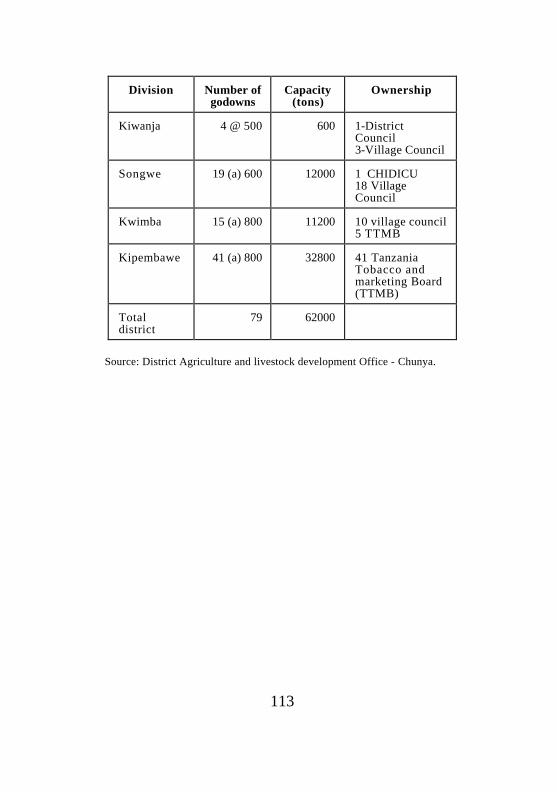
113
Division Number of godowns
Capacity (tons)
Ownership
Kiwanja 4 @ 500 600 1-District Council 3-Village Council
Songwe 19 (a) 600 12000 1 CHIDICU 18 Village Council
Kwimba 15 (a) 800 11200 10 village council 5 TTMB
Kipembawe 41 (a) 800 32800 41 Tanzania Tobacco and marketing Board (TTMB)
Total district
79 62000
Source: District Agriculture and livestock development Office - Chunya.

114
4.3.0 LIVESTOCK DEVELOPMENT The 1994/95 livestock census, revealed that, Mbeya region is
famous for livestock keeping. The region had (1994/95) 965,212 heads of cattle, 171,529 goats, 101,269 sheep and 67,921 pigs mostly indigenous breeds distributed in each district as depicted in table LIX.
Within Mbeya region, Chunya district ranks third in absolute
numbers compared to other districts when taking into account the total number of the four leading livestock units(cattle, sheep, goats and pigs) in the region. Mbeya district is first followed by Mbozi district.
Table LIX: DISTRIBUTION OF LIVESTOCK IN MBEYA REGION BY
DISTRICT (1994/95).
District Cattle Sheep Goats Pigs Total % total used
Chunya 135,36
5
16711 27791 3488 183355 14
Ileje 36,081 8,519 15,707 3,158 63,465 4.9
Kyela 40,243 1,361 1,909 6,303 49,816 3.8
Mbeya 512,526 53,226 80,282 17,006 663,040 50.8
Mbozi 188,184 15,313 37,316 19,349 260,162 19.9
Rungw
e
52,803 6,239 8,524 18,617 86,183 6.6
Total 965,212 101369 171529 67921 1306021 100

115
Source: Livestock Census 1994.

116
Table LX: LIVESTOCK GROWTH 1984 - 1994 - CHUNYA DISTRICT:
Year Cattle Goats Sheep Pigs
1984/85 120,731 23,795 13,756 1,765
1985/86 121,472 24,000 14,895 1,818
1986/87 129,324 24,125 15,497 1,945
1987/88 129,941 24,345 15,501 2,615
1988/89 129,512 25,435 15,675 2,706
1989/90 130,796 25,612 15,795 2,716
1990/91 131,341 25,661 16,356 3,306
1991/92 131,795 26,847 16,437 3,312
1992/93 132,614 26,915 16,515 3,333
1993/94 132,941 27,541 16,651 3,345
1994/95 135,365 27791 16711 3488
Source: DALDO Chunya.
From table LX it is observed that the number of livestock units
registered every consecutive year, between 1984 and 1994 has fairly increased.

117
Table LXI: LIVESTOCK GROWTH IN 1984/85 -1984/95 PERCENTAGE - CHUNYA DISTRICT
Livestock Units
1984/85
1994/95
% increase/d
ecrease
Cattle 120,731 135,365 12.1
Goats 23,795 27791 16.8
Sheep 13,756 16711 21.5
Chart 39: Livestock Growth in 1984/85 - 1994/95 in Chunya District
1984/85 1994/950
30
60
90
120
150
Cattle Goats Sheep
Table LXI shows that there has been a significant growth in
absolute numbers of livestock between the years 1984 and 1994. It is however, questionable if the quality of the animal products has equally improved. There is a dire need for livestock keepers to start up animal improvement programmes, either by cross breeding, improved animal feeds, as well as veterinary clinic services.

118
Table LXII: DISTRIBUTION OF LIVESTOCK IN THE DISTRICT BY WARD 1995
Division Wards Cattle Goats Sheep Pigs
KIWANJA
Chalangwa 5,506 740 270 137
Ifumbo 2,348 316 181 30
Mbugani 2,530 322 167 126
Itewe 656 264 20 37
Chokaa 6,586 10 113 72
Makongolosi 13,572 1,006 290 183
KIPEMBAWE K/katoto 200 31 21 -
Mafyeko 1,555 95 40 2
Matwiga 3,311 234 64 -
Mtanila 3,116 169 158 121
L/Tingatinga 7,293 1,009 233 170
Luwalaje 3,943 1074 388 127
KWIMBA
Ngwala 200 26 25 -
Gua - - - -
Kapalala 3,289 261 170 64
Mgangala 9,618 3,211 3,102 7
Mkwajuni 7,268 2,461 1,691 211
SONGWE
Namkukwe 19,743 8,000 3,546 384
Totowe 17,010 6,226 3,894 712
Mbuyuni 9,294 2,430 2,811 814
Galula 9,973 2,548 3,047 829
Kanga 8,350 3,725 2,606 541
Total District 135,365 34,15 22,837 4,567

119
Source: DALDO Chunya district.
Table LXII shows that Namkukwe and Totowe wards are leading compared to other wards in terms of total number of the cattle and sheep.
4.3.1 LIVESTOCK INFRASTRUCTURE The district has 4 Veterinary Health Centres, 1 livestock clinic, 7
dips, 3 abattoirs and 3 hides/skin houses. It has been established that the condition of these infrastructures has been deteriorating due to the fact that neither the district Council nor the Village Government have sufficient funds to maintain them properly.
Table LXIII Shows the number and condition of livestock
infrastructures in Chunya district.
Table LXIII: LIVESTOCK INFRASTRUCTURE IN CHUNYA DISTRICT 1996.
Facility Total Functioning
Not Functioning
Health Centre 4 3 1
Livestock Clinic 1 0 1
Dips 6 1 5
Abattoirs 3 3 -
Hides house 3 2 1
Source: DALDO Chunya

120
4.3.2 BEEF CATTLE PRODUCTION Chunya District has much is potential for beef cattle production, as
well as small scale dairy production, in identified areas like Kipembawe and Kiwanja divisions. Over 6515 Sq kms. is now free from tsetse fly infestation. Most of these range areas have temporary rivers, hence there is need for dams. Pastoralists are now settling in the tsetse infested areas, and through cultivation activities, and by the use of trypanocides, incidences of trypanosomiasis have been reduced.
4.3.3 FOOD ADEQUACY AND NUTRITIONAL STATUS Chunya District is able to produce food in surplus for her people.
The following table shows the trend of food crop production for the past five years.
TABLE LXIV: FOOD ADEQUACY IN CHUNYA DISTRICT BETWEEN 1991/92 AND 1995/96
Season Population (Projected
)
Food production
(Tons)
Food Demand (Tons)
Food Surplus/Sh
ortage (Tons)
1991/92 1992/93 1993/94 1994/95 1995/96
186465 192506 200206 208244 216550
75540 76948 83512 91098
110980
37450 38501 40412 41549 43310
38090 38447 43100 49549 67670
Source: DED - Chunya

121
Despite adequate food availability in the district, the nutritional
status is still below average. This is attributed to the large amounts of food crops sold outside the district and those used in brewing local drinks. The under-aged malnutritional problems are a result of inadequate supplies of meals to children, as parents are highly involved in productive activities.
The readily available data of Kwimba and Songwe (CSPD
Sampled areas) divisions, have shown some improved trends on elimination of severe malnutrition for the U5 children as shown below:-
TABLE LXV: NUTRITIONAL STATUS FOR 1995/96
Annual Quarters
Nutritional Status (Severe
Malnutrition)
1995 1996
I II III IV
3% 2.9% 2.7% 2.7%
2.1% 1.8% 0.8% 0.4%
Average 2.8% 1.3%
Source: DED - CSPD, Chunya

122
NB: It is the intention of the District to eliminate Severe malnutrition by the year 2000-under UNICEF programme.
4.4.1 FOREST
Out of the estimated 12,595,000 Ha. of forest in Mbeya region
396,400 Ha. are in Chunya district which is 3.1% of the total. These 396,400 Ha. of forest comprise forest reserve and proposed forest reserve. The proposed forest reserves are in the process of being gazetted.
Table LXVI: FOREST RESERVES AND PROPOSED FOREST
RESERVES IN CHUNYA DISTRICT:
Forest Reserve Area (Ha.) Proposed forest reserve
Area (Ha.)
1. Lukwati 19,514.16 1. Mbiwe 49,147.7
2. Lwipa 69,058.81 2. Patamela 200,000.0
3. Kipembawe 3,149.79 3.Sianimpala 930
4. North Lupa 5,052.63 4. Mtainula Hills 1,820
5. Kalongali 2,259.91 5. Itewe 2,045
6. Zira River 32,752
7. Itengu 10,670
Total 99,035.53 Total 297,364.7
Source: DNRO - Chunya.

123
4.4.2 FOREST PRODUCTS
Timber, poles and charcoal are the major products of forest sector.
It is estimated that the district wood demand annually is 2,620,580 m2 compared with available supply of 1,609,266 m3. This high demand of forest products depicts the widespread felling of trees (deforestation). The effect of felling trees has led to decline of soil fertility and drying up of water catchment areas and their sources. This has in turn affected negatively agricultural productivity. Table LXVII shows volume of timber, poles and charcoal harvested in the district during the period 1985 - 1995.
Table LXVII: FOREST PRODUCTS HARVESTED
Year Timber (M3)
Poles (M3) Charcoal (M3)
Total (M3)
1985 210 46.6 5,271.60 5,528.20
1986 73.3 104.0 9,034.40 9,211.70
1987 75.2 26.4 2,036.90 2,138.50
1988 108.5 39.6 2,033.33 2,181.43
1989 45.89 33.89 3,169.23 3,249.01
1990 104.32 24.0 2,836.50 2,964.82
1991 65.18 83.71 11,561.43 11,710.32
1992 99.49 53.71 3,345.60 3,498.80
1993 134.41 21.14 25,915.18 26,070.73
1994 447.3 49.28 26,262.00 26,758.58
1995 179.5 16.65 61,964.90 62,161.05

124
Total 1,543.09 498.98 153,431.07 155,473.14
Source: DNRO - Chunya.
Chart 40: Total Forest Products Harvested in Chunya District in Cubic Metres 1985 - 1995
1985 1986 1987 1988 1989 1990 1991 1992 1993 1994 1995
0
20
40
60
80
Error! Switch argument not specified.
It is further observed from table LXVII that, supply of the three forest products was 14,133.9 m3 on average for the period of 11 years between 1985 and 1995. Within the same period, data shows that, the lowest consumption of the three products was recorded in 1987 (2,138.5m3) while the highest consumption was recorded in 1995 (62,161.05 m3). Kipembawe and Kwimba division are famous for timber while Makongolosi, Chokaa and Mbangala wards are leading for charcoal production.

125
4.4.3 BEEKEEPING Beekeeping is one among the economic activities undertaken by
Chunya people. This economic activity is wholly under the private sector, and processing of honey and bees wax is done traditionally. It is estimated that, between 1985/86 and 1994/95 a total of 752617 kgs of honey and 53766 kgs of bees wax worth Tshs. 213,487,586 and Tshs. 51,274,600 respectively was harvested.
Table LXVIII indicates production of honey and bees wax in the
district (1985/86 - 1994/95). Table LXVIII: PRODUCTION OF HONEY AND BEESWAX (1985/86 - 1994/95) IN CHUNYA DISTRICT.
Year Honey Beeswax
Amount (kgs)
Value (Tsh.) Amount (Kgs)
Value (Tsh.)
1985/86 51,465 5,146,500.00 3,676 551,400.00
1986/87 34,410 4,576,530.00 2,458 491,600.00
1987/88 13,110 1,966,500.00 936 534,000.00
1988/89 47,000 8,514,000.00 3,378 1,013,400.00
1989/90 58,680 11,736,000.00 4,195 1,678,000.00
1990/91 72,600 19,384,200.00 5,186 2,593,000.00
1991/92 34,484 9,793,456.00 2,468 1,970,400.00
1992/93 36,568 10,970,400.00 2,612 3,134,400.00

126
1993/94 218,400 76,440,000.00 15,600 23,400,000.00
1994/95 185,600 64,960,000.00 13,257 15,908,400.00
Total 752,617 213,487,556.00 53,766 51,274,600.00
Source: DNRO Chunya.
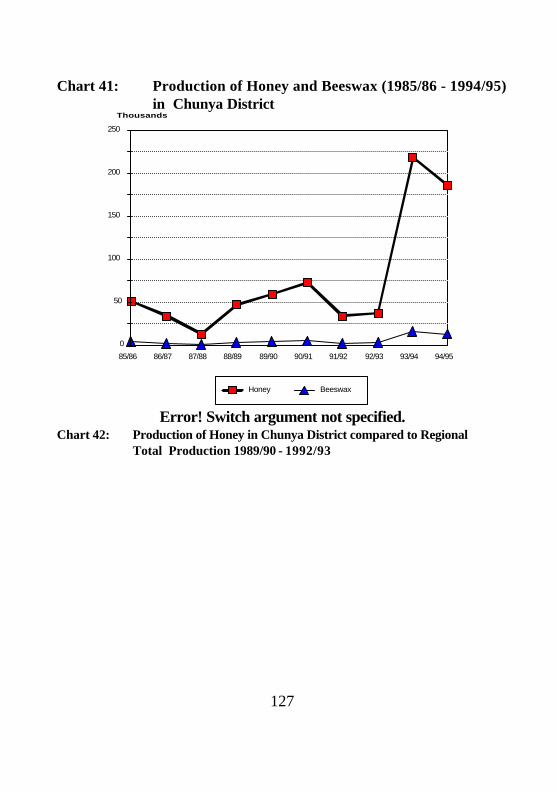
127
Chart 41: Production of Honey and Beeswax (1985/86 - 1994/95) in Chunya District
85/86 86/87 87/88 88/89 89/90 90/91 91/92 92/93 93/94 94/95
0
50
100
150
200
250
Honey Beeswax
Thousands
Error! Switch argument not specified.
Chart 42: Production of Honey in Chunya District compared to Regional Total Production 1989/90 - 1992/93

128
89/90 90/91 91/92 92/93 93/94 94/950
50
100
150
200
250
Mbeya Region
Chunya District
Kgs (Thousands)
Table LXIX: PRODUCTION OF HONEY AND BEESWAX IN CHUNYA
DISTRICT COMPARED TO REGIONAL TOTAL PRODUCTION 1989/90 - 1992/93:
Product/ year
Mbeya Region (kgs)
Chunya District
(Kgs) % District
Share
(a)Honey 1989/90
236,970
58,680
24.8
1990/91 85649.6 64,000 74.7
1991/92 63728.8 36835 57.8
1992/93 44283 36578 82.6
1993/94 233760 218400 93.4
1994/95 206880 187650 90.7
(b)Beeswax 1989/90
18520
3,676
19.8
1990/91 13049.6 2458 18.8
1991/92 63,728.8 936 1.5
1992/93 58,650.5 3378 5.8
1993/94 16464.0 2500 15.2
1994/95 15536 3400 21.9
Source: DNRO - Chunya.

129
Chart 43: Production of Beeswax in Chunya compared to Regional Total Production 1989/90 - 1994/95
89/90 90/91 91/92 92/93 93/94 94/950
20
40
60
80
Mbeya Region Chunya District
Kgs (Thousands)
Error! Switch argument not specified. As stated earlier,
processing of honey and beeswax is done traditionally hence there is need to introduce modern or improved beehives and some improved or modern technology in honey and beeswax processing. All division except Kiwanja division are famous for honey and beeswax production.
4.4.4 FISHERIES
The fishing industry in Chunya district is not yet well developed. It
is estimated that, fish catch in this district ranges from 7 mt to 60 mt annually depending on availability of fish and fish gears. The use of old fish gears has also contributed towards low fish catch. The major fishing area in the district includes, Lake Rukwa, River Songwe and Lupa. Table LXIV shows the estimated quantity of fish catch between 1985/86 and 1994/95.
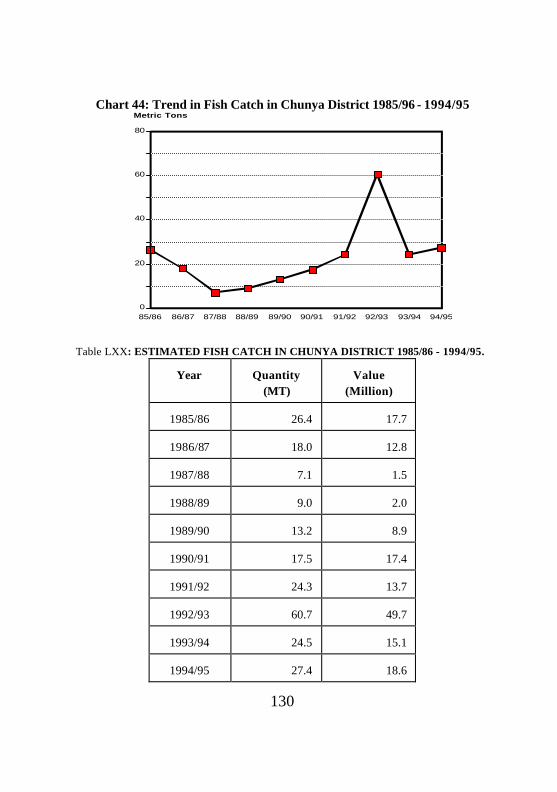
130
Chart 44: Trend in Fish Catch in Chunya District 1985/96 - 1994/95
85/86 86/87 87/88 88/89 89/90 90/91 91/92 92/93 93/94 94/950
20
40
60
80
Metric Tons
Table LXX: ESTIMATED FISH CATCH IN CHUNYA DISTRICT 1985/86 - 1994/95.
Year Quantity (MT)
Value (Million)
1985/86 26.4 17.7
1986/87 18.0 12.8
1987/88 7.1 1.5
1988/89 9.0 2.0
1989/90 13.2 8.9
1990/91 17.5 17.4
1991/92 24.3 13.7
1992/93 60.7 49.7
1993/94 24.5 15.1
1994/95 27.4 18.6

131
Source: DNRO Chunya.
Error! Switch argument not specified.
4.4.1 PROBLEMS FACING FISHING INDUSTRY The fishing industry in the district is faced with an acute shortage of
modern fishing gear. On top of that the existing large number of crocodiles in Lake Rukwa is also a major problem. It is said that each crocodile consumes an average of 10 kgs. of fish per day. On the other hand, supervision and dissemination of knowledge to fishermen is hindered by lack of reliable means of transport. The district is also faced with a shortage of qualified manpower. There is therefore need to improve the fishing industry by providing modern fishing gear, training of staff and improving processing and preservation of fish.
4.5.0 TOURISM The district has one Game Reserve at Lakwati with a total area of
2000 sq. kms. This reserve is situated between Kwimba and Kipembawe divisions. The major activity here is hunting. Effective hunting in Lukwati Game reserve only started in 1993, and as the result, to-date not much investment has so far been made in this area.
Lukwati Game reserve has about 68 varieties of animals, but the
common ones are: buffalos, baboons, bushpigs, bushbucks, waterbucks, hippopotamus, crocodiles, hyenas, leopards and lions to mention a few.

132
Currently, two companies are hunting in this game reserve. Within a period of time revenue collected from hunting has amounted to Tsh. 18,660,000.00 by 1995 as table LXXI depicts.
Table LXXI: REVENUE COLLECTION TREND FROM HUNTING
Year Amount Collected (Tshs.)
% increase/decrea
se
1993 3,000,000.00 -
1994 5,160,000.00 72
1995 10,500,000.00 103
Total 18,660,000.00
Chart 45: Distribution of Revenue Collection Trend From Hunting
in Chunya District (Tshs.), 1993 - 1995

133
1993
16.1%
1994
27.7%
1995
56.3%
4.6.0 MINING Mining in Chunya district is undertaken by small miners. Despite
the fact that, the district has variety of mining deposits, only gold is mined and sold to legal buyers. During the period of 1990 - 1994 the NBC branches in the district bought 652,960 grams of gold worth Tsh. 2,207,182,625. Table LXXII indicates this trend of gold bought by NBC yearly.
Error! Switch argument not specified.

134
Table LXXII: TREND OF GOLD BOUGHT BY NBC - CHUNYA DISTRICT 1990 - 1994.
Year Amount (grams)
Value (Tshs) % Increase/de
crease (grams)
1990 88,035 189,752,255.00
1991 204,056 612,168,000.00 +131.8
1992 229,426 866,153,653.00 +12.4
1993 107,268 429,731,637.00 -53.2
1994 14,175 109,377,080.00 -77.5
Total 652,960 2,207,182,625.00
Source: DNRO - Chunya.
Chart 46: Trend of Gold Bought by NBC - Chnuya District 1990 - 1994

135
1990 1991 1992 1993 19940
50
100
150
200
250
300Grams (Thousands)
There has been fluctuations of quantities and values of gold bought
by NBC. The main reason could be that the incentives provided by NBC to gold miners are not adequate. Thus, a bigger potion is sold through the back market to illegal buyers.
The leading areas for mining is Kiwanja division (gold) Mkwajuni
and Mbangala wards in Kwimba division. 4.6.1 PROBLEMS FACING THE MINING INDUSTRY The Mining Industry in Chunya District is faced with an acute
shortage of modern mining equipment. Most of these artisanal miners, are financially poor, and they are unable to acquire modern equipment. In addition they lack reliable markets for their gold, as well as credit, as they have no collaterals.
4.6.2 THE ADVERSE IMPACTS OF MINING

136
• Apart from small-scale maize and beans farming, Kiwanja Division has no cash crop, because most of the people are engaged in mining activities.
• Alluvial gold -mining as a main economic activity is now
deteriorating as a result of which deep mining, which is expensive and risky to small-scale mines is now required.
• The mined areas are left bare and infertile. • Mining has encouraged migration of the Sukuma,
Nyakyusa, Nyiramba etc to Chunya who earn from the mines without investing in the district.
4.6.3 GOLD MINING POTENTIAL
Organised and systematic goldmining in Chunya area started as
early as in 1930's under British Companies, at Itumbi and Saza. Both surface alluvial mining and deep-shaft mining methods were practiced as early as 1939.
Surveys done by Russians in 1974 showed a high potentialn of the
gemstones. The Techno-Export of Evaluation Report of 1974 indicated reserve of 3.3 million tons of gold. 30 other companies have been licensed to undertake research on further potentiality of the gemstones. Results from these companies involved in the research are expected to increase the production rate of gold by modern mechanized machines.
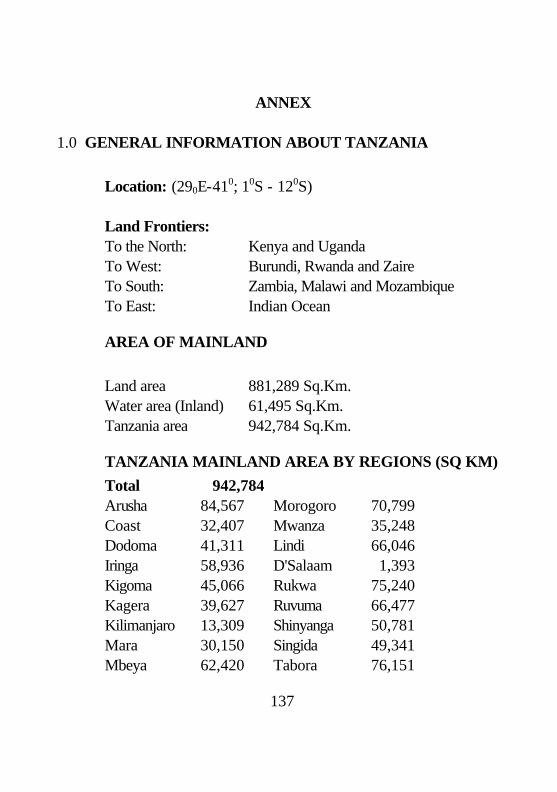
137
ANNEX
1.0 GENERAL INFORMATION ABOUT TANZANIA
Location: (290E-410; 10S - 120S) Land Frontiers: To the North: Kenya and Uganda To West: Burundi, Rwanda and Zaire To South: Zambia, Malawi and Mozambique To East: Indian Ocean
AREA OF MAINLAND Land area 881,289 Sq.Km. Water area (Inland) 61,495 Sq.Km. Tanzania area 942,784 Sq.Km.
TANZANIA MAINLAND AREA BY REGIONS (SQ KM)
Total 942,784 Arusha 84,567 Morogoro 70,799 Coast 32,407 Mwanza 35,248 Dodoma 41,311 Lindi 66,046 Iringa 58,936 D'Salaam 1,393 Kigoma 45,066 Rukwa 75,240 Kagera 39,627 Ruvuma 66,477 Kilimanjaro 13,309 Shinyanga 50,781 Mara 30,150 Singida 49,341 Mbeya 62,420 Tabora 76,151

138
Mtwara 16,707 Tanga 26,808
Population
TOTAL POPULATION AND LIFE EXPECTANCY FOR TANZANIA - BY REGIONS, 1967, 1978, 1988, 1996.
REGION
TOTAL POPULATION LIFE EXP. 1988
1967 (No.) 1978 (No.) 1988 ('000)
1996** ('000)
M Yrs
W Yrs
Dodoma Arusha Kilimanjaro Tanga Morogoro Coast Dar es Salaam Lindi Mtwara Ruvuma Iringa Mbeya Singida Tabora Rukwa Kigoma Shinyanga Kagera Mwanza Mara
709,380 610,474 652,722 771,060 682,700 428,041 356,286 419,853 621,293 395,447 689,905 753,765 457,938 502,068 276,091 473,443 899,468 658,712
1,055,883 544,125
972,005 926,223 902,437
1,037,767 939,264 516,586 843,090 527,624 771,818 561,575 925,044
1,079,864 613,949 817,907 451,897 648,941
1,323,535 1,009,767 1,443,379
723,827
1,234.9 1,348.4 1,106.0 1,307.3 1,254.0
636.5 1,357.6
645.0 887.4 781.4
1,206.0 1,472.7
789.9 1,033.8
693.3 857.8
1,768.6 1,358.8 1,874.4
968.6
1,472.5 1,784.0 1,703.5 1,521.8 1,519.4
740.9 1,945.7
744.8 976.7
1,001.3 1,472.9 1,857.0
949.4 1,232.6
954.7 1,047.6
2,194.83 1,659.5 2,270.9 1,202.0
57 46 50 45 44 44 47 57 46 46 45 45 44 46 44 48 48 54 53 48
58 51 50 47 47 45 49 62 48 48 48 48 48 50 47 50 51 55 54 51
Tanzania Mainland 11,958,654 17,036,499 22,582.4 28,252.2 49 51
Zanzibar North Zanzibar South Zanzibar Urban Pemba Pemba
56,360 39,087 95,047 72,015 92,306
77,017 51,749
142,041 106,290 99,014
97.1 70.2
208.4 137.4 127.7
119.0 91.8
290.4 172.6 160.4
46 45 46 46 45
47 50 52 48 50
Zanzibal Is. 354,815 476,111 640.7 834.2 46 49
Tanzania United Rep.
12,313,469 17,512,610 23,223.1 29,086.4 47 50

139
Note: The projections are based on the national Population Census of 1988, and the calculated growth rates since the 1978 census.
Source: Bureau of Statistics.
Land Use
(Ha (millions) Proportion Small holder cultivation 4.1 5% Large scale agriculture 1.1 1% Grazing Land 35.0 39% Forest and Wood Lands 44.0 50% Other Lands 4.4 5% Total 88.6 100%
Arable Land
Arable Land (Ha) 3,634,000
Lakes
Victoria 34,850 sq km Tanganyika 13,350 sq km Nyasa 5,600 sq km Rukwa 2,850 sq km Eyasi 1,050 sq km Natron 900 sq km Manyara 320 sq km
Mountain summits (metres above sea level)
Kilimanjaro 5,895 Meru 4,566

140

141
Climate
(a) Rainfall
Main rain season on the coast is between March and May
and the second season is between October and December. Rainfall is well distributed throughout the year but there is a peak during March and May.
Average maximum temperature (degrees centigrade) Jan. Apr. July October Dar es Salaam 31.6 30.1 28.6 31.3 Arusha 28.9 25.3 21.1 27.3 Dodoma 31.4 28.4 26.0 30.2 Average manimum tempereture (degrees centigrade) Jan. Apr. July October Dar es Salaam 23.3 22.9 18.3 31.3 Arusha 12.2 16.9 12.6 27.3 Dodoma 19.2 13.5 16.2 30.2 Gross Domestic Product at factor cost (billion Shs.) 1992. At current price 688.0 At constant prices 32.2 GDP growth rate at 1976 prices 1985-92 3.69% Per capita 27,355 At current price 27,355 At constant price 1,280

142

143
1.2 SOCIAL SERVICES
HEALTH FACILITIES
YEAR HOSPITALS RHC DISPENSARIES 1960 98 22 975 1980 149 239 2,600 1990 173 276 3,014
Education: Enrolment rates 1990 compared with other east Africa countries
COUNTRY GROSS ENROLLMENT
PRIMARY SECONDARY
KENYA UGANDA TANZANIA
94
76
63
23
13
4

144
NATIONAL PARKS National Parks (area in sq km)
PARK LOCATION AND PARTICULARS
(i) SERENGETI NATIONAL PARK
LOCATION: At the border of Arusha & Mara Region, about 32 km from Arusha town AREA SIZE: 14,763 square km. It is the largest and oldest Park in Tanzania having been established under the British Colony in 195l. It contains the greatest and most spectacular concentration of plain animals left any where in Africa. MAJOR ATTRACTIONS: Wildebeest about 1.7 million, Lions 3,000. About 35 species of animals and 500 species of birds, Buffalos, Chetah, Leopards etc.
(ii) LAKE MANYARA NATIONAL PARK
LOCATION: Some 125 Kilometres South West of Arusha town. It was officially established and gazzetted as a National Park in 1960. AREA: Lake Manyara National Park covers a total area of 320 square kilometres, 230 kilometres constituting Lake Manyara itself. MAJOR ATTRACTIONS: The Rift Valley edge on the West with the vast lake underneath. Natural forest with many natural rivers and springs. Tree-climbing lions, various species of animals plus about 360 species of birds, Elephants, Hippos, Leopards, Baboons etc.
(iii) TARANGIRE NATIONAL PARK
LOCATION: South of Arusha town along the Dodoma Highway. It was established in l970. AREA: Tarangire National Park covers some 2,600 Square kilometres. MAJOR ATTRACTIONS: Tree climbing pythons, zebra, kongoni, elephant, buffalo, waterbuck, gazettes and oryx.

145
(iv)ARUSHA NATIONAL PARK (MOMELA)
LOCATION: The Park is located between Mount Meru and Mount Kilimanjaro. Formally Ngudoto National Park until 1967. Was commissioned as National Park in 1960. AREA: The park covers some 137 square Kilometres. MAJOR ATTRACTIONS: Ngurdoto Crater, Lake Momella, Mount Meru and the Natural Momela Forests. There are many species of Animals and birds. The most common being African elephant, colobus and velvet monkey, hippo, duicker and a number of bird species.
(v)KILIMANJARO NATIONAL PARK
LOCATION: The Kilimanjaro National Park which derived its name from Mount Kilimanjaro is part and parcel of the Mountain. It was established in 1973. AREA: The bounderies of the Park include the natural forest under and around the Mountain. It covers some 760 square Kilometres. MAJOR ATTRACTIONS: Mount Kilimanjaro with its three peaks Shira (3,962 metres) Mawenzi and Kibo (5,149 and 5,895 metres respectively) above sea level form the largest part of the Park's attraction. There are also various species of Animals, plants and birds.
(vi)MIKUMI NATIONAL PARK
LOCATION: It is situated some 216 km along the Dar - Zambia Highway. It was established in 1964. AREA: Mikumi National Park which borders with Africa's largest Game reserve, the Selous is the third biggest National Park after Serengeti and Ruaha National Park and covers 3230 sq km. MAJOR ATTRACTIONS: The plains sorrounding River Mkata which are rich in flora and fauna are by themselves a wonderful scenarial. The common animals found in the park include zebra, buffalos, elephants, Hippos, lions and the Impalas.

146
(vii)UDZUNGWA NATIONAL PARK
LOCATION: This Park is located South of Mikumi National Park along the Mikumi-Ifakara Highway. The Park was established in 1992. AREA: The Park which derives its identity from the famous Udzungwa mountain has an area of 1990 square kilometres. MAJOR ATTRACTIONS: Its unique species of Fauna and Flora which called for its declaration as a National Park. The Udzungwa Mountains and Forests are a good source of Rivers and springs, one of them being the famous Kilombero River, which constitutes the essential part of the multi-hactoral its total Kilombero Sugar Plantations. Additional attractions: Lions, Buffalos, Giraffes etc.
(viii)RUAHA NATIONAL PARK
LOCATION: The name Ruaha, is derived from the Hehe word "Luvaha" meaning a river. AREA: Park covers an area of 12,950 square kilometres, the second largest in the country. Ruaha National Park which was established in 1964 is situated some 130 km west of Iringa town. MAJOR ATTRACTIONS: The Ruaha River by itself is an attraction, leave alone some hundreds of species of Flora which sorround it. Besides there are a lot of Crocodiles, Hippos, Elephants etc.
(ix) KATAVI NATIONAL PARK*
LOCATION: It is located in Mpanda District, Rukwa Region. It was established in 1974. AREA: The Katavi National Park which is about 40 kilometres South -East of Mpanda town covers an area of 2,253 square kilometres. MAJOR ATTRACTION: Lakes Chala and Chada plus other springs and rivers whose waters feed into lake Rukwa constitute a unique environment. Animals in the park include zebra, sable, eland, leopard, buffalo, lion, antelops etc. Animals like, Buffalos, Elephants, Zebras and BushBucks are a good attraction to visitors.

147
(x)MAHALE NATIONAL PARK
LOCATION Located some 120 south of Kigoma town along the shores of lake Tanganyika, Mahale National Park is yet another attraction in Tanzania's Natural Heritages. AREA: Mahale nation Park has about 1,613 square kilometres and was gazzetted in 1948. MAJOR ATTRACTIONS:Chimpanzees are a major attraction. Also there is a good number of monkey species including red colobus monkeys. It is estimated that there are 700 Chimpanzees in Mahale and 15 species of monkeys whose habits tally with those of the Chimps.
(xi) GOMBE NATIONAL PARK
LOCATION Gombe National Park is situated 16 km north of Kigoma town in western Tanzania. It is a narrow strip of mountainous country bounded in the east by the eastern rift valley escarpment and by lake Tanganyika in the west AREA: Covering some 52 square kilometres. National park, was commssioned in 1968. MAJOR ATTRACTIONS:Ever green forests and primates. These include Chimpanzees, Baboons, blue monkey red tails and red colobus.
(xii) RUBONDO NATIONAL PARK
LOCATION: The Park which form park of a number of archipelagos in Lake Victoria covers some 240 square Kilometres. it was established in 1977 MAJOR ATTRACTIONS: The Chimpanzees. But other attractions include, Hippos, Giraffes, and Elephants. the absence of man-eaters such as Lions & Leopards ensures a safe walk in Rubondo Park even some fishing activities with boats under Park wardens are carried out.
(xiii) NGORONGORO
LOCATION: It is situated west of Arusha town some 230 kms. AREA: The park covers 8320 sq km MAJOR ATTRACTION: Wildebeest, Lions, Buffalos, Leopards, Variety of birds species, Giraffes, elephans etc