socio-economic and resource profile analysis of
TRANSCRIPT
ResearchBulletin
62
Mukesh Kumar SinhaPrabhakar NandaAshwani KumarGanesh P. Behra
20132013
(An Outcome of VDSA Project)(An Outcome of VDSA Project)
SOCIO-ECONOMICAND RESOURCE PROFILE ANALYSIS OF CHANDRASEKHARPUR VILLAGE
SOCIO-ECONOMICAND RESOURCE PROFILE ANALYSIS OF CHANDRASEKHARPUR VILLAGE

Research Bulletin 62
2013
Mukesh Kumar SinhaPrabhakar NandaAshwani KumarGanesh P. Behra
SOCIO-ECONOMIC AND RESOURCE PROFILE ANALYSISOF CHANDRASEKHARPUR VILLAGE
(An Outcome of VDSA Project)(An Outcome of VDSA Project)

Correct citation
Mukesh K. Sinha, Prabhakar Nanda, Ashwani Kumar and Ganesh P. Behra
(2013). Socio-Economic and Resource Profile Analysis of Chandrasekharpur
Village. Research Bulletin No. 62, Directorate of Water Management (Indian
Council of Agricultural Research), Chandrasekharpur, Bhubaneswar-751023
Orissa, India. pp-29.
Published By
Dr. Ashwani Kumar
Director, Directorate of Water Management
(Indian Council of Agricultural Research)
Bhubaneswar-751023, Odisha, India.
Copy Right
© Director, Directorate of Water Management
Bhubaneswar-751023, Odisha, India.
Printed at
Space Setter Press and publicity (P) Ltd.
84, Chandaka Industrial Estate,
In front of KIIT, Patia, Bhubaneswar
CONTENTS
Contents Page No.
Chandrasekharpur Village: An Overview 1
1. Introduction 2
2. The District Dhenkanal 3-5
2.1 History of Dhenkanal 4
2.2 Natural Sub-Divisions 5
2.3 Climate and Vegetation 5
3. The Chandrasekharpur Village 6-7
3.1 History of the Village 6
3.2 Location of the Village 6
3.3 Physical Features 7
3.4 Development Milestones of Chandrasekharpur Village 7
4. Population and Village Society 8-13
4.1 Demographic Structure 8
4.2 Age-wise Population Distribution 8
4.3 Gender Composition 9
4.4 Social Class and Caste Structure 10
4.5 Culture 11
4.5.1 Kapilash Temple and the Village 12
5. Agriculture/Assets/Options 14-20
5.1 Size of Landholding 14
5.2 Soil and Irrigation 15
5.3 Crops and Cropping Pattern 15
5.4 Preference of Paddy Seed Variety 16
5.5 Agriculture Dynamics and Farmer Economy 17
5.6 Livestock 19
5.7 Farm Machinery and Implements 20

6. Economic Situation of Chandrasekharpur 21-23
6.1 Source of Income 21
6.2 Occupational Patterns 21
6.3 Incidence of Migration 23
7. Social Institutions and Need-based Preference 24-24
7.1 Public Institution and Utility based Ranking 24
8. Health Care and Sanitation 25-25
8.1 Health Care Facility 25
8.2 Drinking Water 25
8.3 Sanitation 25
9. Market, Transport and Communication 26-26
9.1 Markets 26
9.2 Transport 26
9.3 Communication 26
9.4 Electricity 26
10. Problems and Opportunities in the Village 27
11. Infrastructural Facilities in village 28
Acknowledgement 29

List of Tables
Table No. Contents Page
Table 1 Important Milestones of Chandrasekharpur 7
Table 2 General Characteristics of Households 8
Table 3 Total Population by Sex in Chandrasekharpur 10
Table 4 Inequality Measure of Own Land in the village 14
Table 5 Changing Crop Pattern in Chandrasekharpur 16
Table 6 Farmers’ Preference of Paddy Seed Variety 16
Table 7 Agricultural Biodiversity and Crop Ecological Dynamics
During 1970-2010 in Chandrasekharpur 18
Table 8 Population by Livestock Species in Chandrasekharpur 19
Table 9 Inequality Measure of Livestock in the village 19
Table 10 Households having Machines in the Village 20
Table 11 Occupational Diversification across farm categories 22
Table 12 Developmental Infrastructure in Chandrashekarpur 28

List of Figures
Fig. No. Contents Page
Figure 1 District Map of Dhenkanal in Odisha 3
Figure 2 Field Investigator Interacting with Farmers 4
Figure 3 Average Rainfall Graph of Dhenkanal 5
Figure 4 Chandrasekhapur Village under Gondia Block map 6
Figure 5 Demographic Distribution in Chandrasekharpur 9
Figure 6 Female Sex Ratio per 1000 male in Chandrasekharpur 9
Figure 7 Social Composition across Farmers Categories 10
Figure 8 Village Deity Worshipped under Banyan Tree 11
Figure 9 Kapilas Temple: Source of Deep Faith 12
Figure 10 Social and Resource Map of Chandrasekharpur Village 13
Figure 11 Average Operational Landholding across Farmers 14
Figure 12 Lorenz Curve of Own Land in Chandrasekharpur 15
Figure 13 Traditional farm with least mechanisation 17
Figure 14 A Pile of Paddy Straw for Livestock Fodder 19
Figure 15 Lorenz Curve of Livestock in Chandrasekharpur 20
Figure 16 Power Tiller v/s Plough: Sides of the same Coin 20
Figure 17 Counting Coins: A Miserable Livelihood Option 21
Figure 18 Diversification of Working Population 22
Figure 19 Daily Needs Family Shop in the Village 22
Figure 20 PRA Exercises in Chandrasekharpur 23
Figure 21 Incidence of migration across farm categories 23
Figure 22 Public Institutions: Households’ Preference and their
Location 24
Figure 23 Women Lifting Drinking Water from Dug-well 25
Figure 24 TV : Modern Source of Information 26
Figure 25 Solar Plate: Alternative Energy Option 26

Chandrasekharpur Village: An Overview
Chandrasekharpur village, located on geographical coordinates of 20°42'48" N
and 85°42'50" E, is 27 km away from district headquarter Dhenkanal and 13 km
from sub-divisional block of Gondia. It is at the foot hill of Kapilas, surrounded
by forest and hills. Natural vegetation with Sal, Mahua, Palas and Sagwan trees
are widely seen around the locality.
Livelihood mainly depends on agriculture and allied activities. As most of the
lands have no irrigation facility and water availability, the agriculture is highly
rain fed and very difficult to mechanize. Even if the inputs are made available,
the resource poor farmers had no money to buy those as a result of which they
had no option but to rely on subsistence nature of farming. Paddy is the only
crop cultivated in the Kharif season and black gram and green gram in Rabi
season. Due to the non-availability of gainful employment until recently, most of
the people started migrating to nearby towns to work in constructions on daily
basis.
The population under earning age constitutes 66 per cent of the total
population. So the age composition of the village is very healthy as very small
size is dependents. In spite of large earning age group, a sizable population (55
per cent) has no or little land restricting the economic activity of population. The
village is rich in red soil. Alluvial soil is found in the low land, which is used for
paddy cultivation. Most of the soil structure is not conducive for crop cultivation
but ideal for plantation. So these areas are surrounded by cashews, mangoes
and teak trees.
Highly under developed state of the village is quite visible and also reflected by
the poor social indicators such as low literacy, poor sex ratio, poor source of
irrigation, low production and productivity, low farm mechanization etc. The
role of the women is also very limited and otherwise engaged in day to day
domestic activities. This traditional outlook of the society restricts them to come
out from household boundaries.
There is no organized market, nor society for crops, milk and livestock. The non-
accessibility of market is a big issue for the local people for agriculture product
and sale and purchase of livestock. This results in unfavorable market price and
discourages production output. The status of socio-economic infrastructure is
very meager. People need the awareness about health and hygiene. Hence, the
development of village is very slow but is in progress.

2
1. Introduction
A mega Project on Tracking Change in Rural Poverty in Households and
Village Economies in South Asia is being undertaken by National Centre for
Agricultural Economies and Policy Research (NCAP), New Delhi and
International Crops Research Institute for Semi-Arid Tropics (ICRISAT),
Hyderabad. For Eastern India, Directorate of Water Management Bhubaneswar
is the implementing agency of the project in Odisha villages. The Project aims at
understanding the dynamic process for reducing poverty in the poverty-laden
agro-ecologies of Eastern India by tracking the households and village
economies continuously. The Eastern region of India is one of the most poverty-
laden regions in terms of both prevalence rates and total numbers. Reducing
poverty in Eastern India has been a big challenge and the successful
implementation of this project is expected to contribute to our understanding of
the complex poverty dynamism in the region.
The overall objective of the Project is to help evolve appropriate and effective
strategies for accelerated reduction of poverty in Eastern India. Specific
objectives of the project are:
• To enhance the availability of reliable household, individual and field-
specific high frequency time series data in selected villages, and to address
dynamics of economic, social, and institutional development at meso-level
(e.g. district level), and
• To nurture policy analysis and strengthen capacity building for poverty
reduction in the Eastern Region of India.
Collection of longitudinal data on households, individuals and field levels in
selected villages is one of the major activities. Twelve villages have been
selected for continuously tracking the changes in rural economies under the
Project. The village Chandrasekharpur of Dhenkanal district of Odisha is one of
the selected village. Before selection of sample households for continuous
monitoring, the village census has been conducted in each selected village to
understand the general and the socio-economic profile of the village.
This village profile is based on the village census carried out and qualitative
information gathered by the project team.
3
2. The District Dhenkanal
Dhenkanal is one of the centrally positioned districts of Odisha. The district is
spread over an area of 4595 square km that stretches across the geographical
coordinates of 20° 29' to 21° 11' North latitude and 85° 58' to 86° 2' East
longitude. As per 20011 census the District has a population of 11,92,948.
The District of Dhenkanal is bound on the east by the Jajpur district. Keonjhar
district lies to the north. The district of Angul borders Dhenkanal on the west.
On the south lies the district of Cuttack. The district is 99 km away from capital
Bhubaneswar on National Highway No. 42. Regular bus services connect
Dhenkanal with Bhubaneswar, Cuttack, Puri, Rourkela, Sambalpur, Raipur, etc.
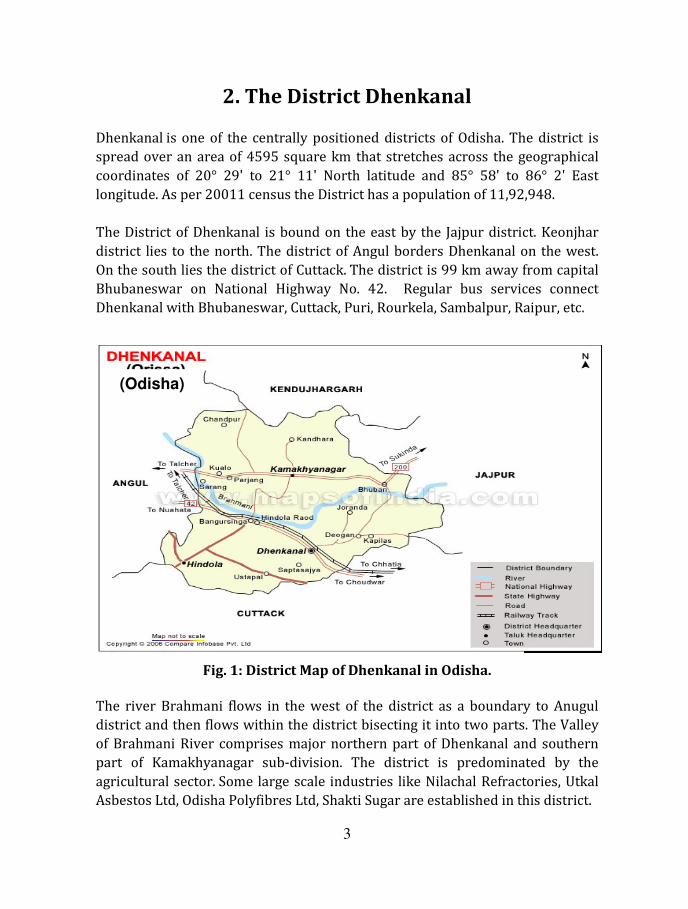
Fig. 1: District Map of Dhenkanal in Odisha.
The river Brahmani flows in the west of the district as a boundary to Anugul
district and then flows within the district bisecting it into two parts. The Valley
of Brahmani River comprises major northern part of Dhenkanal and southern
part of Kamakhyanagar sub-division. The district is predominated by the
agricultural sector. Some large scale industries like Nilachal Refractories, Utkal
Asbestos Ltd, Odisha Polyfibres Ltd, Shakti Sugar are established in this district.
(Odisha)
4
2.1 History of Dhenkanal
It is believed that the district derives its name from Dhenka, the Savara chief
who reigned in the region. The district was influenced by the religious
movement of Mahima Dharma. The district is marked by the presence of several
pilgrim sites. The economy of the district is influenced by the large scale
industries like the Odisha Polyfibres Limited, Nilachal Refractories, Shakti Sugar
and Utkal Asbestos Limited. The forest and its products are also important
components that influence the economy of the district. Rich in flora and fauna,
the forests are home to a number of endangered variety of plants and animals.
The forest is home to the elephants and tigers.
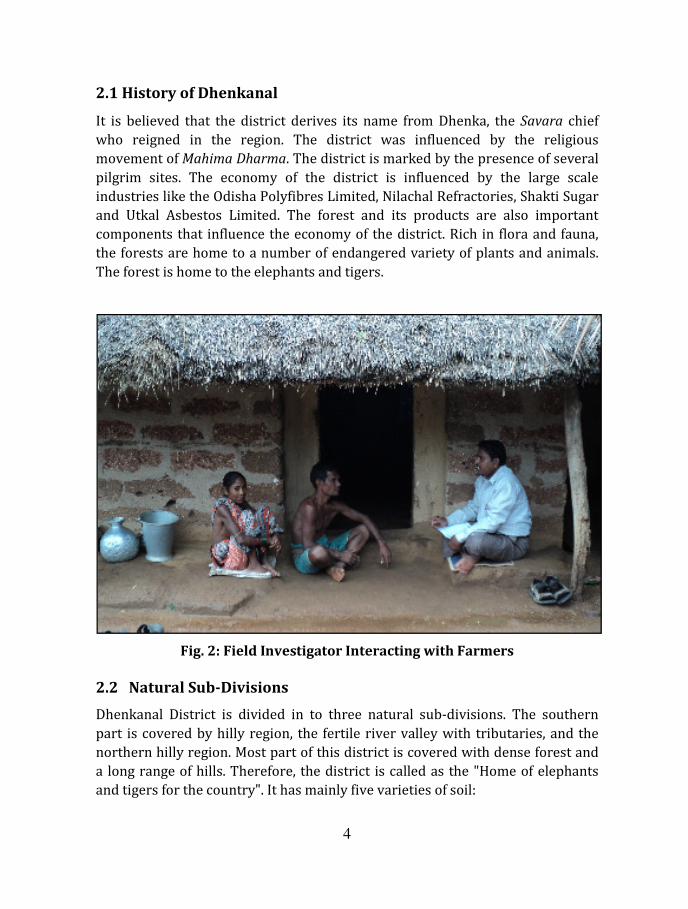
Fig. 2: Field Investigator Interacting with Farmers
2.2 Natural Sub-Divisions
Dhenkanal District is divided in to three natural sub-divisions. The southern
part is covered by hilly region, the fertile river valley with tributaries, and the
northern hilly region. Most part of this district is covered with dense forest and
a long range of hills. Therefore, the district is called as the "Home of elephants
and tigers for the country". It has mainly five varieties of soil:

5
• Alluvial soil (available in river valley)
• Red loam soil (available in highland)
• Sandy loam soil (found in yatches)
• Gravelly soil (found in hill slopes)
• Cleaving loan soil (found throughout the district)
The topography of Dhenkanal district is marked by the hilly regions and the
valley formed by the river that flows in the district. The total population of the
district is 10,65,983 according to the census conducted in the year 2001.
Majority of the people of the district are engaged in the occupation of
agriculture.
2.3 Climate and Vegetation
The climate of this district is generally hot with high humidity during April and
May and cold during December and January. The monsoon generally breaks
during the month of June. The main forest products are timber, bamboo,
firewood, and Kendu leaves. Normal rainfall 1421.1 mm and actual rain fall in
last year (2012) was 1300 mm. The pattern of rain fall supports only two
cropping season’s Kharif and Rabi. Paddy is the major kharif crop and Wheat,
Maize, Ragi, Mung, Biri ,Kulthi ,Till, Groundnut, Mustard, Jute, Potato, Sugarcane
are among the Rabi crops.
Fig. 3 : Average Rainfall graph of Dhenkanal
6
3. The Chandrasekharpur Village
3.1 History of the Village
The village established on the landed property of God Kapilas (Debotter Land).
The residents have no permanent land possession document. And they are living
generations after generations with a feeling that, they are protected by the
divine bless of Lord Chandrasekhar, hence the village named as
Chandrasekharpur.
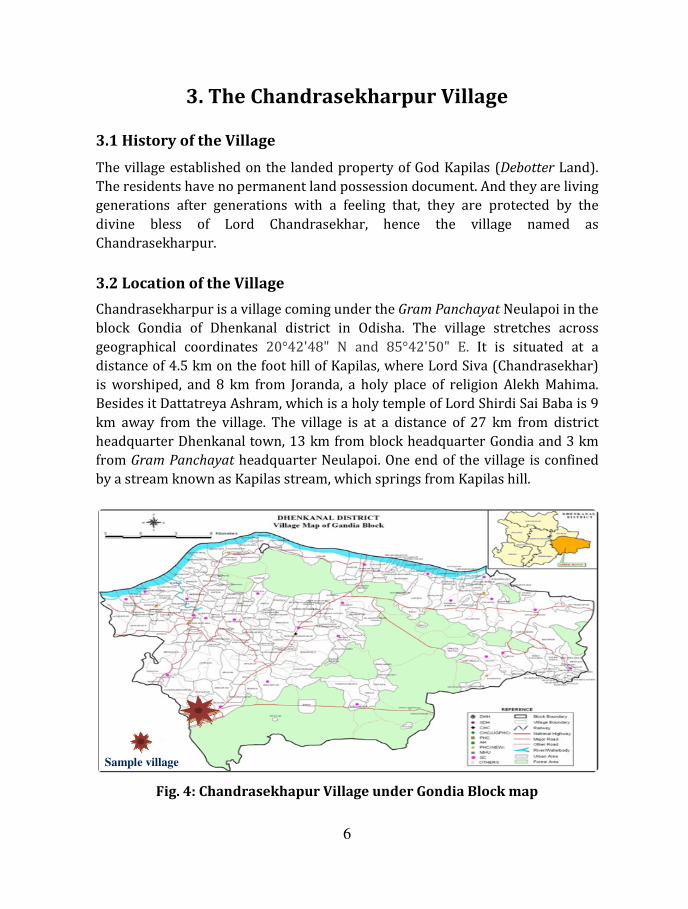
3.2 Location of the Village
Chandrasekharpur is a village coming under the Gram Panchayat Neulapoi in the
block Gondia of Dhenkanal district in Odisha. The village stretches across
geographical coordinates 20°42'48" N and 85°42'50" E. It is situated at a
distance of 4.5 km on the foot hill of Kapilas, where Lord Siva (Chandrasekhar)
is worshiped, and 8 km from Joranda, a holy place of religion Alekh Mahima.
Besides it Dattatreya Ashram, which is a holy temple of Lord Shirdi Sai Baba is 9
km away from the village. The village is at a distance of 27 km from district
headquarter Dhenkanal town, 13 km from block headquarter Gondia and 3 km
from Gram Panchayat headquarter Neulapoi. One end of the village is confined
by a stream known as Kapilas stream, which springs from Kapilas hill.
Fig. 4: Chandrasekhapur Village under Gondia Block map
Sample village
7
3.3 Physical Features
This village is at the foot hill of Kapilas, surrounded by forest and hills. Natural
vegetation like Sal, Mahua, Birja, Patas, Sagwan etc. trees are widely seen around
the locality. Village is on bed of red soil with stone particles locally known as
Moharam soil. Since the stream is very narrow, people depend on it seasonally
for agriculture and bathing. Moharam and stone is available nearby area, that
provide partial employment to people for stone cutting and stone for personal
use i.e. home, building, boundary etc.
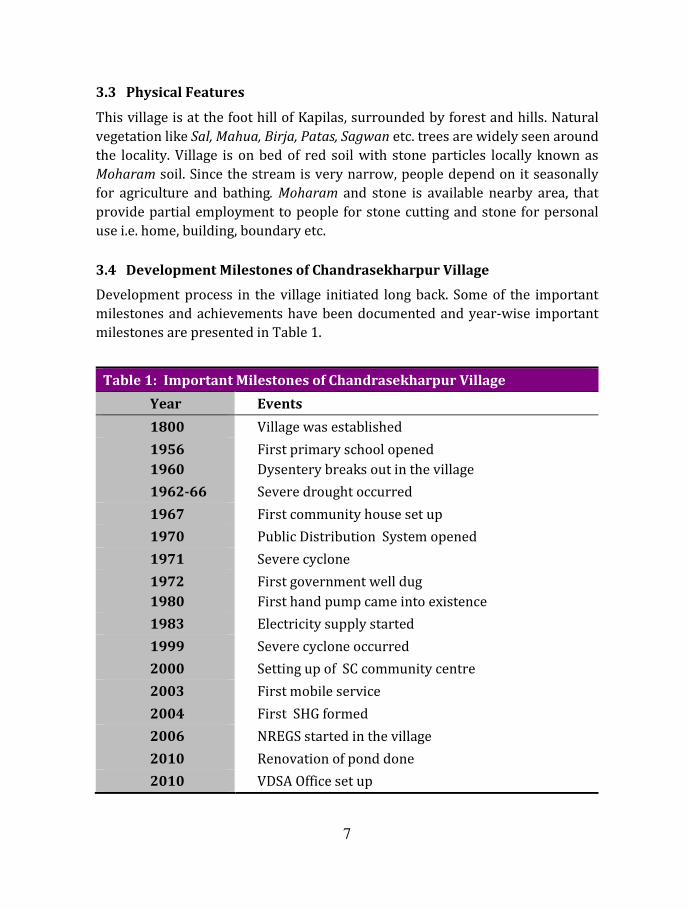
3.4 Development Milestones of Chandrasekharpur Village
Development process in the village initiated long back. Some of the important
milestones and achievements have been documented and year-wise important
milestones are presented in Table 1.
Table 1: Important Milestones of Chandrasekharpur Village
Year Events
1800 Village was established
1956
1960
First primary school opened
Dysentery breaks out in the village
1962-66 Severe drought occurred
1967 First community house set up
1970 Public Distribution System opened
1971 Severe cyclone
1972
1980
First government well dug
First hand pump came into existence
1983 Electricity supply started
1999 Severe cyclone occurred
2000 Setting up of SC community centre
2003 First mobile service
2004 First SHG formed
2006 NREGS started in the village
2010 Renovation of pond done
2010 VDSA Office set up

8
4. Population and Village Society
4.1 Demographic Structure
The village is having 1377 population from 302 households. One-third of
households are having no land (landless), followed by small (25%), medium
(20%), with another 20 per cent large farm households (Table 2). It is
noticeable that the average years of education is highest (i.e., 6.83 years) among
the large farm households followed by medium (5.45), small (4.26), and landless
(3.52) households. Hence, average years of education rise up with class of
farmers. The average years of education of the villagers are 4.56. The education
of most of the population confined to primary level though the overall literacy
rate is 73.12 per cent. The average size of family ranges from 4.00 for landless to
5.38 for large farm households. Most of the households are small and headed by
male member of the family.
4.2 Age-wise Population Distribution
As per the population distribution of Chandrasekharpur by age, the population
within the earning age group i.e.17-60 is 907 which constitute 66% of the total
population, out of which male and female are respectively 482 and 425. So the
age composition of the village is very healthy as small size of population is in the
bracket of dependents. They are either children or old persons. When we further
look in to the distribution of earning age group across the categories 470 are
landless and small farmers and the rest 437 are medium and large farmers. In
spite of large earning age group a sizable population have no or little land, hence
restrict the economic activity of population. The landless population is highest
in number i.e.400 followed by small farmers 347 large farmer 349 medium 255.
Table 2: General Characteristics of Households
Particulars Landless Small Medium Large All
Number 100 75 63 64 302
Age (years) 29.70 30.30 31.02 32.13 30.73
Education (years) 3.52 4.26 5.45 6.83 4.93
Family size (nos.) 4.00 4.63 4.52 5.38 4.56
% headed by male 92.00 93.59 95.31 93.75 93.46
Literacy rate (%) 63.69 66.46 79.18 85.67 73.12

9
Fig. 5: Demographic Distribution in Chandrasekharpur.
4.3 Gender Composition
The total population of the village is 1376 out of which 745
and 631 are female (46%). The overall sex ratio is 847 female for 1000 male,
which is poorer than the district level
population census. But, it is matter a of satisfaction
improving across the age groups from older to younger generation
60years (679), 31-60years (886), 17-30year
5 years (900).
Fig. 6: Female Sex Ratio per 1000 male
860817
0
200
400
600
800
1000
Female sex ratio per 1000 maleLandless Small
Fig. 5:
5: Demographic Distribution in Chandrasekharpur.
The total population of the village is 1376 out of which 745 are male (i.e. 54%)
The overall sex ratio is 847 female for 1000 male,
n the district level ratio of 961 female as per 2001
of satisfaction that the ratio is gradually
from older to younger generation, .i.e., above
30years (876), 6-16 years (773) and below
per 1000 male in Chandrasekharpur.
759
944
Female sex ratio per 1000 maleMedium Large

10
Table 3: Total Population by Sex in Chandrasekharpur (no.)
Particulars Landless Small Medium Large All
Male 215 191 162 177 745
Female 185 156 123 167 631
Total 400 347 285 344 1376
Sex ratio* 860 817 759 944 847
* Number of females per thousand males.
4.4 Social Class and Caste Structure
Village social group composition suggests that 68.04 per cent of the households
belong to Forward Castes (FCs). Of the remaining, 13.75 per cent each belong to
Schedule Castes (SCs) and Other Backward Castes (OBCs) with the remaining
(~5%) belong to Schedule Tribes (STs). Most of the large farmer households are
FCs and landless households are of SCs.
Fig. 7: Social Composition across Farmers’ Categories.
Though, the villagers living together with all sort of harmony, the caste barriers
still exist in the village. Khandayatas and Paikas (General caste) are the most
dominated in the village. Besides that Panas, Hadis (SC) and Behera (OBC) live in
the village. Most of the families are male dominated. Women are not part of
important family decisions. The social statuses of girls are clearly visible by

11
observing their educational status. People are very conservative in the matter of
girls’ education. They hardly allow girls to go for higher education outside the
village. Even for the boys the general education is up to high school level. Only 2
male candidates have graduation degrees in the entire village.
4.5 Culture
The villagers celebrate most of the Hindu
Dushera, Asta Prahari, Brahmani Devi Pooj
being celebrated mainly by people. On
(warrior clan) visit the Kapilas temple with carrying all the war weapons such as
Khanda, Dhala, Bachha and Chhuri to offer ritual prayer to Lord
The village youth always take the lead role in order to collect the required
finance and arrangement of the festival. The major decisions related to any
matter are taken commonly in Kotha Ghar
They also enjoy the local Joranda Yatra festival.
Fig. 8: Village Deity Worshipped under Banyan Tree.
11
observing their educational status. People are very conservative in the matter of
girls’ education. They hardly allow girls to go for higher education outside the
s the general education is up to high school level. Only 2
male candidates have graduation degrees in the entire village.
Hindu festivals, out of which Dola Purnima,
Devi Pooja. Ganesh Pooja, Saraswati Pooja are
n the occasion of Dushera, the Paikas
temple with carrying all the war weapons such as
to offer ritual prayer to Lord Chandrasekhar.
The village youth always take the lead role in order to collect the required
finance and arrangement of the festival. The major decisions related to any
har which is in the centre of the village.
festival.
Deity Worshipped under Banyan Tree.
12
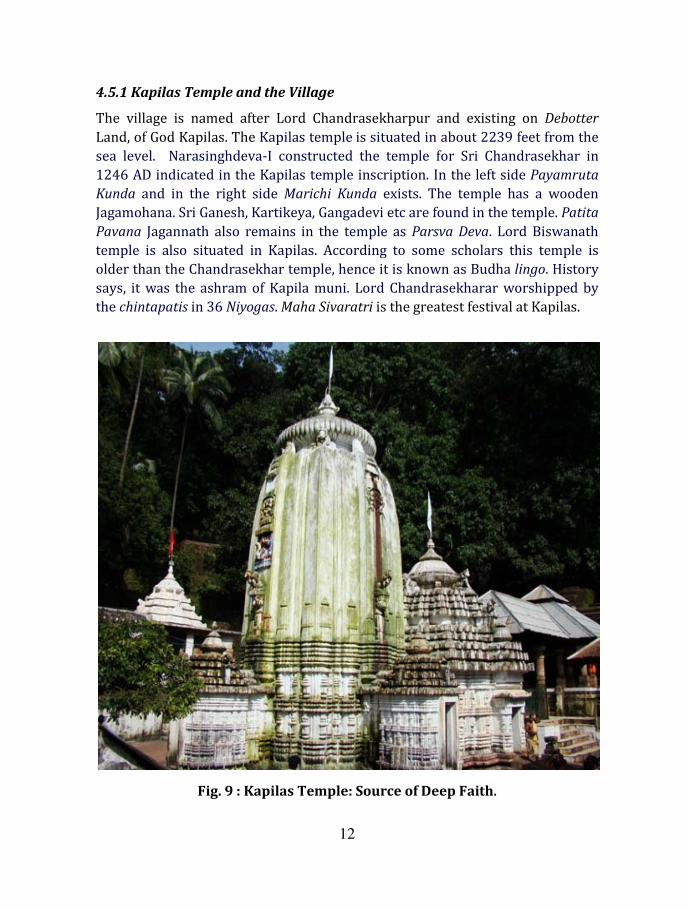
4.5.1 Kapilas Temple and the Village
The village is named after Lord Chandrasekharpur and existing on Debotter
Land, of God Kapilas. The Kapilas temple is situated in about 2239 feet from the
sea level. Narasinghdeva-I constructed the temple for Sri Chandrasekhar in
1246 AD indicated in the Kapilas temple inscription. In the left side Payamruta
Kunda and in the right side Marichi Kunda exists. The temple has a wooden
Jagamohana. Sri Ganesh, Kartikeya, Gangadevi etc are found in the temple. Patita
Pavana Jagannath also remains in the temple as Parsva Deva. Lord Biswanath
temple is also situated in Kapilas. According to some scholars this temple is
older than the Chandrasekhar temple, hence it is known as Budha lingo. History
says, it was the ashram of Kapila muni. Lord Chandrasekharar worshipped by
the chintapatis in 36 Niyogas. Maha Sivaratri is the greatest festival at Kapilas.
Fig. 9 : Kapilas Temple: Source of Deep Faith.

13
Fig. 10: Social and Resource Map of Chandrasekharpur

14
5. Agriculture/Assets/Options
5.1 Size of Landholding
The size of the landholding ranges from 0.10 acre for landless to 5.36 acres for
large farmers. No land in the village is irrigable. So the agriculture is fully
depended on rainfall. The average operated land area in case of landless is 0.21
acre which is more than the size of landholding. So they cultivate available land
more intensively contrary to the large farmers, as the average operated land
area is less than average size of landholding in medium and large farmers. Since
the village is on the foot of hill, maximum area is covered by stones, forest and
Mohram (red soil). So these are permanent fallow. Almost 28.43 per cent area of
the village comes under permanent fallow land.
Fig. 11: Average Operational Landholding across Farmers.
Table 4: Inequality Measure of Own Land in Chandrasekharpur
Particulars Households Per capita
Coefficient of variation 1.475515 1.354045
Ginni coefficient 0.597459 0.592146
Theil entropy measure 0.698958 0.665038

15
Fig. 12: Lorenz Curve of Own Land in Chandrasekharpur.
5.2 Soil and Irrigation
The village is rich in red soil. Alluvial soil is found in the lowland which is used
by the villagers for Paddy cultivation in kharif. Most of the soil structure is not
conducive for crop cultivation but ideal for plantation. So these areas are
surrounded by cashews, mangoes, teak trees (Sagas) and Eucalyptus. Only
Kapilas stream irrigates some portion of agricultural land. No other irrigation
source is available here. People use diesel pump sets to water their fields from
well, small pond at the time of need, number of which are very few. People use
to store stream water for cultivation of Rabi crops.
5.3 Crops and Cropping Pattern
There are two seasons for cultivation of crops in the village namely kharif (July
to October) and Rabi season (November to February). Only Paddy cultivation is
done in season. The success of the crop heavily depends upon rain water. Most
of the time due to scarcity or heavy rain, farmers pays heavy loss. The main
crops of the Rabi season are black gram, green gram, potato. More than 80 per
cent of the cultivated lands are covered by the black gram and green gram. For
domestic consumption the villagers cultivates runner beans, cluster beans and
leafy vegetables in the backyards of their houses.
cum
ula
tive p
roportio
n o
f O
wnla
nd_calc
ula
ted
Lorenz curvecumulative proportion of sample
_perc _share
0 .25 .5 .75 1
0
.25
.5
.75
1

16
Table 5: Changing Crop Pattern in Chandrashekarpur
Crop Year 1970 2010
Crop season Kharif Rabi
Crops grown Paddy Paddy Green gram
Black gram
Vegetables (Potato)
5.4 Preference of Paddy Seed Variety
Based on the seed characteristics like yield, irrigation-need, fertilizer-need, crop
duration and taste of produce, the farmers in the village select the seed variety
for cultivation. In Chandrashekarpur, Paddy is the main crop cultivated by the
farmers. The preferred seed varieties are: 1009 (first preference) and Lalat
(second preference), Paduni (third preference) and 1018 (fourth preference) for
Paddy cultivation, as shown in Table 6.
Table 6: Farmers’ Preference of Paddy Seed Variety in the Village
Paddy
variety
More
Yield
Less
Irrigation
Less
Fertilizer
Less
Duration
Good
Taste
Rank
Lalat Second
Swarna Sixth
1025 Fifth
1018 Fourth
Paduni Third
Khandagiri Eighth
Kalachampa Seventh
1009 First
Note: Symbols are only indicators of change and do not depict the extent of that change
in real terms with time.

17
5.5 Agriculture Dynamics and Farmer Economy
Participatory method of farmer interacttion was used to record farmer
perception on agricultural practices, tools and technology and dynamic changes
over the period of time in the village. The farmers generously responded on the
agriculture-based perception like soil fertility, fertiliser use, crops grown,
cropped area, ground water level, irrigation, migration, horticulture, livestock,
diseases, forest and wildlife, etc. in seventies, nineties and 2010 in the village.
With increasing population, decreasing resource base, the farm practices in the
field also have taken shape as the existing needs. More production taken with
extensive use of critical inputs led to greater pressure on natural resources. The
decreasing soil fertility, more chemical intervention, lowering water table,
intensive cultivation, growing interest for cash commercial crops, deforestation,
less/erratic rainfall, more and more natural calamities like draught, flood are
some of the common phenomenon in today’s environment. Some farmers’
perception on existing dynamics were recorded based on their experiences and
recalled memories has been documented and presented in lucid pictorial cum
tabular form in Table 7.
Fig. 13: Traditional farm Set up of the Village with least mechanisation

18
Table 7 : Agricultural Biodiversity and Crop Ecological Dynamics during 1970-2010 in the Village
Indicators 1970 1990 2010 Reasons
Soil Fertility
Chemical intervention
Number of crops
Availablity of water
Fertilizer use
Decreasing soil fertility
Area of Cultivation
(per capita)
Increasing population
Horticulture
More vegetables production
Irrigation
/////////// /////////// ///////
More investment in private
boring, Government initiative
Migration
Lack of employment and
education opportunities
Ground Water Level - - - - - - - - - - - - - - - - - - - - - - - - - - Less rain
Livestock
Increased government initiative
Diseases
More chemicals use and rising
mosquito population
Forest
Lack of rain, cutting of forests
Wild life
Decreasing forest and
encroachment
Note: The symbols used in this table are only indicators of a change and do not depict the extent of change in real terms over time.
19
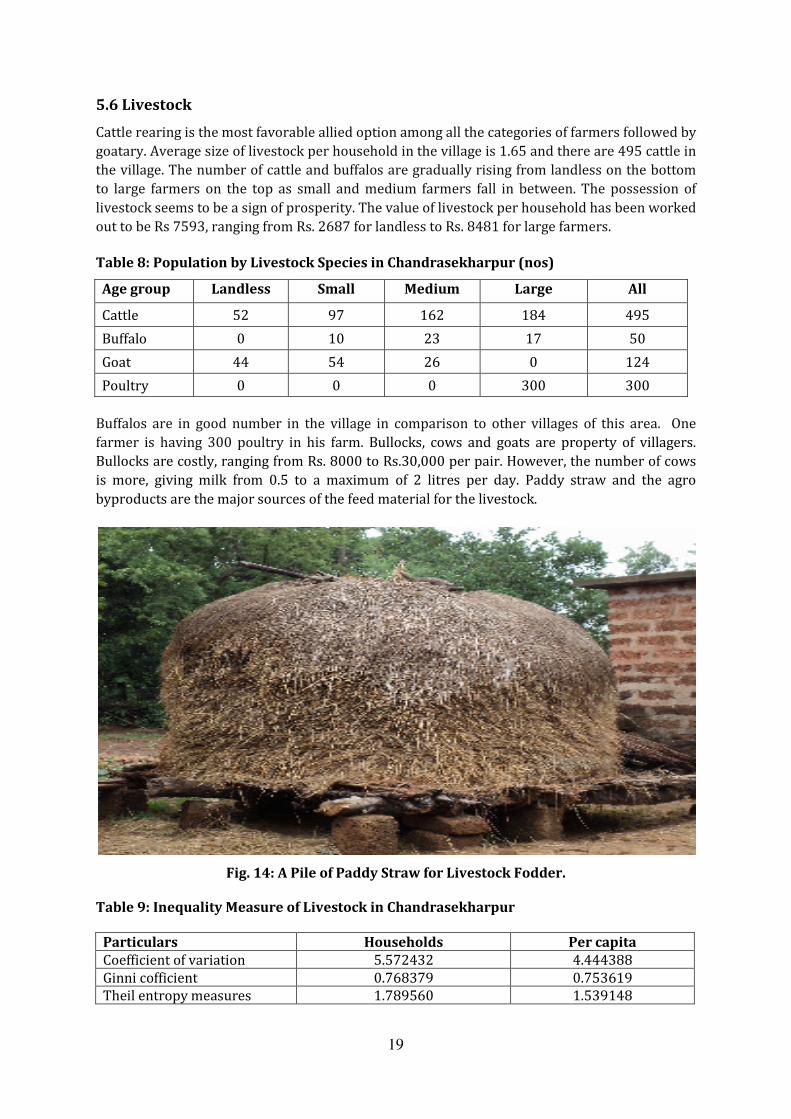
5.6 Livestock
Cattle rearing is the most favorable allied option among all the categories of farmers followed by
goatary. Average size of livestock per household in the village is 1.65 and there are 495 cattle in
the village. The number of cattle and buffalos are gradually rising from landless on the bottom
to large farmers on the top as small and medium farmers fall in between. The possession of
livestock seems to be a sign of prosperity. The value of livestock per household has been worked
out to be Rs 7593, ranging from Rs. 2687 for landless to Rs. 8481 for large farmers.
Table 8: Population by Livestock Species in Chandrasekharpur (nos)
Age group Landless Small Medium Large All
Cattle 52 97 162 184 495
Buffalo 0 10 23 17 50
Goat 44 54 26 0 124
Poultry 0 0 0 300 300
Buffalos are in good number in the village in comparison to other villages of this area. One
farmer is having 300 poultry in his farm. Bullocks, cows and goats are property of villagers.
Bullocks are costly, ranging from Rs. 8000 to Rs.30,000 per pair. However, the number of cows
is more, giving milk from 0.5 to a maximum of 2 litres per day. Paddy straw and the agro
byproducts are the major sources of the feed material for the livestock.
Fig. 14: A Pile of Paddy Straw for Livestock Fodder.
Table 9: Inequality Measure of Livestock in Chandrasekharpur
Particulars Households Per capita
Coefficient of variation 5.572432 4.444388
Ginni cofficient 0.768379 0.753619
Theil entropy measures 1.789560 1.539148
20
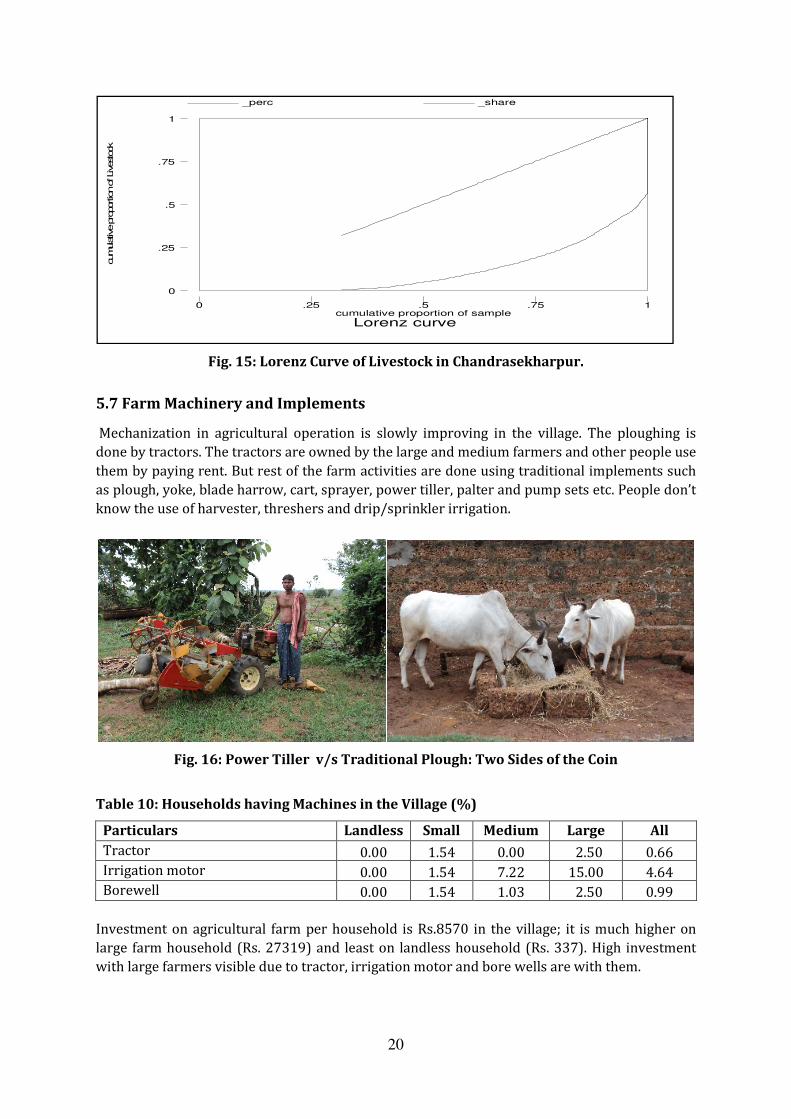
Fig. 15: Lorenz Curve of Livestock in Chandrasekharpur.
5.7 Farm Machinery and Implements
Mechanization in agricultural operation is slowly improving in the village. The ploughing is
done by tractors. The tractors are owned by the large and medium farmers and other people use
them by paying rent. But rest of the farm activities are done using traditional implements such
as plough, yoke, blade harrow, cart, sprayer, power tiller, palter and pump sets etc. People don’t
know the use of harvester, threshers and drip/sprinkler irrigation.
Fig. 16: Power Tiller v/s Traditional Plough: Two Sides of the Coin
Table 10: Households having Machines in the Village (%)
Particulars Landless Small Medium Large All
Tractor 0.00 1.54 0.00 2.50 0.66
Irrigation motor 0.00 1.54 7.22 15.00 4.64
Borewell 0.00 1.54 1.03 2.50 0.99
Investment on agricultural farm per household is Rs.8570 in the village; it is much higher on
large farm household (Rs. 27319) and least on landless household (Rs. 337). High investment
with large farmers visible due to tractor, irrigation motor and bore wells are with them.
cumulative pro
portion of Livestock
Lorenz curvecumulative proportion of sample
_perc _share
0 .25 .5 .75 1
0
.25
.5
.75
1

21
6. Economic Situation in Chandrasekharpur
6.1 Source of Income
The occupation of households in the village encompasses service holders, agricultural farmers,
agriculture labours, stone cutting labourers, and small business men. Service holders are
generally in defense line of services, i.e., ITA, Border Security Force, Assam Rifles etc having 10th
qualification. Agriculture farmers who have their own land cultivate their farm by themselves.
Agriculture laboures work in others’ agriculture fields from July to August and November to
December. During other times they remain unemployed. Stone cutting laboures are those
groups who go to stone mines and work 8 hours every day for 7 to 8 months in a year. They are
getting Rs. 150 to 250 per day out of which they spend minimum 50 per cent of daily wage ( Rs.
75/- to Rs. 150/-) on alcoholic beverages and tobacco. Besides these, some daily wage laboures
go to nearby villages for finding work. Small business men here are village shopkeepers of
grocery items, stationery and alcoholic beverages.
Fig. 17: Counting Coins: A Miserable Livelihood Option Income.
6.2 Occupational Pattern
Working population in the village is about 41 per cent. And the types of workers are cultivators,
agricultural workers, non-farm workers, govt. job holders, etc. (Table 11). Among working class,
maximum 40 per cent are cultivators followed by 33 per cent non-farm workers. 13 per cent
each are in govt. jobs and agricultural workers. If we are adding cultivators and agro-workers,
then we can say village agriculture absorbs about 53 per cent of the working population, so
agriculture is still a major source of village livelihood.

Fig. 18: Diversification of Working Population.
Table 11: Occupation diversification in Chandrasekharpur (%)
Particulars
% working population
Share of particulars in total working population
Cultivator
Agricultural worker
Non-Farm worker
Government Job
Other
Most of the people from landless category sustain by working in others
inadequate land to cultivate
households are employed in different government works. Henc
source of income with agriculture and strengthens the economic status of these groups.
Fig.19:
Non-Farm
worker
33%
22
: Diversification of Working Population.
Occupation diversification in Chandrasekharpur (%)
Landless Small Medium Large
45.00 37.46 44.91 37.79
total working population
11.66 48.46 59.06 50.39
26.38 6.92 7.09 8.53
60.12 33.08 17.32 12.40
1.23 10.77 15.75 27.91
0.61 0.77 0.79 0.78
Most of the people from landless category sustain by working in others’
.27.91 per cent of large, 15.75 per cent
households are employed in different government works. Hence it provides an additional
source of income with agriculture and strengthens the economic status of these groups.
: Daily Needs Family Shop in the Village.
Cultivator
40%
Agricultural
worker
13%
Farm
Govt. Job
13%
Other
1%
Large All
37.79 41.28
50.39 40.44
8.53 13.11
12.40 32.60
27.91 13.11
0.78 0.73
fields as they have
per cent of medium farmer
e it provides an additional
source of income with agriculture and strengthens the economic status of these groups.
Cultivator
40%

According to the PRA perception, the households in Chandrashekarpur could be clas
different income classes as follows : (i) 20 per cent of total households are in ‘rich’ or ‘well
category, (ii) 22per cent of households are in ‘average’ or ‘medium’ category, and (iii) 58 per
cent of households are in ‘poor’ category.
village are ‘poor’ and only a small
Fig. 20
6.3 Incidence of Migration
A sum of 12.57 per cent of villager
options. Among those, maximum migration recorded from resource full farmer
(49.10 %) of the people migrated in order to get a salaried job which is
cause of migration fallowed by 16.77
completely different for landless households. The reason of migration
(35.71%) and 25% to do other
0
10
20
30
40
50
60
70
80
Landless
Education
Own business
Fig. 21: Percentage incidence of migration
23
According to the PRA perception, the households in Chandrashekarpur could be clas
different income classes as follows : (i) 20 per cent of total households are in ‘rich’ or ‘well
category, (ii) 22per cent of households are in ‘average’ or ‘medium’ category, and (iii) 58 per
cent of households are in ‘poor’ category. Thus, the majority of households in Chandrashekarpur
village are ‘poor’ and only a small percentage is of ‘rich’ households.
20: PRA Exercises in Chandrasekharpur.
Migration
A sum of 12.57 per cent of villagers migrated outside the village for searching livelihood
maximum migration recorded from resource full farmer
people migrated in order to get a salaried job which is one
cause of migration fallowed by 16.77 per cent in search of good education. But the picture is
completely different for landless households. The reason of migration is daily wage employment
and 25% to do other part time miscellaneous works.
Small Medium Large
Salaried job Daily wage employment
Job Serach Other
Fig. 21: Percentage incidence of migration across farm categories
According to the PRA perception, the households in Chandrashekarpur could be classifieds into
different income classes as follows : (i) 20 per cent of total households are in ‘rich’ or ‘well-off’
category, (ii) 22per cent of households are in ‘average’ or ‘medium’ category, and (iii) 58 per
us, the majority of households in Chandrashekarpur
illage for searching livelihood
maximum migration recorded from resource full farmers. Almost half
one of the prominent
in search of good education. But the picture is
is daily wage employment
Large
Daily wage employment
across farm categories
24
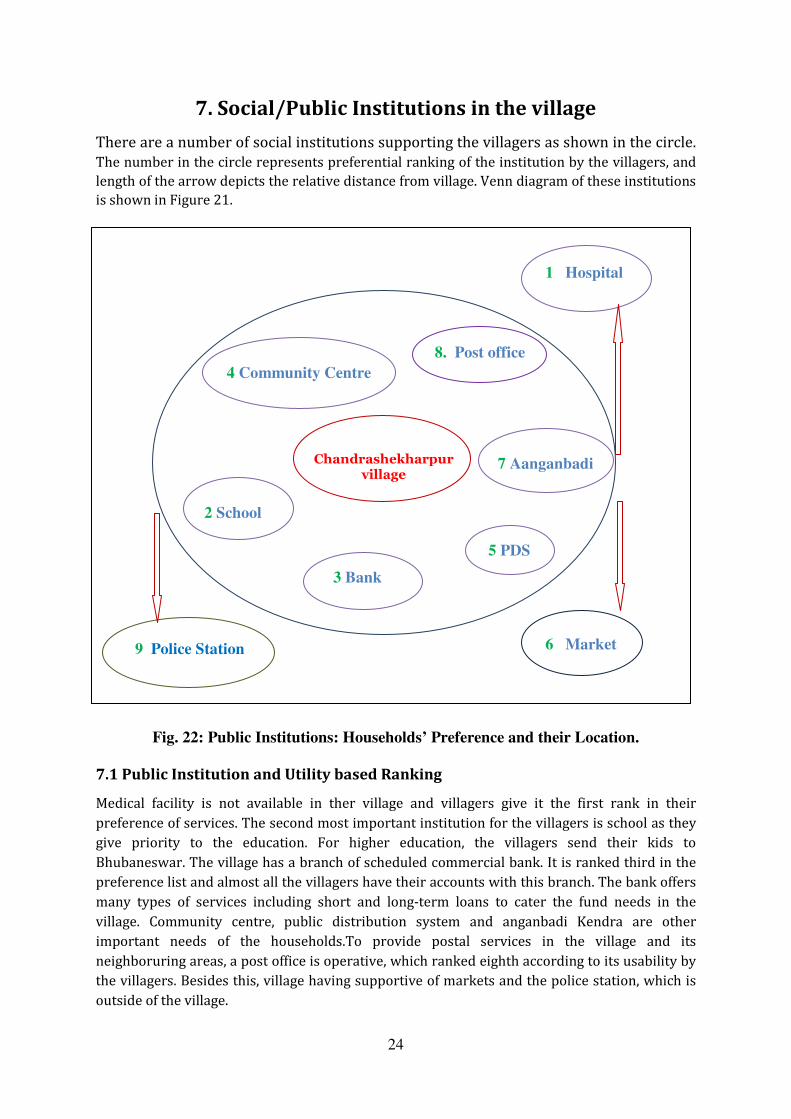
7. Social/Public Institutions in the village
There are a number of social institutions supporting the villagers as shown in the circle.
The number in the circle represents preferential ranking of the institution by the villagers, and
length of the arrow depicts the relative distance from village. Venn diagram of these institutions
is shown in Figure 21.
Fig. 22: Public Institutions: Households’ Preference and their Location.
7.1 Public Institution and Utility based Ranking
Medical facility is not available in ther village and villagers give it the first rank in their
preference of services. The second most important institution for the villagers is school as they
give priority to the education. For higher education, the villagers send their kids to
Bhubaneswar. The village has a branch of scheduled commercial bank. It is ranked third in the
preference list and almost all the villagers have their accounts with this branch. The bank offers
many types of services including short and long-term loans to cater the fund needs in the
village. Community centre, public distribution system and anganbadi Kendra are other
important needs of the households.To provide postal services in the village and its
neighboruring areas, a post office is operative, which ranked eighth according to its usability by
the villagers. Besides this, village having supportive of markets and the police station, which is
outside of the village.
8. Post office
4 Community Centre
2 School
3 Bank
5 PDS
7 Aanganbadi
1 Hospital
6 Market 9 Police Station
Chandrashekharpur village
25
8. Health Care and Sanitation
8.1 Health Care Facility
Villagers are facing much difficulty to get minimum medical benefit. During the critical illness
periods they have to move outside of the village by arranging private vehicle to get first aid.
People mainly depend on Beltikiri Public Health Centre, 8 km away from the village and further
referral to district headquarter hospital of Dhenkanal. An ASHA worker is active for taking pre-
and post-natal care of women and child. The Anganwadi center is functioning in the village.
People get free medicine when they suffer from fever and malaria.
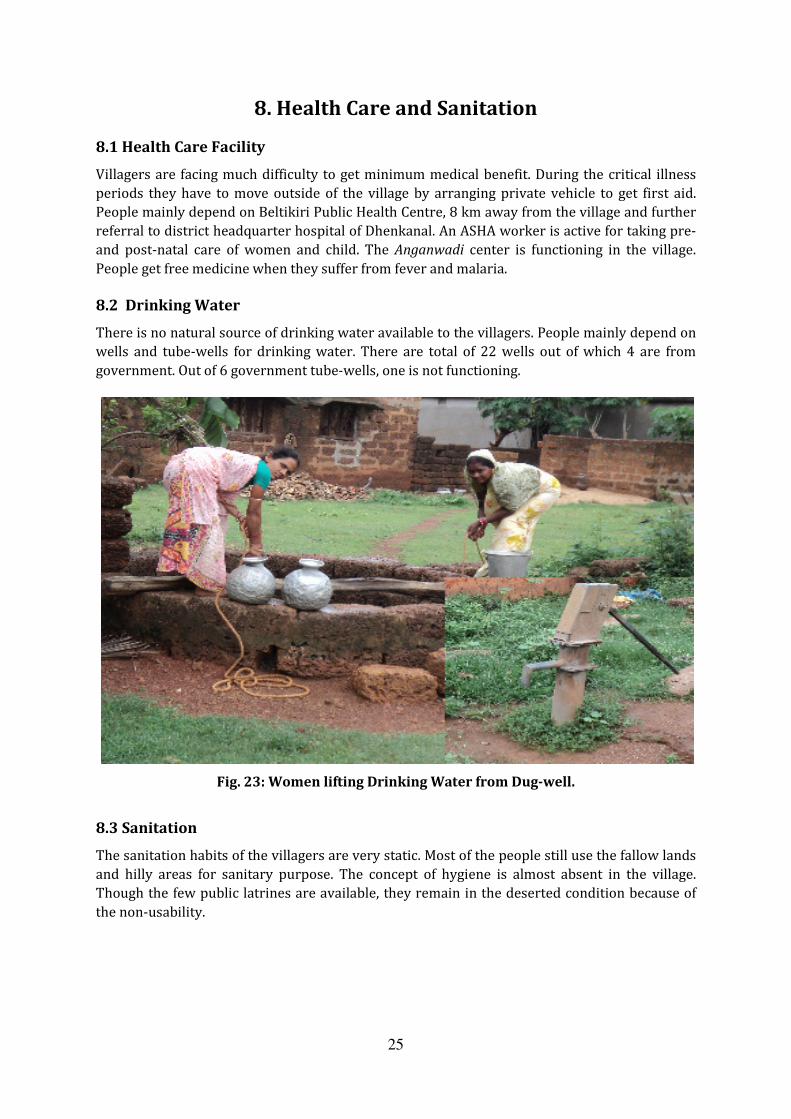
8.2 Drinking Water
There is no natural source of drinking water available to the villagers. People mainly depend on
wells and tube-wells for drinking water. There are total of 22 wells out of which 4 are from
government. Out of 6 government tube-wells, one is not functioning.
Fig. 23: Women lifting Drinking Water from Dug-well.
8.3 Sanitation
The sanitation habits of the villagers are very static. Most of the people still use the fallow lands
and hilly areas for sanitary purpose. The concept of hygiene is almost absent in the village.
Though the few public latrines are available, they remain in the deserted condition because of
the non-usability.

26
Fig. 24: TV: Modern Source of
Information.
9. Market, Transport and Communication
9.1 Market
Joranda, a small market (Hata) 8 km from village which functions two times in a week, is for
grocery, vegetable and necessary goods. The supply market is in Dhenkanal town, which is 27
km from village. The daily needs of domestic consumption is met by the village petty shops. The
farmers of this village have been facing lots of bottlenecks due to non-accessibility of proper
market for their surplus production. In spite of the presence of government crop mandi at
Deogaon, the farmers are compelled to sell their seasonal surplus crops to outside village
traders, who come to village only to tender them in much depreciated price. The people of the
village do not prefer to visit the government mandi because of delay in cash payment and other
official formalities. A weekly livestock market is at Gopinathpur, 40 km away from village.
9.2 Transport
The method of transport is bus; auto rickshaw facility is available for the villagers. Under
Pradhan Mantri Gram Sadak Yojana (PMGSY), the village is linked by all season road to Deogan,
5 km away from Chandrasekharpur. The nearest bus stoppage is in Deogan. People follow some
short cut roads to cover the distance by walking. The nearest railway station is in Dhenkanal
around 30 km away from the village. They use auto rickshaw and bus to go to health centre,
district headquarter and market.
9.3 Communication
Pucca road is from village to district headquarter via Deogaon
and local market Joranda via Neulapoi, 3 km from Murom road
from the village and 5 km pucca road to the end. Generally
people use walk way via Durga Prasad to go to Dhenkanal town
and to Beltikiri PHC for health except rainy season. The
communication infrastructure is gradually changing due to
establishment of mobile towers in the radius of 10 km. Now the
villagers have nearly 80 sets of mobiles in order communicate in
need. The use of radio set is very limited as most of the people
have TV sets. People have personal dish antenna to avail necessary channels. People prefer to
watch the regional channel in order to get information and entertainment. The use of
newspaper is very restrictive. One has to travel Deogan in order to read an Oriya newspaper.
9.4 Electricity
Though the village has received electric supply
under RGVY; but 100 households are still in a
queue to get the facility. Only 48 households
have connected by electricity. The quality of
electricity supply is inferior. People face
frequent power cuts and the voltage is also
very low. Television is the advance electronic
equipment in most of the houses. Only a few
people have recently purchased coolers to get
rid from summer temperature. Fig25: Solar Plate: Alternative Energy Option.

27
10. Problems and Opportunities in the Village
The village has growing horticulture sector; the setting up of markets for the perishables will
definitely increase the profit of the farmers. The village has potentially hard working population
which with suitable infrastructure can make the village better in economic terms.
The existing problems of the village are as follows:
� Lack of participation of women in decision making
� Stigma that girls are not allowed to go out of the village for education
� No property ownership to females
� Lack of awareness about the hygiene and sanitation practices
� Lack of healthcare infrastructure and personnel
� Lack of transport facilities
� Lack of good roads
� Lack of reliable markets for vegetables
� Inadequate knowledge and skills in improved production
� Lack of irrigation facilities
� Lack of proper livestock management practices
� Lack of good transport facility as poor conveyance and poor roads
� Lack of storage facility
� Inadequate drinking water facility
� Inadequate food processing facility in the village.
� Lack of toilet facility
� Lack of market in the village
� Erratic electricity supply
� SHGs work is not satisfactory as irregular depositors and arising conflicts.
� Difference in wage rate for females and males despite of working for same hours
� No government market (mandi) is nearby so traders or mediators take benefit in
selling of crops. It causes distress among the farmers.

28
11. Infrastructural Facilities in village
Details of available facilities in the village summarized in Table 12.
Table 12: Developmental Infrastructure in Chandrasekharpur
Particulars Number
Primary School : One
Primary Health Centre : No
Hospital : No
Veterinary hospital : No
Ashas (medical helpers) : One
Anganwadi Centres : One
Private Chemist Shop : No
Tractors : One
Power tiller : One
Bus Service : 5 km away
Bank : No
Drinking Water Supply : No
Dug well : Yes
Farm Pond : Four
Electric Supply : Yes, erratic
TV Sets : Yes
Dish TV antenna : Yes
Public Handpumps : Yes
Post Office : No
Telephone Land Line : No
Mobile Phone : Yes
Agricultural Input Shop : No
Farmers Club : No
Library : No

29
Acknowledgements
Authors are grateful to VDSA Project Implementing Agency, International Crop Research
Institute for Semi Arid Tropic (ICRISAT), Hyderabad and Project Lead Centre of Eastern India,
National Centre for Agricultural Economics and Policy Research (NCAP), New Delhi for
providing all sort of moral and financial support for carrying out these research activities under
Village Dynamic Studies Project on Rural Poverty. We are equally grateful to Dr. Anjani Kumar,
Agricultural Economist, for his untiring cooperation, constant encouragement and support for
this manuscript and project activities. Thanks are also to meticulous efforts of Field
investigators and the project staff, which made it possible this village profile brought out in the
present form. We thank all those with whom we interacted during field surveys, in particular
farmers, workers, village leaders, traders, extension functionaries, etc. Finally, the views
expressed in this publication are those of the authors and may not necessarily represent the
views of their respective organizations.
Authors
