chiral recognition of amino acids by use of a fluorescent
TRANSCRIPT

Portland State University Portland State University
PDXScholar PDXScholar
Chemistry Faculty Publications and Presentations Chemistry
2008
Chiral Recognition of Amino Acids by Use of a Chiral Recognition of Amino Acids by Use of a
Fluorescent Resorcinarene Fluorescent Resorcinarene
Gerald I. Richard Louisiana State University
Hadi M. Marwani Louisiana State University
Shan Jiang Louisiana State University
Sayo O. Fakayode Winston-Salem State University
Mark Lowry Louisiana State University
See next page for additional authors Follow this and additional works at: https://pdxscholar.library.pdx.edu/chem_fac
Part of the Biochemistry Commons, and the Chemistry Commons
Let us know how access to this document benefits you.
Citation Details Citation Details Richard, Gerald I.; Marwani, Hadi M.; Jiang, Shan; Fakayode, Sayo O.; Lowry, Mark; Strongin, Robert M.; and Warner, Isiah M., "Chiral Recognition of Amino Acids by Use of a Fluorescent Resorcinarene" (2008). Chemistry Faculty Publications and Presentations. 62. https://pdxscholar.library.pdx.edu/chem_fac/62
This Post-Print is brought to you for free and open access. It has been accepted for inclusion in Chemistry Faculty Publications and Presentations by an authorized administrator of PDXScholar. Please contact us if we can make this document more accessible: [email protected].

Authors Authors Gerald I. Richard, Hadi M. Marwani, Shan Jiang, Sayo O. Fakayode, Mark Lowry, Robert M. Strongin, and Isiah M. Warner
This post-print is available at PDXScholar: https://pdxscholar.library.pdx.edu/chem_fac/62

Chiral Recognition of Amino Acids by Use of a FluorescentResorcinarene
GERALD I. RICHARD, HADI M. MARWANI, SHAN JIANG, SAYO O. FAKAYODE, MARKLOWRY, ROBERT M. STRONGIN*, and ISIAH M. WARNER*Department of Chemistry, Louisiana State University, Baton Rouge, Louisiana 70803 (G.I.R.,H.M.M., S.J., M.L., I.M.W.); Department of Chemistry, King Abdulaziz University, Jeddah, SaudiArabia 21589 (H.M.M.); Department of Chemistry, Winston-Salem State University, Winston-Salem,North Carolina 27110 (S.O.F.); and Department of Chemistry, Portland State University, Portland,Oregon 97207 (R.M.S.)
AbstractThe spectroscopic properties of a chiral boronic acid based resorcinarene macrocycle employed forchiral analysis were investigated. Specifically, the emission and excitation characteristics oftetraarylboronate resorcinarene macrocycle (TBRM) and its quantum yield were evaluated. Thechiral selector TBRM was investigated as a chiral reagent for the enantiomeric discrimination ofamino acids using steady-state fluorescence spectroscopy. Chiral recognition of amino acids in thepresence of the macrocycle was based on diastereomeric complexes. Results demonstrated thatTBRM had better chiral discrimination ability for lysine as compared to the other amino acids. Partialleast squares regression modeling (PLS-1) of spectral data for macrocycle-lysine guest-hostcomplexes was used to correlate the changes in the fluorescence emission for a set of calibrationsamples consisting of TBRM in the presence of varying enantiomeric compositions of lysine. Inaddition, validation studies were performed using an independently prepared set of samples withdifferent enantiomeric compositions of lysine. The results of multivariate regression modelingindicated good prediction ability of lysine, which was confirmed by a root mean square percentrelative error (RMS%RE) of 5.8%.
KeywordsChiral analysis; Fluorescent sensors; Chemometrics; Partial least squares regression modeling;PLS-1
INTRODUCTIONChiral recognition has an important influence on biological systems due to the many naturallyoccurring chiral molecules such as carbohydrates, amino acids, proteins, hormones, enzymes,and DNA.1-6 In fact, several biological functions are based on chiral interactions. For example,since human odor receptors are chiral, humans are able to recognize that (R)-limonene smellslike lemons and (S)-limonene smells like oranges. Likewise, D-asparagine tastes sweet and L-asparagine tastes bitter. While it is generally accepted that biological systems are primarilycomposed of L-amino acids and D-carbohydrates, the presence of D-amino acids at low levelshas been reported in humans.7-10 In addition, D-amino acids may possibly have an antagonisticbiological function.
*Authors to whom correspondence should be sent. E-mail: [email protected] and [email protected]..
Published in final edited form as:Appl Spectrosc. 2008 May ; 62(5): 476–480. doi:10.1366/000370208784344514.
NIH
-PA Author Manuscript
NIH
-PA Author Manuscript
NIH
-PA Author Manuscript

The true importance of chirality to human functions was realized in the 1960s when the chiraldrug thalidomide was prescribed to pregnant women to alleviate morning sickness. It was laterdiscovered that the (R)-enantiomer produced the desired therapeutic effect, while the (S)-enantiomer resulted in severe birth defects.11 As a result, there has been a proliferation ofstudies of enantiomeric selectivity in biological systems, and a concomitant series of analyticalmethods have been applied. The most commonly used analytical methods involvechromatographic techniques such as high-performance liquid chromatography (HPLC),12 gaschromatography (GC),13 and capillary electrophoresis (CE).14 However, spectroscopictechniques such as UV-visible,15 nuclear magnetic resonance (NMR),16 and massspectroscopy17 have shown considerable promise in studying chiral recognition ability fordifferent applications. Fluorescence spectroscopy is one of the most powerful and widely usedmethods in studying the enantioselectivity of several biological systems because of itsrelatively high sensitivity, selectivity, and versatility.18-21 Consequently, enantioselectivefluorescent sensors have attracted considerable interest for use in potential bioanalyticalapplications.22-24
When enantioselective studies are performed in an achiral environment, chiral discriminationis not observed. Therefore, the use of a chiral selector for chiral recognition of enantiomers isrequired. For instance, some commonly used fluorescent chiral selectors for spectroscopicinvestigations of chiral molecules include fluorescent-labeled cyclodextrins,22 crown ethers,23 and calixarenes.24 Previously, a chiral pinanediolderived boronate resorcinarenemacrocycle was developed by Lewis et al.25 Resorcinarenes are cyclic aromatic tetramerssynthesized in a single step from an acid catalyzed condensation reaction of resorcinol and analdehyde.26 Lewis et al.,27 He et al.,28 Davis et al.,29 and Zhang et al.30 have previouslyreported the use of boronic acid based resorcinarene macrocycles for achiral and chiralcarbohydrate recognition and chemical sensing using UV-visible spectroscopic methods.Consequently, these macrocycles could be useful in investigating the fluorescence detectionand enantiodiscrimination of amino acids.
Amino acids, which are structurally similar to one another, but have different side chains, areamong the most important molecules in biological systems because they are also constituentsof peptides, proteins, and DNA. Most amino acids exhibit transparency in the UV-visibleregion. In fact, the optical detection of amino acids has been the focus of several researchstudies. However, a majority of fluorescent chiral recognition studies involving amino acidshave been performed with amino acid derivatives.31-33 Therefore, fluorescenceenantioselective recognition of unmodified amino acids would be an attractive approach formonitoring diseases and understanding protein biological functions. In addition, manyapproaches have recently demonstrated that the enantiomeric composition of chiral moleculescan be determined by multivariate regression modeling of fluorescence emission spectral data.18,34-36 These results from spectral data measurements have demonstrated that multivariateregression modeling is a reliable method for evaluating the chiral recognition ability of chiralmolecules.
This study reports the fluorescent spectral properties of tetraarylboronate resorcinarenemacrocycle (TBRM) and investigates the enantiomeric selectivity of unmodified amino acidswith TBRM employed as a chiral selector. In addition, the chiral recognition ability of TBRMwith selected amino acids as well as determination of enantiomeric composition of lysine wasevaluated by use of steady-state fluorescence spectroscopy and multivariate regressionanalysis.
RICHARD et al. Page 2
NIH
-PA Author Manuscript
NIH
-PA Author Manuscript
NIH
-PA Author Manuscript
EXPERIMENTALMaterials
D- and L-enantiomers of alanine, arginine, asparagine, aspartate, glutamine, glutamate,isoleucine, leucine, lysine, methionine, proline, serine, threonine, and valine were obtainedfrom Sigma-Aldrich (St. Louis, MO) and used as received. Spectroscopic grade (≥99.9%)acetonitrile, dimethyl sulfoxide, ethyl acetate, methanol, and tetrahydrofuran were alsopurchased from Sigma Aldrich (St. Louis, MO) and used as received. Resorcinol, 4-formylphenylboronic acid, ethanol, hydrochloric acid, dimethyl formamide, sodium sulfate,and 1R, 2R, 3S, and 5R-(-)-pinanediol were obtained from Sigma Chemical Company(Milwaukee, WI). The purity of all analytes and reagents was 99% or higher.
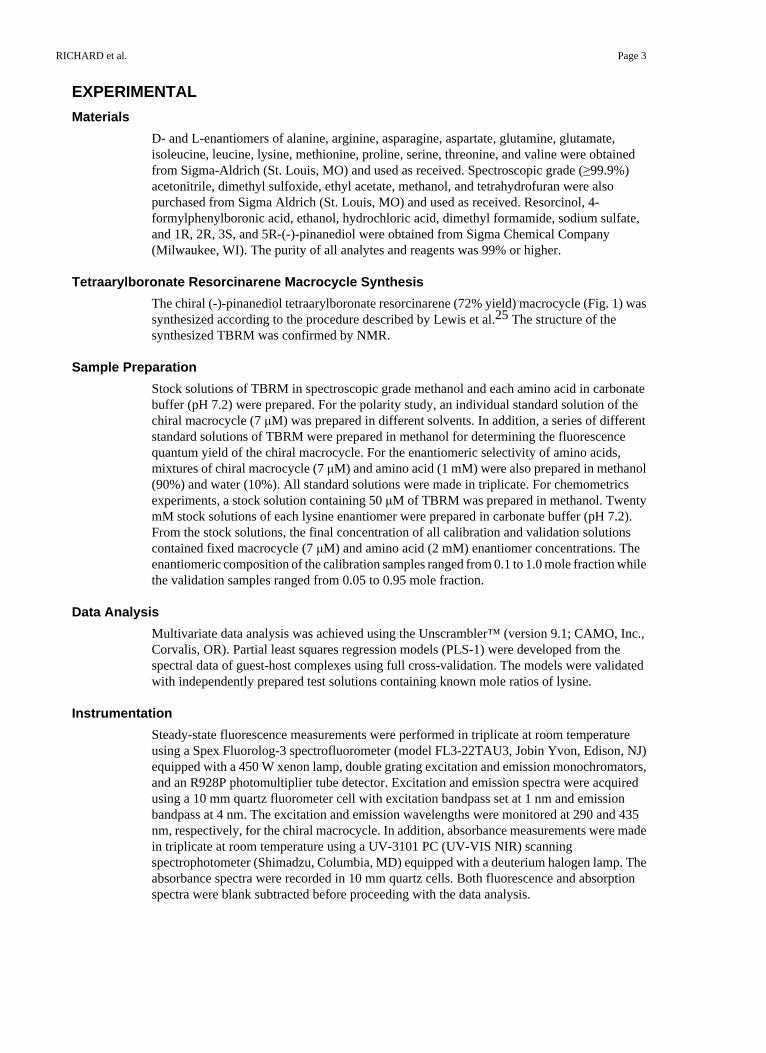
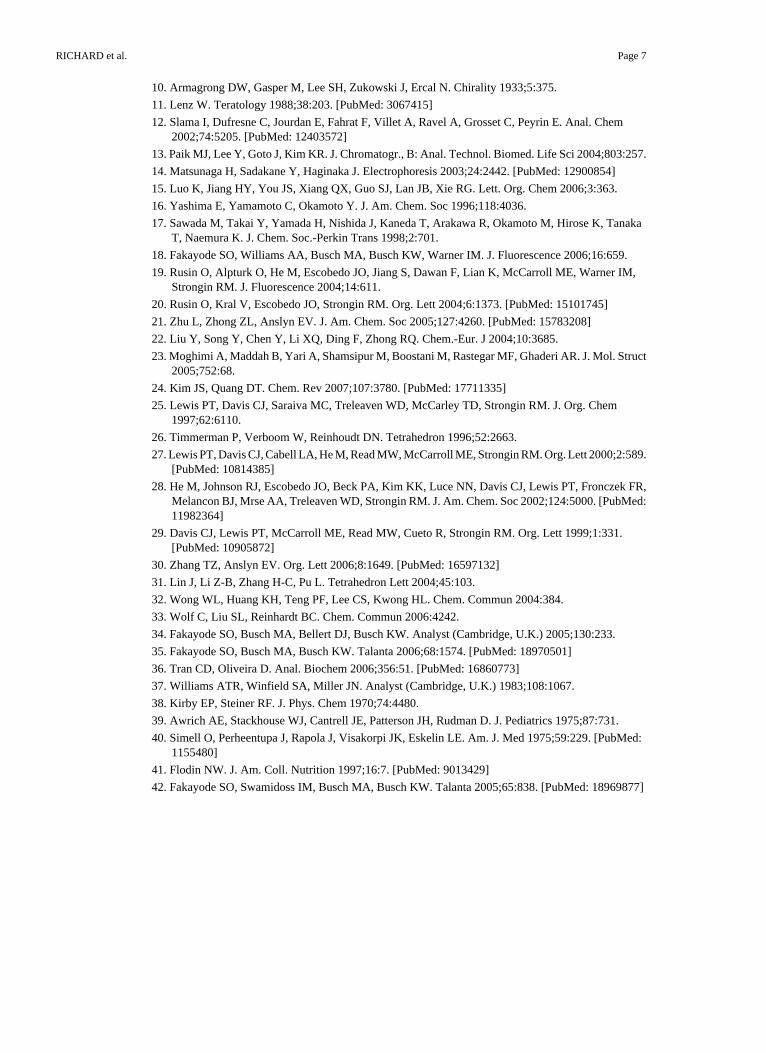
Tetraarylboronate Resorcinarene Macrocycle SynthesisThe chiral (-)-pinanediol tetraarylboronate resorcinarene (72% yield) macrocycle (Fig. 1) wassynthesized according to the procedure described by Lewis et al.25 The structure of thesynthesized TBRM was confirmed by NMR.
Sample PreparationStock solutions of TBRM in spectroscopic grade methanol and each amino acid in carbonatebuffer (pH 7.2) were prepared. For the polarity study, an individual standard solution of thechiral macrocycle (7 μM) was prepared in different solvents. In addition, a series of differentstandard solutions of TBRM were prepared in methanol for determining the fluorescencequantum yield of the chiral macrocycle. For the enantiomeric selectivity of amino acids,mixtures of chiral macrocycle (7 μM) and amino acid (1 mM) were also prepared in methanol(90%) and water (10%). All standard solutions were made in triplicate. For chemometricsexperiments, a stock solution containing 50 μM of TBRM was prepared in methanol. TwentymM stock solutions of each lysine enantiomer were prepared in carbonate buffer (pH 7.2).From the stock solutions, the final concentration of all calibration and validation solutionscontained fixed macrocycle (7 μM) and amino acid (2 mM) enantiomer concentrations. Theenantiomeric composition of the calibration samples ranged from 0.1 to 1.0 mole fraction whilethe validation samples ranged from 0.05 to 0.95 mole fraction.
Data AnalysisMultivariate data analysis was achieved using the Unscrambler™ (version 9.1; CAMO, Inc.,Corvalis, OR). Partial least squares regression models (PLS-1) were developed from thespectral data of guest-host complexes using full cross-validation. The models were validatedwith independently prepared test solutions containing known mole ratios of lysine.
InstrumentationSteady-state fluorescence measurements were performed in triplicate at room temperatureusing a Spex Fluorolog-3 spectrofluorometer (model FL3-22TAU3, Jobin Yvon, Edison, NJ)equipped with a 450 W xenon lamp, double grating excitation and emission monochromators,and an R928P photomultiplier tube detector. Excitation and emission spectra were acquiredusing a 10 mm quartz fluorometer cell with excitation bandpass set at 1 nm and emissionbandpass at 4 nm. The excitation and emission wavelengths were monitored at 290 and 435nm, respectively, for the chiral macrocycle. In addition, absorbance measurements were madein triplicate at room temperature using a UV-3101 PC (UV-VIS NIR) scanningspectrophotometer (Shimadzu, Columbia, MD) equipped with a deuterium halogen lamp. Theabsorbance spectra were recorded in 10 mm quartz cells. Both fluorescence and absorptionspectra were blank subtracted before proceeding with the data analysis.
RICHARD et al. Page 3
NIH
-PA Author Manuscript
NIH
-PA Author Manuscript
NIH
-PA Author Manuscript
RESULTS AND DISCUSSIONTBRM Spectroscopic Characteristics
Fluorescence spectroscopic properties, including emission and excitation characteristics andquantum yield of TBRM, were investigated. The influence of different solvents on the chiralmacrocycle's microenvironment was evaluated. Different spectroscopic grade solvents,including acetonitrile, dimethyl sulfoxide (DMSO), ethyl acetate, methanol, andtetrahydrofuran, were used in order to study the fluorescence characteristics of TBRM.Significant shifts in fluorescence spectra of the chiral macrocycle in the presence of eachsolvent were observed at the maximum emission wavelength. The TBRM maximum emissionwavelengths in tetrahydrofuran, ethyl acetate, acetonitrile, DMSO, and methanol were 325,350, 390, 410, and 435 nm, respectively. In general, these marked shifts in the maximumemission wavelength are indicative of non-covalent interactions between the solvent moleculesand the chiral macrocycle.
The quantum yield of the TBRM was determined in order to evaluate its fluorescenceefficiency. For determination of the TBRM fluorescence quantum yield, L-tryptophan (L-Trp)was selected as a standard sample since L-Trp absorbs near the excitation wavelength(λmax ex = 290 nm) of the chiral macrocycle. As a result, it is expected that the same numberof photons will be absorbed by both samples. Dilute solutions of TBRM (1-10 μM) and L-Trp(4-22 μM) were prepared in methanol and water, respectively. The fluorescence of the standardand unknown were recorded using the same standard and unknown solutions used forabsorbance measurements.
The quantum yield of the chiral macrocycle was calculated using the following equation:37
(1)
where the x and std subscripts denote the chiral macrocycle (unknown) and L-Trp (used as thestandard), respectively, Φ is the quantum yield, Grad is the slope from the plot of integratedfluorescence intensity versus absorbance, and η is the refractive index. The quantum yield ofL-Trp has been previously reported in water as 0.14.38 The refractive indices for water andmethanol are 1.32 and 1.33, respectively. Using Eq. 1, the calculated quantum yield of TBRMat a maximum emission wavelength of 435 nm was 0.10, indicative of a relatively highlyfluorescence efficient macrocycle.
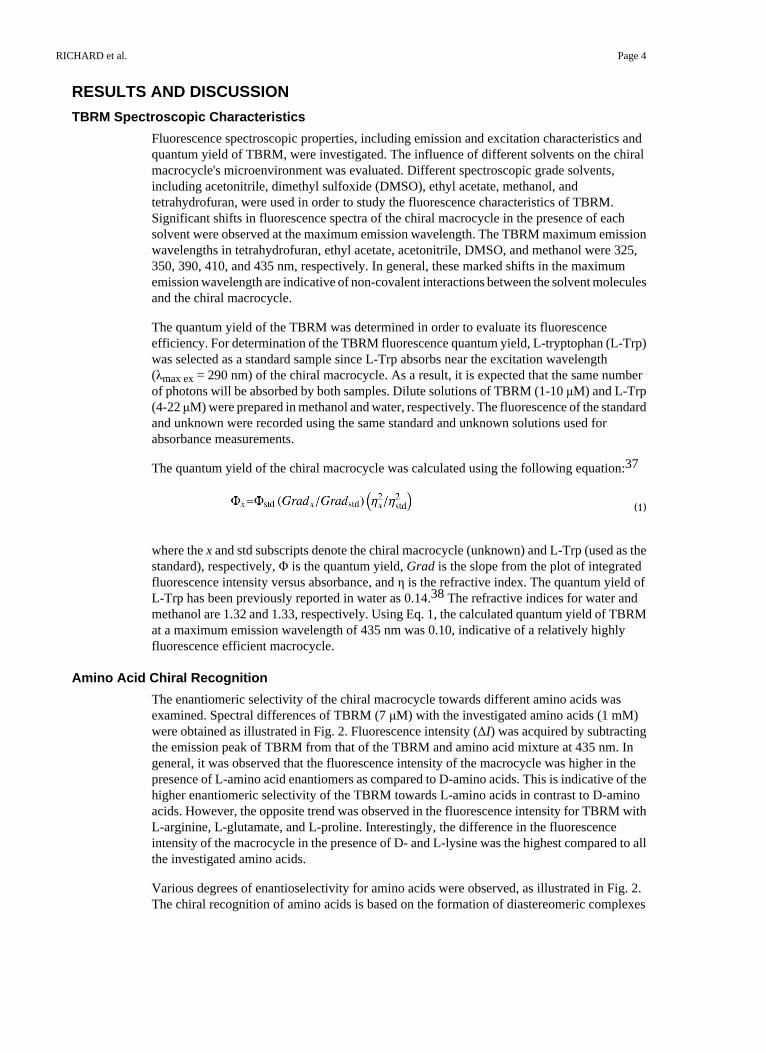
Amino Acid Chiral RecognitionThe enantiomeric selectivity of the chiral macrocycle towards different amino acids wasexamined. Spectral differences of TBRM (7 μM) with the investigated amino acids (1 mM)were obtained as illustrated in Fig. 2. Fluorescence intensity (ΔI) was acquired by subtractingthe emission peak of TBRM from that of the TBRM and amino acid mixture at 435 nm. Ingeneral, it was observed that the fluorescence intensity of the macrocycle was higher in thepresence of L-amino acid enantiomers as compared to D-amino acids. This is indicative of thehigher enantiomeric selectivity of the TBRM towards L-amino acids in contrast to D-aminoacids. However, the opposite trend was observed in the fluorescence intensity for TBRM withL-arginine, L-glutamate, and L-proline. Interestingly, the difference in the fluorescenceintensity of the macrocycle in the presence of D- and L-lysine was the highest compared to allthe investigated amino acids.
Various degrees of enantioselectivity for amino acids were observed, as illustrated in Fig. 2.The chiral recognition of amino acids is based on the formation of diastereomeric complexes
RICHARD et al. Page 4
NIH
-PA Author Manuscript
NIH
-PA Author Manuscript
NIH
-PA Author Manuscript
between the enantiomer and the chiral macrocycle, as indicated by differences in thefluorescence emission of TBRM with amino acid enantiomers. It is observed that there weresignificant differences in fluorescence intensity of TBRM with alanine, leucine, and lysineenantiomers as compared to less evident changes for arginine, aspartate, and asparagineenantiomers. Moreover, all amino acids used in this study do not absorb in the same region asthe chiral macrocycle, further supporting the idea that the changes in fluorescence intensitywere due to interactions between the macrocycle and amino acid enantiomers.
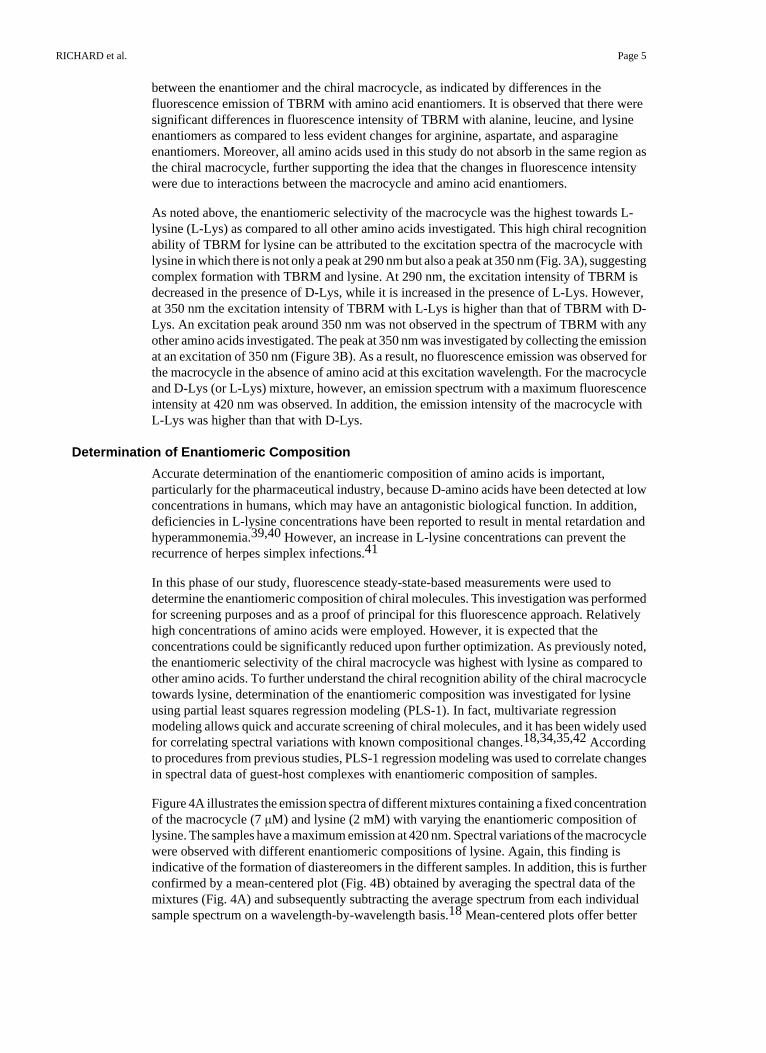
As noted above, the enantiomeric selectivity of the macrocycle was the highest towards L-lysine (L-Lys) as compared to all other amino acids investigated. This high chiral recognitionability of TBRM for lysine can be attributed to the excitation spectra of the macrocycle withlysine in which there is not only a peak at 290 nm but also a peak at 350 nm (Fig. 3A), suggestingcomplex formation with TBRM and lysine. At 290 nm, the excitation intensity of TBRM isdecreased in the presence of D-Lys, while it is increased in the presence of L-Lys. However,at 350 nm the excitation intensity of TBRM with L-Lys is higher than that of TBRM with D-Lys. An excitation peak around 350 nm was not observed in the spectrum of TBRM with anyother amino acids investigated. The peak at 350 nm was investigated by collecting the emissionat an excitation of 350 nm (Figure 3B). As a result, no fluorescence emission was observed forthe macrocycle in the absence of amino acid at this excitation wavelength. For the macrocycleand D-Lys (or L-Lys) mixture, however, an emission spectrum with a maximum fluorescenceintensity at 420 nm was observed. In addition, the emission intensity of the macrocycle withL-Lys was higher than that with D-Lys.
Determination of Enantiomeric CompositionAccurate determination of the enantiomeric composition of amino acids is important,particularly for the pharmaceutical industry, because D-amino acids have been detected at lowconcentrations in humans, which may have an antagonistic biological function. In addition,deficiencies in L-lysine concentrations have been reported to result in mental retardation andhyperammonemia.39,40 However, an increase in L-lysine concentrations can prevent therecurrence of herpes simplex infections.41
In this phase of our study, fluorescence steady-state-based measurements were used todetermine the enantiomeric composition of chiral molecules. This investigation was performedfor screening purposes and as a proof of principal for this fluorescence approach. Relativelyhigh concentrations of amino acids were employed. However, it is expected that theconcentrations could be significantly reduced upon further optimization. As previously noted,the enantiomeric selectivity of the chiral macrocycle was highest with lysine as compared toother amino acids. To further understand the chiral recognition ability of the chiral macrocycletowards lysine, determination of the enantiomeric composition was investigated for lysineusing partial least squares regression modeling (PLS-1). In fact, multivariate regressionmodeling allows quick and accurate screening of chiral molecules, and it has been widely usedfor correlating spectral variations with known compositional changes.18,34,35,42 Accordingto procedures from previous studies, PLS-1 regression modeling was used to correlate changesin spectral data of guest-host complexes with enantiomeric composition of samples.
Figure 4A illustrates the emission spectra of different mixtures containing a fixed concentrationof the macrocycle (7 μM) and lysine (2 mM) with varying the enantiomeric composition oflysine. The samples have a maximum emission at 420 nm. Spectral variations of the macrocyclewere observed with different enantiomeric compositions of lysine. Again, this finding isindicative of the formation of diastereomers in the different samples. In addition, this is furtherconfirmed by a mean-centered plot (Fig. 4B) obtained by averaging the spectral data of themixtures (Fig. 4A) and subsequently subtracting the average spectrum from each individualsample spectrum on a wavelength-by-wavelength basis.18 Mean-centered plots offer better
RICHARD et al. Page 5
NIH
-PA Author Manuscript
NIH
-PA Author Manuscript
NIH
-PA Author Manuscript
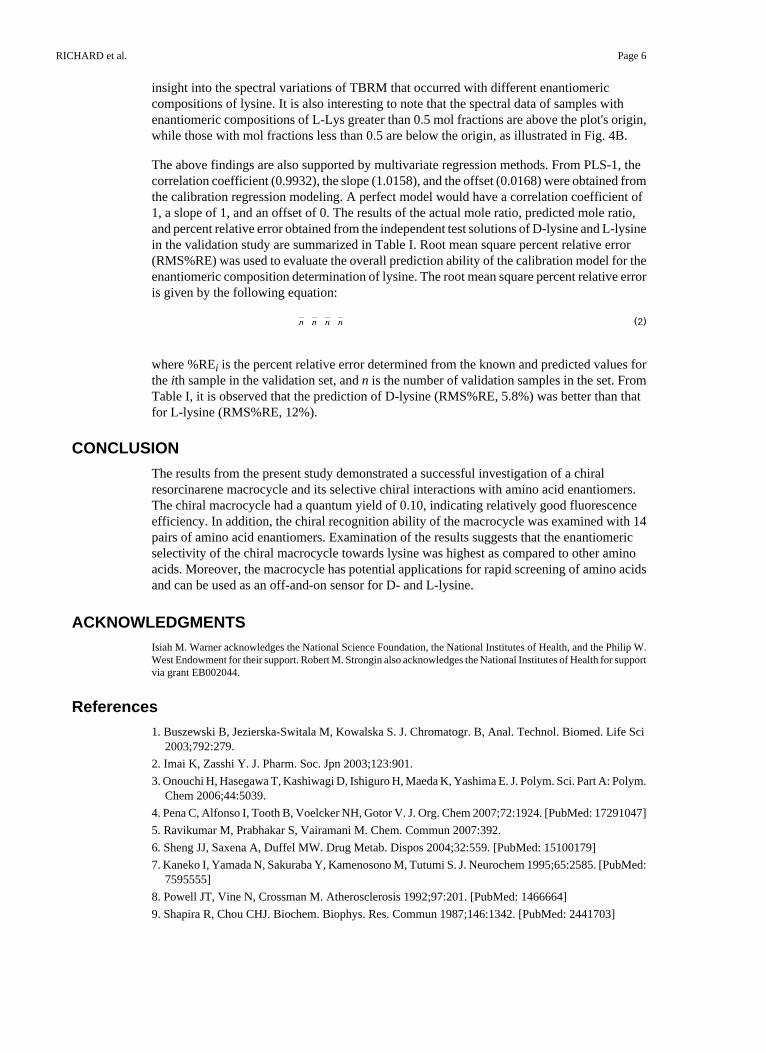
insight into the spectral variations of TBRM that occurred with different enantiomericcompositions of lysine. It is also interesting to note that the spectral data of samples withenantiomeric compositions of L-Lys greater than 0.5 mol fractions are above the plot's origin,while those with mol fractions less than 0.5 are below the origin, as illustrated in Fig. 4B.
The above findings are also supported by multivariate regression methods. From PLS-1, thecorrelation coefficient (0.9932), the slope (1.0158), and the offset (0.0168) were obtained fromthe calibration regression modeling. A perfect model would have a correlation coefficient of1, a slope of 1, and an offset of 0. The results of the actual mole ratio, predicted mole ratio,and percent relative error obtained from the independent test solutions of D-lysine and L-lysinein the validation study are summarized in Table I. Root mean square percent relative error(RMS%RE) was used to evaluate the overall prediction ability of the calibration model for theenantiomeric composition determination of lysine. The root mean square percent relative erroris given by the following equation:
(2)
where %REi is the percent relative error determined from the known and predicted values forthe ith sample in the validation set, and n is the number of validation samples in the set. FromTable I, it is observed that the prediction of D-lysine (RMS%RE, 5.8%) was better than thatfor L-lysine (RMS%RE, 12%).
CONCLUSIONThe results from the present study demonstrated a successful investigation of a chiralresorcinarene macrocycle and its selective chiral interactions with amino acid enantiomers.The chiral macrocycle had a quantum yield of 0.10, indicating relatively good fluorescenceefficiency. In addition, the chiral recognition ability of the macrocycle was examined with 14pairs of amino acid enantiomers. Examination of the results suggests that the enantiomericselectivity of the chiral macrocycle towards lysine was highest as compared to other aminoacids. Moreover, the macrocycle has potential applications for rapid screening of amino acidsand can be used as an off-and-on sensor for D- and L-lysine.
ACKNOWLEDGMENTSIsiah M. Warner acknowledges the National Science Foundation, the National Institutes of Health, and the Philip W.West Endowment for their support. Robert M. Strongin also acknowledges the National Institutes of Health for supportvia grant EB002044.
References1. Buszewski B, Jezierska-Switala M, Kowalska S. J. Chromatogr. B, Anal. Technol. Biomed. Life Sci
2003;792:279.2. Imai K, Zasshi Y. J. Pharm. Soc. Jpn 2003;123:901.3. Onouchi H, Hasegawa T, Kashiwagi D, Ishiguro H, Maeda K, Yashima E. J. Polym. Sci. Part A: Polym.
Chem 2006;44:5039.4. Pena C, Alfonso I, Tooth B, Voelcker NH, Gotor V. J. Org. Chem 2007;72:1924. [PubMed: 17291047]5. Ravikumar M, Prabhakar S, Vairamani M. Chem. Commun 2007:392.6. Sheng JJ, Saxena A, Duffel MW. Drug Metab. Dispos 2004;32:559. [PubMed: 15100179]7. Kaneko I, Yamada N, Sakuraba Y, Kamenosono M, Tutumi S. J. Neurochem 1995;65:2585. [PubMed:
7595555]8. Powell JT, Vine N, Crossman M. Atherosclerosis 1992;97:201. [PubMed: 1466664]9. Shapira R, Chou CHJ. Biochem. Biophys. Res. Commun 1987;146:1342. [PubMed: 2441703]
RICHARD et al. Page 6
NIH
-PA Author Manuscript
NIH
-PA Author Manuscript
NIH
-PA Author Manuscript
10. Armagrong DW, Gasper M, Lee SH, Zukowski J, Ercal N. Chirality 1933;5:375.11. Lenz W. Teratology 1988;38:203. [PubMed: 3067415]12. Slama I, Dufresne C, Jourdan E, Fahrat F, Villet A, Ravel A, Grosset C, Peyrin E. Anal. Chem
2002;74:5205. [PubMed: 12403572]13. Paik MJ, Lee Y, Goto J, Kim KR. J. Chromatogr., B: Anal. Technol. Biomed. Life Sci 2004;803:257.14. Matsunaga H, Sadakane Y, Haginaka J. Electrophoresis 2003;24:2442. [PubMed: 12900854]15. Luo K, Jiang HY, You JS, Xiang QX, Guo SJ, Lan JB, Xie RG. Lett. Org. Chem 2006;3:363.16. Yashima E, Yamamoto C, Okamoto Y. J. Am. Chem. Soc 1996;118:4036.17. Sawada M, Takai Y, Yamada H, Nishida J, Kaneda T, Arakawa R, Okamoto M, Hirose K, Tanaka
T, Naemura K. J. Chem. Soc.-Perkin Trans 1998;2:701.18. Fakayode SO, Williams AA, Busch MA, Busch KW, Warner IM. J. Fluorescence 2006;16:659.19. Rusin O, Alpturk O, He M, Escobedo JO, Jiang S, Dawan F, Lian K, McCarroll ME, Warner IM,
Strongin RM. J. Fluorescence 2004;14:611.20. Rusin O, Kral V, Escobedo JO, Strongin RM. Org. Lett 2004;6:1373. [PubMed: 15101745]21. Zhu L, Zhong ZL, Anslyn EV. J. Am. Chem. Soc 2005;127:4260. [PubMed: 15783208]22. Liu Y, Song Y, Chen Y, Li XQ, Ding F, Zhong RQ. Chem.-Eur. J 2004;10:3685.23. Moghimi A, Maddah B, Yari A, Shamsipur M, Boostani M, Rastegar MF, Ghaderi AR. J. Mol. Struct
2005;752:68.24. Kim JS, Quang DT. Chem. Rev 2007;107:3780. [PubMed: 17711335]25. Lewis PT, Davis CJ, Saraiva MC, Treleaven WD, McCarley TD, Strongin RM. J. Org. Chem
1997;62:6110.26. Timmerman P, Verboom W, Reinhoudt DN. Tetrahedron 1996;52:2663.27. Lewis PT, Davis CJ, Cabell LA, He M, Read MW, McCarroll ME, Strongin RM. Org. Lett 2000;2:589.
[PubMed: 10814385]28. He M, Johnson RJ, Escobedo JO, Beck PA, Kim KK, Luce NN, Davis CJ, Lewis PT, Fronczek FR,
Melancon BJ, Mrse AA, Treleaven WD, Strongin RM. J. Am. Chem. Soc 2002;124:5000. [PubMed:11982364]
29. Davis CJ, Lewis PT, McCarroll ME, Read MW, Cueto R, Strongin RM. Org. Lett 1999;1:331.[PubMed: 10905872]
30. Zhang TZ, Anslyn EV. Org. Lett 2006;8:1649. [PubMed: 16597132]31. Lin J, Li Z-B, Zhang H-C, Pu L. Tetrahedron Lett 2004;45:103.32. Wong WL, Huang KH, Teng PF, Lee CS, Kwong HL. Chem. Commun 2004:384.33. Wolf C, Liu SL, Reinhardt BC. Chem. Commun 2006:4242.34. Fakayode SO, Busch MA, Bellert DJ, Busch KW. Analyst (Cambridge, U.K.) 2005;130:233.35. Fakayode SO, Busch MA, Busch KW. Talanta 2006;68:1574. [PubMed: 18970501]36. Tran CD, Oliveira D. Anal. Biochem 2006;356:51. [PubMed: 16860773]37. Williams ATR, Winfield SA, Miller JN. Analyst (Cambridge, U.K.) 1983;108:1067.38. Kirby EP, Steiner RF. J. Phys. Chem 1970;74:4480.39. Awrich AE, Stackhouse WJ, Cantrell JE, Patterson JH, Rudman D. J. Pediatrics 1975;87:731.40. Simell O, Perheentupa J, Rapola J, Visakorpi JK, Eskelin LE. Am. J. Med 1975;59:229. [PubMed:
1155480]41. Flodin NW. J. Am. Coll. Nutrition 1997;16:7. [PubMed: 9013429]42. Fakayode SO, Swamidoss IM, Busch MA, Busch KW. Talanta 2005;65:838. [PubMed: 18969877]
RICHARD et al. Page 7
NIH
-PA Author Manuscript
NIH
-PA Author Manuscript
NIH
-PA Author Manuscript
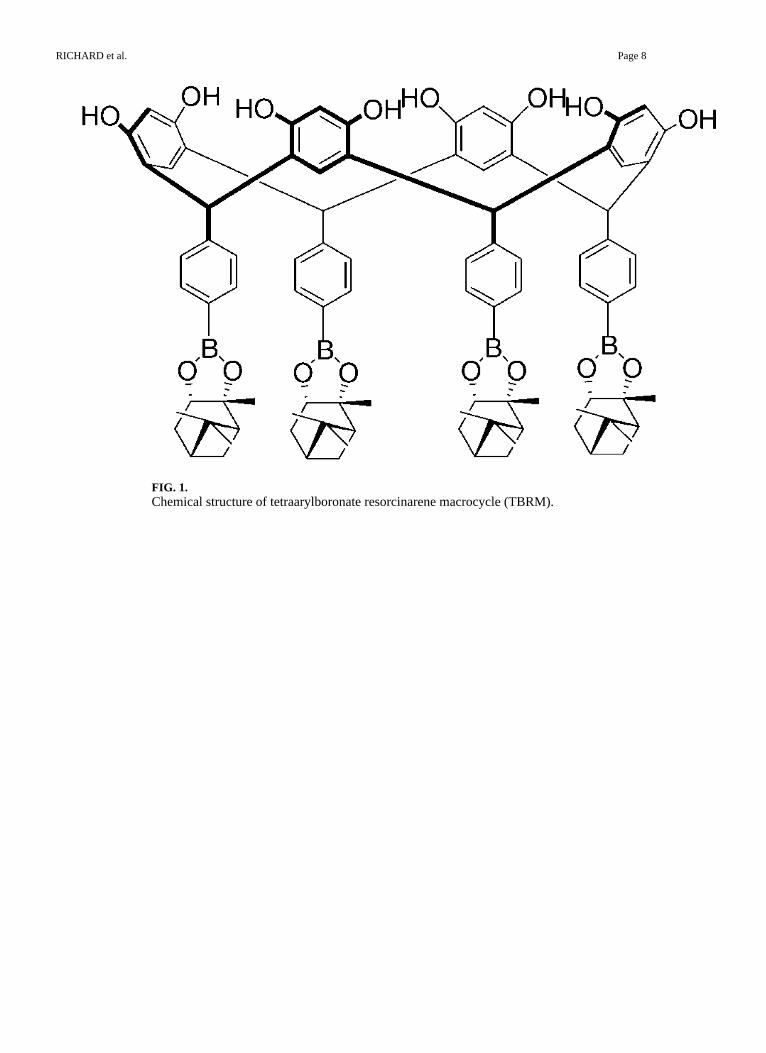
FIG. 1.Chemical structure of tetraarylboronate resorcinarene macrocycle (TBRM).
RICHARD et al. Page 8
NIH
-PA Author Manuscript
NIH
-PA Author Manuscript
NIH
-PA Author Manuscript
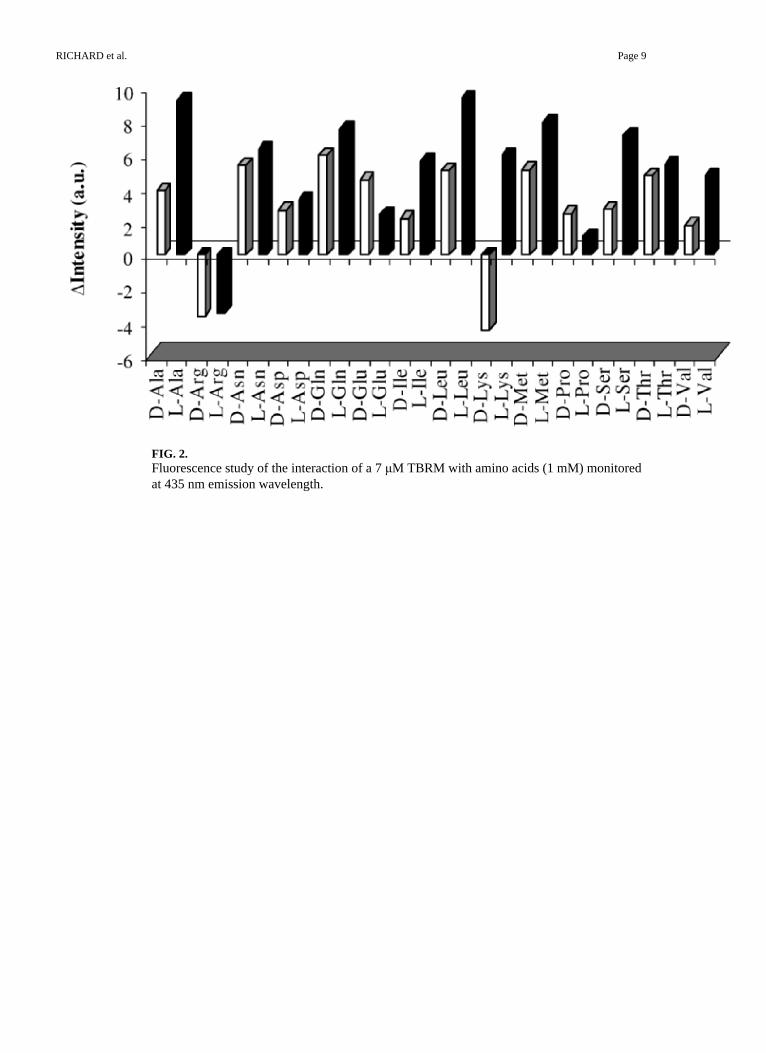
FIG. 2.Fluorescence study of the interaction of a 7 μM TBRM with amino acids (1 mM) monitoredat 435 nm emission wavelength.
RICHARD et al. Page 9
NIH
-PA Author Manuscript
NIH
-PA Author Manuscript
NIH
-PA Author Manuscript

FIG. 3.(A) Excitation spectra monitored at 435 nm emission wavelength and (B) emission spectramonitored at 350 nm excitation wavelength of TBRM (7 μM) in the absence and presence ofD-lysine (1 mM) and L-lysine (1 mM).
RICHARD et al. Page 10
NIH
-PA Author Manuscript
NIH
-PA Author Manuscript
NIH
-PA Author Manuscript
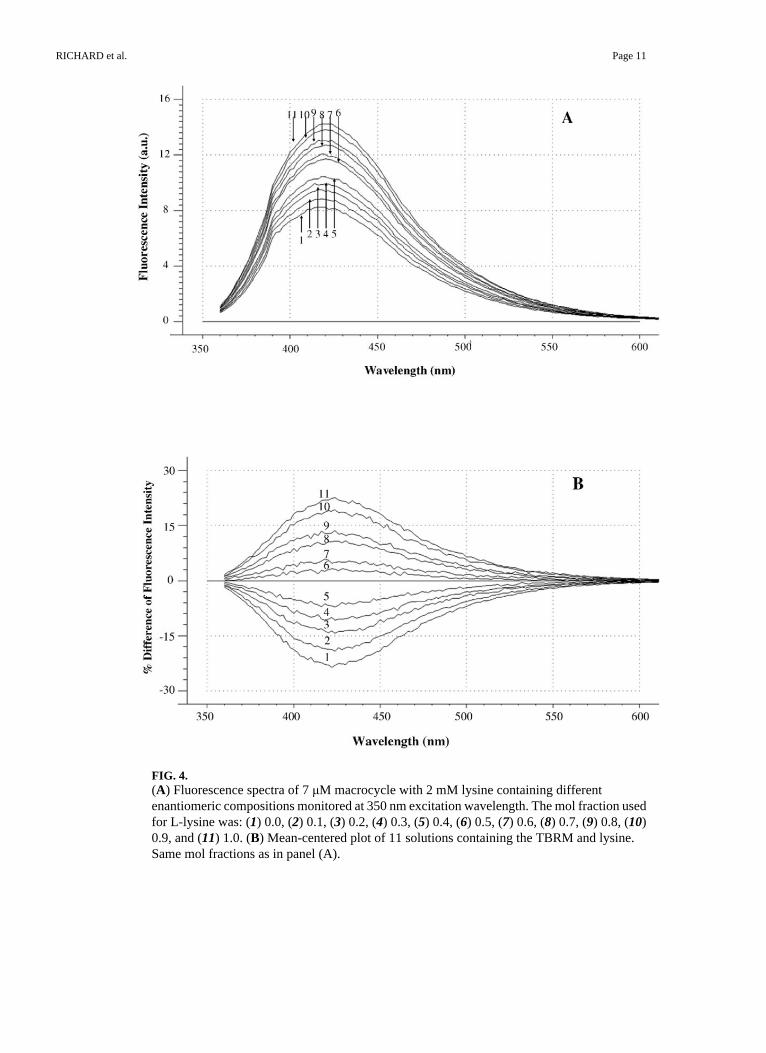
FIG. 4.(A) Fluorescence spectra of 7 μM macrocycle with 2 mM lysine containing differentenantiomeric compositions monitored at 350 nm excitation wavelength. The mol fraction usedfor L-lysine was: (1) 0.0, (2) 0.1, (3) 0.2, (4) 0.3, (5) 0.4, (6) 0.5, (7) 0.6, (8) 0.7, (9) 0.8, (10)0.9, and (11) 1.0. (B) Mean-centered plot of 11 solutions containing the TBRM and lysine.Same mol fractions as in panel (A).
RICHARD et al. Page 11
NIH
-PA Author Manuscript
NIH
-PA Author Manuscript
NIH
-PA Author Manuscript

NIH
-PA Author Manuscript
NIH
-PA Author Manuscript
NIH
-PA Author Manuscript
RICHARD et al. Page 12
TAB
LE I
Act
ual a
nd p
redi
cted
mol
frac
tion
of D
-lysi
ne a
nd L
-lysi
ne fo
r sol
utio
ns c
onta
inin
g 2
mM
lysi
ne a
nd 7
μM
mac
rocy
cle.
Act
ual m
ol fr
actio
nD
-lysi
ne p
redi
cted
mol
frac
tion
Rel
ativ
e er
ror
(%)
Act
ual m
ol fr
actio
nL
-lysi
ne p
redi
cted
mol
frac
tion
Rel
ativ
e er
ror
(%)
0.05
00.
049
1.76
0.95
00.
951
-0.1
10
0.15
00.
157
-4.6
70.
850
0.84
30.
820
0.25
00.
230
8.00
0.75
00.
770
-2.6
7
0.35
00.
308
12.0
0.65
00.
692
-6.4
6
0.45
00.
448
0.41
00.
550
0.55
2-0
.360
0.55
00.
540
1.82
0.45
00.
460
-2.2
2
0.65
00.
589
9.38
0.35
00.
411
-17.
4
0.75
00.
773
-3.0
70.
250
0.22
79.
20
0.85
00.
851
-0.1
200.
150
0.14
90.
670
0.95
00.
996
-1.6
80.
050
0.03
431
.6
RM
S%R
E5.
80R
MS%
RE
12.0