china’s rise in global m a: here to stay - rhodium...
TRANSCRIPT

China’s rise in global M&A: Here to stay The record set for Chinese outbound M&A in 2015 and 2016 could become the new normal if China successfully manages short-term challenges

White & Case2
© A
lam
y
Table of contents
Executive summary
The long-term potential of Chinese outbound investment
China’s emergence as a global player in M&A
Near-term risks to China’s outbound M&A
Introduction
01 0302
Conclusions
1206 18
1China’s rise in global M&A: Here to stay
Executive summary � China has become a key player in global cross-border M&A.
Following almost a decade of consistent double-digit growth, in 2016 China became the second-largest global investor behind the United States with US$140 billion in completed M&A transactions. The top targets for Chinese buyers in 2016 were industrials, high tech, financials and entertainment.
� In the near term, Chinese outbound M&A faces certain challenges. Balance of payments pressures have necessitated stricter administrative controls on outbound investments, which may impact deal flows in 2017. The indebtedness of Chinese corporations and overleveraging in China’s financial system as a whole creates risks, while higher borrowing costs and market-based interest rates may temper overseas buying by Chinese companies. Chinese firms will face rising scrutiny abroad due to growing national security concerns, complaints about asymmetries in market access and discontent about the role of government and industrial policy in China’s outbound investment.
� However, long-term growth potential for Chinese outbound investment is tremendous. Outward investment surpassed inward investment for the first time last year, and China’s global investment footprint is still tiny compared to China’s economic size. Barring a collapse of Chinese economic growth, China’s global outward foreign direct investment (OFDI) flows could average anywhere from US$140 billion to US$275 billion annually over the next decade.
� China’s future outbound investment trajectory is contingent on the implementation of domestic economic reforms. China’s role as global investor in the decade to come will depend on successfully managing current challenges and implementing much-needed structural reforms that address concerns about external financial wherewithal, domestic banking system health, responsible corporate borrowing and exchange rate management.
� China’s record outbound M&A levels in 2015 and 2016 could become the new normal. If China successfully manages near-term challenges and the historical relationship between M&A and outbound investment holds, annual M&A spending by Chinese companies will likely exceed the record levels of Chinese global M&A activity in 2015 and 2016.
OFDI could reach US$275 billion annually over the next
decade
US
$275billion
In 2016, China became the
second-largest global investor behind the US with US$140
billion in completed M&A
transactions
US
$140billion

White & Case2
IntroductionChallenges notwithstanding, Chinese cross-border M&A is likely to grow significantly over the next decade
hina has become one of the most important sources of global cross-border M&A. In 2007, it accounted for only one percent of global cross-border M&A value. By 2016, China captured 14 percent—
second only to the United States, which accounted for 19 percent. In 2016, Chinese companies spent US$140 billion on global acquisitions, almost twice the previous annual record set in 2015.
Yet the future of China’s global M&A has recently become a matter of debate. Chinese investors face serious challenges, including tighter controls on outbound capital flows in China, dangerously high levels of corporate debt and greater overseas scrutiny of Chinese investment. These short-term risks may result in a more volatile outbound M&A pattern in coming years.
The debate about short-term risks is important, but it should not overshadow the long-term potential of Chinese outbound investment. Chinese capital is still vastly under-deployed globally, leaving China with ample room to grow its global investment footprint. If it is able to address short-term challenges, Chinese companies will invest hundreds of billions of dollars in the coming decade.
This report provides important context for this debate. It first reviews China’s emergence as the world’s second-largest M&A investor, illustrating how significant a player China has become in recent years. It then discusses the short- and medium-term challenges that Chinese outbound investors face, and explains the underlying issues that need to be addressed. Finally, the report takes a long-term view on the future of Chinese outbound investment by calculating potential Chinese outbound M&A flows under three different scenarios between 2015 and 2025.
Our analysis shows that barring an economic crisis in China, the record set for Chinese outbound M&A in 2016 is not a one-off event. If China sustains economic growth and stays on track with external financial liberalization, the average annual value of Chinese outbound M&A will more than double from 2015 to 2025 compared with the period from 2010 to 2015.
C
If China sustains economic growth and stays on track with external financial liberalization, the average annual value of Chinese outbound M&A will more than double from 2015 to 2025 compared with the period from 2010 to 2015
Alex ZhangPartner, Shanghai, BeijingWhite & Case
Vivian TsoiPartner, Beijing, SingaporeWhite & Case
Francis ZouPartner, New YorkWhite & Case
Farhad JalinousPartner, Washington, DCWhite & Case
John ReissPartner, New York White & Case

3China’s rise in global M&A: here to stay

White & Case4
China’s emergence as a global player in M&ASince the turn of the century, China’s share of global cross-border M&A rose from near-zero to 14 percent—putting it second only to the US
hinese outbound M&A grew at a remarkable pace over the past decade.
In 2005, the value of Chinese cross-border acquisitions totaled less than US$10 billion. By 2009, the amount had risen threefold to US$30 billion—in part because Chinese companies, which were largely shielded from the negative effects of the global financial crisis, were able to seize opportunities to purchase assets at discounted prices. From 2010 to 2015, the annual value of completed Chinese outbound M&A fluctuated between US$30 billion and US$60 billion and then rocketed 120 percent to US$140 billion in 2016, accounting for a record 14 percent of global cross-border M&A value (Figure 1).
From energy and materials to a broader mix of assets In the early 2000s, Chinese outbound M&A largely focused on energy and natural resources. China became a net importer of many raw materials amidst a massive housing and infrastructure boom, and the Chinese government encouraged state-owned enterprises to invest overseas in upstream assets such as oil fields, iron ore mines and copper mines. From 2005 to 2013, Chinese companies spent US$198 billion on global acquisitions in energy and basic materials assets, accounting for 67 percent of China’s total outbound M&A value in that period.
After 2013, the mix of industries targeted by Chinese M&A became much more diverse. In 2014, recognizing the importance of outbound investment for global competitiveness and national development goals, the Chinese
C
Figure 1: China has become a key driver of global cross-border M&A Country-of-origin share of the total value of all completed global cross-border acquisitions
0%
5%
10%
15%
20%
25%
30%
2016201520142013201220112010200920082007200620052004
US 19%
UK 7%
China 14%
Japan 9%
France 3%Germany 4%
Source: Rhodium Group. Selected economies only. Percent figures in labels are for 2016.
government further relaxed its policy regime for outbound investment. This liberalization particularly benefited private companies, which had strong rationales to invest overseas to optimize global value chains, upgrade technology and innovation capacities, develop consumer brands and other customer-serving capabilities in their key export markets, and diversify their global investment portfolios. Financial investors including private equity firms, insurance companies
and conglomerates have also emerged as important outbound investors, broadening the mix of Chinese companies with global ambitions. In 2016, the share of energy and materials assets in total Chinese outbound M&A by value was only 20 percent, and the largest recipient industries of Chinese outbound M&A were high-tech at 24 percent, financial institutions at 13 percent, industrials at 12 percent and real estate at 11 percent (Figure 2).
In 2016, Chinese companies
spent US$140 billion on global
acquisitions. This is almost
double the record set in 2015
US $140
billion

5China’s rise in global M&A: Here to stay
Figure 2: Chinese buyers are targeting an increasingly diverse industry mixAggregate value of global Chinese cross-border M&A by industry (US$ billion)
Figure 3: Most Chinese investment is now flowing to advanced economiesAggregate value of completed Chinese outbound M&A transactions by region/country of target (US$ billion)
0
30
60
90
120
150
Others
Materials
Real Estate
Media and Entertainment
Energy and Power
High Technology
Industrials
Financials
Retail
2016201520142013201220112010200920082007200620052004
0
30
60
90
120
150
2016201520142013201220112010200920082007200620052004
Others
JapanAustraliaCanada
EU 28
US
Source: Rhodium Group. Dataset includes all completed M&A transactions by ultimately Chinese-owned firms, aggregated by date of completion.
Source: Rhodium Group. Dataset includes all completed M&A transactions by ultimately Chinese-owned firms, aggregated by date of completion.
From 2013 to 2016, further increasing investment in high-income economies was largely driven by non-extractive deals in Europe and the US
Changing geographical focusThe changing target industry mix also drove a shift in the geographic distribution of Chinese outbound M&A during the last ten years. Earlier in the century, Chinese acquisitions mostly targeted resource-rich economies in the Middle East, Central Asia, Africa and Latin America. As Chinese investors gained appreciation for political risk and the unconventional oil and gas boom opened up new opportunities, investment shifted to politically stable, resource-rich countries such as Canada, Australia and the US. From 2008 to 2013, those three economies accounted for almost half of total Chinese outbound M&A.
From 2013 to 2015, further increasing investment in industrialized countries was largely driven by non-extractive deals in Europe and the US. By 2015, high-income economies were capturing two-thirds of all Chinese M&A by value. These trends continued in 2016, with a particularly significant increase in deal flow to the US and continuously high levels of investment in Europe. Other economies that made it into the top 10 list of target economies in 2016 include Hong Kong, Israel, Brazil and Malaysia (Figure 3).
White & Case6
China’s regulatory framework for outward foreign direct investment (OFDI) approval
China has significantly liberalized and streamlined the regulatory process for OFDI in recent years. Under current rules, most companies only have to register their investments with local offices of the Ministry of Commerce (MOFCOM) and the National Development and Reform Commission (NDRC) before securing foreign exchange for their transactions from banks. Transactions involving more than US$300 million are subject to more stringent requirements and must be submitted to the NDRC for pre-approval. Deals involving sensitive countries, regions and industries must also go through a special approval process that involves MOFCOM, the NDRC and, in some cases, the State Council.
In reaction to rapid capital outflows, China increased scrutiny on certain transactions in 2016. The government did not formally change OFDI regulations, but
it has taken additional steps to increase scrutiny for certain kinds of transactions. Most at risk are transactions that would require the transfer of large amounts of foreign exchange offshore, investments that are outside of the investor’s primary area of business, investments in real estate and other assets that primarily function as a store of value, transactions by over-leveraged companies or companies that rely heavily on domestic debt financing, takeovers aimed at taking private Chinese companies that are listed on overseas exchanges, and investments by limited partnerships.
In the first half of 2017, the government is expected to issue new rules to clarify and formalize new outbound investment policies for market participants.
Near-term risks to China’s outbound M&A China’s future outbound investment trajectory is contingent on the implementation of domestic reforms
n 2016, China became the second-largest global source of completed cross-border
M&A. However, Chinese investors now face a number of significant near-term risks, which may lead to greater volatility in outbound M&A patterns going forward. The three main risks are capital controls related to balance of payments pressures, corporate and broader debt levels in the Chinese economy, and growing regulatory and political backlash against Chinese investment from host economies. Balance of payments and capital controls One major driver behind the recent growth in Chinese outbound M&A has been the far-reaching liberalization of administrative controls on corporate outward investment. After the latest round of reforms in 2014, most overseas investments now only require registration with local authorities, with formal approvals limited to large-scale transactions and investments in politically sensitivecountries and industries.
This liberalization was predicated on a structural surplus in the financial account of China’s balance of payments. However, China’s financial account position has moved from significant surpluses to substantial deficits in the past two years (Figure 4). Capital outflows accelerated after the one-off yuan depreciation in mid-2015, and by early 2017 China’s foreign exchange reserves had dropped by US$1 trillion, or about 25 percent from the peak in mid-2014. Additional currency pressure looms with expectations of an expansive US fiscal policy and further rate hikes
by the Federal Reserve in 2017.In reaction to these pressures,
Chinese authorities began to retighten administrative controls for capital outflows in 2016, including those for outbound M&A transactions. While publicly reaffirming support for legitimate outbound investment, Beijing issued informal guidance to regulators and local banks to scrutinize certain types of outbound investments. Beijing’s new stance on outbound acquisitions is unlikely to bring deal flow to a halt, but it will slow down certain types of transactions. Moreover, the new policies have
By early 2017, China’s foreign
exchange reserves had dropped by
US$1Tr compared to the 2014 peak
I further raised the bar for Chinese companies in terms of reverse break fees and other concessions when competing for foreign assets, which could impair the ability of Chinese investors to continue the pace of buying seen in 2016.
US
-$1trillion

7China’s rise in global M&A: Here to stay
Figure 4: Accelerating capital outflows are pressuring Chinese policymakersFinancial account by component in China’s quarterly balance of payments (US$ billion)
0
50
100
150
200
-200
-150
-100
-50
0
Q4
2016
Q3
2016
Q2
2016
Q1
2016
Q4
2015
Q3
2015
Q2
2015
Q1
2015
Q4
2014
Q3
2014
Q2
2014
Q1
2014
Q4
2013
Q3
2013
Q2
2013
Q1
2013
Q4
2012
Q3
2012
Q2
2012
Q1
2012
Q4
2011
Q3
2011
Q2
2011
Q1
2011
Q4
2010
Q3
2010
Q2
2010
Q1
2010
Q4
2009
Q3
2009
Q2
2009
Q1
2009
Q4
2008
Q3
2008
Q2
2008
Q1
2008
Q4
2007
Q3
2007
Q2
2007
Q1
2007
Q4
2006
Q3
2006
Q2
2006
Derivatives
Direct investment
Other investment
Portfolio investment
Financial account balance
Source: People’s Bank of China, State Administration of Foreign Exchange, Rhodium Group. Data for 4Q 2016 is preliminary, and a full breakdown by category is not yet available.

White & Case8
-40%
-20%
0%
20%
40%
60%
80%
Outstanding credit to non-financial corporations as percent of GDP, 2016
Perc
ent
chan
ge in
out
stan
ding
cor
pora
te c
redi
t fr
om 2
010
to 2
016
Indonesia
Mexico SingaporeSaudi Arabia
Chile
China
France
Canada
Australia
MalaysiaCzech
Korea
FinlandIndia
GermanyGreece
Italy AustriaJapan Portugal
DenmarkNew Zealand
HungaryIsraelUK
Spain
Argentina
SwitzerlandUS
RussiaPoland
ThailandBrazil
South Africa Belgium
Norway
SwedenNetherlands
Turkey
Debt levels and corporate leverageA second serious threat to sustaining high levels of Chinese outbound investment is the indebtedness of China’s corporate sector. From 2010 to 2016, total outstanding debt in the Chinese economy increased by 166 percent to more than US$24 trillion, with the majority of the growth attributable to sharp increases in lending to state-owned enterprises and, to a lesser extent, private firms. This brought China’s corporate debt-to-gross domestic product (GDP) ratio to more than 160 percent and China’s total debt-to-GDP ratio to more than 220 percent in 2016 (Figure 5). China’s elevated debt levels are widely viewed as dangerously high. A tightening of domestic monetary conditions in China (for example, in response to rising interest rates in the US) could have a significant impact on the ability of Chinese companies to service their existing debt and raise additional funds for outbound M&A transactions.
A phase of serious deleveraging or a slowdown of economic growth could also disrupt established financing mechanisms for outbound M&A at state-owned banks and weigh on the appetite of international banks to participate in financing. Japan provides a sobering historical precedent: Outward financial direct investment OFDI by Japanese companies soared in the 1980s on the back of strong GDP growth and asset price increases, but then tanked subsequently as the asset bubble burst and Japan entered its lost decade (Figure 6).
Figure 5: The recent explosion of Chinese corporate debtCorporate debt growth and levels in China compared to selected other nations
Source: Bank for International Settlements, Rhodium Group. Includes all countries included in the Bank of International Settlements dataset on total credit to the non-financial sectors except Luxembourg (363%), Hong Kong (233%) and Ireland (264%).
Figure 6: The case of Japan illustrates the impact of a sharp growth slowdown on outbound investment Japanese 3-year average OFDI flows (left, US$ million); Japanese 3-year average GDP growth (right)
0
5,000
10,000
15,000
20,000
25,000
30,000
35,000
40,000
45,000
50,000Japanese FDI outflows, 3yma
2000
1999
1998
1997
1996
1995
1994
1993
1992
1991
1990
1989
1988
1987
1986
1985
1984
1983
1982
1981
1980
-1%
0%
1%
2%
3%
4%
5%
6%
7%
Japanese GDP growth rate, 3yma
Source: United Nations Conference on Trade and Development, World Bank, Rhodium Group

9
Approaches to screening foreign investments for national security risks
In the US, the Committee on Foreign Investment in the United States (CFIUS) reviews transactions for potential security threats. CFIUS is chaired by the Secretary of the Treasury, and includes the heads of various other US Government agencies and certain other key Executive Branch representatives. The CFIUS review process is ostensibly voluntary, though CFIUS actively looks for transactions of interest that were not notified and can “invite” parties to file or initiate reviews directly.
The process consists of a draft “prefiling” that typically takes several weeks and allows CFIUS staff to provide initial feedback on a filing; an initial 30-calendar-day review period; a potential additional 45-calendar-day investigation phase (which is required in more than a third of all cases); and, in rare instances, a 15-calendar-day Presidential review period. In cases in which CFIUS has national security concerns, it can impose mitigation requirements to address those issues, recommend the parties abandon the deal if no mitigation is deemed acceptable, or refer the case to the President with a recommendation to block the transaction if the parties will not abandon it.
Cases in which Chinese deals were prohibited or canceled as a result of the CFIUS process have included acquisitions of US companies in close physical proximity to sensitive military installations, those that are part of US critical infrastructure, and US companies with technology with both military and civilian applications.
While CFIUS’s scope is legally limited to national security only, national security is not defined by law and CFIUS tends to interpret its jurisdiction broadly. There is also a chance of tougher scrutiny under the new US administration, including the potential for new legislation, making the CFIUS process more aggressive and possibly having a reach beyond national security concerns.
Canada and Australia both employ review mechanisms based on criteria that are not limited exclusively to national security.
With respect to Canada, if financial and other thresholds are exceeded, the investor may be required to obtain
approval by showing that the investment is of “net benefit” to Canada. Net benefit criteria include economic, antitrust, Canadian participation and national security elements. Even if no approval is required, the investment could be subject to Canadian review based on national security considerations, which an investor may choose to address prior to implementation.
Australia requires a wide variety of transactions involving foreign persons to be reviewed and approved before completion, including any acquisition by a foreign person of a substantial interest (20 percent or more) in an Australian entity and the acquisition of residential or vacant land. Historically, there have been few rejections by the Treasurer of Australia on the grounds of national interest, but recently the Treasurer has blocked three high-profile investment proposals. Also, the Foreign Investment Review Board, which advises the Treasurer and examines foreign investment proposals, has been increasingly willing to use conditions and undertakings to increase the government’s oversight of more complex or sensitive investments.
The European Union does not have a supranational framework for reviewing foreign investment, and approaches vary greatly between countries.
Germany generally provides for a liberal investment climate and limited restrictions on foreign investments. However, there is a growing scrutiny by the Federal Ministry for Economic Affairs and Energy (BMWi) on acquisitions by investors that are not members of the European Union or European Free Trade Association (especially in the tech sector). This may also be seen as a direct response to another peak of Chinese M&A activity into Germany seen in 2016 and the lack of reciprocity in M&A market access to China voiced by German government officials. Pending further changes in the current legislative environment, the threshold for blocking decisions by the BMWi remains high, requiring an actual and sufficiently serious threat to public order or security.
China’s rise in global M&A: Here to stay
Regulatory and political backlash in host economiesA third major risk factor for the future trajectory of Chinese outbound M&A is changing attitudes toward Chinese capital in host economies. There is increasing anxiety in host countries about the potential impacts of Chinese takeovers on national security. Foreign control over local assets can elicit specific national security concerns, and many countries have specific investment review regimes in place to assess and mitigate these kinds of concerns. These regimes typically have review processes that consider factors such as foreign control over strategic assets, influence over production of critical defense inputs, transfer of sensitive technology, and possible on-the-ground espionage and sabotage actions. In addition to worries about proximity of Chinese-owned companies to military installations and other critical infrastructure, Chinese companies’ increasing appetite for high-tech assets with potential military dual-use applications has elicited concerns, which has contributed to the collapse of a number of Chinese takeovers in recent years. In a November 2016 report to the US Congress, the China Economic and Security Review Commission recommended changes to the CFIUS statute that would empower CFIUS to block Chinese SOEs from acquiring US companies.

White & Case10

11
Host countries are also increasingly anxious about potential negative economic impacts from Chinese M&A activity. One of the main concerns is the lack of reciprocal market access for foreign firms in China. While Chinese OFDI has grown rapidly in recent years, China has only made limited progress in further leveling the playing field for foreign companies in China, which still face numerous formal investment restrictions as well as alleged informal discrimination. This lack of reciprocal openness is fueling particular frustration in advanced economies, which follow principles of openness and nondiscrimination for Chinese and other foreign investors (Figure 7).
Another set of economic concerns are related to the unusual role of the state and industrial policy in China’s economy. Host economies are increasingly worried that outbound investment could become a channel through which distortions in the Chinese
Figure 7: China is One of the most restrictive countries for foreign direct investmentIndex based on formal investment restrictions, ranging from 1=Closed to 0=Open
0.00
0.05
0.10
0.15
0.20
0.25
0.30
0.35
0.40
OE
CD
Res
tric
tiven
ess
Inde
x
Ger
man
y
Fran
ce
Japa
n
Sou
th A
fric
a
Uni
ted
Kin
gdom
OE
CD
Ave
rageUS
Bra
zil
Aus
tral
ia
Can
ada
Rus
sia
BR
ICS
Ave
rage
Indi
a
Chi
na
Closed Open
0.39
0.24
0.19 0.180.17
0.14
0.10 0.090.07 0.06 0.06 0.05 0.05
0.02
Source: Organization for Economic Cooperation and Development. The index is compiled by measuring restrictions on foreign equity, screening and prior approval requirements, rules for key personnel, and other restrictions on operating foreign enterprises. These factors are weighted and scored for all industries, which are then aggregated and weighted into an overall index for each country.
marketplace such as asset price bubbles and misallocation of resources spill over into overseas markets. Policymakers are also nervous about potential unfair advantages through subsidies and access to preferential loans for state-owned companies, and acquisitions of technology assets driven by industrial policies such as “Made in China 2025.” Several countries are in various stages of reevaluating their inward investment policies in response to these new concerns, including Germany and the US. This has also been discussion in Europe and the US about the appropriateness of introducing so-called “net economic benefit tests” and “reciprocity tests,” in addition to a narrower national security analysis. While such tests have not yet been put in place in major European jurisdictions or the US, the discussion marks a trend toward greater emphasis on such policy considerations, at least within the political debate.
China’s rise in global M&A: Here to stay
One of the concerns abroad is the lack of reciprocal market access for foreign firms in China
White & Case12
Concept and definition of foreign direct investment
Foreign direct investment (FDI) is a type of cross-border capital flow that results in significant long-term control of a company, as opposed to shorter-term portfolio investments and cross-border lending. FDI can come in two different modes: the establishment of new subsidiaries (greenfield FDI) or the acquisition of existing assets (mergers and acquisitions or M&A).
Inbound or inward FDI refers to foreigners making investments in the respective nation. Outbound or outward FDI (OFDI) refers to residents of the respective country investing overseas.
FDI flows represent investments made during a specific period of time. FDI stocks represent the cumulative value of historical investments at a specific point in time.
The long-term potential of Chinese outbound investment Economic fundamentals suggest that Chinese outbound M&A will remain strong in the coming decade if China can successfully manage short-term challenges
hile there are plenty of challenges that may cause greater
volatility in China’s outbound M&A trajectory in the coming years, it is important to peg expectations about future Chinese outbound investment to an analysis of economic fundamentals. These fundamentals suggest that China is still only at the beginning of a secular catch-up in global investment, and Chinese companies can be expected to spend hundreds of billions of dollars on overseas deals in the coming decade if short-term speed bumps are overcome.
Inflection point: China only recently became a net exporter of FDI History has shown that countries’ external investment patterns closely follow their economic development trajectories. In the early stages of economic development, most countries build a deeply negative net position in foreign direct investment (FDI) as they draw foreign capital, while domestic firms do not yet have significant capabilities and interests to invest overseas. As per capita GDP increases, inward FDI growth tends to level off, and local firms start investing abroad. At some point, typically around a per capita GDP of US$15,000, FDI outflows overtake inflows and the net outward FDI position eventually moves into positive territory. Once countries surpass the middle income threshold, their investment
position fluctuates depending on macroeconomic fundamentals and other factors (Figure 8).
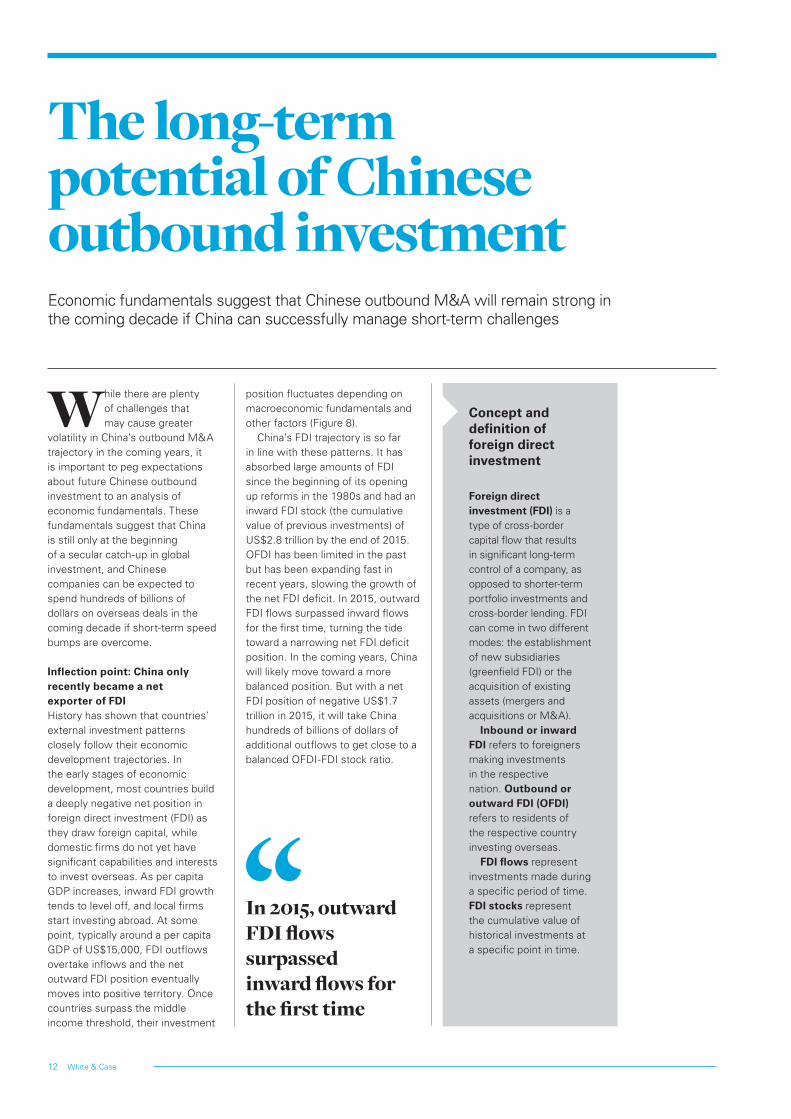
China’s FDI trajectory is so far in line with these patterns. It has absorbed large amounts of FDI since the beginning of its opening up reforms in the 1980s and had an inward FDI stock (the cumulative value of previous investments) of US$2.8 trillion by the end of 2015. OFDI has been limited in the past but has been expanding fast in recent years, slowing the growth of the net FDI deficit. In 2015, outward FDI flows surpassed inward flows for the first time, turning the tide toward a narrowing net FDI deficit position. In the coming years, China will likely move toward a more balanced position. But with a net FDI position of negative US$1.7 trillion in 2015, it will take China hundreds of billions of dollars of additional outflows to get close to a balanced OFDI-FDI stock ratio.
W
In 2015, outward FDI flows surpassed inward flows for the first time

13
Figure 8: Countries’ net FDI positions typically move from deficit to surplus as per-capita GDP increases Ratio of outward FDI to inward FDI stock against per capita GDP, 2015
0 20 40 60 80 100
0.0
0.5
1.0
1.5
2.0
OFD
I-IFD
I
GDP per capita ($ thousands)
ZAF
MYSRUS
GRC
ITA
KORFRA
DNK
CAN
SWE
USA NOR
ISL
IRL GBR
ESP
HUN
PRTIND
BRA
CHNMEX
THA
TURCZE
NZL
SGP
AUS
CHEAT
FIN
Source: International Monetary Fund; Rhodium Group. Blue line is a logarithmic best fit line inserted to show the general uptrend seen in countries; OFDI-FDI stock ratios as per-capita GDP increases.
China’s rise in global M&A: Here to stay

White & Case14
0%
10%
20%
30%
40%
50%
60%
70%
80%
Rat
io o
f O
FDI S
tock
to
GD
P
Indi
a
Chi
na
Mex
ico
Bra
zil
Kore
a
Rus
sia
Japa
n
US
Sou
th A
fric
a
Ger
man
y
Fran
ceUK
72%
65%
58%
49%
39%
31%28%
20%16%
12% 10% 7%
Figure 9: China’s OFDI stock remains tiny as a percentage of GDP Ratio of OFDI Stock to GDP, Percent
Source: International Monetary Fund; Rhodium Group
Figure 10: Chinese OFDI remains underdeveloped relative to inward FDI and trade integrationPercent of GDP, 2015
10%
15%
20%
26%
0%
5%
10%
15%
20%
25%
30%
Inward FDI stockExports of goodsImports of goodsOutward FDI stock
Source: International Monetary Fund, Rhodium Group
Ample headroom: China’s OFDI stock is low by all measures In gauging the magnitude of future outflows, it is important to emphasize just how small China’s current outward FDI position is compared to other economies. Chinese outbound FDI flows have grown spectacularly in recent years, but China’s total stock of OFDI is still among the smallest in the world.
This sense of scale is amplified when considering the size of China’s GDP. The growth of China’s GDP has averaged in the double digits for the past decade, turning China into the world’s second-largest economy. Compared to this rapid increase in GDP, China’s OFDI stock growth has been small. With an OFDI stock of US$1.1 trillion and US$11 trillion in GDP, China’s OFDI-to-GDP ratio was only about 10 percent in 2015, far below developed economies, such as the UK (72 percent), France (65 percent), Germany (58 percent) and the US (39 percent), and less than many emerging markets, including South Africa (49 percent) and Brazil (16 percent) (Figure 9).
China’s outward FDI intensity is also low compared to other modes of global economic integration. After three decades of absorbing FDI, China’s inward FDI stock-to-GDP ratio amounted to 26 percent in 2015. China also rapidly expanded its foreign trade, with imports reaching 15 percent of GDP and exports 20 percent of GDP in the same year. At 10 percent, the ratio of outbound FDI to GDP is still lagging behind despite a rapid increase in recent years (Figure 10).
Projections for Chinese outbound investment under various scenariosIt is clear that China is punching below its weight in terms of global outward FDI. But what is the magnitude of the upside? A number of academic studies have tried to map out China’s OFDI trajectory in the context of broader Chinese external liberalization, but they have yielded either abstract results or numbers that have already been surpassed by reality.1 Historical data from other countries illustrate why this might be the case; while a demonstrable positive relationship
15China’s rise in global M&A: Here to stay
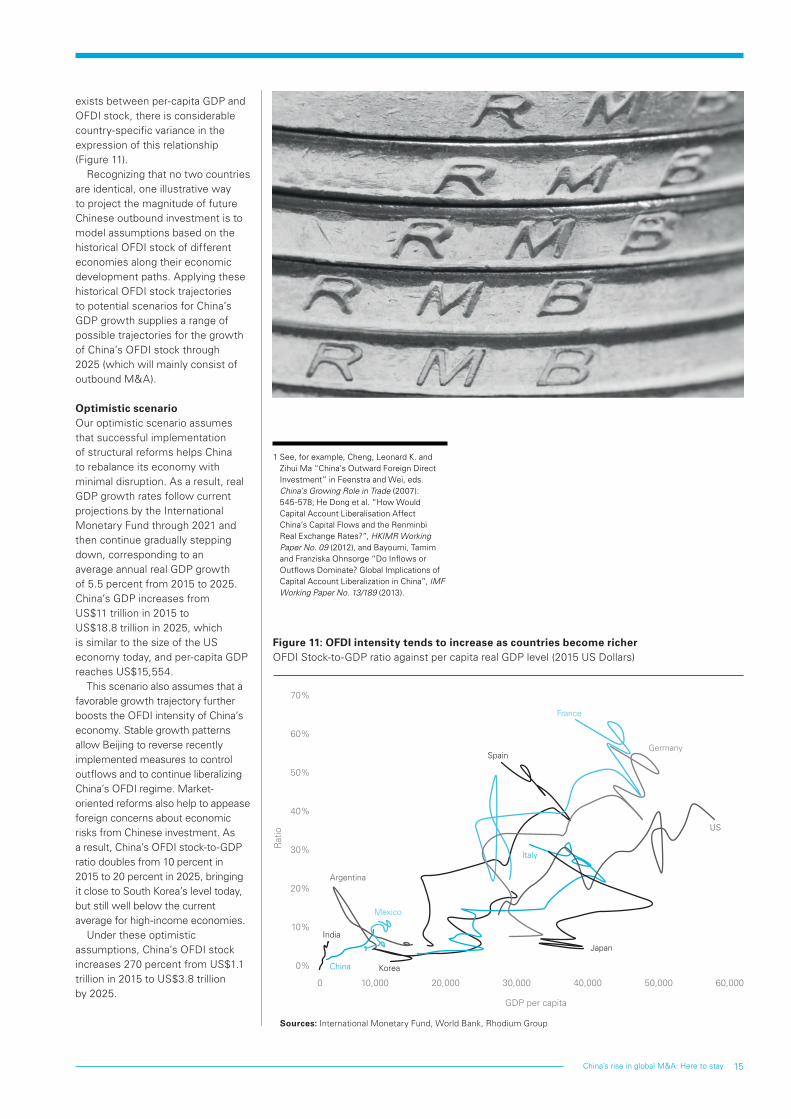
exists between per-capita GDP and OFDI stock, there is considerable country-specific variance in the expression of this relationship (Figure 11).
Recognizing that no two countries are identical, one illustrative way to project the magnitude of future Chinese outbound investment is to model assumptions based on the historical OFDI stock of different economies along their economic development paths. Applying these historical OFDI stock trajectories to potential scenarios for China’s GDP growth supplies a range of possible trajectories for the growth of China’s OFDI stock through 2025 (which will mainly consist of outbound M&A).
Optimistic scenario Our optimistic scenario assumes that successful implementation of structural reforms helps China to rebalance its economy with minimal disruption. As a result, real GDP growth rates follow current projections by the International Monetary Fund through 2021 and then continue gradually stepping down, corresponding to an average annual real GDP growth of 5.5 percent from 2015 to 2025. China’s GDP increases from US$11 trillion in 2015 to US$18.8 trillion in 2025, which is similar to the size of the US economy today, and per-capita GDP reaches US$15,554.
This scenario also assumes that a favorable growth trajectory further boosts the OFDI intensity of China’s economy. Stable growth patterns allow Beijing to reverse recently implemented measures to control outflows and to continue liberalizing China’s OFDI regime. Market-oriented reforms also help to appease foreign concerns about economic risks from Chinese investment. As a result, China’s OFDI stock-to-GDP ratio doubles from 10 percent in 2015 to 20 percent in 2025, bringing it close to South Korea’s level today, but still well below the current average for high-income economies.
Under these optimistic assumptions, China’s OFDI stock increases 270 percent from US$1.1 trillion in 2015 to US$3.8 trillion by 2025.
1 See, for example, Cheng, Leonard K. and Zihui Ma “China’s Outward Foreign Direct Investment” in Feenstra and Wei, eds. China’s Growing Role in Trade (2007): 545-578; He Dong et al. “How Would Capital Account Liberalisation Affect China’s Capital Flows and the Renminbi Real Exchange Rates?”, HKIMR Working Paper No. 09 (2012), and Bayoumi, Tamim and Franziska Ohnsorge “Do Inflows or Outflows Dominate? Global Implications of Capital Account Liberalization in China”, IMF Working Paper No. 13/189 (2013).
Figure 11: OFDI intensity tends to increase as countries become richerOFDI Stock-to-GDP ratio against per capita real GDP level (2015 US Dollars)
Sources: International Monetary Fund, World Bank, Rhodium Group
0%
10%
20%
30%
40%
50%
60%
70%
0 60,00050,00040,00030,00020,00010,000
GDP per capita
Rat
io
Korea
India
China
Argentina
Mexico
Spain
Italy
France
Germany
US
Japan

White & Case16
Base-case scenario Our base-case scenario assumes a soft landing for China’s economy with more near-term volatility as delays in reforms make their eventual implementation more disruptive. Growth rates between now and 2020 fall below current IMF projections before bouncing back to a more sustainable trajectory after 2021, resulting in average annual GDP growth of 4 percent from 2015 to 2025. This trajectory brings China’s GDP to US$16.3 trillion and per-capita GDP to US$14,214 in 2025.
In this scenario, it is also assumed that a phase of greater domestic volatility requires Beijing to maintain outbound investment controls for longer, slowing down the outbound investment ambitions of Chinese companies.
to only US$14 trillion in 2025 with a corresponding per-capita GDP of US$12,143.
Under this scenario, many of the shorter-term challenges facing OFDI further deepen, including balance of payments pressures, growing corporate debt levels, and foreign concerns about negative economic spillovers. As a result, China’s OFDI stock-to-GDP ratio does not catch up with other middle income economies, but stagnates at 10 percent through 2025.
Under these pessimistic assumptions, China’s OFDI stock only increases by about 40 percent to US$1.4 trillion by 2025.
Breaking down these OFDI stock figures into annual averages illustrates that there is still significant potential upside for Chinese outbound investment, even
China’s OFDI stock-to-GDP ratio only increases moderately to 15 percent, which is in line with the current average for emerging markets and just below Brazil today.
Under these base-case assumptions, China’s OFDI stock grows by almost 140 percent to US$2.5 trillion by 2025.
Pessimistic scenario Our pessimistic scenario assumes that China further postpones necessary structural adjustments and instead continues its debt-fueled growth path. Consequently, a few more years of high growth ultimately give way to a hard landing with severe economic disruptions. The ensuing recession drags down the average annual GDP growth rate between 2015 and 2025 to just 2.5 percent, and China’s GDP rises
17China’s rise in global M&A: Here to stay
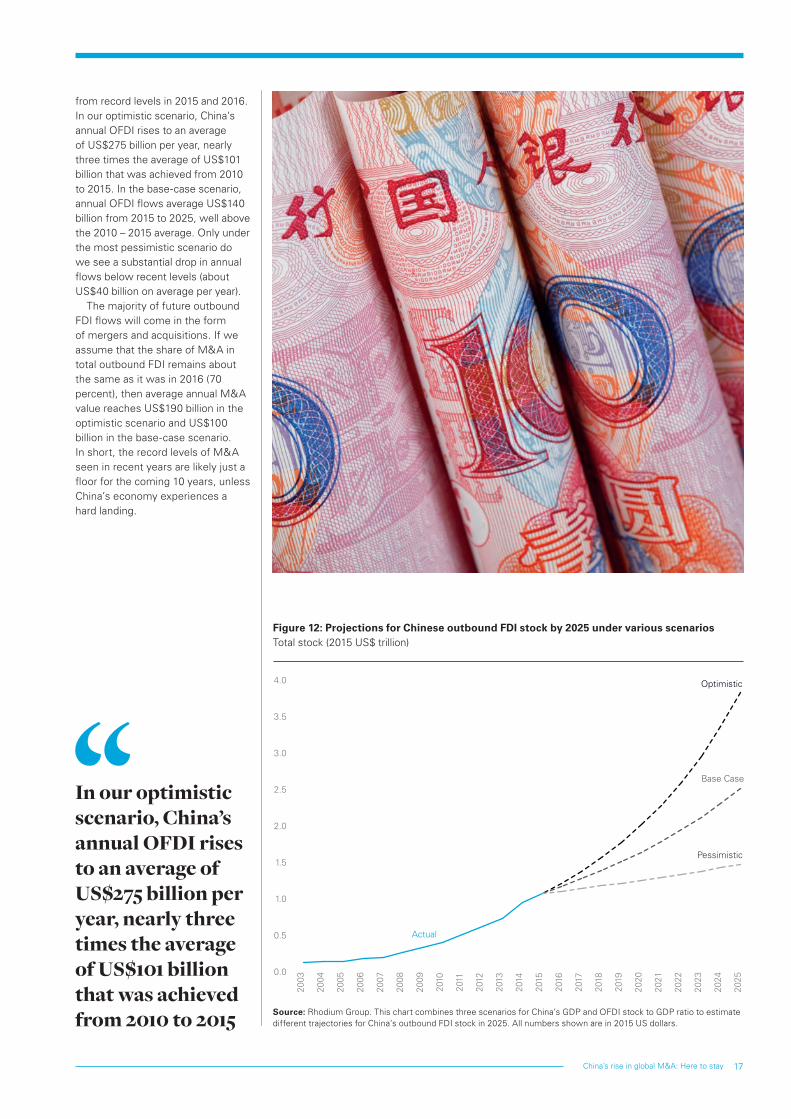
Figure 12: Projections for Chinese outbound FDI stock by 2025 under various scenariosTotal stock (2015 US$ trillion)
0.0
0.5
1.0
1.5
2.0
2.5
3.0
3.5
4.0
2025
2024
2023
2022
2021
2020
2019
2018
2017
2016
2015
2014
2013
2012
2011
2010
2009
2008
2007
2006
2005
2004
2003
Optimistic
Base Case
Actual
Pessimistic
Source: Rhodium Group. This chart combines three scenarios for China’s GDP and OFDI stock to GDP ratio to estimate different trajectories for China’s outbound FDI stock in 2025. All numbers shown are in 2015 US dollars.
In our optimistic scenario, China’s annual OFDI rises to an average of US$275 billion per year, nearly three times the average of US$101 billion that was achieved from 2010 to 2015
from record levels in 2015 and 2016. In our optimistic scenario, China’s annual OFDI rises to an average of US$275 billion per year, nearly three times the average of US$101 billion that was achieved from 2010 to 2015. In the base-case scenario, annual OFDI flows average US$140 billion from 2015 to 2025, well above the 2010 – 2015 average. Only under the most pessimistic scenario do we see a substantial drop in annual flows below recent levels (about US$40 billion on average per year).
The majority of future outbound FDI flows will come in the form of mergers and acquisitions. If we assume that the share of M&A in total outbound FDI remains about the same as it was in 2016 (70 percent), then average annual M&A value reaches US$190 billion in the optimistic scenario and US$100 billion in the base-case scenario. In short, the record levels of M&A seen in recent years are likely just a floor for the coming 10 years, unless China’s economy experiences a hard landing.

White & Case18
ConclusionThe evolution of China’s global M&A footprint will shape global cross-border capital flows in the coming decade
fter a decade of strong outbound investment growth, China is now a key
player in global M&A. However, there are significant near- and medium-term risks for Chinese investors, including Chinese capital controls, the level of debt in the Chinese economy, and regulatory and political backlash against Chinese investment in important host countries.
However, based on historical investment trajectories in other large economies, there is still tremendous room for China’s global investment footprint to expand in the years ahead; but that trajectory is contingent on a heavy load of reform in China, confidence building abroad and management of near-term balance of payments problems. The most important benchmark is whether China implements necessary structural reforms at home. Market-oriented reforms are needed to reduce balance of payments volatility, mitigate debt risks and assuage
foreign concerns about the security and economic consequences of Chinese acquisitions. In addition to macroeconomic and political challenges, Chinese companies’ capacity and sophistication to execute cross-border transactions will also be important factors for China’s M&A success going forward.
Given its extraordinary size, and the pace at which it has demonstrated an ability to expand into global markets, the evolution of China’s global M&A footprint will not just be important, but definitive for global markets. As the second-largest economy on the planet, China will be a critical factor shaping the volume, value and character of global investment activity in the coming decade. China and host nations have a joint interest in cooperating in this area, to ensure that the enormous potential economic benefits of the next phase of Chinese globalization can be realized without compromising the deeply held political and security convictions of other nations.
China will be critical in shaping the volume, value and character of global investment activity in the coming decade
A

19China’s rise in global M&A: here to stay

White & Case20
Global
John ReissPartner, New YorkT +1 212 819 8247E [email protected]
Americas
Gregory PryorPartner, New YorkT +1 212 819 8389E [email protected]
Francis ZouPartner, New YorkT +1 212 819 8733E [email protected]
Farhad JalinousPartner, Washington, DCT +1 202 626 3691E [email protected]
EMEA
Jorg KraffelPartner, BerlinT +49 30 880911 400E [email protected] Allan TaylorPartner, LondonT +44 20 7532 2126E [email protected] John CunninghamPartner, LondonT +44 20 7532 2199E [email protected]
Tobias HeinrichPartner, FrankfurtT +49 69 29994 1121E [email protected]
Asia
Alex ZhangPartner, Shanghai, BeijingT +86 21 6132 5966E [email protected]
Christopher KellyPartner, Hong KongT +852 2822 8740E [email protected]
Vivian TsoiPartner, Beijing, SingaporeT +86 10 5912 9620E [email protected]

21China’s rise in global M&A: here to stay

whitecase.comIn this publication, White & Casemeans the international legal practice comprising White & Case llp, a New York State registered limited liability partnership, White & Case llp, a limited liability partnership incorporated under English law and all other affiliated partnerships, companies and entities.
This publication is prepared for the general information of our clients and other interested persons. It is not, and does not attempt to be, comprehensive in nature. Due to the general nature of its content, it should not be regarded as legal advice.
Produced in collaboration with Rhodium Group, an economic research firm that combines policy experience, quantitative economic
tools and on-the-ground research to analyze disruptive global trends.
rhg.com
DisclaimerThis publication contains general information and is not intended to be comprehensive nor to provide nancial, investment, legal, tax or other professional advice or services. This publication is not a substitute for such professional advice or services, and it should not be acted on or relied upon or used as a basis for any investment or other decision or action that may affect you or your business. Before taking any such decision, you should consult a suitably quali ed professional advisor. While reasonable effort has been made to ensure the accuracy of the information contained in this publication, this cannot be guaranteed and neither Mergermarket nor any of its subsidiaries or any af liate thereof or other related entity shall have any liability to any person or entity which relies on the information contained in this publication, including incidental or consequential damages arising from errors or omissions. Any such reliance is solely at the user’s risk.