china market outlook - umtri ihs automotive, lv global segmentation, ... oems moving to emerging...
TRANSCRIPT

© 2016 IHS Markit. All Rights Reserved.© 2016 IHS Markit. All Rights Reserved.
China Market OutlookVolume Growth Engine to the Global Automotive Industry
UMTRI: Ann Arbor, Michigan | 9 November 2016
Mike Jackson, Senior Executive
North America, Vehicle Production Forecasting
+1-248-388-8912

© 2016 IHS
-5
-4
-3
-2
-1
0
1
2
3
4
5
6
7
8
World UnitedStates
Japan Eurozone Brazil Russia India China UnitedKingdom
2015 2016 2017 Avg 2018-2023
Global Growth Set to Rise in 2017US Economy Gains as Brazil/Russia Start Recovery
GD
P g
row
th r
ate
%
World average
2016 = 2.4%
World economic growth rates
Source: IHS

© 2016 IHS 3
8890
9194
105
1.0%
1.5%
2.0%
2.5%
3.0%
3.5%
4.0%
50
60
70
80
90
100
110
200
1
200
3
200
5
200
7
200
9
201
1
201
3
201
5
201
7
201
9
202
1
202
3
World Light Vehicle Sales ForecastMarket will reach 100 million by end of the decade; growth peak is approaching
Source: IHS Automotive sales forecasts
Annual LV sales (millions)
3
Annual growth (%)
Average growth 3.2%
Growth rate peaks
in 2019
© 2016 IHS
0.8
1.0
1.2
1.4
1.6
1.8
2.0
2.2
20
12
20
13
20
14
20
15
20
16
20
17
20
18
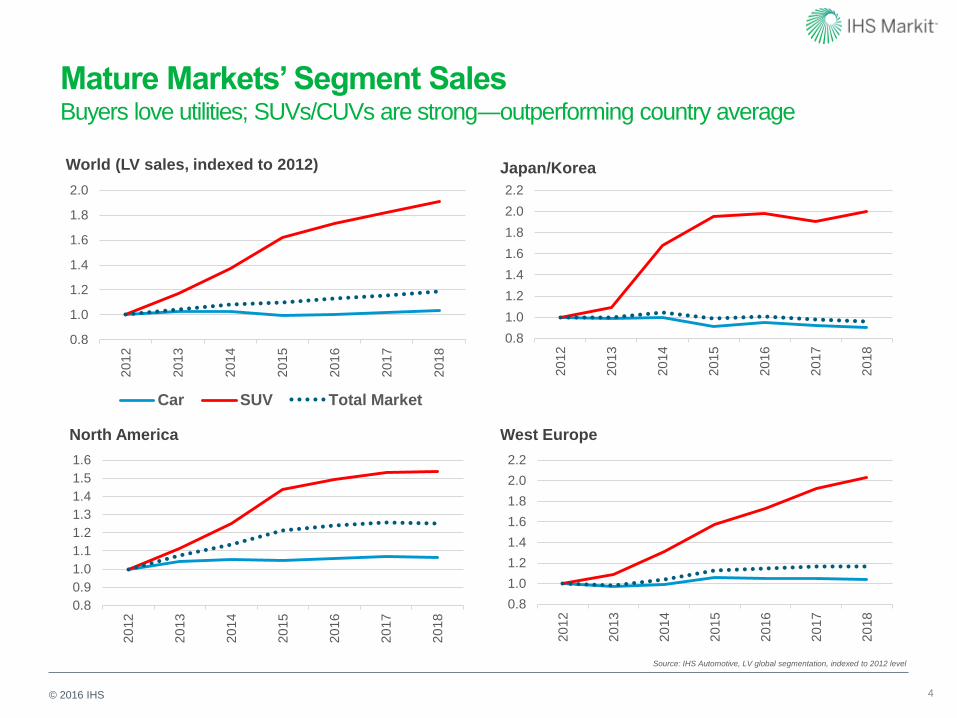
Mature Markets’ Segment SalesBuyers love utilities; SUVs/CUVs are strong―outperforming country average
4
0.8
1.0
1.2
1.4
1.6
1.8
2.0
20
12
20
13
20
14
20
15
20
16
20
17
20
18
Car SUV Total Market
West Europe
Japan/Korea
0.8
1.0
1.2
1.4
1.6
1.8
2.0
2.2
20
12
20
13
20
14
20
15
20
16
20
17
20
18
0.8
0.9
1.0
1.1
1.2
1.3
1.4
1.5
1.6
20
12
20
13
20
14
20
15
20
16
20
17
20
18
North America
World (LV sales, indexed to 2012)
Source: IHS Automotive, LV global segmentation, indexed to 2012 level

© 2016 IHS
Developing Markets’ Segment SalesUtilities are strong―even in weaker markets
5
0.4
0.5
0.6
0.7
0.8
0.9
1.0
1.1
1.2
20
12
20
13
20
14
20
15
20
16
20
17
20
18
Brazil (LV sales, indexed to 2012) China
0.4
1.0
1.6
2.2
2.8
3.4
20
12
20
13
20
14
20
15
20
16
20
17
20
18
0.0
0.4
0.8
1.2
1.6
2.0
2.4
2.8
20
12
20
13
20
14
20
15
20
16
20
17
20
18
India Russia
Source: IHS Automotive, LV global segmentation, indexed to 2012 level
0.4
0.6
0.8
1.0
1.2
1.4
1.6
20
12
20
13
20
14
20
15
20
16
20
17
20
18
Car SUV Total Market

© 2016 IHS. ALL RIGHTS RESERVED.
60
91
106
50
60
70
80
90
100
110
2007 2009 2011 2013 2015 2017 2019 2021 2023
Millio
ns 15million
6
Beyond the RecoveryGlobal Production Growth 2016 - 2023
32million
6.6
4.3
2.0
1.2
0.8
0.6
-0.5
-2 0 2 4 6 8 10
Greater China
South Asia
Europe
South America
Middle East/Africa
North America
Japan/Korea
Millions

© 2016 IHS Markit. All Rights Reserved.
0
5
10
15
20
25
30
35
2005 2007 2009 2011 2013 2015 2017 2019 2021 2023
Mill
ions
Sep 2015 FC Sep 2016 FC
Not enough weak data points to call a trend break in the strong relationship of key drivers to automotive sales:- headline GDP- average income- disposable income growth- urban population employment growth Stock market volatility is real, yet less market level.
The auto stimulus program (from October 2015) boosts short term
China Light Vehicle Sales OutlookAutomotive Conference – Shanghai | October 2016
• Termination of tax incentives
• GDP growth rate of 6.2% in 2017
• The government could usher in vehicle demand management because of rising energy security concerns
• Vehicle Purchase Tax cut from 10% to 5% for vehicles (1.6L and below) in October 2015–December 2016
• Improving GDP growth of 6.6% in 2016
• GDP growth to trough out from 2018 with an average growth of 6.4% in 2018–20
• Supported by replacement demand coming from scrappage of vehicles (Euro I and below) in 2014–17

© 2016 IHS Markit. All Rights Reserved.
8
Economy vs. Car Sales: City Tier DevelopmentTier 4–Tier 6 cities market shares increase with Tier 1 share declining
T1
13%
T1.5
13%
T2
13%
T3
24%
T4
10%
T5
15%
T6
12%
T1
6%T1.5
12%
T2
13%
T3
24%
T4
11%
T5
18%
T6
16%T1
12%
T1.5
12%
T2
12%
T3
21%
T4
11%
T5
18%
T6
14%
T1
12%
T1.5
12%
T2
12%
T3
21%
T4
11%
T5
18%
T6
14%
2010
GDP share by city tier 2010–15
2010
2015
2015
PV market share by city tier 2010–15
Automotive Conference – Shanghai | October 2016

© 2016 IHS Markit. All Rights Reserved.
354
915
435463 448
233
282
463
0
100
200
300
400
500
600
700
800
900
1,000
United
States
China Japan Germany France India Brazil Russia
9
Product Nameplates – LV Sales OEMs moving to emerging market quickly to gain customers
Number of nameplates 2006–23
© 2016 IHS MarkitSource: IHS Markit
Automotive Conference – Shanghai | October 2016

© 2016 IHS Markit. All Rights Reserved.
10
Body Type DiversitySUV sales keeps expanding over-proportionally in long term
13%
47%15%
11%
10%36%
34%
13%
9%
4%
SUV Hatchback
Sedan Wagon
MPV Coupe
Convertible Roadster
38%
44%
3%
7%4%
45%
39%
8%3%
SUV Sedan
Hatchback MPV
Coupe Wagon
Convertible Roadster
12%
65%
18%
5%
44%
39%
8%8%
SUV Sedan
Hatchback MPV
Wagon Coupe
Convertible
2010
CHINA North America EUROPE
2010 2010
2025 2025 2025
The Slowdown and the Stimulus in China / October 2016

© 2016 IHS Markit. All Rights Reserved.
11
Production - Long-term DevelopmentSlowing down gradually after 2019, a decline still not expected
Production volume development
© 2016 IHS MarkitSource: IHS Markit
0%
10%
20%
30%
40%
50%
60%
0
5
10
15
20
25
30
35
Millio
ns
PV LCV Growth rate y/y
Growth phase Mature phaseAdjustment phase
The Slowdown and the Stimulus in China / October 2016

© 2016 IHS Markit. All Rights Reserved.
4
4.5
5
5.5
6
6.5
7
7.5
8
Q1
2014
Q2
2014
Q3
2014
Q4
2014
Q1
2015
Q2
2015
Q3
2015
Q4
2015
Q1
2016
Q2
2016
Q3
2016
Q4
2016
Q1
2017
Q2
2017
Q3
2017
Q4
2017
Q1
2018
Q2
2018
Q3
2018
Q4
2018
Millions
Tax policy ends in 2016 Tax policy ends in 2017
Seasonality abnormality from 2015 to 2017
© 2016 IHS MarkitSource: IHS Markit
12
Scenarios by Stimulation of Tax-cut PolicyExpiration of Tax-Cut Policy as main impact
Growth RatePolicy ends 2016 Policy ends 2017
2014: 8.1% 2014: 8.1%2015: 4.7% 2015: 4.7%2016: 7.5% 2016: 6.5%2017: 1.0% 2017: 3.0%2018: 3.0% 2018: 1.0%
200-300K units shift from Q42016 to 2017
+1%
-3%
The Slowdown and the Stimulus in China / October 2016

© 2016 IHS Markit. All Rights Reserved.
Risk & Reward: Over Capacity
13
Capacity development
Source: IHS Markit © 2016 IHS Markit
0%
10%
20%
30%
40%
50%
60%
70%
80%
90%
0
5
10
15
20
25
30
35
40
Millions
Production Over capacity % Utilization
?4,
000,
000,0 00,0
00CNY
Investment!
The Slowdown and the Stimulus in China / October 2016

14
Greater China Output +6.6M
© 2015 IHS
G315%
US314%
A416%
Other55%
Contributionto Growth %
4.4 5.4
2.83.7
5.46.4
13.2
16.8
0.0
5.0
10.0
15.0
20.0
25.0
30.0
35.0
2012 2014 2016 2018 2020 2022
Millio
ns
Other Asian4 US3 German3

© 2016 IHS Markit. All Rights Reserved.
Modular Platforms of JV & China OEMsTotal number of platforms increase, while decrease per OEM by modular platform
The Slowdown and the Stimulus in China / October 2016
JV Brand Local BrandJV & Local Brands

© 2016 IHS Markit. All Rights Reserved.
New OEM entrances and brand expansionNew entrants from other industries drives brand expansion
Existing small OEMs
Mega Tech Companies
New OEMs
Sharing Economy
Brand number
2000 2010 2015 2025
25 62 78 94
The Slowdown and the Stimulus in China / October 2016

© 2016 IHS Markit. All Rights Reserved.
Capacity expansion in ChinaJV brands and COEM - NEV is a main driver for future capacity expansion
17
Volkswagen - Qingdao & TianjinFord – HarbinPSA – ChengduFCA – GuangzhouHyundai – Cangzhou & ChongqingHonda – WuhanRenault – WuhanKarma - HangzhouTesla – ?
BAIC - Huanghua & RuiliGeely – Baoji, Jinzhong Zhangjiakou & GuiyangGAIG - UrumqiChery – ChangshuFDG – HangzhouHanteng – ShangraoJoylong – YangzhouNEXTEV – HefeiShaolin – ZhengzhouCH-Auto - Suzhou
2M
1.3M
Harbin
Tianjin
Qingdao
Zhangjiakou
Suzhou
Changzhou
Hangzhou
Guangzhou
Quanzhou
Ruili
Guiyang
Chengdu
Chongqing Wuhan
Shangrao
Cangzhou
Huanghua
Baoji
Jinzhong
Zhengzhou
Hefei
Yangzhou
Urumqi
The Slowdown and the Stimulus in China / October 2016

© 2016 IHS Markit. All Rights Reserved.
China OEM expansion in Overseas MarketsNew plants and R&D centres, establishment reflect COEMs ambitions
SAIC: SOP2017
SAIC: SOP2017
GWM: SOP2017
SAIC: SOP2017GWM: SOP2018
Rayong, Thailand
Kaliningrad,Russia
Uzlovaya,Russia
Bekasi, Indonesia
Foton: SOP2017
Pune, India Chery: SOP2016
Manila, Philippines
Lifan: SOP2017
Lipetsk, Russia
Jianghuai: SOP2015
Kostanay, Kazakhstan
Haima: SOP2015
Khorasan, Iran Foton: SOP2015
Gateway Thailand
Changhe: SOP2018
Docharkh, Iran
Jianghuai: SOP2016
Camacari, Brazil
FAW: SOP2015
Algeria
Volvo: SOP2018
Ridgeville,USA
London,Britain
Geely
Silicon Valley,USA
BAIC
Goteborg,Sweden
Volvo
Turin,Italy
ChanganJAC
Birmingham,Britain
SAIC
Tokyo,Japan
Great Wall
Detroit,USA
BAIC
Sao Paulo,Brazil
BYD
San Jose,USA
NEXTEV
R&D
Production facility
The Slowdown and the Stimulus in China / October 2016

© 2016 IHS
Global EV Production
0.0
.1
0.6
0.4
1.8
0%
10%
20%
30%
40%
50%
60%
0.0
0.5
1.0
1.5
2.0
2.5
2012 2014 2016 2018 2020 2022
Millio
ns
NA EV ROW EV NA EV Share China EV Share
CAGR = 27.5%
2023: 1.1M
CAGR = 28.3%
2023: .6M
19 Nameplates
146 Nameplates
Proactive Positioning / September 2016
© 2016 IHS
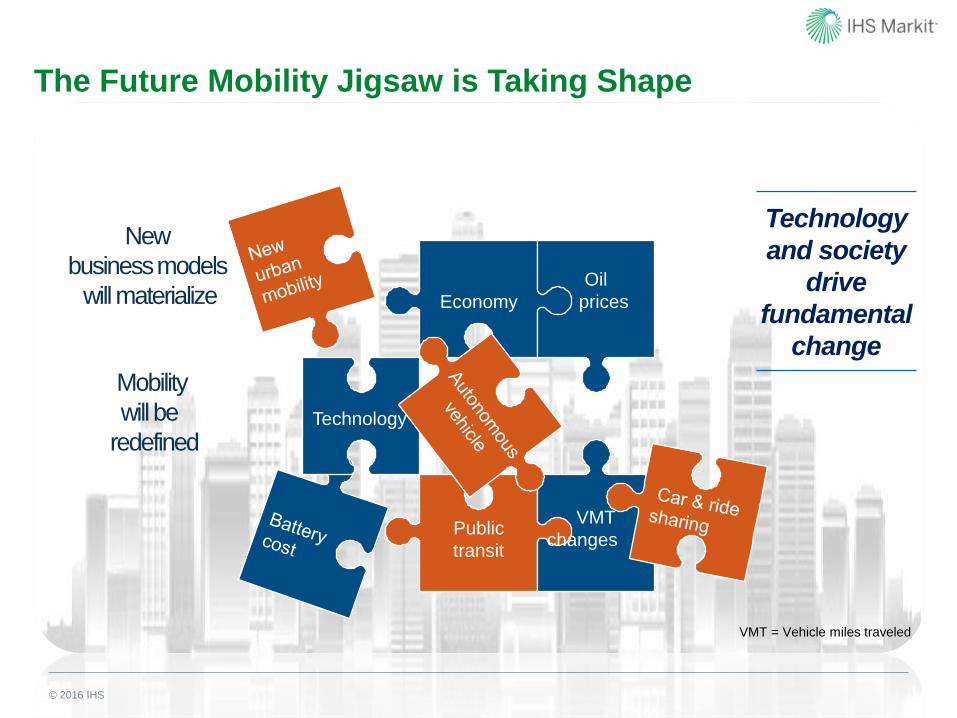
Public
transit
VMT
changes
Economy
Oil
prices
Technology
New
business models
will materialize
Mobility
will be
redefined
Technology
and society
drive
fundamental
change
VMT = Vehicle miles traveled
The Future Mobility Jigsaw is Taking Shape
Automotive Conference – Detroit | 8 September 2016

© 2016 IHS Markit. All Rights Reserved.© 2016 IHS Markit. All Rights Reserved.
Thank You!
Mike Jackson, Senior Executive
North America, Vehicle Production Forecasting
+1-248-388-8912