umtri-2005-30 (2)
DESCRIPTION
seatTRANSCRIPT

7/21/2019 UMTRI-2005-30 (2)
http://slidepdf.com/reader/full/umtri-2005-30-2 1/54
UMTRI-2005-30
DEVELOPMENT OF A NEWEYELLIPSE AND SEATING
ACCOMMODATION MODEL FORTRUCKS AND BUSES
Matthew P. Reed
University of Michigan
Transportation Research Institute
November 2005

7/21/2019 UMTRI-2005-30 (2)
http://slidepdf.com/reader/full/umtri-2005-30-2 2/54
7/21/2019 UMTRI-2005-30 (2)
http://slidepdf.com/reader/full/umtri-2005-30-2 3/54
DEVELOPMENT OF A NEW EYELLIPSE AND SEATING ACCOMMODATION
MODEL FOR TRUCKS AND BUSES
Matthew P. Reed
The University of Michigan
Transportation Research Institute
Ann Arbor, Michigan 48109-2150
U.S.A.
Report No. UMTRI-2005-30
November 2005

7/21/2019 UMTRI-2005-30 (2)
http://slidepdf.com/reader/full/umtri-2005-30-2 4/54

7/21/2019 UMTRI-2005-30 (2)
http://slidepdf.com/reader/full/umtri-2005-30-2 5/54
i
Technical Report Documentation Page1. Report No.
UMTRI-2005-30
2. Government Accession No. 3. Recipient!s Catalog No.
5. Report Date
November 2005
4. Title and Subtitle
Development of a New Eyellipse and Seating Accommodation Model for
Trucks and Buses 6. Performing Organization Code
3027537. Author(s)
Reed, M.P.
8. Performing Organization Report No.
UMTRI-2005-3010. Work Unit no. (TRAIS)9. Performing Organization Name and Address
The University of Michigan
Transportation Research Institute
2901 Baxter Road
Ann Arbor, Michigan 48109-2150 U.S.A.
11. Contract or Grant No.
13. Type of Report and Period
Covered12. Sponsoring Agency Name and Address
International Truck and Engine Corporation
14. Sponsoring Agency Code
15. Supplementary Notes
16. Abstract
Driver posture data from a laboratory study and an in-vehicle test-track study were used to develop and to
evaluate a new seating accommodation model and eyellipse for SAE Class-B vehicles. The new statistical
models are configurable for population anthropometry; include the effects of steering wheel position;
incorporate a new method based on driver preference for using the adjustment range of highly adjustable
steering wheels as input to the models; and are customizable to any desired accommodation level. The new
seating accommodation model predicts ranges of fore-aft seat-position that are similar to those in SAE
J1517, but includes simultaneous prediction of vertical seat adjustment range. The new eyellipse is almost
twice as tall as the current J941 Class-B eyellipse, due to the incorporation of vertical seat adjustment. The
new eyellipse is narrower in plan view and aligned with the vehicle grid, unlike the J941 eyellipse.
Predictions from the new model compared well with driver seat positions and eye locations measured in six
test vehicles, although extensive seat-position censoring in four of the test vehicles limited the comparison.The new models are more accurate and much more flexible for application to modern trucks and buses with
vertically adjustable seats and tilt/telescope steering columns.
17. Key Words
Trucks, Buses, Driving, Posture, Accommodation, Vision, Eyellipse, Seating
Accommodation Model
18. Distribution Statement
Unlimited
19. Security Classification (of this report)
None 20. Security Classification (of this page)
None 21. No. of Pages
44
22. Price

7/21/2019 UMTRI-2005-30 (2)
http://slidepdf.com/reader/full/umtri-2005-30-2 6/54
ii

7/21/2019 UMTRI-2005-30 (2)
http://slidepdf.com/reader/full/umtri-2005-30-2 7/54
iii
ACKNOWLEDGMENTS
Financial support for the data collection efforts was provided in part by the Great
Lakes Center for Truck and Transit Research, International Truck and Engine
Corporation, and Transom Technologies. At UMTRI, Michelle Way and Brian Eby were
important contributors to the work. The current data analysis and modeling effort was
sponsored in part by International Truck and Engine Corporation. Carol A. C. Flannagan
of UMTRI Biosciences collaborated on the development of the statistical methodology
used in this report.

7/21/2019 UMTRI-2005-30 (2)
http://slidepdf.com/reader/full/umtri-2005-30-2 8/54
iv

7/21/2019 UMTRI-2005-30 (2)
http://slidepdf.com/reader/full/umtri-2005-30-2 9/54
v
CONTENTS
ACKNOWLEDGMENTS ................................................................................................. iii
1.0 INTRODUCTION ...................................................................................................1
1.2 Occupant Packaging.................................................................................................1
1.2 Template Approaches ..............................................................................................1
1.3 Accommodation Models..........................................................................................2
2.0 METHODS ..............................................................................................................5
2.1 Background..............................................................................................................5
2.2 Data Sources ............................................................................................................6
2.3 Statistical Modeling Approach ..............................................................................10
3.0 RESULTS ..............................................................................................................15
3.1 Linear Regression Models .....................................................................................16
3.2 Seat Position Model ...............................................................................................18
3.3 Eyellipse.................................................................................................................22
3.4 Adjustable Steering Wheels and Preferred Steering Wheel Position ....................29
3.5 Comparison to In-Vehicle Data .............................................................................30
3.6 Simplified Application Procedures ........................................................................33
4.0 DISCUSSION........................................................................................................37
4.1 Accomplishments...................................................................................................37
4.2 Limitations .............................................................................................................37
4.3 Applications ...........................................................................................................40
4.4 Research Needs......................................................................................................41
5.0 REFERENCES ......................................................................................................43

7/21/2019 UMTRI-2005-30 (2)
http://slidepdf.com/reader/full/umtri-2005-30-2 10/54

7/21/2019 UMTRI-2005-30 (2)
http://slidepdf.com/reader/full/umtri-2005-30-2 11/54
1
1.0 INTRODUCTION
1.1 Occupant Packaging
Occupant packaging refers to the process of laying out a vehicle interior to provide goodaccommodation, comfort, and safety for the driver and passengers. The primary design
variables in packaging the driver’s workstation are the locations and sizes of the
adjustment ranges for the steering wheel and seat with respect to the accelerator pedal.
The positions of these adjustment ranges are selected to provide good exterior vision,
clearance to interior components, and comfort for the drivers. The choice of compatible
ranges of steering wheel and seat adjustment is critical, because restricting drivers’ ability
to posture themselves as they would prefer can lead to discomfort and may decrease
safety. Increasing the size of adjustment ranges entails additional cost, so providing
small, accurately located adjustment ranges is preferred to providing large adjustment
ranges.
The history of driver packaging in the U.S. over the past 50 years spans three major
innovations in design tools. The template-based approaches developed in the 1950s were
superseded over the following decades by population accommodation models. During
the 1990s, digital human modeling was developed as a complement to percentile
accommodation models, and even replaced the earlier percentile accommodation models
in some companies.
1.2 Template Approaches
The application of engineering anthropometry to vehicle layout began in the 1950s,
including pioneering work by Wilfred Dempster (Dempster 1955). Two-dimensional
templates that were scaled to accurately represent percentiles of human body dimensions
were laid on paper package drawings to represent the spatial requirements of large men.
This approach was codified in SAE Recommended Practices1 in 1962 with the adoption
of SAE J826, which defined a weighted, three-dimensional manikin for measuring seats
and legroom (the SAE H-point machine) and a two-dimensional template with a similar
profile and leg segment lengths. The SAE J826 H-point machine remains the standard
tool for defining seat H-point (a reference point approximating human hip location) and
1 The SAE practices, identified by J xxxx numbers, can be found in the SAE Handbook,
which is published in hardcopy and electronically every year (SAE 2005).

7/21/2019 UMTRI-2005-30 (2)
http://slidepdf.com/reader/full/umtri-2005-30-2 12/54
2
for measuring seat back angle. Recently, a new H-point machine (HPM-II) was adopted
in SAE J4002 and is being applied in some companies, particularly for seat design.
Although the original H-point machine was originally conceived as a “comfort
dimensioning tool” to ensure adequate legroom in vehicles, better methods have been
developed for determining the appropriate range of seat positions to accommodate a
population of drivers.
1.3 Population Accommodation Models
The second major innovation in driver packaging was the eyellipse (the word is a
contraction of eye and ellipse). In the early 1960s, General Motors, Ford, and Chrysler
collaborated on a large-scale study of driver eye locations. The researchers performing
the study were motivated by the observation that template-based approaches, with eye
location estimates scaled solely by body dimensions, did not adequately account for theobserved variability in eye locations. The eye locations of over 2300 men and women
were recorded by stereophotogrammetry as they sat in three convertibles (Meldrum
1965). The researchers noted that the resulting distribution of eye locations was
approximately normal (Gaussian) in three dimensions. They represented this distribution
for vehicle design purposes by a single ellipse in side view and two ellipses (representing
the distributions of the left and right eyes) in plan view. To take into account vehicle
dimensions, the eyellipse was located within vehicle package space by reference to the
height of the seat above the floor and the available seat track length. Subsequent studies
added the effect of fixed seat back angle to the locator equation.
During the early 1970s, SAE and its member companies conducted a large-scale research
study of driver reach. Again, experience in the auto companies had shown that template-
based approaches did not accurately predict the percentage of drivers who could reach a
particular location within the vehicle. In the SAE Controls Reach Study (Hammond and
Roe, 1972) a sample of drivers demonstrated their maximum reach capability in two
different belt restraint conditions. The data were used to create a statistical model
predicting selected percentiles of driver reach capability at a mesh of locations in front ofthe driver. This model, now in SAE J287, combines the effects of driver population,
package variables, and individual reach capability.
During the 1980s, another SAE-sponsored study of truck driver posture led to the
development of population accommodation models for heavy trucks (Phillipart et al.
1985, Stanick et al. 1987). Applying the same conceptual methodology used for the
7/21/2019 UMTRI-2005-30 (2)
http://slidepdf.com/reader/full/umtri-2005-30-2 13/54
3
development of the passenger car eyellipse and reach models, SAE committees
developed an eyellipse (J941), accommodation tool locating procedures (J1516), seating
accommodation curves (J1517), and head and hair contours (J1052) for application to
SAE Class-B vehicles (i.e., vehicles with design seat height, SAE H30, greater than
405 mm). In addition, the committees developed two practices exclusively for
application to truck packages: driver shin/knee contours (SAE J1521), and truck-driver
belly contours (J5122).
The SAE study that produced the data used to generate these models was large-scale,
well-conducted study. Sanders and Shaw (1985) used stereophotogrammetry to measure
the postures of 183 male and 58 female truck drivers as they sat in a reconfigurable cab
mockup. Test conditions included a wide range of steering wheel positions and seat
heights. Data were gathered with both fixed and vertically adjustable seats.
Unfortunately, the data were not analyzed and presented in a way that would be useful for
current vehicles. In particular, only the data for fixed-height seats were used to create the
models, the models are not configurable for changes in driver anthropometry, and the
important effects of steering wheel position with respect to the pedals were neglected.
During the late 1990s, UMTRI made an unsuccessful effort to recover the data from this
study for reanalysis, including contacting people at SAE, at the companies involved, and
researchers involved in the study. The data have apparently been lost.
Since about 1990, digital human figure models such as Jack and RAMSIS (Seidl 1997)
have been increasingly used for packaging and ergonomic analysis during vehicle interior
design. The trend has been particularly important in truck and bus development, because
the widespread use of height-adjustable seats in these vehicles and anthropometric trends
in driver populations have made the SAE tools largely inapplicable. Figure model
analyses are valuable for many aspects of vehicle interior design, but population models
are needed for making accurate quantitative assessments of accommodation and vision
(Reed and Flannagan 2000).
For the past decade, UMTRI researchers have been developing updated versions of theSAE vehicle packaging tools for passenger cars and light trucks (SAE Class-A vehicles).
Using driver-posture data from extensive studies in vehicles and in laboratory mockups,
the research has led to a new H-point machine (J4002), a new seating accommodation
model (J4004), a new eyellipse (J941) and a new head-position contour (J1052)
(Flannagan et al. 1998, Manary et al. 1998, Reed et al. 1999a). In related work, new
statistical models to predict driving posture were developed (Reed et al. 2002).
7/21/2019 UMTRI-2005-30 (2)
http://slidepdf.com/reader/full/umtri-2005-30-2 14/54
4
Beginning in the late 1990s, the measurement and analysis methods used to develop these
new tools for passenger cars were applied to trucks and buses. A laboratory study of 63
drivers in a truck cab mockup was conducted along with an in-vehicle study of 24 truck
drivers in six trucks. The data were analyzed to develop posture prediction models that
are used with the Jack human figure modeling software.
This report presents the development of new seat-position and eyellipse models based on
the data from these two studies. The new models are intended for use in modern trucks
and buses with highly adjustable seats and steering wheels. Using methods similar to
those used to develop the recent revision of the J941 Class-A eyellipse, the new models
respond to the vehicle features that most influence driver posture and position and allow
the user to define the driver population with respect to body dimensions and gender mix.
7/21/2019 UMTRI-2005-30 (2)
http://slidepdf.com/reader/full/umtri-2005-30-2 15/54
5
2.0 METHODS
2.1 Background on Seating Accommodation and Eyellipse Models
The objective of a seating accommodation model, such as the Class-B model in J1517, is
to predict the distribution of driver-selected seat positions represented by translated H-
point location. The H-point location with respect to the seat is defined with the seat in the
“design” position, such that the H-point is coincident with the seating reference point
(SgRP). The seat position selected by the driver is quantified by applying the fore-aft and
vertical translation of the seat from the design position.
The appropriate selection of the size and location of the H-point travel path is a critical
part of driver packaging. As the analyses in this report show, trucks are often designed
with inappropriate adjustment ranges that result in a large percentage of drivers being
unable to place the seat in their preferred positions. These findings highlight the need
for a new seating accommodation model, since these vehicles were likely designed using
either 1987 J1517 model or digital human figure models. Unlike previous seating
accommodation models, the model presented in this report is designed for seats with both
fore-aft and vertical adjustment, which covers the majority of trucks and buses now built
in the U.S.
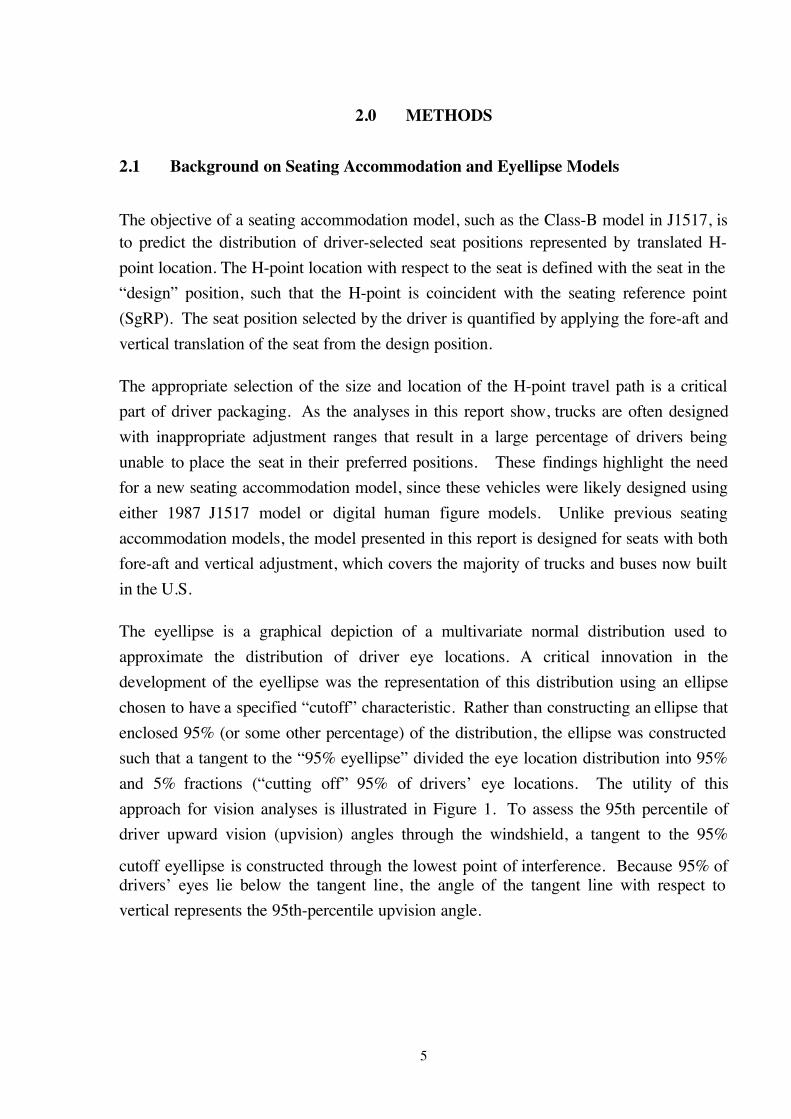
The eyellipse is a graphical depiction of a multivariate normal distribution used to
approximate the distribution of driver eye locations. A critical innovation in the
development of the eyellipse was the representation of this distribution using an ellipse
chosen to have a specified “cutoff” characteristic. Rather than constructing an ellipse that
enclosed 95% (or some other percentage) of the distribution, the ellipse was constructed
such that a tangent to the “95% eyellipse” divided the eye location distribution into 95%
and 5% fractions (“cutting off” 95% of drivers’ eye locations. The utility of this
approach for vision analyses is illustrated in Figure 1. To assess the 95th percentile of
driver upward vision (upvision) angles through the windshield, a tangent to the 95%
cutoff eyellipse is constructed through the lowest point of interference. Because 95% ofdrivers’ eyes lie below the tangent line, the angle of the tangent line with respect to
vertical represents the 95th-percentile upvision angle.

7/21/2019 UMTRI-2005-30 (2)
http://slidepdf.com/reader/full/umtri-2005-30-2 16/54
6
Figure 1. Illustration of side-view eyellipse with 95% cutoff characteristic.
2.2 Data Sources
The data used in this report were gathered in two studies of driving postures. Data from a
study of 63 drivers in a laboratory mockup were used to develop the models. The models
were tuned and validated by comparison to data from 24 drivers in six trucks driven on a
test track.
Laboratory Study
In the first study, the postures of 49 men and 14 women were measured in a laboratory
mockup in 27 different test conditions. Among the men, 32 were experienced truck
drivers, 4 were bus drivers, and 13 had no truck- or bus-driving experience. Among the
women, 3 were experienced truck drivers, 3 were bus drivers, and 8 had no truck- or bus-
driving experience. Overall, 42 of the 63 participants had experience driving a truck or
bus. Driver stature ranged from 1478 to 1919 mm, with a mean of 1724 mm. Body
weight ranged from 105 to 274 lb. Mean body mass index was 28 kg/m2, with a range
from 17 to 38 kg/m2.
The test conditions included manipulations of seat height, steering wheel height, steering
wheel diameter, fore-aft steering wheel position, and clutch stroke. Previous analyses of
these data for purposes of developing posture-prediction models showed that the effects
of steering wheel diameter and clutch stroke could be neglected. For the development of
the new models, data from the test conditions listed in Table 1 were analyzed. The nine
7/21/2019 UMTRI-2005-30 (2)
http://slidepdf.com/reader/full/umtri-2005-30-2 17/54
7
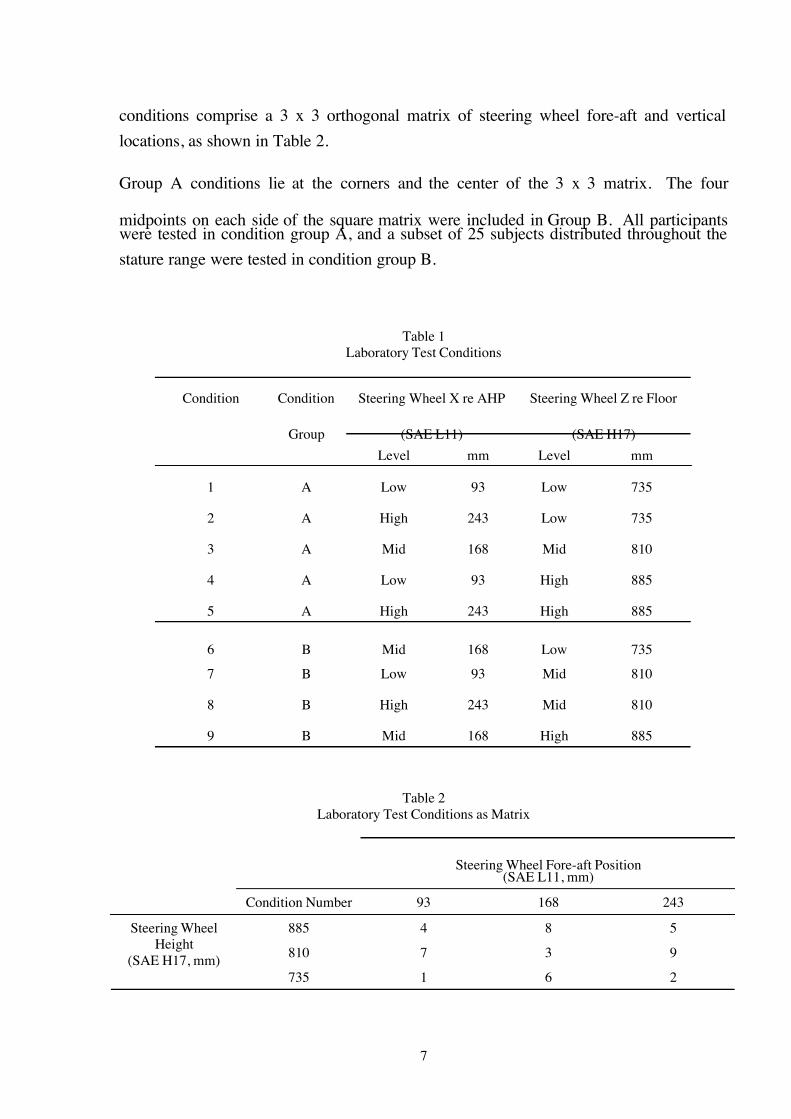
conditions comprise a 3 x 3 orthogonal matrix of steering wheel fore-aft and vertical
locations, as shown in Table 2.
Group A conditions lie at the corners and the center of the 3 x 3 matrix. The four
midpoints on each side of the square matrix were included in Group B. All participantswere tested in condition group A, and a subset of 25 subjects distributed throughout the
stature range were tested in condition group B.
Table 1
Laboratory Test Conditions
Steering Wheel X re AHP
(SAE L11)
Steering Wheel Z re Floor
(SAE H17)
Condition Condition
Group
Level mm Level mm
1 A Low 93 Low 735
2 A High 243 Low 735
3 A Mid 168 Mid 810
4 A Low 93 High 885
5 A High 243 High 885
6 B Mid 168 Low 735
7 B Low 93 Mid 810
8 B High 243 Mid 810
9 B Mid 168 High 885
Table 2
Laboratory Test Conditions as Matrix
Steering Wheel Fore-aft Position(SAE L11, mm)
Condition Number 93 168 243
885 4 8 5
810 7 3 9
Steering Wheel
Height
(SAE H17, mm)
735 1 6 2

7/21/2019 UMTRI-2005-30 (2)
http://slidepdf.com/reader/full/umtri-2005-30-2 18/54
8
For each trial, the steering wheel was set to the specified location with respect to the
accelerator heel point, the steering wheel was set to a neutral angle, the seat was set to a
midrange position, and the seat back angle was set to a neutral angle. The participantentered the mockup and adjusted the seat fore-aft position, seat height, seat back angle,
and steering wheel angle to achieve a comfortable driving posture. The posture was then
digitized, using procedures developed at UMTRI for measuring driver posture (Reed et
al. 1999a, Reed et al. 20000). The locations of landmarks on the seat were used to
calculate the translated seat H-point location, referencing H-point calibration data
obtained with the SAE J826-1995 manikin. Cyclopean eye location was estimated using
the vertical location of the corner of the eye, the fore-aft location of the infraorbitale
landmark, and the lateral location of the glabella landmark. The translated H-point (“seat
position”) and eye location data were referenced to the accelerator heel point (AHP) in all
conditions.
In-Vehicle Study
An in-vehicle driver-posture study was conducted at a truck manufacturer’s research
facility. Details of the methods are reported in Jahns et al. (2001). The ranges of seat
and steering wheel adjustment were measured in each vehicle using a FARO Arm
digitizer. The H-point location with respect to seat landmarks was quantified using the
SAE J826-1995 H-point machine. Testing was conducted in the six vehicles listed in
Table 3. Class-8 tractors from four manufacturers with wide ranges of seat and steering
wheel adjustment were tested. An International 4700 Class-6 straight truck and a Class-5
DAF 45 were included. The International 4700 was tested without steering wheel
adjustment, and the DAF-45 was tested without seat height or steering wheel adjustment.
Table 4 lists package data for the six trucks.
Testing was conducted with 17 men and 7 women (24 total), all holders of commercial
driver licenses. Fourteen of the participants were current or former professional drivers,
seven were students in training to become truck drivers, and three were engineers who
had undergone basic driver training. Drivers with a wide range of stature and weight
were chosen. Stature ranged from 1546 mm to 1924 mm, with an average of 1758 mm.
Body weight ranged from 120 to 358 lb. Body mass index ranged from 21 to 50 kg/m2,
and half of the participants were obese (BMI ! 30 kg/m2).

7/21/2019 UMTRI-2005-30 (2)
http://slidepdf.com/reader/full/umtri-2005-30-2 19/54
9
Table 3
Test Vehicles and Adjustable Components
Seat Steering Wheel
Truck Model Fore-aft Height Recline Cushion
Angle
Cushion
Length
Tilt Telescope
Peterbilt 379
(Class 8)
x x x x x x x
International
Eagle
(Class 8)
x x x x x x x
Freightliner
Century
(Class 8)
x x x x x x x
Volvo VN
(Class 8)
x x x x x x x
International4700 (Class 6)
x x x
DAF 45
(Class 5)
x x
Table 4
Package Data for Test Vehicles*
Truck Model Steering Wheel Fore-aft
Position re AHP
(SAE L11, mm)
Steering Wheel Vertical
Position re AHP
(SAE H17, mm)
Peterbilt 379 (Class 8) 220 857
International Eagle (Class 8) 165 843
Freightliner Century (Class 8) 172 799
Volvo VN (Class 8) 195 807
International 4700 (Class 6) 260 799
DAF 45 (Class 5) 201 765
* Steering wheel position defined at the side-view geometric center of tilt/telescope travel path of the
steering wheel center point. DAF 45 and International 4700 were tested with fixed steering wheel positions
(see Figure 8).
The participants drove the six trucks in random order around a test track using both a
high-speed oval and a durability road course. After instruction regarding the seat and
steering wheel adjustments, the driver was given 5 to 10 minutes to become familiar with
all of the controls. The driver set all of the components to preferred positions and drove

7/21/2019 UMTRI-2005-30 (2)
http://slidepdf.com/reader/full/umtri-2005-30-2 20/54
10
the vehicle out onto the test track. The total amount of time driving a single vehicle was
usually less than 15 minutes, with two laps of the high-speed track and two laps of the
durability track being typical. If the driver needed more time to make seat and wheel
adjustments, additional laps of the track were taken.
The high-speed track consists of a 1.6-mile oval with two 15-ft lanes and 800-ft-radius
curves. The curves are banked at 12% and 29% for equivalent “hands off the wheel”
straight line driving at 35 and 60 mph respectively. On this portion of the track drivers
remained on the inside lane at 35 mph. The durability track consists of a 1.5-mile loop
inside the high-speed oval. The lane used for this test contained no durability events (i.e.
chuck-holes, chevrons, broken concrete, etc.). The lane is about 12 feet wide and there
are a series of gentle right and left corners on the course, as well as full 90-degree corners
to get onto, and off of the track. The durability track was traveled at a speed of 25 to 30
mph. Using both tracks allowed the drivers several opportunities to brake and shift, as
well as manipulate the steering wheel in a manner representative of normal street driving.
At the end of the drive, the participant drove the vehicle into a shop facility bay, where
the FARO Arm was used to digitize various body, seat, and vehicle landmarks to define
the driving posture and position. Seat position and eye location were calculated from the
landmark data in the same manner as with the laboratory data.
2.3 Statistical Modeling Approach
The data analysis and model development in this report is based on linear regression
analysis and exploits some of the statistical characteristics of linear regression. In
general, a dimension of interest, such as fore-aft eye location, is expressed as a linear
function of potential predictors, such as steering wheel position and driver stature. The
models have the form
y = c0 + c1 x1 + c2 x2 + ... + e(0, s2) [1]
where y is the dependent measure to be predicted, the ci are constant coefficients obtained
by fitting to the data, the xi are the predictors (vehicle and driver body dimensions). The
final “error” term e(0, s2) is a random, normally distributed variable with zero mean and
variance s2, where s is the root mean square error (RMSE) of the regression. In
7/21/2019 UMTRI-2005-30 (2)
http://slidepdf.com/reader/full/umtri-2005-30-2 21/54
11
computational terms, the RMSE is the standard deviation of the data vector that is
obtained by subtracting the regression prediction from each data observation. This
residual variance is a crucial part of the modeling in this report.
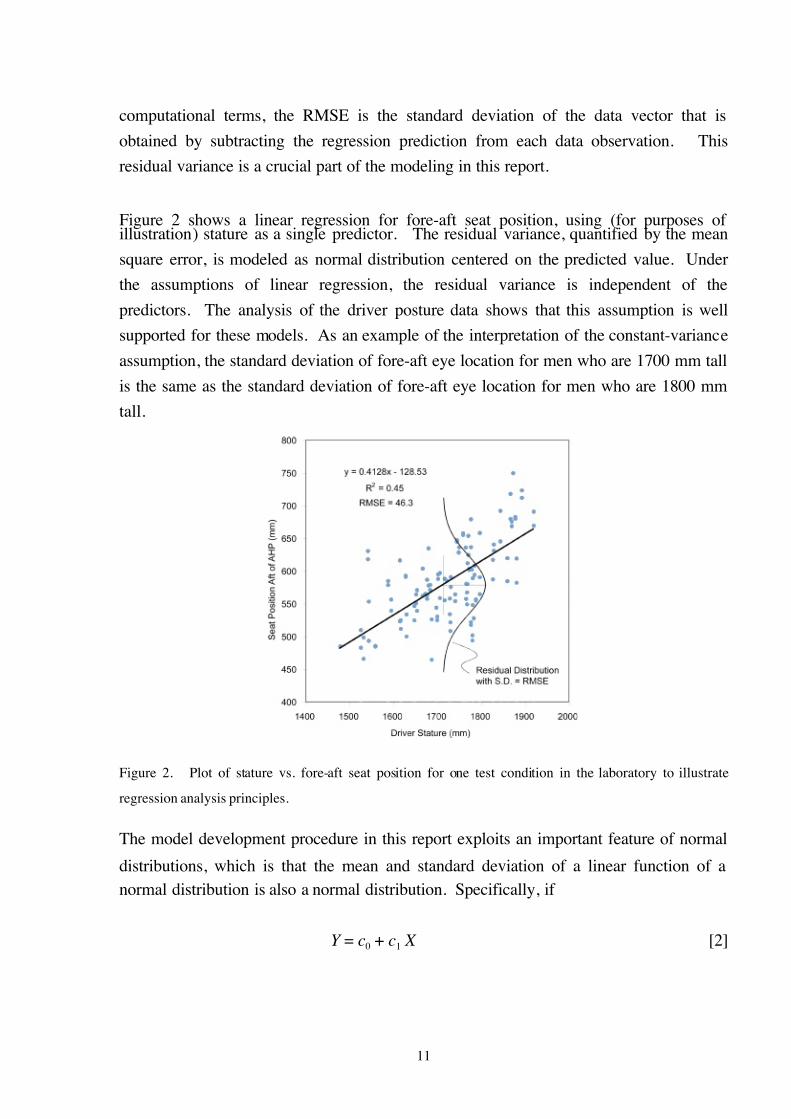
Figure 2 shows a linear regression for fore-aft seat position, using (for purposes ofillustration) stature as a single predictor. The residual variance, quantified by the mean
square error, is modeled as normal distribution centered on the predicted value. Under
the assumptions of linear regression, the residual variance is independent of the
predictors. The analysis of the driver posture data shows that this assumption is well
supported for these models. As an example of the interpretation of the constant-variance
assumption, the standard deviation of fore-aft eye location for men who are 1700 mm tall
is the same as the standard deviation of fore-aft eye location for men who are 1800 mm
tall.
Figure 2. Plot of stature vs. fore-aft seat position for one test condition in the laboratory to illustrate
regression analysis principles.
The model development procedure in this report exploits an important feature of normal
distributions, which is that the mean and standard deviation of a linear function of a
normal distribution is also a normal distribution. Specifically, if
Y = c0 + c1 X [2]

7/21/2019 UMTRI-2005-30 (2)
http://slidepdf.com/reader/full/umtri-2005-30-2 22/54
12
where c0 and c1 are constants and X is a normal distribution with mean X Mean and standard
deviation sX, then Y is also a normal distribution, with mean
Y Mean = c0 + c1 X Mean [3]
and variance (standard deviation squared) of
sY2 = (c1 sX)2 [4]
The sum of two normal distributions is also a normal distribution, with variance equal to
the sum of the variances. So, the residual variance from a regression can be included in
estimating the distribution of the dependent measures. For example, consider
HPtX = c0 + c1 Stature + e(0, s2) [5]
where HPtX is fore-aft seat position, c0 and c1 are constant coefficients from the
regression analysis, and s is the root mean square error from the regression. If stature is
modeled as a normally distributed random variable, this becomes the sum of two
normally distributed random variables. Hence, for this example, HPtX is modeled as a
normal distribution with mean
HPtX Mean = c0 + c1 StatureMean [6]
and variance
sStature2 = (c1 sStature)
2 [7]
This formulation is particularly valuable for modeling driver posture because the relevant
human descriptors, such as stature and body mass index, are normally distributed within
gender or can be transformed to be. If the predictors are correlated, then the calculation
of the variance of the independent is slightly different. For the equation
7/21/2019 UMTRI-2005-30 (2)
http://slidepdf.com/reader/full/umtri-2005-30-2 23/54
13
Y = c1 X 1 + c2 X 2 [8]
where X 1 and X 2 are normally distributed random variables with variances s12 and s2
2 and
correlation r1,2, the variance of Y is given by
sY2 = (c1 s1)
2 + (c2 s2)2 + 2 r1,2 s1 s2 [9]
For a difference between two normal random variables
Y = c1 X 1 - c2 X 2 [10]
the covariance (r1,2 s1 s2) is subtracted:
sY2 = (c1 s1)
2 + (c2 s2)2 - 2 r1,2 s1 s2 [11]
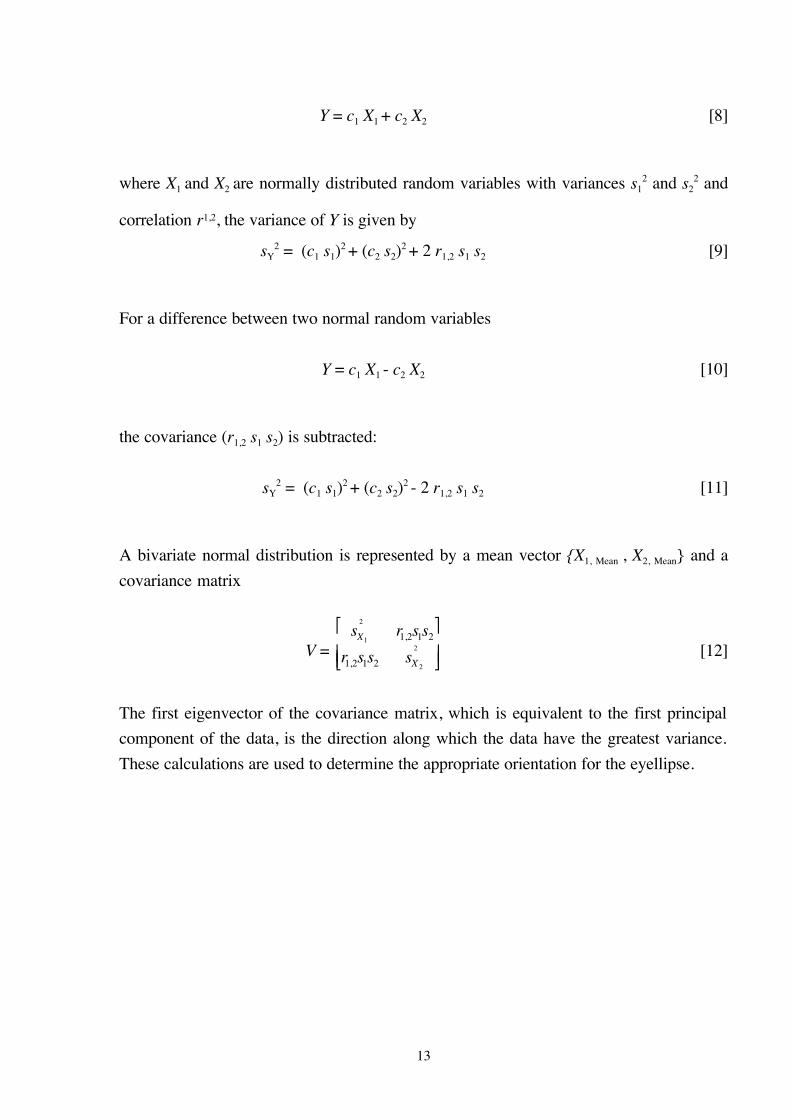
A bivariate normal distribution is represented by a mean vector {X 1, Mean , X 2, Mean} and a
covariance matrix
V =
s X 1
2
r1,2s1s2
r1,2s1s2
s X 2
2
"
# $ $
%
& ' ' [12]
The first eigenvector of the covariance matrix, which is equivalent to the first principal
component of the data, is the direction along which the data have the greatest variance.
These calculations are used to determine the appropriate orientation for the eyellipse.

7/21/2019 UMTRI-2005-30 (2)
http://slidepdf.com/reader/full/umtri-2005-30-2 24/54
14
7/21/2019 UMTRI-2005-30 (2)
http://slidepdf.com/reader/full/umtri-2005-30-2 25/54
15
3.0 RESULTS
3.1 Linear Regression Models
Table 5 lists the primary dependent measures of interest. Seat position, quantified as the
H-point location translated with the seat, was expressed with respect to accelerator heel
point (AHP). Driver eye location was expressed relative to seat H-point, rather than
AHP. This allows factors that affect seat position to be reflected in the location of the
eyellipse and ensures that the predictions from the two models will be consistent.
Table 6 lists the results of linear regressions predicting the dependent measures from
steering wheel position and driver descriptors. The analyses leading to the development
of these regression models showed:
• no significant nonlinearities in the effects of steering wheel position or body
dimensions;
• approximately normally distributed residual variance;
• consistent residual variance across levels of the predictors (homoscedasticity);
• no important interactions among predictors;
• no significant differences between men and women after accounting for body
dimensions; and
• no significant differences between people with and without professional drivingexperience, after accounting for body dimensions.
The regression models were developed by an iterative process using stepwise regression
as a means of discovering the most important predictors. Candidate predictors for each
variable were fore-aft and vertical steering wheel position (SAE L11 and H17) and five
driver descriptors: stature, erect sitting height, the ratio of sitting height to stature, stature
minus sitting height (a measure of leg length), and the natural log of BMI. The log
transform of BMI was used to obtain a measure that was approximately normally
distributed. Because of correlations among the driver descriptors, particularly those
related to stature and sitting height, a variety of alternative models with similar levels of
fit to the data could be obtained. The goal was to achieve a parsimonious model for each
dependent measure that used the minimum number of predictors required to achieve an
R2adj value within 0.02 of the maximum value achievable. Consideration was also given
to the needs of users to configure the models for different driver populations. In

7/21/2019 UMTRI-2005-30 (2)
http://slidepdf.com/reader/full/umtri-2005-30-2 26/54
16
particular, measures of both stature and torso length were desired whenever there was
evidence of independent effects of these body dimensions.
The regressions results in Table 6 show that fore-aft H-point and eye locations are
affected by the fore-aft steering wheel position. The driver’s effective leg length (stature
minus sitting height) and body mass index also affect the fore-aft seat position. Increases
in body mass index result in further-rearward seat positions. Previous analyses of these
data for posture prediction have shown that the fore-aft hip locations with respect to AHP
are similar for individuals with high BMI, but the fore-aft offset between the driver’s hips
and the seat H-point is larger. Driver-selected seat height is predicted solely by the
vertical position of the steering wheel. Several anthropometric measures had significant
effects on H-point height, but the net increase in R2adj was less than 0.02 when adding
body dimensions to the equation.
The fore-aft eye location with respect to the seat H-point was significantly related to fore-
aft steering wheel position, with larger values of L11 producing slightly more rearward
eye locations (more-reclined postures, effectively). Drivers with a larger ratio of sitting
height to stature also sat more reclined. The BMI effect approximately offsets the effect
of BMI on moving the seat rearward relative to the sitter’s hips. These effects are
important to include when driver populations include a substantial portion of obese
individuals.
The fore-aft eye location with respect to H-point is shifted forward by 28 mm to account
for a difference in driver torso recline between the laboratory and in-vehicle studies. On
average, drivers in the vehicles sat 2.5 degrees more upright (as measured on the side-
view hip-to-eye vector) than in the laboratory, after accounting for body dimensions and
vehicle geometry effects. Applying the 2.5-degree correction to the average eye height in
the laboratory study yielded a 28-mm forward adjustment.

7/21/2019 UMTRI-2005-30 (2)
http://slidepdf.com/reader/full/umtri-2005-30-2 27/54
17
Table 5
Definition of Dependent Measures and Predictors
Variable Intercept
HPtXAHP Fore-aft location of translated seat H-point aft of Accelerator Heel Point
HPtZAHP Vertical location of translated seat H-point above Accelerator Heel Point
EyeXHPt Fore-aft location of cyclopean eye* with respect to translated seat H-point
EyeZHPt Vertical location of cyclopean eye with respect to translated seat H-point
L11 Fore-aft location of center of steering wheel with respect to AHP (see J1100)
H17 Vertical location of center of steering wheel with respect to AHP (see J1100)
S Stature (erect standing height without shoes)
SH Erect sitting height
SH/S Ratio of erect sitting height to stature
SSH Stature minus erect sitting height
Log(BMI) Natural log (log to the base e) of body mass index (BMI). BMI is defined as body
mass in kg divided by stature in meters squared.
* Cyclopean eye was estimated at the vertical location of the corner-eye landmark, fore-aft location of
infraorbitale, and lateral location of glabella.
Table 6
Results of Regression Analysis†
Dependent
Measure
Intercept L11 H17 SH SH/S SSH Log(BMI) R2adj RMSE
HPtXAHP -53.6 0.6081 -0.3343 0.6394 89.07 0.73 37.7
HPtZAHP -200.3 0.8545 0.85 22.9
EyeXHPt* -334.0 0.0809 1142 -87.98 0.30 41.0
EyeZHPt -47.3 0.7812 0.71 22.3
† Form a linear equation by multiplying the tabulated coefficients by the input variables (mm and
ln(kg/m2)) and adding the intercept. Dependent measures are in mm. Independent variables are defined in
Table 5.
* Includes a -28 mm torso recline adjustment (see text).
Rewriting the values from table 6 as equations,
HPtXAHP = -53.6 + 0.6081 L11 - 0.3343 H17 + 0.6394 SSH + 89.07 Log(BMI) [13]
HPtZAHP = -200.3 + 0.8545 H17 [14]
EyeXHPt = -334.0 + 0.0809 L11 + 1142 SH/S - 87.98 Log(BMI) [15]
EyeZHPt = -47.3 + 0.7812 SH [16]

7/21/2019 UMTRI-2005-30 (2)
http://slidepdf.com/reader/full/umtri-2005-30-2 28/54
18
3.2 Seat Position Model
Development of the Model
The objective of the seat position model is to predict the distribution of driver-selected
seat positions (translated H-point locations) in the absence of restriction due to
insufficient seat track adjustment range. The target application for this model is the
design of seat tracks that accommodate a large percentage of drivers’ preferred seat
positions.
An important finding from the regression modeling was that the residuals from the
regression functions predicting fore-aft and vertical seat position were uncorrelated. Thismeans that the accommodation on the fore-aft axis can be assessed independent of the
vertical accommodation.
Because vertical seat position is a function only of steering wheel height (H17), the
vertical distribution of drivers’ preferred seat positions is modeled for all vehicles as a
normal distribution with the mean
HPtZ mean (mm) = -200.3 + 0.8545 H17 [17]
and standard deviation
sHPtZ = 22.9 mm [18]
following the regression results in Table 6. Using the normal approximation, a seat track
height required to accommodate 95% of drivers on vertical position would be at least
2 (22.9) !-1(0.975) = 90 mm [19]
where !-1(q) is the inverse cumulative standard normal distribution. For example,
!-1(0.975) = 1.96 [20]
!-1(q) can be obtained in Microsoft Excel as normsinv(q).
Obtaining the appropriate bounds for fore-aft seat position is more complex because the
regression equation includes two anthropometric variables. The means and standard

7/21/2019 UMTRI-2005-30 (2)
http://slidepdf.com/reader/full/umtri-2005-30-2 29/54
19
deviations of SSH (stature minus sitting height) and log(BMI) are needed for the target
population. These values can be derived from analysis of a target sample intended to be
representative of the driver population, or obtained by weighting other data appropriately.
For example, the values might be obtained from NHANES III, ANSUR, or another large
anthropometric dataset. The examples in this report use the NHANES III dataset (NCHS
2005). The NHANES III population represents U.S. civilians as of 1990. Table 7 lists
distributional data for this population.
Table 7
Means (standard deviations) of Anthropometric Distributions
for Men and Women Ages 18-65 in NHANES III*
Dimension (mm) Men Women
Stature (S) 1762 (72.3) 1627 (67.5)
Erect Sitting Height (SH) 923 (38.9) 861 (35.9)
Stature minus Erect Sitting Height (SSH) 841 (46.8) 768 (43.2)
Ratio of Erect Sitting Height to Stature (SH/S) 0.523 (0.0134) 0.528 (0.0138)
Log(BMI)† 3.281 (0.1703) 3.293 (0.2251)
* Means and standard deviations estimated to obtain an accurate fit at the 5th and 95th percentiles of the
distributions when using a normal approximation. These are not necessarily the actual means and standard
deviations of the data.
† Units are natural log (kg/m2)
The distribution of fore-aft seat position for a single-gender population (male or female)
is modeled as a normal distribution. The mean value is obtained by plugging in the
steering wheel location (L11, H17) and the mean values of SSH and log(BMI) from
Table 7 into the equation 13. The standard deviation is obtained by the equation
s2HPtXAHP = (0.6394 s SSH)2 + (89.07 s log(BMI))
2 + (37.7)2 [21]
Note that because log(BMI) and SSH are uncorrelated, the covariance can be neglected.
The constant squared term is the root mean square error from the regression.
For this population, the fore-aft seat position distribution for the population described inTable 7 is then described by two single gender normal distributions with (mean,
variance):
Male Seat Position X (mm) ~ N (761.2 + 0.6081 L11 - 0.3343 H17 , 49.32) [22]
Female Seat Position X (mm) ~ N (711.9 + 0.6081 L11 - 0.3343 H17 , 48.02) [23]

7/21/2019 UMTRI-2005-30 (2)
http://slidepdf.com/reader/full/umtri-2005-30-2 30/54
20
For a mixed-gender population, selecting bounds on the fore-aft seat adjustment range to
accommodate a target percentage of the population (or, equivalently, to disaccommodate
a specified fraction at each end) requires an iterative solution. Taking m as the fraction of
males in the population, the fraction of the combined male female population that lies to
the forward of x1 is
F 1 = m !(( x1 - xMean,Male)/sHPtX,Male) + (1-m) !(( x1 - xMean,Female)/sHPtX,Female) [24]
Where ! (x) is the cumulative standard normal distribution. For example, ! (1.64) =
0.95. The fraction rearward of x2 is
F 2 = m (1 - !(( x2 - xMean,Male)/sHPtX,Male)) + (1-m) (1 - !(( x2 - xMean,Female)/sHPtX,Female)) [25]
The accommodation problem is then to find x1 and x2 such that, for example, 95% of
drivers’ preferred seat positions lie within the bounds. The solution is obtained by
iteratively varying x1 and x2. (See the Excel spreadsheet accompanying this report for an
annotated guide to the calculations.)
Multivariate Accommodation
In practice, a designer will likely want to accommodate a target percentage of drivers on
fore-aft and vertical position simultaneously. The total seat-position accommodation can
be solved as shown in Figure 3. Suppose the target is 95% accommodation on both
vertical and fore-aft seat position. The total percentage disaccommodated is the sum of
the fractions disaccommodated on the front, back, top, and bottom of the adjustment
range, minus the double-counted individuals in the corners. Because fore-aft and vertical
seat positions are uncorrelated in this dataset, the corner fractions are simply the product
of the adjacent fractions. For example, if 2.5% of drivers are disaccommodated at the top
of the travel and 2.5% at the front of the travel, the percentage of drivers who prefer a
seat position both above and forward of the adjustment range is (0.025) 2 = 0.0006225.
With symmetrical disaccommodation of p in each of the four directions, the total
accommodation A is
A = 1 - 4 p + 4 p2 [26]
Solving the quadratic equation for p gives
p = 0.5 – 0.5 ( A)1/2 [27]
7/21/2019 UMTRI-2005-30 (2)
http://slidepdf.com/reader/full/umtri-2005-30-2 31/54
21
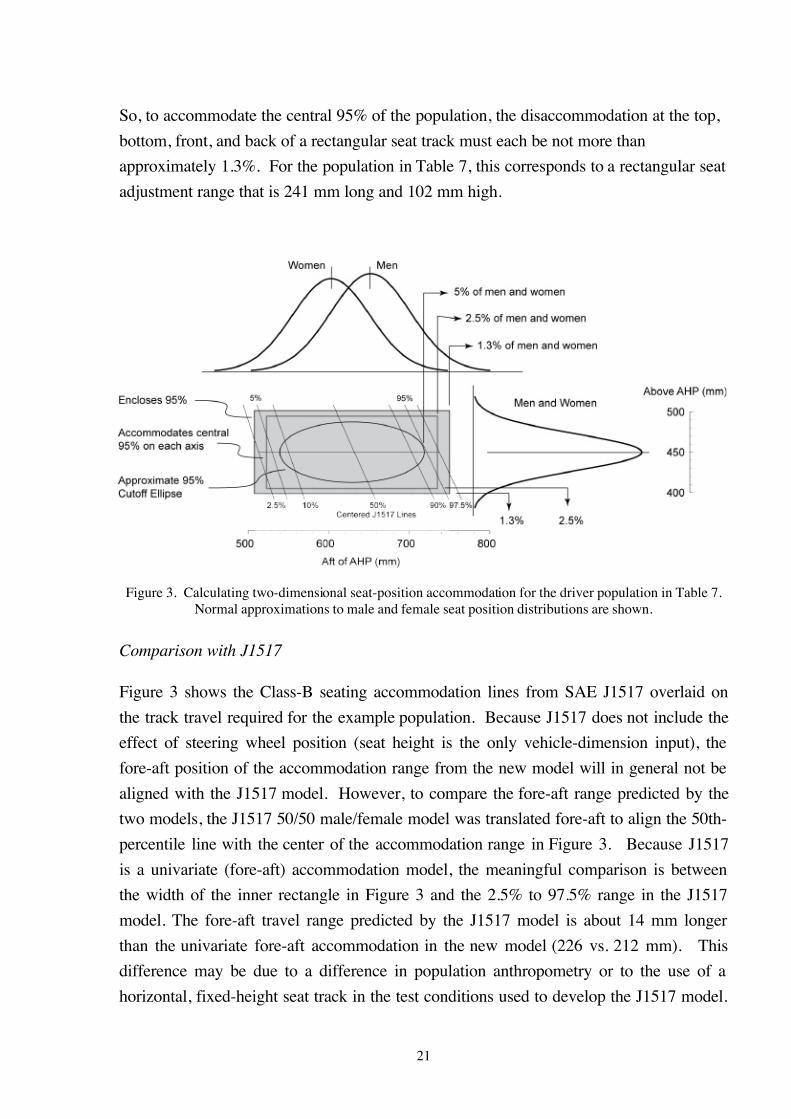
So, to accommodate the central 95% of the population, the disaccommodation at the top,
bottom, front, and back of a rectangular seat track must each be not more than
approximately 1.3%. For the population in Table 7, this corresponds to a rectangular seat
adjustment range that is 241 mm long and 102 mm high.
Figure 3. Calculating two-dimensional seat-position accommodation for the driver population in Table 7.
Normal approximations to male and female seat position distributions are shown.
Comparison with J1517
Figure 3 shows the Class-B seating accommodation lines from SAE J1517 overlaid on
the track travel required for the example population. Because J1517 does not include the
effect of steering wheel position (seat height is the only vehicle-dimension input), the
fore-aft position of the accommodation range from the new model will in general not be
aligned with the J1517 model. However, to compare the fore-aft range predicted by the
two models, the J1517 50/50 male/female model was translated fore-aft to align the 50th-
percentile line with the center of the accommodation range in Figure 3. Because J1517
is a univariate (fore-aft) accommodation model, the meaningful comparison is between
the width of the inner rectangle in Figure 3 and the 2.5% to 97.5% range in the J1517
model. The fore-aft travel range predicted by the J1517 model is about 14 mm longer
than the univariate fore-aft accommodation in the new model (226 vs. 212 mm). This
difference may be due to a difference in population anthropometry or to the use of a
horizontal, fixed-height seat track in the test conditions used to develop the J1517 model.

7/21/2019 UMTRI-2005-30 (2)
http://slidepdf.com/reader/full/umtri-2005-30-2 32/54
22
Overall, the new model is reasonably consistent with the J1517 seating accommodation
model, but the new model provides greater accuracy and flexibility because it takes into
account steering wheel position, is configurable for driver body dimension distributions,
and was developed for height-adjustable seats.
3.3 Eyellipse
Overview
The construction of the eyellipse is divided into two stages. First, the dimensions of the
eyellipse are determined. Second, the eyellipse is located in the package with respect to
the AHP. The new eyellipse is designed to be used with the seating accommodation
model presented in the previous section. In fact, the first step in the process of locating
the new eyellipse within the vehicle package is calculating the mean fore-aft and verticalseat position. The eyellipse was developed using statistical procedures that are very
similar to those that were used to develop the new (2002) J941 Class-A eyellipse. As
with the seat-position model, the eyellipse is configurable for the body dimension
distributions of the driver population and gender mix. The steering wheel position is the
only vehicle package information that is used, but a new procedure based on driver
preference data is used to calculate the effective steering wheel position for input to the
model.
The eyellipse models the distribution of driver eye locations as a three-dimensionalnormal distribution. Specifically, the data analysis suggests that the distribution of right
or left eye locations for a single gender population in a vehicle with minimal censoring
due to seat track limitations, headroom, knee room, and other clearance dimensions will
be normal on each axis. Because the male and female eye location distributions overlap
substantially, and because conducting analyses with separate male and female eyellipses
would be cumbersome, a procedure has been developed to create a single eyellipse that
approximates the cutoff behavior that would be obtained through weighted analyses using
single-gender eyellipses.
Developing the Eyellipse
To compute the dimensions of the eyellipse, the eye location data for each of the nine
laboratory test conditions were centered on the condition means. Figure 4 shows a trend
toward lower eye locations toward the front of the distribution. The correlation between
the fore-aft and vertical coordinates is 0.36.

7/21/2019 UMTRI-2005-30 (2)
http://slidepdf.com/reader/full/umtri-2005-30-2 33/54
23
Figure 4. Fore-aft and vertical eye-location data (mm) from laboratory study, centered for each conditionand overlaid. First and second principal components (eigenvectors of covariance matrix) are shown, along
with a 95% cutoff (74% inclusion) ellipse constructed assuming bivariate normality.
To construct an approximating ellipse, the covariance matrix for the data was calculated.
The first eigenvector of the covariance matrix describes the direction along which the
data have highest variance, which is taken to be the long axis of the ellipse ( x’). The
second eigenvector is perpendicular to the first and gives the direction of the side-view
minor axis of the ellipse ( z’). To determine if anthropometric effects determine the axis
lengths, the data were expressed on the x’, z’ axes given by the eigenvectors (see
Figure 4). The x’ coordinates were found to be significantly related to stature (S ) with
x’ = -838 + 0.4825 S , R2 = 0.52, RMSE = 52.6 mm [28]
The z’ coordinates were significantly related to stature, but the R2 value was only 0.11, so
this relationship was neglected. Equation 28 is used in the eyellipse construction
procedure to identify cutoff points on the long axis of the ellipse. The procedure is
described below, after introducing the locator equation.
The centroid of the eyellipse is positioned with respect to the mean predicted seatposition. Equations 13 and 14 are used with the mean population values of SSH and
log( BMI ) to obtain the mean seat position. The mean population value of SSH is
SSH Mean, Pop = m SSH Mean, Male + (1-m) SSH Mean, Female [29]
7/21/2019 UMTRI-2005-30 (2)
http://slidepdf.com/reader/full/umtri-2005-30-2 34/54
24
where m is the fraction of the population that is male. The mean population value for
log( BMI ) is calculated similarly. A reference eyellipse centroid is then calculated with
respect to the mean seat position using equations 15 and 16 with the mean anthropometric
measures for the population. The reference centroid is used as a starting point to scale
and locate the eyellipse.
The construction procedures, which are illustrated in Figure 5, follow the methods used
to create the J941 Class-A eyellipse (see J941 Appendix A).
1. Construct a side-view line passing through the reference centroid oriented at 32.2
degrees from horizontal (down at the front).
2. Find the male centroid by moving along the x’ line relative to reference centroid by
the distance given by
x’Centroid, Male = 0.4825 (S Mean, Male - S Mean, Pop) [30]
where S Mean, Pop is the mean population stature. Similarly, find the female centroid by
x’Centroid, Male = 0.4825 (S Mean, Male - S Mean, Pop) [31]
The female centroid will lie further forward along x’ than the male centroid.
3. Compute the standard deviation of eye location for male and female drivers along the
x’ axis from the standard deviations of stature by
s2x’, Male = (0.4825 sS, Male)
2+ (52.6)2 [32]
and
s2x’, Female = (0.4825 sS, Female)
2+ (52.6)2 [33]
7/21/2019 UMTRI-2005-30 (2)
http://slidepdf.com/reader/full/umtri-2005-30-2 35/54
25
3. Choose the front axis point x’1 such that a tangent to the ellipse at that point
(perpendicular to x’) will cut off the desired fraction of the population by iteratively
solving for x’1 in
1-C = m !
(( x’1 - x’Mean,Male)/sx’,Male) + (1-m)!
(( x’1 - x’Mean,Female)/sx’,Female) [34]
where C is the desired eyellipse cutoff (e.g., 95%) and !(") is the cumulative
standard normal distribution. Similarly, choose the rear axis point x’2 to cut off the
same fraction:
1-C = m (1 - !(( x’2 - x’Mean,Male)/sx’,Male)) + (1-m) (1 - !(( x’2 - x’Mean,Female)/sx’,Female)) [35]
The x’ axis length is x’1 - x’2. The eyellipse centroid is located at ( x’1 + x’2)/2. In
general, this will not be at the reference centroid location, because of differences
between men and women in stature variance.
4. Compute the y’ and z’ axis lengths from the selected cutoff fraction. The y’ axis is
parallel to the y (lateral) axis of the vehicle (cross-cab). The standard deviation of eye
locations on this axis is a constant 19.7 mm. So, the axis length for a cutoff
percentage of C (e.g., 0.95) is
y’ axis length = 2 (19.7) !-1(C ) [36]
where !-1
(q) is the inverse standard cumulative normal distribution (e.g., !-1
(0.95) =1.64). The z’ axis, perpendicular to the x’ axis and in the same vertical plane, has
length
z’ axis length = 2 (45.6)!-1(C ) [37]
where the standard deviation on z’ is a constant 45.6 mm.
5. The lateral position of the cyclopean eyellipse is aligned with driver centerline, which
is usually the centerline of the steering wheel. The right- and left-eye ellipses are
obtained by translating the eyellipse left and right by 32.5 mm from driver centerline
for a lateral spacing of 65 mm, which is typical interpupillary distance (just as in
J941). The new eyellipse has no plan-view rotation angle, unlike the J941 Class-B
eyellipse.

7/21/2019 UMTRI-2005-30 (2)
http://slidepdf.com/reader/full/umtri-2005-30-2 36/54
26
Figure 5. Schematic of eyellipse construction.
Comparison to J941
The SAE Class-B eyellipse, which was adopted in 1987, is currently documented in
Appendix E of J941. This eyellipse is not widely used in truck and bus design for
reasons described in the Introduction, but it may be useful to compare the new model to
the current SAE J941 version. Such comparisons are only approximate, because of the
differing structure of the models. The inputs to the old model are driver gender mix,
design seat height (SAE H30), and design seat back angle. As is implied by these inputs,
the model was developed for fixed-height seats (fore-aft adjustment only) and for seats
with fixed seat back angles. Most trucks and buses manufactured for the U.S. market
today have seats with seat height adjustment and adjustable seat back angles. The driver
population used to create the models (Sanders and Shaw, 1985; Phillipart et al., 1985)
also may differ substantially from the driver populations currently of interest.
Nonetheless, the models will be compared for several different truck packages. The
driver population will be represented by a generic U.S. adult civilian population with
50% men derived from NHANES III data (NCHS 2005). This population, which is
approximately representative of U.S. adults as of 1990, is described using the values in
Table 7.
Six vehicle packages are listed in Table 8. For this comparison the steering wheel
locations, defined by SAE L11 and H17, are assumed to be fixed. Packages 1-3 were
configured using 100-mm increments of L11 and values of H17 calculated to lie on the
7/21/2019 UMTRI-2005-30 (2)
http://slidepdf.com/reader/full/umtri-2005-30-2 37/54
27
steering wheel preference line (see section 3.4, below). For packages 1–3, H30 was
estimated using equation 17, which gives mean expected vertical seat position in an
adjustable seat as a function of vertical steering wheel position (repeated here for
convenience):
HPtZ mean (mm) = -200.3 + 0.8545 H17 [38]
This equation produces H30 values that correspond well to the seat-position model used
as part of the eyellipse calculation. Design seat back angle (A40) for the J941 model was
set to 15 degrees for packages 1-3 to isolate the effects of package. Packages 4-6 were
taken from Sanders and Shaw (1985), except that the seat back angles were manipulated
to minimize the fore-aft discrepancy between the eyellipse centroids.
In package 2, the J941 eyellipse and the new eyellipse are almost exactly aligned fore-aftand the new eyellipse centroid is 12 mm higher. This shows that the vertical spacing
between the seat and eyes that is produced by the new model is similar to the old model,
and that the fore-aft position with respect to AHP is similar under some plausible
conditions. However, when the steering wheel is further forward, the new eyellipse
responds by moving more forward than the change in seat height alone would indicate,
creating a discrepancy between the old and new models. Of course, this could be
eliminated by changes to the seat back angle, since that variable also controls fore-aft
positioning in the old J941 model. Following this approach, the back angles required to
align the fore-aft positions of the old and new eyellipses in packages 4–6 range from 8.4
to 15.6 degrees, a plausible range. The vertical discrepancies in centroid location for
these packages arise because the fixed seat heights (H30) in packages 4–6 do not follow
the driver-selected seat height relationship observed with height-adjustable seats.
Figure 6 compares the shape of the J941 95% eyellipse for the 50/50 male/female
population with the new eyellipse constructed using the population in Table 7. The fore-
aft length of the new eyellipse is similar, but the new eyellipse is approximately twice as
tall, due to the vertically adjustable seat.

7/21/2019 UMTRI-2005-30 (2)
http://slidepdf.com/reader/full/umtri-2005-30-2 38/54
28
Table 8
Comparison of Centroid Location with J941 Class-B Eyellipse and New Model (mm)
Package
Dimension 1 2 3 4 5 6
L11
100
200
300
64
168
229
H17 855 786 716 840 790 740
H30 531 471 412 531 468 405
A40 (deg) 15 15 15 8.4 13.2 15.6
J941 Centroid X 577 604 630 488 580 633
J941 Centroid Z 1168 1109 1049 1193 1113 1043
New Centroid X 513 605 697 493 582 641
New Centroid Z 1180 1121 1061 1167 1124 1082
Delta X -64 2 67 0 0 0
Delta Z
12
12
12
-25
13
41
Figure 6. Comparison of J941 and new eyellipses for a 50/50 gender mix and seat track length >133 mm
(J941). The new eyellipse was configured with the population from Table 7. Eyellipses are shown with the
same centroid, although differences in the locator equations will usually result in different centroids.
7/21/2019 UMTRI-2005-30 (2)
http://slidepdf.com/reader/full/umtri-2005-30-2 39/54
29
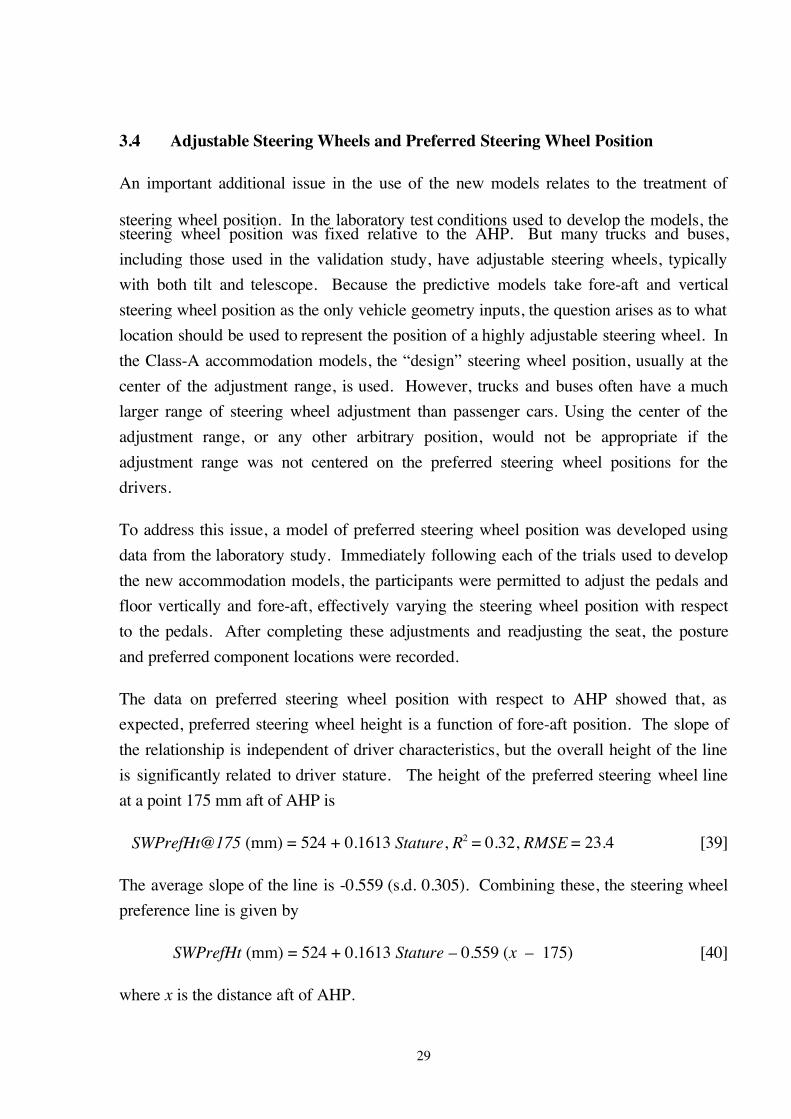
3.4 Adjustable Steering Wheels and Preferred Steering Wheel Position
An important additional issue in the use of the new models relates to the treatment of
steering wheel position. In the laboratory test conditions used to develop the models, thesteering wheel position was fixed relative to the AHP. But many trucks and buses,
including those used in the validation study, have adjustable steering wheels, typically
with both tilt and telescope. Because the predictive models take fore-aft and vertical
steering wheel position as the only vehicle geometry inputs, the question arises as to what
location should be used to represent the position of a highly adjustable steering wheel. In
the Class-A accommodation models, the “design” steering wheel position, usually at the
center of the adjustment range, is used. However, trucks and buses often have a much
larger range of steering wheel adjustment than passenger cars. Using the center of the
adjustment range, or any other arbitrary position, would not be appropriate if the
adjustment range was not centered on the preferred steering wheel positions for the
drivers.
To address this issue, a model of preferred steering wheel position was developed using
data from the laboratory study. Immediately following each of the trials used to develop
the new accommodation models, the participants were permitted to adjust the pedals and
floor vertically and fore-aft, effectively varying the steering wheel position with respect
to the pedals. After completing these adjustments and readjusting the seat, the posture
and preferred component locations were recorded.
The data on preferred steering wheel position with respect to AHP showed that, as
expected, preferred steering wheel height is a function of fore-aft position. The slope of
the relationship is independent of driver characteristics, but the overall height of the line
is significantly related to driver stature. The height of the preferred steering wheel line
at a point 175 mm aft of AHP is
SWPrefHt@175 (mm) = 524 + 0.1613 Stature, R2 = 0.32, RMSE = 23.4 [39]
The average slope of the line is -0.559 (s.d. 0.305). Combining these, the steering wheel
preference line is given by
SWPrefHt (mm) = 524 + 0.1613 Stature – 0.559 ( x – 175) [40]
where x is the distance aft of AHP.

7/21/2019 UMTRI-2005-30 (2)
http://slidepdf.com/reader/full/umtri-2005-30-2 40/54
30
For purposes of the new accommodation models, the location of an adjustable steering
wheel is chosen with respect to the steering wheel preference line. First, the geometric
center (centroid) of the travel envelope for the center of the steering wheel in side view is
calculated. (The center of the wheel is defined, as in SAE J1100, as the intersection
between the axis of rotation of the wheel and a plane lying on the driver side of the
wheel.) Next, the point on the steering wheel preference line that is closest to the
geometric center of the travel envelope is calculated. If this point lies within the travel
envelope, it is used as the steering wheel location to define Ll1 and H17 for input to the
models. If the closest point on the preference line to the travel-envelope centroid lies
outside the travel envelope, the point of intersection between the travel envelope and the
perpendicular line from the preference line to the centroid is used. Figure 7 shows the
calculation schematically. This approach provides an objective, data-based method for
representing the effects of adjustable steering wheels on driver posture, while alsoproviding some design guidance. The method is illustrated in the next section as the new
models are exercised for the vehicles used in the validation study.
Figure 7. Calculating effective steering wheel location for a case in
which the preference line does not pass through the adjustment range.
3.5 Comparison to In-Vehicle Data
The in-vehicle data provide an opportunity to evaluate the performance of the newmodels. Because the driver population was relatively small (24 drivers), and only seven
were women, comparing the results to models constructed for a generic population (e.g.,
U.S. adults) would not be very meaningful. Instead, the models were tailored to the
anthropometric distribution of the driver population, combining men and women. This

7/21/2019 UMTRI-2005-30 (2)
http://slidepdf.com/reader/full/umtri-2005-30-2 41/54
31
allows the model performance to be judged independent of the particular driver
population. Table 9 lists the distributional data used to configure the models.
Table 9
Anthropometric Distributions for the
In-Vehicle Driver Population (men and women combined)
Dimension Mean Standard Deviation
Stature (mm) 1758 102
Erect Sitting Height (mm) 922 42.4
Log(BMI) 3.460 0.216
Stature minus Sitting Height 836 66.2
Sitting Height / Stature 0.525 0.013
Figure 8 compares the new accommodation models to the distribution of driver-selected
seat positions and driver eye locations for the six test vehicles. Driver-selected seat
positions, steering wheel locations, and eye locations (N=24 in each vehicle) are shown
with small black dots. Crosshairs indicate the mean ± one standard deviation on the fore-
aft and vertical axes for each landmark. The steering wheel and seat adjustment ranges
are represented by polygons joining the extreme points. The 4700 and DAF45 were
tested with fixed steering wheel positions. The origin for each plot is the accelerator heel
point and the accelerator pedal plane is depicted with a line. The steering wheel
preference line is shown as a green line. The geometric center of the steering wheeladjustment range is shown with a red dot. The steering wheel position used as input to
the accommodation models (L11, H17) is shown with a blue dot. This point lies on the
steering wheel preference line if the line passes through the steering wheel adjustment
envelope, at the location of fixed steering wheels, or on the boundary of the adjustment
envelope when the line does not intersect the envelope.
The seat position data show substantial amounts of censoring. The “stacking up” of
drivers at the rear and sometimes the bottom of the travel path indicates that many drivers
were not able to sit in the position that they would have chosen with unlimited seat
adjustment range. (The seat position data lie slightly outside the H-point travel path in
some cases because the travel paths were defined with unloaded seats.) The prevalence
of seat-position censoring across these vehicles (only the Eagle showed largely
uncensored seat positions) highlights the need for improved driver accommodation
models.

7/21/2019 UMTRI-2005-30 (2)
http://slidepdf.com/reader/full/umtri-2005-30-2 42/54
32
The seat position model is shown using a 95% cutoff ellipse constructed just as the
eyellipse is constructed. The mean predicted seat position (ellipse centroid) was
calculated using the mean population anthropometry values from Table 9 in equations 13
and 14. The horizontal and vertical axis lengths were determined using the horizontal
and vertical standard deviations calculated from equations 18 and 21. In this case, the
population was treated as a single-gender distribution, simplifying the calculation of fore-
aft axis length. If the model is accurate and the underlying data are normally distributed,
approximately 74% of the data points would be expected to lie within the ellipse.
A 95% cutoff eyellipse was calculated as described above, using a single-gender
population quantified by the values in Table 9. The centroids of the seat-position
eyellipse and eyellipse are shown with blue dots. Because the eyellipse location is based
on the predicted seat location, errors in the prediction of seat location will affect the
assessment of the eyellipse fit. Consequently, a second eyellipse, displayed with a thin
line, was positioned based on the mean observed seat position. This provides a good
indication of whether the eyellipse size, shape, and predicted location with respect to H-
point match the data well.
The majority of seat positions and eye locations fell within the model ellipses for each
vehicle, and the predicted mean lay within one standard deviation of the observed mean
value in each case. Among the Class-8 cabs, the worst fit was observed for the seat
position data in the Century. Approximately half of the drivers were censored on seat
position in this vehicle and the driver-selected steering wheel positions lie primarily aft of
the steering wheel position used as input to the model. The reason for the discrepancy
may be due to a problem with steering wheel angle, since drivers tended to select
positions only in the bottom half of the angle range. However, even in this vehicle, the
fore-aft span of seat positions and both the vertical and fore-aft span of eye locations
were well captured by the models. In the other Class-8 cabs, the fit to both the seat
positions and eye locations was good. The new seat position model clearly shows where
the seat adjustment range should have been located to avoid the substantial censoring
observed in the 379 and VN, and confirms the well-positioned seat track in the Eagle.
The seat-position model predicts the large amount of censoring at the back of the track
travel in the 4700 cab, and the eyellipse captures the eye locations well. In the DAF 45,
the model predicted that drivers would have preferred to sit lower than the fixed-height
track permitted, given the steering wheel height. The seat-position ellipse and
consequently the eyellipse lie below the observed distributions, but the eyellipse based on

7/21/2019 UMTRI-2005-30 (2)
http://slidepdf.com/reader/full/umtri-2005-30-2 43/54
33
the mean observed seat positions fits the eye location data very well. The new model is
not designed for fixed-height seats, but could be adapted by setting the mean height to the
height of the track. In that case, the eyellipse would accurate reflect the vertical eye
positions.
Overall, the correspondence between the new models and the in-vehicle data was good.
The seat position model accurately predicted the situations in which substantial seat-
position censoring would occur. If the vehicles had been designed with the new models,
little censoring would have occurred. The eyellipse, which like the seat position model
was tailored to this driver population, accurately captured the overall height and fore-aft
position of the driver’s eyes. A more quantitative analysis of eyellipse shape or cutoff
fraction is not possible with this small dataset.
3.6 Simplified Application Procedures
The calculation procedures described in this report allow customization of the models for
any driver population and vehicle geometry, and allow selection of the desired seat-track
accommodation and eyellipse cutoff. However, in many cases, a generic accommodation
model may suffice for initial analyses. Table 10 presents dimensions for seat track
adjustment ranges and eyellipses for a 50%-male U.S. adult population, and a 90%-male
U.S. adult population. In each case, the seat track dimensions are predicted to
accommodate 95% of the drivers and the eyellipse is a 95% cutoff. Note that there is
only 10-mm difference in the seat track length for the two populations, due to the large
overlap between the male and female seat position distributions.
In practice, users may identify a small number of design populations (e.g., Class-8
owner/operators, bus drivers, or delivery-truck drivers) and compute values similar to
those in Table 10 using the equations in this report or in the associated Excel spreadsheet.
The application to new designs can then proceed simply, perhaps programmed as a CAD
macro that generates and places a rectangular H-point travel path and a pair of eyellipses.

7/21/2019 UMTRI-2005-30 (2)
http://slidepdf.com/reader/full/umtri-2005-30-2 44/54
34
Figure 8. Comparison of accommodation models to in-vehicle driver data for four Class-8 cabs. Driver
data are shown with black dots. Steering wheel and seat adjustment ranges are shown with black lines.
Green line is steering wheel preference model. The seat position model is shown as 95% cutoff ellipse.
The eyellipse based on mean predicted seat position is shown with a thick line. The eyellipse with a thin
line is based on mean observed seat position.
7/21/2019 UMTRI-2005-30 (2)
http://slidepdf.com/reader/full/umtri-2005-30-2 45/54
35
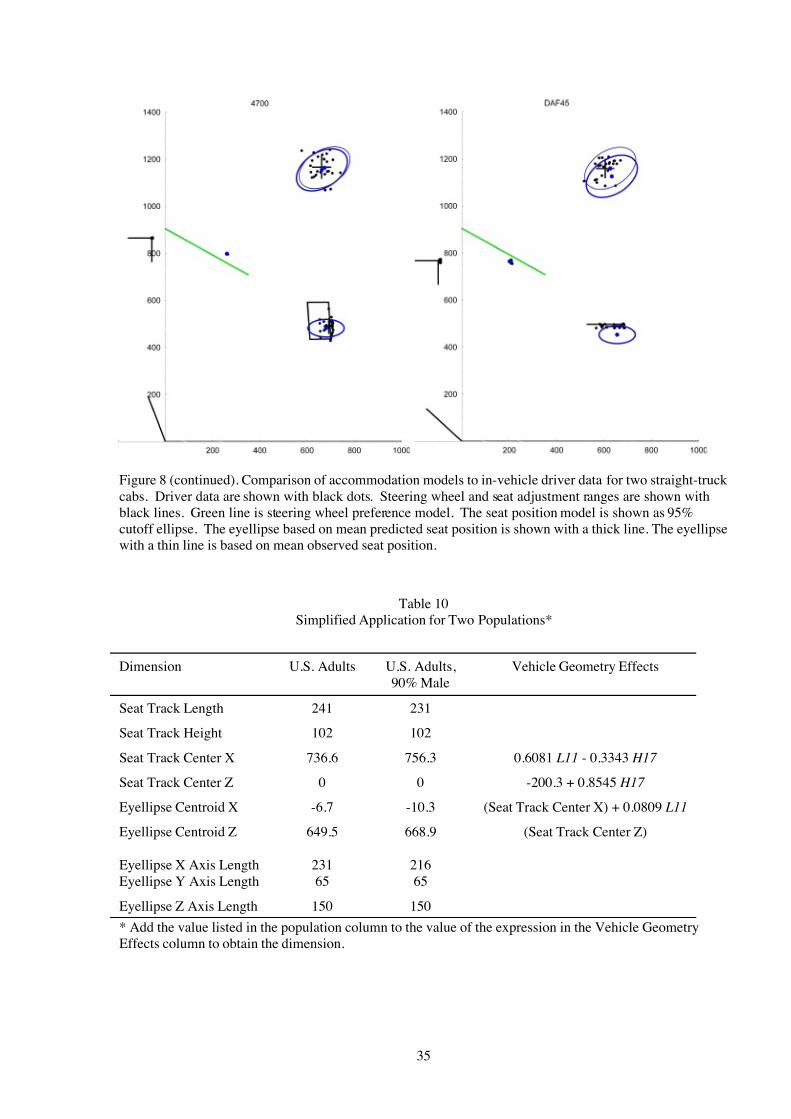
Figure 8 (continued). Comparison of accommodation models to in-vehicle driver data for two straight-truck
cabs. Driver data are shown with black dots. Steering wheel and seat adjustment ranges are shown with
black lines. Green line is steering wheel preference model. The seat position model is shown as 95%
cutoff ellipse. The eyellipse based on mean predicted seat position is shown with a thick line. The eyellipse
with a thin line is based on mean observed seat position.
Table 10
Simplified Application for Two Populations*
Dimension U.S. Adults U.S. Adults,
90% Male
Vehicle Geometry Effects
Seat Track Length 241 231
Seat Track Height 102 102
Seat Track Center X 736.6 756.3 0.6081 L11 - 0.3343 H17
Seat Track Center Z 0 0 -200.3 + 0.8545 H17
Eyellipse Centroid X -6.7 -10.3 (Seat Track Center X) + 0.0809 L11
Eyellipse Centroid Z 649.5 668.9 (Seat Track Center Z)
Eyellipse X Axis Length 231 216
Eyellipse Y Axis Length 65 65
Eyellipse Z Axis Length 150 150
* Add the value listed in the population column to the value of the expression in the Vehicle Geometry
Effects column to obtain the dimension.

7/21/2019 UMTRI-2005-30 (2)
http://slidepdf.com/reader/full/umtri-2005-30-2 46/54
36

7/21/2019 UMTRI-2005-30 (2)
http://slidepdf.com/reader/full/umtri-2005-30-2 47/54
37
4.0 DISCUSSION
4.1 Accomplishments
The seat-position and eyellipse models presented in this report represent importantadvancements over the current state of the art in driver population accommodation
modeling as embodied in SAE practices. The new models improve on the current SAE
tools in at least six ways:
1. The new models are configurable for population anthropometry, so they can be
customized for particular driver populations (e.g., school bus drivers or long-haul
truck drivers).
2. The new models represent vehicle geometry using fore-aft and vertical steeringwheel position with respect to accelerator heel point, rather than seat height,
allowing application to vehicles with height-adjustable seats.
3. The new models provide for a rigorous treatment of large steering wheel adjustment
ranges based on driver preference data, rather than using an arbitrarily chosen
position such as the center of the adjustment range.
4. The eyellipse model is located using the mean seat position obtained from the seat
position model, so the predictions obtained from the two models are always
consistent.
5. The same data and complementary analysis methods were used to develop the
Class-B posture prediction models in the Jack digital human modeling software
package, so the results of Jack analyses can be expected to be consistent with the
new models.
6. The new models are customizable for different cutoffs and accommodation levels,
rather than being limited to a few percentiles of fore-aft seat position and two
eyellipse accommodation levels, allowing back-solving to determine actual
accommodation levels for candidate designs.
4.2 Limitations
The accommodation models in the SAE practices are based on more driver measurements
than the new models. The original eyellipse was based on eye locations of more than

7/21/2019 UMTRI-2005-30 (2)
http://slidepdf.com/reader/full/umtri-2005-30-2 48/54
38
2300 drivers (measured statically). The Class-B models developed in the 1980s were
based on fewer than 200 drivers. The new Class-A seat-position and eyellipse models in
J941 and J4004 are based on 60 to 120 drivers measured in dozens of vehicles. The
current model is based on measurements from 63 drivers in a laboratory study and 24-
drivers measured in vehicles.
In spite of the relatively small sample of drivers, experience with the development of the
Class-A models suggests that the primary limitation is not the number of drivers per se,
but rather the number of vehicles in which mean driving position has been measured. In
particular, substantial seat-position censoring was observed in four of the six validation
vehicles, limiting the value of the comparison between those data and the model
prediction. Consequently, the driver behavior in those vehicles (for example, mean
selected seat position) may not accurately reflect the behavior of drivers in vehicles with
better positioned seat tracks. However, the model predictions for seat position and eye
location matched driver data well in the two vehicles with minimal censoring, and
predicted the censoring accurately in the other four vehicles.
Another limitation inherent in studies of this sort is the short duration of the test intervals.
Some drivers report frequent changes in posture and position during long drives. The
importance of these changes for design may be minimal, however, because the majority
of these posture shifts will happen within the range of adjustment required to
accommodate the initial postures of a large population of drivers. Measurements of
drivers in the vehicles they normally drive will be necessary to quantify these effects.
Although these models are intended for application to any on-road Class-B vehicle, they
have not been validated for special populations, particularly school or transit bus drivers.
Bus drivers operate different vehicles and in a different environment than truck drivers.
The critical nature of driver vision near buses is reflected in the substantially different
mirror requirements. Vision requirements may cause drivers to sit differently in a bus
than they would driving a truck with a similar steering-wheel-to-pedal relationship. In-
vehicle validation measurements are needed to determine the applicability of the newmodels to that environment.
Overall, the data from the in-vehicle truck study do not support the hypothesis that driver
exterior vision is an important determinant of driver posture. Specifically, the model
accuracy was similar across the vehicles with height-adjustable seats, but these vehicles
had substantially different external vision restrictions imposed by different hood

7/21/2019 UMTRI-2005-30 (2)
http://slidepdf.com/reader/full/umtri-2005-30-2 49/54
39
geometries and windshield layouts. If driver vision was an important factor determining,
for example, vertical seat height, higher seat positions than predicted would have been
expected in the Peterbilt 379, which has a relatively long, high hood. More
measurements of driving posture in vehicles driven in actual on-road use will be needed
to determine the conditions under which external vision restrictions are important
determinants of driver posture.
Due to the limitations of the underlying data, in particular the number of vehicles for
which driver data are available, the models presented in this report do not address the
issue of statistical tolerance. Because all empirical models have error, the models will be
more or less accurate across vehicles, resulting in deviations from the expected
accommodation. To illustrate using an analogy, calculating the dimensions of a
rectangular seat track travel path using the methods in this report can be thought of as
trying to place a rectangular box over a pile of sand. If a box sized to enclose 95% of the
sand is perfectly centered on the pile, the box will contain the desired percentage.
However, any errors in centering the box on the pile will result in less than 95% lying
within the box. Errors in the dimensioning of the box will sometimes result in more than
95% inclusion, but the slope of the distribution at the edges means that dimensional
errors will also be biased toward reduced inclusion.
Tolerance applies a probabilistic assessment to the model application domain, so that the
model includes consideration of the likelihood of actually accommodating the desired
percentage of the population in a particular new vehicle. In SAE J4004, a tolerance value
of 90% was used to define a set of seat track lengths targeting various levels of
accommodation. For example, 95% of a generic U.S. driver population can be
accommodated in an average passenger car by an optimally positioned 200-mm-long seat
track. However, it is necessary to use a 240-mm-long seat track to accommodate at least
95% of drivers in 90% of new vehicles equipped with seat tracks designed with the
model. The tolerance for the Class-A models was estimated by applying the model to
dozens of vehicles for which driver seat-position data were available. Unfortunately, the
small number of trucks for which driver data are available does not permit a similarcalculation for the new seat-position model.
One approach to estimating tolerance for the new model would be to use the percentage
increase in seat track length required by the inclusion of 90% tolerance in the Class-A
model (i.e., about 20%). This would lengthen the seat track adjustment range
requirements for a typical U.S. adult driver population to approximately 288 mm x

7/21/2019 UMTRI-2005-30 (2)
http://slidepdf.com/reader/full/umtri-2005-30-2 50/54
40
120 mm. However, judging from the results of the in-vehicle study, a large improvement
in truck driver accommodation can be expected just from the use of the new models
without including tolerance. The further expansion of the models to include tolerance
would best be left until after more relatively uncensored seat-position data from on-road
studies are available.
4.3 Applications
The models presented in this report should be used both to develop new vehicle designs
and to assess existing designs, including benchmarking of competitive vehicles. The
new-vehicle design process might begin with consideration of the steering-wheel-location
preference line introduced in this report. Several of the test vehicles had steering wheel
adjustment ranges intersecting the preference line, but others did not. The vertical
position of the preference line is customizable for the average driver stature, so thesteering wheel position for a school bus, for example, might be located differently than
that of a severe-service truck.
From a design steering wheel location on the preference line, a seat track adjustment
range can be laid out. The model locates and scales the seat adjustment range based on
the effective steering wheel location and the distribution of driver body dimensions.
Importantly, the model includes the effects of increasing body mass index on the required
seat adjustment range. The seat track travel required to accommodate a population that
has a high percentage of obese drivers is located further rearward.
The eyellipse presents a much more accurate representation of the vertical distribution of
eye locations in vehicles with height adjustable seats than did the SAE J941 eyellipse.
The change in eyellipse dimensions (see Figure 6) can be expected to affect a variety of
vision analyses. For example, the top edge of the 95% cutoff eyellipse is about 42 mm
higher than top of the J941 eyellipse for H30 at the middle of the vertical seat travel,
reducing the estimated 95th-percentile upvision angle. Similarly, the 5th-percentile
downvision angle would be reduced. Another consequence of the taller eyellipse is that
the estimated headroom requirement would be increased by approximately the additional
height of the eyellipse (42 mm). The narrower lateral axis would slightly change mirror
field-of-view and pillar obscuration calculations, but these are not likely to be important
effects. Cluster visibility analyses may be somewhat eased by the narrower eyellipse.
Interestingly, along the axis of downvision to the instrument cluster (approximately 30

7/21/2019 UMTRI-2005-30 (2)
http://slidepdf.com/reader/full/umtri-2005-30-2 51/54
41
degrees to horizontal), the eyellipse dimensions are approximately the same, reducing the
impact of the larger eyellipse on cluster visibility analyses (rimblock assessments).
The equations for calculating the centroids of the seat position and eye location
distributions are similar to those developed previously for posturing human figuremodels. Because they are based on the same data, they also produce similar results. For
example, putting the mean population anthropometry into the posture prediction models
will produce predicted seat position and eye locations that are generally within 10 mm of
the centroids calculated using the above procedures. Consequently, an alternative
approach to using the models in this report to position a generic seat track adjustment
range and eyellipse using posture prediction based on the mean population values. The
fit to the data will be essentially identical, as can be readily verified.
4.4 Research Needs
Additional models can be created from the existing data to fill out the family of tools. In
particularly, the data are available to create a new shin/knee contour model to replace
J1521, and a new belly contour model to replace J15122. The models would be based on
the seat-position model and configurable for population anthropometry in the same way
the new eyellipse is. A new head contour model can be created based on the new
eyellipse. The data are also available to create a lateral clearance model (shoulder, hips,
knees, elbows) that will take into account changes in population body dimensions,
particularly increases in body mass index. Data on preferred shifter location were
gathered in the laboratory study and could be used to create a population model focused
on that control.
New data are most urgently needed for special vehicle environments, particularly buses.
Data should be gathered from bus drivers in the vehicles they normally drive as well as in
laboratory mockups. Other special vehicle populations of interest, such as local delivery
vehicles, should also be studied in detail. As part of these studies, driver vision
obstructions should be systematically manipulated to quantify the effects, similar to a
study conducted previously for Class-A vehicles (Reed et al. 2000b). Any new vehicle
studies should be conducted using seat track adjustment ranges that provide good
accommodation according to the new model to avoid the problem of excessive censoring.
Other factors that should be studied in mockups and in vehicle include the effects of
restrictive headroom; different seat features, including motorized tilt adjustments; and

7/21/2019 UMTRI-2005-30 (2)
http://slidepdf.com/reader/full/umtri-2005-30-2 52/54
42
transmission type (all testing to date has been conducted with clutches and manual
transmissions).
A model for steering-wheel angle adjustment is also needed. The current laboratory and
in-vehicle data have not revealed useful patterns of adjustment behavior. For example,drivers’ preferred steering wheel angles do not appear to be related to belly clearance or
vision to the cluster. It may be that vision to the cluster or belly room only have
significant effects when the vehicle package creates a conflict. For example, in a vehicle
with insufficient rearward seat track travel, drivers might select a flatter wheel angle to
move the rim of the wheel further forward. Driver steering-wheel angle selection
behavior might be driven in part by the need to view the instrument cluster. This may
have been a factor in the anomalous steering-wheel-angle distribution in the Century,
which in turn led to seat positions lower than expected. Careful investigation of this
issue, first in vehicle mockups and then in vehicles, will be needed to understand the
effects and to develop appropriate models.

7/21/2019 UMTRI-2005-30 (2)
http://slidepdf.com/reader/full/umtri-2005-30-2 53/54
43
5.0 REFERENCES
Dempster, W.T. (1955). Space requirements of the seated operator: Geometrical,
kinematic, and mechanical aspects of the body with special reference to the limbs.
WADC Technical Report No. 55-159. Wright-Patterson Air Force Base, OH: Wright AirDevelopment Center.
Flannagan, C.A.C., Manary, M.A., Schneider, L.W., and Reed, M.P. (1998). An
improved seating accommodation model with applications to different user populations.
Technical Paper No. 980651. Warrendale, PA: Society of Automotive Engineers, Inc.
Hammond, D.C. and Roe, R.W. (1972). SAE controls reach study. Technical Paper
720199. Warrendale, PA: Society of Automotive Engineers, Inc.
Jahns, S.K., Reed, M.P., and Hardee, H.L. (2001). Methods for in-vehicle measurement
of truck driver postures. SAE Technical Paper 2001-01-2821. Society of Automotive
Engineers, Warrendale, PA.
Manary, M.A., Flannagan, C.A.C., Reed, M.P., and Schneider, L.W. (1999). Human
subject testing in support of ASPECT. Technical Paper 990960. Warrendale, PA: Society
of Automotive Engineers, Inc.
Meldrum, J.F. (1965). Automobile driver eye position. Technical Paper 650464.
Warrendale, PA: Society of Automotive Engineers, Inc.
National Center for Health Statistics (2005). http://www.cdc.gov/nchs/.
Phillipart, N.L., Kuechenmeister, T.J., and Stanick, J.M. (1985). Describing the truckdriver workspace. Technical Paper 85217. Warrendale, PA: Society of Automotive
Engineers, Inc.
Reed, M.P., Manary, M.A., and Schneider, L.W. (1999a). Automobile occupant posture
prediction for use with human models. Technical Paper 990966. Warrendale, PA: Society
of Automotive Engineers, Inc.
Reed, M.P., Manary, M.A., and Schneider, L.W. (1999b). Methods for measuring and
representing automobile occupant posture. Technical Paper 990959. Warrendale, PA:
Society of Automotive Engineers, Inc.
Reed, M.P., Roe, R.W, and Schneider, L.W. (1999c). Design and development of the
ASPECT manikin. Technical Paper 990963. SAE Transactions: Journal of Passenger
Cars, Vol. 108.
Reed, M.P., Lehto, M.M., and Schneider, L.W. (2000a). Methods for laboratory
investigation of truck and bus driver postures. Technical Paper 2000-01-3405. SAE
Transactions: Journal of Commercial Vehicles, Vol. 109.
7/21/2019 UMTRI-2005-30 (2)
http://slidepdf.com/reader/full/umtri-2005-30-2 54/54
Reed, M.P., Manary, M.A., and Schneider, L.W. (2000b). The effects of forward vision
restriction on automobile driver posture. Transportation Human Factors, 2(2). 173-179.
Reed, M.P. and Flannagan, C.A.C. (2000c). Anthropometric and postural variability:
limitation of the boundary manikin approach. Technical Paper 2000-01-2172.
Warrendale, PA: Society of Automotive Engineers, Inc.
Sanders, M.S. and Shaw, B.E. (1985) U.S. truck driver anthropometric and truck work
space data survey: sample selection and methodology. Technical Paper 852315.
Warrendale, PA: Society of Automotive Engineers, Inc.
Society of Automotive Engineers (2005). SAE Handbook. Warrendale, PA: Society of
Automotive Engineers, Inc.
Schneider, L.W., Reed, M.P., Roe, R.W., Manary, M.A., Flannagan, C.A.C., Hubbard,
R.P., and Rupp, G.L. (1999). ASPECT: The next-generation H-point machine and
related vehicle and seat design and measurement tools. Technical Paper 990962.
Warrendale, PA: Society of Automotive Engineers, Inc.
Seidl, A. (1997). RAMSIS - a new CAD-tool for ergonomic analysis of vehicles
developed for the German automotive industry. Technical Paper 970088. Warrendale,
PA: Society of Automotive Engineers, Inc.
Stanick, J.M., Phillipart, N.J., and Kuechenmeister, T.J. (1987). Describing the truck
driver eye and head accommodation. Technical Paper 871531. Warrendale, PA: Society
of Automotive Engineers, Inc.