children’s worlds report, 2015
TRANSCRIPT

Children’s views on their lives and well-being in 15 countries:
A report on the Children’s Worlds survey, 2013-14

Children’s Worlds Report, 2015
1
Children’s views on their lives and well-being in 15 countries:
A report on the Children’s Worlds survey, 2013-14
Acknowledgements The project team would like to thank the Jacobs Foundation for their generous funding which
made it possible to conduct this wave of the Children’s Worlds study and for their support
through the process of completing this work.
We are grateful to the peer reviewers – Gordon Alexander, Yekaterina Chzhen and Haridhan
Goswami – who gave valuable feedback during the report-writing process.
Finally, we would like to thank the schools and other organisations within each country who
facilitated the survey and, most importantly, the 53,000 children who spent time completing the
survey and providing the views and experiences on which this report is based.
About this report This report has been prepared and edited by Gwyther Rees and Gill Main at the University of
York, UK. It is the product of a collaborative effort between the international team of
researchers working on this wave of the Children’s Worlds survey listed on the following page.
It can be cited as follows:
Rees, G. & Main, G. (eds) (2015) Children’s views on their lives and well-being in 15 countries: An
initial report on the Children’s Worlds survey, 2013-14. York, UK: Children’s Worlds Project
(ISCWeB)
Further information Further information about the Children’s Worlds project can be found on the project website at
www.isciweb.org.
If you have any queries about the project, please e-mail: [email protected]
Children’s Worlds Report, 2015
2
Children’s Worlds 2013/14: International project team
Project Principal Investigators (Core Group):
Sabine Andresen, Faculty of Educational Science, Goethe University Frankfurt
Asher Ben-Arieh, The Paul Baerwald School of Social Work and Social Welfare, The Hebrew
University of Jerusalem and Haruv Institute
Jonathan Bradshaw, Social Policy Research Unit, University of York
Ferran Casas, EÍDIQV, University of Girona.
Gwyther Rees, Social Policy Research Unit, University of York
Project Co-ordinator:
Tamar Dinisman, International Survey of Children’s Well-Being (ISCWeB)
National Principal Investigators and Researchers:
Algeria: Habib Tillouine, Laboratory of Educational Processes and Social Context (Labo-PECS).
Faculty of Social Sciences, University of Oran
Colombia: Juanita Bernal, Yicel Nairobis Giraldo and Ofelia Roldan, International Centre for
Education and Human Development CINDE
Estonia: Dagmar Kutsar, Institute of Social Studies, University of Tartu
Ethiopia: Yehualashet Mekonen and Negussie Dejene, The African Child Policy Forum
Germany: Sabine Andresen, Johanna Wilmes, Faculty of Educational Science, Goethe University
Frankfurt and Renate Möller, Faculty of Educational Science, Bielefeld University
Israel: Asher Ben-Arieh, The Paul Baerwald School of Social Work and Social Welfare, The
Hebrew University of Jerusalem and Haruv Institute and Avital Kaye-Tzadok, Ruppin
Academic Centre
Nepal: Arbinda Lal Bhomi, Faculty of Education, Tribhuvan University, Kathmandu
Norway: Elisabeth Backe-Hansen, Nova
Poland: Dorota Strózik, Tomasz Strózik and Krzysztof Szwarc, The Poznań University of
Economics.
Romania: Sergiu Bălțătescu and Claudia Oșvat, Department of Sociology and Social Work,
University of Oradea
South Africa: Shazly Savahl, Sabirah Adams, Serena Isaacs, Gaironeesa Hendricks, Arnold
Matzdorff, Cassandra Wagenaar, Lameez Abrahams, Department of Psychology, University of
the Western Cape and Rose September, Department of Women, Children and People with
Disabilities.
South Korea: Bong Joo Lee, Jaejin Ahn, Joan Yoo and Sun Suk Kim, Seoul National University
Spain: Ferran Casas, Mònica González, Sara Malo, Dolors Navarro, Carme Montserrat, Ferran
Viñas, Carles Alsinet, Gemma Crous, Mireia Baena, Mireia Aligué, ERÍDIQV, University of
Girona.
Turkey: Serra Müderrisoğlu, Department of Psychology; Boğaziçi University, Abdullah Karatay,
Department of Social Work Üsküdar University; Pınar Uyan-Semerci, Department of
International Relations, Istanbul Bilgi University and Başak Ekim-Akkan, Social Policy Forum,
Boğaziçi University
United Kingdom: Gwyther Rees, Gill Main, and Jonathan Bradshaw, Social Policy Research
Unit, University of York.

Children’s Worlds Report, 2015
3
Contents Introduction .......................................................................................................................................................................... 4
The survey .......................................................................................................................................................................... 14
The context of children’s lives ....................................................................................................................................... 21
Life as a whole ................................................................................................................................................................... 33
Home and family ............................................................................................................................................................... 45
Money and possessions ................................................................................................................................................... 55
Friends and other relationships ..................................................................................................................................... 61
School................................................................................................................................................................................... 67
Local area ............................................................................................................................................................................ 82
Self ......................................................................................................................................................................................... 91
Other aspects of life ....................................................................................................................................................... 100
Children’s rights ............................................................................................................................................................... 104
Time use ............................................................................................................................................................................ 111
Overview ........................................................................................................................................................................... 132
Conclusions ...................................................................................................................................................................... 139
Appendix: Additional tables .......................................................................................................................................... 148
References ........................................................................................................................................................................ 151

Children’s Worlds Report, 2015
4
Chapter 1
Introduction
This is an initial report on the second wave of the Children’s Worlds survey - a major new
international study of children’s lives and well-being. This wave of the survey, funded by the
Jacobs Foundation, has so far gathered data from over 53,000 children aged around 8, 10 and 12
years old in 15 countries across four continents. This report presents findings from over 30,000
children aged 10 to 12 and provides new comparative insights into the context of children’s
lives, how children spend their time and how they feel about their lives.
This introductory chapter provides a brief overview of the development of the Children’s
Worlds project and describes the purpose and content of the report.
The Children’s Worlds project: Overview
Aims
Children’s Worlds, the International Survey of Children’s Well-Being (ISCWeB), is a worldwide
research survey on children’s subjective well-being.
The project fills a substantial gap in international comparative research evidence on children’s
own views of their lives and well-being. Some international studies of children gathering some
relevant data already exist1 but they are limited either in the diversity of countries included
and/or in the scope of the topics they cover.
The study aims to collect solid and representative data on children’s lives and daily activities
and on their perceptions and evaluations of their lives. The purpose is to improve children's
well-being by creating awareness among children, their parents and their communities, opinion
leaders, decision makers, professionals and the general public.
Concepts
The thinking behind the project draws together several related strands and areas of interest.
First, we wished to focus on childhood as an important life stage in its own right, rather than as
a preparation for adulthood. Social research on children is often concerned with the
implications of certain experiences in childhood for ‘outcomes’ in later life – for example
whether childhood poverty affects educational attainment. These are very important issues.
However childhood, while it has different meanings and definitions in different contexts, is a
significant and substantial period in people’s lives and merits consideration in itself, and not
only because of how it may affect later life stages.
Second, we wished to focus on children as social actors. Many social surveys gather statistics
on children primarily as members of families or households. A drawback of this approach is
1 For example the Health Behaviour in School-aged Children (HBSC) survey, the Kidscreen initiative and
the Young Lives study

Children’s Worlds Report, 2015
5
that children’s status becomes defined by their household or family status and this may not
reflect their personal experience. For example, a household may be defined as ‘not in poverty’
on the basis of household income, but a child in that household may still experience material
deprivation depending on the spending choices that adults in the household make. It has been
argued for some time2 that children should be a ‘unit of observation’ in social accounting. As
we will see in Chapter 3 this issue has become particularly pertinent in some countries where
substantial minorities of children no longer live in a single household.
In line with the above, a third consideration was that we wanted to gather information directly
from children about their views and experiences. As well as recognising children as social
actors this approach is very much in line with the spirit of the UN Convention on the Rights of
the Child and the importance it places on providing opportunities for children to express their
views, listening to these views and taking them seriously.
Fourth, we were interested in exploring the fullest possible range of topics, ensuring that we
included topics that children themselves felt were important. To this end the early stages of
development of the project included extensive piloting and discussion with children about the
questionnaire content. This consideration also led us to want to focus on positive and
evaluative indicators rather on indicators based on problems and behaviours.
Finally, we wished to explore the concept of children’s subjective well-being. There has been a
remarkable growth in interest internationally in the topic of subjective well-being over the last
few decades. There is now a substantial research evidence base on this topic in relation to
adults, and the issue of subjective well-being has attracted the interest of governments and
policy organisations3. In comparison the study of children’s subjective well-being has lagged
behind. In recent years there have been a number of studies within specific countries, including
some done by members of the core group for the Children’s Worlds project itself4. There is also
some subjective data available for the Health Behaviour in School-aged Children survey, which
has been used in two of the UNICEF Report Cards5 and in two recent journal articles6. However
international comparative data on children’s subjective well-being across the full range of
relevant aspects of their lives has not been available prior to the study described in this report.
The term ‘well-being’ is used in many different ways in different contexts and so it seems
necessary to provide some clarity about the particular conceptualisation of well-being that we
have adopted for the Children’s Worlds project. First of all, our approach to well-being is
entirely focused on self-report information gathered from children – i.e. self-reported well-
being. We recognise that the well-being concept can encompass a much wider range of
information such as social indicators. We have attempted to clarify this specific focus in, for
example, the title of this report. Second, even within the delimited field of self-reported well-
being there are many different ideas and conceptual frameworks. For this phase of the project
we have been interested to explore one of the most common frameworks which divides self-
reported well-being into three components – cognitive subjective well-being, affective subjective
well-being and psychological well-being. We discuss this framework in a little more detail in
Chapter 4. The questionnaires contained some questions designed to tap into each of these
2 e.g. Qvortrup (1997) 3 e.g. Stiglitz, Sen & Fitoussi (2009); OECD (2013); Evans et al (2015) 4 e.g. Hurrelmann & Andresen (2010); The Children’s Society (2014); UNICEF Spain (2012) 5 UNICEF Office of Research (2007) and (2013) 6 Bradshaw et al. (2013); Klocke et al. (2014)

Children’s Worlds Report, 2015
6
concepts. We plan in the future to do analytical work, using this data, to test out (possibly for
the first time) this three-component framework for children in a comparative international
context. However, this report primarily focuses (apart from a small amount of material in
Chapter 4) on cognitive subjective well-being (children’s evaluations of their lives) which is the
most widely-explored of the three components in research on adult and child self-reported
well-being. Our understanding of cognitive subjective well-being is that it incorporates
evaluations of life as a whole and also of particular aspects or domains of life. The structure of
the questionnaires and this report are based on one way of delineating different relevant
domains of children’s lives based on our own previous research and other research literature.
This is discussed further in the introductions to Chapter 4 and Chapter 14. However we view
this is as ‘work in progress’ and hope to test, develop and refine this framework through
ongoing analysis of the data gathered in this wave of the survey.
The overall conceptual framework described so far in this section is in keeping with some of the
shifts in focus in the field of study of child well-being identified by Ben-Arieh (2008) – (a) from
survival to well-being; (b) from negative aspects to positive ones; (c) from well-becoming to
well-being; and (d) from traditional indicators to new child-centred domains.
Within this overall framework, the specific current focus of the Children’s Worlds project is on
middle childhood – that is, the ages of 8 years old to 12 years old inclusive. The rationale for
this focus is that this is an age group which has been relatively neglected by existing research
into children and young people which has tended to concentrate either on early childhood or on
adolescence.
History of the Children’s Worlds project
Initiation and early development
The project began in 2009 when a group of researchers, mainly from the International Society
for Child Indicators (ISCI), held a meeting hosted by UNICEF Regional Office for the CEECIS to
discuss the potential need for the survey. The group agreed that such a survey would fill an
important gap in knowledge internationally about children’s lives. One of the products of the
meeting was an early version of a survey questionnaire which was based on a combination of
the participants’ existing research on this topic area. This first draft questionnaire was tested
and piloted in the summer and autumn of 2010 in six countries7.
In December 2010, the findings of these pilot surveys were presented and discussed at a
meeting hosted by World Vision, Germany and this led to a second draft version of the
questionnaire which was then piloted in the first half of 2011 in five countries8.
The pilot survey
In October 2011, members of the research group reviewed the learning from the second pilot
and drew up a third set of the survey questionnaires with separate versions for children aged 8,
10 and 12 years old. These questionnaires were then used in a range of 14 countries9 for a large-
scale deep pilot of the survey. Over 34,000 children participated in this wave of the survey. The
data was gathered into an international database and some preliminary findings were presented
7 Brazil, England, Germany, Honduras, Israel, Spain. 8 Germany, Romania, South Africa, Spain and Turkey. 9 Algeria, Canada, Chile, England, Israel, Nepal, Romania, Rwanda, South Africa, South Korea, Spain,
Uganda, United States.

Children’s Worlds Report, 2015
7
for peer review at a meeting hosted by UNICEF Innocenti Research Centre in Florence in
November 2012 and at the ISCI conference in Seoul in May 2013. Data from the pilot wave was
used as the basis for a series of articles published in a special issue of Child Indicators Research
in early 201510.
The current survey
The pilot survey was reviewed and learning from this review was used to refine the
questionnaires, leading to three versions of the questionnaire for different age groups that have
been used in the current wave of the survey.
The current wave of the project is funded by the Jacobs Foundation and consists of a survey of
children aged 8 to 12 which has so far been completed by just over 53,000 children in 15
countries. The survey is currently under way in a further five countries. A complete listing of
the countries is shown in the table on the next page. In some countries, the survey covered the
whole country while in other countries the survey covered a specific region. Further details are
provided in Chapter 2, which also provides a description of survey methodology.
Selection of countries for the current survey The selection of countries to participate in the current wave of the survey was based on a
thorough and contextually-driven process. As one of the goals of this project is to study
children’s well-being within different contexts we took existing conceptual frameworks11 and
relevant data (e.g. the Human Development Index) into consideration in selecting the sample as
our intention was to include as diverse a range of countries across as many continents as
possible. Finally we also took into account the potential value of including countries with
different primary religious faiths.
Based on all of the above considerations, we selected the sample as follows. First, based on the
Esping-Andersen typology and its extensions, we selected one social-democratic country
(Norway); one conservative country (Germany); one western Mediterranean country (Spain);
one liberal country (UK (England)) and one Asian, productivist welfare state (South Korea). We
further included two eastern Mediterranean countries (Turkey and Israel); two eastern
European countries (Estonia and Romania) which are in process of transformation into a
welfare state, but at a somewhat different pace and with different demographics and finally we
chose four countries (Algeria, Colombia, Ethiopia and Nepal) that were not yet included in any
welfare regime typology. In making these selections we also ensured a geographical distribution
with countries from different parts of Europe, Africa, Latin America, Asia and the Middle East.
Subsequently, in addition to these 13 countries funded by the grant from the Jacobs Foundation,
two additional countries – South Africa and Poland – also joined and completed the survey in
time for their data to be included in this report.
The survey is currently under way in a further five countries and, in the future, it will be
possible to include data from these additional countries in the international data set.
10 Child Indicators Research, 8, 1, 227-241 11 Esping-Andersen (1990) and more recent related literature – e.g. Arts & Gelissen (2002); Ajzenstadt and
Gal (2010)

Children’s Worlds Report, 2015
8
Table 1: Countries participating in the current wave of the survey
Survey completed Survey in progress
Algeria Israel South Africa Argentina
Colombia Nepal South Korea Italy
Estonia Norway Spain Malta
Ethiopia Poland Turkey Portugal
Germany Romania UK (England) UK (Wales)
In summary, then, the original sample of participating countries is highly diverse and will
enable us to address a wide range of broad questions of interest, as well as exploring whether
this kind of research using standard measures is useful across such a variety of countries. This
diversity needs to be taken into account in contextualising and interpreting the findings
presented in this report (see further discussion in next section).
This report
Purpose
The purpose of this report is to provide an introduction to the data gathered through the survey
and to present some primarily descriptive analysis focusing on age, gender and country
differences. We have sought to present the information in an accessible format for a range of
audiences and have limited the amount of technical research information. More detailed
additional technical information on relevant issues is available via the project website.
As explained in Chapter 2 there were substantial differences between the questionnaire for the
youngest age group (around 8 years old) and the older two age groups (around 10 and 12 years
old respectively). Due to considerations about the length and complexity of the report, it was
decided to produce this initial report using only the data for the older two age groups. A report
on the 8-years-old survey will be published later in 2015.
With such a large data set containing many variables there is clearly a huge amount of potential
for detailed and extensive analysis. Some of this analysis will be undertaken over the next 12
months by researchers who have been part of the project, and will include the publication of a
series of working papers on the project website as well as articles submitted for publication in
peer-reviewed journals. From mid-2016 the data will also be made freely available to other
interested researchers who wish to conduct analysis.
Strengths, limitations and challenges
Attempts to undertake comparative cross-national and cross-cultural research face many
challenges. In the case of the Children’s Worlds project the diversity of the countries
participating in the project is in many ways a strength – generating a unique set of data. In
addition, the project has other strengths in terms of the size of the data set and the approaches
taken to piloting, sample design and ethics as described in Chapter 2. On the other hand the
diversity of the sample of countries also raises substantial issues to consider both in terms of
methodological and analytical approaches.
An initial challenge for all research on children’s subjective well-being is to ensure that the
measures being used are reliable, valid and relevant to children. This requirement becomes

Children’s Worlds Report, 2015
9
more complex in a cross-national and cross-cultural context where it is necessary to examine
carefully the functioning of measures which have been translated into different languages and
asked of children in a wide variety of circumstances. Some initial analysis undertaken with the
pilot data using confirmatory factor analysis12 suggests that the psychometric scales used in the
study to measure overall cognitive subjective well-being13 were functioning adequately to be
used for analysis within each country and to make between-country comparisons based on
correlations and regressions. However they did not meet the stricter statistical requirements for
comparing mean scores between countries. This issue needs to be borne in mind when
considering the findings presented in this report.
A second challenge is the possibility of cultural variations in response patterns to questions.
This issue has been recognised for some time in the study of adults’ subjective well-being14.
There is evidence that respondents in different countries tend to be more or less likely to select
specific response points on the scale – particularly the end and mid-points. There has been
relatively little exploration of this issue in relation to children, although it has been recognised
in recent literature15 and an analysis of the pilot survey16 suggested that it may also be relevant
in the case of children’s reports of their subjective well-being.
So to tackle the issue within an international comparative context, we have also used an
alternative approach which takes into account both the response patterns within a specific
country and the overall tendency for an aspect of life to rank high or low across all countries.
We have calculated what we have termed a ‘relative score’ for each country for questions using
a satisfaction, agreement or frequency format. For example, there were 32 questions using an
11-point satisfaction format (from zero to ten) in the questionnaires. In these cases we have
used the formula shown in Figure 1 to calculate a relative score.
Figure 1: Calculation of relative scores
𝑅𝑒𝑙𝑎𝑡𝑖𝑣𝑒 𝑠𝑐𝑜𝑟𝑒 = 𝑀𝑒𝑎𝑛𝑖𝑗
𝑀𝑒𝑎𝑛𝑖 × (𝑀𝑒𝑎𝑛𝑗 ÷ 𝐺𝑟𝑎𝑛𝑑 𝑚𝑒𝑎𝑛)
Where:
Meanij = Actual mean satisfaction score for aspect i in country j
Meani = Pooled mean satisfaction score for aspect i across all countries
Meanj = Mean satisfaction score for all aspects within country j
Grand mean = Mean of all Meanij
Using this formula the mean of all the resulting scores within a country equals 1, as does the
mean of all scores for a particular aspect. A score of 1.0 means that the satisfaction of children in
a country for an aspect is exactly as would be expected taking into account the mean for this
12 Casas & Rees (2015) 13 These were the Personal Well-Being Index – School children (Cummins & Lau, 2005) and modified and
adapted versions of the Student Life Satisfaction Scale (Huebner, 1991) and Brief Multidimensional
Student Life Satisfaction Scale (Huebner et al, 2006). 14 e.g.Diener et al.(2003); Kim et al. (2012) 15 e.g. Bradshaw (2015) 16 Rees & Dinisman (2015)

Children’s Worlds Report, 2015
10
aspect of life relative to other aspects across countries and also taking into account the overall
response tendency of children in that particular country. Scores above 1 identify aspects where
children in a country are relatively more satisfied than expected. Scores below 1 identify
aspects where children in a country are relatively less satisfied than expected. The intention of
this approach is to provide information about the aspects of life for which children in a
particular country are faring particularly well compared to children in the other countries in the
survey, taking into account differences in response patterns across countries, and aspects which
might be prioritised for improvement in each country.
Finally, a very important challenge for this type of analysis is to avoid overly simplistic
comparisons of indicators between countries and to take account of the different social, political
and economic contexts within each country that form the backdrop to children’s lives. We have
taken three measures to tackle this issue. First, each national research team has provided a
contextual description of children‘s lives within their country and these are included in the
national survey reports which are available on the project website. These descriptions provide a
wealth of information that can be used to contextualise the findings and will be a valuable
resource for ongoing analysis of this data set. Second, we have compiled a comprehensive list
of available relevant indicators for each of the participating countries from international data
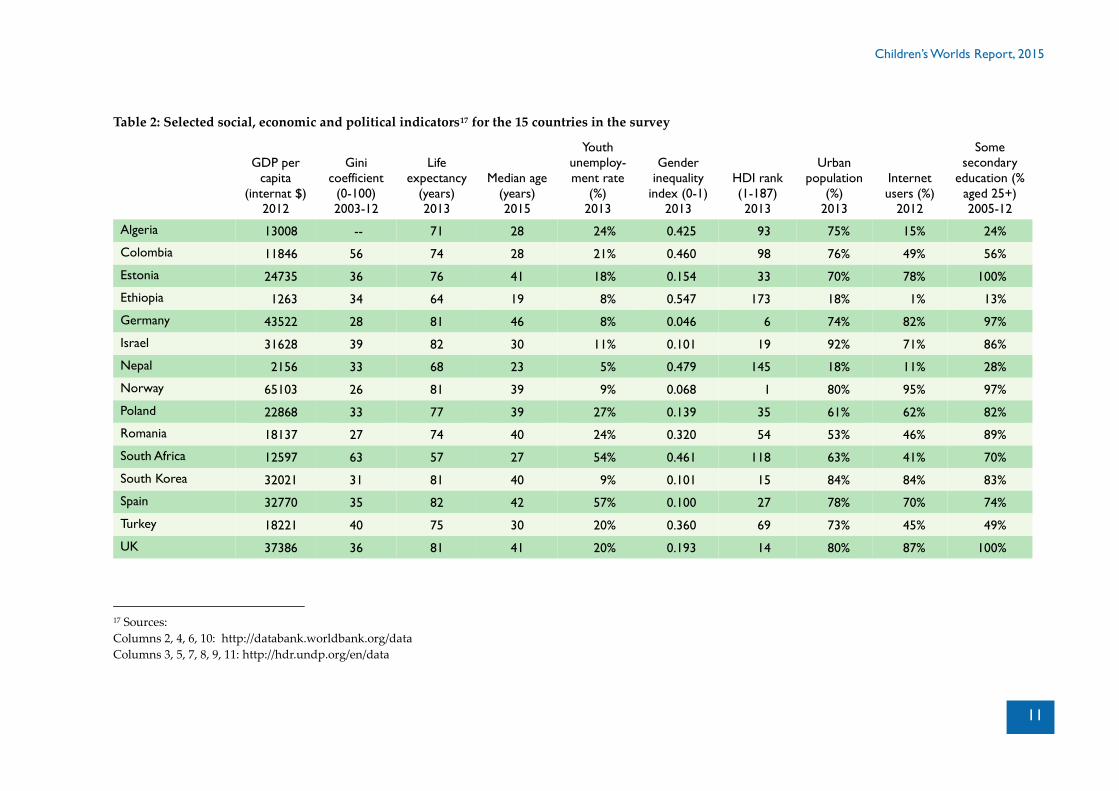
banks. A selection of these indicators is provided in Table 2. We envisage utilising these macro
indicators to undertake and publish analysis of their associations with children’s subjective
well-being. Third, we have included a number of case studies in the findings-based chapters of
the report which seek to contextualise key findings in relation to specific countries. These
measures are just a starting point and we envisage that future analysis of the survey data will
pay close attention to making sense of the observed cross-national variations presented in this
report through consideration of the different contexts within each country.
We have already noted that a limitation of our data is that it only includes children attending
mainstream schools. One further point is that our data is gathered at a single point in time and
therefore has the usual limitations of cross-sectional data in terms of not being able to explore
causal links between different variables and factors, which would require longitudinal data.
Children’s Worlds Report, 2015
11
Table 2: Selected social, economic and political indicators17 for the 15 countries in the survey
GDP per
capita
(internat $)
2012
Gini
coefficient
(0-100)
2003-12
Life
expectancy
(years)
2013
Median age
(years)
2015
Youth
unemploy-
ment rate
(%)
2013
Gender
inequality
index (0-1)
2013
HDI rank
(1-187)
2013
Urban
population
(%)
2013
Internet
users (%)
2012
Some
secondary
education (%
aged 25+)
2005-12
Algeria 13008 -- 71 28 24% 0.425 93 75% 15% 24%
Colombia 11846 56 74 28 21% 0.460 98 76% 49% 56%
Estonia 24735 36 76 41 18% 0.154 33 70% 78% 100%
Ethiopia 1263 34 64 19 8% 0.547 173 18% 1% 13%
Germany 43522 28 81 46 8% 0.046 6 74% 82% 97%
Israel 31628 39 82 30 11% 0.101 19 92% 71% 86%
Nepal 2156 33 68 23 5% 0.479 145 18% 11% 28%
Norway 65103 26 81 39 9% 0.068 1 80% 95% 97%
Poland 22868 33 77 39 27% 0.139 35 61% 62% 82%
Romania 18137 27 74 40 24% 0.320 54 53% 46% 89%
South Africa 12597 63 57 27 54% 0.461 118 63% 41% 70%
South Korea 32021 31 81 40 9% 0.101 15 84% 84% 83%
Spain 32770 35 82 42 57% 0.100 27 78% 70% 74%
Turkey 18221 40 75 30 20% 0.360 69 73% 45% 49%
UK 37386 36 81 41 20% 0.193 14 80% 87% 100%
17 Sources:
Columns 2, 4, 6, 10: http://databank.worldbank.org/data
Columns 3, 5, 7, 8, 9, 11: http://hdr.undp.org/en/data

Children’s Worlds Report, 2015
12
Structure of the remainder of the report
The structure of the remainder of this report is as follows:
Chapter 2 provides further details about the current wave of the survey covering the
questionnaires, sampling, ethics, survey administration, data inputting, cleaning and
weighting.
Chapter 3 begins the presentation of findings from the survey by looking at the data we
have gathered through the survey on the context of children’s lives in the different
countries – summarising children’s responses to fact-based questions about their living
circumstances.
Chapters 4 to 13 then form the main bulk of the report consisting of a series of chapters
on life as a whole and then on different aspects of children’s lives – family and home
life; money; friends and other relationships; local area; school; self; other aspects of life;
children’s rights and time use. Each chapter presents overall findings and also
discusses differences according to age group, gender and country.
The final two chapters of the report draw together the key findings, discuss their
implications, and identify key areas for further analysis of the data.
Accompanying documents
To accompany this initial publication we have prepared a series of national reports. We will
also be producing and ongoing series of technical and working papers. All of these documents
will be freely available on the project website.
Technical note 1: Statistical tests
This is a primarily descriptive introductory report to the data set and does not contain complex
multivariate statistical analysis. However, we have used statistical testing where appropriate in
the analysis which underlies the findings presented. This mainly relates to differences in means
and percentages based on gender and age group. The main tests used were t-tests (for
satisfaction, agreement and frequency questions) and chi-square tests (for questions with
nominal response categories). Where a difference is described as statistically significant this
refers to a p-value of less than 0.01. It is important to clarify therefore that a non-significant
difference does not necessarily imply that there is no difference, but rather that we did not find
sufficient evidence of a difference. Additionally, it should be acknowledged that most of the
variables in the survey were either nominal or ordinal and therefore did not meet all of the
requirements for parametric statistical tests; and that the ordinal variables (e.g. satisfaction
items) were often highly skewed. We will be undertaking further analysis with regard to these
issues and so the age and gender differences described as statistically significant should be
regarded as provisional. All data in this report is weighted to reflect the sampling strategy in
each country and, wherever possible, we have used complex samples tests to ensure that
confidence intervals take into account the design of the samples, including clustering of cases at
the school level.

Children’s Worlds Report, 2015
13
Technical note 2: Variations in age distributions of samples between countries
As explained in Chapter 2, although there were target ages (in years) for the survey, in most
countries there was some variation in the actual age (in years) of children taking part because
the survey was undertaken in school class groups at varying points during the academic year.
Children who were more than two years above or below the target age were excluded from the
final data set. For the remaining children, the mean ages (using age in years) in the 10-years-old
survey ranged from around 9.5 in Israel to around 10.6 in Germany and for the 12-years-old
survey from around 11.4 in Israel to around 12.5 in Germany. This variation in age distributions
countries has some implications for making comparisons between countries, particularly
because there are significant differences in children’s responses between the two age groups for
many aspects of life in at least some of the countries.
It is possible to attempt to correct for this potential age effect by using information about mean
scores within each country for each age group to calculate a corrected mean score. Because
mean scores often drop between the two age groups this means that for countries such as
Germany with an older age profile the age-corrected mean scores may be slightly higher than
the uncorrected ones; while the opposite may be true for countries such as Israel with a younger
age profile.
We tested this approach with some of the mean satisfaction scores presented in this report to
assess how much difference this might make to the overall findings. We found that the age-
corrected mean scores were noticeably different to the uncorrected mean satisfaction scores in
some countries (particularly ones where there were strong variations in satisfaction between the
two age groups). However, these differences did not tend to affect the overall rankings of
countries very much. For example, for the question about satisfaction with life as a whole, there
was no difference in the ranking positions of the highest nine countries or the lowest two
countries, whether one used uncorrected mean scores or age-corrected mean scores. Only two
pairs of countries exchanged places – 10th and 11th, and 12th and 13th respectively.
It would have been possible to calculate age-corrected mean scores and percentages with low
well-being for all the satisfaction questions covered in this report. However we took the
decision not to do this for several reasons. First, it would have been technically difficult (and
would have required additional assumptions) to extend this approach to the agreement and
frequency questions where we have quoted percentages in each response category rather than
means. So there would have been an inconsistency in the way different statistics were
presented. Second, there may be other factors – such as gender – that should also be taken into
account in calculating corrected scores and this kind of approach goes well beyond the scope of
this report. Third, we have restricted ourselves in this initial report to a primarily descriptive
presentation of comparisons between countries, focusing more on rankings than means, and the
testing described in the previous paragraph indicated that the calculation of corrected scores
would not tend to make a huge difference to the broad patterns of rankings between countries
in any case.
However it is important to acknowledge the issue of age variations and to identify the need for
this to be taken into account in the future in more sophisticated multivariate analysis
approaches using the data set – for example, controlling for age variation using regression.

Children’s Worlds Report, 2015
14
Chapter 2
The survey
This chapter provides a broad introduction to the survey methodology – briefly describing
questionnaires, sampling, ethics, survey administration, and data cleaning and weighting. The
discussion here reflects the general principles that were adopted for the survey in all countries.
Given the diversity of countries involved in the research there were additional issues to resolve
within each country and these are covered in the series of national reports which are published
to accompany this comparative report. Further information about various aspects of the survey
methodology is also available on the project website.
Questionnaires There were three versions of the questionnaire for the different age groups – for children
around 8, 10 and 12 years of age respectively. The three questionnaires all covered the following
key aspects of children’s lives:
Overview of the content of the survey
Basic characteristics (age, gender, country of birth)
Living situation, home and family relationships
Money and economic circumstances
Friends and other relationships
Local area
School
Time use
Self
Overall subjective well-being
Children’s rights
The questionnaires for the older two age groups also covered two further topics – recent
changes in children’s lives and qualities aspired to for the future.
On the basis of piloting of questionnaires with children it was decided that it was necessary to
simplify the response formats for some questions for the 8-years-old survey. As explained in
Chapter 1 this initial report only makes use of data gathered in the 10-years-old and 12-years-
old surveys and so the details that follow primarily focus on these two age groups.
The question items fell into four basic types:
1. Fact-based items – e.g. age, gender, household possessions.
2. Agreement items. These consisted of statements (e.g. ‘I feel safe at home’). In most
cases children were asked to respond on a five-point scale labelled ‘I do not agree’,

Children’s Worlds Report, 2015
15
‘Agree a little’, ‘Agree somewhat’, ‘Agree a lot’, ‘Totally agree’. There was also a ‘Don’t
know’ option. Some of the agreement items in the questionnaires for 10-year-olds and
12-year-olds used an 11-point numbered (0 to 10) scale with the end points labelled
‘Not at all agree’ and ‘Totally agree’.
3. Frequency items. These mostly consisted of questions about various aspects of time
use, but also included experiences of bullying and worries about family money. These
items were all on a four-point scale with descriptions of frequencies relevant to the
topic – e.g. ‘Rarely or never’, ‘Less than once a week’, ‘Once or twice a week’, ‘Every
day or almost every day’.
4. Satisfaction items. These consisted of questions about satisfaction with various aspects
of life and with life as a whole. In the versions of the questionnaire for 10-year-olds and
12-year-olds these items all used an 11-point (0 to 10) response scale with the end points
labelled as ‘Not at all satisfied’ and ‘Totally satisfied’.
The lengths of the questionnaire (total number of items to answer) had been determined
through the piloting process described earlier and, as a result the questionnaires contained
fewer items for younger age groups. In total there were 112 items in the questionnaire for 12-
year-olds and 104 items in the questionnaire for 10-year-olds.
Amongst the items described above, the questionnaires contained versions of three previously-
tested psychometric scales of overall subjective well-being. First, there was a context-free scale
intended to measure overall cognitive subjective well-being comprising five items which
formed a short modified version of The Student Life Satisfaction Scale18. Second there were two
scales made up of domain satisfaction items – the seven-item Personal Well-being Index - School
Children19 and a modified version of the five-item Brief Multidimensional Student Life
Satisfaction Scale20. As well as the previously tested scales, we also included two new sets of
items. The first was a set of six items on positive affect which were influenced by Russell‘s Core
Affect scale21 .The second was a set of six items designed to represent various aspects of
psychological well-being based on a framework proposed by Ryff22.
Further details of items and the original question wordings in English are provided in the
relevant chapters of the report alongside the presentation of findings.
A key issue for the project was to try to ensure that the various versions of the questionnaire in
the different languages spoken by children in the participating countries were as compatible as
possible. With this aim, the translation process was as follows. Each country started with the
standard English-language version of the questionnaires. The questionnaires were then
translated into the relevant languages and then, independently of the original translation,
translated back into English. Each back-translated English version was compared with the
original English version and this comparison was used to highlight any discrepancies or issues.
Any identified issues were then resolved through revising the translations as required.
18 Huebner (1991) 19 Cummins & Lau (2005) 20 Huebner et al. (2006) 21 Russell (198) 22 Ryff (1989)

Children’s Worlds Report, 2015
16
Sampling The aim within each country participating in the survey was to obtain the most representative
sample possible of children in the relevant age groups. For practical reasons, it was decided
that the only feasible way of conducting a large-scale survey with the resources available was
through schools. This evidently places a limitation on representativeness as it excludes children
not attending school. Considering the age range covered by the survey, there was compulsory
schooling and high school participation rates in all participating countries, so a school-based
sampling method will include the large majority of children in the age group in each country.
However, it is acknowledged that the survey does not cover some groups of children such as
those who have been excluded from school, children in special educational establishments,
children who are home-schooled and other children who do not attend school for various
reasons. Many of these children may be deemed to be in marginalised groups within the
population and there remains a task for future research to find ways to include these children in
research on children’s lives and well-being.
It should be noted that for practical (resource-based) reasons in seven countries – Algeria,
Colombia, South Africa, Spain, Poland, Turkey and the UK - the sample only included part of
the country. Additionally, in particular, the Turkey sample was unique in only including
children in an urban setting and this factor should be borne in mind in interpreting the results
for that country. Furthermore, in two countries – Germany and Nepal – specific regions or areas
were selected as part of the sampling process. The coverage in each country is shown in Table 3.
Throughout the report, in the tables and charts, we have include an asterisk after the names of
these seven countries in order to provide a reminder that the sample only covers a region of the
country.
Table 3: Sampling coverage in each country
Country Coverage
Algeria Western region
Colombia Antioquia state
Estonia Whole country
Ethiopia Whole country
Germany Whole country (but 4 Federal states selected for sample)
Israel Whole country
Nepal Whole country (but 6 districts in 2 development regions selected for sample)
Norway Whole country
Poland Wielkopolska region
Romania Whole country
South Africa Western Cape province
South Korea Whole country
Spain Catalonia
Turkey Istanbul
United Kingdom England
In order to provide support to national research teams in designing a sampling strategy, and
also to ensure the quality of the samples, a process of reviewing each sampling methodology
was used. Initially each national research team proposed a sampling strategy based on their
knowledge of the country and of the practical issues involved in the survey. These proposals

Children’s Worlds Report, 2015
17
were then reviewed by a panel of researchers (within and outside the project) with expertise in
sampling. Each proposal was reviewed by two members of the panel and feedback was
provided to the national research teams. The national research teams then devised a revised
proposal taking into account the feedback and this was submitted to the panel for final
approval.
In all countries some form of stratification was used. A range of stratification variables were
used in different countries, depending on the specific context, including economic prosperity,
type of school (e.g. private / public) and population density (e.g. urban / rural). More details on
the sampling strategy in each country are contained in the national reports available on the
project website.
Ethics One of the requirements for participation in the project was to gain full ethical clearance from a
relevant committee in one’s own country. A set of broad ethical guidelines for the project were
drawn up including the importance of (a) children having an active and informed choice in
whether to participate in the survey or not; (b) appropriate measures to safeguard children’s
privacy, confidentiality and anonymity; and (c) a commitment to feeding back findings to
participating schools. Each country was expected to draw up an ethics proposal based on these
broad guidelines. Any queries about the ethical approval for a particular country should be
addressed to the contact for that country (see the project website).
There were differences in the requirements for parental consent in different countries. In some
countries active (‘opt-in’) consent was required from parents for children to be able to
participate in the survey. In some countries passive consent was used – i.e. parents were
provided with information and were able to request that their child was not included in the
survey. Finally in some countries no parental consent was sought and the consent of the school
was deemed sufficient. The parental consent requirements in some countries (particularly
where active consent was required) meant that some children in selected schools and class
groups were not able to participate. This has unknown impacts on the constitution of the
sample. At a broader level it also raises issues about children’s rights to make choices and to
have their views heard. Irrespective of the requirements for parental consent it was emphasised
that children’s own consent was a fundamental requirement of participation in the survey.
Administration Administration guidelines were provided to each national research team as part of the initial
information pack. There was some variation in the specific arrangements for administration. In
most countries, researchers from the national research team travelled to schools on the day of
the survey and were involved in administering the survey through paper-based questionnaires.
However in Poland, Spain and the UK some or all of the questionnaires were administered
online via the internet. In the UK, researchers did not visit the school and instead guidelines
were provided to schools staff to administer the survey.
One issue that had emerged in piloting in some countries was that children in the youngest age
group (around 8 years of age) needed additional help to complete the survey. Due to this, some
additional guidance was developed for this age group, which included a ‘training’ sheet to be
used in advance of the survey and the option of teachers or researchers reading the questions

Children’s Worlds Report, 2015
18
aloud while the survey was being conducted. These measures were deemed necessary and
used in a number of countries.
Data inputting and cleaning Data inputting and quality control was the responsibility of each national research team.
Responses to paper questionnaires were input into a standard template in SPSS or Excel format.
The data files were then sent to a central data co-ordinator who ran a number of standard
checks and identified any queries. A report on the data checking was sent to the national
research team including issues that required further checking and a response. Once all queries
had been resolved satisfactorily the data was finalised in preparation for inclusion in the
combined international data set. At this stage, following discussions at a meeting of lead
researchers for each participation country, it was decided to exclude a small proportion of cases
from inclusion in the combined international data set. The criteria for exclusion were as
follows:
1. The child was more than two years older or younger than the target age group.
2. The case contained a high proportion of missing data (more than a quarter of
variables)
3. The case contained evidence of systematic responding to all frequency-based
questions, which raised doubts about the responses provided.
These criteria led to around 3% of cases being excluded from the data sets for the 10 years old
and 12 years old age group and around 6% of cases from the data set for the 8 years old age
group.
The finalised data The final numbers in the data set in each country overall and by age group and the percentage
by gender are shown in Table 5.
It should be noted that, because the survey was undertaken in school classes, there was some
variation around the target age. Cases were retained in the data set if they were within two
years of the target age. Unweighted percentages of children of each age in the final data set of
each survey are shown in Table 4.
Table 4: % of children of different ages (in years) in the final sample by survey version
Age in years
6 7 8 9 10 11 12 13 14
8-years-old survey <0.1% 7.3% 76.7% 14.8% 1.2%
10-years-old survey 0.1% 6.5% 76.4% 15.7% 1.3%
12-years-old survey 1.1% 9.5% 72.3% 15.9% 1.2%
There was also some variation in age profiles between countries, due to the timings when the
survey was conducted within the school year, and different sampling strategies. The
implications of this for some of the analysis presented in this report were discussed in a
technical note in Chapter 1.

Children’s Worlds Report, 2015
19
Table 5: The achieved sample in each country by age group and gender
Country Total
8 years
old
10 years
old
12 years
old Female Male
Algeria (Western) 3676 1244 1149 1283 48% 52%
Colombia (Antioquia) 2816 902 939 975 51% 49%
Estonia 3119 1076 1014 1029 48% 52%
Ethiopia 2877 953 944 980 50% 50%
Germany 3009 1056 1101 852 52% 48%
Israel 2777 886 988 903 52% 48%
Nepal 2953 975 983 995 50% 50%
Norway 2864 930 960 974 53% 47%
Poland (Wielkopolska) 3157 1021 1119 1017 48% 52%
Romania 4115 1249 1359 1507 48% 52%
South Africa (W Cape) 3188 996 1061 1131 52% 48%
South Korea 7467 2432 2438 2597 52% 48%
Spain (Catalonia) 3801 1032 1057 1712 48% 52%
Turkey (Istanbul) 3024 959 1047 1018 52% 48%
UK (England) 3298 990 989 1319 50% 50%
Total 53164 17259 17613 18292 50% 50%
Unweighted sample, after data cleaning
Weighting Once the final data set for each country had been agreed, a process was then undertaken to
weight the final sample, taking into account the sampling strategy employed in that country.
Weightings were calculated to correct for:
a) variations in the probabilities of children being selected due to the sampling strategy –
for example, the planned sample size for some sub-groups may have been higher or
lower than their representation within the child population;
b) variations in the probabilities of children being selected for the sample due to the
sampling selection process (e.g. if schools were selected with equal probability and one
class group was randomly selected per school, then children in smaller schools with
fewer class groups had a higher probability of being included in the survey than
children in larger schools with more class groups);
c) differences between intended sample size and achieved sample size due to non-
participation and non-response of some children in selected class groups – for example
due to children not attending on the day of the survey or parental consent not being
obtained in in some countries.
Weightings were calculated on the basis of the planned sampling strategy, the achieved sample
and available data on the child population from which the sample was drawn. Final weightings
were discussed and agreed between the central data co-ordinator and each national research
team. The weighting coefficients were calculated so that the final weighted sample size was
identical to the unweighted sample size.

Children’s Worlds Report, 2015
20
All findings in this report use weighted data. In addition, where pooled findings are presented
for the whole sample then each country is weighted equally (to control for differences in
achieved sample size between countries).
Presentation of statistics Please note that in tables and figures where percentages are shown these have usually been
rounded and so total percentages may not add up to exactly 100%.

Children’s Worlds Report, 2015
21
Chapter 3
The context of children’s lives
In this chapter we provide some purely descriptive data on the lives of the children
participating in the survey in the 15 countries. This includes questions about household
structure and living arrangements; economic and material indicators; and the country of origin
of the child.
This information provides an important context to many of the findings presented later in the
report. For example, the chapter on time use includes data on how frequently children in each
country spent time using computers or watching television. The findings presented there need
to be viewed within the context of variations in the presence of these items within the home by
children in the different countries.
Who children live with The questionnaires for 10-year-olds and 12-year-olds contained a number of questions about
children’s living arrangements and the people that they lived with, as shown in the box on the
next page.
Analysing and interpreting this data in a cross-national context raises some important
challenges. Typologies of family forms that are recognised and salient in one national context
may not have the same resonance or applicability in another. A comprehensive analysis of the
data will therefore require careful consideration of different social and cultural contexts and this
is a task for future work. In this report we do not attempt to construct ‘family forms’ from the
data but instead restrict ourselves to a descriptive account of the responses to the different
questions and response options. Despite this restriction on the analysis some interesting
patterns are evident which provide an important contextual background to children’s lives in
the diverse set of countries participating in the survey.
Figure 2 shows the proportion of responses in each country to the first question about where
children stayed or slept at night. Overall, 60% of children reported always sleeping in the same
home, 35% sometimes slept in different homes, and just under 6% regularly slept in different
homes. There were marked differences between countries. The proportion of children always
sleeping in the same home ranged from 82% in Ethiopia to 23% in Norway; and the proportion
reporting regularly sleeping in two homes ranged from less than 1% in Ethiopia to 18% in
Norway. The lowest proportions of children living in only one home tended to be in European
countries. However the experience of regularly living in two homes is not restricted to Europe.
The chart shows the percentages for all countries where more than 1 in 20 (5%) of children lived
in two homes and this includes Colombia, South Africa and Israel.

Children’s Worlds Report, 2015
22
Box 1: Questions about living arrangements and people lived with
Some children usually sleep in the same home every night. Other children sometimes or often
sleep in different homes. Please choose which of the following sentences best describes you:
I always sleep in the same home
I usually sleep in the same home, but sometimes sleep in other places (for example a friends
or a weekend house)
I regularly sleep in two homes with different adults
Which of the following best describes the home you live in most of the time?
I live with my family
I live in a foster home
I live in a children’s home
I live in another type of home
This question is about the people you live with. Please tick all of the people who live in your home.
Mother
Father
Mother’s partner
Father’s partner
Grandmother
Grandfather
Brothers and sisters
Other children
Other adults
Note: There were some variations in the presentation of these questions between countries:
1. In most countries the third question above was asked twice if children indicated in the first
question that they stayed in more than one home. Some countries omitted repeating this
list as the issue of living in two homes was not deemed to be relevant to sufficient numbers
of children. These countries were: Ethiopia, Israel, Poland, Romania, South Korea and South
Africa.
2. In Nepal the options relating to parents’ partners were omitted for all children, while in
Israel these questions were omitted for some sub-groups.
3. In some countries the fourth option (‘I live in another type of home’) for the second
question was not deemed necessary and was omitted.
In terms of the second question about the type of home that children lived in, the large majority
of children in all countries said that they lived with their family. The highest proportion (just
over 5%) not living with family was in Ethiopia where around 5% of children living in foster
homes. In all other countries more than 95% of children lived with family.

Children’s Worlds Report, 2015
23
Figure 2: Where children slept by country
10 and 12 year old surveys, all countries, equally weighted by age group
The two charts in Figure 3 show the proportion of children who lived with their mother and
father respectively.
Well over 95% of children lived with their mothers. This includes, in some countries, a small
percentage of cases where children slept regularly in two homes and their mother lived in the
home they defined as their second home. The countries with the lowest proportion of children
living with their mother were South Africa (91%) and Ethiopia (92%).
The large majority of children also lived with their father. However there was more variability
here with the proportions ranging from 63% in Colombia to 95% in Israel. Of course the
variations in proportions living with both parents may be explained by phenomena such as
parents living in other places or countries in order to do paid work as well as by the birth
parents splitting up. Furthermore the decision about whether to count fathers in second homes
makes a substantial difference in some countries as can be seen for Norway, UK and Spain
where 11%, 10% and 6% of children respectively stay with their father regularly in a second
home.
12%
9%
6%
18%
6%
6%
11%
6%
0% 20% 40% 60% 80% 100%
UK*
Turkey*
Spain*
S Korea
S Africa*
Romania
Poland*
Norway
Nepal
Israel
Germany
Ethiopia
Estonia
Colombia*
Algeria*
Always in same home Usually in same home Regularly in two homes

Children’s Worlds Report, 2015
24
Figure 3: Proportion of children living with their mother and their father by country
10 and 12 year old surveys, all countries, equally weighted by age group
The left hand chart in Figure 4 shows the proportion of children living with one or more
grandparents in their first or only home. This is usually in addition to one or both parents
although a small minority of children in most countries lived with grandparents and not with
either of their parents. Here there are very wide variations. In particular, well over half of
children (61%) in Nepal lived with at least one of their grandparents. This is a much higher
proportion than the next two countries in the chart – South Africa and Romania (each 35%). In
three countries – England, Norway and Israel – less than one in ten children had a grandparent
living in the same home as them. Clearly these kinds of variations in living contexts are likely
to have a bearing on children’s family relationships and attachments.
There was also substantial variation in the proportion of children having one or more siblings
living in their first or only home – ranging from 68% in Romania to 91% in Israel. Presumably
these differences are linked to variations in average and typical family sizes in these countries.
0% 50% 100%
UK*
Turkey*
Spain*
S Korea
S Africa*
Romania
Poland*
Norway
Nepal
Israel
Germany
Ethiopia
Estonia
Colombia*
Algeria*
Lives with mother
First home Second home
0% 50% 100%
UK*
Turkey*
Spain*
S Korea
S Africa*
Romania
Poland*
Norway
Nepal
Israel
Germany
Ethiopia
Estonia
Colombia*
Algeria*
Lives with father
First home Second home

Children’s Worlds Report, 2015
25
Figure 4: Proportion of children living with grandparents and siblings in their first home by
country
10 and 12 year old surveys, all countries, equally weighted by age group
Economic circumstances In this chapter we present descriptive findings relating to factual questions that children were
asked about their own and their family’s economic situation. Evaluative questions about this
aspect of life are discussed in Chapter 5.
The Children’s Worlds study covered a diverse range of countries, in terms not only of society
and culture, but also national wealth. Developing a set of material well-being indicators which
are specific and meaningful to children in this context, and which do not impose cultural bias,
proves challenging. Specific material possessions which are almost universal in some countries
are accessible only to the very wealthiest in others; and material possessions and provisions
may have different meanings in different cultural contexts which not only influence their
accessibility, but also their desirability. Here results are presented for the range of indicators
included; however these should be interpreted with attention to national and cultural context.
Children were asked a series of questions about the resources to which they had access, about
the number of adults in the household in paid work and also two questions about pocket
money (12 year old survey only) as shown below.
5%
6%
7%
10%
13%
16%
19%
22%
23%
26%
26%
33%
35%
35%
61%
0% 20% 40% 60% 80% 100%
UK*
Norway
Israel
Spain*
S Korea
Germany
Turkey*
Ethiopia
Estonia
Colombia*
Algeria*
Poland*
Romania
S Africa*
Nepal
Lives with grandparent(s)
68%
69%
72%
72%
77%
78%
78%
83%
85%
85%
85%
86%
86%
86%
91%
0% 20% 40% 60% 80% 100%
Romania
Colombia*
Estonia
Poland*
Germany
S Africa*
Spain*
UK*
S Korea
Norway
Nepal
Turkey*
Ethiopia
Algeria*
Israel
Lives with sibling(s)

Children’s Worlds Report, 2015
26
Box 2: Fact-based questions about economic circumstances
Which of the following things do or don’t you have?
Clothes in good condition to go to school in
Access to a computer at home
Access to the internet
A mobile phone
Your own room
Books to read for fun
A family car for transportation
Your own stuff to listen to music
A television at home that you can use
Response options were ‘Yes’, ‘No’ and ‘Don’t know’. ‘Don’t know’ responses were treated as
missing data.
The final item about television was not asked in Estonia, Germany and Poland.
The four questions about electrical and technology items were not asked of some sub-groups of
children in Israel.
How many adults that you live with have a paid job? (12 years old survey only)
Response options were ‘None’, ‘One’ and ‘Two’, ‘More than two’ and ‘Don’t know’. ‘Don’t know’
responses were treated as missing data.
How often do you get pocket money? (12 year old survey only)
I don’t get pocket money
I get pocket money, but not regularly
I get pocket money every week
I get pocket money every month
If one of the last two options was chosen, children were also asked approximately how much
pocket money they received every week or month. This data is not analysed in this report due
to the complexity of comparing amounts of money in different currencies and contexts.
However it will be available for researchers to analyse in the future.
Table 6 shows the proportion of children who said that they lacked access to each item in the list
above. For all items there was a significant difference between countries in the proportion of
children lacking, with the strongest difference for access to the internet. In each case, children
in Ethiopia were most likely to lack items, while children in Norway were least likely to lack
them. In many cases, so few children lacked items that estimates may not be reliable.

Children’s Worlds Report, 2015
27
Table 6: Percentage of children lacking access to material items by country
Good
clothes
Comp-
uter Internet
Mobile
phone
Own
room Books
Family
car
Music
player TV
Algeria* 3% 47% 56% 61% 62% 28% 42% 55% 24%
Colombia* 1% 22% 25% 23% 39% 29% 64% 42% 4%
UK* <0.5% 6% 3% 16% 17% 10% 11% 5% 1%
Estonia 1% 3% 2% 4% 28% 4% 14% 12% n/a
Ethiopia 18% 97% 98% 86% 86% 64% 98% 83% 73%
Germany 2% 16% 9% 8% 11% 21% 7% 5% n/a
Israel 1% 6% 6% 20% 30% 7% 8% 19% 3%
Nepal 3% 87% 93% 24% 41% 30% 93% 46% 31%
Norway <0.5% 2% 1% 3% 7% 3% 3% 1% <0.5%
Poland* 1% 2% 4% 5% 8% 14% 11% 10% n/a
Romania 1% 14% 20% 18% 36% 12% 41% 13% 3%
S Africa* 3% 38% 40% 27% 42% 18% 28% 29% 4%
S Korea 1% 4% 3% 10% 11% 4% 7% 10% 4%
Spain* 2% 6% 7% 45% 19% 10% 13% 14% 2%
Turkey* 5% 18% 23% 60% 33% 10% 43% 43% 3%
10 and 12 year old surveys, all countries, equally weighted by age group
Differences were found based on age group in the pooled sample for seven of the nine items.
10-year-olds were more likely to lack six of these: a computer, internet, a mobile phone, their
own room, stuff to play music, and a TV. 12-year-olds were more likely to lack books to read
for fun. Age-related differences (some statistically significant) at the country level tended to
follow this overall pattern.
In the pooled data set differences in the proportions of girls and boys lacking items were found
for computers, their own room and their own stuff to listen to music (girls were more likely to
lack these), and books to read for fun (boys were more likely to lack these). The strongest
differences were for the statement having books to read for fun, lacked by 44% of girls and 56%
of boys. As with age group these patterns were broadly reflected in gender variations within
countries, although many of the country-level differences were not statistically significant.
Individual items can be combined to provide a summary of the material well-being of children
across and within the different participating countries. Because some countries did not ask
about access to a television, this item has been omitted from the scale in this international report
(but may be used in individual countries). Using the pooled data, children lacked on average
1.9 of the items. This masks strong variations between countries with the mean number of
items lacked ranging from 0.2 in Norway to 6.3 in Ethiopia as shown in Figure 5.
Inequality between children within countries in their access to resources also provides an
interesting source of information on material well-being within and between countries.
Standard deviations in the number of items children lacked ranged from 2.0 in Algeria,
indicating the highest level of inequality between children, and 0.5 in Norway, indicating the
lowest level. Interestingly, children in Ethiopia who experienced the highest comparative levels
of deprivation were around the middle in terms of levels of inequality. Results are shown in
Figure 6.

Children’s Worlds Report, 2015
28
Figure 5: Mean number of items lacked by country
10 and 12 year old surveys, all countries, equally weighted by age group
Figure 6: Inequalities in access to material items by country
10 and 12 year old surveys, all countries, equally weighted by age group
6.3
4.2
3.6
2.4
2.3
2.3
1.5
1.1
0.9
0.8
0.7
0.7
0.5
0.5
0.2
0 1 2 3 4 5 6 7 8
Ethiopia
Nepal
Algeria*
Colombia*
Turkey*
S Africa*
Romania
Spain*
Israel
Germany
Estonia
UK*
Poland*
S Korea
Norway
Number of items lacked
2.0
1.9
1.8
1.7
1.6
1.4
1.3
1.2
1.1
1.0
1.0
1.0
1.0
0.9
0.5
0.0 0.5 1.0 1.5 2.0 2.5
Algeria*
S Africa*
Colombia*
Turkey*
Romania
Nepal
Ethiopia
Israel
Spain*
S Korea
Germany
Poland*
UK*
Estonia
Norway
Inequalities in access to items (standard deviations)

Children’s Worlds Report, 2015
29
Responses to the question about the number of adults in the household in paid work in the 12-
years-old survey are shown in the chart below. There was substantial variation here.
In two countries – Algeria and Ethiopia – more than 10% of children lived in homes
without any adults in paid work.
In Algeria, Ethiopia, Nepal and Turkey it was most common for one adult to be in paid
work.
In the remaining 11 countries the most common pattern was for two adults to be in paid
work (highest in Norway where 73% of children lived in a household(s) with two adults
doing paid work)
The high percentage of households with more than two adults in paid work in South
Africa (37%) is notable. See context box on next page for further discussion.
Figure 7: Number of adults in household in paid work by country
12 year old survey, all countries
0% 10% 20% 30% 40% 50% 60% 70% 80% 90% 100%
UK*
Turkey*
Spain*
S Korea
S Africa*
Romania
Poland*
Norway
Nepal
Israel
Germany
Ethiopia
Estonia
Colombia*
Algeria*
None One Two More than two

Children’s Worlds Report, 2015
30
Context 1
Country: South Africa
Establishing the diverse meanings of different types of factual information about children’s living
situations proved complex, among such a diverse range of countries with differing social and
cultural norms. As an example, we found that in South Africa, an unusually large number of
children reported living in households with more than two adults in paid work. The presence of
multiple adults in paid work has been used in western studies to indicate higher socio-economic
status, but in these situations it is unusual for children to be living in households with more than
two adults. In contrast, in South Africa the presence of more than two adults in a child’s
household is not unusual, especially in lower-income areas. This can have multiple causes,
including the need to pool resources among larger households to meet needs through
economies of scale; family breakdown leading to parents moving in with their own parents;
poverty among older people leading to them moving in with grandchildren; and housing shortages
which result in extended families living together. However, in low income communities, these jobs
are either low paying semi-permanent, part-time, or located in the informal sector. Additionally,
cultural influences impact household structure. The traditional black South African concept of
ubuntu denotes a sense of community, incorporating communal responsibility for child rearing,
which can be helpful in understanding that wider communities and networks may form part of a
child’s household. That is, the notion of family and ‘normal’ household structure varies markedly
among participating countries, and the ‘nuclear family’ incorporating parents and dependent
children is a western concept which cannot necessarily be applied to non-western contexts.
Significant differences were found between countries in the patterns of children received pocket
money. The proportions of children receiving no pocket money ranged from 5% in Romania to
40% in Ethiopia. Differences in the proportions of children receiving no pocket money are
shown in Figure 8.
It is also evident that there are differences in the patterns of children receiving pocket money
between countries – for example while similar proportions of children in Germany (90%), South
Africa (90%) and Colombia (89%) receive pocket money, in Germany the majority of children
receive pocket money each month, while in Colombia the majority receive it irregularly.
Children in South Africa who receive pocket money are close to equally distributed between
receiving it irregularly, weekly, and monthly.

Children’s Worlds Report, 2015
31
Figure 8: Frequency of receiving pocket money by country
12 year old survey, all countries
Country of origin Finally in this chapter, we briefly present data in response to a question about whether the child
was born in the country of the survey. More than one in 20 children (>5%) were born outside
the country in four of the European countries in the survey – Spain, UK, Norway and Germany.
0% 20% 40% 60% 80% 100%
Turkey*
Spain*
S Korea
S Africa*
Romania
Poland*
Norway
Nepal
Israel
Germany
Ethiopia
Estonia
UK*
Colombia*
Algeria*
None Irregular Weekly Monthly

Children’s Worlds Report, 2015
32
Figure 9: Percentage of children not born in the country of the survey by country
Summary and discussion This chapter has provided a description of aspects of the context of children’s lives based on the
information gathered from children in the survey.
The large majority of children in all countries lived with their family, but within this broad
description there are wide variations in household composition and living arrangements. In
some countries (Nepal, Romania, South Africa and Poland) a third or more of children lived in
three-generation households with one or more parents and one or more grandparents. In some
countries – particularly Norway, the UK and Estonia – more than one in ten children regularly
lived in two different homes, usually with one birth parent in each home. There is potential for
further analysis to map the diversity of children’s living circumstances across the 15 countries in
the survey.
The survey also shows the range of material circumstances in which children live. In some
countries, children typically have access to a much wider range of items and resources than
others. The variations in children’s ability to access the internet – ranging from 99% in Norway
to 2% in Ethiopia – for example, are likely to be linked to substantial cross-national differences
in how children spend their time and interact socially, and these factors might usefully be borne
in mind when considering the findings presented in later chapters on friendships and time use.
Given the diversity of the sample of countries included in the survey it is not surprising that this
descriptive analysis highlights substantial variations between countries. These variations
provide important background information for the findings presented in the chapters that
follow. This information also offers opportunities for future analysis of the data set to explore
the extent to which children’s subjective well-being varying according to contextual factors
within and between countries.
17%
8%
8%
5%
3%
3%
3%
3%
1%
1%
1%
1%
1%
1%
0%
0% 5% 10% 15% 20% 25% 30%
Spain*
UK*
Norway
Germany
Estonia
Israel
Romania
Nepal
Colombia*
Algeria*
Turkey*
S Korea
Poland*
S Africa*
Ethiopia

Children’s Worlds Report, 2015
33
Chapter 4
Life as a whole
Overview There is a growing body of research on people’s self-reported well-being – that is, their
evaluations of, and feelings about, their lives. Although the research literature contains
numerous different ideas and measures of self-reported well-being, it commonly includes three
core concepts23:
1. Cognitive subjective well-being which is concerned with people’s evaluations of their
lives as a whole, or in particular domains
2. Affective subjective well-being which relates to people’s moods and feelings
3. Psychological well-being which focuses on the extent to which people feel their basic
psychological needs are met and their sense of flourishing
There has been a substantial amount of research validating and utilising this conceptual
framework with adults, particularly in the US, and also in other Western industrialised
countries. However it is less certain how well the framework fits other cultural contexts, or the
extent to which it is applicable to children.
The Children’s Worlds survey questionnaire included measures designed to relate to all three of
these concepts (see box on the next page), with the intention that the data set will enable
researchers to test out the applicability of the concepts to children, cross-nationally and cross-
culturally. The detailed analysis required to test out these frameworks will be a task for future
work using the Children’s Worlds data. In this chapter we consider three example questions
representing each of the three components discussed above:
satisfaction with life as a whole (cognitive subjective well-being)
frequency of feeling happy in the past two week (affective subjective well-being)
feeling positive about the future (psychological well-being)
We look at how children’s responses to each of these three questions varies according to country,
age and gender and establish some of the methods of comparison that are utilised in the topic-
based chapters that follow.
23 See, for example, Samman (2007); Deci & Ryan (2008); Linley et al.(2009)

Children’s Worlds Report, 2015
34
Box 3: Questions about overall well-being
Cognitive subjective well-being
Single item
How satisfied are you with your life as a whole?
Response options were on an 11-point scale from ‘Not at all satisfied’ to ‘Totally satisfied’
Multi-item24
Here are five sentences about how you feel about your life as a whole. Please tick a box to say how
much you agree with each of the sentences
My life is going well
My life is just right
I have a good life
I have what I want in life
The things in my life are excellent
Response options were on an 11-point scale from ‘Not at all agree’ to ‘Totally agree’
Affective subjective well-being
Multi-item25
Below is a list of words that describe different feelings and emotions. Please read each word and
then tick a box to say how much you have felt this way during the last two weeks
Happy
Satisfied
Relaxed
Active
Calm
Full of energy
Response options were on an 11-point scale from ‘Not at all’ to ‘Extremely’
Psychological well-being
Multi-item26
Please say how much you agree with each of the sentences:
I like being the way I am
I am good at managing my daily responsibilities
People are generally pretty friendly towards me
I have enough choice about how I spend my time
I feel that I’m learning a lot at the moment
I feel like I know where my life is going
I feel positive about my future
Response options were on an 11-point scale from ‘Not at all agree’ to ‘Totally agree’
This set of questions was not asked in Israel
24 This set of questions is derived from the Student Life Satisfaction Scale (Huebner, 1991). The first four
items are taken directly from that scale and the fifth is an additional item being tested for the first time . 25 This set of questions is based on ideas from Russell’s work on ‘core affect’ (Russell, 1980). The items were
selected with the age group and cross-national nature of the survey in mind. It was decided in this survey
only to focus on positive affect so there are no items relating to negative affect. 26 This set of items covers the six components of psychological well-being proposed by Ryff (1989). The
final two items are alternative options for the component relating to ‘purpose in life’. Some of the items
are based on ones originally suggested by Keyes (2006) and Ryan & Deci
(www.selfdeterminationtheory.org/questionnaires/)

Children’s Worlds Report, 2015
35
Figure 10 shows the distribution of responses to the single-item measure of cognitive subjective
well-being. It is well-established from the research on adult populations that subjective well-
being tends to be highly skewed towards positive evaluations, with most people evaluating
themselves above the mid-point of the scale and mean scores typically in the range of 7 to 8 out
of 10. However, as can be seen from the chart, the distribution here is even more skewed with
the majority of children in the 10-years-old and 12-years-old surveys saying that they were
‘totally satisfied’ with their lives. The mean score for this particular question in the pooled data
set was around 8.9 out of 10.
Figure 10: Distribution of responses to question about satisfaction with life as a whole
10 and 12 year old surveys, all countries, equally weighted by age group and country
Such skewed distributions present challenges for statistical analysis because many statistical
techniques require much more evenly-balanced27 data. In the next section we discuss some of
the approaches that might be taken to make comparisons using this type of data.
Different approaches to making comparisons The table below presents a summary of some different comparisons between countries for the
above question.
The first column of figures shows the mean score for each country which varies from
8.1 in South Korea to 9.5 in Romania.
The second column shows the mean rank of each country. This is a statistic calculated
by ranking each case and then calculating the mean of the ranks of cases for each
country. Because these statistics refer to an equally weighted data set with
approximately 30,000 cases, the overall mean rank is around 15,000. Romania ranks
highest on this statistic and South Korea ranks lowest.
The next column shows the percentage of children scoring less than five out of 10,
which ranged from 1.5% in Romania to 7.4% in South Africa.
27 Approximating to a normal distribution
1.2% 0.5% 0.6% 0.8% 1.2% 3.4% 2.8% 4.8%8.7%
14.5%
61.5%
0%
10%
20%
30%
40%
50%
60%
70%
0 1 2 3 4 5 6 7 8 9 10
% o
f ch
ildre
n
Satisfaction with life as a whole (0 to 10)

Children’s Worlds Report, 2015
36
Similarly the next column shows the percentage of children scoring a maximum score
of 10 out of 10 (‘totally satisfied’) which ranges from 39.5% in South Korea to 78% in
Turkey.
The final column shows a measure of inequality of life satisfaction within each country
which ranges from Romania (most equal = 1.299) to South Africa (least equal = 2.538)
Table 7: Summary of statistics for satisfaction with life as a whole by country
Mean Mean rank
% with low
well-being
(<5 out of 10)
% with very
high well-being
(10 out of 10)
Inequality
(standard
deviation)
Algeria* 9.13 16012 3.5% 67.9% 1.849
Colombia* 9.42 17427 1.8% 77.0% 1.459
Estonia 8.97 14861 3.6% 58.9% 1.818
Ethiopia 8.63 13417 4.5% 50.7% 2.024
Germany 8.82 13798 4.1% 52.6% 1.864
Israel 9.20 16620 3.5% 73.1% 1.818
Nepal 8.65 13826 6.0% 57.3% 2.216
Norway 9.00 15025 3.4% 60.3% 1.749
Poland* 8.81 14365 4.8% 56.7% 2.001
Romania 9.51 17607 1.5% 77.1% 1.299
S Africa* 8.56 14738 7.4% 62.8% 2.538
S Korea 8.10 11579 7.4% 39.5% 2.222
Spain* 9.02 14960 2.8% 56.8% 1.646
Turkey* 9.27 17446 4.1% 78.0% 1.897
UK* 8.66 13744 5.5% 53.4% 2.113
All 8.92 15000 4.2% 61.5% 1.957
10 and 12 year old surveys, all countries, equally weighted by age group
These points about the highest and lowest scores for each statistic illustrate that the choice of
comparison statistic makes a difference to which country is identified as having the highest and
lowest well-being. This is illustrated further by Table 8 which shows the rankings of each
country on each of the five measures in Table 7.
Romania and Colombia are consistently in the top three ranked countries and South
Korea is in the bottom two ranked countries irrespective of which measure is used.
Algeria, Estonia, Israel, Poland and the UK all have rankings within a range of one or
two places of each other in all five columns.
However for other countries there is more variation.
The widest variation is for South Africa which ranks 6th out of the 15 countries based on
the proportion of children with very high well-being but 15th based on the proportion of
children with low well-being and on inequality.
Turkey ranks first for the proportion of children with very high well-being but 9th for
equality of well-being
Spain ranks as high as 3rd for the (low) proportion of children with low well-being but
10th for the proportion of children with very high well-being.

Children’s Worlds Report, 2015
37
Table 8: Summary of different approaches to country rankings for satisfaction with life as a
whole
Mean Mean rank
% with low
well-being
(<5 out of 10)
% with very
high well-being
(10 out of 10)
Inequality
(standard
deviation)
Algeria* 5 5 5 5 7
Colombia* 2 3 2 3 2
Estonia 8 8 7 8 6
Ethiopia 13 14 10 14 11
Germany 9 12 9 13 8
Israel 4 4 6 4 5
Nepal 12 11 13 9 13
Norway 7 6 4 7 4
Poland* 10 10 11 11 10
Romania 1 1 1 2 1
S Africa* 14 9 15 6 15
S Korea 15 15 14 15 14
Spain* 6 7 3 10 3
Turkey* 3 2 8 1 9
UK* 11 13 12 12 12
10 and 12 year old surveys, all countries, equally weighted by age group
It is therefore important to acknowledge that the choice of statistic to summarise the
distribution of well-being in each country will have a tangible effect on the rankings of
countries.
To illustrate the reasons for this, the chart below shows the distribution of responses to the
question about satisfaction with life as a whole in two countries with contrasting patterns of
responses – Germany and South Africa. A substantially greater proportion of children in South
Africa (63%) than Germany (53%) chose the maximum score of 10 out of 10. However, children
in Germany more frequently selected each of the next three highest response categories (7 to 9)
than children in South Africa. The effect of this is that 90% of children in Germany selected a
score higher than 6 out of 10, compared to 79% of children in South Africa. At the bottom end
of the scale only 0.7% of children in Germany selected the lowest possible score of 0 out of 10
compared to 3.3% of children in South Africa. Thus:
Germany has a higher mean score than South Africa
South Africa has a higher mean rank score than Germany
Germany has a smaller proportion of children with low well-being than South Africa
South Africa has a higher proportion of children with very high well-being than
Germany
Germany has less inequality of well-being than South Africa

Children’s Worlds Report, 2015
38
Figure 11: Distribution of responses to question about satisfaction with life as a whole
10 and 12 year old surveys, all countries, equally weighted by age group and country
For this report, given the number of different survey questions for which findings are
presented, it would be impractical to present five different summary statistics for each question.
We have therefore chosen to focus on two.
First, we make use of the mean score as the main way to rank countries. The mean is one of the
three out of the five statistics that makes use of information about the whole distribution and is
easier to interpret than the mean rank or standard deviation. In addition, due to the highly-
skewed distribution, there are statistical problems with using the standard deviation.
Second, we make use of the proportion of children with low well-being. We have reasoned that
this may be of greater practical and policy concern than the proportion of children who are
totally satisfied with their lives. Additionally, for this type of highly-skewed distribution the
proportion with low well-being is closely related to measures of inequality of well-being as can
be seen from the relevant columns in Table 8.
Additionally, we need to be aware of the possibility of cultural response differences. As
reviewed in Chapter 1, these are an identified phenomenon in the literature on adult subjective
well-being but there has been little exploration of this topic in relation to children. It would
seem logical to think that if there are systematic differences in responding to these types of
questions across countries then there may be similar patterns for adults and children. However,
this may not be the case. Some initial analysis we have undertaken on the association between
adults’ and children’s mean level of subjective well-being at a country level does not suggest a
strong relationship between the two28
On the other hand, we have found evidence in our data that children in different countries may
respond differently to questions presented in different formats. For example, there are some
suggestions in the findings presented in Chapter 5 that children in Romania and Turkey
respond more positively to questions about family and home using an 11-point satisfaction
28 Further details will be published in a working paper later in 2015.
1% 0% 1% 1% 1% 3% 3%6%
11%
20%
53%
3%1% 1% 1% 1%
6%3% 4%
7%9%
63%
0%
10%
20%
30%
40%
50%
60%
70%
0 1 2 3 4 5 6 7 8 9 10
% o
f ch
ildre
n
Satisfaction with life as a whole (0 to 10)
Germany S Africa

Children’s Worlds Report, 2015
39
scale than with questions about the same topics using a five-point agreement scale (see, for
example, Table 11.
The possibility can not be discounted that some of the variations between countries that we see
in children’s (and adults’) evaluations of their lives are attributable to differences in response
tendencies between countries. Therefore, while we have produced rankings of means and
percentages throughout this report, these need to be treated with appropriate caution and, as
outlined in Chapter 1, we have also taken other comparative approaches in the topic-based
chapters.
Variations by country In light of the above discussion the following three charts show, for the 12-years-old survey, the
mean scores and the percentage of children with low well-being for each of the three questions
considered in this chapter.
Figure 12: Level of satisfaction with ‘life as a whole’ by country
12-years-old survey, all countries
7.6
8.4
8.4
8.5
8.5
8.6
8.6
8.8
8.8
8.8
8.9
9.1
9.2
9.3
9.5
9.8%
7.1%
6.2%
6.1%
7.0%
5.0%
3.6%
3.4%
2.4%
3.5%
6.1%
4.4%
3.2%
2.0%
1.1%
S Korea
UK*
Poland*
Nepal
S Africa*
Germany
Ethiopia
Estonia
Spain*
Norway
Turkey*
Algeria*
Israel
Colombia*
Romania
% with low satisfaction
Mean satisfaction (out of 10)

Children’s Worlds Report, 2015
40
Figure 13: Level of happiness in the last two weeks by country
12-years-old survey, all countries
Figure 14: Level of agreement with ‘I feel positive about the future’ by country
12-years-old survey, all countries (except Israel)
7.5
8.0
8.0
8.2
8.3
8.4
8.5
8.6
8.7
8.7
8.9
8.9
8.9
9.0
9.4
10.6%
7.6%
8.1%
7.8%
8.9%
4.7%
8.2%
5.4%
4.5%
3.9%
6.9%
4.7%
4.7%
4.5%
1.9%
S Korea
Germany
Estonia
Poland*
UK*
Ethiopia
S Africa*
Nepal
Norway
Spain*
Turkey*
Algeria*
Israel
Colombia*
Romania
% with low happiness
Mean happiness (out of 10)
7.5
7.9
8.2
8.2
8.2
8.4
8.6
8.7
8.7
8.7
8.8
8.9
8.9
9.0
9.3%
10.6%
8.1%
7.9%
5.8%
4.9%
5.9%
7.5%
3.7%
5.9%
3.0%
5.6%
6.4%
4.9%
S Korea
Poland*
Germany
UK*
Estonia
Spain*
Nepal
S Africa*
Ethiopia
Algeria*
Norway
Colombia*
Turkey*
Romania
% with low agreement
Mean agreement (out of 10)

Children’s Worlds Report, 2015
41
Table 9 summarises these three charts by showing the ranking for each of the three questions in
terms of mean scores and percentages of children with low well-being. Looking at these
rankings:
Some countries rank reasonably consistently across the different questions and the two
types of rankings. These include: Romania and Colombia (high rankings) and South
Korea and Poland (low rankings)
Other countries show variability between the three different questions. For example,
Nepal ranks lower for life satisfaction than for happiness or the future. Conversely,
Estonia and the UK have the opposite pattern
Some countries – Algeria, South Africa and Turkey – rank higher on mean scores than
on percentages with low well-being. The opposite is true in Spain and Ethiopia.
The high rankings of Norway and Ethiopia in the right-hand column – reflecting low
proportions of children with low agreement regarding feeling positive about the future
are also notable.
These differences reinforce the point made earlier that the choice of self-reported well-being
indicator and of the particular comparison made (e.g. mean or percentage with low well-being)
have implications for the conclusions that will be drawn on between-country variations.
Table 9: Summary of country rankings for three measures of well-being
Mean scores % low well-being
Satisfaction Happiness Future Satisfaction Happiness Future
Algeria* 4 4 5 8 7 7
Colombia* 2 2 3 2 3 5
Estonia 8 13 10 5 12 6
Ethiopia 9 10 6 7 6 2
Germany 10 14 12 9 10 12
Israel 3 3 n/a 4 5 n/a
Nepal 12 8 8 11 8 8
Norway 6 7 4 6 4 1
Poland* 13 12 13 12 11 14
Romania 1 1 1 1 1 3
S Africa* 11 9 7 13 13 10
S Korea 15 15 14 15 15 13
Spain* 7 6 9 3 2 4
Turkey* 5 5 2 10 9 9
UK* 14 11 11 14 14 11
12 year old surveys, all countries

Children’s Worlds Report, 2015
42
Variations by age group The chart below shows key statistics for life satisfaction and happiness in the last two weeks for
the 10-years-old and 12-years-old age groups respectively. Note that the third question
considered in this chapter about feeling positive about the future was not asked in the 10-years-
old questionnaire.
Children in the 12-years-old survey had significantly lower mean scores and significantly
higher rates of low well-being for both of these questions.
Figure 15: Selected overall well-being variable by age group (pooled sample)
10 and 12 year old surveys, all countries weighted equally by country and age group
At a country level, there were significant differences in life satisfaction and happiness according
to age group.
For life satisfaction, five countries had lower mean scores for 12-year-olds than 10-year-
olds – Estonia, Spain, Turkey, South Korea and Poland – although in only two of these
countries – Turkey and South Korea – was the difference in percentages with low well-
being also statistically significant.
For happiness, there was a larger group of eight countries where mean happiness was
lower among 12-year-olds than 10-year-olds; although again for this question the
difference in percentages with low well-being was only significant in Turkey and South
Korea.
The overall decline in life satisfaction between the 10-years-old and 12-years-old surveys is not
in evidence in all countries as illustrated in Figure 16. This chart shows the sharp drop in mean
satisfaction in South Korea (from 8.7 in the 10-year-olds survey to 7.6 in the 12-year-old survey),
in Poland (9.2 to 8.4) and in Turkey (9.6 to 8.9); as well as smaller drops in a number of other
(European) countries. However there is no change in life satisfaction between the two age
groups in Israel and Ethiopia and only a very small (and statistically non-significant) difference
in three other countries – South Africa, Romania and Algeria. As will be seen in other chapters
this pattern is also in evidence for a number of specific aspects of life. This suggests an
important area for future research to explore age-related patterns in a cross-national context,
ideally with a wider age range.
8.53
8.74
9.00
9.10
4.7%
6.2%
3.8%
4.0%
Happy in last
two weeks
Satisfied with
life
10-year-olds, mean 12-year-olds, mean 10-year-olds, % low 12-year-olds, % low

Children’s Worlds Report, 2015
43
Figure 16: Variations in mean life satisfaction by country and age group
10 and 12 year old surveys, all countries
Variations by gender The chart below shows an overview of gender patterns in the three well-being variables for the
pooled data set. There was no significant difference between females and males for any of the
three variables, either in terms of mean scores or the percentages with low well-being.
Figure 17: Selected overall well-being variables by gender (pooled sample)
10 and 12 year old surveys, all countries weighted equally by country and age group
8.4
8.9
8.8
7.6
8.5
9.5
8.4
8.8
8.5
9.2
8.6
8.6
8.8
9.3
9.1
8.9
9.6
9.3
8.7
8.6
9.6
9.2
9.2
8.8
9.2
9.1
8.6
9.2
9.5
9.2
0 2 4 6 8 10
UK*
Turkey*
Spain*
S Korea
S Africa*
Romania
Poland*
Norway
Nepal
Israel
Germany
Ethiopia
Estonia
Colombia*
Algeria*
Mean life satisfaction (0 to 10)
10 years old 12 years old
8.53
8.80
8.95
8.44
8.73
8.88
6.1%
4.6%
4.0%
6.6%
5.5%
4.4%
Positive about
future
Happy in last
two weeks
Satisfied with
life
Girls, mean Boys, mean Girls, % low Boys, % low
Children’s Worlds Report, 2015
44
Looking at each country individually, the only significant gender differences were in South
Korea where girls had lower mean scores than boys on each of the three variables, and also a
higher proportion of low happiness than boys. It is worth noting that the South Korea sample
was substantially larger than the other countries and therefore it is more likely that analysis will
pick up small differences in this country. However, across the data set there was little evidence
of a consistent gender pattern, with some countries tending to have slightly higher scores for
girls and other countries tending to have slightly higher scores for boys.
Summary and discussion This chapter has focused on children’s evaluations of their lives as a whole making use of three
of the single-item measures included in the survey designed to cover cognitive subjective well-
being (life satisfaction); affective subjective well-being (recent feelings of happiness) and
psychological well-being or ‘flourishing’ (feelings about the future).
On the face of it there are substantial variations between countries in children’s overall
evaluations of their lives with, typically, children in Romania and Colombia having the highest
scores and children in South Korea the lowest. However the chapter also highlights two issues
that need to be borne in mind in considering such comparisons.
First, the ranking of countries can differ substantially depending on which of the three
measures is being considered and also whether one focuses on mean scores or on the
proportion of children with particularly low scores. For example, children in Turkey rank much
higher for mean scores than when low well-being is considered; and children in Estonia rank
much lower for feelings of happiness than for life satisfaction.
Second, it is important to be aware of the possibility, highlighted in the literature on adult
subjective well-being, of differences between countries in interpretation of the different
concepts and also in tendencies to select particular response options. Thus it will be important
for future analysis of the data set to test some of the multi-item measures of overall well-being
included in the survey, and also to investigate plausible associations between variations in self-
reported well-being at a country level and other social indicators, which might help to explain
the observed variations.
We have also explored gender and age variations in children’s self-reported overall well-being.
There is very little evidence of significant gender variations in the pooled sample or in
particular countries (the exception being South Korea where boys had higher well-being scores).
However there is some evidence of age group variations. An important finding here, echoed
throughout the report, is that in some countries there are significant drops in well-being
between the 10-years-old and 12-years old surveys, while in other countries there are not. The
fact that age-related patterns are not universal identifies a potentially important topic for future
research.

Children’s Worlds Report, 2015
45
Chapter 5
Home and family
Overview Children were asked 12 questions about their home life:
Five agreement questions
Four satisfaction questions
Three time use questions
The agreement and satisfaction questions are shown in the box below.
Box 4: Home and family: Agreement and satisfaction questions
Agreement questions:
I feel safe at home
I have a quiet place to study at home
My parents (or the people who look after me) listen to me and take what I say into account
We have a good time together in my family
My parents (or the people who look after me) treat me fairly
Answers were given on a five-point, unipolar scale, with responses ranging from ‘I do not agree’
to ‘Totally agree’.
Satisfaction questions
How satisfied are you with...
The house or flat where you live
The people who live with you
All the other people in your family
Your family life
Responses were on a unipolar, 11-point scale from 0-10, with 0 labelled as ‘Not at all satisfied’
and 10 labelled as ‘Totally satisfied’.
The third satisfaction item was not asked in Poland.
The three questions about time use are discussed in Chapter 13.
The wordings and overall responses to the agreement questions for the whole sample (equally
weighted by country and age group) are shown in Table 10. The majority of children totally
agreed with all five statements. The highest level of total agreement was for feeling safe at home
(73%) and the lowest level of total agreement was for having a quiet place to study (53%).

Children’s Worlds Report, 2015
46
Table 10: Agreement questions about home and family life
Not at all A little Somewhat A lot Totally
I feel safe at home 3% 3% 5% 16% 73%
I have a quiet place to study at home 7% 6% 12% 22% 53%
My parents listen to me and take what
I say into account. 4% 6% 13% 23% 55%
We have a good time together in my
family 3% 4% 9% 20% 64%
My parents treat me fairly 4% 4% 8% 20% 65%
10 and 12 year old surveys, all countries, equally weighted by age group and country
Figure 18 shows the mean scores and percentage of children with low satisfaction for the four
satisfaction items about home and family. Mean scores for the whole data set (equally weighted
by country and age group) were close to 9 out of 10 for all four items. The percentage of
children with low satisfaction was also relatively small, ranging from around 3% to 6%.
Figure 18: Satisfaction questions about home and family life
10 and 12 year old surveys, all countries, equally weighted by age group and country
Variations by country The charts on the following five pages shows the distribution of responses to each of the nine
questions by country. A summary of the key points from these charts follows.
9.2
8.8
9.1
8.9
3.4%
6.0%
4.2%
4.3%
Family life
Other family
People lived with
House or flat
% with low satisfaction
Mean satisfaction (out of 10)

Children’s Worlds Report, 2015
47
Figure 19: Level of agreement with ‘I feel safe at home’ by country
10 and 12 year old surveys, all countries, equally weighted by age group
Figure 20: Level of agreement with ‘I have a quiet place to study at home’ by country
10 and 12 year old surveys, all countries, equally weighted by age group
0% 10% 20% 30% 40% 50% 60% 70% 80% 90% 100%
Ethiopia
Nepal
S Korea
S Africa*
Romania
Germany
Spain*
Algeria*
UK*
Turkey*
Colombia*
Estonia
Israel
Norway
Poland*
% of children
Not at all A little Somewhat A lot Totally
0% 10% 20% 30% 40% 50% 60% 70% 80% 90% 100%
Ethiopia
S Africa*
UK*
Nepal
S Korea
Germany
Spain*
Algeria*
Israel
Colombia*
Estonia
Turkey*
Norway
Romania
Poland*
% of children
Not at all A little Somewhat A lot Totally

Children’s Worlds Report, 2015
48
Figure 21: Level of agreement with ‘We have a good time together in my family’ by country
10 and 12 year old surveys, all countries, equally weighted by age group
Figure 22: Level of agreement with ‘My parents listen to me and take what I say into account’
by country
10 and 12 year old surveys, all countries, equally weighted by age group
0% 10% 20% 30% 40% 50% 60% 70% 80% 90% 100%
Nepal
Ethiopia
S Korea
Germany
S Africa*
Romania
UK*
Spain*
Colombia*
Israel
Algeria*
Turkey*
Poland*
Estonia
Norway
% of children
Not at all A little Somewhat A lot Totally
0% 10% 20% 30% 40% 50% 60% 70% 80% 90% 100%
Ethiopia
Nepal
S Africa*
S Korea
Turkey*
Estonia
Romania
Germany
Spain*
UK*
Poland*
Algeria*
Norway
Israel
Colombia*
% of children
Not at all A little Somewhat A lot Totally

Children’s Worlds Report, 2015
49
Figure 23: Level of agreement with ‘My parents treat me fairly’ by country
10 and 12 year old surveys, all countries, equally weighted by age group
Figure 24: Level of satisfaction with ‘the house or flat where you live’ by country
10 and 12 year old surveys, all countries, equally weighted by age group
0% 10% 20% 30% 40% 50% 60% 70% 80% 90% 100%
S Korea
Nepal
S Africa*
Germany
Ethiopia
Turkey*
Estonia
UK*
Spain*
Israel
Poland*
Romania
Norway
Algeria*
Colombia*
% of children
Not at all A little Somewhat A lot Totally
8.4
8.5
8.6
8.7
8.9
8.9
8.9
8.9
9.0
9.1
9.1
9.1
9.1
9.4
9.4
6.6%
8.5%
8.0%
2.9%
5.8%
4.0%
4.4%
3.4%
2.9%
4.4%
3.6%
3.1%
2.6%
2.4%
2.5%
Ethiopia
Nepal
S Africa*
S Korea
Algeria*
Estonia
UK*
Spain*
Germany
Colombia*
Israel
Poland*
Norway
Romania
Turkey
% with low satisfaction
Mean satisfaction (out of 10)

Children’s Worlds Report, 2015
50
Figure 25: Level of satisfaction with ‘the people who live with you’ by country
10 and 12 year old surveys, all countries, equally weighted by age group
Figure 26: Level of satisfaction with ‘all the other people in your family’ by country
10 and 12 year old surveys, all countries except Poland, equally weighted by age group
8.1
8.4
8.6
9.0
9.0
9.1
9.1
9.2
9.2
9.2
9.2
9.3
9.4
9.5
9.5
10.5%
6.5%
7.1%
4.5%
2.5%
3.6%
3.1%
4.5%
4.8%
3.3%
3.6%
2.6%
1.3%
2.6%
2.4%
Nepal
Ethiopia
S Africa*
Poland*
S Korea
UK*
Germany
Algeria*
Colombia*
Estonia
Spain*
Israel
Norway
Romania
Turkey*
% with low satisfaction
Mean satisfaction (out of 10)
7.8
7.8
8.2
8.6
8.8
8.8
8.9
8.9
9.1
9.1
9.1
9.2
9.5
9.5
12.8%
13.8%
11.5%
7.3%
6.8%
7.6%
6.6%
4.0%
3.0%
2.0%
4.7%
1.9%
1.7%
1.0%
Ethiopia
Nepal
Estonia
S Africa*
Algeria*
Turkey*
Israel
UK*
Spain*
Germany
Colombia*
S Korea
Romania
Norway
% with low satisfaction
Mean satisfaction (out of 10)

Children’s Worlds Report, 2015
51
Figure 27: Level of satisfaction with ‘your family life’ by country
10 and 12 year old surveys, all countries, equally weighted by age group
The two tables below summarise the key points about variations between countries in relation
to family and home life.
Table 11 shows a ranking of the mean scores for each question.
Two countries – Norway and Colombia – rank highly on all or almost all aspects of
home and family life
Romania and Turkey tend to rank higher for the satisfaction items than the agreement
items, which may indicate some differences in responses to these two question formats
in those countries (see discussion in Chapter 1 about cultural response differences).
Two countries – Ethiopia and Nepal – rank low on all aspects
South Korea also ranks low for all aspects apart from satisfaction with ‘other people in
your family’
Some countries vary widely in their rankings on different aspects. For example,
children in Algeria rank third for satisfaction with family life but 10th for agreeing that
they have a place to study at home.
8.4
8.8
8.9
9.0
9.0
9.0
9.1
9.2
9.2
9.3
9.4
9.4
9.5
9.6
9.6
6.9%
5.4%
2.9%
3.7%
5.6%
3.8%
2.9%
2.8%
3.4%
1.5%
2.6%
2.6%
2.5%
1.6%
2.2%
Ethiopia
Nepal
S Korea
UK*
S Africa*
Germany
Spain*
Estonia
Poland*
Norway
Israel
Colombia*
Algeria*
Romania
Turkey
% with low satisfaction
Mean satisfaction (out of 10)

Children’s Worlds Report, 2015
52
Table 11: Home and Family – Summary of rankings by country for each question
Safe
Place to
study
Parents
listen
Has
good
time
Parents
treat
fairly
House
or flat
People
lived
with
Other
people
in family
Family
life
Algeria* 9 10 4 6 3 11 8 10 3
Colombia* 5 5 2 9 1 6 7 4 4
Estonia 4 4 9 2 9 10 6 12 8
Ethiopia 15 15 15 14 11 15 14 14 15
Germany 10 9 8 12 10 7 9 5 10
Israel 2 7 3 5 7 5 4 8 5
Nepal 13 11 13 15 13 14 15 13 14
Norway 3 3 1 1 4 3 3 1 6
Poland* 1 1 5 3 6 4 12 n/a 7
Romania 11 2 10 10 2 2 2 2 2
S Africa* 12 14 14 11 14 13 13 11 11
S Korea 14 12 11 13 15 12 11 3 13
Spain* 8 8 6 7 5 8 5 6 9
Turkey* 7 6 12 4 12 1 1 9 1
UK* 6 13 7 8 8 9 10 7 12
10 and 12 year old surveys, all countries, equally weighted by age group
Table 12 presents ‘relative scores’. As discussed in Chapter 1 these scores have been calculated
to highlight relatively high and low scores within different countries, taking into account the
overall response tendencies of children within each country. They are intended to complement
the rankings of absolute scores as in the table above. As can been seen from Table 9, they paint
a slightly different picture:
Here the scores for Norway and Colombia are not greatly different from what would be
expected based on children’s patterns of responses across all the topics in the
questionnaire.
Ethiopia and Nepal still tend to score fairly low in this domain, even taking into
account the general pattern of response for these countries
On the other hand, South Korea scores highly for a number of questions, suggesting
that this is one of the domains where children in South Korea feel relatively satisfied in
comparison with other aspects of their lives. The same is true to a lesser extent for
Germany.
Children in the UK tend to score relatively well on this domain, except for having
access to a quiet place to study, for which there is a notably low relative score.

Children’s Worlds Report, 2015
53
Table 12: Home and Family – Relative scores by country for each question
See Chapter 1 for explanation of these scores
Safe
Place to
study
Parents
listen
Has
good
time
Parents
treat
fairly
House
or flat
People
lived
with
Other
people
in family
Family
life
Algeria* 0.98 0.93 1.04 1.01 1.04 0.99 1.00 0.99 1.03
Colombia* 1.00 1.00 1.05 0.97 1.05 0.98 0.97 1.00 0.99
Estonia 1.03 1.04 0.98 1.07 1.02 1.01 1.03 0.95 1.02
Ethiopia 0.88 0.73 0.93 0.96 1.03 0.99 0.97 0.92 0.96
Germany 1.03 1.04 1.05 0.98 1.00 1.02 1.02 1.05 1.00
Israel 1.03 1.00 1.06 1.02 1.03 0.99 1.01 0.98 1.00
Nepal 0.95 0.98 0.93 0.89 0.96 0.99 0.93 0.92 1.00
Norway 0.98 1.00 1.01 1.02 0.98 0.98 1.00 1.03 0.97
Poland* 1.03 1.18 1.01 1.02 0.99 1.02 0.99 n/a 1.00
Romania 1.00 1.09 0.98 0.99 1.06 0.98 0.98 1.01 0.98
S Africa* 1.01 0.92 0.99 1.05 0.94 1.00 0.99 1.02 1.02
S Korea 0.99 1.06 1.04 0.99 0.98 1.04 1.06 1.11 1.03
Spain* 1.00 1.00 1.00 0.98 1.02 0.99 1.00 1.02 0.99
Turkey* 1.01 1.01 0.93 1.04 0.90 1.01 1.01 0.96 1.00
UK* 1.05 0.92 1.04 1.03 1.05 1.01 1.02 1.04 1.00
10 and 12 year old surveys, all countries, equally weighted by age group
Variations by age group
Looking at each country individually, there was no clear pattern of age differences for the
questions considered in this chapter, and few of the differences met the criteria for statistical
significant outlined in Chapter 1. Children in the 10-years-old survey in South Korea had
significantly higher levels of agreement and satisfaction for most of the questions. There was
also some evidence of a similar pattern for some questions in Germany, Poland and Spain.
However, overall, this was not an aspect of life where clear and consistent differences were
evident between the two age groups.
Variations by gender Similarly there were relatively few significant gender differences either in the agreement or the
satisfaction items for this topic.
Summary and discussion In general, children in the survey were positive about their home and family lives. It is
encouraging, for example that almost three-quarters of children totally agreed that they felt safe
at home, although the fact that 3% of children did not agree with this statement at all and that a
further 3% only agreed a little could still be seen as a concern in that these percentages will
translate into substantial numbers of children.

Children’s Worlds Report, 2015
54
Similar comments can be made about the other questions covered in this chapter. While the
generally positive picture is reassuring, further analysis would be helpful to try to identify
factors associated with the minority of children who reported low agreement and satisfaction
with this important aspect of their lives.
There were some consistent variations between countries. Children in Ethiopia and Nepal
tended to score low in this domain in both absolute and relative terms. There was more
variability in the higher scores, although children in Norway tended to score high rankings for
almost all questions. In relative terms this was an aspect of life with which children in South
Korea tend to be more satisfied than average compared to other aspects considered in later
chapters, and the same is true to a lesser extent for Germany and the UK.
There was very limited evidence, either overall or at an individual country level, of statistically
significant variations by age group or gender for this aspect of life.

Children’s Worlds Report, 2015
55
Chapter 6
Money and possessions
Overview Children were asked two evaluative questions about money – one satisfaction question and one
agreement question. These questions were in a section of the questionnaire entitled ‘Money and
things you have’ and followed the set of questions about personal and household possessions
discussed in Chapter 3. Question wordings were as follows.
Box 5: Questions about money and possessions
How satisfied are you with all the things you have?
Responses were on an 11-point unipolar scale from ‘Not at all satisfied’ to ‘Totally satisfied’
How often do you worry about how much money your family has?
Responses were on an four-point scale with response options being ‘Never’, ‘Sometimes’, ‘Often’
and ‘Always’
(This question was not asked in the UK as, during piloting, children in that country expressed
the view that the question was too sensitive).
Overall responses for the pooled data are shown in the two charts below.
Figure 28: Satisfaction with ‘the things you have’
10 and 12 year old surveys, all countries, equally weighted by age group and country
Figure 29: Frequency of worrying about family money
10 and 12 year old surveys, all countries except UK, equally weighted by age group and country
9.0 3.9%The things you
have
% with low satisfaction
Mean satisfaction (out of 10)
33%
41%
14% 13%
0%
10%
20%
30%
40%
50%
Not at all Sometimes Often Always

Children’s Worlds Report, 2015
56
Variations by country The following three charts summarise children’s responses to these two questions by country.
Figure 30 shows the mean scores and percentage with low satisfaction (less than 5 out of 10) for
the satisfaction question. The mean scores for many of the countries are relatively similar, with
nine countries having means in the range between 9.2 and 9.6 out of 10. However, the means
for Ethiopia (7.2) and Algeria (8.1) are substantially lower. This is reflected in relatively high
percentages (10% and 19% respectively) of children having low satisfaction with this aspect of
life in these countries. It is also notable from the chart that Turkey has a higher proportion of
children with low satisfaction than might be expected from the mean, while the opposite is the
case in Germany and South Korea.
Figure 30: Level of satisfaction with ‘the things you have’ by country
10 and 12 year old surveys, all countries, equally weighted by age group
Figure 31 shows levels of inequality in satisfaction with ‘the things you have’ for each country.
Here the top two and bottom two countries are the same as for the mean scores in the above
chart. There are some differences in the middle of the range with Germany faring better on
equality than on mean satisfaction and Turkey faring worse, as might be expected from the
above points about the percentage of children with low satisfaction.
Figure 32 shows the distribution of responses to the question about worrying about family
money in each country. The pattern here is quite different to that for mean satisfaction with
Ethiopia and Algeria in the mid-range. Children in Colombia, Nepal and Spain most frequently
worry about family money, while children in South Korea, Norway and Germany have the least
worries. Children in Israel are the most likely to say that they ‘never’ worry about family
money followed by Turkey and Algeria (even though Algeria has the second lowest mean
satisfaction scores for ‘the things you have’).
7.2
8.1
8.5
8.7
8.8
9.0
9.2
9.2
9.2
9.3
9.3
9.4
9.5
9.5
9.6
18.7%
9.8%
3.9%
5.1%
5.2%
2.5%
2.0%
1.0%
3.6%
1.6%
1.3%
1.4%
1.6%
0.6%
1.0%
Ethiopia
Algeria*
S Korea
S Africa*
Nepal
Estonia
UK*
Germany
Turkey*
Poland*
Spain*
Israel
Colombia*
Norway
Romania
% with low satisfaction
Mean satisfaction (out of 10)

Children’s Worlds Report, 2015
57
Figure 31: Inequalities in satisfaction with ‘the things you have’ by country
10 and 12 year old surveys, all countries, equally weighted by age group
Figure 32: Level of worry about ‘how much money your family has’ by country
10 and 12 year old surveys, all countries except UK, equally weighted by age group
1.0
1.1
1.3
1.3
1.3
1.4
1.4
1.5
1.6
1.8
1.8
2.1
2.2
2.6
3.2
0.0 0.5 1.0 1.5 2.0 2.5 3.0 3.5 4.0
Norway
Romania
Germany
Spain*
Poland*
Colombia*
Israel
UK*
Estonia
S Korea
Turkey*
Nepal
S Africa*
Algeria*
Ethiopia
Inequalities in satisfaction with material situation (standard deviations)
0% 10% 20% 30% 40% 50% 60% 70% 80% 90% 100%
S Korea
Norway
Germany
Poland*
Turkey*
Estonia
Algeria*
Israel
Ethiopia
S Africa*
Romania
Spain*
Nepal
Colombia*
% of children
Never Sometimes Often Always

Children’s Worlds Report, 2015
58
Table 13 shows the rankings of countries based on mean scores and on inequalities in
satisfaction with ‘the things you have’, and the relative scores for this aspect of life (see Chapter
1 for explanation). It also shows rankings (based on an ordinal test of ranks) for the question
about family money worries. The table clearly shows the different patterns from the two
different questions. Colombia and Spain are in the top half of the rankings for mean satisfaction
scores and for equality of satisfaction, but have the highest levels of money worries. Children in
Algeria have relatively low levels of worrying about family money, even though levels of
satisfaction with material possessions are low (see context box for further discussion).
The ranking of each country in terms of GDP per capita is provided as a point of comparison.
Table 13: Satisfaction with ‘the things you have’ – rankings and relative scores by country
Satisfaction with ‘the things you have’
Family money
worries
Ranking
(of mean)
Ranking
(of equality) Relative score
Ranking
(mean rank29)
Rank of GDP
per capita
Algeria* 14 14 .90 5 11
Colombia* 3 6 1.01 14 13
Estonia 10 9 1.02 10 7
Ethiopia 15 15 0.84 11 15
Germany 8 3 1.04 4 2
Israel 4 7 1.03 3 6
Nepal 11 12 1.02 12 14
Norway 2 1 1.01 2 1
Poland* 6 5 1.03 7 8
Romania 1 2 1.00 9 10
S Africa* 12 13 1.01 8 12
S Korea 13 10 1.02 6 5
Spain* 5 4 1.03 13 4
Turkey* 7 11 0.98 1 9
UK* 9 8 1.05 n/a 3
10 and 12 year old surveys, all countries, equally weighted by age group
29 This ranking uses mean rank scores generate by a Kruskal-Wallis test.

Children’s Worlds Report, 2015
59
Context 2
Country: Algeria
Child poverty, whether defined in relative or absolute terms, is of key importance to children’s
lives and outcomes. However, investigations which are based on children’s own perceptions and
experiences of their material living standards are relatively rare. The Children’s Worlds survey
sought to investigate children’s material well-being in such a manner. One surprising finding was
that despite Algeria’s very low GDP, children reported comparatively low levels of worry about
how much money their family had. While the lack of recent data on inequality in Algeria (such as
a recent Gini coefficient) makes it difficult to test this, one possible explanation is that until
relatively recently (in the 1990s) Algeria was under a socialist-egalitarian political regime. Many
effects of this – such as free education and educational resources, financial aid for poor parents at
the start of the school year, free school meals for many children in primary education – remain,
which may result in poor children judging their own situation to be similar to that of their peers,
and therefore not feeling that their family is worse off. Parental protection of children, and the
protection which is afforded many children by extended family networks, may also play a role in
protection children against worries about their family’s financial situation.
Variations by age group There were only a few significant differences between 10-year-olds and 12-year-olds in relation
to the above two questions:
Children in the 10-year-old survey in Poland, South Korea and Turkey were more
satisfied with the things they had than children in the 12-year-old survey
In South Korea, the younger age group also tended to worry less about family money
than the older age group.
Variations by gender
There were no significant gender variation in any of the countries in relation either to the
satisfaction question or worries about family money.
Summary and discussion This chapter has considered children’s responses to two questions about their material situation
– their level of satisfaction with ‘the things you have’ and the frequency with which they worry
about family money. Across the pooled sample as a whole, children’s satisfaction with the
things they have was high – with a mean score of 9.0 out of 10 and fewer than one in 20 children
reporting low satisfaction. As might be expected there was evidence of variation between
countries. Children in Ethiopia and Algeria had noticeably lower levels of satisfaction (7.2 and
8.1) respectively. Indicators of inequality in satisfaction between countries show a similar
picture but some countries (e.g. Germany and South Korea) rank higher for equality than for
mean satisfaction) and the opposite is the case in Turkey. In addition to the above points, the
calculation of relative scores indicates that this is an aspect of life which children in four
countries (the UK, Germany, Israel and Poland) feel relatively positive about, in comparison
with other aspects of life.

Children’s Worlds Report, 2015
60
At a country level, children’s average frequencies of worrying about how much money their
family do not always match their satisfaction with the things they have. For example, children
in Algeria rank fifth highest (i.e. fifth least frequently worried) in terms of worries about family
money, even though their mean satisfaction score with the things they have is the second lowest
(14th) in the survey sample. On the other hand children in Spain are reasonably satisfied with
the things they have (ranked fifth) but report relatively high levels of worries about family
money (exceeded only in Colombia).
There were few significant age group differences for this aspect of life and no significant gender
differences in any of the 15 countries.
Children’s evaluations of this aspect of their lives – relating to money and possessions – is
relatively under-explored in the current wave of the survey compared to other aspects of life
such as school and family. The diverging patterns of findings for the two evaluative questions
asked suggest that it may be important to include a wider range of such questions in future
surveys in order to fully capture children’s evaluations in relation to this domain.

Children’s Worlds Report, 2015
61
Chapter 7
Friends and other relationships
Overview Children were asked seven questions about their friendships and other relationships:
Two agreement questions
Two satisfaction questions
Three time use questions
The agreement and satisfaction questions are shown in the box below. The three questions
about time use are discussed in the later chapter on this topic.
Box 6: Friends and other relationships: Agreement and satisfaction questions
Agreement questions:
My friends are usually nice to me
I have enough friends
Answers were given on a five-point, unipolar scale, with responses ranging from ‘I do not agree’
to ‘Totally agree’.
Satisfaction questions
How satisfied are you with...
Your friends
Your relationships with people in general
Responses were on a unipolar, 11-point scale from 0-10, with 0 labelled as ‘Not at all satisfied’
and 10 labelled as ‘Totally satisfied’.
The overall responses to the agreement and satisfaction questions are shown in the table and
chart below.
Table 14: Agreement questions about friendships
Not at all A little Somewhat A lot Totally
My friends are usually nice to me 3% 6% 14% 29% 48%
I have enough friends 4% 5% 9% 19% 64%
10 and 12 year old surveys, all countries, equally weighted by age group and country

Children’s Worlds Report, 2015
62
Figure 33: Satisfaction questions about home and family life
10 and 12 year old surveys, all countries, equally weighted by age group and country
Variations by country The four charts below provide a summary of levels of agreement and satisfaction for the four
questions being considered in this chapter for each country.
In most countries the majority of children ‘totally agree’ that they have enough friends.
Norway is the highest ranked country for all four questions
The countries ranked lowest vary somewhat between questions.
More than 10% of children in South Africa and Nepal have low satisfaction with their
relationships in general.
Figure 34: Level of agreement with ‘My friends are usually nice to me’ by country
10 and 12 year old surveys, all countries, equally weighted by age group
8.7
8.7
5.2%
4.7%
Relationships with
other people
Your friends
% with low satisfaction
Mean satisfaction (out of 10)
0% 10% 20% 30% 40% 50% 60% 70% 80% 90% 100%
S Korea
Nepal
Colombia*
Estonia
S Africa*
Ethiopia
Romania
Poland*
Algeria*
UK*
Israel
Germany
Turkey*
Spain
Norway
% of children
Not at all A little Somewhat A lot Totally

Children’s Worlds Report, 2015
63
Figure 35: Level of agreement with ‘I have enough friends’ by country
10 and 12 year old surveys, all countries, equally weighted by age group
Figure 36: Level of satisfaction with ‘your friends’ by country
10 and 12 year old surveys, all countries, equally weighted by age group
0% 10% 20% 30% 40% 50% 60% 70% 80% 90% 100%
Nepal
S Korea
Ethiopia
Algeria*
Romania
S Africa*
Colombia*
UK*
Germany
Spain*
Turkey*
Israel
Poland*
Estonia
Norway
% of children
Not at all A little Somewhat A lot Totally
8.2
8.4
8.5
8.5
8.6
8.6
8.7
8.7
8.8
8.8
9.0
9.0
9.0
9.1
9.2
7.6%
8.1%
6.3%
4.8%
3.8%
6.0%
4.7%
6.2%
4.2%
4.0%
3.5%
4.6%
3.0%
2.1%
1.8%
Ethiopia
S Africa*
Algeria*
Poland*
S Korea
Nepal
Estonia
Colombia*
Israel
UK*
Romania
Turkey*
Spain*
Germany
Norway
% with low satisfaction
Mean satisfaction (out of 10)

Children’s Worlds Report, 2015
64
Figure 37: Level of satisfaction with ‘your relationships with people in general’ by country
10 and 12 year old surveys, all countries, equally weighted by age group
Table 15 summarises the rankings of scores and the relative scores for each of the four questions
considered in this chapter.
In terms of the rankings of actual scores:
Friendships are an aspect of life for which children in Norway, Spain, and Turkey score
consistently highly.
South Korea, South Africa, Ethiopia, Nepal and Algeria on the other hand rank
consistently low (with the exception of satisfaction with relationships in general in
Algeria).
For most countries, the pattern of rankings for relationships in general is similar to that
for the three friendships questions. However it is notable that children in Algeria are
relatively satisfied with their relationships in general, even though they score relatively
low for the friendships questions.
The relative scores for many countries are roughly what would be expected based on the overall
response patterns across all topics in the survey for these countries. However:
Children in Israel tend to score higher on this domain than they do across the survey in
general
Children in Algeria (for the three friendships items) and Colombia (all four items) score
relatively poorly for this domain.
8.0
8.1
8.2
8.3
8.5
8.5
8.6
8.6
8.8
8.8
8.9
8.9
9.1
9.1
9.2
10.2%
10.6%
4.1%
6.2%
5.3%
5.8%
6.9%
4.2%
4.7%
2.3%
4.1%
4.2%
3.9%
3.0%
2.0%
Nepal
S Africa*
S Korea
Ethiopia
Estonia
UK*
Colombia*
Germany
Poland*
Spain*
Israel
Algeria*
Turkey*
Romania
Norway
% with low satisfaction
Mean satisfaction (out of 10)

Children’s Worlds Report, 2015
65
Table 15: Friends and other relationships – Summary of rankings by country for each
question
Rankings Relative scores
Friends
nice
Enough
friends
Satisfied
friends
Satisfied
rel’ships
Friends
nice
Enough
friends
Satisfied
friends
Satisfied
rel’ships
Algeria* 10 12 13 4 0.94 0.93 0.97 1.02
Colombia* 15 10 8 9 0.88 0.95 0.96 0.95
Estonia 8 3 9 11 1.04 1.02 1.01 1.00
Ethiopia 11 13 15 12 1.01 1.04 0.98 1.00
Germany 3 7 2 8 1.03 1.00 1.05 1.01
Israel 5 4 7 5 1.06 1.03 0.99 1.00
Nepal 12 15 10 15 1.00 1.02 1.02 0.97
Norway 1 1 1 1 0.98 0.92 1.01 1.02
Poland* 7 2 12 7 1.01 0.99 0.97 1.01
Romania 9 9 5 2 0.98 1.01 0.96 0.99
S Africa* 14 11 14 14 0.97 0.98 0.99 0.97
S Korea 13 14 11 13 0.99 1.04 1.04 1.01
Spain* 2 6 3 6 1.03 0.99 1.02 1.01
Turkey* 4 5 4 3 1.02 1.00 0.98 1.01
UK* 6 8 6 10 1.01 1.02 1.03 1.01
10 and 12 year old surveys, all countries, equally weighted by age group
Context 3
Countries: Germany, Spain, Ethiopia
Friendships with peers form an important aspect of children’s lives, allowing them opportunities
to develop identities and engage in activities separately from family and school environments.
Potential explanations for the variations between countries in children’s evaluations of this aspect
of their lives may relate to resources and time availability. For example in Germany parents begin
encouraging children to form friendships from babyhood, with toddler groups to allow children
to interact with one another. In contrast, in some countries such as Ethiopia children spend a
great deal of the time they are not in education on household and work-related chores, as a
necessary aspect of providing for themselves and their families. As a result, limited time is
available for friendships. Similarly, in Spain, children will regularly interact not only in person but
via social media, on computers and mobile phones. Children in poorer countries are less likely to
have access to such resources, and their peers are also less likely to have such access, making
ongoing ‘maintenance’ of friendships through very regular contact more difficult.

Children’s Worlds Report, 2015
66
Variations by age group There were very few significant age group differences for the four variables discussed above.
In South Korea, children in the 12-year-old age group scored significantly lower on all
four variables than children in the 10-year-old age group. For example, mean scores for
satisfaction with friends were 8.73 among 10-year-olds and 8.37 among 12-year-olds
In Poland, the older age group scored significantly lower for the two satisfaction
variables. The larger difference was for satisfaction with ‘your relationships with
people in general’. Mean scores were 8.99 among 10-year-olds and 8.56 among 12-year-
olds
Apart from these statistically significant differences there was no consistent pattern of (non-
significant) variation between the two age groups. For example, for satisfaction with
relationships in general, means were higher among 10-year-olds in seven countries, almost
equal (within 0.01) in two countries, and higher among 12-year-olds in four countries.
Variations by gender There were no significant gender differences for the three questions about friendships in any of
the countries.
For the question about satisfaction with relationships in general, girls tended to have higher
mean scores than boys in most countries (the exceptions being Norway and Poland where boys
scored slightly higher than girls). However the gender difference was only statistically
significant in Israel where mean satisfaction scores were 8.7 for boys and 9.1 for girls.
Summary and discussion Previous consultative research in several countries30 has indicated that children view good
friendships as one of the most important ingredients of their overall well-being and happiness.
Most children in the survey agreed ‘totally’ or ‘a lot’ that their friends were usually nice to them
and that they had enough friends. This was also true for each individual country. Levels of
satisfaction with friendships were also high, and less than 10% of children had low satisfaction
with this aspect of life in all countries. Levels of satisfaction with relationships in general
tended to be similar but slightly lower than for friendships. The proportion of children with
low satisfaction with relationships in general only exceeded 10% in two countries (South Africa
and Nepal).
There were only a few significant age group or gender differences within individual countries
for the three questions about friendships. For the question about satisfaction with relationships
in general, girls tended to score higher than boys in most countries although the difference was
only statistically significant (using the criteria described in Chapter 1) in Israel.
The findings in this chapter paint a generally positive picture about children’s feelings about
their friendships and other relationships. However, as with other aspects of life, there were
some children who had low levels of satisfaction and agreement with the questions asked.
Given the central importance of these relationships for children’s lives it may be helpful to do
further analysis to try to identify the factors associated with low well-being in this aspect of life.
30 See Dex & Hollingworth (2012) for a review

Children’s Worlds Report, 2015
67
Chapter 8
School
Overview Children were asked 12 questions about their school life:
Four agreement questions
Six satisfaction questions
Two frequency questions about experiences of being bullied
The wordings of all questions are shown in the box below.
Box 7: School: Agreement, satisfaction and frequency questions
Agreement questions:
My teachers listen to me and take what I say into account
I like going to school
My teachers treat me fairly
I feel safe at school
Answers were given on a five-point, unipolar scale, with responses ranging from ‘I do not agree’
to ‘Totally agree’.
Satisfaction questions
How satisfied are you with...
Other children in your class
Your relationship with teachers
The things you have learned
Your school marks
Your school experience
Your life as a student
Responses were on a unipolar, 11-point scale from 0-10, with 0 labelled as ‘Not at all satisfied’
and 10 labelled as ‘Totally satisfied’.
Frequency questions:
How often, if at all, in the last month have you been...
Hit by other children in your school
Left out by other children in your class
Answers were given on a four-point, frequency scale, with responses ranging from ‘Never’ to
‘More than 3 times’.

Children’s Worlds Report, 2015
68
The overall responses to the agreement and satisfaction questions are shown in the two charts
below. The two questions about bullying are discussed in a separate section later in the chapter.
A general observation is that the agreement and satisfaction scores in this chapter are lower
than those for family and friends which were presented in the last two chapters.
Table 16: Agreement questions about school
Not at all A little Somewhat A lot Totally
My teachers listen to me and take
what I say into account 5% 7% 15% 28% 45%
My teachers treat me fairly 5% 7% 13% 24% 51%
I feel safe at school 5% 6% 11% 22% 57%
I like going to school 10% 9% 15% 23% 43%
Figure 38: Satisfaction questions about school life
10 and 12 year old surveys, all countries, equally weighted by age group and country
Variations by country Charts summarising the responses to each question by country are presented on the next few
pages.
The statement ‘I like going to school’ shows particularly large variation between countries –
with 84% totally agreeing with this statement in Ethiopia compared to 21% in Germany.
One of the overall features of the charts showing the agreement and satisfaction items is the
tendency for the European countries in the survey (with the exception of Romania) to lie
towards the bottom of the rankings.
8.1
8.2
8.5
8.6
8.9
8.5
7.4%
7.6%
5.5%
5.8%
3.5%
7.0%
Others in class
School marks
School experience
Life as student
Things learned
Relationships with
teachers
% with low satisfaction
Mean satisfaction (out of 10)

Children’s Worlds Report, 2015
69
Figure 39: Level of agreement with ‘My teachers listen to me and take what I say into
account’ by country
10 and 12 year old surveys, all countries, equally weighted by age group
Figure 40: Level of agreement with ‘My teachers treat me fairly’ by country
10 and 12 year old surveys, all countries, equally weighted by age group
0% 10% 20% 30% 40% 50% 60% 70% 80% 90% 100%
Germany
Estonia
Poland*
S Korea
UK*
Colombia*
Israel
Spain*
Nepal
Romania
Norway
S Africa*
Ethiopia
Turkey*
Algeria*
% of children
Not at all A little Somewhat A lot Totally
0% 10% 20% 30% 40% 50% 60% 70% 80% 90% 100%
Germany
UK*
S Korea
Estonia
S Africa*
Poland*
Israel
Spain*
Norway
Ethiopia
Nepal
Turkey*
Colombia*
Romania
Algeria*
% of children
Not at all A little Somewhat A lot Totally

Children’s Worlds Report, 2015
70
Figure 41: Level of agreement with ‘I feel safe at school’ by country
10 and 12 year old surveys, all countries, equally weighted by age group
Figure 42: Level of agreement with ‘I like going to school’ by country
10 and 12 year old surveys, all countries, equally weighted by age group
0% 10% 20% 30% 40% 50% 60% 70% 80% 90% 100%
Germany
S Korea
Ethiopia
Estonia
Nepal
UK*
Poland*
Israel
Spain*
Romania
S Africa*
Colombia*
Turkey*
Norway
Algeria*
% of children
Not at all A little Somewhat A lot Totally
0% 10% 20% 30% 40% 50% 60% 70% 80% 90% 100%
Germany
Estonia
UK*
Poland*
Spain*
Israel
Norway
S Korea
Romania
S Africa*
Colombia*
Turkey*
Nepal
Algeria*
Ethiopia
% of children
Not at all A little Somewhat A lot Totally

Children’s Worlds Report, 2015
71
Figure 43: Level of satisfaction with ‘other children in your class’ by country
10 and 12 year old surveys, all countries, equally weighted by age group
Figure 44: Level of satisfaction with ‘your relationship with teachers’ by country
10 and 12 year old surveys, all countries, equally weighted by age group
7.7
7.8
7.8
8.0
8.1
8.1
8.1
8.1
8.1
8.2
8.2
8.3
8.4
8.6
8.7
11.2%
8.8%
7.6%
7.9%
6.4%
7.0%
8.4%
9.9%
8.6%
9.3%
5.9%
7.9%
4.0%
4.2%
3.4%
S Africa*
Estonia
Germany
UK*
S Korea
Poland*
Israel
Algeria*
Colombia*
Turkey*
Ethiopia
Nepal
Spain*
Romania
Norway
% with low satisfaction
Mean satisfaction (out of 10)
7.7
7.8
7.9
8.2
8.3
8.3
8.4
8.4
8.6
8.7
8.9
9.0
9.1
9.2
9.2
13.8%
12.6%
9.7%
8.5%
9.3%
5.3%
9.6%
5.3%
7.2%
4.4%
3.5%
4.6%
4.6%
3.2%
3.1%
Poland*
UK*
Germany
Estonia
Israel
S Korea
S Africa*
Spain*
Colombia*
Ethiopia
Norway
Nepal
Turkey*
Romania
Algeria*
% with low satisfaction
Mean satisfaction (out of 10)

Children’s Worlds Report, 2015
72
Figure 45: Level of satisfaction with ‘the things you have learned’ by country
10 and 12 year old surveys, all countries, equally weighted by age group
Figure 46: Level of satisfaction with ‘your school marks’ by country
10 and 12 year old surveys, all countries, equally weighted by age group
8.2
8.4
8.5
8.6
8.6
8.8
8.8
8.9
9.0
9.0
9.1
9.3
9.3
9.4
9.5
5.8%
7.0%
4.0%
4.6%
4.6%
2.4%
3.5%
2.4%
3.4%
4.4%
2.3%
3.0%
2.2%
1.4%
1.2%
S Korea
Poland*
Germany
Estonia
UK*
Spain*
Ethiopia
Norway
Israel
S Africa*
Nepal
Turkey*
Colombia*
Algeria*
Romania
% with low satisfaction
Mean satisfaction (out of 10)
7.1
7.5
7.8
7.8
7.9
8.1
8.2
8.3
8.4
8.5
8.6
8.7
8.7
8.7
8.7
15.5%
11.4%
9.5%
8.1%
9.7%
7.9%
9.9%
7.7%
8.1%
4.1%
3.9%
4.7%
3.7%
4.5%
4.8%
S Korea
Germany
Estonia
Spain*
Poland*
UK*
Turkey*
S Africa*
Colombia*
Ethiopia
Algeria*
Israel
Norway
Romania
Nepal
% with low satisfaction
Mean satisfaction (out of 10)

Children’s Worlds Report, 2015
73
Figure 47: Level of satisfaction with ‘your school experience’ by country
10 and 12 year old surveys, all countries, equally weighted by age group
Figure 48: Level of satisfaction with ‘your life as a student’ by country
10 and 12 year old surveys, all countries, equally weighted by age group
8.0
8.2
8.2
8.3
8.3
8.3
8.4
8.4
8.4
8.8
8.9
8.9
8.9
9.0
9.1
6.6%
5.2%
8.0%
6.7%
7.3%
5.5%
5.4%
8.4%
6.8%
4.2%
3.1%
4.5%
5.6%
3.2%
2.2%
Germany
S Korea
Estonia
UK*
Poland*
Ethiopia
Spain*
Israel
S Africa*
Nepal
Norway
Colombia*
Turkey*
Algeria*
Romania
% with low satisfaction
Mean satisfaction (out of 10)
7.9
8.0
8.0
8.1
8.2
8.2
8.4
8.7
8.7
9.0
9.0
9.1
9.2
9.3
9.3
8.9%
7.5%
9.1%
9.3%
6.2%
7.4%
8.3%
5.2%
6.0%
4.4%
2.8%
4.5%
3.4%
2.4%
2.6%
Germany
S Korea
Poland*
Estonia
Spain*
UK*
Israel
Norway
S Africa*
Nepal
Ethiopia
Turkey*
Colombia*
Romania
Algeria*
% with low satisfaction
Mean satisfaction (out of 10)

Children’s Worlds Report, 2015
74
The table below summarises the responses to all ten questions presented above and
demonstrates:
The generally high scores for almost all questions among children in Algeria
The low scores for children in Germany and Estonia
Some distinctive patterns in other countries. For example, Colombia and Romania
rank in the top half of the scores for all questions except whether teachers listen.
Table 17: School – Summary of rankings by country for each question
Agreement questions Satisfaction questions
Teachers
listen
Teachers
fair Safe Like Peers Teachers Learned Marks
School
exp.
Life as
student
Algeria* 1 1 1 2 8 1 2 5 2 1
Colombia* 13 4 4 5 7 7 3 7 4 3
Estonia 14 12 12 15 14 12 12 13 13 12
Ethiopia 3 6 14 1 5 6 9 6 10 5
Germany 15 15 15 14 13 13 13 14 15 15
Israel 12 11 10 11 9 11 7 4 8 9
Nepal 6 2 11 3 4 4 5 1 6 6
Norway 5 7 2 9 1 5 8 3 5 8
Poland* 11 9 8 13 10 15 14 11 11 13
Romania 10 3 7 6 2 2 1 2 1 2
S Africa* 7 13 9 7 15 9 6 8 7 7
S Korea 8 10 13 8 11 10 15 15 14 14
Spain* 4 5 5 10 3 8 10 12 9 11
Turkey* 2 8 3 4 6 3 4 9 3 4
UK* 9 14 6 12 12 14 11 10 12 10
10 and 12 year old surveys, all countries, equally weighted by age group
However, the following table showing the relative scores presents a clearer picture. Taken in
the context of the patterns of responses across the survey as a whole:
Children in Nepal, Algeria, South Africa and Ethiopia score particularly highly on this
aspect of life, having relative scores above 1.0 for all or almost all of the questions.
Children in South Korea also score quite highly on this domain (with the exception of
satisfaction with school marks) relative to their responses for other aspects of life.
Children in Germany, Estonia and Poland score consistently below what would be
expected from their general pattern of responses to the survey indicating that this is an
aspect of life where children in these countries are comparatively unhappy (see context
box for further discussion).
Four other countries – Israel, Norway, Spain and the UK – also fare comparatively
poorly for most questions within this aspect of life.
The question about liking going to school shows the largest variations between
countries with relative scores ranging from 0.77 in Poland to 1.40 in Ethiopia.

Children’s Worlds Report, 2015
75
Table 18: School – Relative scores by country for each question
See Chapter 1 for explanation of the calculation and interpretation of these scores
Teachers
listen
Teachers
fair Safe Like Peers Teachers Learned Marks
School
exp.
Life as
student
Algeria* 1.07 1.06 1.03 1.22 0.99 1.07 1.05 1.04 1.04 1.08
Colombia* 0.91 1.02 1.01 1.09 0.96 0.97 1.01 0.98 1.00 1.02
Estonia 0.93 0.96 0.95 0.79 0.97 0.98 0.98 0.97 0.98 0.95
Ethiopia 1.16 1.12 0.99 1.40 1.05 1.07 1.04 1.09 1.02 1.09
Germany 0.97 0.91 0.96 0.84 0.97 0.95 0.97 0.93 0.95 0.94
Israel 0.95 0.96 0.97 0.82 0.97 0.95 0.99 1.03 0.96 0.95
Nepal 1.04 1.10 1.04 1.27 1.06 1.09 1.07 1.11 1.07 1.08
Norway 0.96 0.96 0.99 0.91 1.03 1.00 0.96 1.01 1.00 0.97
Poland* 0.93 0.93 0.97 0.77 0.99 0.91 0.94 0.96 0.97 0.93
Romania 0.96 1.05 1.00 1.08 0.99 1.01 1.00 0.99 0.99 1.01
S Africa* 1.08 1.00 1.06 1.15 0.98 1.02 1.05 1.05 1.02 1.05
S Korea 1.07 1.04 1.00 1.10 1.05 1.04 0.98 0.92 1.02 0.99
Spain* 1.00 1.00 0.99 0.87 1.02 0.98 0.98 0.95 0.97 0.94
Turkey* 1.07 0.99 1.04 1.14 0.96 1.03 1.00 0.96 1.00 1.01
UK* 0.99 0.96 1.03 0.84 1.00 0.94 0.99 1.01 0.99 0.98
10 and 12 year old surveys, all countries, equally weighted by age group
Context 4
Country: Estonia
Stark differences were found in children’s satisfaction with various aspects of their school lives. A
notable pattern is that children growing up in poorer countries, and especially in African
countries, report much higher levels of satisfaction with almost all aspects of school than children
in richer, European countries. This may reflect a view among children in richer countries, where
education is a well-established right, that school is a chore; while among poorer countries where
access to education is more recent and less taken-for-granted, children perceive the opportunity
to access it much more positively. However, western children are potentially suffering in their
school well-being in part as a result of the environments within schools. In Estonia, for example,
children do comparatively very well on objective measures of education, but are dissatisfied with
much of their school experience. This may relate to highly competitive systems which link
academic success with future prospects, and put a great deal of pressure on parents and on
children to excel, from a very early age. Children in Estonia begin school at 7, but even before
this there is competitive entry into childcare provision which often includes in-depth education in
foreign languages and sciences. Small, rural schools, where children tend to have higher levels of
subjective well-being, are under threat as they do not perform as well academically as larger,
urban schools. Bullying is also a problem in schools which is acknowledged by the Estonian
Government and the Child Ombudsman’s Office, and research indicates that the school
environment is the source of bullying, and that bullying is often directly or indirectly instigated by
adults rather than by children themselves.

Children’s Worlds Report, 2015
76
Variations by age group In the survey as a whole there were significant variations in children’s responses to the ten
questions about school between the 10-years-old and 12-years-old surveys. For all questions,
children in the 12-years-old survey tended to agree less or be less satisfied than children in the
10-years-old survey.
Within this overall picture, there were some different patterns for different countries, howeve:
Children in the 12-year-old survey in South Korea scored lower than children in the 10-
year-old survey for all ten questions
In a number of other countries, mainly in Europe – Estonia, Germany, Poland, Romania,
South Korea, Spain, Turkey and the UK – children in the 12-years-old survey agreed
less or were less satisfied in response to a majority of the questions.
In other countries, almost all outside Europe, there were few significant age variations
with the main exception of Algeria where there were significant differences for four of
the ten questions.
It would be interesting to explore whether the significant variations noted here are linked to
countries where children typically change schools between the ages of 10 and 12 as this a factor
that may potentially explain some of the age-related variations.
The age group differences in some countries are quite large and an example of this is provided
in Figure 49 which shows age group variations in satisfaction with ‘your school experience’.
The mean score for 12-year-olds is 1.2 lower than for 10-year-olds in South Korea and
1.0 lower in Turkey.
On the other hand there was little or no evidence of changes in satisfaction across the
two age groups in Israel, Ethiopia, Nepal, Colombia or Norway.
Variations by gender Girls tended to be a little more satisfied than boys with all aspects of school. However, the
differences were generally quite small and so there were relatively few significant gender
variations within countries. The main significant differences related to two variables:
Girls tended to more strongly agree than boys with the statement ‘I like going to school’
in Algeria, Estonia, Spain, Turkey, Romania and Poland.
Girls were significantly more satisfied than boys with their relationships with teachers
in Algeria, Estonia, Spain, and Romania.

Children’s Worlds Report, 2015
77
Figure 49: Mean satisfaction with school experience by age group and country
10 and 12 year old surveys, all countries, equally weighted by age group
8.0
8.4
8.0
7.6
8.3
8.9
8.0
8.8
8.8
8.4
7.6
8.3
7.9
8.8
8.8
8.6
9.4
8.8
8.8
8.6
9.3
8.6
9.0
8.9
8.4
8.4
8.4
8.6
9.0
9.2
0 2 4 6 8 10
UK*
Turkey*
Spain*
S Korea
S Africa*
Romania
Poland*
Norway
Nepal
Israel
Germany
Ethiopia
Estonia
Colombia*
Algeria*
Mean satisfaction (out of 10)
10 years old 12 years old

Children’s Worlds Report, 2015
78
Experiences of being bullied The chart below shows the overall distribution of responses to the two questions about being
bullied (being hit and being left out by other children) in the pooled sample of all 15 countries
(with each country and age group having an equal weighting).
The percentages are very similar for the two questions with around one third of children saying
that they had experienced each of the two behaviours in the last month, and around 9% to 10%
saying that this had happened more than three times in that period.
Figure 50: Frequency questions about being bullied at school in the last month
10 and 12 year old surveys, all countries, equally weighted by age group and country
However, these similar patterns conceal substantial variation between countries and also some
different patterns in the frequencies of experiencing the two forms of behaviour within
countries:.
In relation to being hit in school, the percentage of children who had experienced this at
least once in the past month ranged from 11% in South Korea to over half (54%) in
Turkey.
The percentage of children who had been left out by other children in their class ranged
from 4% in South Korea to 50% in England.
In terms of differential patterns within countries, for example, being left out by other children
was more common than being hit by other children in the UK while the opposite was true in
Turkey.
65%
16%9% 10%
67%
15%9% 9%
0%
10%
20%
30%
40%
50%
60%
70%
80%
Never Once 2 to 3 times More than 3 times
Hit Left out

Children’s Worlds Report, 2015
79
Figure 51: Frequency of being hit by other children in school in the last month by country
10 and 12 year old surveys, all countries, equally weighted by age group
Figure 52: Frequency of being left out by other children in school class in the last month by
country
10 and 12 year old surveys, all countries, equally weighted by age group
0% 10% 20% 30% 40% 50% 60% 70% 80% 90% 100%
S Korea
Algeria*
Norway
Germany
Ethiopia
Colombia*
Nepal
UK*
Poland*
Spain*
Israel
Romania
Estonia
Turkey*
S Africa*
% of children
Never Once 2 or 3 times More than 3 times
0% 10% 20% 30% 40% 50% 60% 70% 80% 90% 100%
S Korea
Ethiopia
Norway
Spain*
Germany
Algeria*
Israel
Poland*
Turkey*
Nepal
Estonia
Colombia*
UK*
S Africa*
Romania
% of children
Never Once 2 or 3 times More than 3 times

Children’s Worlds Report, 2015
80
There were some substantial differences in the likelihood of children experiencing these two
types of behaviours in school, between age groups and genders as shown in the table below.
Children in the 10-years-old survey were more likely than children in the 12-years-old
survey to have been hit by other children at school in the last month in all countries.
The largest age group difference was in South Korea (1.97 times more likely) and the
smallest was in Turkey (1.06 times more likely)
There was a similar pattern for being left out by classmates. Again the largest age-
related difference was in South Korea (10-year-olds were 1.77 times more likely to have
experienced this than 12-year-olds). The smallest age difference here was in Colombia
and Ethiopia.
Boys were more likely than girls to be hit by other children in school in all countries. In
South Korea they were much more than twice (2.39) as likely to experience this
behaviour, whereas the gender difference was smallest in Nepal (1.16)
Gender differences in terms of being excluded by other children tended to be less
pronounced and were in different directions in different countries. In eight countries
boys were more likely to experience this than girls, with the largest imbalance being in
Colombia (1.35). In seven countries girls were more likely to experience this than boys
(1.6 times more likely in Norway and 1.4 times more likely in the UK).
Table 19: Ratios of likelihood of being bullied by age group and gender in each country (Explanatory note: the ratios in the table are calculated as the larger of the two group percentages experiencing the
behaviour divided by the corresponding smaller percentage. Larger ratios reflect a greater imbalance between the
two groups)
10 10 year olds > 12 year olds G Girls > Boys
12 12 year olds > 10 year olds B Boys > Girls
Age group ratios Gender ratios
Hit Excluded Hit Excluded
Algeria* 1.34 1.43 1.45 1.02
Colombia* 1.19 1.03 1.97 1.35
Estonia 1.30 1.31 1.34 1.01
Ethiopia 1.30 1.03 1.29 1.09
Germany 1.77 1.08 2.00 1.04
Israel 1.68 1.62 1.31 1.29
Nepal 1.42 1.23 1.16 1.09
Norway 1.52 1.17 1.30 1.60
Poland* 1.35 1.11 1.60 1.02
Romania 1.07 1.10 1.37 1.12
S Africa* 1.21 1.10 1.18 1.18
S Korea 1.97 1.77 2.39 1.30
Spain* 1.88 1.53 1.40 1.21
Turkey* 1.06 1.05 1.19 1.20
UK* 1.59 1.16 1.52 1.40
10 and 12 year old surveys, all countries

Children’s Worlds Report, 2015
81
Summary and discussion As this was a survey of children attending school in the 15 countries, school was a common and
probably important part of all the surveyed children’s lives. Generally, children were less
positive about school than they were about their relationships with family and friends
discussed in the previous chapters. However this was not true for all countries. For example, a
comparison of mean scores between this chapter and Chapters 5 and 7 shows the children in
Nepal and Ethiopia had higher satisfaction with ‘the things that you have learned’, their school
experience and their relationship with teachers than with aspects of their family and home life.
There were some similar patterns for other countries. Satisfaction with the ‘things that you
have learned’ had the highest mean score in South Africa across all aspects of life covered in the
survey; and aspects of school were also highly rated in Algeria.
These patterns are indicative of a division in the sample between the three African countries
and Nepal, where there were predominantly relatively high scores for aspects of school life and
some of the European countries (particularly Estonia, Germany, Poland) where there were
relatively low scores.
In many countries there was a significant drop in children’s evaluations of their school lives
between the 10-years-old and 12-years-old age groups. But there were exceptions – there was
no evidence of significant age differences in Colombia, Ethiopia, Israel, Nepal and Norway, and
only one in South Africa. So it is clearly not the case that decreasing satisfaction with school
with age is universal or inevitable. Further research to explore these differences and how they
might relate to the school system would be useful.
Girls tended to be a little more positive in their evaluations about school than boys, but the
differences were not that large and were only statistically significant for some countries and
aspects of school life.
The chapter also presented evidence on children’s experiences of being hit by other children and
of being excluded by classmates. These aspects of bullying have previously been identified as
being strongly associated with children’s well-being in some research studies31. There were
wide variations in children’s experience of these two behaviours between two countries.
Children in Turkey were the most likely to say that they had been hit by other children in school
at least once in the last month. Children in the UK were the most likely to say that they had
been left out by other children in their class at least once in the last month. Children in South
Korea were the least likely to experience either of these behaviours. The survey data offers new
opportunities to explore the association between these behaviours and children’s overall
subjective well-being across a very diverse range of countries.
31 e.g. Klocke et al (2014).

Children’s Worlds Report, 2015
82
Chapter 9
Local area
Overview Children were asked eight questions about their local area:
Three agreement questions
Five satisfaction questions
The wording and format of the questions are shown in the box below.
Box 8: Local area: Agreement and satisfaction questions
Agreement questions:
The town council asks children and young people their opinion about things that are
important to them
In my area there are enough places to play or to have a good time
I feel safe when I walk around in the area I live in
Answers were given on a five-point, unipolar scale, with responses ranging from ‘I do not agree’
to ‘Totally agree’.
The first agreement item about the town council was omitted by several countries and there
were relatively high levels of missing data for this question in a number of other countries, which
means that the data may not be reliable. Therefore this question is not considered further in
this report
Satisfaction questions
How satisfied are you with ..
The people who live in your area
The local police in your area
How you are dealt with when you go to the doctors
The outdoor areas children can use in your area
The area where you live, in general
Responses were on a unipolar, 11-point scale from 0-10, with 0 labelled as ‘Not at all satisfied’
and 10 labelled as ‘Totally satisfied’.
The question about the police was only asked on the 12-years old questionnaire and not asked
in Poland or Norway. The question about the doctors was also not asked in Poland.
The table and chart below provide summary statistics for these questions for the whole sample
(weighted equally by age group and country). Some of the scores in this domain are among the
lowest for any aspect of life covered in the survey.

Children’s Worlds Report, 2015
83
Table 20: Agreement questions about local area
Not at all A little Somewhat A lot Totally
In my area there are enough places to
play or to have a good time 10% 10% 13% 20% 46%
I feel safe when I walk around in the
area I live in 8% 9% 15% 22% 47%
10 and 12 year old surveys, all countries, equally weighted by age group and country
Figure 53: Satisfaction questions about local area
10 and 12 year old surveys, all countries, equally weighted by age group and country
Variations by country The charts on the following pages provide a summary of responses to each question for each
country. One notable overall pattern, in comparison with aspects of life covered in other
chapters, is the relatively low scores (and high levels of low satisfaction) in many countries for
aspects of the local area. For example, in all countries more than 10% of children had low
satisfaction with local police (although it should be borne in mind that this question was only
asked of 12-year-olds whose levels of satisfaction were often lower than for 10-year-olds), and in
12 out of the 15 countries more than 10% also had low satisfaction with the outdoor places they
could use in their local area.
8.5
7.7
8.8
7.1
8.1
7.1%
14.4%
5.2%
18.5%
9.8%
Area in general
Outdoor areas
Doctors
Police
People in area
% with low satisfaction
Mean satisfaction (out of 10)

Children’s Worlds Report, 2015
84
Figure 54: Level of agreement with ‘In my area there are enough places to play or to have a
good time’ by country
10 and 12 year old surveys, all countries, equally weighted by age group
Figure 55: Level of agreement with ‘I feel safe when I walk around in the area I live in’ by
country
10 and 12 year old surveys, all countries, equally weighted by age group
0% 10% 20% 30% 40% 50% 60% 70% 80% 90% 100%
S Korea
Ethiopia
Nepal
Romania
Algeria*
UK*
S Africa*
Turkey*
Germany
Estonia
Israel
Spain*
Poland*
Colombia*
Norway
% of children
Not at all A little Somewhat A lot Totally
0% 10% 20% 30% 40% 50% 60% 70% 80% 90% 100%
S Korea
S Africa*
Ethiopia
Turkey*
UK*
Nepal
Germany
Algeria*
Romania
Colombia*
Estonia
Spain*
Poland*
Israel
Norway
% of children
Not at all A little Somewhat A lot Totally

Children’s Worlds Report, 2015
85
Figure 56: Level of satisfaction with ‘the people who live in your area’ by country
10 and 12 year old surveys, all countries, equally weighted by age group
Figure 57: Level of satisfaction with ‘the local police in your area’ by country
12 year old surveys, all countries except Norway and Poland,
7.2
7.5
7.8
7.9
7.9
8.0
8.0
8.1
8.1
8.1
8.2
8.3
8.4
8.6
8.6
19.0%
13.2%
6.8%
9.0%
11.3%
13.6%
10.9%
9.1%
10.3%
8.8%
8.5%
9.7%
6.2%
6.1%
5.0%
S Africa*
Germany
S Korea
Ethiopia
UK*
Turkey*
Estonia
Poland*
Algeria*
Nepal
Colombia*
Israel
Spain*
Norway
Romania
% with low satisfaction
Mean satisfaction (out of 10)
5.9
6.4
6.7
6.8
6.8
6.9
7.2
7.2
7.3
7.4
7.5
7.7
7.8
28.6%
27.4%
26.1%
21.5%
12.5%
17.7%
19.0%
16.2%
15.6%
15.9%
11.9%
15.1%
13.0%
Colombia*
S Africa*
Algeria*
Estonia
S Korea
Spain*
Israel
Ethiopia
Germany
Nepal
UK*
Turkey*
Romania
% with low satisfaction
Mean satisfaction (out of 10)
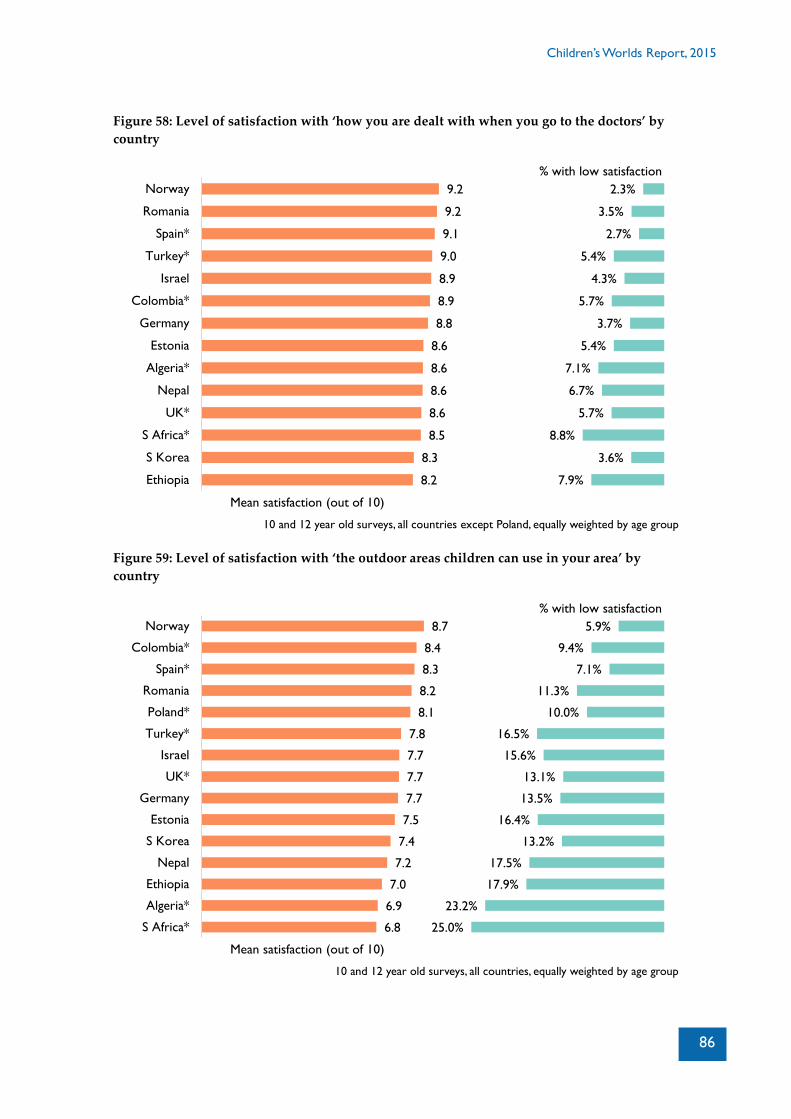
Children’s Worlds Report, 2015
86
Figure 58: Level of satisfaction with ‘how you are dealt with when you go to the doctors’ by
country
10 and 12 year old surveys, all countries except Poland, equally weighted by age group
Figure 59: Level of satisfaction with ‘the outdoor areas children can use in your area’ by
country
10 and 12 year old surveys, all countries, equally weighted by age group
8.2
8.3
8.5
8.6
8.6
8.6
8.6
8.8
8.9
8.9
9.0
9.1
9.2
9.2
7.9%
3.6%
8.8%
5.7%
6.7%
7.1%
5.4%
3.7%
5.7%
4.3%
5.4%
2.7%
3.5%
2.3%
Ethiopia
S Korea
S Africa*
UK*
Nepal
Algeria*
Estonia
Germany
Colombia*
Israel
Turkey*
Spain*
Romania
Norway
% with low satisfaction
Mean satisfaction (out of 10)
6.8
6.9
7.0
7.2
7.4
7.5
7.7
7.7
7.7
7.8
8.1
8.2
8.3
8.4
8.7
25.0%
23.2%
17.9%
17.5%
13.2%
16.4%
13.5%
13.1%
15.6%
16.5%
10.0%
11.3%
7.1%
9.4%
5.9%
S Africa*
Algeria*
Ethiopia
Nepal
S Korea
Estonia
Germany
UK*
Israel
Turkey*
Poland*
Romania
Spain*
Colombia*
Norway
% with low satisfaction
Mean satisfaction (out of 10)
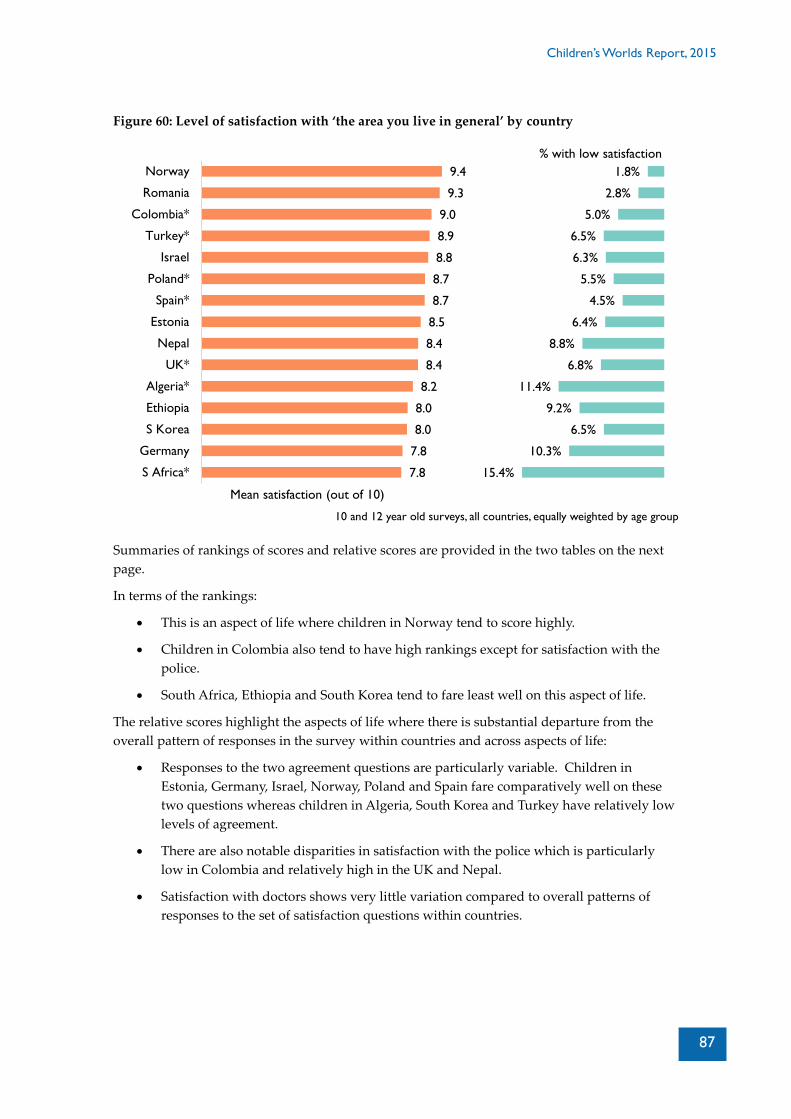
Children’s Worlds Report, 2015
87
Figure 60: Level of satisfaction with ‘the area you live in general’ by country
10 and 12 year old surveys, all countries, equally weighted by age group
Summaries of rankings of scores and relative scores are provided in the two tables on the next
page.
In terms of the rankings:
This is an aspect of life where children in Norway tend to score highly.
Children in Colombia also tend to have high rankings except for satisfaction with the
police.
South Africa, Ethiopia and South Korea tend to fare least well on this aspect of life.
The relative scores highlight the aspects of life where there is substantial departure from the
overall pattern of responses in the survey within countries and across aspects of life:
Responses to the two agreement questions are particularly variable. Children in
Estonia, Germany, Israel, Norway, Poland and Spain fare comparatively well on these
two questions whereas children in Algeria, South Korea and Turkey have relatively low
levels of agreement.
There are also notable disparities in satisfaction with the police which is particularly
low in Colombia and relatively high in the UK and Nepal.
Satisfaction with doctors shows very little variation compared to overall patterns of
responses to the set of satisfaction questions within countries.
7.8
7.8
8.0
8.0
8.2
8.4
8.4
8.5
8.7
8.7
8.8
8.9
9.0
9.3
9.4
15.4%
10.3%
6.5%
9.2%
11.4%
6.8%
8.8%
6.4%
4.5%
5.5%
6.3%
6.5%
5.0%
2.8%
1.8%
S Africa*
Germany
S Korea
Ethiopia
Algeria*
UK*
Nepal
Estonia
Spain*
Poland*
Israel
Turkey*
Colombia*
Romania
Norway
% with low satisfaction
Mean satisfaction (out of 10)

Children’s Worlds Report, 2015
88
Table 21: Local area – Summary of rankings by country for each question
Place to
play Feel safe
Local
people Police Doctors
Outdoor
areas
Area in
general
Algeria* 13 9 7 11 9 14 11
Colombia* 4 6 5 13 6 2 3
Estonia 5 4 9 10 8 10 8
Ethiopia 15 13 12 6 14 13 12
Germany 7 8 14 5 7 9 14
Israel 6 5 4 7 5 7 5
Nepal 11 10 6 4 10 12 9
Norway 1 1 2 n/a 1 1 1
Poland* 2 2 8 n/a n/a 5 6
Romania 14 7 1 1 2 4 2
S Africa* 10 14 15 12 12 15 15
S Korea 12 15 13 9 13 11 13
Spain* 3 3 3 8 3 3 7
Turkey* 9 12 10 2 4 6 4
UK* 8 11 11 3 11 8 10 10 and 12 year old surveys, all countries, equally weighted by age group
Table 22: Local area – Relative scores by country for each question
Place to
play Feel safe
Local
people Police Doctors
Outdoor
areas
Area in
general
Algeria* 0.78 0.97 1.00 0.95 0.98 0.89 0.96
Colombia* 1.08 1.01 0.98 0.81 0.98 1.05 1.01
Estonia 1.07 1.09 1.01 0.98 1.00 1.00 1.02
Ethiopia 0.84 0.95 1.02 1.06 0.98 0.95 0.98
Germany 1.08 1.07 0.95 1.05 1.02 1.01 0.93
Israel 1.06 1.06 1.00 0.99 1.00 0.98 1.01
Nepal 0.95 1.03 1.05 1.09 1.02 0.98 1.03
Norway 1.09 1.12 1.02 n/a 1.01 1.08 1.05
Poland* 1.09 1.08 1.00 n/a n/a 1.05 1.02
Romania 0.81 1.03 1.00 1.04 0.98 1.00 1.02
S Africa* 0.99 0.77 0.93 0.94 1.01 0.92 0.94
S Korea 0.90 0.79 1.03 1.03 1.01 1.02 1.00
Spain* 1.07 1.06 1.04 0.97 1.03 1.07 1.01
Turkey* 0.94 0.89 0.95 1.05 0.98 0.97 1.00
UK* 1.00 1.00 1.00 1.09 1.00 1.02 1.01
10 and 12 year old surveys, all countries, equally weighted by age group

Children’s Worlds Report, 2015
89
Context 5
Countries: Poland, South Africa
Children’s local areas can provide spaces for them to spend time away from home, playing and
spending time with friends. However, they can also be spaces in which children experience threat
and fear. For example, children in South Africa reported very low levels of satisfaction with the
spaces available to them in their local areas. This may be a result of high levels of violence and
crime, with children either exposed to this when out in their local area, or prevented (by choice
or by parental wishes to protect children) from accessing spaces in their local area. In contrast
to this experience, children in Poland reported very high levels of satisfaction with the spaces
available to them. Among the reasons for this may be interventions undertaken under the Polish
National Programme of Action against Social Exclusion, which included the My Sports Field
Programme (running 2008-2012) which made sports infrastructure available to children and
young people within all Polish municipalities. Additionally, the Happy Schools Programme which
ran from 2009-2014, provided financial aid to primary schools which could be used for
modernisation or creation of playgrounds for children.
Variations by age group There was a general pattern in the data set as a whole of children in the 12-years-old survey
being less satisfied with aspects of their local area than those in the 10-years-old survey. These
differences are summarised for the pooled data set (with equal weighting for each country) in
the chart below.
Figure 61: Local area – Summary of significant age group differences by country
10 and 12 year old surveys, all countries, equally weighted by country
8.3
7.4
8.6
7.8
8.7
8.0
8.9
8.3
0 2 4 6 8 10
Area in general
Outdoor area
Doctors
People in area
Mean satisfaction (out of 10)
10 year old 12 year olds

Children’s Worlds Report, 2015
90
These age group differences were also reflected in a number of countries individually as
follows:
Places to play: South Korea, Poland, Norway, Estonia, Spain
People in local area: South Korea, Poland
Doctors: South Korea, Turkey
Outdoor area: South Korea, Turkey, Estonia, Spain, Poland
Local area in general: South Korea, Turkey, Poland
Variations by gender There were relatively few significant gender differences for the questions considered in this
chapter, either overall or in particular countries. The main exception to this was that boys in
South Korea tended to be more happy with most aspects of their local area than girls.
Additionally, boys in Algeria had higher levels of agreement than girls with the questions about
places to play and safety in the local area.
Summary and discussion The topic of local area was one for which children in the survey had some of the lowest levels of
satisfaction. In all countries at least one (and usually two) of the three lowest ranked
satisfaction questions in the survey related to the local area. The local police received the lowest
mean satisfaction rating in 11 out of the 15 countries, and satisfaction with outdoor areas to play
was also usually towards the bottom of the rankings. In absolute and relative terms, the local
area was an aspect of life for which children in South Africa had particularly low levels of
satisfaction while children in Norway tended to have high satisfaction scores.
There were substantial variations between countries in the extent to which children felt safe in
their local area. Over two-thirds (70%) of children in Norway totally agreed that they felt safe
walking around in the area where they lived compared to 17% in South Korea and 30% in South
Africa.
There were fairly consistent age group differences for this aspect of life with satisfaction tending
to be lower in the 12-years-old survey than the 10-years-old survey. On the other hand there
were relatively few gender differences.
At this stage we do not know how important children’s feelings about their local area are for
their overall well-being. Given the generally low levels of satisfaction with this aspect of life it
will be interesting for future analysis of the data set to explore the extent to which children’s
evaluations of their local area have a significant association with their evaluations and feelings
about their lives as a whole.

Children’s Worlds Report, 2015
91
Chapter 10
Self
Overview Children were asked four satisfaction questions that fall into this category:
Box 9: Self: satisfaction questions
Satisfaction questions
How satisfied are you with ..
Your health
Your body
The way that you look
Your self-confidence
Responses were on a unipolar, 11-point scale from 0-10, with 0 labelled as ‘Not at all satisfied’
and 10 labelled as ‘Totally satisfied’.
The third item was not asked in Poland.
A summary of responses to these four questions are shown in the chart below. Overall, these
patterns are roughly average for the survey as a whole with means in the region of 8.5 to 9.0 and
small proportions of children with low well-being.
Figure 62: Satisfaction questions about self
10 and 12 year old surveys, all countries, equally weighted by age group and country
However there are some notable differences between countries, age groups and genders for
some of these questions.
8.7
8.5
8.6
9.0
5.8%
6.8%
7.0%
3.6%
Self-confidence
Appearance
Body
Health
% with low satisfaction
Mean satisfaction (out of 10)

Children’s Worlds Report, 2015
92
Variations by country The four charts on the next two pages show the mean scores and percentages of children with
low satisfaction by country for each of the four questions considered in this chapter.
The variations in satisfaction with health are not that pronounced. Mean scores have a
relatively narrow range from 8.4 to 9.6 and the percentage of children with low
satisfaction is below 6% in all countries. To a great extent these satisfaction ratings
reflect those for overall subjective well-being (see Chapter 13).
Variations between countries in children’s satisfaction with their bodies are much more
substantial. Mean scores range from 7.4 in South Korea to 9.5 in Colombia. Here there
are tentative indications of a geographical pattern. In South Korea and five countries in
Europe (UK, Germany, Estonia, Norway and Poland) more than 8% of children had low
satisfaction with their bodies (see context box below). In the remaining countries, the
mean scores were higher and the percentages with low satisfaction were in the range
from 2% to 6%. Statistical testing suggests that the mean scores for South Korea, UK,
Germany and Estonia are significantly lower than for all the countries from Nepal and
above in Figure 64; while mean scores for Norway and Poland are significantly lower
than those for Algeria and above.
Variations in satisfaction with one’s appearance showed a similar pattern, although here
children in Nepal also tend to score relatively low. The percentages (more than one in
ten children) with low satisfaction in South Korea, UK and Nepal are notable.
Finally, in terms of self-confidence, four countries (Romania, Colombia, Turkey and
Algeria) have mean scores above 9.0, while UK and South Korea have notably low
mean scores and more than 10% of children in the UK have low satisfaction with this
aspect of their lives.
Context 6
Countries: Poland, Norway, England
In terms of satisfaction with various aspects of themselves, we found that children in African
countries tended to fare comparatively well, while children in many European countries
(especially in England and Norway) fared poorly. Children in England fared particularly poorly on
satisfaction with body and appearance. The poor satisfaction of children in England is probably
the result of a range of factors. Research suggests that increasingly unrealistic and unhealthy
portrayals of ‘ideal’ body types in the media have contributed to an increased dissatisfaction
among children and young people with their own bodies, and a probable association between
exposure to such images and the likelihood of suffering from eating disorders. So to an extent
children’s concerns might reflect a perceived deficit measured against an unrealistic and unhealthy
ideal. However, research also demonstrates a worryingly high proportion of overweight and
obese children – statistics from the National Child Measurement Programme indicate that almost
30% of children aged 10-11 were overweight or obese in England in 2013-14. Dissatisfaction with
body and appearance probably therefore reflects a complex combination of exposure to
unhealthy ideals in the media, coupled with the reality of high levels of overweight in the child
population.

Children’s Worlds Report, 2015
93
Figure 63: Level of satisfaction with ‘your health’ by country
10 and 12 year old surveys, all countries, equally weighted by age group
Figure 64: Level of satisfaction with ‘your body’ by country
10 and 12 year old surveys, all countries, equally weighted by age group
8.4
8.6
8.8
8.8
8.8
8.9
9.0
9.0
9.0
9.0
9.3
9.3
9.4
9.5
9.6
5.0%
5.7%
5.4%
4.9%
5.8%
4.0%
3.8%
2.7%
2.2%
4.2%
1.5%
3.1%
3.2%
1.9%
1.3%
S Korea
Nepal
UK*
Estonia
S Africa*
Ethiopia
Poland*
Germany
Norway
Algeria*
Spain*
Israel
Turkey*
Colombia*
Romania
% with low satisfaction
Mean satisfaction (out of 10)
7.4
7.9
8.1
8.1
8.3
8.4
8.6
8.6
8.7
8.8
8.9
9.1
9.1
9.3
9.5
13.0%
12.8%
11.7%
11.0%
9.2%
8.6%
5.7%
5.3%
3.7%
5.5%
5.4%
5.3%
4.0%
2.0%
2.4%
S Korea
UK*
Germany
Estonia
Norway
Poland*
Nepal
Spain*
Ethiopia
Algeria*
S Africa*
Turkey*
Israel
Romania
Colombia*
% with low satisfaction
Mean satisfaction (out of 10)

Children’s Worlds Report, 2015
94
Figure 65: Level of satisfaction with ‘the way that you look’ by country
10 and 12 year old surveys, all countries except Poland, equally weighted by age group
Figure 66: Level of satisfaction with ‘your self-confidence’ by country
10 and 12 year old surveys, all countries, equally weighted by age group
7.2
7.8
7.9
8.2
8.3
8.4
8.6
8.7
8.7
8.9
9.1
9.2
9.3
9.4
13.0%
13.0%
12.1%
9.2%
8.1%
7.1%
4.1%
4.2%
6.7%
6.4%
3.4%
4.0%
1.9%
2.0%
S Korea
UK*
Nepal
Germany
Estonia
Norway
Spain*
Ethiopia
S Africa*
Turkey*
Algeria*
Israel
Romania
Colombia*
% with low satisfaction
Mean satisfaction (out of 10)
7.8
7.9
8.4
8.5
8.5
8.5
8.5
8.6
8.8
8.8
8.8
9.2
9.3
9.4
9.4
12.7%
9.4%
8.5%
5.9%
7.1%
5.1%
6.4%
6.5%
4.1%
4.2%
5.9%
2.4%
3.8%
2.7%
1.9%
UK*
S Korea
S Africa*
Germany
Nepal
Estonia
Norway
Poland*
Ethiopia
Spain*
Israel
Algeria*
Turkey*
Colombia*
Romania
% with low satisfaction
Mean satisfaction (out of 10)

Children’s Worlds Report, 2015
95
The table below summarises the rankings of mean scores and the relative scores for each
question for each country. The rankings of mean scores have already been discussed above.
The relative scores show a slightly different pattern:
The pattern of scores for satisfaction with health is not particularly distinctive, taking
into account the way that children in each country respond to these types of satisfaction
questions across the survey as a whole, although Colombia fares a little better than
expected and Norway a little worse.
Children in South Africa also fare particularly well in terms of satisfaction with their
body and their appearance, when one takes into account the general response patterns
across the survey for each country.
Children in Colombia score higher on all four questions than would be expected from
the general pattern of responses across all questions of this type.
Three countries – UK, Norway and South Korea – stand out as having particularly low
scores for satisfaction with body, appearance and self-confidence.
For almost all countries the relative scores for body and appearance are very similar. In
this light, the difference in relative scores for body and appearance in Nepal is
interesting and this may merit further exploration in terms of children’s interpretation
of these two questions in that country.
Table 23: Self – Summary of rankings and relative scores by country for each question
See Chapter 1 for an explanation of the calculation of the relative scores
Rankings Relative scores
Health Body
Appear-
ance
Self-
confidence Health Body
Appear-
ance
Self-
confidence
Algeria* 6 6 4 4 1.00 1.01 1.06 1.06
Colombia* 2 1 1 2 1.04 1.06 1.05 1.04
Estonia 12 12 10 10 0.99 0.97 0.99 1.00
Ethiopia 10 7 7 7 1.02 1.06 1.06 1.05
Germany 8 13 11 12 1.01 0.95 0.97 0.99
Israel 4 3 3 5 1.01 1.04 1.05 0.99
Nepal 14 9 12 11 1.00 1.04 0.96 1.02
Norway 7 11 9 9 0.96 0.92 0.94 0.94
Poland* 9 10 n/a 8 0.99 0.97 n/a 0.98
Romania 1 2 2 1 0.99 1.02 1.02 1.01
S Africa* 11 5 6 13 1.01 1.07 1.05 1.00
S Korea 15 15 14 14 0.99 0.92 0.90 0.96
Spain* 5 8 8 6 1.02 1.00 1.00 1.01
Turkey* 3 4 5 3 0.99 1.01 1.00 1.02
UK* 13 14 13 15 0.99 0.94 0.94 0.92
10 and 12 year old surveys, all countries, equally weighted by age group

Children’s Worlds Report, 2015
96
Variations by age group This is an aspect of children’s lives where there are noticeable drops in levels of satisfaction
between the ages of 10 and 12, particularly for body, appearance and self-confidence, as shown
in the chart below.
Figure 67: Satisfaction questions about self
10 and 12 year old surveys, all countries, equally weighted by country
However, these age group differences are not consistently seen across the data set. In Estonia,
Germany, Norway, Poland (where data is available), South Korea, Spain, Turkey and the UK,
children in the 12-years-old survey were much less satisfied with their body, appearance and
self-confidence than in the 10-year-old survey. Some of these differences are quite sizeable – for
example in the UK and South Korea the mean scores for appearance were around 10% lower in
the 12-years-old survey compared to the 10-years-old survey (7.3 compared to 8.3 in the UK, 6.7
compared to 7.8 in South Korea). But these age-related patterns are not reflected in all countries
as shown in Figure 68 . For example, satisfaction with appearance was actually slightly higher
(not statistically significant so) among 12-year-olds in Ethiopia (mean score of 8.8) than among
10-year olds (8.6). It would therefore be interesting to consider further why there are such sharp
drops in children’s satisfaction with these aspects of their lives in most European and some
other countries.
8.4
8.2
8.2
8.8
8.9
8.7
8.8
9.1
0 2 4 6 8 10
Self-confidence
Appearance
Body
Health
Mean satisfaction (out of 10)
10 year old 12 year olds

Children’s Worlds Report, 2015
97
Figure 68: Satisfaction with appearance by age group and country
Variations by gender There are some similar patterns in relation to gender differences within countries for these
questions. Using the criteria for statistical significance outlined in Chapter 1:
There was no evidence of gender differences for satisfaction with health
Satisfaction with one’s body was lower among girls than boys in six countries – Estonia,
Germany, Norway, Poland, UK and South Korea
Satisfaction with appearance was lower among girls than boys in Germany, Norway,
UK and South Korea
Satisfaction with self-confidence was lower among girls than boys in Germany, UK and
South Korea
Again this pattern of gender differences is not in evidence across all countries. For example, in
terms of satisfaction with appearance, girls in Colombia have higher mean scores (9.5) than
boys (9.2) and the same applies in Ethiopia (8.8 for girls compared to 8.6 for boys) and Nepal
(8.0 for girls and 7.8 for boys), although in none of these countries is the difference statistically
8.8
9.4
8.7
7.9
9.1
9.2
9.0
8.3
7.8
8.4
7.8
7.9
7.3
6.7
8.6
9.3
8.7
7.9
9.2
9.5
9.4
9.0
8.5
9.4
8.8
8.9
8.3
7.8
0 2 4 6 8 10
Ethiopia
Romania
S Africa*
Nepal
Algeria*
Colombia*
Israel
Spain*
Germany
Turkey*
Estonia
Norway
UK*
S Korea
Mean satisfaction with appearance (out of 10)
10 years old 12 years old

Children’s Worlds Report, 2015
98
significant. Mean satisfaction ratings for appearance are very similar (within 0.1) for girls and
boys in a number of other countries – Algeria, Israel, Romania and South Africa.
Figure 69 shows similar patterns for satisfaction with one’s body, the largest proportional
differences are in the UK where the mean score for boys is around 15% higher than for girls.
This contrasts with seven countries (from Romania to Nepal in the chart) where girls had
marginally higher satisfaction with this aspect.
Figure 69: Satisfaction with body by gender and country
Variations by gender and age group The size of the differences in satisfaction with some of these aspects of life according to gender
and age group is illustrated in the chart below which focuses on the six countries where the
majority of substantial differences occur. The chart shows mean scores for satisfaction with
one’s body, broken down by age group and gender in each country. It can be seen that the
gender differences are much more pronounced among the 12-year-old age group than the 10-
year-old age group with gender differences of more than one point of 10 in the UK and
Germany in particular.
8.4
9.4
8.6
9.1
8.8
8.7
9.3
9.2
8.8
8.4
8.7
7.7
8.6
8.5
8.4
8.7
9.6
8.7
9.2
8.9
8.8
9.4
9.0
8.5
7.9
8.1
7.1
8.0
7.6
7.3
0 2 4 6 8 10 12
Nepal
Colombia*
Ethiopia
Israel
S Africa*
Algeria*
Romania
Turkey*
Spain*
Estonia
Poland*
S Korea
Norway
Germany
UK*
Mean satisfaction with body (out of 10)
Girls Boys

Children’s Worlds Report, 2015
99
Figure 70: Mean satisfaction with ‘your body’ by age group and gender in six countries
Summary and discussion This chapter has looked at variations in children’s evaluations of aspects of ‘self’ – their health,
bodies, appearance and self-confidence. Taking the survey sample as a whole, children’s levels
of satisfaction with these four topics were in the middle range compared to other aspects of life.
However this broad finding conceals considerable variation according to country, age group
and gender.
Children in Colombia, Romania and Turkey had the highest absolute scores for this aspect of
life while South Korea and the UK had the lowest. In relative terms (i.e. compared to
satisfaction with other aspects of life) children in Algeria, Ethiopia and South Africa tended also
to be satisfied with this aspect of life. Overall there were indications of a divide between low
scores in South Korea and countries in the northern half of Europe and high scores elsewhere.
These patterns were broadly reinforced by the evidence on age and gender variations. In South
Korea, the UK, Estonia, Germany, Norway and Poland children in the 12-years old survey
tended to have significantly lower satisfaction than children in the 10-years-old survey; and
girls tended to have significantly lower satisfaction than boys. An important point here is that
these age and gender variations were not in evidence in most other countries in the survey.
The combination of age and gender factors produces some of the most striking variations in
satisfaction in the report as shown in the figure above. For example, satisfaction with ‘your
body’ varied in the UK from 8.7 out of 10 among boys in the 10-years-old survey to 6.4 out of 10
for girls in the 12-years-old survey.
The fact that in many countries there was little or no evidence of age or gender differences in
children’s satisfaction with the aspects of life covered in this chapter highlights important
questions to be considered further in the six countries shown in Figure 70 regarding why such
differences exist in these countries.
0
1
2
3
4
5
6
7
8
9
10
Estonia Germany Norway Poland* South Korea UK*
Mean
sat
isfa
ctio
n s
core
(out
of 10)
Boys, 10 Girls, 10 Boys, 12 Girls, 12

Children’s Worlds Report, 2015
100
Chapter 11
Other aspects of life
Overview Children were also asked satisfaction questions about a number of other aspects of life that cut
across some of the topics considered in previous chapters.
Box 10: Other satisfaction questions
Satisfaction questions
How satisfied are you with ..
The freedom you have
The amount of opportunities you have in life
How you are listened to by adults in general
How safe you feel
With the things you want to be good at
About doing things away from your home
About what may happen to you later in your life
With your preparation for the future
Responses were on a unipolar, 11-point scale from 0-10, with 0 labelled as ‘Not at all satisfied’
and 10 labelled as ‘Totally satisfied’.
Notes: Item 3 was not asked in Poland; item 8 was not asked in six countries; and item 2 was
only asked in the 12-years-old survey.
Items 4 to 7 in the above list were included as they are part of the Personal Well-being Index –
School Children, which is one of the psychometric scales included in the questionnaire – see
Chapter 4 for further discussion.
The final item about preparation for the future was omitted from the questionnaires in six
countries and so is not considered further here.
The presentation of key statistics in this chapter is more brief than in the previous ones partly
because these items do not represent a coherent theme that can be discussed and partly because
as indicated above some of the items are items of a scale which is dealt with elsewhere.
Mean scores and percentages of children with low well-being for the 15 countries as a whole are
shown in the chart below. In general, children were a little more satisfied with their safety and
with ‘the things you want to be good at’ than with other five aspects which all have very similar
satisfaction ratings.

Children’s Worlds Report, 2015
101
Figure 71: Satisfaction questions about other aspects of life
10 and 12 year old surveys, all countries, equally weighted by age group and country
Variations by country The patterns in mean scores across the seven aspects of life and different countries are shown in
the next two tables.
Table 24 shows the rankings of the mean scores:
Three countries – Romania, Turkey and Colombia – rank consistently highly
Ethiopia and South Korea rank consistently low in all aspects
For a few countries and aspects of life there are notable variations. Nepal and South
Africa rank much higher on satisfaction with ‘things you want to be good at’ than on
other aspects; while the opposite is true in Norway and Germany
Table 25 shows the relative scores which put each mean score in the context of the overall
pattern of responses to the satisfaction questions within countries and also across particular
aspects (see Chapter 1 for details of how these scores are calculated). This table indicates that
most scores are relatively close to what would be expected from the general pattern of
responses within each country and the general level of responses for each aspect. However:
Within the ‘doing things away from home’ aspect there are some notable patterns with
Germany, Estonia and Poland faring relatively well and Algeria, South Africa, Nepal
and Ethiopia faring comparatively poorly. It is not clear what interpretation should be
put on these findings but it was shown in Chapter 8 that these last four countries all
score relatively low for satisfaction with outdoor areas in the locality, so it may be that
children view this question as relating to that aspect of life. (This item wording is from
the Personal Well-being Index – School Children and was intended to measure aspects
of community rather than local facilities, see Cummins & Lau, 2005)
Children in Nepal and, to a lesser extent, Ethiopia have relatively low satisfaction for
most of these aspects of life, taking into account their responses to the whole set of
satisfaction questions within the questionnaire
Children in Germany, Poland and Turkey have relatively high scores for ‘what may
happen later in life’
8.4
8.5
8.5
8.5
8.9
8.8
8.5
7.3%
5.9%
7.1%
7.2%
3.3%
4.0%
6.7%
Later in life
Opportunities
Freedom
Doing things away from home
Things you want to be good at
Safety
Feeling listened to% with low satisfaction
Mean satisfaction (out of 10)

Children’s Worlds Report, 2015
102
Table 24: Other aspects of life – Summary of rankings by country for each question
Listened to Safety
Things want
be good at Things away
from home Freedom
Opport-
unities Later in life
Algeria* 4 5 4 13 12 7 6
Colombia* 5 3 2 3 5 1 2
Estonia 9 10 9 6 11 9 10
Ethiopia 13 14 12 12 15 13 14
Germany 8 9 14 8 6 6 5
Israel 6 7 5 7 4 4 8
Nepal 14 12 6 14 14 14 15
Norway 3 4 11 5 3 3 7
Poland* n/a 6 10 4 7 10 4
Romania 1 1 1 1 1 2 3
S Africa* 11 13 7 15 10 11 13
S Korea 12 15 15 11 13 15 12
Spain* 7 8 8 9 9 12 9
Turkey* 2 2 3 2 2 5 1
UK* 10 11 13 10 8 8 11
10 and 12 year old surveys, all countries, equally weighted by age group
Table 25: Other aspects of life – Summary of relative scores by country for each question
See Chapter 1 for an explanation of the calculation of the relative scores
Listened to Safety
Things want
be good at Things away
from home Freedom
Opport-
unities Later in life
Algeria* 1.04 1.02 1.03 0.88 0.95 1.00 1.05
Colombia* 1.00 1.00 1.02 1.03 1.01 1.04 1.05
Estonia 1.01 1.01 1.01 1.07 0.98 1.01 1.01
Ethiopia 0.98 0.97 1.02 0.93 0.96 0.99 0.95
Germany 1.01 1.00 0.96 1.06 1.04 1.02 1.08
Israel 0.99 0.99 1.00 1.02 1.03 1.02 1.01
Nepal 0.92 1.01 1.06 0.91 0.96 0.96 0.71
Norway 1.00 0.99 0.94 1.02 1.02 1.02 1.01
Poland* n/a 1.01 0.99 1.06 1.02 0.99 1.06
Romania 1.01 1.00 1.00 1.03 1.02 1.01 0.99
S Africa* 1.01 0.99 1.04 0.88 1.00 1.02 0.97
S Korea 1.00 0.97 0.97 1.02 0.99 0.93 1.01
Spain* 0.99 1.00 0.99 1.02 0.97 0.95 1.02
Turkey* 1.02 1.02 0.99 1.03 1.02 0.99 1.06
UK* 1.01 1.01 0.99 1.02 1.02 1.02 0.99
10 and 12 year old surveys, all countries, equally weighted by age group

Children’s Worlds Report, 2015
103
Variations by age group There were a number of significant age differences in mean satisfaction with the above aspects
of life in some countries. Children in the 10-year-old survey were more satisfied than children in
the 12-years-old survey with all six aspects of life in South Korea and Turkey. There were also
significant differences in Poland (5 aspects), Spain (4 aspects), Estonia (3 aspects) and Norway
(one aspect). In all these cases 10-year-olds had higher satisfaction than 12-year-olds. The
reason for these variations in these particular countries is not clear and will require further
exploration.
Variations by gender There were relatively few significant gender differences within countries among this set of
satisfaction items. The main point of note is that in three countries – South Korea, Germany and
Norway – girls were significantly less satisfied with ‘the things you want to be good at’. This
may relate to some of the patterns of gender difference in terms of sense of self which were
discussed in the previous chapter. There were four other aspects - safety, later in life,
opportunities and doing things away from home – for which girls in South Korea were
significantly less satisfied than boys. However it should be borne in mind that the South Korea
sample was substantially the largest in the survey and this may make it more likely that
significant differences will be identified.
Summary and discussion This chapter has looked briefly at a diverse group of questions about satisfaction with various
aspects of life not covered in other chapters. This includes cross-cutting issues of freedom,
safety and being listened to that are relevant across different parts of children’s lives.
For the most part the patterns of satisfaction for these questions reflected those across the
survey as a whole with countries such as Romania, Turkey and Colombia, who tend to score
higher than average, ranking highest here and countries such as South Korea and Ethiopia
ranking lowest.
The two aspects where there were the most noticeable cross-national variations were ‘doing
things away from your home’ and ‘what may happen later in your life’. For the first question,
Nepal and the three African countries in the sample had relatively low levels of satisfaction
while children in Estonia, Germany and Poland had relatively high scores. It may be that
children link this question with the topic of local area discussed in Chapter 9 where there were
similar between-country patterns. For the second question, about the future, there were also
some notable variations with Germany, Poland and Turkey scoring high in relative terms and
Ethiopia, Nepal and South Africa scoring relatively low.
There were substantial age-related drops in satisfaction with some or all of these aspects of life
in South Korea, Turkey, Poland, Spain and Estonia. There was less evidence of gender
variations although the question about ‘things you want to be good at’ may possibly link with
the questions about ‘self’ discussed in the previous chapter.
Overall, perhaps the most useful next analysis that can be done with these items is to explore
their place within an overall framework of the different components of children’s overall well-
being.

Children’s Worlds Report, 2015
104
Chapter 12
Children’s rights
Overview The three questions that children were asked about children’s rights are shown in the box below
Box 11: Questions about children’s rights
Please answer the following questions about children’s rights
I know what rights children have
I know about the children’s rights convention
I think, in my country, adults in general respect children’s rights
Responses were on a three-point scale – ‘No’, ‘Not sure’, ‘Yes’
Responses for the pooled data from the 15 countries are shown in the chart below. A majority of
children felt that they knew what rights children have (58%) and that adults in their country
respected children’s rights (52%). However, a smaller proportion - less than half (42%) - said
that they knew about the children’s rights convention.
Figure 72: Questions about children’s rights
10 and 12 year old surveys, all countries, equally weighted by age group and country
Variations by age and gender There was very little variation in responses to these questions according to gender. There were
also no substantial variation according to age group for the first two questions, although
awareness of the UN Convention was slightly higher (43%) among 12-year-olds than 10-year
14%
25%
10%
35%
33%
32%
52%
42%
58%
0% 10% 20% 30% 40% 50% 60% 70% 80% 90% 100%
Adults respect children's rights
Know about UN convention
Know what rights children have
No Not sure Yes

Children’s Worlds Report, 2015
105
olds. However there was a significant age difference in relation to the question about adults
respecting children’s rights. Children in the 12-years-old survey had much less positive views
on this issue than children in the 10-years-old survey as shown in the figure below. In the 10-
years-old survey a majority (56%) of children said that they felt adults in their country respected
children’s rights whereas in the 12-years-old survey the percentage decreased to 48%. We will
return to this pattern after looking at differences between countries.
Figure 73: Whether children feel that adults respect their rights
10 and 12 year old surveys, all countries, equally weighted by age group and country
Variations by country
The three charts that follow show summaries of responses to each question for each country in
the survey.
In terms of the question about knowing about rights, there were wide variations. In Norway
and Colombia three-quarters of children felt that they knew what rights they had. In England,
South Korea, Israel and Germany less than half did so.
Levels of awareness of the children’s rights convention also varied widely between countries
with Germany, the lowest level of awareness, followed by the UK, Ethiopia, South Africa and
South Korea. In only four countries (Norway, Colombia, Turkey and Estonia) did more than half
of children say that they knew about the children’s rights convention.
Finally in response to the question about whether adults respected children’s rights, children in
Norway had much higher levels of agreement (84%) than any other country. Excluding
Norway, levels of agreement ranged from 33% in South Korea to 65% in Nepal.
16%
12%
37%
32%
48%
56%
0% 20% 40% 60% 80% 100%
12 years old
10 years old
No Not sure Yes

Children’s Worlds Report, 2015
106
Figure 74: Responses to ‘I know what rights children have’ by country
10 and 12 year old surveys, all countries, equally weighted by age group
Figure 75: Responses to ‘I know about the children’s rights convention’ by country
10 and 12 year old surveys, all countries, equally weighted by age group
36%
44%
48%
49%
51%
52%
54%
54%
62%
62%
68%
71%
71%
75%
77%
0% 20% 40% 60% 80% 100%
UK*
S Korea
Israel
Germany
Algeria*
Spain*
Estonia
S Africa*
Ethiopia
Romania
Turkey*
Nepal
Poland*
Colombia*
Norway
% of children
No Not sure Yes
16%
29%
30%
30%
31%
35%
36%
42%
43%
49%
50%
51%
52%
62%
76%
0% 20% 40% 60% 80% 100%
Germany
UK*
Ethiopia
S Africa*
S Korea
Algeria*
Nepal
Spain*
Israel
Poland*
Romania
Estonia
Turkey*
Colombia*
Norway
% of children
No Not sure Yes

Children’s Worlds Report, 2015
107
Figure 76: Responses to ‘I think, in my country, adults in general respect children’s right’ by
country
10 and 12 year old surveys, all countries, equally weighted by age group
Variations by country and age group: adults respecting children’s rights Given the substantial variations both by country and by age group in the proportion of children
feeling that adults in their country respect children’s rights it is interesting to consider these two
issues jointly.
The chart below shows both the proportion of children who answered ‘yes’ to this question in
each country and age group (the bars on the left) and the proportion of children who answered
‘no’ to this question (the bars on the right). The reason for showing both is that are different
interpretations depending on which statistic is being considered.
It is apparent that the overall age group differences summarised above mask considerable
variation in age-related patterns between countries
The drop in percentage of children saying ‘yes’ to this question between the two age
groups was 23% in Turkey (from 73% of 10-year-olds to 50% of 12-year-olds)
In six other countries – UK, Estonia, Spain, Romania, Poland and South Korea – the
percentage dropped by more than 10% between the two age groups. Germany was not
far behind with an 8% drop
In other countries – Norway, Israel, South Africa, Colombia and Algeria - there was less
evidence of an age pattern in the proportion responding ‘yes’
In Ethiopia there was no difference in the percentage of children saying ‘yes’ to this
question in the two age groups
33%
41%
44%
45%
46%
47%
48%
50%
51%
53%
54%
56%
61%
65%
84%
0% 20% 40% 60% 80% 100%
S Korea
Algeria*
S Africa*
Colombia*
Poland*
Israel
Ethiopia
Romania
Spain*
Germany
Estonia
UK*
Turkey*
Nepal
Norway
% of children
No Not sure Yes

Children’s Worlds Report, 2015
108
Finally, in Nepal there was a slight increase (61% to 64%) in the percentage across the
two age groups.
The result of these fluctuations is that, for example, Poland ranks 9th highest in terms of
‘yes’ responses among 10-year-olds but 14th highest among 12-year-olds.
Figure 77: Variations in views about whether adults respect children’s rights by country and
age group
10 and 12 year old surveys, all countries
39%
41%
47%
48%
46%
49%
54%
57%
57%
59%
60%
62%
73%
61%
86%
27%
40%
43%
44%
46%
44%
39%
47%
49%
48%
50%
50%
50%
64%
84%
11%
16%
21%
15%
28%
13%
8%
18%
6%
8%
4%
7%
7%
16%
2%
23%
22%
32%
24%
22%
19%
14%
14%
12%
9%
7%
11%
12%
9%
2%
0%20%40%60%80%100%
0% 20% 40% 60% 80% 100%
S Korea
Algeria*
Colombia*
S Africa*
Ethiopia
Israel
Poland*
Romania
Germany
Spain*
Estonia
UK*
Turkey*
Nepal
Norway
12 year olds, Yes 10 year olds, Yes 12 year olds, No 10 year olds, No

Children’s Worlds Report, 2015
109
Turning to the proportion of children saying ‘no’ to the question. The patterns here are similar
but with some differences – which are a result of variations in the proportion of children
selecting the ‘don’t know’ option across countries and age groups:
In a few countries – Germany, Poland and South Korea – the percentage of children
saying ‘no’ to the statement about adults respecting children’s rights roughly doubles
between the two age groups.
In several other countries – e.g. Israel, Colombia and Algeria – there are also substantial
leaps in the percentage of children answering ‘no’ between the ages of 10 and 12.
On the other hand in four countries – Nepal, Ethiopia, Romania and (based on a very
small percentage) Norway – there is a drop in the percentage of children’s answering
‘no’ at the age of 12 compared to at the age of 10.
In summary, this analysis has shown substantial differences across countries in the way that
children’s views of adults’ respect for children’s rights varies by age. It suggests that in some
countries children aged 12 have a substantially poorer view of adults than children aged 10
whereas in other countries this age pattern is not evident. It would require further research
with a wider age range to explore how children’s views on this matter vary during adolescence.
Summary and discussion Children’s responses to the three questions considered in this chapter show substantial
variations in knowledge about children’s rights and in opinions about adults’ respect for these
rights between the 15 countries covered in this survey. The table below provides a summary of
the between-country comparisons based on the rankings of each country on the three questions.
This illustrates some differences in rankings according to knowledge compared to opinions
about adults. Children in Norway and Turkey rank highly on both of these aspects; while
children in Algeria and South Korea rank relatively low for both. Some countries – e.g. UK and
Germany – rank low for knowledge but higher in terms of children’s opinions about adults’
respect of children’s rights. In these cases it is not clear how reliable children’s opinions of the
latter are, if they do not feel confident in knowing what their rights are. In contrast, in
Colombia for example, children feel that they know what their rights are but, in relative terms,
are less positive about adults’ respect for these rights.
The analysis in this chapter also highlights age-related differences in responses to these
questions. Overall, the older children (aged around 12) tend to feel that they know a little more
about their rights than the younger age group (around 10 years old) but also feel less positive
about adults’ respect for their rights. However this pattern is not uniformly in evidence across
all countries and this points to the potential for further analysis of cross-national differences in
children’s experiences and views about this topic.

Children’s Worlds Report, 2015
110
Table 26: Country ranking32 for each children’s rights question
Know about
rights
Know about
UN convention
Adults respect
child rights
Mean ranking
Norway 1 1 1 1.0 Turkey* 5 3 3 3.7
Nepal 4 9 2 5.0 Poland* 3 5 9 5.7
Colombia* 2 2 13 5.7 Romania 6 4 8 6.0
Estonia 9 6 5 6.7 Spain* 11 8 6 8.3
Ethiopia 7 11 11 9.7 Israel 13 7 10 10.0
South Africa* 8 12 12 10.7 UK* 15 14 4 11.0
Germany 12 15 7 11.3 Algeria* 10 10 14 11.3
South Korea 14 13 15 14.0
10 and 12 year old surveys, all countries, equally weighted by age group
32 Based on percentage of ‘Yes’ responses

Children’s Worlds Report, 2015
111
Chapter 13
Time use
Overview Questions about time use were asked in four different sections of the questionnaire as follows:
Three frequency questions relating to family
Three frequency questions relating to friends
A list of ten frequency questions on a range of topics in a specific section on time use
Two satisfaction questions
The question wordings are shown on the next page. Levels of missing data (‘Don’t know’
responses and blank responses) were below 5% for all questions. The following analysis
excludes these responses.
A summary of responses to the frequency questions is shown in Tables 25 to 27.
For the three family time use questions almost two-thirds of children said that they
spent time talking together with family every day and over one-third said that they had
fun with family and spent time learning with family every day.
For the three friends time use questions the balance was slightly different with a higher
frequency of having fun together and a lower frequency of studying together.
Doing homework was the most common activity in the list of ten general items – with
79% of children doing this every day or almost every day.
The next most common activity was watching television.
By far the least common activity was organised leisure activities which only 12% of
children did every day or almost every day.
Exploratory factor analysis of the ten general time use frequency questions was undertaken33
and suggested that there are three groupings of variables:
Group 1 (Relaxing): ‘Watching TV’, ‘Using a computer’ and ‘Just being by myself’.
Group 2 (Being active): ‘Taking classes outside school time’, ‘Organised leisure time
activities’ and ‘Playing sports or doing exercise’.
Group 3 (Working and caring): ‘Doing homework’, ‘Helping with housework’ and
‘Taking care of family members’.
‘Reading for fun’ did not fit neatly into one grouping but was most strongly associated with
Group 3.
33 Using both Principal Axis Factoring and Principal Components Analysis

Children’s Worlds Report, 2015
112
This analysis would need further testing on a country-by-country basis so we have not created
summary scores for each factor, but in the rest of this chapter have presented the activities in
this order so that any similarities of findings within groups of activities can be identified.
Box 12: Questions about time use
Family questions
How often in the past week have you spent time doing the following things with your family?
Talking together
Having fun together
Learning together
Responses were on a four-point frequency scale from ‘Not at all’ to ‘Every day’, plus ‘Don’t
know’
Friends questions
How often in the past week have you spent time doing the following things with your friends
apart from at school?
Talking together
Having fun together
Learning together
Responses were on a four-point frequency scale from ‘Not at all’ to ‘Every day’, plus ‘Don’t
know’
General time use questions
How often do you usually spend time doing the following activities when you are not at school?
Taking classes outside school time on matters different than at school
Participating in organised leisure-time activities*
Reading for fun (not homework)
Helping around the house
Doing homework
Watching TV or listening to music
Playing sports or doing exercise
Using a computer
Spending time just being by myself*
Taking care of brothers or sisters or other family members*
Responses were on a four-point frequency scale from ‘Rarely or never’ to ‘Every day or almost
every day’, plus ‘Don’t know’
The three items marked with a * were only asked in the questionnaire for 12-year-olds.
Satisfaction questions
How satisfied are you with ..
How you use your time
What you do in your free time
Responses were on a unipolar, 11-point scale from 0-10, with 0 labelled as ‘Not at all satisfied’
and 10 labelled as ‘Totally satisfied’.

Children’s Worlds Report, 2015
113
Table 27: Frequency questions about time with family
Not at all
Once or
twice Most days Every day
Talking together 3% 12% 23% 62%
Having fun together 6% 21% 38% 35%
Learning together 12% 22% 30% 36%
10 and 12 year old surveys, all countries, equally weighted by age group and country
Table 28: Frequency questions about time with friends
Not at all
Once or
twice Most days Every day
Talking together 5% 15% 27% 53%
Having fun together 7% 17% 32% 43%
Meeting to study 39% 30% 17% 14%
10 and 12 year old surveys, all countries, equally weighted by age group and country
Table 29: General time use questions
Rarely or
never
Less than
once a week
Once or
twice a
week
Every day or
almost
Watching TV / Listening to music 6% 6% 18% 69%
Using a computer 22% 11% 25% 42%
Spending time by one’s self 21% 19% 27% 33%
Taking classes outside school time 28% 10% 33% 29%
Organised leisure-time activities 55% 13% 20% 12%
Playing sports / Doing exercise 9% 10% 30% 51%
Doing homework 3% 5% 15% 78%
Helping around the house 7% 10% 29% 53%
Taking care of family members 29% 13% 21% 38%
Reading for fun 22% 15% 27% 36%
10 and 12 year old surveys, all countries, equally weighted by age group and country
Items 2, 9 and 10 only asked of 12-year-olds

Children’s Worlds Report, 2015
114
A summary of responses to the two satisfaction questions for the whole data set is shown in the
chart below. Less than one in 20 children had low satisfaction with these two aspects of life.
Figure 78: Satisfaction questions about time use
10 and 12 year old surveys, all countries, equally weighted by age group and country
Variations by country The charts on the following pages, provide country-by-country breakdowns of the responses to
each of the 18 questions considered in this section.
A visual inspection of the first six charts, covering time spent with family and friends, based on
the proportion of children who said that they spent time every day on particular activities
suggests some interesting patterns:
The lives of children in Nepal appear to be quite family-focused, with children being
more likely to spend time on the three activities with family every day than the similar
set of activities with friends.
The country with the strongest focus on time spent with friends is South Africa.
Children in Norway, Germany and Spain report the greatest frequency of talking to
family. But the same is not true for the two other family activities questions where these
countries are lower in the rankings.
Children in Algeria, in comparison with the other countries, most frequently spend
time having fun with family and learning together with family.
The frequency of spending time studying with friends is highest in the three African
countries. The six countries where this activity is least common are all in Europe.
The next ten charts relate to the general time use questions and are discussed further following
the charts.
8.9
8.6
4.0%
4.7%
What you do in free time
How you use your time
% with low satisfaction
Mean satisfaction (out of 10)

Children’s Worlds Report, 2015
115
Figure 79: Frequency of ‘Talking together with family’ by country
10 and 12 year old surveys, all countries, equally weighted by age group and country
Figure 80: Frequency of ‘Having fun together with family’ by country
10 and 12 year old surveys, all countries, equally weighted by age group and country
0% 10% 20% 30% 40% 50% 60% 70% 80% 90% 100%
Ethiopia
S Korea
Colombia*
Nepal
Turkey*
S Africa*
Poland*
Israel
Algeria*
Estonia
UK*
Romania
Spain*
Germany
Norway
% of children
Not at all Once or twice a week Most days Every day
0% 10% 20% 30% 40% 50% 60% 70% 80% 90% 100%
S Korea
Poland*
Estonia
Ethiopia
Spain*
Turkey*
Colombia*
UK*
Norway
Nepal
Germany
Israel
Romania
S Africa*
Algeria*
% of children
Not at all Once or twice a week Most days Every day

Children’s Worlds Report, 2015
116
Figure 81: Frequency of ‘Learning together with family’ by country
10 and 12 year old surveys, all countries, equally weighted by age group and country
Figure 82: Frequency of ‘Talking together with friends’ by country
10 and 12 year old surveys, all countries, equally weighted by age group and country
0% 10% 20% 30% 40% 50% 60% 70% 80% 90% 100%
Germany
S Korea
UK*
Estonia
Norway
Ethiopia
Israel
Spain*
Poland*
Romania
S Africa*
Turkey*
Colombia*
Nepal
Algeria*
% of children
Not at all Once or twice a week Most days Every day
0% 10% 20% 30% 40% 50% 60% 70% 80% 90% 100%
Ethiopia
Nepal
Turkey*
Estonia
Romania
Colombia*
Algeria*
UK*
S Korea
Germany
Norway
Spain*
Poland*
S Africa*
Israel
% of children
Not at all Once or twice a week Most days Every day

Children’s Worlds Report, 2015
117
Figure 83: Frequency of ‘Having fun together with friends’ by country
10 and 12 year old surveys, all countries, equally weighted by age group and country
Figure 84: Frequency of ‘Meeting to study with friends’ by country
10 and 12 year old surveys, all countries, equally weighted by age group and country
0% 10% 20% 30% 40% 50% 60% 70% 80% 90% 100%
Nepal
Ethiopia
Estonia
Algeria*
Turkey*
Romania
S Korea
Poland*
Germany
UK*
Norway
Israel
Spain*
Colombia*
S Africa*
% of children
Not at all Once or twice a week Most days Every day
0% 10% 20% 30% 40% 50% 60% 70% 80% 90% 100%
Germany
Spain*
UK*
Norway
Estonia
Poland*
Israel
Romania
Turkey*
S Korea
Colombia*
Nepal
Ethiopia
Algeria*
S Africa*
% of children
Not at all Once or twice a week Most days Every day

Children’s Worlds Report, 2015
118
Figure 85: Frequency of ‘Watching TV or listening to music’ by country
10 and 12 year old surveys, all countries, equally weighted by age group and country
Figure 86: Frequency of ‘Using a computer’ by country
10 and 12 year old surveys, all countries, equally weighted by age group and country
0% 10% 20% 30% 40% 50% 60% 70% 80% 90% 100%
Ethiopia
Nepal
Algeria*
Turkey*
S Korea
S Africa*
Spain*
Colombia*
Germany
Romania
Israel
Poland*
UK*
Norway
Estonia
% of children
Rarely or never Less than once a week Once or twice a week Every day or almost
0% 10% 20% 30% 40% 50% 60% 70% 80% 90% 100%
Ethiopia
Nepal
S Korea
Germany
Algeria*
Turkey*
S Africa*
Norway
Spain*
Romania
Colombia*
UK*
Poland*
Israel
Estonia
% of children
Rarely or never Less than once a week Once or twice a week Every day or almost

Children’s Worlds Report, 2015
119
Figure 87: Frequency of ‘Just being by myself’ by country
10 and 12 year old surveys, all countries, equally weighted by age group and country
Figure 88: Frequency of ‘Taking classes outside school time’ by country
10 and 12 year old surveys, all countries, equally weighted by age group and country
0% 10% 20% 30% 40% 50% 60% 70% 80% 90% 100%
Ethiopia
Nepal
Romania
Algeria*
Germany
S Korea
Colombia*
Norway
Turkey*
Poland*
Estonia
Israel
S Africa*
Spain*
UK*
% of children
Rarely or never Less than once a week Once or twice a week Every day or almost
0% 10% 20% 30% 40% 50% 60% 70% 80% 90% 100%
UK*
Nepal
Ethiopia
Romania
Turkey*
Poland*
Algeria*
S Korea
Israel
Colombia*
S Africa*
Norway
Germany
Spain*
Estonia
% of children
Rarely or never Less than once a week Once or twice a week Every day or almost

Children’s Worlds Report, 2015
120
Figure 89: Frequency of ‘Participating in organised leisure-time activities’ by country
10 and 12 year old surveys, all countries, equally weighted by age group and country
Figure 90: Frequency of ‘Playing sports or doing exercise’ by country
10 and 12 year old surveys, all countries, equally weighted by age group and country
0% 10% 20% 30% 40% 50% 60% 70% 80% 90% 100%
S Korea
Poland*
Estonia
Norway
Germany
Spain*
Romania
Ethiopia
Israel
Nepal
Algeria*
Colombia*
UK*
Turkey*
S Africa*
% of children
Rarely or never Less than once a week Once or twice a week Every day or almost
0% 10% 20% 30% 40% 50% 60% 70% 80% 90% 100%
Ethiopia
S Korea
Algeria*
Nepal
Turkey*
Colombia*
Germany
UK*
Estonia
Spain*
Romania
S Africa*
Israel
Norway
Poland*
% of children
Rarely or never Less than once a week Once or twice a week Every day or almost

Children’s Worlds Report, 2015
121
Figure 91: Frequency of ‘Doing homework’ by country
10 and 12 year old surveys, all countries, equally weighted by age group and country
Figure 92: Frequency of ‘Helping around the home’ by country
10 and 12 year old surveys, all countries, equally weighted by age group and country
0% 10% 20% 30% 40% 50% 60% 70% 80% 90% 100%
UK*
S Korea
Colombia*
Ethiopia
S Africa*
Nepal
Algeria*
Germany
Israel
Norway
Turkey*
Romania
Spain*
Poland*
Estonia
% of children
Rarely or never Less than once a week Once or twice a week Every day or almost
0% 10% 20% 30% 40% 50% 60% 70% 80% 90% 100%
S Korea
Turkey*
Germany
Estonia
UK*
Colombia*
Israel
Norway
Spain*
S Africa*
Poland*
Algeria*
Ethiopia
Romania
Nepal
% of children
Rarely or never Less than once a week Once or twice a week Every day or almost

Children’s Worlds Report, 2015
122
Figure 93: Frequency of ‘Taking care of brothers, sisters and other family members’ by
country
10 and 12 year old surveys, all countries, equally weighted by age group and country
Figure 94: Frequency of ‘Reading for fun (not homework)’ by country
10 and 12 year old surveys, all countries, equally weighted by age group and country
0% 10% 20% 30% 40% 50% 60% 70% 80% 90% 100%
Germany
Turkey*
S Korea
Norway
Poland*
Colombia*
Israel
Romania
UK*
Ethiopia
Estonia
Spain*
Nepal
S Africa*
Algeria*
% of children
Rarely or never Less than once a week Once or twice a week Every day or almost
0% 10% 20% 30% 40% 50% 60% 70% 80% 90% 100%
Ethiopia
S Korea
Estonia
Colombia*
Poland*
Norway
UK*
Israel
Germany
Spain*
Algeria*
Nepal
Romania
Turkey*
S Africa*
% of children
Rarely or never Less than once a week Once or twice a week Every day or almost

Children’s Worlds Report, 2015
123
The patterns for the ten questions about general time use, shown in the charts above, are
summarised in terms of rankings in the table below. For example, in comparison with the other
countries:
Children in Estonia watch television and use computers most frequently. They also do
homework more frequently than children in the other 14 countries. On the other hand
they infrequently read for fun.
Children in Algeria spend most time taking care of siblings and other family members.
They play sports, watch television and use computers less often than children in most
of the countries surveyed.
Children in Nepal do housework most often of the 15 countries and children in Ethiopia
second most often. Children in these two countries also watch television and use
computers less often than children in the other 13 countries.
Children in England spend most time just being by themselves and have the lowest
frequency of doing homework and taking classes outside school.
Children in South Africa spend most time doing organised leisure activities.
Poland is the country where children most frequently play sports and exercise.
Table 30: Rankings34 of frequencies of each activity by country
TV
Comp-
uter By self Classes
Org.
leisure
Sports/
Exercise
Help
house
Care
family
Home
work
Reading
for fun
Algeria* 13 13 12 10 8 14 5 1 9 5
Colombia* 8 6 11 6 5 10 10 10 13 11
Estonia 1 1 5 1 12 5 12 5 1 14
Ethiopia 15 15 15 13 7 15 2 4 12 15
Germany 7 11 10 2 10 7 13 15 8 9
Israel 6 2 3 7 6 3 9 8 7 7
Nepal 14 14 13 11 3 12 1 2 10 4
Norway 2 7 6 4 14 2 8 12 6 10
Poland* 4 3 7 8 13 1 4 11 2 13
Romania 5 8 14 14 11 9 3 9 4 3
S Africa* 10 10 4 5 1 6 6 3 11 2
S Korea 11 12 9 9 15 13 14 13 14 12
Spain* 9 5 2 3 9 4 7 6 3 6
Turkey* 12 9 8 12 4 11 15 14 5 1
UK* 3 4 1 15 2 8 11 7 15 8
10 and 12 year old surveys, all countries, equally weighted by age group
Findings such as these suggest important differences in the nature of children’s everyday lives
which are likely to be linked to cultural, economic, demographic and other differences between
countries.
However, one of the challenges in this kind of international comparative work is taking account
of possible cultural differences in response patterns to these types of questions, as well as
differences that may result from translation of the questions into different languages. In
34 Based on mean ranks calculated using a Kruskal-Wallis test.
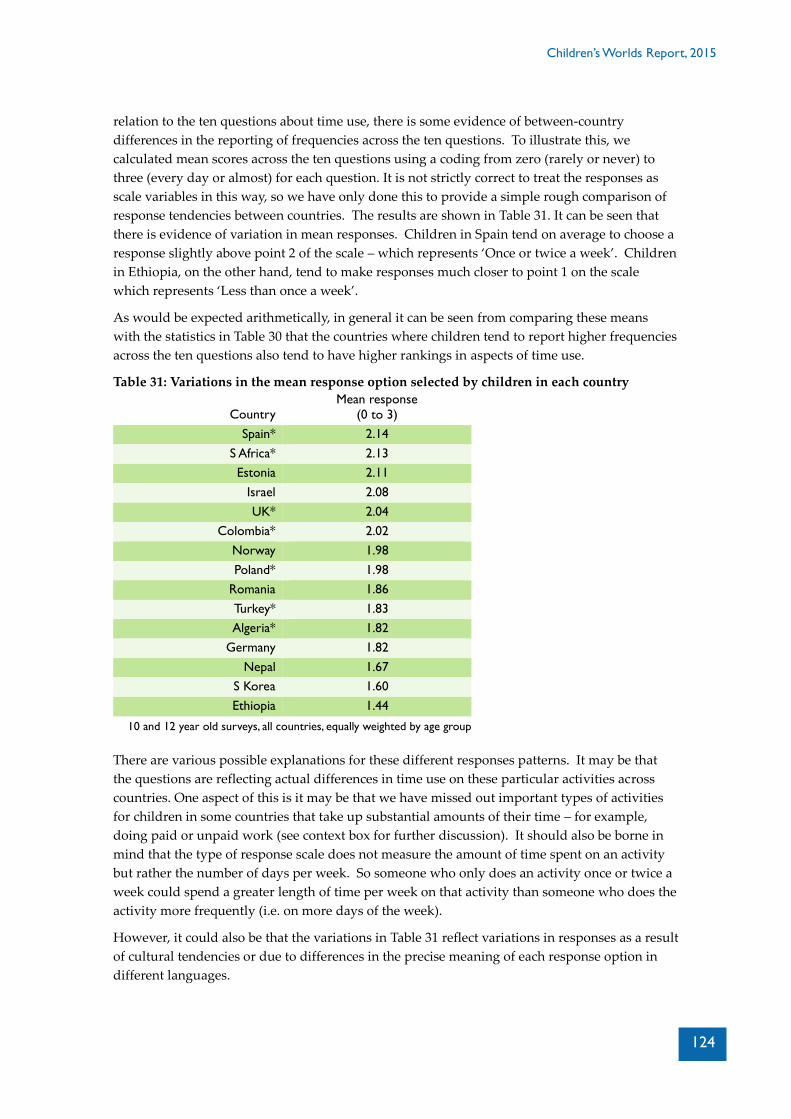
Children’s Worlds Report, 2015
124
relation to the ten questions about time use, there is some evidence of between-country
differences in the reporting of frequencies across the ten questions. To illustrate this, we
calculated mean scores across the ten questions using a coding from zero (rarely or never) to
three (every day or almost) for each question. It is not strictly correct to treat the responses as
scale variables in this way, so we have only done this to provide a simple rough comparison of
response tendencies between countries. The results are shown in Table 31. It can be seen that
there is evidence of variation in mean responses. Children in Spain tend on average to choose a
response slightly above point 2 of the scale – which represents ‘Once or twice a week’. Children
in Ethiopia, on the other hand, tend to make responses much closer to point 1 on the scale
which represents ‘Less than once a week’.
As would be expected arithmetically, in general it can be seen from comparing these means
with the statistics in Table 30 that the countries where children tend to report higher frequencies
across the ten questions also tend to have higher rankings in aspects of time use.
Table 31: Variations in the mean response option selected by children in each country
Country Mean response
(0 to 3)
Spain* 2.14
S Africa* 2.13
Estonia 2.11
Israel 2.08
UK* 2.04
Colombia* 2.02
Norway 1.98
Poland* 1.98
Romania 1.86
Turkey* 1.83
Algeria* 1.82
Germany 1.82
Nepal 1.67
S Korea 1.60
Ethiopia 1.44
10 and 12 year old surveys, all countries, equally weighted by age group
There are various possible explanations for these different responses patterns. It may be that
the questions are reflecting actual differences in time use on these particular activities across
countries. One aspect of this is it may be that we have missed out important types of activities
for children in some countries that take up substantial amounts of their time – for example,
doing paid or unpaid work (see context box for further discussion). It should also be borne in
mind that the type of response scale does not measure the amount of time spent on an activity
but rather the number of days per week. So someone who only does an activity once or twice a
week could spend a greater length of time per week on that activity than someone who does the
activity more frequently (i.e. on more days of the week).
However, it could also be that the variations in Table 31 reflect variations in responses as a result
of cultural tendencies or due to differences in the precise meaning of each response option in
different languages.

Children’s Worlds Report, 2015
125
Context 7
Countries: Algeria, Ethiopia
As for questions relating to family structure and material possessions, a challenge for the
Children’s Worlds survey was to identify a set of activities which covered a broad enough range
of topics to provide a meaningful picture of how children spend their time, while avoiding
selecting activities too specific to particular countries or cultures. Unsurprisingly, activities like
watching TV and using a computer were far more common in richer countries where these
resources are available to most children, and far less common in countries where they are in
possession only of the comparatively privileged few. Perhaps more interestingly, we found that
children in Algeria and Ethiopia especially seemed to spend more time on activities to help
support their home and family – such as helping around the home, and caring for other people in
their families – and less time on activities such as spending time with friends, than in many other
countries. This finding may in part relate to our findings on household structure – for example
as we noted earlier for children in South Africa, Algerian children tend to live in large, extended
family groups, and parents may require children to contribute to family activities such as caring
for younger siblings – research has found that a comparatively large proportion of mothers in
Algeria leave young children in the care of older children. In Ethiopia, in rural settings in
particular children are required to engage in helpful work such as fetching water and collecting
firewood (for girls) and herding cattle or helping with farming (for boys). As a result, children
have relatively little time to spend playing alone or with friends.
We cannot be sure from the survey data which of these (or other) explanations might account
for the observed differences. As a result it may not be reliable to make between-country
comparisons based on the absolute values of scores for each question. To try to address this
issue, Table 32 shows a different approach to making between-country comparisons which tries
to take into account the different response tendencies in each country as shown in Table 31.
Many of the patterns in Table 32 are the same or similar to those in Table 30.
For example, England still scores highly for children spending time by themselves and lowest
for homework and taking classes outside school.
However, some of the patterns vary considerably. This is particularly the case for Ethiopia,
South Korea and Nepal where children tend to report less frequency across all activities.
In Table 32, Ethiopia is the highest scoring country for housework (2nd in Table 30), caring for
family (4th in Table 30) and homework (12th in Table 30). The large change in ranking for
homework is partly due to the fact that there is relatively little difference between most of the
countries in terms of reported frequencies for this activity, with the most common response
being ‘Every day or almost’ in all countries (see Figure 91) so correcting the data for variations
in response tendencies across countries has a greater impact on the rankings in this case.
It is not clear which of these two approaches is the most appropriate for making comparisons of
time use across countries and it may be helpful to take the rankings both of absolute and
relative values into account in drawing conclusions.
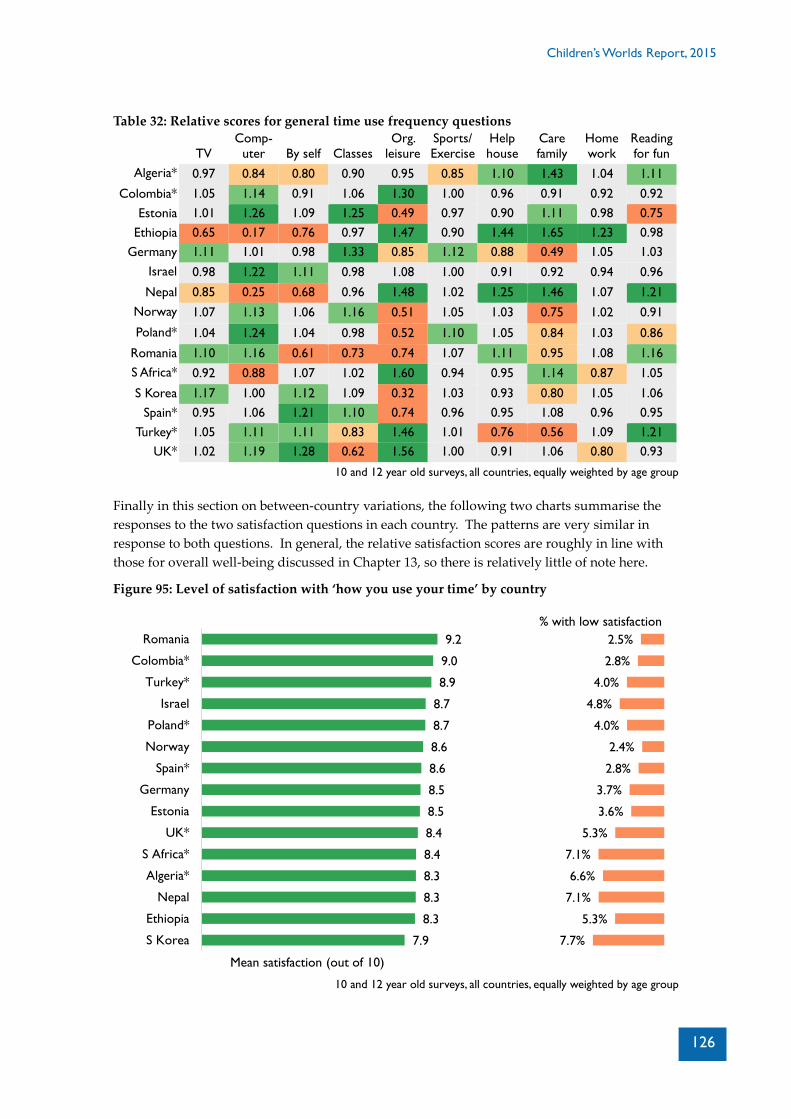
Children’s Worlds Report, 2015
126
Table 32: Relative scores for general time use frequency questions
TV
Comp-
uter By self Classes
Org.
leisure
Sports/
Exercise
Help
house
Care
family
Home
work
Reading
for fun
Algeria* 0.97 0.84 0.80 0.90 0.95 0.85 1.10 1.43 1.04 1.11
Colombia* 1.05 1.14 0.91 1.06 1.30 1.00 0.96 0.91 0.92 0.92
Estonia 1.01 1.26 1.09 1.25 0.49 0.97 0.90 1.11 0.98 0.75
Ethiopia 0.65 0.17 0.76 0.97 1.47 0.90 1.44 1.65 1.23 0.98
Germany 1.11 1.01 0.98 1.33 0.85 1.12 0.88 0.49 1.05 1.03
Israel 0.98 1.22 1.11 0.98 1.08 1.00 0.91 0.92 0.94 0.96
Nepal 0.85 0.25 0.68 0.96 1.48 1.02 1.25 1.46 1.07 1.21
Norway 1.07 1.13 1.06 1.16 0.51 1.05 1.03 0.75 1.02 0.91
Poland* 1.04 1.24 1.04 0.98 0.52 1.10 1.05 0.84 1.03 0.86
Romania 1.10 1.16 0.61 0.73 0.74 1.07 1.11 0.95 1.08 1.16
S Africa* 0.92 0.88 1.07 1.02 1.60 0.94 0.95 1.14 0.87 1.05
S Korea 1.17 1.00 1.12 1.09 0.32 1.03 0.93 0.80 1.05 1.06
Spain* 0.95 1.06 1.21 1.10 0.74 0.96 0.95 1.08 0.96 0.95
Turkey* 1.05 1.11 1.11 0.83 1.46 1.01 0.76 0.56 1.09 1.21
UK* 1.02 1.19 1.28 0.62 1.56 1.00 0.91 1.06 0.80 0.93
10 and 12 year old surveys, all countries, equally weighted by age group
Finally in this section on between-country variations, the following two charts summarise the
responses to the two satisfaction questions in each country. The patterns are very similar in
response to both questions. In general, the relative satisfaction scores are roughly in line with
those for overall well-being discussed in Chapter 13, so there is relatively little of note here.
Figure 95: Level of satisfaction with ‘how you use your time’ by country
10 and 12 year old surveys, all countries, equally weighted by age group
7.9
8.3
8.3
8.3
8.4
8.4
8.5
8.5
8.6
8.6
8.7
8.7
8.9
9.0
9.2
7.7%
5.3%
7.1%
6.6%
7.1%
5.3%
3.6%
3.7%
2.8%
2.4%
4.0%
4.8%
4.0%
2.8%
2.5%
S Korea
Ethiopia
Nepal
Algeria*
S Africa*
UK*
Estonia
Germany
Spain*
Norway
Poland*
Israel
Turkey*
Colombia*
Romania
% with low satisfaction
Mean satisfaction (out of 10)

Children’s Worlds Report, 2015
127
Figure 96: Level of satisfaction with ‘what you do in your free time’ by country
10 and 12 year old surveys, all countries, equally weighted by age group
Variations by age group There were fairly consistent age-related patterns of general time use across countries:
There was a significant drop in the frequency of spending time learning together with family
between the 10-year-old and 12-year-old age groups.
Figure 97: Frequency of learning together with family by age group
10 and 12 year old surveys, all countries, equally weighted by age group and country
There was an age-related drop in frequency of this activity in every country, and significantly so
in Estonia, Spain, Turkey, South Korea, Germany, Romania and Poland.
8.2
8.2
8.3
8.6
8.7
8.8
8.9
9.0
9.0
9.0
9.1
9.2
9.2
9.3
9.5
5.8%
7.1%
4.6%
5.5%
4.9%
4.9%
4.6%
3.0%
2.8%
2.6%
3.2%
4.1%
2.4%
2.9%
1.1%
S Korea
Nepal
Ethiopia
Algeria*
S Africa*
UK*
Poland*
Estonia
Germany
Spain*
Israel
Turkey*
Norway
Colombia*
Romania
% with low satisfaction
Mean satisfaction (out of 10)
16%
9%
25%
19%
30%
30%
30%
42%
0% 10% 20% 30% 40% 50% 60% 70% 80% 90% 100%
12 years old
10 years old
% of children
Not at all Once or twice a week Most days Every day

Children’s Worlds Report, 2015
128
Overall, in terms of time with friends, there was a significant increase in time spent talking with
and having fun with friends and a significant decrease in time spent studying together with
friends. However these differences were not that large and were only significant within a few
countries in the survey.
There were some more substantial and notable patterns in relation to three of the seven
questions on general time use which were asked in both the 10-year-old and 12-year-old
surveys. In particular:
12-year-olds tended to more frequently watch TV and to use computers
10-year-olds tended to more frequently read for fun
These differences were not statistically significant in all countries.
There were few or no differences for the other four activities that were asked about in both the
10-year-old and 12-year-old questionnaire.
The decline in reading for fun between the 10-year-old and 12-year-old survey is particularly
marked and is illustrated in the chart below which shows the proportion of children in each age
group per country who said that they read for fun every day or almost every day.
Figure 98: Percentage of children who read for fun every day or almost every day by country
and age group
10 and 12 year old surveys, all countries
Variations by gender Overall, there were only small gender differences in the frequency of time spent on activities
with family and friends. The largest difference was for spending time studying with friends.
Girls tended to do this activity a little more than boys in most countries. The differences were
0% 10% 20% 30% 40% 50% 60%
Algeria*
Colombia*
Estonia
Ethiopia
Germany
Israel
Nepal
Norway
Poland*
Romania
S Africa*
S Korea
Spain*
Turkey*
% of children reading for fun every day or almost every day
10 year olds 12 year olds

Children’s Worlds Report, 2015
129
significant in Poland and Estonia. However this pattern was not in evidence in Algeria or South
Africa where boys tended to spend more time on this activity than girls.
There were quite a few gender differences in terms of the more general questions about how
children spend their time in different countries:
Boys more frequently spent time than girls using computers and playing sports or
exercising
Girls more frequently spent time than boys helping with housework and reading for
fun.
These general patterns held across all or almost all countries (although the differences were not
always statistically significant based on the criteria discussed in Chapter 1). For example, a
summary of gender differences in the frequency of helping with housework is shown in Figure
99. Girls were more likely to help with housework every day in all 15 countries in the survey.
The countries are ranked in descending order of the size of the gender ratio. In Turkey girls
were 1.36 times more likely to help with housework than boys, whereas in Nepal they were
only 1.05 times more likely to do so.
Figure 99: Percentage of children helping with housework every day by gender and country
70%
63%
57%
46%
58%
61%
59%
51%
49%
23%
31%
59%
41%
44%
27%
74%
68%
62%
52%
66%
70%
67%
59%
57%
27%
37%
72%
52%
58%
37%
0% 10% 20% 30% 40% 50% 60% 70% 80%
Nepal
Ethiopia
Spain*
UK*
S Africa*
Romania
Poland*
Norway
Israel
S Korea
Germany
Algeria*
Estonia
Colombia*
Turkey*
% of children helping with housework every day
Girls Boys

Children’s Worlds Report, 2015
130
Figure 100 presents similar statistics for the percentage of children who played sports or
exercised every day. Boys in Turkey were more than twice as likely to do this activity daily than
girls, whereas in Poland there was very little gender difference.
Figure 100: Percentage of children playing sports or exercising every day by gender and
country
Summary and discussion This chapter has summarised a group of 16 questions asked in the survey regarding how
children spend their time with family, friends and in general and two questions about
satisfaction with time use. The findings presented in the chapter show considerable diversity
and complexity.
For example, children in Nepal more frequently spend time talking and having fun with family
than similar activities with friends, while the opposite is true for children in South Africa who
spend more time on these activities with friends than children in other countries. Talking
together with family is most common in Norway, Germany and Spain. Having fun and
learning together is most common in Algeria. There were also indications of shifts in the
frequency of activities with family and friends between age groups. Children in the 12-years-old
71%
42%
62%
68%
63%
66%
66%
60%
62%
61%
69%
27%
48%
51%
71%
65%
37%
51%
56%
51%
53%
51%
46%
47%
45%
44%
17%
26%
26%
32%
0% 10% 20% 30% 40% 50% 60% 70% 80%
Poland*
Nepal
Estonia
Norway
Romania
Israel
S Africa*
Germany
UK*
Colombia*
Spain*
Ethiopia
Algeria*
S Korea
Turkey*
% of children helping with housework every day
Girls Boys

Children’s Worlds Report, 2015
131
age group tended to spend less time learning together with family than children in the 10-years-
old age group, and more time talking and having fun with friends.
The ten more general activities covered in this questionnaire paint a rich picture of the diversity
in children’s time use between countries. The highest rankings for frequency of these activities
were seen in seven different countries. For example, children in Estonia tended to most
frequently spend time on homework, while children in Poland most frequently played sports
and exercised, and Algeria was the country where children most frequently cared for siblings
and other family members. As well as the diversity of overall time use, there were also
substantial age and gender variations in many countries. Older children (12-years-old survey)
tended to more frequently watch TV and use computers, while younger children (10-years-old
survey) more frequently read for fun. In many countries boys more frequently spent time using
computers and playing sports or exercising, while girls more frequently spent time helping
with housework. However, perhaps surprisingly, there was little evidence of gender variations
in frequency of caring for siblings and other family members.
The above are only some selected findings from a very rich data set which offers great potential
for further analysis. In addition to such analysis, some of the findings suggest that more work
is needed to explore the types of activities that children undertake in different countries in order
to compile a more comprehensive list of common activities for future research.

Children’s Worlds Report, 2015
132
Chapter 14
Overview
In this chapter we draw together the findings presented in Chapters 4 to 13 on children’s
evaluations of their life as a whole and specific aspects of their lives, looking at variations
between countries and according to gender and age group. In order to do this we have selected
one main indicator from each chapter (apart from the children’s rights chapter35) as follows:
Table 33: Selected indicators for each aspect of life
Aspect Indicator
Overall well-being Satisfaction with your life as a whole
Family and home Satisfaction with your family life
Money and possessions Satisfaction with the things you have
Friends and other relationships Satisfaction with your friends
School Satisfaction with your life as a student
Local area Satisfaction with your local area
Self Satisfaction with your body
Time use Satisfaction with how you use your time
Other aspects of life Satisfaction with what may happen later in your life
These indicators were selected so that, where possible, they represented the broadest indicator
available for the particular aspect of life and were available for all countries in the survey. The
questions in the ‘other aspects of life’ category are very diverse and so we selected the question
about the future because it captures a key aspect of well-being discussed in the literature and
often included in indicator sets of people’s overall well-being.
It is worth mentioning here that the division of the preceding chapters of the report into
different aspects of life was derived originally from the early design and planning of the survey.
This categorisation of aspects was based on prior research and knowledge among the core
group designing the survey with the exception that ‘self’ and ‘other aspects of life’ were
conceptually grouped together under a broader category of ‘personal well-being’.
Subsequently, the framework has been tested out through analysis of the pilot data36 which has
provided some support for the framework but also suggested the value of separating
satisfaction questions relating to ‘self’ (i.e. health, appearance, body and self-confidence) from
other more abstract questions about ‘personal well-being’ (e.g. safety, freedom and the future).
Hence, this division into eight categories (plus overall well-being) is used in this report. It
remains a question for future analysis with the current data set to establish whether this
categorisation is the most appropriate one for the current data set as a whole and the extent to
which this holds within each country individually.
35 We have not included children’s rights in this chapter because the questions asked about this the topic do
not lend themselves to comparison with the other aspects of life. 36 Using exploratory factor analysis. A working paper will be published on the project website.

Children’s Worlds Report, 2015
133
Figure 101 shows summary statistics for these nine indicators for the pooled data set (with each
country and age group weighted equally):
In terms of mean scores, children are most satisfied with their family lives (9.2),
followed by the things that they have (9.0). Satisfaction with the remaining aspects of
life is within a fairly close range from 8.4 to 8.7.
There is a slightly different pattern for the percentages of children with low satisfaction.
Three aspects of life – the future, local area and body – have percentages above 7%,
followed by life as a student (5.8%). The remaining aspects lie between 3% and 5%.
Figure 101: Overview of selected satisfaction questions
10 and 12 year old surveys, all countries, equally weighted by age group and country
Variations by country The tables on the next two pages provide the mean scores and the percentage of children with
low well-being for each key indicator in each country and then the relative scores.
Looking first at the mean scores:
Romania scores highly on all indicators and Colombia and Turkey do so on most of
them.
South Korea scores low on all indicators and the UK and South Africa score low for all
but one indicator each
Some countries show greater fluctuations in ranking.
Algeria is ranked in the top three countries for family life and life as a student but in the
bottom three countries for material possessions and friends.
Germany is in the top three countries for friends but in the bottom three for life as a
student and local area
To enable more detailed comparisons, rankings of mean scores within each country for each
aspect of life are shown in Table A1 in the Appendix, and some of the key patterns in this table
are discussed further in the final chapter of the report.
8.4
8.6
8.6
8.5
8.6
8.7
9.0
9.2
8.9
7.3%
4.7%
7.0%
7.1%
5.8%
4.7%
3.9%
3.4%
4.2%
Later in life
Time use
Body
Local area
Life as student
Friends
Things you have
Family life
Life as a whole
% with low satisfaction
Mean satisfaction (out of 10)

Children’s Worlds Report, 2015
134
Table 34: Key indicators – Summary of means by country for each question
Family
life Things Friends
Life as
student
Local
area
Time
use Body
The
future
Life as a
whole
Algeria* 9.53 8.10 8.51 9.32 8.23 8.34 8.76 8.93 9.13
Colombia* 9.40 9.45 8.72 9.16 8.95 9.02 9.47 9.24 9.42
Estonia 9.18 8.96 8.71 8.09 8.53 8.50 8.15 8.40 8.97
Ethiopia 8.44 7.20 8.23 9.01 8.02 8.31 8.69 7.71 8.63
Germany 9.02 9.19 9.07 7.94 7.82 8.53 8.05 8.95 8.82
Israel 9.36 9.40 8.83 8.41 8.82 8.72 9.15 8.72 9.20
Nepal 8.80 8.77 8.56 9.00 8.44 8.34 8.57 5.78 8.65
Norway 9.31 9.46 9.22 8.74 9.36 8.62 8.26 8.86 9.00
Poland* 9.19 9.27 8.52 8.05 8.70 8.71 8.39 8.96 8.81
Romania 9.61 9.57 8.96 9.30 9.27 9.18 9.35 8.97 9.51
S Africa* 9.00 8.74 8.36 8.74 7.78 8.35 8.87 7.87 8.56
S Korea 8.86 8.54 8.55 8.02 8.00 7.91 7.41 8.02 8.10
Spain* 9.13 9.28 8.99 8.17 8.69 8.56 8.63 8.66 9.02
Turkey* 9.61 9.19 8.96 9.10 8.88 8.95 9.07 9.34 9.27
UK* 8.99 9.17 8.84 8.25 8.43 8.42 7.86 8.23 8.66
10 and 12 year old surveys, all countries, equally weighted by age group
In terms of the percentages with low well-being, in Table 35 instances of more than 5% and
more than 10% of children having low well-being for particular aspects of life have been
highlighted:
More than one in ten children had low satisfaction with material possessions in
Ethiopia; with their local area in South Africa and Germany; with their body in South
Korea, the UK, Germany and Ethiopia; and with the future in Nepal, South Africa and
Ethiopia.
The relative scores in Table 36 provide an alternative view of the data:
There are much greater fluctuations in relative scores for some aspects of life – such as
life as a student and one’s body – than for others such as time use and family life.
The table also allows identification of particularly high and low scores for certain
countries. For example, there are relatively high scores for Algeria, Ethiopia and Nepal
in relation to children’s satisfaction with life as a student. There are relatively low
scores for Norway, South Korea and UK for children’s satisfaction with their bodies.
To aid further more detailed comparisons a complete listing of relative scores for all satisfaction
questions is shown in Table A2 in the Appendix. One feature that this additional table illustrates
is how little variation from expected scores there is in some countries such as Romania and
Israel, compared to countries such as Algeria, Ethiopia and Nepal. The same goes for some
aspects of life such as time use and safety, compared to others such as some of the school
questions.

Children’s Worlds Report, 2015
135
Table 35: Key indicators – Summary of % with low well-being by country for each question
Family
life Things Friends
Life as
student
Local
area
Time
use Body
The
future
Life as a
whole
Algeria* 2.5% 9.8% 6.3% 2.6% 11.4% 6.6% 5.5% 4.5% 3.5%
Colombia* 2.6% 1.6% 6.2% 3.4% 5.0% 2.8% 2.4% 3.4% 1.8%
Estonia 2.8% 2.5% 4.7% 9.3% 6.4% 3.6% 11.0% 5.4% 3.6%
Ethiopia 6.9% 18.7% 7.6% 2.8% 9.2% 5.3% 3.7% 11.0% 4.5%
Germany 3.8% 1.0% 2.1% 8.9% 10.3% 3.7% 11.7% 2.2% 4.1%
Israel 2.6% 1.4% 4.2% 8.3% 6.3% 4.8% 4.0% 5.2% 3.5%
Nepal 5.4% 5.2% 6.0% 4.4% 8.8% 7.1% 5.7% 34.7% 6.0%
Norway 1.5% .6% 1.8% 5.2% 1.8% 2.4% 9.2% 3.1% 3.3%
Poland* 3.4% 1.6% 4.8% 9.1% 5.5% 4.0% 8.6% 3.3% 4.8%
Romania 1.6% 1.0% 3.5% 2.4% 2.8% 2.5% 2.0% 3.9% 1.5%
S Africa* 5.6% 5.1% 8.1% 6.0% 15.4% 7.1% 5.4% 13.4% 7.4%
S Korea 2.9% 3.9% 3.8% 7.5% 6.5% 7.7% 13.0% 5.8% 7.4%
Spain* 2.9% 1.3% 3.0% 6.2% 4.5% 2.8% 5.3% 2.5% 2.8%
Turkey* 2.2% 3.6% 4.6% 4.5% 6.5% 4.0% 5.3% 2.7% 4.1%
UK* 3.7% 2.0% 4.0% 7.4% 6.8% 5.3% 12.8% 7.8% 5.5%
10 and 12 year old surveys, all countries, equally weighted by age group
Table 36: Key indicators – Relative scores by country for each question
See Chapter 1 for explanation of these scores
Family
life Things Friends
Local
area
Life as
student
Time
use Body
The
future
Algeria* 1.03 0.90 0.97 0.96 1.08 0.97 1.01 1.05
Colombia* 0.99 1.01 0.96 1.01 1.02 1.01 1.06 1.05
Estonia 1.02 1.02 1.01 1.02 0.95 1.01 0.97 1.01
Ethiopia 0.96 0.84 0.98 0.98 1.09 1.01 1.06 0.95
Germany 1.00 1.04 1.05 0.93 0.94 1.01 0.95 1.08
Israel 1.00 1.03 0.99 1.01 0.95 1.00 1.04 1.01
Nepal 1.00 1.02 1.02 1.03 1.08 1.01 1.04 0.71
Norway 0.97 1.01 1.01 1.05 0.97 0.96 0.92 1.01
Poland* 1.00 1.03 0.97 1.02 0.93 1.01 0.97 1.06
Romania 0.98 1.00 0.96 1.02 1.01 1.00 1.02 0.99
S Africa* 1.02 1.01 0.99 0.94 1.05 1.01 1.07 0.97
S Korea 1.03 1.02 1.04 1.00 0.99 0.98 0.92 1.01
Spain* 0.99 1.03 1.02 1.01 0.94 0.99 1.00 1.02
Turkey* 1.00 0.98 0.98 1.00 1.01 1.00 1.01 1.06
UK* 1.00 1.05 1.03 1.01 0.98 1.00 0.94 0.99
10 and 12 year old surveys, all countries, equally weighted by age group

Children’s Worlds Report, 2015
136
Variations by age group We have presented analysis of age group differences throughout the preceding chapters. Here
we provide an overview of the main patterns identified. The chart below shows mean
satisfaction scores for the 10-years-old and 12-years-old age groups for the whole sample
(weighted equally by country) for the nine key indicators discussed above. All nine mean
scores are significantly lower for the 12-year-old age group than the 10-years-old age group.
There is a larger age-related difference for some aspects of life than others with the biggest
differences being for satisfaction with one’s body and time use, followed by life as a student,
and the smallest difference being for family life.
Figure 102: Key indicators by age group
10 and 12 year old surveys, all countries, equally weighted by country
Variations at the individual country level have already been discussed in previous chapters.
Where there were significant differences they almost always related to children in the 12-years-
old survey having lower mean satisfaction than children in the 10-years-old survey. However
this age-related pattern in well-being is not equally in evidence in all countries.
In Poland and South Korea there were significant age group differences for most
indicators in the survey.
There were a smaller number of significant age group differences in a selection of other
countries, such as Turkey and Spain.
There were no significant age group differences in Algeria, Colombia, Ethiopia, Israel,
Romania and South Africa
8.31
8.27
8.30
8.34
8.38
8.62
8.85
9.08
8.74
8.57
8.88
8.83
8.72
8.86
8.85
9.06
9.25
9.10
0 2 4 6 8 10
Future
Body
Time use
Local area
Life as student
Friends
Things
Family life
Life as a whole
Mean satisfaction (out of 10)
10-year-olds 12-year-olds

Children’s Worlds Report, 2015
137
Variations by gender Figure 103 shows mean scores for the key indicators for girls and boys across the whole sample
(equally weighted by age group and country). There were only two significant differences here.
Girls were more satisfied with ‘your life as a student’ than boys
Boys were more satisfied with ‘your body’ than girls.
At a country level, gender differences in these two aspects of life were only statistically
significant in some countries. The main pattern of note was that boys were more satisfied with
‘your body’ than girls in Estonia, Germany, Norway, Poland, South Korea and the UK – see
Chapter 10 for further discussion.
Figure 103: Key indicators by gender
10 and 12 year old surveys, all countries, equally weighted by country and age group
Summary and discussion In this chapter we have drawn together some key patterns in the data from previous chapters
using key indicators relating to satisfaction with family life, material possessions, friendships,
school, local area, time use, self, the future and life as a whole. Generally, satisfaction with all of
these aspects of life is high with the large majority of children scoring themselves on or above
the mid-point of an 11-point satisfaction scale. Within this positive picture, there was some
variation in children’s levels of satisfaction with the highest mean satisfaction being with family
life and the lowest relating to the future – an aspect for which more than 7% of children had low
satisfaction. We have looked at variations with satisfaction with these aspects of life by country,
age group and gender.
8.44
8.72
8.57
8.51
8.48
8.70
8.91
9.15
8.95
8.44
8.44
8.56
8.55
8.76
8.77
8.99
9.17
8.92
0 2 4 6 8 10
Future
Body
Time use
Local area
Life as student
Friends
Things
Family life
Life as a whole
Mean satisfaction (out of 10)
Girls Boys

Children’s Worlds Report, 2015
138
There are only relatively small variations between countries in children’s satisfaction with some
aspects of life such as family life and time use. For a few other aspects there are one or two
notable differences such as low satisfaction with material possessions in Ethiopia and some of
the other countries with low GDP; low satisfaction with the local area in Germany and South
Africa; and high satisfaction with what might happen in the future in Germany, Turkey and
Poland. However, probably the most important patterns in country differences relate to
children’s satisfaction with school and with their sense of self. First, in terms of school, there is
a clear pattern in the survey that children in Algeria, Ethiopia, South Africa and Nepal tend to
have relatively higher levels of satisfaction with this aspect of life than other countries. Some of
the potential reasons for this are discussed in the relevant chapter earlier in the report. Second,
in terms of self, children in South Korea and many of the countries surveyed in Europe tend to
have relatively low satisfaction with this aspect of life, in contrast with countries such as
Colombia, Ethiopia and South Africa were satisfaction tends to be relatively high.
There are broadly consistent age-related differences in the survey as a whole with children in
the 12-years-old survey tending to have lower satisfaction than children in the 10-years-old
survey. There is some variation here between different aspects of life with, for example, much
greater age differences for satisfaction with life as a student than with family life. An important
finding in this respect is that these age group differences are not equally in evidence across all
of the countries in the sample. The strongest age group differences tend to be in South Korea
and Poland. In some countries, there were no statistically significant age-related differences for
any aspects of life. This highlights an important issue for further research to explore why there
is a more substantial age pattern in some countries than others and whether this applies over a
wider age range than considered in this report.
There were far fewer significant gender differences. Across the survey sample as a whole, there
were only significant gender differences for two of the key indicators considered in this chapter.
Girls tended to be more satisfied with ‘your life as a student’ and less satisfied with ‘your body’
than boys. Further analysis indicates that these gender differences only apply to some
countries, with the most notable differences being in relation to satisfaction with one’s body
which was significantly lower among girls than boys in South Korea.

Children’s Worlds Report, 2015
139
Chapter 15
Conclusions
In this final chapter we highlight and discuss key findings from the report and identify
potential future directions for the work on this survey and for research on children’s self-
reported well-being surveys in general.
Discussion
The overall picture
The overall picture presented in relation to children’s evaluations of their lives is a positive one.
Mean satisfaction ratings for life as a whole were higher than is typical in adult populations
and, for most aspects of their lives, the proportion of children having low-being was less than
one in ten in all or almost all countries.
Generally, children seem more satisfied with family and friendships than other aspects such as
school and local area. For example, mean scores for satisfaction with ‘family life’ were higher
than for satisfaction with ‘life as a student’ in 13 of the 15 countries – the exceptions were
Ethiopia and Nepal where satisfaction with ‘life as a student’ was higher. However, these
exceptions illustrate that one of the main values of the survey lies in exploring variations in
well-being between countries and sub-groups of the population.
Variations by country
One of the key aims of this report has been to explore variations in children’s lives and well-
being between the 15 countries who have completed their participation in the survey so far. It
must be acknowledged that any international comparative work using self-report data rests on
a number of assumptions about the reliability, validity and comparability of responses to survey
questions, taking into account linguistic and cultural differences. We will return to this issue
later in the discussion. However, first we will briefly review the evidence of between-country
differences in children’s responses to the questions which asked them to evaluate various
aspects of their lives. A full listing of rankings of mean scores within each country for each
aspect of life is provided in an appendix (Table A1).
In the seven European countries and in Turkey, Israel and South Korea the three aspects of life
with which children were most satisfied almost always37 related to family, home and material
possessions. In the three African countries and in Nepal, school was more prominent among
the aspects that children were most satisfied with, accounting for two of the three top-ranked
aspects in Algeria, Ethiopia and Nepal, and one in South Africa. However, satisfaction with
family life was still in the top three aspects in Algeria and South Africa. Finally, Colombia had a
unique pattern in this respect in that the top three aspects were ‘health’, ‘your body’ and ‘the
things you want to be good at’.
37 The exceptions were that, in Estonia, satisfaction with free time was the third ranked aspect; and, in
Romania and Spain, health was the second ranked aspect.

Children’s Worlds Report, 2015
140
Turning to the aspects of life with which children were least satisfied, in most countries one or
more of these aspects were found within the local area domain. In fact, in ten countries, at least
two of the bottom ranked aspects related to local area. These findings suggest that in most
countries children may not perceive their local area as being particularly child-friendly. The
most notable exception was Norway where satisfaction with ‘the area you live in general’ was
the fourth most positive aspect. In Poland all three bottom-ranked aspects were in the school
domain, and this domain also featured once amongst the three lowest rankings (in addition to
local area) in Colombia, Estonia, Israel, Romania, South Korea and Spain. This contrasts with
the high rankings for aspects of school in Algeria, Ethiopia, Nepal and South Africa noted
above. Nepal was unique in that ‘what may happen later in life’ was the aspect of life with
which children were least satisfied. Finally, an important pattern in Norway, UK and South
Korea were the particular low mean scores and therefore rankings of children’s evaluations of
their body, appearance and self-confidence.
This brief summary of rankings of mean scores provides some important indications of avenues
for future exploration. For example, there seem to be a number of common patterns within the
three African countries, which are also often similar in Nepal. There also seem to be common
patterns in European countries, particularly those countries in the northern half of Europe, and
these are often similar in South Korea and to a lesser extent in Turkey and Israel. Finally,
Colombia, the only country from South America to so far have participated in this wave of the
survey, appears to have a different profile to the other countries.
However, as discussed in the introduction to this report there are questions regarding how
meaningful it is simply to compare raw summary statistics of children’s feelings about, and
evaluations of, their lives, given the challenges of undertaking surveys in different languages
and in diverse cultural contexts. In this report we have attempted to take account of this issue
in two ways – by providing contextual information for a selection of key findings and by
calculating what we have called ‘relative scores’ for each country and aspect of life.
In most of the topic-based chapters we selected a key finding in one or more countries that we
felt was of particular interest and have gathered background information, primarily through the
national research teams in the relevant countries, with the aim of gaining some understanding
of the background to the patterns observed. For example, we found in Chapter 9 that children in
Poland were relatively positive about feeling safe and having places to play in their local area.
Our colleagues in Poland connected this with two national initiatives within the last decade
which had been aimed at creating more sports facilities and playgrounds for children. In this
respect it is interesting to note the finding in Chapter 13 on time use that children in Poland
reported the highest frequency of playing sports and doing exercise of the 15 countries in the
survey. As we will discuss later in this chapter, such contextualisation is essential to making
sense of comparative international findings on self-reported well-being and to extracting
practical conclusions from them.
Our second approach to cultural and linguistic response differences has been to calculate
relative scores for each country for each satisfaction, agreement and time use question. These
scores identify the extent to which the observed scores for a particular country vary from what
would be expected given the overall response patterns for children in the country to particular
question formats, and the overall response patterns for children across countries to questions
about particular aspects of life.

Children’s Worlds Report, 2015
141
One thing that this approach enables is to identify aspects of life with high and low variability
across countries. For example, we have found that if one knows the average level of satisfaction
of children in each country in general then one can fairly accurately predict satisfaction with
health and with safety in each country (see Table A2 in the Appendix). These are aspects of life
where there is very little variability between countries once overall levels of satisfaction are
taken into account. On the other hand, knowing about overall responses to satisfaction
questions is not so useful in predicting country scores for satisfaction with aspects of school. In
comparison with aspects such as health and safety there is a much higher degree of variability
in children’s feelings about school issues across countries. This is a salient finding in its own
right as school is an aspect of life which may be particularly amenable to policy initiatives.
The other use of the relative scores approach is to identify aspects of life for which children in
each country are faring unexpectedly well or poorly, taking into account their overall response
patterns. For example, it is evident throughout this report that children in South Korea tend to
rank fairly low for most questions, particularly when mean scores are used as the basis for
comparison. This was not unanticipated as research with adults has indicated a tendency for
lower scores on self-reported well-being in some countries, including South Korea, which
appear to be at least partly due to cultural issues in responding to evaluative questions.
Calculating relative scores can to a great extent take account of these cultural response issues
and serve to highlight positive and negative findings in each country. In South Korea, for
instance, we have found that children evaluate their family lives and their relationships at
school with classmates and teachers relatively positively, taking into account the overall
response patterns to satisfaction questions in this country. On the other hand their satisfaction
with school marks, their body and appearance, and their sense of opportunities are all low in
relative as well as absolute terms. We hope that this approach will therefore complement the
comparison of observed mean scores and enable interested stakeholders in each country to
extract messages about the positive and negative aspects of life for children in their country.
Moving away from the satisfaction and agreement questions, there was evidence of significant
variation between countries for a number of other topics and questions including time use,
children’s rights and experiences of bullying.
Children’s use of time varied considerably. The top rankings of frequency of time spent on ten
different activities were shared between seven different countries with only Estonia being top-
ranked for more than one activity. There was substantial diversity in terms of the least frequent
activities also. For example, children in Turkey spent the most time of any country reading for
fun but the least time helping with housework; children in the UK spent the most time by
themselves and the least time doing homework. The survey has generated a rich set of data
including ten general activities and a further six activities specific to family and friends, and this
will provide opportunities for a more detailed exploration of the nature of children’s daily lives
in the diverse set of national contexts covered.
Children’s knowledge of their rights, and their views about whether these rights were respected
by adults, varied very substantially between countries. In most countries most children felt that
they knew what rights children have, but in four countries – the UK, South Korea, Israel and
Germany – only a minority did so. Children’s confidence in adults’ respect for their rights
varied from 33% in South Korea to 84% in Norway. In seven countries, including South Korea,
less than half of children definitely felt that adults in general respected their rights. These are
important findings in terms of international policy work on children’s rights.

Children’s Worlds Report, 2015
142
Research in some countries shows that experiences of being bullied can have a particularly
detrimental effect on children’s well-being. In the Children’s Worlds survey children were
asked two questions about experiences of this issue at school – the frequency of being hit by
other children and of being excluded by other children in the last month. There were wide
variations between countries here also. Children in South Korea were the least likely to
experience either form of bullying; children in Turkey were the most likely to have been hit by
their peers; while children in the UK were the most likely to have been left out by their peers. It
remains to be seen whether these varying levels of bullying are associated with levels of school
or overall well-being within and between countries.
Variations by age group
Apart from variations by country, this report has also explored variations in children’s
responses by age group and by gender. In terms of age group, we have compared children
around 10 years of age with those around 12 years of age although it must be borne in mind that
these are approximate ages and, in fact, the children participating in the 10-years-old and 12-
years old surveys were within a year (or, in a small number of cases, two years) of the target age
of the survey. This variation was due to the survey being conducted in school class groups.
There is evidence of age group variations across many of the aspects of life covered in this
report. Usually, for the questions measuring satisfaction and agreement, there is tendency for
the 12-year-olds to be less positive than the 10-year-olds. However, there is a stronger age-
related pattern for some aspects of life than others – with the most pronounced being for school
issues and sense of self. There are also differences between countries. By and large there is
more evidence of a difference in well-being between the ages of 10 and 12 in South Korea and
some European countries. This raises interesting questions for future research into potential
different age patterns in different countries or groupings of countries.
There were also age-related differences in many countries (mostly European apart from
Norway) in terms of how much children felt that adults in their country respected children’s
rights. In some countries such as Turkey and Poland the drop in agreement with this question
between the ages of 10 and 12 was particularly large. However this age pattern did not apply at
all in the three African countries where there was no significant age difference, although levels
of agreement were generally lower in these countries to begin with among 10-year-olds than in
the countries where there substantial age differences.
Finally, there were some notable age patterns in time use. In most countries children in the 12-
years-old survey tended to read for fun significantly less frequently than in the 10-years-old
survey. On the other hand, in many of the more industrialised countries the older age group
tended more frequently to spend time watching television and/or using a computer. These
findings on time use connect with findings presented in Chapter 3 about children’s access to
material items and resources. Children in the 12-years-old survey were more likely to own or
have access to a mobile phone, a music player and the internet than children in the 10-years-old
survey in many countries. On the other hand, children in the 10-years-old survey in most
countries were more likely to say that they had access to books to read at home.
All in all, there is substantial evidence here of differences in the lives and well-being of children
between the ages of 10 and 12 in many but not all countries, and this is another potentially
fruitful area for further analysis and research.

Children’s Worlds Report, 2015
143
Variations by gender
There was a more mixed picture in terms of gender differences. In some aspects of life – such as
family life, friendships and material possessions - there was little significant variation between
girls and boys regarding their evaluations of their lives. There were some indications that girls
tended to be a little more positive about aspects of school life. However the aspect of life where
there were the most notable gender differences related to children’s views of themselves. In five
European countries and South Korea, girls were significantly less satisfied with their
appearance and their body than boys. However, in other countries this was not the case. This is
an illustration of the value of undertaking the survey in such a diverse range of countries and
cultural contexts. Differences that may seem commonplace in one cultural context may be
found not to exist in other contexts and this can challenge the notion that these types of
differences are inevitable or universal. The question of why girls feel much less positive about
themselves than boys in some countries and not others merits further research.
There were gender differences in relation to time use also. In many countries there was a fairly
typical pattern of boys being more likely than girls to spend time playing sports, exercising and
using computers; while girls were more likely than boys to read for fun and help with
housework. However, there was a lack of evidence of a gender difference in frequency of
spending time caring for siblings and other family members. There was no clear pattern here
and in only one country (Norway) was there a significant difference, with boys reporting
spending more time on this activity than girls.
Future directions for research
Future directions for analysis of the Children’s Worlds survey data
This report, and the analytical work that underpins it, was intended to provide a primarily
descriptive and accessible introduction to the survey. It clearly only represents a starting point
in terms of making use of the potential of the data set. There are many different avenues for
ongoing exploration and analysis of the data. A few of the important aspects that warrant initial
attention are:
1. Analysis of the 8-years-old data set. For practical reasons it was only possible for this
initial report to analyse data for the older two age groups. Most of the questions in the
8-years-old survey have different response formats to the 10-years-old and 12-years-old
surveys, taking into account the typical reading and cognitive levels of the younger age
group. This means that it is not straightforward to make comparisons across all three
age groups. However there is considerable potential for analysis of country and gender
variations within the 8-years-old data set and then it would be possible to compare the
patterns identified with those presented in this report for the older two age groups. We
will be publishing an initial report on the 8-years-old survey later in 2015.
2. Validation of scales and measures. In this report we have not attempted to create or
test scales made up of different items within the data set. The surveys included
versions of several previously tested scales, and so an important first step will be to
undertake statistical analysis of the functioning of these scales across the pooled data
set and individually within each country. In addition it may be possible to create new
scales by combining sets of questions asked on a specific aspect of life (e.g. family
relationships) or on a cross-cutting theme (e.g. treatment by adults). Such scales would

Children’s Worlds Report, 2015
144
help to summarise data within the current study and may also be of value to future
research.
3. The structure of children’s self-reported well-being. We briefly touched on a three-
component framework of self-reported well-being – comprising cognitive subjective
well-being, affective subjective well-being and psychological well-being – which is
common in the research literature on the well-being of adults. There has been relatively
little exploration of the extent to which this model is applicable to children and the
current data set offers a valuable opportunity to undertake this work in an international
context. Additionally, there is considerable potential to explore the structure of aspects
and domains of life within the concept of cognitive subjective well-being.
4. Explaining variations at the individual level. An important question is the extent to
which people’s overall sense of well-being can be explained by their characteristics and
life circumstances. For practical reasons we have restricted this initial report to simple
description of variations in children’s responses by country, age and gender. There is
potential to use the data set to explore the power of a wider range of factors including
family composition, household economic circumstances and experiences of bullying in
terms of variations in explaining overall well-being. An important application of the
Children’s World data set will be to analyse how the influence of each of these factors
varies between countries and the findings of this analysis would make an important
new contribution to the research evidence on children’s subjective well-being.
5. Explaining variations at the country level. An important related question is the extent
to which mean self-reported well-being scores at a country level can be explained by
macro indicators relating to each country. In the field of adult self-reported well-being,
researchers have had substantial success in explaining variations between countries
through a combination of macro indicators relating to economic, political and social
factors38. This is another area where there has been much less exploration in relation to
children’s self-reported well-being. So, some work on this question would be valuable
although the number of countries currently included in the survey data set may put
some limits on this type of analysis. It will be important to consider which macro
indicators may be most relevant to explaining between-country variations in children’s
well-being as these may not be the same indicators that are relevant in the case of
adults. For example, the level of attention to children’s rights in each country may be a
salient variable for children.
There is an ongoing analysis plan for the next 12 months and we would expect to make some
progress with each of these aspects during that period. Working papers will appear on the
project website when available. Following this initial analytical effort, in the summer of 2016
the whole data set will be made freely available to interested researchers who wish to undertake
further analysis.
Future cross-national research on children’s self-reported well-being
While the data set considered in this report will offer a rich set of opportunities for research on
children’s subjective well-being, the current wave of the project also has a number of limitations
which suggest directions for future research. The following are some issues identified during
38 Helliwell et al. (2014)

Children’s Worlds Report, 2015
145
the course of this report which are of relevance to future cross-national research on children’s
self-reported well-being, including future waves of the Children’s Worlds study itself
1. Cultural response issues. Systematic differences in the way that people in different
cultures respond to subjective well-being questions has been identified as an important
issue in the research on adult populations. Based on the analysis of this survey so far, it
may also be an issue in researching children’s subjective well-being. Further research is
needed on this issue. One method which has been used in some of the research with
adults is to use ‘anchoring vignettes’39 – which ask respondents to evaluate the well-
being of a standard hypothetical person – and this may be a useful approach with
children also.
2. Extending the number of countries. We aim to undertake analysis of the extent to
which variations in children’s subjective well-being between countries can be explained
by macro indicators at the country level. However the potential for this is likely to be
limited by the number of countries in the current sample. Some of the advances in
understanding international variations in adults’ subjective well-being have been
dependent on the availability of comparable data from many countries. In addition, a
greater number of countries would enable more comparisons between countries within
particular continents or regions to be made. This could be valuable because there are
some indications within the current data of similar patterns of findings within
geographical groupings of countries. Ideally future cross-national data collection
efforts, either through a new wave of the Children’s Worlds survey or through other
means will succeed in covering a larger number of countries.
3. Broadening the age range. This report has identified some interesting evidence of age
patterns in children’s evaluations of their lives. There appears to be a decline in
subjective well-being between the ages of 10 and 12 years old in a number of countries –
particularly within Europe – but this is not in evidence across the whole range of 15
countries included in this report. Patterns of decreasing subjective well-being between
the ages of 11 and 15 have previously been identified in many countries in Europe and
North America40. Given the restricted age range of the current report it is not clear
whether these decreases may be universal but occur at different ages in different
countries, or whether they are specific to particular countries or groups of countries.
Therefore further research on age-related differences with a wider range of age groups
would be valuable.
4. Inclusion of marginalised groups. The research considered in this report was
undertaken with children in mainstream schools in each country. This has made it
possible, within the resources available, to achieve the large sample sizes which make
some of the statistical analysis feasible. However, mainstream schools samples are
likely to exclude certain sub-groups of children, including children educated in
specialist settings and children who are not attending school, possibly as a result of
particularly disadvantaged circumstances. Therefore a goal of future research should
be to include some of these sub-groups.
39 van Soest et al. (2011); Angelini et al. (2013) 40 Currie et al. (2012)

Children’s Worlds Report, 2015
146
5. Reviewing topics and questions. The survey questionnaires described in this report
cover a broad range of relevant domains in children’s lives. However, inevitably in a
research initiative of this kind, gaps and areas for improvement exist. Some topics (e.g.
family and school) have been more fully covered than others (e.g. economic issues and
friendships) and it may be appropriate to balance future research differently between
these domains. It would also be helpful to review whether there are any important
topics missing from the framework – for example, the issue of spirituality has
sometimes been included in research on adults’ subjective well-being. Additionally,
within each topic it will be important to identify gaps. An example of this is the
discussion on time use, where it seems likely that some important activities relevant to
children in some countries were not included in the questionnaire. There is a role for
qualitative research with children using a range of methodologies and in a range of
countries in helping to improve the overall content of questionnaires such as this which
attempt to cover a comprehensive overview of children’s lives and well-being.
6. Longitudinal research. An inevitable limitation of a snapshot survey such as this one is
that it is not possible to identify cause and effect. There is currently a shortage of
longitudinal data on children’s self-reported well-being which would enable an analysis
of causal factors which can aid in understanding variations in well-being. The
possibility of gathering data of this kind in an international context should be
considered as part of future cross-national research efforts.
7. Considering the most appropriate methods of comparison between countries. An
important issue identified in Chapter 4 of this report is the fact that different methods
of comparing children’s evaluations of their lives can lead to different conclusions about
variations between countries. Some countries fare better when mean scores are
considered than when the proportion of children with low well-being is the focus, or
when comparisons are based on equality or inequality of well-being. This issue goes to
the heart of the debate about the potential value of measuring people’s self-reported
well-being. People may have different priorities for improving the well-being of a
given population. It can be argued that the goal should be to maximise average
happiness, to minimise misery or to minimise inequality. Each of these goals links to
one of the methods of comparison discussed above. In this initial report we have
tended to follow similar previous research in focusing mainly on mean scores, although
we have also presented percentages of children with low well-being throughout the
report. It would seem appropriate that future research should keep in mind the
alternative goals of improving well-being identified above and therefore routinely make
comparisons using the different methods available.
Key messages
The overall aim of the Children’s Worlds project is to generate findings which are not only of
research interest but also can be valuable to key stakeholders who are concerned with the
quality of children’s lives. These stakeholders include children themselves; parents and other
family members; professionals who work with children; and local, national and international
policymakers. This aim will be an ongoing concern as the analysis of the data develops. This
initial report already points to some important issues, in particular ones which might be salient
at the national and international policy level. In concluding the report we will briefly discuss
two broad messages in this respect.

Children’s Worlds Report, 2015
147
The first key message is that it has been possible, using cross-national comparisons, to identify
positive and negative aspects of children’s lives in all countries involved in the survey. The
combination of different comparative approaches taken in this report has suggested, for
example, that school is an aspect of life where there is considerable variation in children’s
experiences and the findings on this topic may be of particular concern to national policymakers
as this is certainly an aspect of children’s lives which is amenable to policy intervention. The
findings on relatively low levels of satisfaction about body, appearance and self-confidence in
some countries provide important messages for policy makers and all those concerned with
children’s well-being in those countries, as it is apparent that there are countries where these
issues are much less pronounced. The substantial cross-national variations in children’s
knowledge of their rights, and in their opinions regarding adults’ respect for these rights, is
another area where there are important messages for national and international policy
organisations. Cross-national variations like these also offer the opportunity to identify areas of
strength in particular countries, and the learning from these countries may be of value to other
countries in developing new initiatives to tackle key issues and improve children’s lives.
A second related message comes from the exploration of age and gender differences. One of the
challenges for research on children’s subjective well-being within individual countries is that it
is not clear whether observed differences between sub-groups of children, for example on the
basis of age or gender, are distinctive to that country’s context or are a more universal feature of
childhood. It is only through cross-national comparative work that answers to this question can
be found. We have observed in this report that some of the age and gender differences
previously identified in specific countries are not in fact universal phenomena. For example, if
gender differences in children’s satisfaction with a particular aspect of life are not evident in all
countries this presents important information and a challenge for each individual country with
regard to the equality of children’s well-being. This is an important initial broad finding which
has been made possible by the diversity of countries involved in the research.
To conclude, this initial report has hopefully begun to demonstrate the potential of the
Children’s Worlds survey and, more generally, of international comparative research which
gathers children’s own opinions and perspectives, in identifying both positive and negative
aspects of children’s lives in different countries and priorities for future action.

Children’s Worlds Report, 2015
148
Appendix: Additional tables

Children’s Worlds Report, 2015
149
Table A1: Rank of mean satisfaction scores within each country for each aspect of life
Algeria* Colombia* Estonia Ethiopia Germany Israel Nepal Norway Poland* Romania S Africa* S Korea Spain* Turkey* UK*
The house/flat where you live 14 16 6 10 7 8 14 10 3 11 12 4 9 3 5
The people you live with 7 13 1 12 2 3 21 3 5 4 11 2 3 2 2
All the other people in family 16 15 22 26 3 16 26 1 – 6 10 1 5 26 4
Your family life 1 5 2 11 6 2 6 5 2 1 2 3 4 1 3
All the things you have 27 4 4 30 1 1 7 2 1 3 6 6 1 10 1
Your friends 22 24 10 20 4 18 13 7 16 26 19 5 8 20 6
Your relationships .. in general 13 26 16 15 14 14 22 8 11 23 24 10 12 14 13
The people in your area 26 29 27 24 29 27 20 27 23 28 28 25 22 29 25
The local police in your area 31 31 31 29 31 31 28 – – 31 31 31 31 31 31
How dealt with at doctors 18 21 11 19 11 11 11 6 – 19 13 9 6 19 12
Outdoor areas .. in your area 30 28 30 31 28 30 30 25 21 30 30 28 27 30 30
The area you live in general 24 19 13 22 26 20 16 4 13 16 26 21 16 24 16
Other children in your class 25 30 29 18 27 29 18 23 22 29 27 17 23 27 24
Your school marks 19 27 28 9 30 23 8 24 25 27 21 30 30 28 23
Your school experience 11 20 21 13 23 25 5 18 20 24 14 13 25 22 20
Your life as a student 3 14 26 1 24 26 3 22 24 15 7 19 28 15 21
Things you have learned 2 8 12 3 17 10 1 16 19 7 1 12 14 7 10
Relationship with teachers 6 25 24 5 25 28 4 17 26 21 18 8 24 13 28
How you use your time 23 18 15 16 16 21 17 26 12 18 20 22 20 21 18
What do in your free time 20 9 3 14 5 9 19 9 9 8 8 11 7 11 8
Your health 9 1 8 2 8 4 9 15 8 2 5 7 2 5 7
The way that you look 8 7 20 7 21 5 23 29 – 13 9 29 18 23 27
Your own body 17 2 25 6 22 6 12 30 18 12 4 26 19 16 26
Your self-confidence 4 6 14 4 19 17 15 28 15 10 16 23 13 8 29
The freedom you have 28 22 23 25 13 13 25 14 14 17 23 24 26 17 17
Amount of opportunities .. 21 11 18 21 15 15 24 12 17 20 17 27 29 25 14
Listened to by adults .. 15 23 17 23 18 24 27 19 – 22 22 20 21 18 19
How safe you feel 10 12 9 17 12 12 10 11 6 9 15 15 10 4 9
Things you want to be good at 5 3 7 8 20 7 2 21 10 5 3 14 11 9 11
Doing things away from home 29 17 5 28 10 19 29 13 4 14 29 16 15 12 15
Later in life 12 10 19 27 9 22 31 20 7 25 25 18 17 6 22
1

Children’s Worlds Report, 2015
150
Table A2: Relative satisfaction scores for each aspect of life by country
Algeria* Colombia* Estonia Ethiopia Germany Israel Nepal Norway Poland* Romania S Africa* S Korea Spain* Turkey* UK*
The house/flat where you live 0.99 0.98 1.01 0.99 1.02 0.99 0.99 0.98 1.02 0.98 1.00 1.04 0.99 1.01 1.01
The people you live with 1.00 0.97 1.03 0.97 1.02 1.01 0.93 1.00 0.99 0.98 0.99 1.06 1.00 1.01 1.02
All the other people in family 0.99 1.00 0.95 0.92 1.05 0.98 0.92 1.03 – 1.01 1.02 1.11 1.02 0.96 1.04
Your family life 1.03 0.99 1.02 0.96 1.00 1.00 1.00 0.97 1.00 0.98 1.02 1.03 0.99 1.00 1.00
All the things you have 0.90 1.01 1.02 0.84 1.04 1.03 1.02 1.01 1.03 1.00 1.01 1.02 1.03 0.98 1.05
Your friends 0.97 0.96 1.01 0.98 1.05 0.99 1.02 1.01 0.97 0.96 0.99 1.04 1.02 0.98 1.03
Your relationships .. in general 1.02 0.95 1.00 1.00 1.01 1.00 0.97 1.02 1.01 0.99 0.97 1.01 1.01 1.01 1.01
The people in your area 1.00 0.98 1.01 1.02 0.95 1.00 1.05 1.02 1.00 1.00 0.93 1.03 1.04 0.95 1.00
The local police in your area 0.95 0.81 0.98 1.06 1.05 0.99 1.09 – – 1.04 0.94 1.03 0.97 1.05 1.09
How dealt with at doctors 0.98 0.98 1.00 0.98 1.02 1.00 1.02 1.01 – 0.98 1.01 1.01 1.03 0.98 1.00
Outdoor areas .. in your area 0.89 1.05 1.00 0.95 1.01 0.98 0.98 1.08 1.05 1.00 0.92 1.02 1.07 0.97 1.02
The area you live in general 0.96 1.01 1.02 0.98 0.93 1.01 1.03 1.05 1.02 1.02 0.94 1.00 1.01 1.00 1.01
Other children in your class 0.99 0.96 0.97 1.05 0.97 0.97 1.06 1.03 0.99 0.99 0.98 1.05 1.02 0.96 1.00
Your school marks 1.04 0.98 0.97 1.09 0.93 1.03 1.11 1.01 0.96 0.99 1.05 0.92 0.95 0.96 1.01
Your school experience 1.04 1.00 0.98 1.02 0.95 0.96 1.07 1.00 0.97 0.99 1.02 1.02 0.97 1.00 0.99
Your life as a student 1.08 1.02 0.95 1.09 0.94 0.95 1.08 0.97 0.93 1.01 1.05 0.99 0.94 1.01 0.98
Things you have learned 1.05 1.01 0.98 1.04 0.97 0.99 1.07 0.96 0.94 1.00 1.05 0.98 0.98 1.00 0.99
Relationship with teachers 1.07 0.97 0.98 1.07 0.95 0.95 1.09 1.00 0.91 1.01 1.02 1.04 0.98 1.03 0.94
How you use your time 0.97 1.01 1.01 1.01 1.01 1.00 1.01 0.96 1.01 1.00 1.01 0.98 0.99 1.00 1.00
What do in your free time 0.96 1.01 1.03 0.98 1.03 1.00 0.96 0.99 1.00 1.00 1.02 0.99 1.01 0.99 1.01
Your health 1.00 1.01 0.99 1.02 1.01 1.01 1.00 0.96 0.99 0.99 1.01 0.99 1.02 0.99 0.99
The way that you look 1.06 1.05 0.99 1.06 0.97 1.05 0.96 0.94 – 1.02 1.05 0.90 1.00 1.00 0.94
Your own body 1.01 1.06 0.97 1.06 0.95 1.04 1.04 0.92 0.97 1.02 1.07 0.92 1.00 1.01 0.94
Your self-confidence 1.06 1.04 1.00 1.05 0.99 0.99 1.02 0.94 0.98 1.01 1.00 0.96 1.01 1.02 0.92
The freedom you have 0.95 1.01 0.98 0.96 1.04 1.03 0.96 1.02 1.02 1.02 1.00 0.99 0.97 1.02 1.02
Amount of opportunities .. 1.00 1.04 1.01 0.99 1.02 1.02 0.96 1.02 0.99 1.01 1.02 0.93 0.95 0.99 1.02
Listened to by adults .. 1.04 1.00 1.01 0.98 1.01 0.99 0.92 1.00 – 1.01 1.01 1.00 0.99 1.02 1.01
How safe you feel 1.02 1.00 1.01 0.97 1.00 0.99 1.01 0.99 1.01 1.00 0.99 0.97 1.00 1.02 1.01
Things you want to be good at 1.03 1.02 1.01 1.02 0.96 1.00 1.06 0.94 0.99 1.00 1.04 0.97 0.99 0.99 0.99
Doing things away from home 0.88 1.03 1.07 0.93 1.06 1.02 0.91 1.02 1.06 1.03 0.88 1.02 1.02 1.03 1.02
Later in life 1.05 1.05 1.01 0.95 1.08 1.01 0.71 1.01 1.06 0.99 0.97 1.01 1.02 1.06 0.99
1

Children’s Worlds Report, 2015
151
References
Angelini, V., Cavapozzi, D., Corazzini, L., & Paccagnella, O. (2013), Do Danes and Italians Rate Life
Satisfaction in the Same Way? Using Vignettes to Correct for Individual-Specific Scale Biases. Oxford Bulletin
of Economics and Statistics. doi: 10.1111/obes.12039
Arts, W. and Gelissen, J. (2002) ‘Three Worlds of Welfare Capitalism or More? A State of the Art Report’
Journal of European Social Policy, 12: 2, 137‐58.
Ajzenstadt, M. & Gal, J. (2010) Children, Gender and Families in Mediterranean Welfare States. Dodrecht,
Heidelberg, London, New York: Springer.
Ben-Arieh, A. (2008). The Child Indicators Movement: Past, Present, and Future. Child Indicators Research,
1(1), 3–16. http://doi.org/10.1007/s12187-007-9003-1
Bradshaw, J., B. Martorano, L. Natali and C. de Neubourg (2013). Children’s Subjective Well-being in Rich
Countries, Child Indicators Research, 6, 4, 619–635.
Bradshaw, J. (2015) Subjective well-being and social policy: can nations make their children happier? Child
Indicators Research, 8, 1, 227-241.
Casas, F., & Rees, G. (2015). Measures of Children’s Subjective Well-Being: Analysis of the Potential for Cross-
National Comparisons. Child Indicators Research, 8(1), 49–69. http://doi.org/10.1007/s12187-014-9293-z
Cummins R & Lau A (2005) Personal Wellbeing Index – School Children (Third Edition). Melbourne: School of
Psychology, Deakin University
Currie, C., & others. (2012). Social determinants of health and well-being among young people. World Health
Organization Regional Office for Europe Copenhagen
Deci, E. L., & Ryan, R. M. (2000). The ‘what’ and ‘why’ of goal pursuits: Human needs and the self‐
determination of behaviour. Psychological Inquiry, 11, 227‐268.
Deci, E. L., & Ryan, R. M. (2008). Hedonia, eudaimonia, and well-being: an introduction. Journal of Happiness
Studies, 9(1), 1–11. http://doi.org/10.1007/s10902-006-9018-1
Dex, S., & Hollingworth, K. (2012). Children’s and young people’s voices on their wellbeing. Childhood Well-Being
Research Centre, Working Paper, 16. London: Institute of Education.
Diener, E., Oishi, S., & Lucas, R. E. (2003). Personality, Culture, and Subjective Well-Being: Emotional and
Cognitive Evaluations of Life. Annual Review of Psychology, 54(1), 403–425.
http://doi.org/10.1146/annurev.psych.54.101601.145056
Esping-Andersen, G. (1990) The three worlds of welfare capitalism. Cambridge and Oxford: Polity Press.
Evans J., Macrory, I. & Randall, C. (2015) Measuring National Well-being: Life in the UK, 2015. London: Office
for National Statistics
Helliwell, John F., Richard Layard, and Jeffrey Sachs, eds. (2013). World Happiness Report 2013. New York: UN
Sustainable Development Solutions Network.
Huebner, E. S. (1991). Initial Development of the Student’s Life Satisfaction Scale. School Psychology
International, 12(3), 231–240. http://doi.org/10.1177/0143034391123010
Huebner, E. S., Seligson, J. L., Valois, R. F., & Suldo, S. M. (2006). A Review of the Brief Multidimensional
Students’ Life Satisfaction Scale. Social Indicators Research, 79(3), 477–484. http://doi.org/10.1007/s11205-005-
5395-9

Children’s Worlds Report, 2015
152
Hurrelmann, K., & Andresen, S. (2010). Children in Germany 2010: Second World vision Kinderstudie.
Friedrichsdorf, Germany: World Vision.
Keyes, C. L. M. (2006). Mental health in adolescence: Is America’s youth flourishing? American Journal of
Orthopsychiatry, 76(3), 395–402. http://doi.org/10.1037/0002-9432.76.3.395
Kim, H., Schimmack, U., & Oishi, S. (2012). Cultural differences in self- and other-evaluations and well-
being: A study of European and Asian Canadians. Journal of Personality and Social Psychology, 102(4), 856–873.
http://doi.org/10.1037/a0026803
Klocke, A., Clair, A. and Bradshaw, J. (2014) 'International Variation in Child Subjective Well-Being', Child
Indicators Research. 7, 1, 1-20.
Linley, P. A., Maltby, J., Wood, A. M., Osborne, G., & Hurling, R. (2009). Measuring happiness: The higher
order factor structure of subjective and psychological well-being measures. Personality and Individual
Differences, 47(8), 878–884. http://doi.org/10.1016/j.paid.2009.07.010
OECD (2013), OECD Guidelines on Measuring SubjectiveWell-being, OECD Publishing.
http://dx.doi.org/10.1787/9789264191655-en
Qvortrup, J. (1997). A voice for children in statistical and social accounting: A plea for children's right to be
heard. In A. James, & A. Prout (eds.) Constructing and Reconstructing Childhood: Contemporary Issues in the
Sociological Study of Childhood (pp. 83-104). London,UK: Routledge.
Rees, G., & Dinisman, T. (2015). Comparing Children’s Experiences and Evaluations of Their Lives in 11
Different Countries. Child Indicators Research, 8(1), 5–31. http://doi.org/10.1007/s12187-014-9291-1
Russell, J. A. (1980). A circumplex model of affect. Journal of Personality and Social Psychology, 39(6), 1161–1178.
Ryff, C. D. (1989). Happiness is everything, or is it? Explorations on the meaning of psychological well-being.
Journal of Personality and Social Psychology, 57(6), 1069.
Stiglitz, J., Sen, A. & Fitoussi, J.-P. (2009). Report of the commission on the measurement of economic
performance and social progress. http://www.stiglitz-sen-fitoussi.fr/documents/rapport_anglais.pdf.
The Children's Society (2014) The Good Childhood Report 2014. London: The Children's Society
http://www.childrenssociety.org.uk/sites/default/files/publications/the_good_childhood_report_2014_-
_final.pdf
UNICEF Office of Research (2013). Child Well-being in Rich Countries: A comparative overview, Innocenti Report
Card 11. Florence, Italy: UNICEF Innocenti Research Centre. Retrieved from: http://www.unicef-
irc.org/publications/683
UNICEF Office of Research. (2007). Child poverty in perspective: An overview of child well-being in rich countries,
Innocenti Report Card 7. Florence, Italy: UNICEF Innocenti Research Centre. Retrieved from:
http://www.unicef-irc.org/media-centre/press-kit/reportcard7/
UNICEF Spain (2012). Children’s well‐being from their own point of view. What affects the children’s wellbeing in the
first year of Compulsory Secondary Education in Spain? Madrid: UNICEF Spain
Van Soest, A., Delaney, L., Harmon, C., Kapteyn, A., & Smith, J. P. (2011). Validating the use of anchoring
vignettes for the correction of response scale differences in subjective questions. Journal of the Royal Statistical
Society: Series A (Statistics in Society), 174(3), 575–595.