children’s system of care...disturbances who are receiving care management, mrss, or out-of-home...
TRANSCRIPT
Children’s System of Care
Presented by
Elizabeth Manley
Assistant Commissioner
2
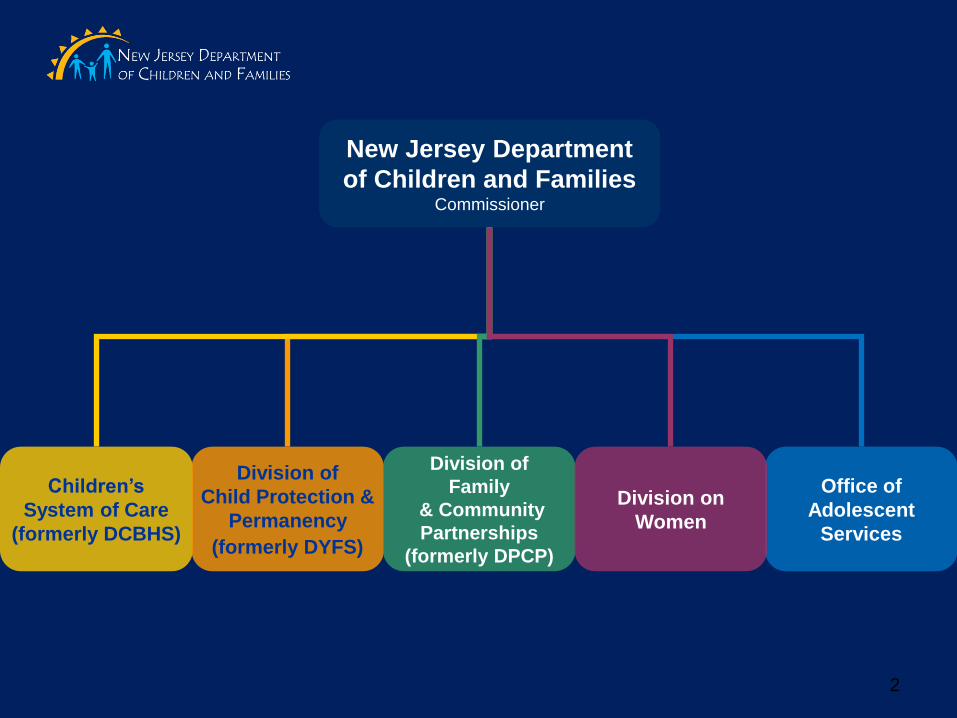
Children’s
System of Care
(formerly DCBHS)
Division of
Child Protection &
Permanency
(formerly DYFS)
Division of
Family
& Community
Partnerships
(formerly DPCP)
Office of
Adolescent
Services
New Jersey Department
of Children and Families Commissioner
Division on
Women
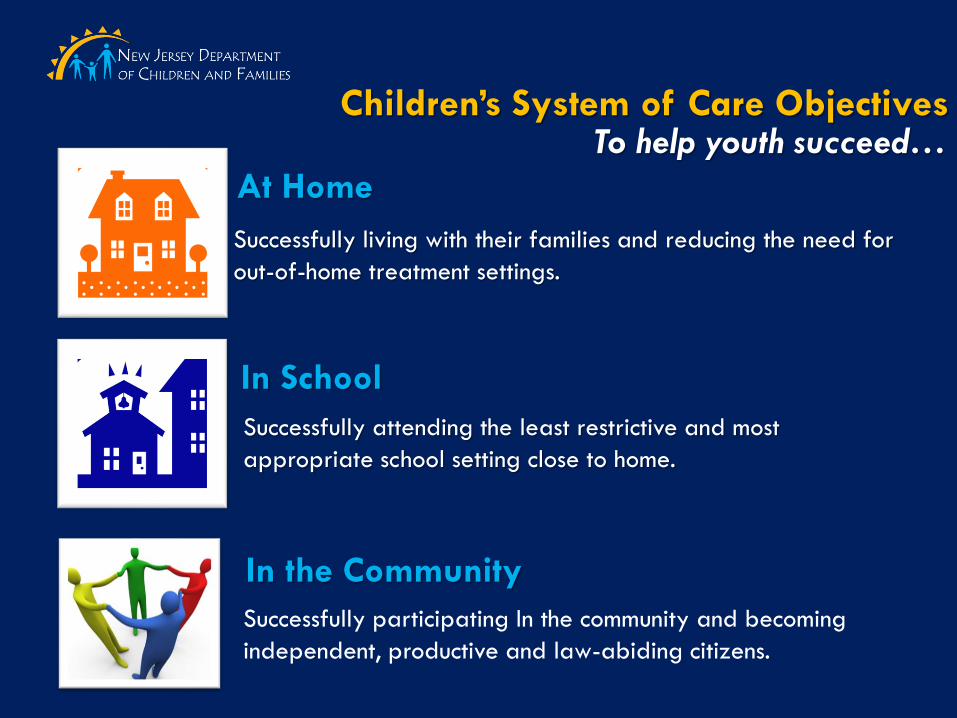
At Home
In School
In the Community
Successfully living with their families and reducing the need for
out-of-home treatment settings.
Successfully attending the least restrictive and most
appropriate school setting close to home.
Successfully participating In the community and becoming
independent, productive and law-abiding citizens.
Children’s System of Care Objectives To help youth succeed…
4
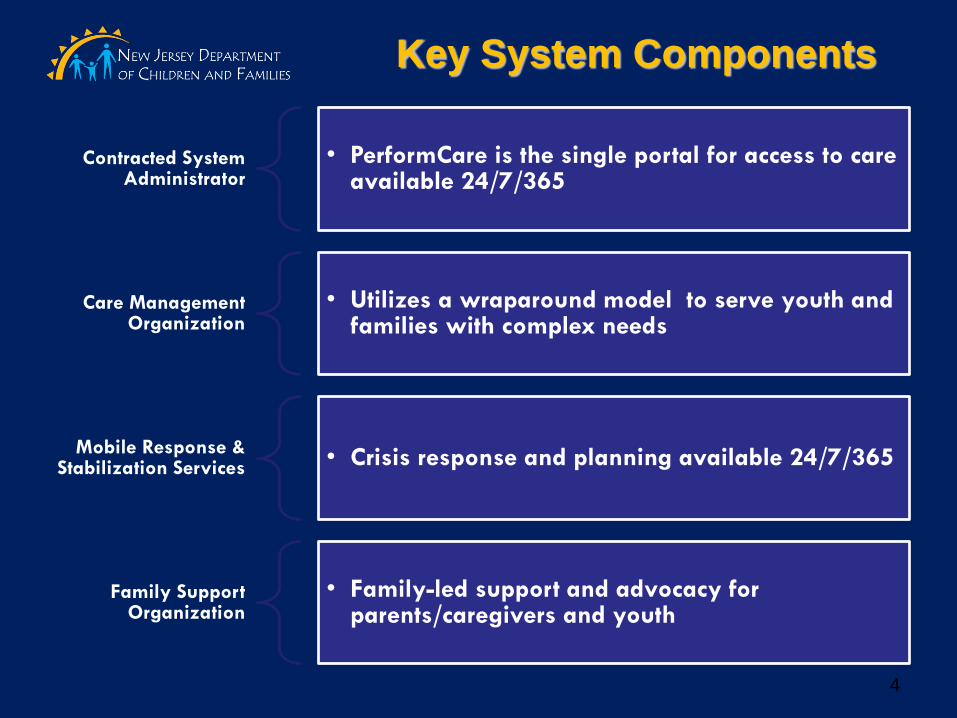
Key System Components
Contracted System Administrator
• PerformCare is the single portal for access to care available 24/7/365
Care Management Organization
• Utilizes a wraparound model to serve youth and families with complex needs
Mobile Response & Stabilization Services • Crisis response and planning available 24/7/365
Family Support Organization
• Family-led support and advocacy for parents/caregivers and youth
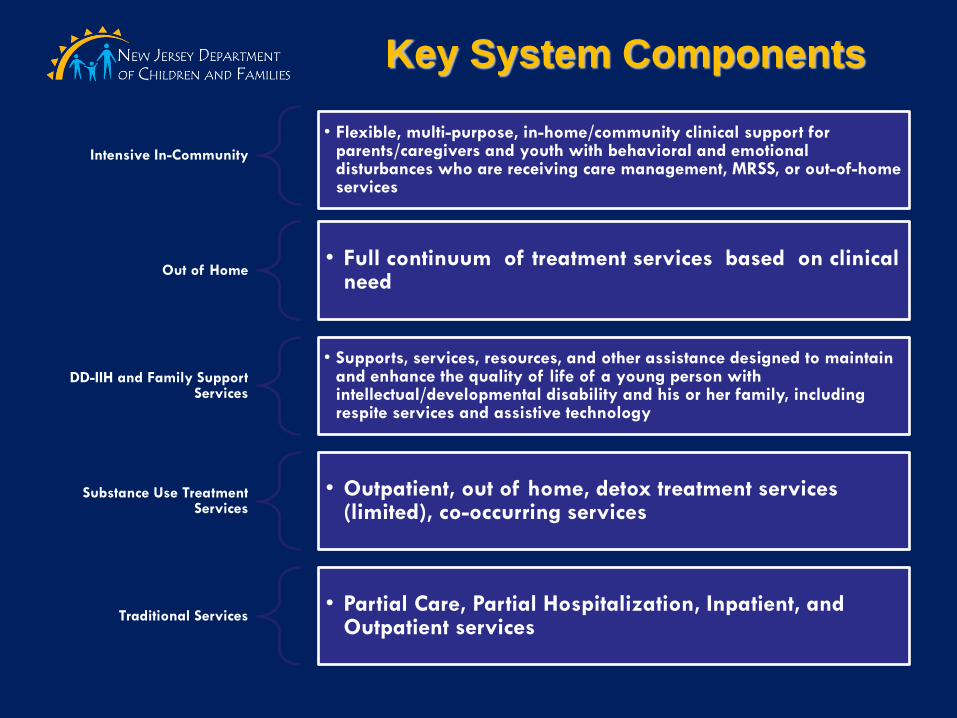
Key System Components
Intensive In-Community
• Flexible, multi-purpose, in-home/community clinical support for parents/caregivers and youth with behavioral and emotional disturbances who are receiving care management, MRSS, or out-of-home services
Out of Home • Full continuum of treatment services based on clinical
need
DD-IIH and Family Support Services
• Supports, services, resources, and other assistance designed to maintain and enhance the quality of life of a young person with intellectual/developmental disability and his or her family, including respite services and assistive technology
Substance Use Treatment Services
• Outpatient, out of home, detox treatment services (limited), co-occurring services
Traditional Services • Partial Care, Partial Hospitalization, Inpatient, and
Outpatient services
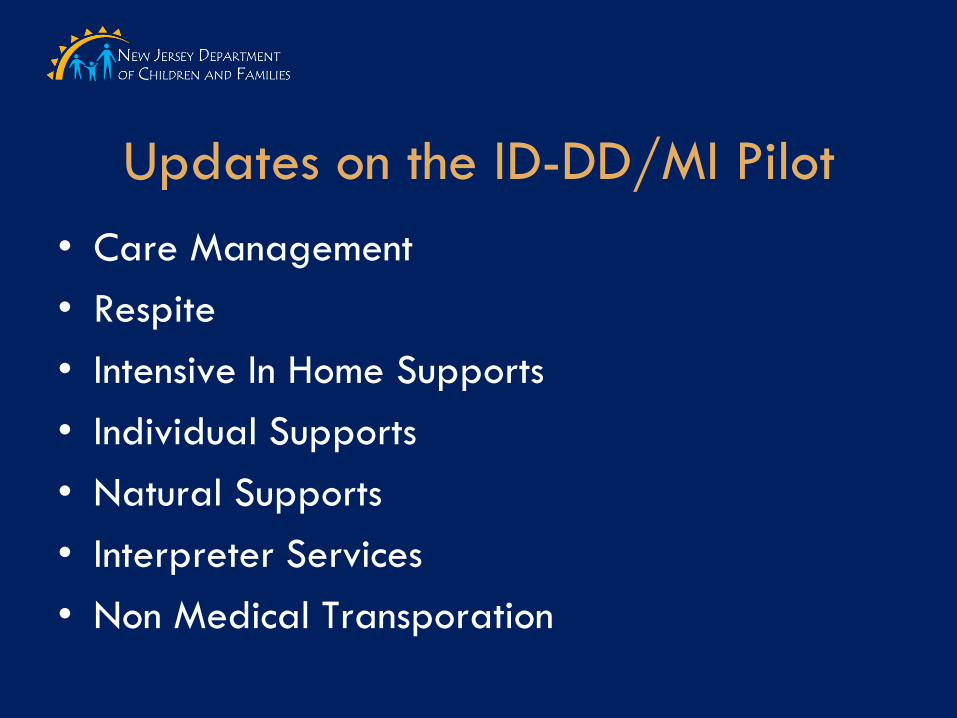
Updates on the ID-DD/MI Pilot
• Care Management
• Respite
• Intensive In Home Supports
• Individual Supports
• Natural Supports
• Interpreter Services
• Non Medical Transporation
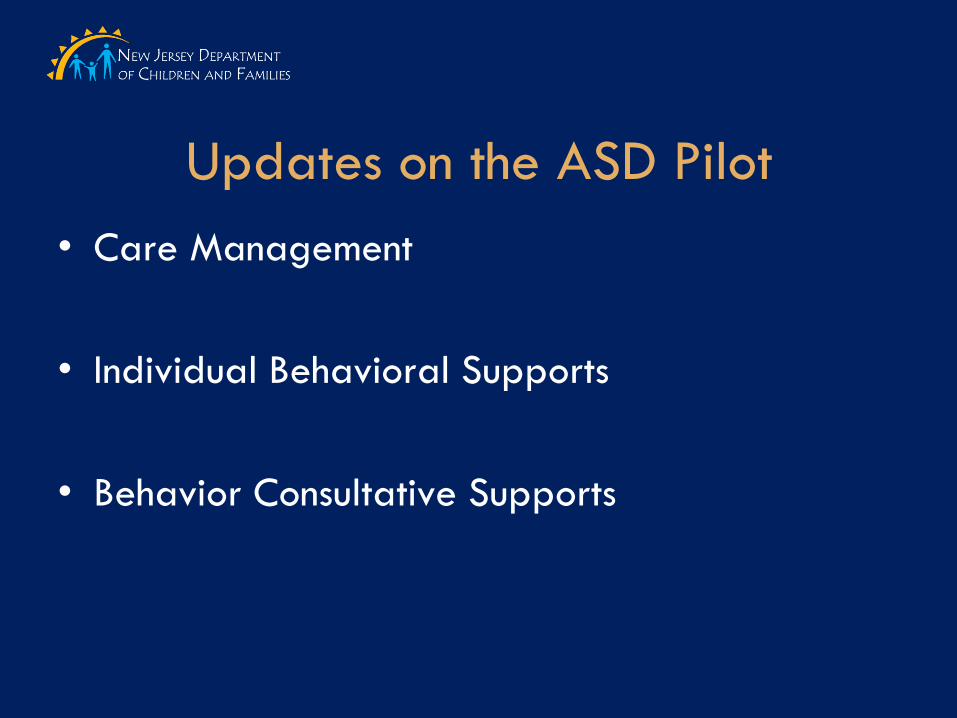
Updates on the ASD Pilot
• Care Management
• Individual Behavioral Supports
• Behavior Consultative Supports
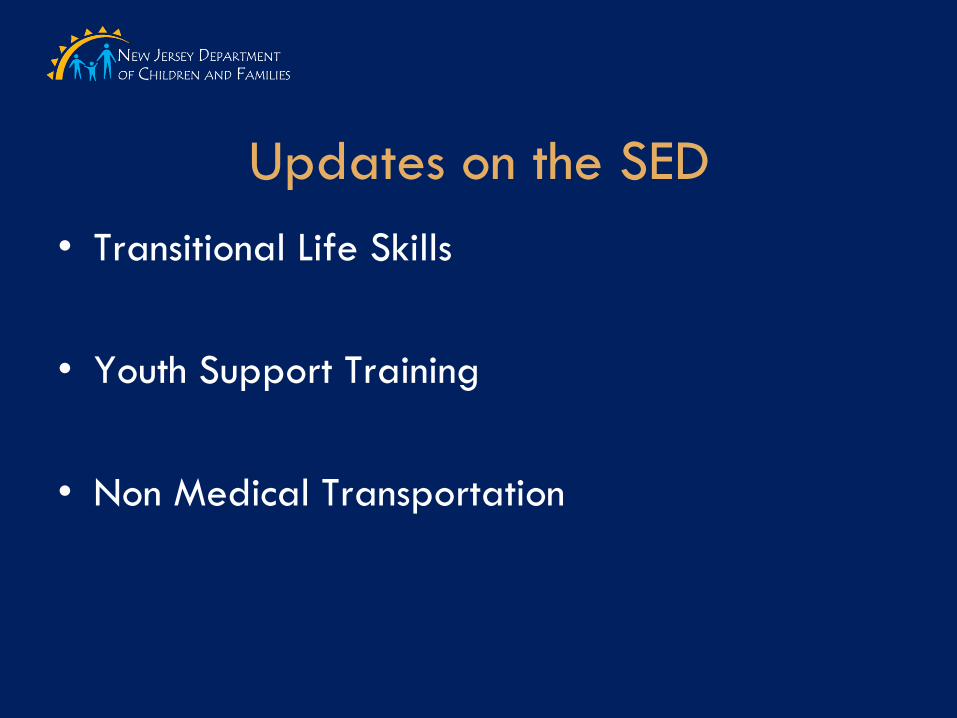
Updates on the SED
• Transitional Life Skills
• Youth Support Training
• Non Medical Transportation
Child Family Team
Child Family Team (CFT)
A team of family members, professionals, and significant community residents identified by
the family and organized by the care management organization to design and oversee
implementation of the Individual Service Plan.
CFT members should include, but are not limited to, the following individuals:
– Child/Youth/Young Adult
– Parent(s)/Legal Guardian
– Care Management Organization
– Natural supports as identified and selected by youth and family
– Treating Providers (in-home, out-of-home, etc.)
– Educational Professionals
– Probation Officer (if applicable)
– Child Protection & Permanency (CP&P)
(if applicable)
Developmental/Intellectual Disabilities
Eligibility Process
• Electronic Application
• Over 17,000 individuals are DD Eligibility
Family Support Service
• Fair and Equitable process through Family Support
Application Process
• Data now included in CIACC Data Dashboard
Summer Camp
• RFQ for Summer Camp and One to One
Intellectual / Developmental Disabilities
Eligibility & Services
Eligibility
• For individuals under age 18, eligibility is determined by CSOC
- Application materials for individuals under 18 available on PerformCare website (www.performcarenj.org)
• For individuals age 18 and older, eligibility is determined by DDD
- Application materials for individuals 18 and older available on DDD website (www.state.nj.us/humanservices/ddd/services/apply/application.html)
CSOC Substance Use Treatment Services
Available Services:
• Assessment
• Outpatient (OP)
• Intensive Outpatient (IOP)
• Partial Care (PC)
• Long-Term Residential (LT-RTC)*
• Short-Term Residential (ST-RTC)*
• Detoxification
All service authorizations are based on clinical justification.
*Qualifies for co-occurring enhancement services
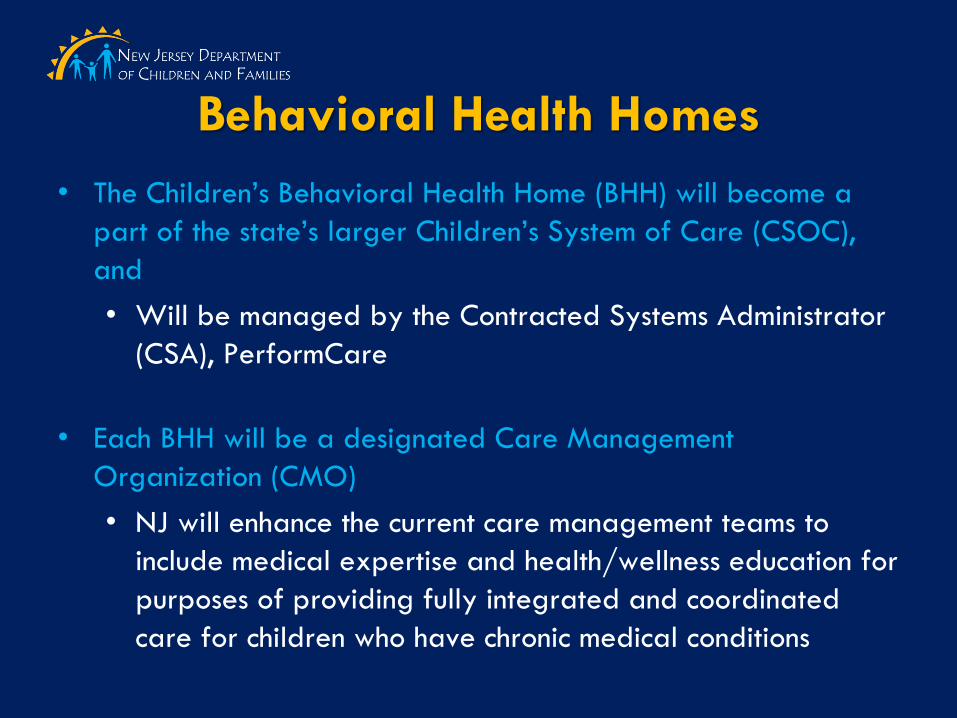
Behavioral Health Homes
• The Children’s Behavioral Health Home (BHH) will become a
part of the state’s larger Children’s System of Care (CSOC),
and
• Will be managed by the Contracted Systems Administrator
(CSA), PerformCare
• Each BHH will be a designated Care Management
Organization (CMO)
• NJ will enhance the current care management teams to
include medical expertise and health/wellness education for
purposes of providing fully integrated and coordinated
care for children who have chronic medical conditions
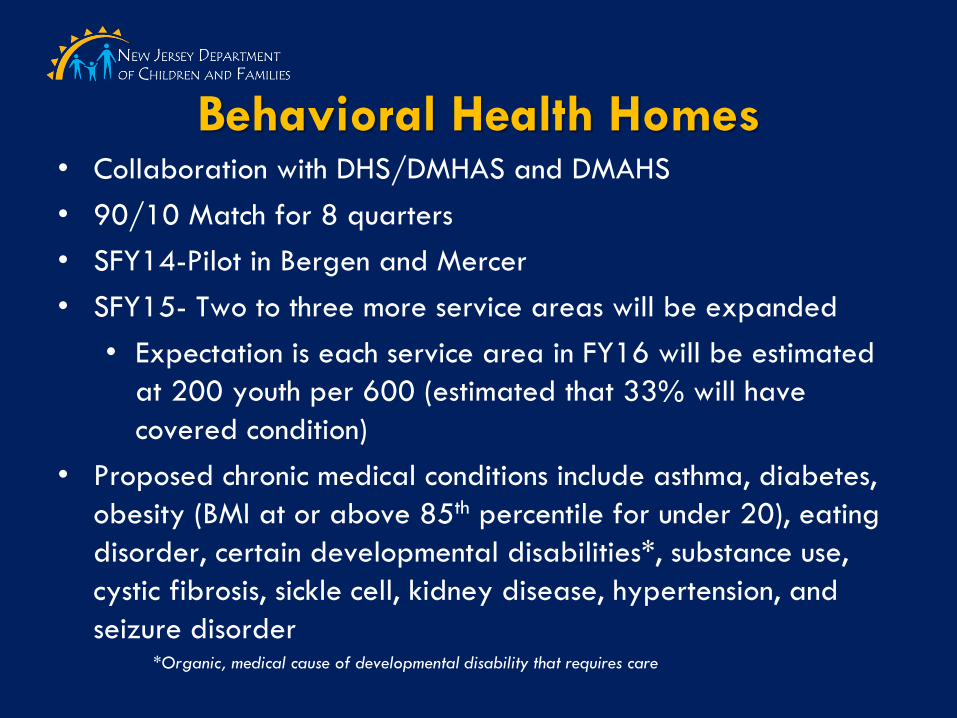
Behavioral Health Homes • Collaboration with DHS/DMHAS and DMAHS
• 90/10 Match for 8 quarters
• SFY14-Pilot in Bergen and Mercer
• SFY15- Two to three more service areas will be expanded
• Expectation is each service area in FY16 will be estimated
at 200 youth per 600 (estimated that 33% will have
covered condition)
• Proposed chronic medical conditions include asthma, diabetes,
obesity (BMI at or above 85th percentile for under 20), eating
disorder, certain developmental disabilities*, substance use,
cystic fibrosis, sickle cell, kidney disease, hypertension, and
seizure disorder *Organic, medical cause of developmental disability that requires care
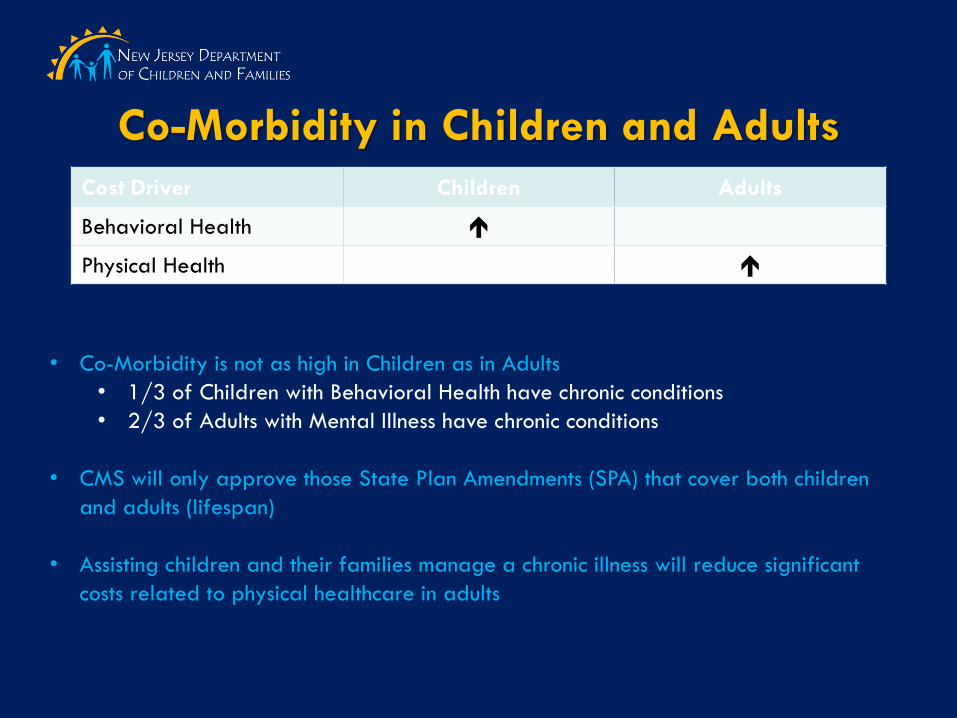
Co-Morbidity in Children and Adults
Cost Driver Children Adults
Behavioral Health
Physical Health
• Co-Morbidity is not as high in Children as in Adults
• 1/3 of Children with Behavioral Health have chronic conditions
• 2/3 of Adults with Mental Illness have chronic conditions
• CMS will only approve those State Plan Amendments (SPA) that cover both children
and adults (lifespan)
• Assisting children and their families manage a chronic illness will reduce significant
costs related to physical healthcare in adults
For more information… 1
Children’s System of Care
http://www.state.nj.us/dcf/families/csc/
PerformCare Member Services:
877-652-7624
www.performcarenj.org
Managed Long Term Services and Supports (MLTSS)
Presentation to the Medical Assistance
Advisory Council
January 20, 2016
Presentation by Lowell Arye Deputy Commissioner
Department of Human Services
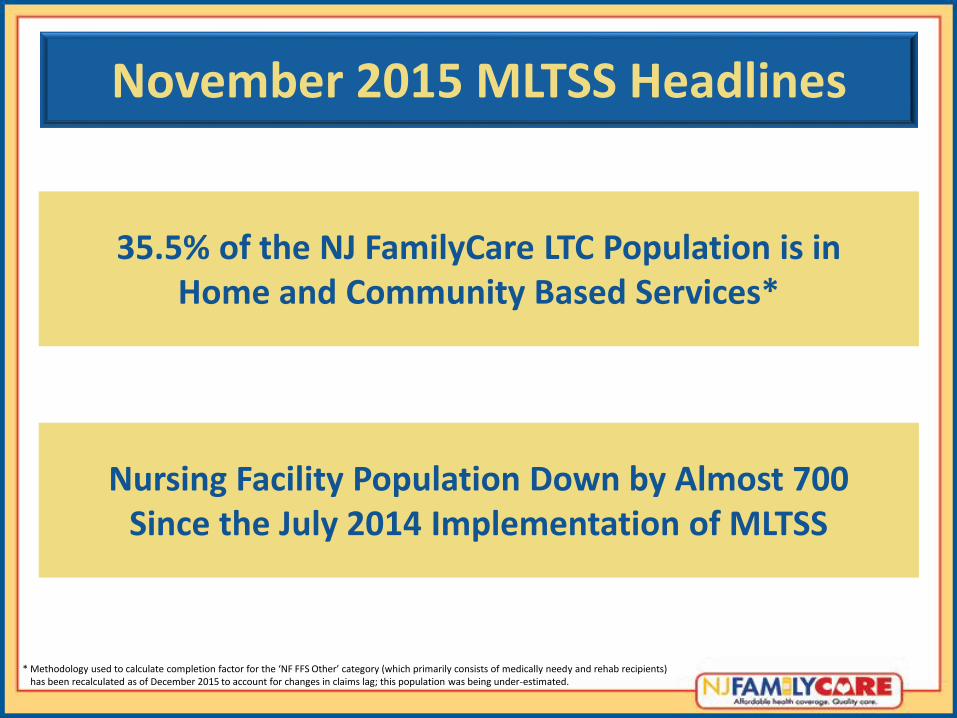
November 2015 MLTSS Headlines
35.5% of the NJ FamilyCare LTC Population is in Home and Community Based Services*
Nursing Facility Population Down by Almost 700 Since the July 2014 Implementation of MLTSS
* Methodology used to calculate completion factor for the ‘NF FFS Other’ category (which primarily consists of medically needy and rehab recipients) has been recalculated as of December 2015 to account for changes in claims lag; this population was being under-estimated.
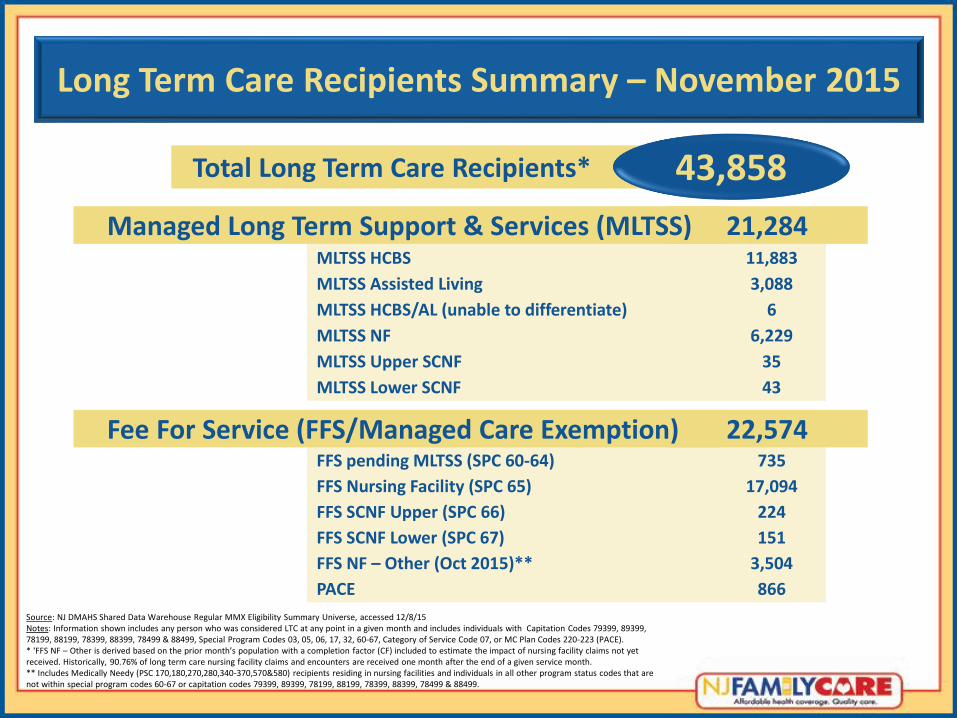
FFS pending MLTSS (SPC 60-64) 735
Total Long Term Care Recipients* 43,858
FFS Nursing Facility (SPC 65) 17,094
FFS SCNF Upper (SPC 66) 224
FFS SCNF Lower (SPC 67) 151
MLTSS HCBS 11,883
MLTSS Assisted Living 3,088
22,574
21,284
Fee For Service (FFS/Managed Care Exemption)
Managed Long Term Support & Services (MLTSS)
Long Term Care Recipients Summary – November 2015
Source: NJ DMAHS Shared Data Warehouse Regular MMX Eligibility Summary Universe, accessed 12/8/15 Notes: Information shown includes any person who was considered LTC at any point in a given month and includes individuals with Capitation Codes 79399, 89399, 78199, 88199, 78399, 88399, 78499 & 88499, Special Program Codes 03, 05, 06, 17, 32, 60-67, Category of Service Code 07, or MC Plan Codes 220-223 (PACE). * ‘FFS NF – Other is derived based on the prior month’s population with a completion factor (CF) included to estimate the impact of nursing facility claims not yet received. Historically, 90.76% of long term care nursing facility claims and encounters are received one month after the end of a given service month. ** Includes Medically Needy (PSC 170,180,270,280,340-370,570&580) recipients residing in nursing facilities and individuals in all other program status codes that are not within special program codes 60-67 or capitation codes 79399, 89399, 78199, 88199, 78399, 88399, 78499 & 88499.
FFS NF – Other (Oct 2015)** 3,504
PACE 866
MLTSS HCBS/AL (unable to differentiate) 6
MLTSS NF 6,229
MLTSS Upper SCNF 35
MLTSS Lower SCNF 43
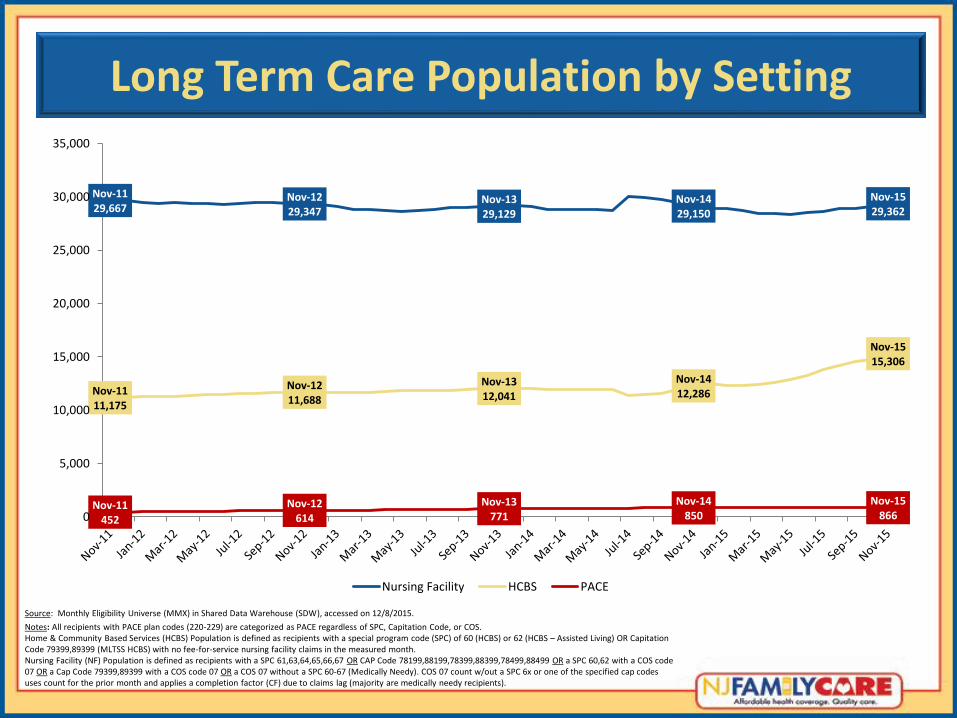
Long Term Care Population by Setting
Source: Monthly Eligibility Universe (MMX) in Shared Data Warehouse (SDW), accessed on 12/8/2015.
Notes: All recipients with PACE plan codes (220-229) are categorized as PACE regardless of SPC, Capitation Code, or COS. Home & Community Based Services (HCBS) Population is defined as recipients with a special program code (SPC) of 60 (HCBS) or 62 (HCBS – Assisted Living) OR Capitation Code 79399,89399 (MLTSS HCBS) with no fee-for-service nursing facility claims in the measured month. Nursing Facility (NF) Population is defined as recipients with a SPC 61,63,64,65,66,67 OR CAP Code 78199,88199,78399,88399,78499,88499 OR a SPC 60,62 with a COS code 07 OR a Cap Code 79399,89399 with a COS code 07 OR a COS 07 without a SPC 60-67 (Medically Needy). COS 07 count w/out a SPC 6x or one of the specified cap codes uses count for the prior month and applies a completion factor (CF) due to claims lag (majority are medically needy recipients).
Nov-11 29,667
Nov-12 29,347
Nov-13 29,129
Nov-14 29,150
Nov-15 29,362
Nov-11 11,175
Nov-12 11,688
Nov-13 12,041
Nov-14 12,286
Nov-15 15,306
Nov-11 452
Nov-12 614
Nov-13 771
Nov-14 850
Nov-15 866 0
5,000
10,000
15,000
20,000
25,000
30,000
35,000
Nursing Facility HCBS PACE
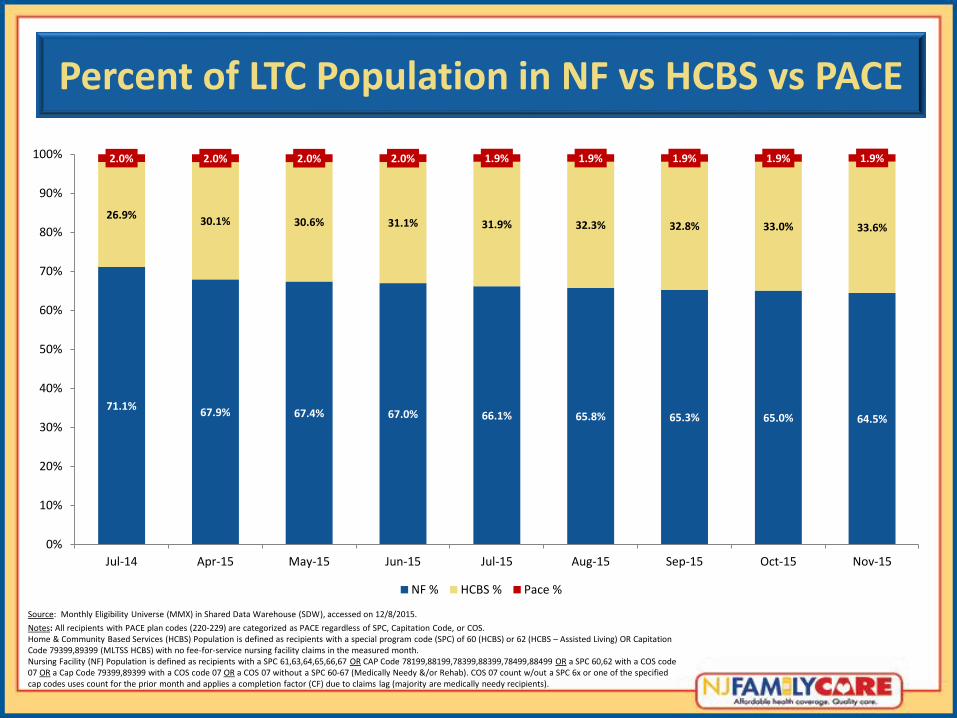
Percent of LTC Population in NF vs HCBS vs PACE
Source: Monthly Eligibility Universe (MMX) in Shared Data Warehouse (SDW), accessed on 12/8/2015.
Notes: All recipients with PACE plan codes (220-229) are categorized as PACE regardless of SPC, Capitation Code, or COS. Home & Community Based Services (HCBS) Population is defined as recipients with a special program code (SPC) of 60 (HCBS) or 62 (HCBS – Assisted Living) OR Capitation Code 79399,89399 (MLTSS HCBS) with no fee-for-service nursing facility claims in the measured month. Nursing Facility (NF) Population is defined as recipients with a SPC 61,63,64,65,66,67 OR CAP Code 78199,88199,78399,88399,78499,88499 OR a SPC 60,62 with a COS code 07 OR a Cap Code 79399,89399 with a COS code 07 OR a COS 07 without a SPC 60-67 (Medically Needy &/or Rehab). COS 07 count w/out a SPC 6x or one of the specified cap codes uses count for the prior month and applies a completion factor (CF) due to claims lag (majority are medically needy recipients).
71.1% 67.9% 67.4% 67.0% 66.1% 65.8% 65.3% 65.0% 64.5%
26.9% 30.1% 30.6% 31.1% 31.9% 32.3% 32.8% 33.0% 33.6%
2.0% 2.0% 2.0% 2.0% 1.9% 1.9% 1.9% 1.9% 1.9%
0%
10%
20%
30%
40%
50%
60%
70%
80%
90%
100%
Jul-14 Apr-15 May-15 Jun-15 Jul-15 Aug-15 Sep-15 Oct-15 Nov-15
NF % HCBS % Pace %
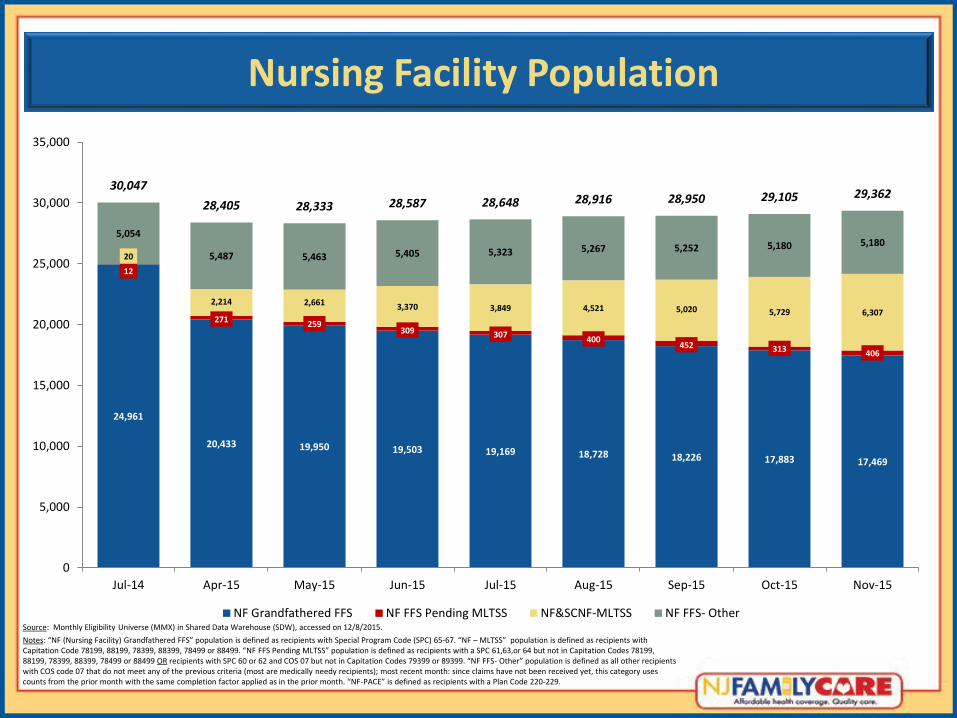
Nursing Facility Population
Source: Monthly Eligibility Universe (MMX) in Shared Data Warehouse (SDW), accessed on 12/8/2015.
Notes: “NF (Nursing Facility) Grandfathered FFS” population is defined as recipients with Special Program Code (SPC) 65-67. “NF – MLTSS” population is defined as recipients with Capitation Code 78199, 88199, 78399, 88399, 78499 or 88499. “NF FFS Pending MLTSS” population is defined as recipients with a SPC 61,63,or 64 but not in Capitation Codes 78199, 88199, 78399, 88399, 78499 or 88499 OR recipients with SPC 60 or 62 and COS 07 but not in Capitation Codes 79399 or 89399. “NF FFS- Other” population is defined as all other recipients with COS code 07 that do not meet any of the previous criteria (most are medically needy recipients); most recent month: since claims have not been received yet, this category uses counts from the prior month with the same completion factor applied as in the prior month. “NF-PACE” is defined as recipients with a Plan Code 220-229.
24,961
20,433 19,950 19,503 19,169 18,728 18,226 17,883 17,469
12
271 259
309 307 400
452 313 406
20
2,214 2,661 3,370 3,849 4,521 5,020 5,729 6,307
5,054
5,487 5,463 5,405 5,323 5,267 5,252 5,180 5,180
30,047
28,405 28,333 28,587 28,648 28,916 28,950 29,105 29,362
0
5,000
10,000
15,000
20,000
25,000
30,000
35,000
Jul-14 Apr-15 May-15 Jun-15 Jul-15 Aug-15 Sep-15 Oct-15 Nov-15
NF Grandfathered FFS NF FFS Pending MLTSS NF&SCNF-MLTSS NF FFS- Other
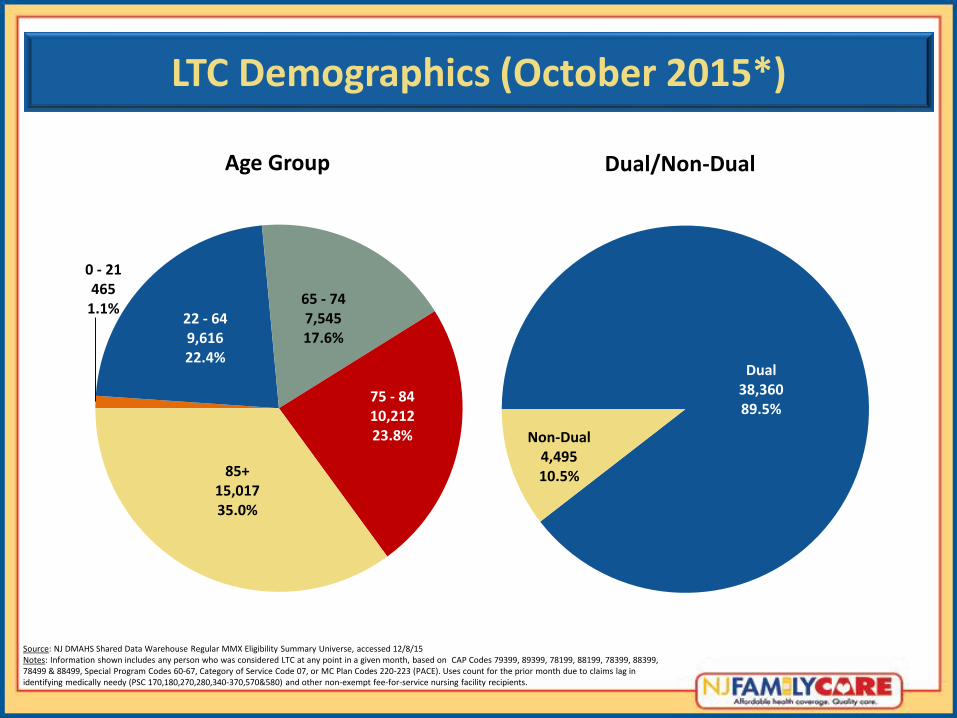
LTC Demographics (October 2015*)
Source: NJ DMAHS Shared Data Warehouse Regular MMX Eligibility Summary Universe, accessed 12/8/15 Notes: Information shown includes any person who was considered LTC at any point in a given month, based on CAP Codes 79399, 89399, 78199, 88199, 78399, 88399, 78499 & 88499, Special Program Codes 60-67, Category of Service Code 07, or MC Plan Codes 220-223 (PACE). Uses count for the prior month due to claims lag in identifying medically needy (PSC 170,180,270,280,340-370,570&580) and other non-exempt fee-for-service nursing facility recipients.
0 - 21 465
1.1% 22 - 64 9,616 22.4%
65 - 74 7,545 17.6%
75 - 84 10,212 23.8%
85+ 15,017 35.0%
Age Group
Dual 38,360 89.5%
Non-Dual 4,495 10.5%
Dual/Non-Dual
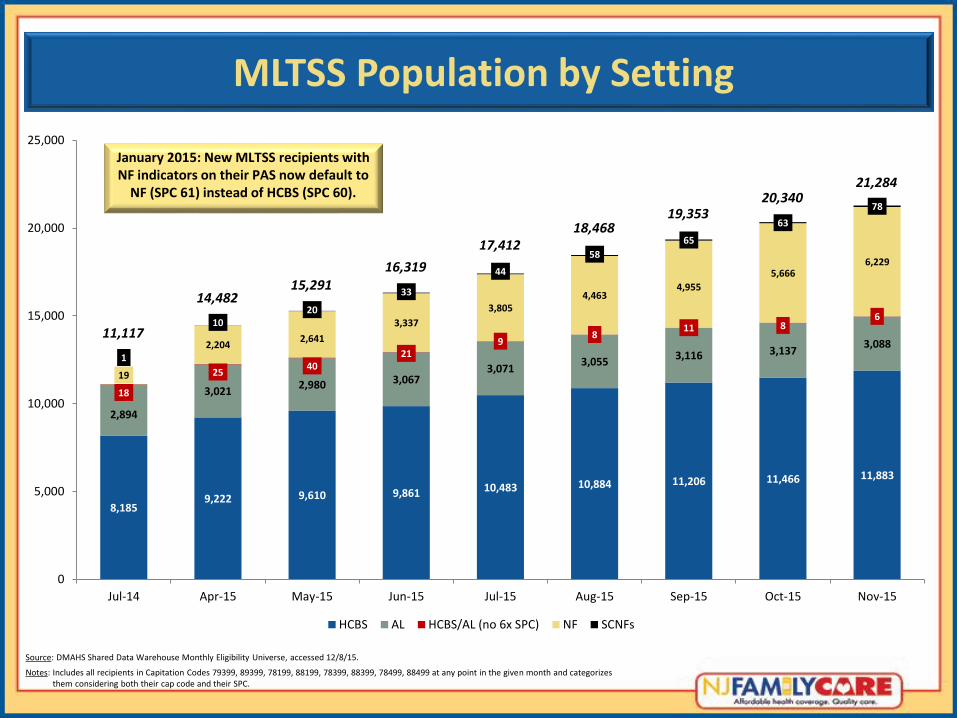
MLTSS Population by Setting
Source: DMAHS Shared Data Warehouse Monthly Eligibility Universe, accessed 12/8/15.
Notes: Includes all recipients in Capitation Codes 79399, 89399, 78199, 88199, 78399, 88399, 78499, 88499 at any point in the given month and categorizes them considering both their cap code and their SPC.
January 2015: New MLTSS recipients with NF indicators on their PAS now default to
NF (SPC 61) instead of HCBS (SPC 60).
8,185 9,222 9,610 9,861 10,483 10,884 11,206 11,466 11,883
2,894
3,021 2,980 3,067
3,071 3,055
3,116 3,137 3,088
18
25 40
21 9
8 11 8
6
19
2,204 2,641
3,337
3,805 4,463
4,955
5,666 6,229
1
10 20
33
44
58
65
63
78
11,117
14,482 15,291
16,319
17,412 18,468
19,353 20,340
21,284
0
5,000
10,000
15,000
20,000
25,000
Jul-14 Apr-15 May-15 Jun-15 Jul-15 Aug-15 Sep-15 Oct-15 Nov-15
HCBS AL HCBS/AL (no 6x SPC) NF SCNFs
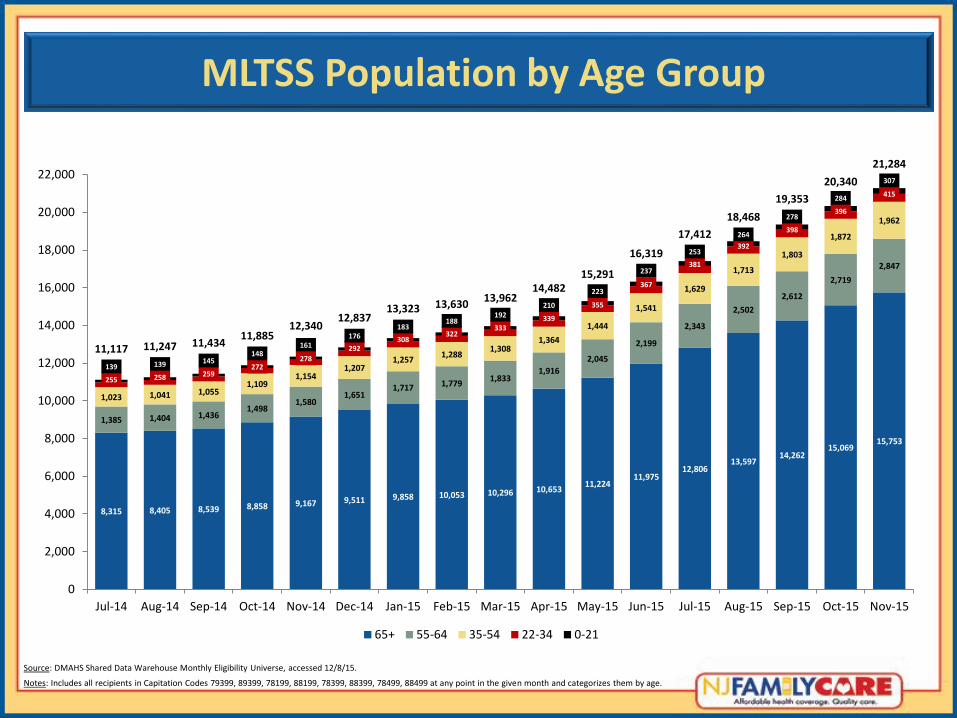
MLTSS Population by Age Group
Source: DMAHS Shared Data Warehouse Monthly Eligibility Universe, accessed 12/8/15.
Notes: Includes all recipients in Capitation Codes 79399, 89399, 78199, 88199, 78399, 88399, 78499, 88499 at any point in the given month and categorizes them by age.
8,315 8,405 8,539 8,858 9,167 9,511 9,858 10,053 10,296 10,653 11,224
11,975 12,806
13,597 14,262
15,069 15,753
1,385 1,404 1,436 1,498
1,580 1,651
1,717 1,779 1,833
1,916
2,045
2,199
2,343
2,502
2,612
2,719
2,847
1,023 1,041 1,055 1,109
1,154 1,207
1,257 1,288
1,308 1,364
1,444
1,541
1,629
1,713
1,803
1,872
1,962
255 258 259 272
278
292 308
322 333
339
355
367
381
392
398
396
415
139 139 145 148
161 176
183 188
192 210
223
237
253
264
278
284
307
11,117 11,247 11,434 11,885
12,340 12,837
13,323 13,630 13,962
14,482 15,291
16,319
17,412
18,468
19,353
20,340
21,284
0
2,000
4,000
6,000
8,000
10,000
12,000
14,000
16,000
18,000
20,000
22,000
Jul-14 Aug-14 Sep-14 Oct-14 Nov-14 Dec-14 Jan-15 Feb-15 Mar-15 Apr-15 May-15 Jun-15 Jul-15 Aug-15 Sep-15 Oct-15 Nov-15
65+ 55-64 35-54 22-34 0-21
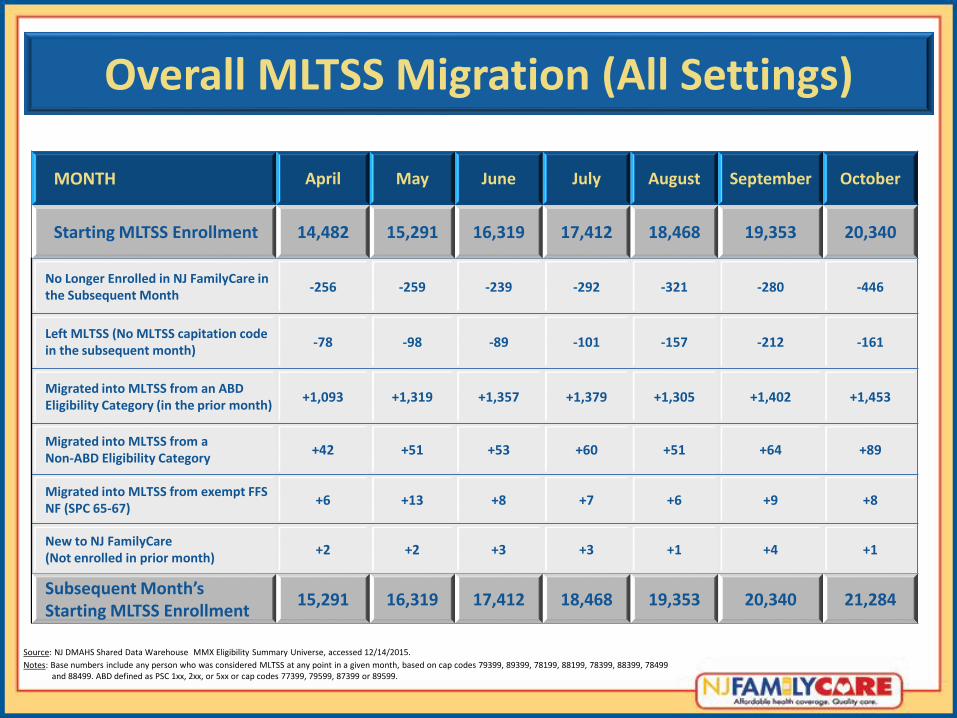
Overall MLTSS Migration (All Settings)
MONTH April May June July August September October
Starting MLTSS Enrollment 14,482 15,291 16,319 17,412 18,468 19,353 20,340
No Longer Enrolled in NJ FamilyCare in the Subsequent Month
-256 -259 -239 -292 -321 -280 -446
Left MLTSS (No MLTSS capitation code in the subsequent month)
-78 -98 -89 -101 -157 -212 -161
Migrated into MLTSS from an ABD Eligibility Category (in the prior month)
+1,093 +1,319 +1,357 +1,379 +1,305 +1,402 +1,453
Migrated into MLTSS from a Non-ABD Eligibility Category
+42 +51 +53 +60 +51 +64 +89
Migrated into MLTSS from exempt FFS NF (SPC 65-67)
+6 +13 +8 +7 +6 +9 +8
New to NJ FamilyCare (Not enrolled in prior month)
+2 +2 +3 +3 +1 +4 +1
Subsequent Month’s Starting MLTSS Enrollment
15,291 16,319 17,412 18,468 19,353 20,340 21,284
Source: NJ DMAHS Shared Data Warehouse MMX Eligibility Summary Universe, accessed 12/14/2015.
Notes: Base numbers include any person who was considered MLTSS at any point in a given month, based on cap codes 79399, 89399, 78199, 88199, 78399, 88399, 78499 and 88499. ABD defined as PSC 1xx, 2xx, or 5xx or cap codes 77399, 79599, 87399 or 89599.
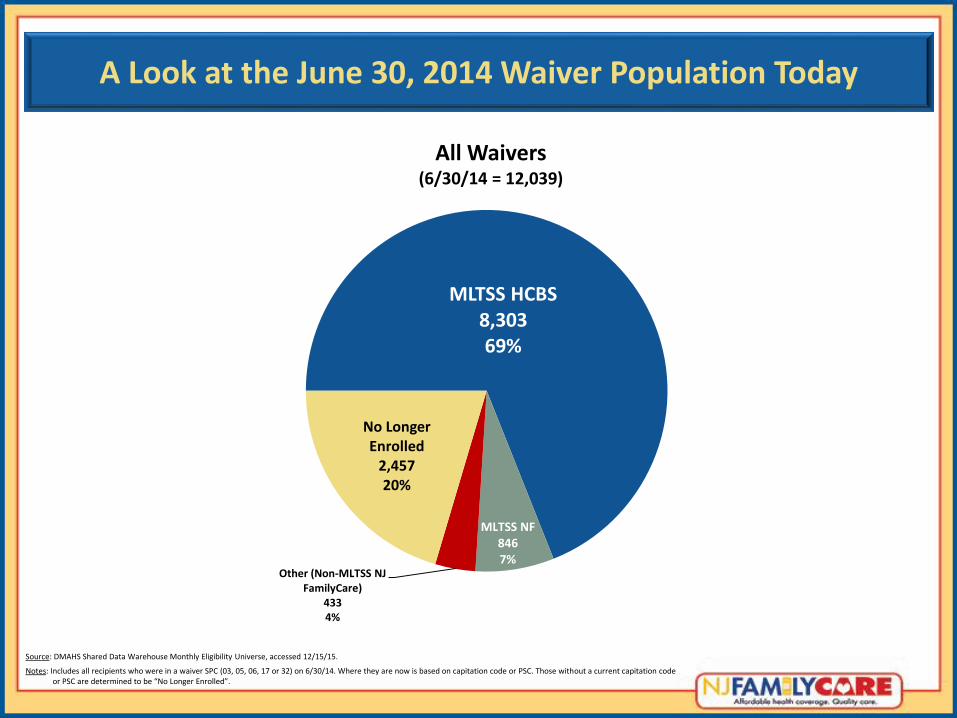
A Look at the June 30, 2014 Waiver Population Today
Source: DMAHS Shared Data Warehouse Monthly Eligibility Universe, accessed 12/15/15.
Notes: Includes all recipients who were in a waiver SPC (03, 05, 06, 17 or 32) on 6/30/14. Where they are now is based on capitation code or PSC. Those without a current capitation code or PSC are determined to be “No Longer Enrolled”.
MLTSS HCBS 8,303 69%
MLTSS NF 846 7%
Other (Non-MLTSS NJ FamilyCare)
433 4%
No Longer Enrolled
2,457 20%
All Waivers (6/30/14 = 12,039)
Source: DMAHS Shared Data Warehouse Monthly Eligibility Universe, accessed 12/8/15.
Notes: Includes all recipients in Capitation Codes 79399, 89399, 78199, 88199, 78399, 88399, 78499, 88499 at any point in the given month and categorizes them by age.
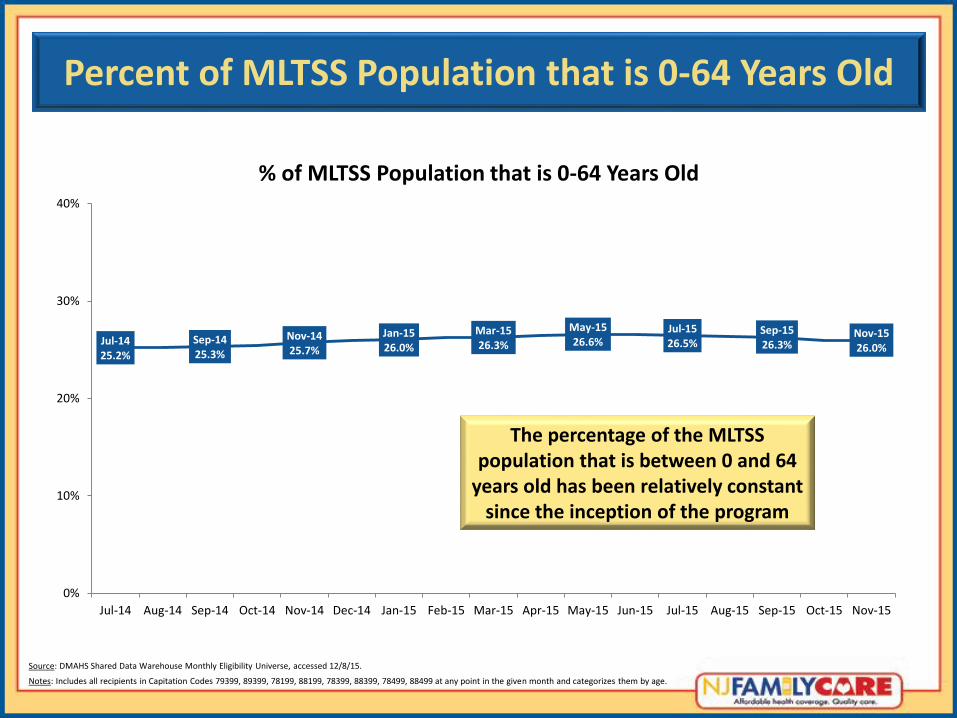
Percent of MLTSS Population that is 0-64 Years Old
Jul-14 25.2%
Sep-14 25.3%
Nov-14 25.7%
Jan-15 26.0%
Mar-15 26.3%
May-15 26.6%
Jul-15 26.5%
Sep-15 26.3%
Nov-15 26.0%
0%
10%
20%
30%
40%
Jul-14 Aug-14 Sep-14 Oct-14 Nov-14 Dec-14 Jan-15 Feb-15 Mar-15 Apr-15 May-15 Jun-15 Jul-15 Aug-15 Sep-15 Oct-15 Nov-15
% of MLTSS Population that is 0-64 Years Old
The percentage of the MLTSS population that is between 0 and 64
years old has been relatively constant since the inception of the program
Source: DMAHS Shared Data Warehouse Monthly Eligibility Universe, accessed 12/8/15.
Notes: Includes all recipients in Capitation Codes 79399, 89399, 78199, 88199, 78399, 88399, 78499, 88499 at any point in the given month and categorizes them by age.
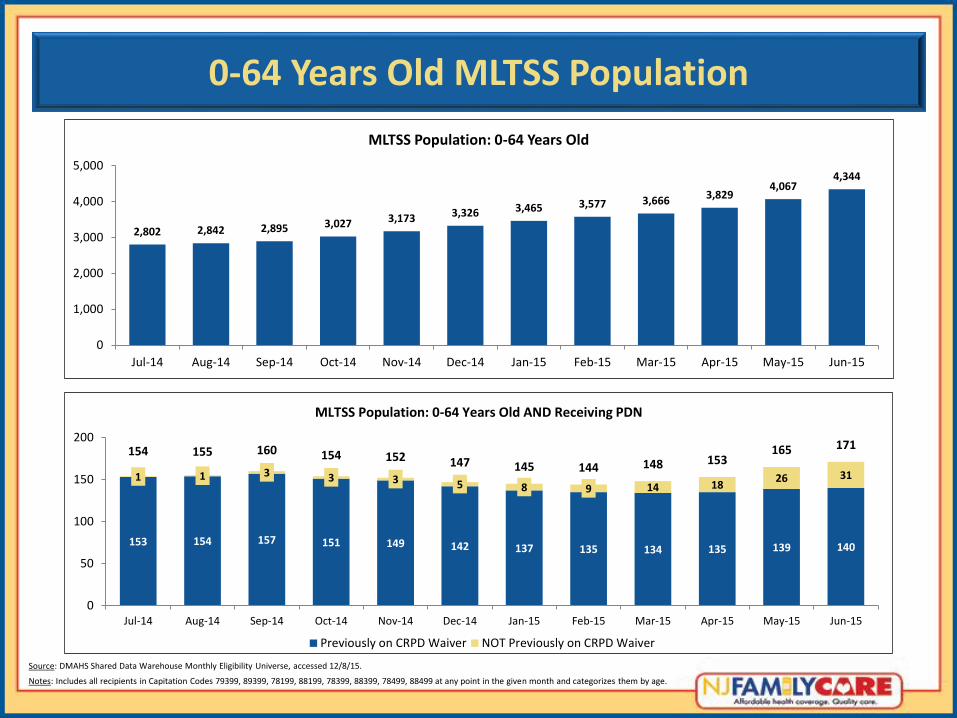
0-64 Years Old MLTSS Population
2,802 2,842 2,895 3,027 3,173 3,326 3,465 3,577 3,666 3,829 4,067
4,344
0
1,000
2,000
3,000
4,000
5,000
Jul-14 Aug-14 Sep-14 Oct-14 Nov-14 Dec-14 Jan-15 Feb-15 Mar-15 Apr-15 May-15 Jun-15
MLTSS Population: 0-64 Years Old
153 154 157 151 149 142 137 135 134 135 139 140
1 1 3 3 3 5 8 9 14 18 26 31
154 155 160 154 152 147 145 144 148 153 165 171
0
50
100
150
200
Jul-14 Aug-14 Sep-14 Oct-14 Nov-14 Dec-14 Jan-15 Feb-15 Mar-15 Apr-15 May-15 Jun-15
MLTSS Population: 0-64 Years Old AND Receiving PDN
Previously on CRPD Waiver NOT Previously on CRPD Waiver
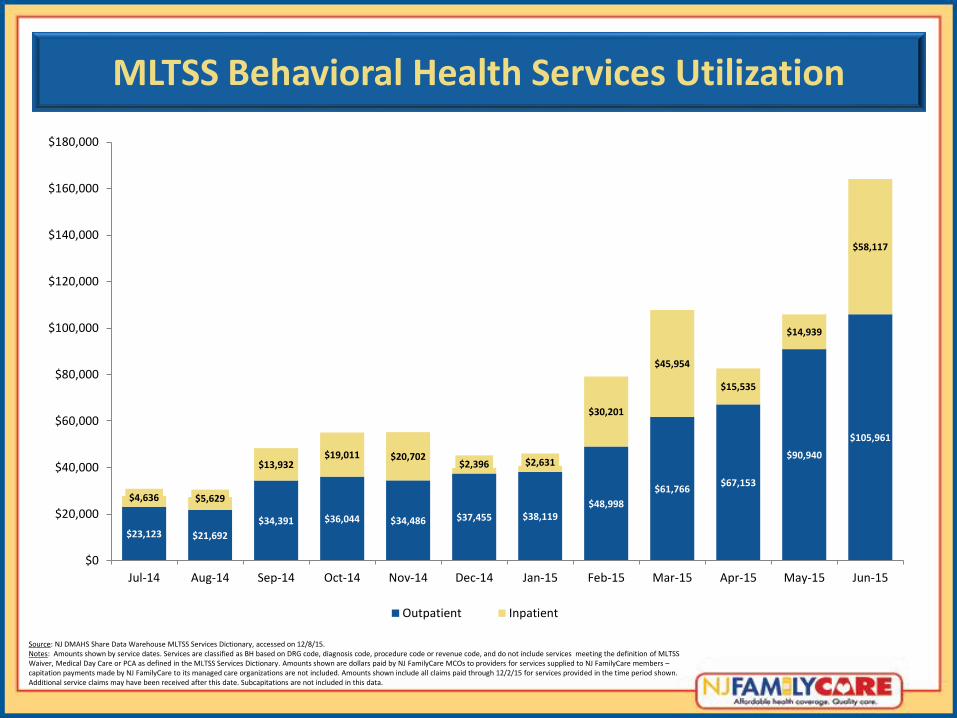
MLTSS Behavioral Health Services Utilization
Source: NJ DMAHS Share Data Warehouse MLTSS Services Dictionary, accessed on 12/8/15. Notes: Amounts shown by service dates. Services are classified as BH based on DRG code, diagnosis code, procedure code or revenue code, and do not include services meeting the definition of MLTSS Waiver, Medical Day Care or PCA as defined in the MLTSS Services Dictionary. Amounts shown are dollars paid by NJ FamilyCare MCOs to providers for services supplied to NJ FamilyCare members – capitation payments made by NJ FamilyCare to its managed care organizations are not included. Amounts shown include all claims paid through 12/2/15 for services provided in the time period shown. Additional service claims may have been received after this date. Subcapitations are not included in this data.
$23,123 $21,692
$34,391 $36,044 $34,486 $37,455 $38,119 $48,998
$61,766 $67,153
$90,940
$105,961
$4,636 $5,629
$13,932 $19,011 $20,702
$2,396 $2,631
$30,201
$45,954
$15,535
$14,939
$58,117
$0
$20,000
$40,000
$60,000
$80,000
$100,000
$120,000
$140,000
$160,000
$180,000
Jul-14 Aug-14 Sep-14 Oct-14 Nov-14 Dec-14 Jan-15 Feb-15 Mar-15 Apr-15 May-15 Jun-15
Outpatient Inpatient
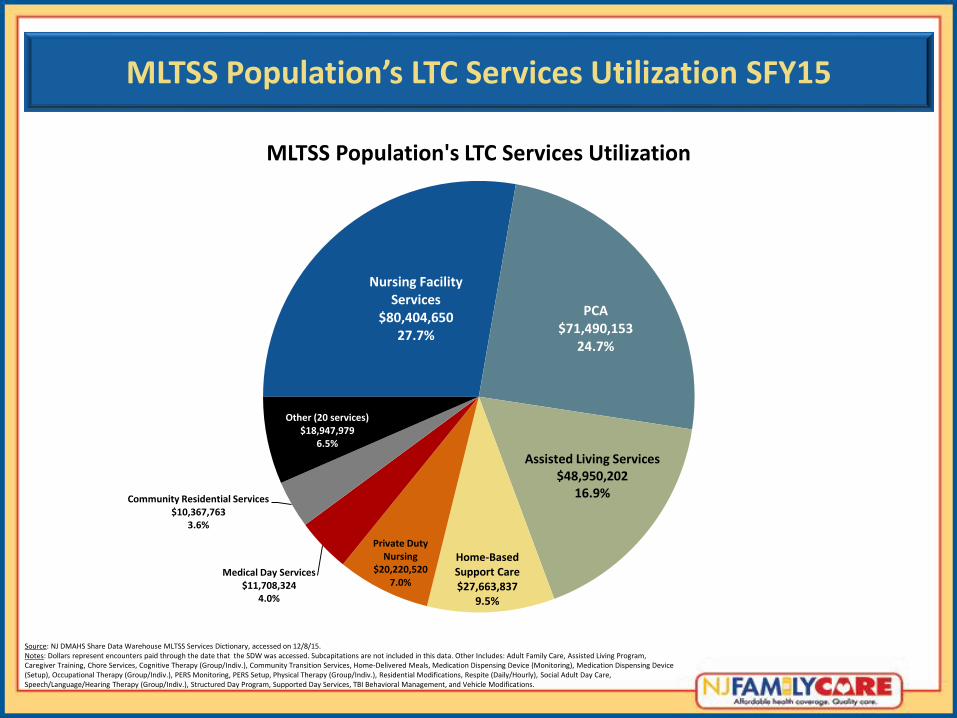
MLTSS Population’s LTC Services Utilization SFY15
Source: NJ DMAHS Share Data Warehouse MLTSS Services Dictionary, accessed on 12/8/15. Notes: Dollars represent encounters paid through the date that the SDW was accessed. Subcapitations are not included in this data. Other Includes: Adult Family Care, Assisted Living Program, Caregiver Training, Chore Services, Cognitive Therapy (Group/Indiv.), Community Transition Services, Home-Delivered Meals, Medication Dispensing Device (Monitoring), Medication Dispensing Device (Setup), Occupational Therapy (Group/Indiv.), PERS Monitoring, PERS Setup, Physical Therapy (Group/Indiv.), Residential Modifications, Respite (Daily/Hourly), Social Adult Day Care, Speech/Language/Hearing Therapy (Group/Indiv.), Structured Day Program, Supported Day Services, TBI Behavioral Management, and Vehicle Modifications.
Nursing Facility Services
$80,404,650 27.7%
PCA $71,490,153
24.7%
Assisted Living Services $48,950,202
16.9%
Home-Based Support Care $27,663,837
9.5%
Private Duty Nursing
$20,220,520 7.0%
Medical Day Services $11,708,324
4.0%
Community Residential Services $10,367,763
3.6%
Other (20 services) $18,947,979
6.5%
MLTSS Population's LTC Services Utilization
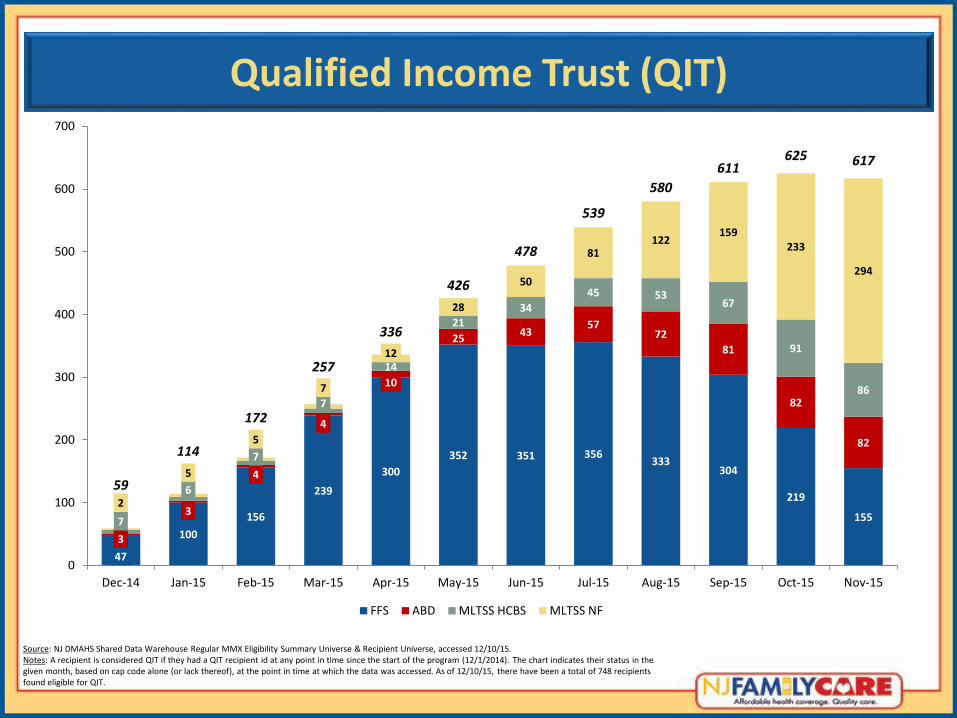
Qualified Income Trust (QIT)
Source: NJ DMAHS Shared Data Warehouse Regular MMX Eligibility Summary Universe & Recipient Universe, accessed 12/10/15. Notes: A recipient is considered QIT if they had a QIT recipient id at any point in time since the start of the program (12/1/2014). The chart indicates their status in the given month, based on cap code alone (or lack thereof), at the point in time at which the data was accessed. As of 12/10/15, there have been a total of 748 recipients found eligible for QIT.
47
100
156
239
300
352 351 356 333
304
219
155
3
3
4
4
10
25 43
57 72
81
82
82
7
6
7
7
14
21 34
45 53 67
91
86
2
5
5
7
12
28
50
81 122
159 233
294
59
114
172
257
336
426
478
539
580
611 625 617
0
100
200
300
400
500
600
700
Dec-14 Jan-15 Feb-15 Mar-15 Apr-15 May-15 Jun-15 Jul-15 Aug-15 Sep-15 Oct-15 Nov-15
FFS ABD MLTSS HCBS MLTSS NF
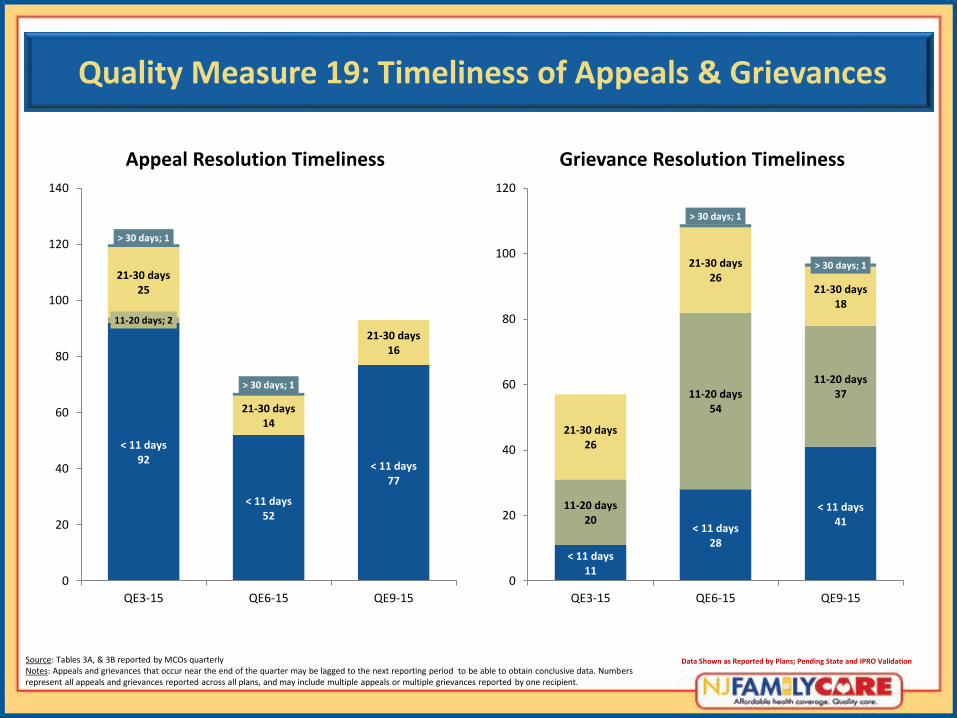
Quality Measure 19: Timeliness of Appeals & Grievances
Source: Tables 3A, & 3B reported by MCOs quarterly Notes: Appeals and grievances that occur near the end of the quarter may be lagged to the next reporting period to be able to obtain conclusive data. Numbers represent all appeals and grievances reported across all plans, and may include multiple appeals or multiple grievances reported by one recipient.
< 11 days 92
< 11 days 52
< 11 days 77
11-20 days; 2
21-30 days 25
21-30 days 14
21-30 days 16
> 30 days; 1
> 30 days; 1
0
20
40
60
80
100
120
140
QE3-15 QE6-15 QE9-15
Appeal Resolution Timeliness
< 11 days 11
< 11 days 28
< 11 days 41
11-20 days 20
11-20 days 54
11-20 days 37
21-30 days 26
21-30 days 26
21-30 days 18
> 30 days; 1
> 30 days; 1
0
20
40
60
80
100
120
QE3-15 QE6-15 QE9-15
Grievance Resolution Timeliness
Data Shown as Reported by Plans; Pending State and IPRO Validation
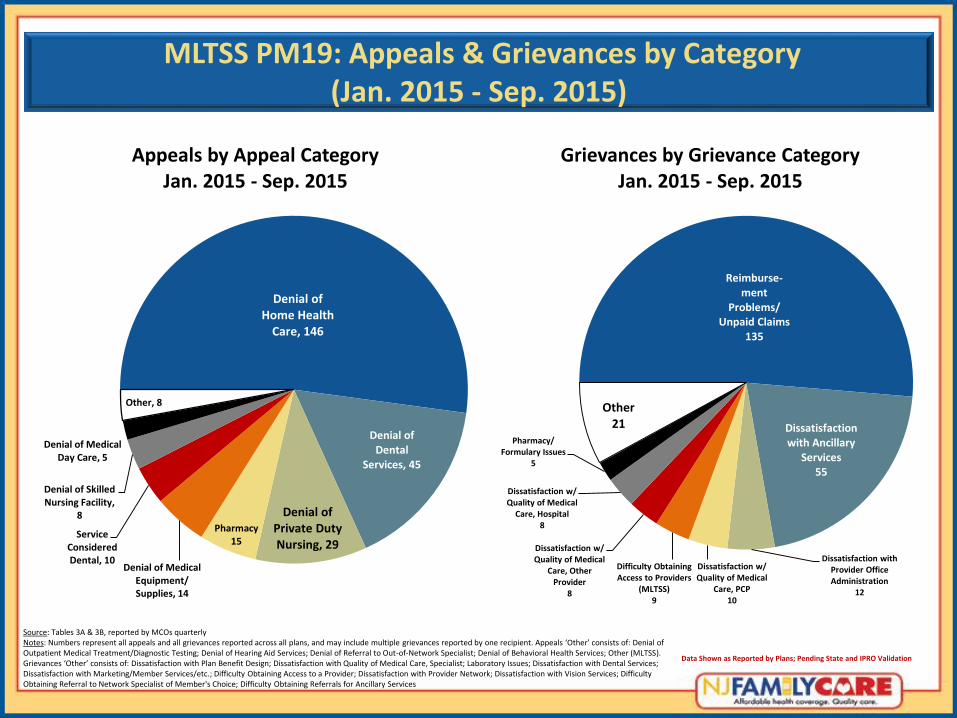
MLTSS PM19: Appeals & Grievances by Category (Jan. 2015 - Sep. 2015)
Source: Tables 3A & 3B, reported by MCOs quarterly Notes: Numbers represent all appeals and all grievances reported across all plans, and may include multiple grievances reported by one recipient. Appeals ‘Other’ consists of: Denial of Outpatient Medical Treatment/Diagnostic Testing; Denial of Hearing Aid Services; Denial of Referral to Out-of-Network Specialist; Denial of Behavioral Health Services; Other (MLTSS). Grievances ‘Other’ consists of: Dissatisfaction with Plan Benefit Design; Dissatisfaction with Quality of Medical Care, Specialist; Laboratory Issues; Dissatisfaction with Dental Services; Dissatisfaction with Marketing/Member Services/etc.; Difficulty Obtaining Access to a Provider; Dissatisfaction with Provider Network; Dissatisfaction with Vision Services; Difficulty Obtaining Referral to Network Specialist of Member's Choice; Difficulty Obtaining Referrals for Ancillary Services
Denial of Home Health
Care, 146
Denial of Dental
Services, 45
Denial of Private Duty Nursing, 29
Pharmacy 15
Denial of Medical Equipment/ Supplies, 14
Service Considered Dental, 10
Denial of Skilled Nursing Facility,
8
Denial of Medical Day Care, 5
Other, 8
Appeals by Appeal Category Jan. 2015 - Sep. 2015
Reimburse-ment
Problems/ Unpaid Claims
135
Dissatisfaction with Ancillary
Services 55
Dissatisfaction with Provider Office Administration
12
Dissatisfaction w/ Quality of Medical
Care, PCP 10
Difficulty Obtaining Access to Providers
(MLTSS) 9
Dissatisfaction w/ Quality of Medical
Care, Other Provider
8
Dissatisfaction w/ Quality of Medical
Care, Hospital 8
Pharmacy/ Formulary Issues
5
Other 21
Grievances by Grievance Category Jan. 2015 - Sep. 2015
Data Shown as Reported by Plans; Pending State and IPRO Validation
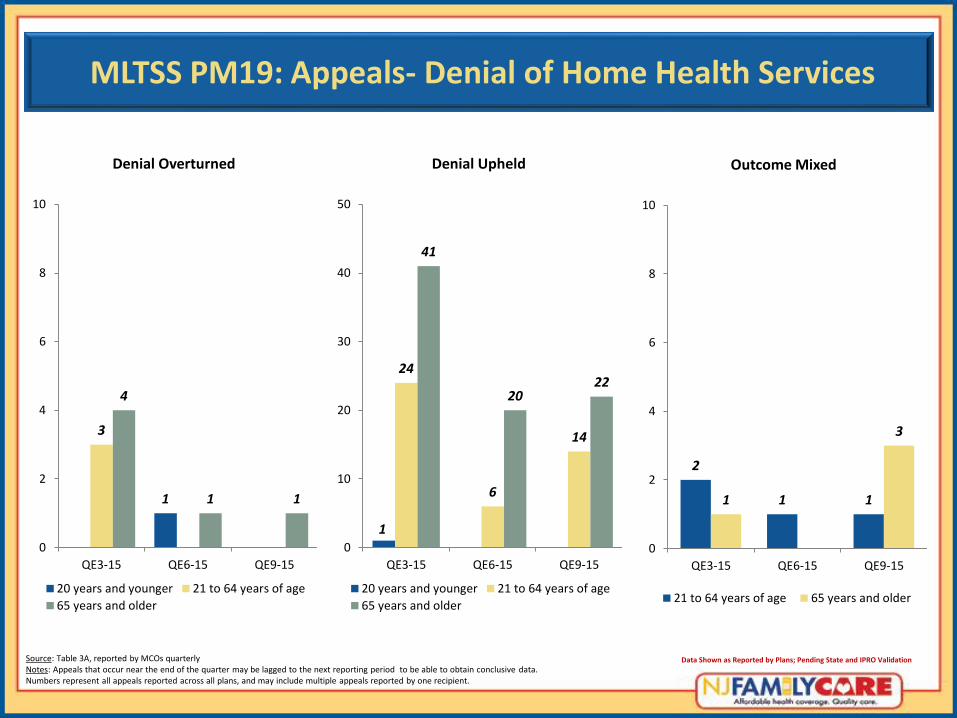
MLTSS PM19: Appeals- Denial of Home Health Services
Source: Table 3A, reported by MCOs quarterly Notes: Appeals that occur near the end of the quarter may be lagged to the next reporting period to be able to obtain conclusive data. Numbers represent all appeals reported across all plans, and may include multiple appeals reported by one recipient.
1
3
4
1 1
0
2
4
6
8
10
QE3-15 QE6-15 QE9-15
Denial Overturned
20 years and younger 21 to 64 years of age
65 years and older
1
24
6
14
41
20 22
0
10
20
30
40
50
QE3-15 QE6-15 QE9-15
Denial Upheld
20 years and younger 21 to 64 years of age
65 years and older
2
1 1 1
3
0
2
4
6
8
10
QE3-15 QE6-15 QE9-15
Outcome Mixed
21 to 64 years of age 65 years and older
Data Shown as Reported by Plans; Pending State and IPRO Validation
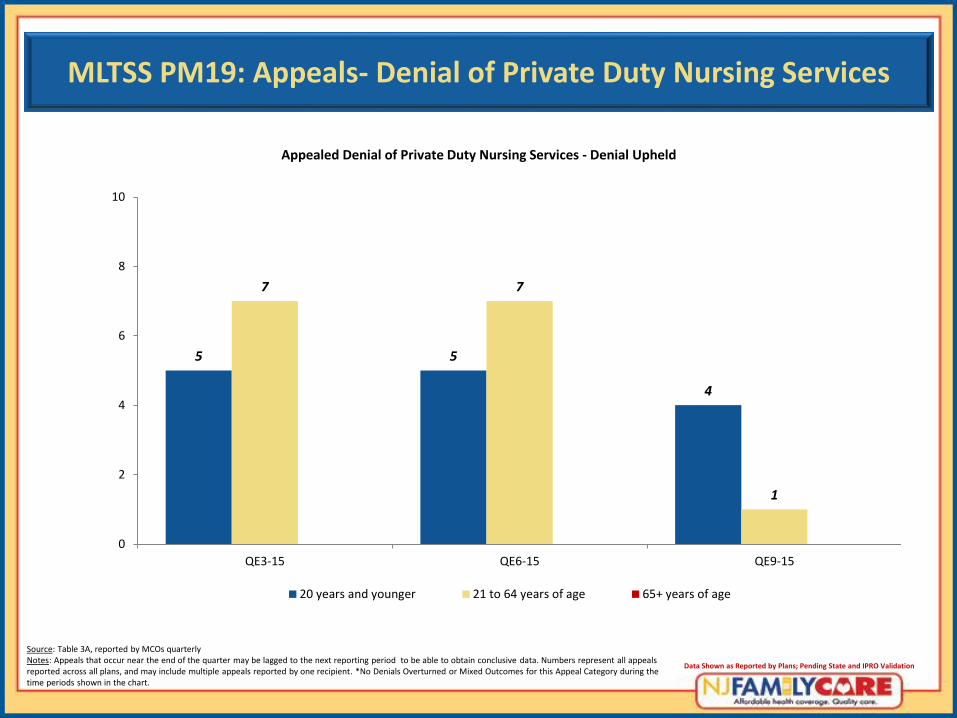
MLTSS PM19: Appeals- Denial of Private Duty Nursing Services
Source: Table 3A, reported by MCOs quarterly Notes: Appeals that occur near the end of the quarter may be lagged to the next reporting period to be able to obtain conclusive data. Numbers represent all appeals reported across all plans, and may include multiple appeals reported by one recipient. *No Denials Overturned or Mixed Outcomes for this Appeal Category during the time periods shown in the chart.
Data Shown as Reported by Plans; Pending State and IPRO Validation
5 5
4
7 7
1
0
2
4
6
8
10
QE3-15 QE6-15 QE9-15
Appealed Denial of Private Duty Nursing Services - Denial Upheld
20 years and younger 21 to 64 years of age 65+ years of age
Informational Update:
DMAHS Appeals and Grievances First Quarter 2015 Data
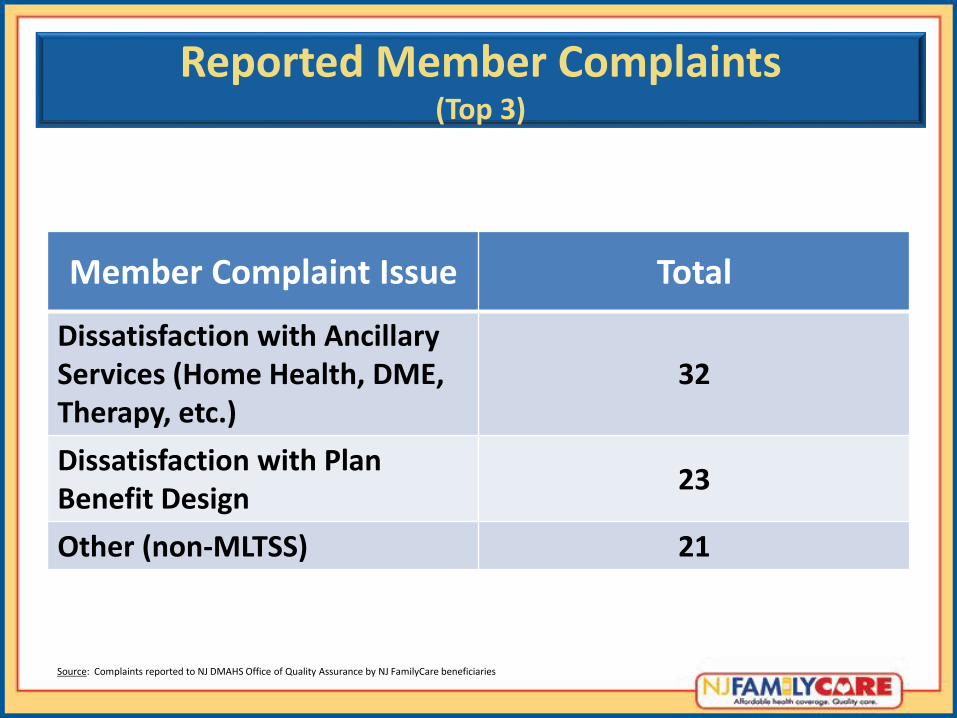
Member Complaint Issue Total
Dissatisfaction with Ancillary Services (Home Health, DME, Therapy, etc.)
32
Dissatisfaction with Plan Benefit Design
23
Other (non-MLTSS) 21
Reported Member Complaints (Top 3)
Source: Complaints reported to NJ DMAHS Office of Quality Assurance by NJ FamilyCare beneficiaries
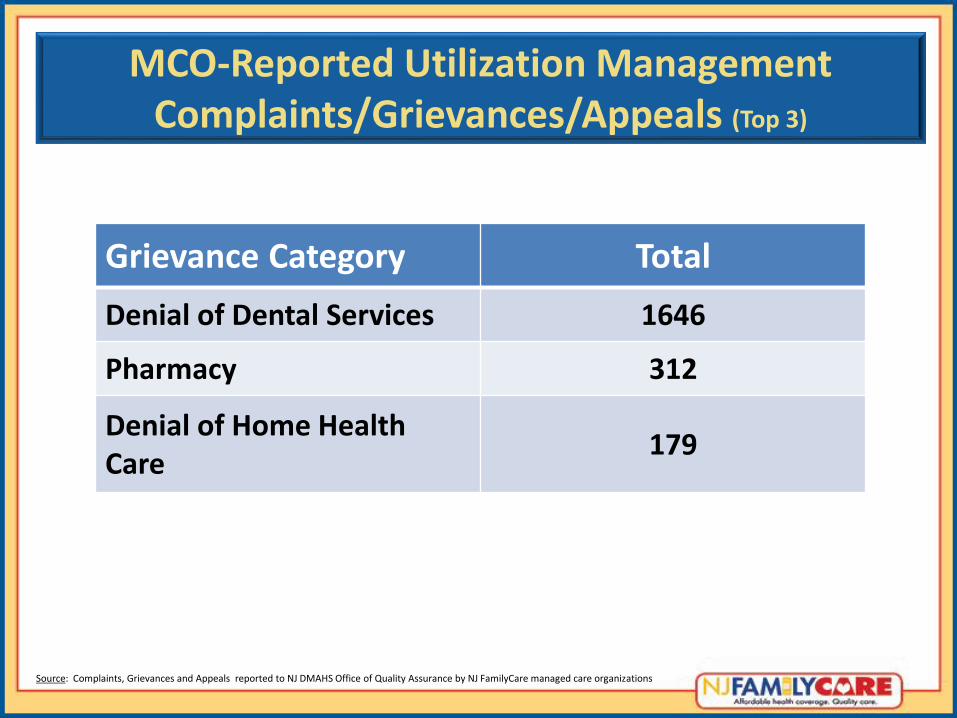
MCO-Reported Utilization Management Complaints/Grievances/Appeals (Top 3)
Grievance Category Total
Denial of Dental Services 1646
Pharmacy 312
Denial of Home Health Care
179
Source: Complaints, Grievances and Appeals reported to NJ DMAHS Office of Quality Assurance by NJ FamilyCare managed care organizations
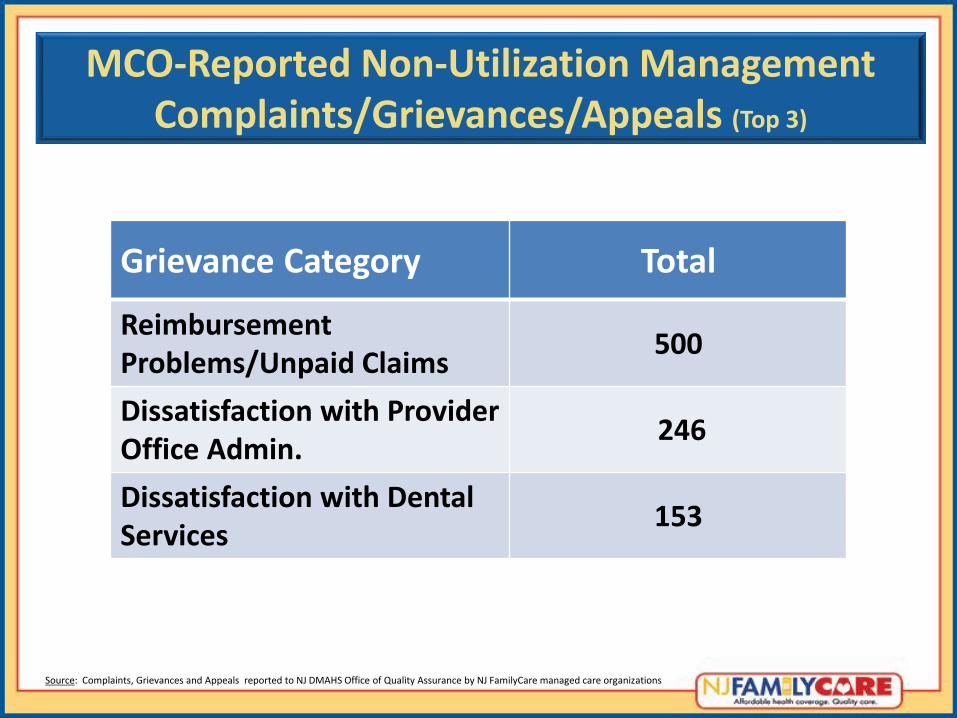
Grievance Category Total
Reimbursement Problems/Unpaid Claims
500
Dissatisfaction with Provider Office Admin.
246
Dissatisfaction with Dental Services
153
MCO-Reported Non-Utilization Management Complaints/Grievances/Appeals (Top 3)
Source: Complaints, Grievances and Appeals reported to NJ DMAHS Office of Quality Assurance by NJ FamilyCare managed care organizations
Informational Update:
Dual Integration
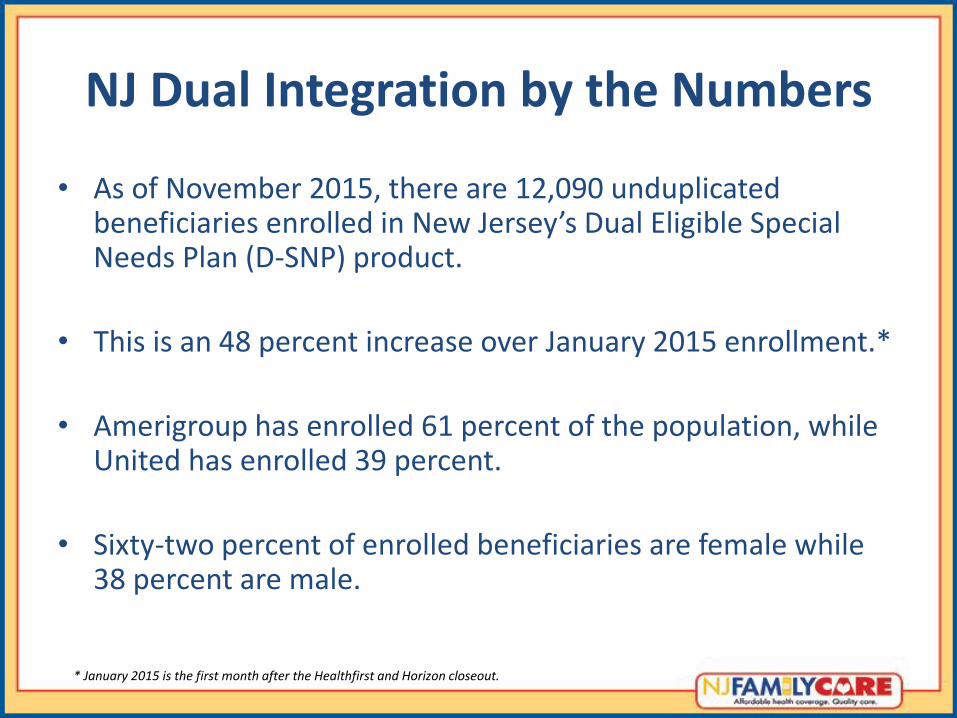
NJ Dual Integration by the Numbers
• As of November 2015, there are 12,090 unduplicated beneficiaries enrolled in New Jersey’s Dual Eligible Special Needs Plan (D-SNP) product.
• This is an 48 percent increase over January 2015 enrollment.*
• Amerigroup has enrolled 61 percent of the population, while United has enrolled 39 percent.
• Sixty-two percent of enrolled beneficiaries are female while 38 percent are male.
* January 2015 is the first month after the Healthfirst and Horizon closeout.
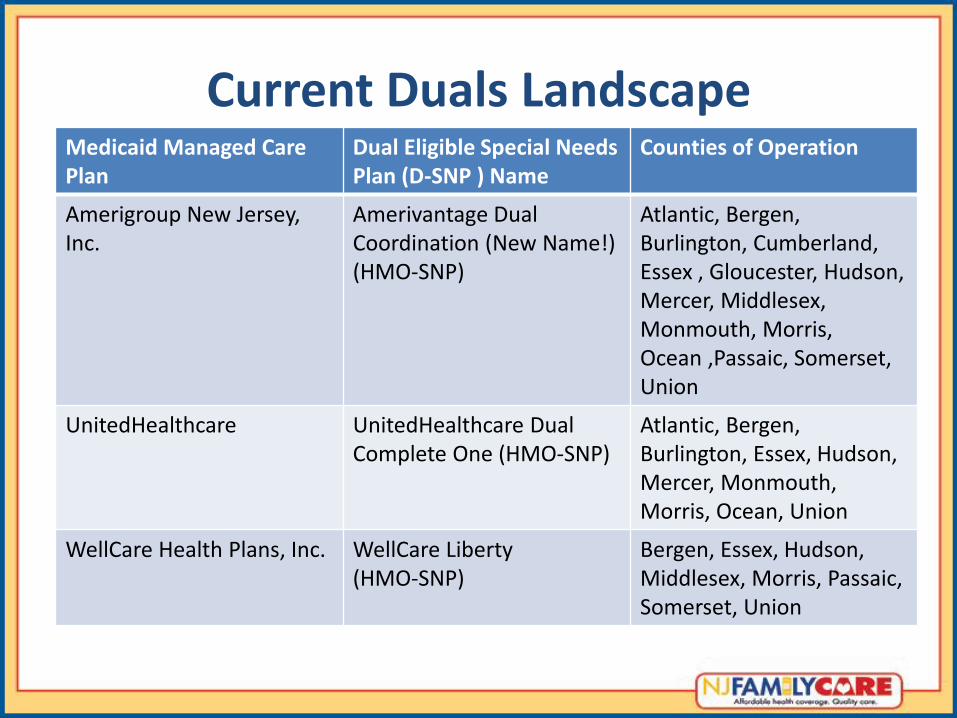
Current Duals Landscape Medicaid Managed Care Plan
Dual Eligible Special Needs Plan (D-SNP ) Name
Counties of Operation
Amerigroup New Jersey, Inc.
Amerivantage Dual Coordination (New Name!) (HMO-SNP)
Atlantic, Bergen, Burlington, Cumberland, Essex , Gloucester, Hudson, Mercer, Middlesex, Monmouth, Morris, Ocean ,Passaic, Somerset, Union
UnitedHealthcare UnitedHealthcare Dual Complete One (HMO-SNP)
Atlantic, Bergen, Burlington, Essex, Hudson, Mercer, Monmouth, Morris, Ocean, Union
WellCare Health Plans, Inc. WellCare Liberty (HMO-SNP)
Bergen, Essex, Hudson, Middlesex, Morris, Passaic, Somerset, Union
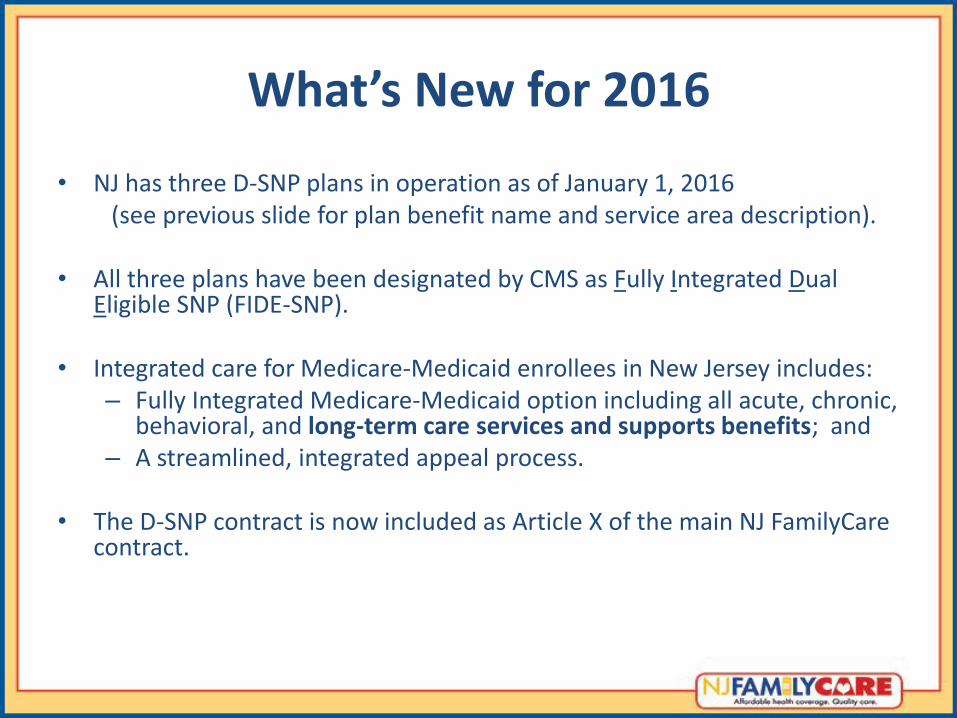
What’s New for 2016
• NJ has three D-SNP plans in operation as of January 1, 2016 (see previous slide for plan benefit name and service area description). • All three plans have been designated by CMS as Fully Integrated Dual
Eligible SNP (FIDE-SNP). • Integrated care for Medicare-Medicaid enrollees in New Jersey includes:
– Fully Integrated Medicare-Medicaid option including all acute, chronic, behavioral, and long-term care services and supports benefits; and
– A streamlined, integrated appeal process.
• The D-SNP contract is now included as Article X of the main NJ FamilyCare contract.
Looking Forward to 2017
• Deep dive discussions are occurring with all of the D-SNP MCO’s to gain input into the draft 2017 contract.
• NJ anticipates beginning drafting the 2017 contract toward the end of February or beginning of March.
• Both internal and external stakeholders will have an opportunity to review any changes prior to submitting to CMS By July 1, 2016.
Looking Forward to 2017 Continued: Data Analytics in Dual Integration
• New Jersey applied and was selected to receive targeted technical assistance (TA) to improve care coordination for the dually eligible population.
• This TA opportunity is being offered through the Medicaid Innovation Accelerator Program (IAP) and is available to assist states build or enhance their data analytic capabilities to support delivery system reforms efforts.
• New Jersey has submitted a Information Exchange Agreement (IEA) to CMS and is starting the process of writing Data Use Agreements.(DUAs)
Informational Update:
NJ 1115 Comprehensive Medicaid Waiver
Renewal Timeline and Evaluation
Renewal Timeline
• August 2015 to December 2015
– Held listening sessions with various internal stakeholders (sister departments, divisions and agencies) regarding what they would like to see continued or amended in the waiver. This included any new initiatives to be considered.
Renewal Timeline
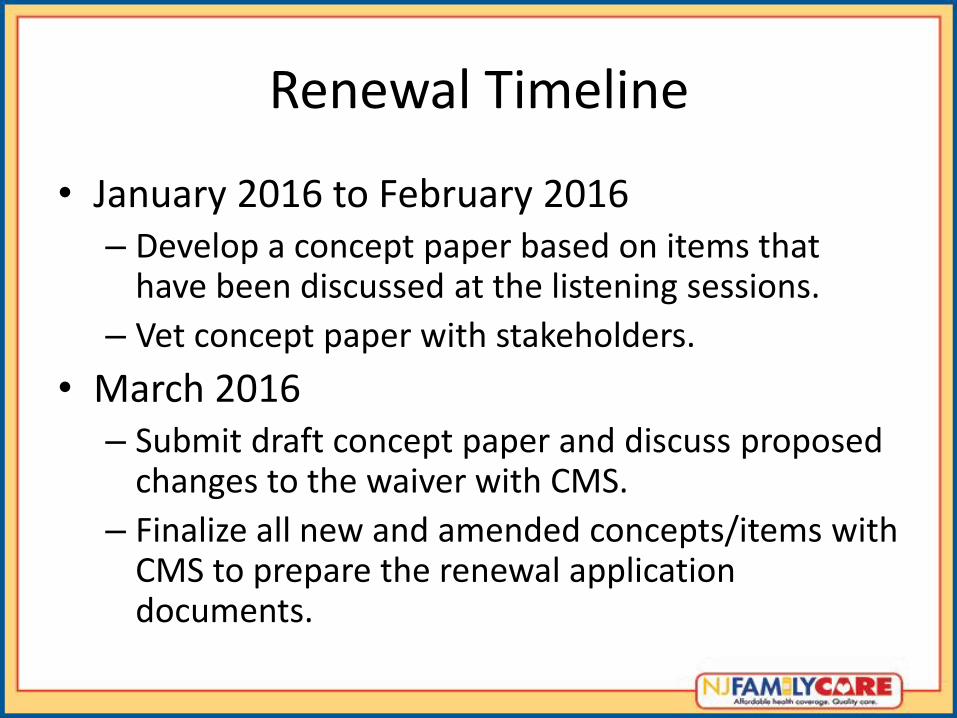
• January 2016 to February 2016 – Develop a concept paper based on items that
have been discussed at the listening sessions.
– Vet concept paper with stakeholders.
• March 2016 – Submit draft concept paper and discuss proposed
changes to the waiver with CMS.
– Finalize all new and amended concepts/items with CMS to prepare the renewal application documents.
Renewal Timeline
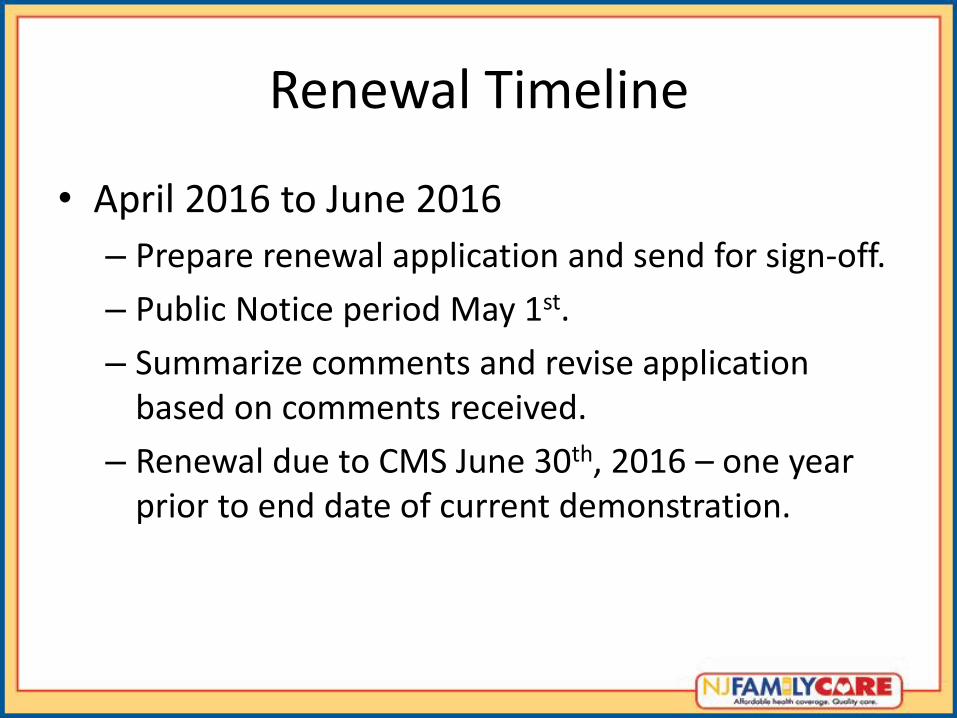
• April 2016 to June 2016
– Prepare renewal application and send for sign-off.
– Public Notice period May 1st.
– Summarize comments and revise application based on comments received.
– Renewal due to CMS June 30th, 2016 – one year prior to end date of current demonstration.
Renewal Timeline
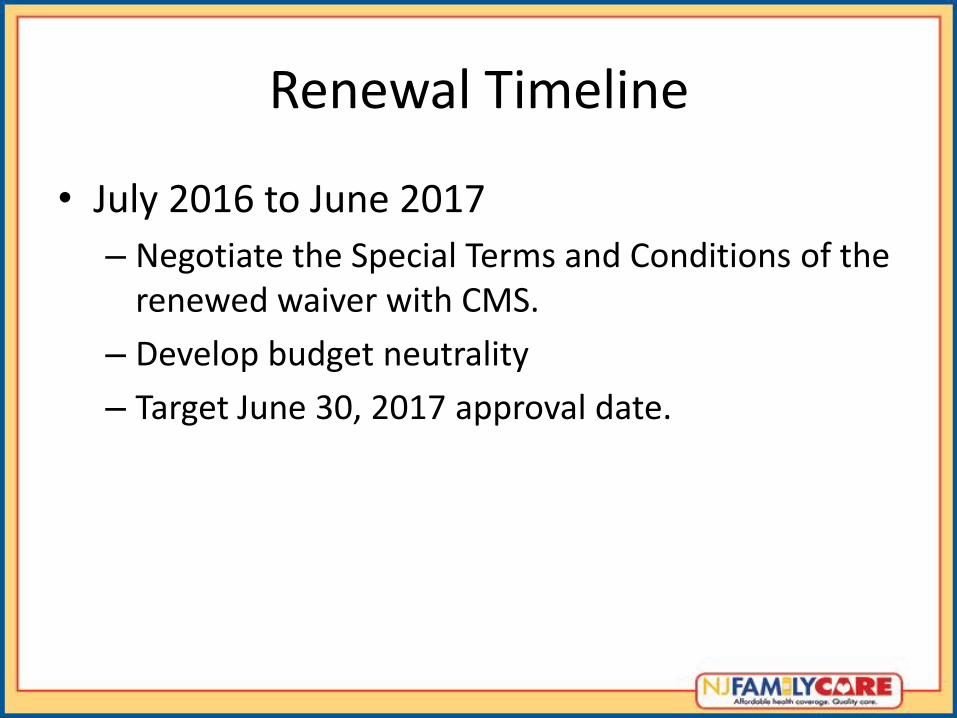
• July 2016 to June 2017
– Negotiate the Special Terms and Conditions of the renewed waiver with CMS.
– Develop budget neutrality
– Target June 30, 2017 approval date.
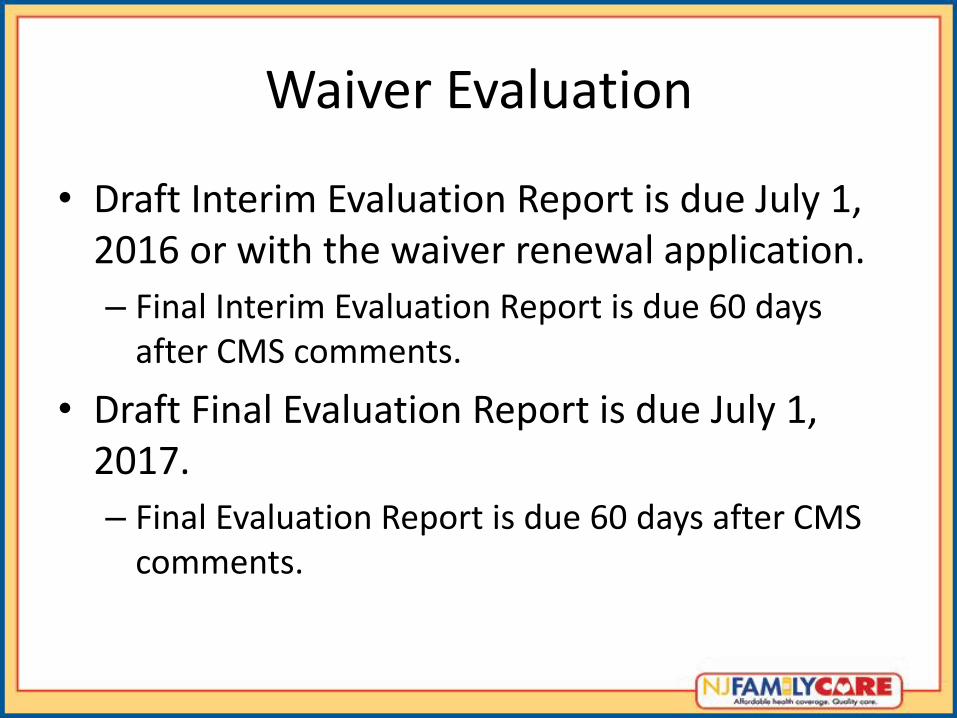
Waiver Evaluation
• Draft Interim Evaluation Report is due July 1, 2016 or with the waiver renewal application.
– Final Interim Evaluation Report is due 60 days after CMS comments.
• Draft Final Evaluation Report is due July 1, 2017.
– Final Evaluation Report is due 60 days after CMS comments.
Informational Update:
NJ FamilyCare Update
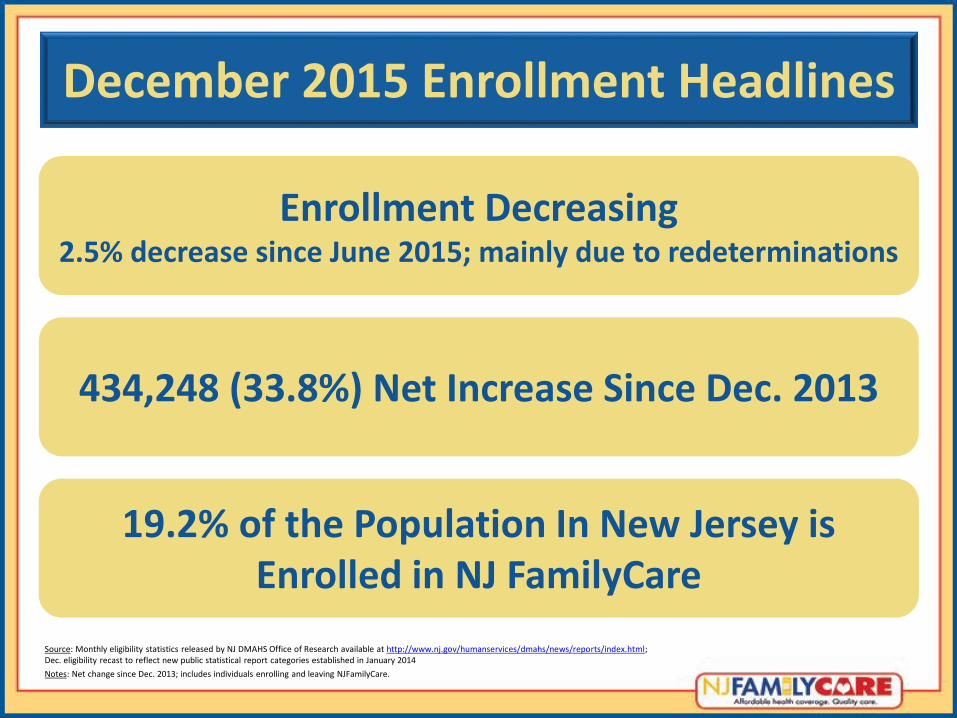
December 2015 Enrollment Headlines
Enrollment Decreasing 2.5% decrease since June 2015; mainly due to redeterminations
Source: Monthly eligibility statistics released by NJ DMAHS Office of Research available at http://www.nj.gov/humanservices/dmahs/news/reports/index.html; Dec. eligibility recast to reflect new public statistical report categories established in January 2014
Notes: Net change since Dec. 2013; includes individuals enrolling and leaving NJFamilyCare.
434,248 (33.8%) Net Increase Since Dec. 2013
19.2% of the Population In New Jersey is Enrolled in NJ FamilyCare
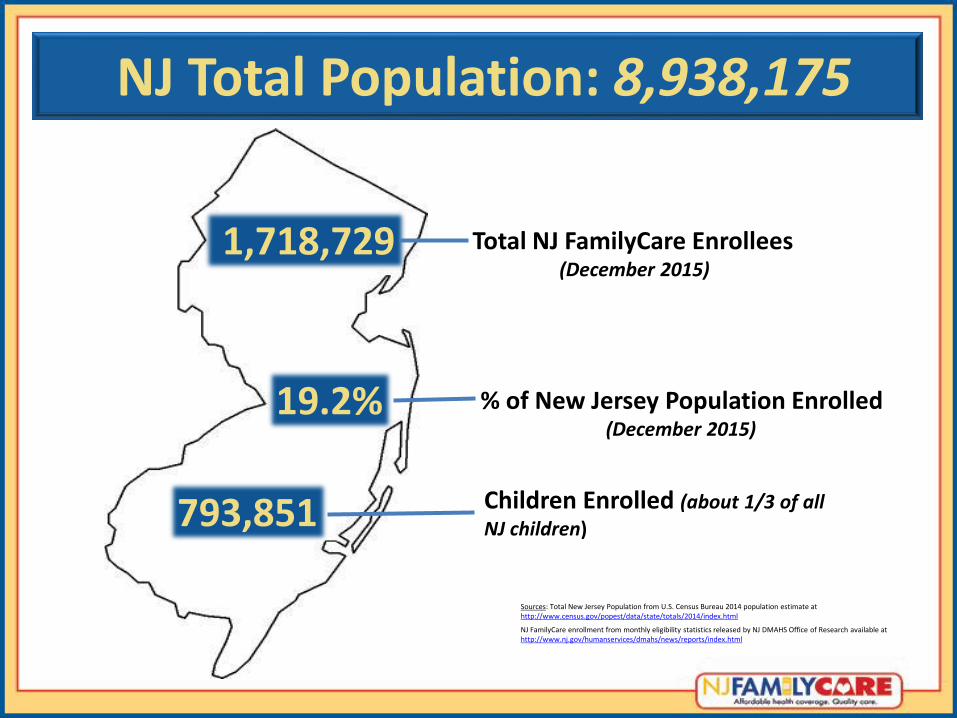
1,718,729 Total NJ FamilyCare Enrollees (December 2015)
19.2% % of New Jersey Population Enrolled (December 2015)
793,851 Children Enrolled (about 1/3 of all
NJ children)
NJ Total Population: 8,938,175
Sources: Total New Jersey Population from U.S. Census Bureau 2014 population estimate at http://www.census.gov/popest/data/state/totals/2014/index.html
NJ FamilyCare enrollment from monthly eligibility statistics released by NJ DMAHS Office of Research available at http://www.nj.gov/humanservices/dmahs/news/reports/index.html
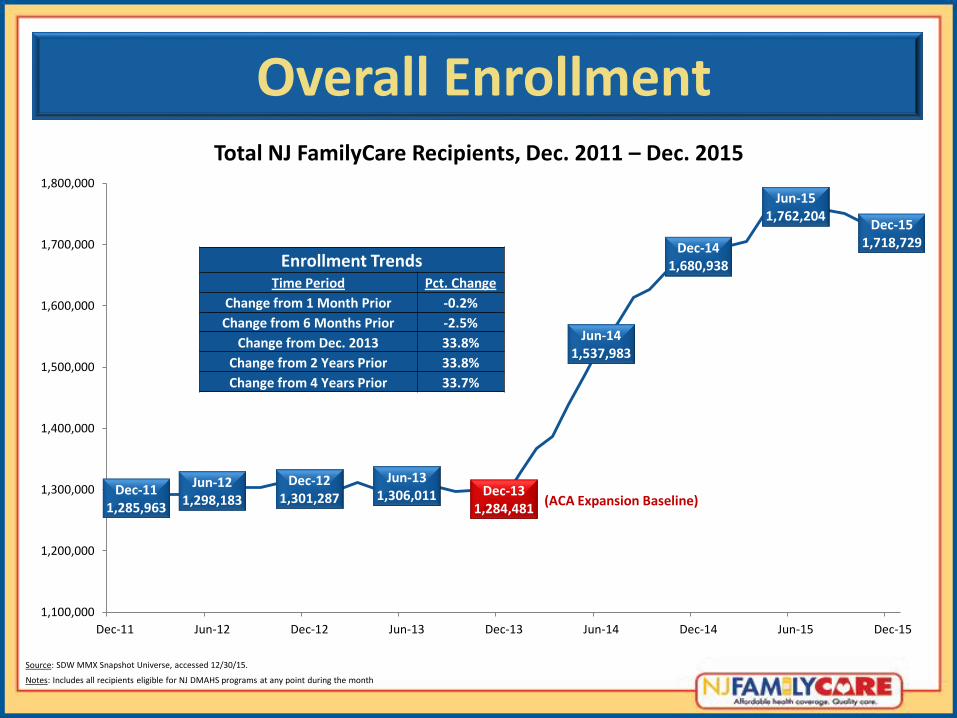
Overall Enrollment
Source: SDW MMX Snapshot Universe, accessed 12/30/15.
Notes: Includes all recipients eligible for NJ DMAHS programs at any point during the month
Dec-11 1,285,963
Jun-12 1,298,183
Dec-12 1,301,287
Jun-13 1,306,011 Dec-13
1,284,481
Jun-14 1,537,983
Dec-14 1,680,938
Jun-15 1,762,204
Dec-15 1,718,729
1,100,000
1,200,000
1,300,000
1,400,000
1,500,000
1,600,000
1,700,000
1,800,000
Dec-11 Jun-12 Dec-12 Jun-13 Dec-13 Jun-14 Dec-14 Jun-15 Dec-15
Total NJ FamilyCare Recipients, Dec. 2011 – Dec. 2015
(ACA Expansion Baseline)
Enrollment Trends Time Period Pct. Change
Change from 1 Month Prior -0.2%
Change from 6 Months Prior -2.5%
Change from Dec. 2013 33.8%
Change from 2 Years Prior 33.8%
Change from 4 Years Prior 33.7%
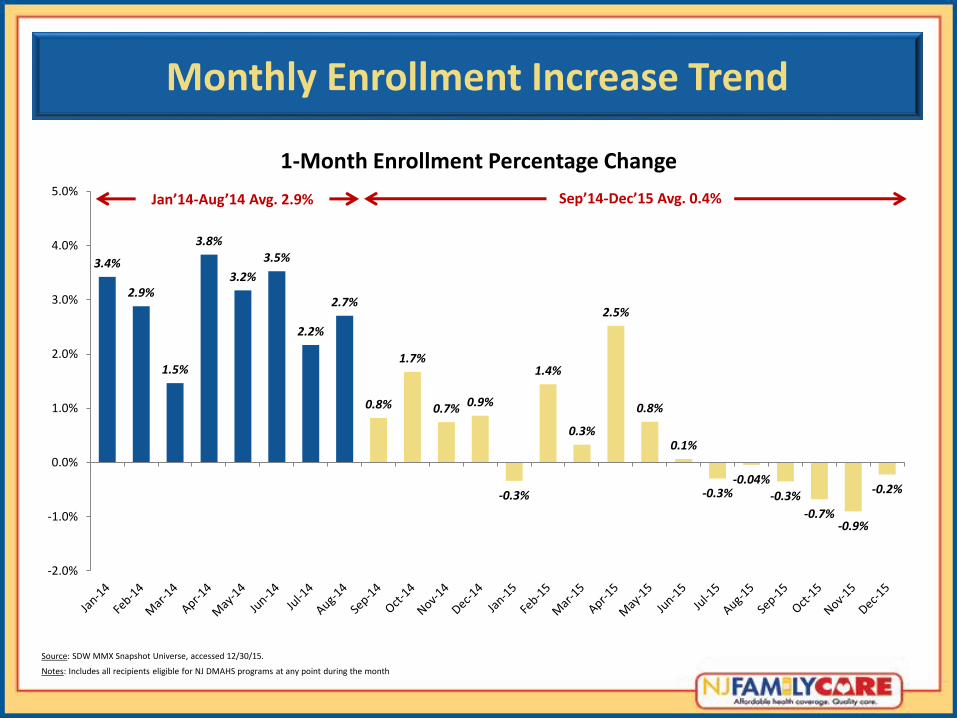
Monthly Enrollment Increase Trend
Source: SDW MMX Snapshot Universe, accessed 12/30/15.
Notes: Includes all recipients eligible for NJ DMAHS programs at any point during the month
3.4%
2.9%
1.5%
3.8%
3.2%
3.5%
2.2%
2.7%
0.8%
1.7%
0.7% 0.9%
-0.3%
1.4%
0.3%
2.5%
0.8%
0.1%
-0.3% -0.04%
-0.3%
-0.7% -0.9%
-0.2%
-2.0%
-1.0%
0.0%
1.0%
2.0%
3.0%
4.0%
5.0%
1-Month Enrollment Percentage Change
Jan’14-Aug’14 Avg. 2.9% Sep’14-Dec’15 Avg. 0.4%
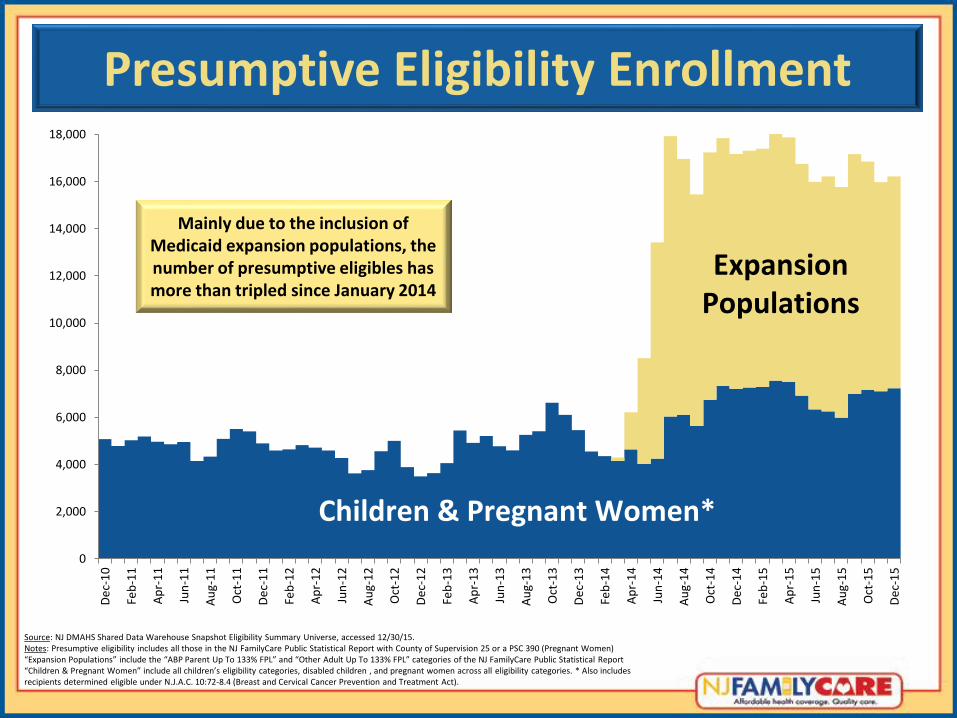
Presumptive Eligibility Enrollment
Source: NJ DMAHS Shared Data Warehouse Snapshot Eligibility Summary Universe, accessed 12/30/15. Notes: Presumptive eligibility includes all those in the NJ FamilyCare Public Statistical Report with County of Supervision 25 or a PSC 390 (Pregnant Women) “Expansion Populations” include the “ABP Parent Up To 133% FPL” and “Other Adult Up To 133% FPL” categories of the NJ FamilyCare Public Statistical Report “Children & Pregnant Women” include all children’s eligibility categories, disabled children , and pregnant women across all eligibility categories. * Also includes recipients determined eligible under N.J.A.C. 10:72-8.4 (Breast and Cervical Cancer Prevention and Treatment Act).
0
2,000
4,000
6,000
8,000
10,000
12,000
14,000
16,000
18,000
De
c-1
0
Feb
-11
Ap
r-1
1
Jun
-11
Au
g-1
1
Oct
-11
De
c-1
1
Feb
-12
Ap
r-1
2
Jun
-12
Au
g-1
2
Oct
-12
De
c-1
2
Feb
-13
Ap
r-1
3
Jun
-13
Au
g-1
3
Oct
-13
De
c-1
3
Feb
-14
Ap
r-1
4
Jun
-14
Au
g-1
4
Oct
-14
De
c-1
4
Feb
-15
Ap
r-1
5
Jun
-15
Au
g-1
5
Oct
-15
De
c-1
5
Children & Pregnant Women*
Expansion Populations
Mainly due to the inclusion of Medicaid expansion populations, the number of presumptive eligibles has more than tripled since January 2014
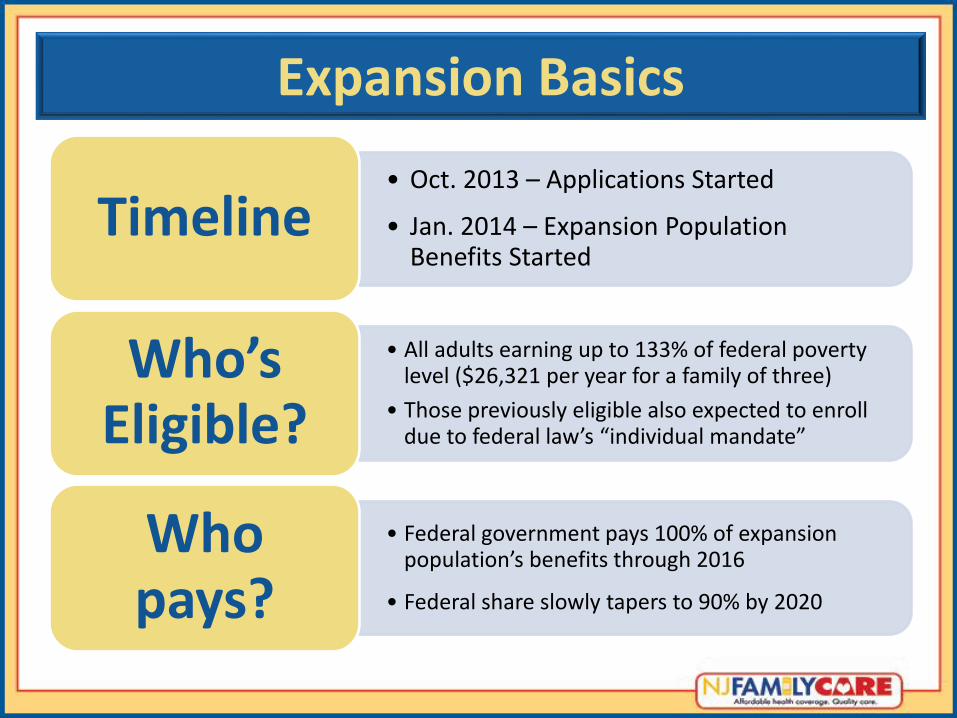
Expansion Basics
• Oct. 2013 – Applications Started
• Jan. 2014 – Expansion Population Benefits Started
Timeline
• All adults earning up to 133% of federal poverty level ($26,321 per year for a family of three)
• Those previously eligible also expected to enroll due to federal law’s “individual mandate”
Who’s Eligible?
• Federal government pays 100% of expansion population’s benefits through 2016
• Federal share slowly tapers to 90% by 2020
Who pays?
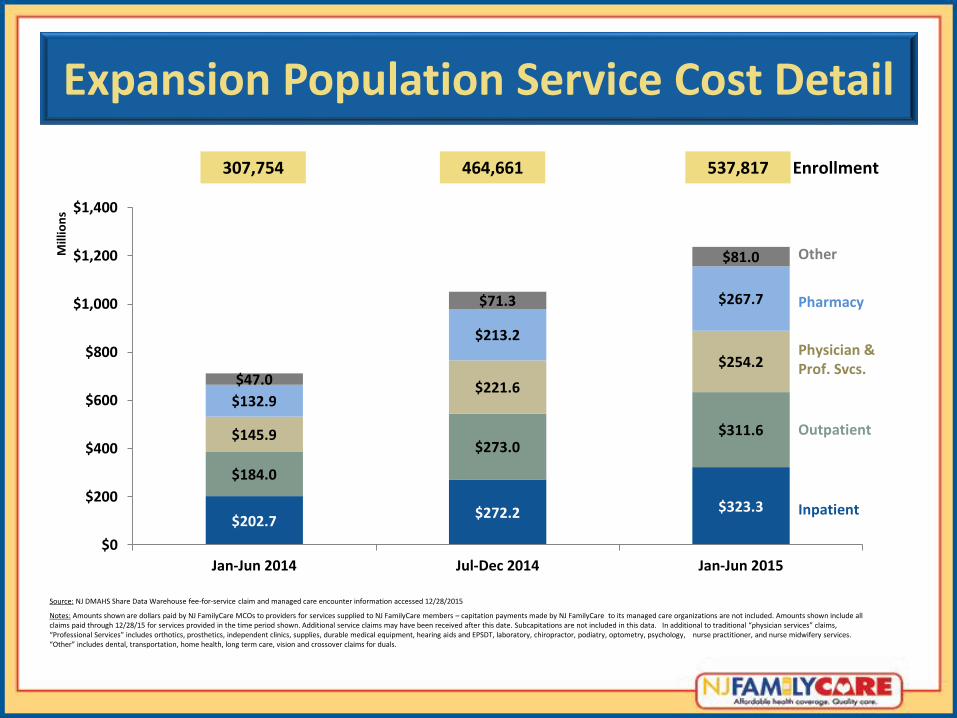
Expansion Population Service Cost Detail
Source: NJ DMAHS Share Data Warehouse fee-for-service claim and managed care encounter information accessed 12/28/2015
Notes: Amounts shown are dollars paid by NJ FamilyCare MCOs to providers for services supplied to NJ FamilyCare members – capitation payments made by NJ FamilyCare to its managed care organizations are not included. Amounts shown include all claims paid through 12/28/15 for services provided in the time period shown. Additional service claims may have been received after this date. Subcapitations are not included in this data. In additional to traditional “physician services” claims, “Professional Services” includes orthotics, prosthetics, independent clinics, supplies, durable medical equipment, hearing aids and EPSDT, laboratory, chiropractor, podiatry, optometry, psychology, nurse practitioner, and nurse midwifery services. “Other” includes dental, transportation, home health, long term care, vision and crossover claims for duals.
$202.7 $272.2 $323.3
$184.0
$273.0 $311.6 $145.9
$221.6
$254.2
$132.9
$213.2
$267.7
$47.0
$71.3
$81.0
$0
$200
$400
$600
$800
$1,000
$1,200
$1,400
Jan-Jun 2014 Jul-Dec 2014 Jan-Jun 2015
Mill
ion
s
Inpatient
Outpatient
Physician & Prof. Svcs.
Pharmacy
Other
Enrollment 307,754 464,661 537,817
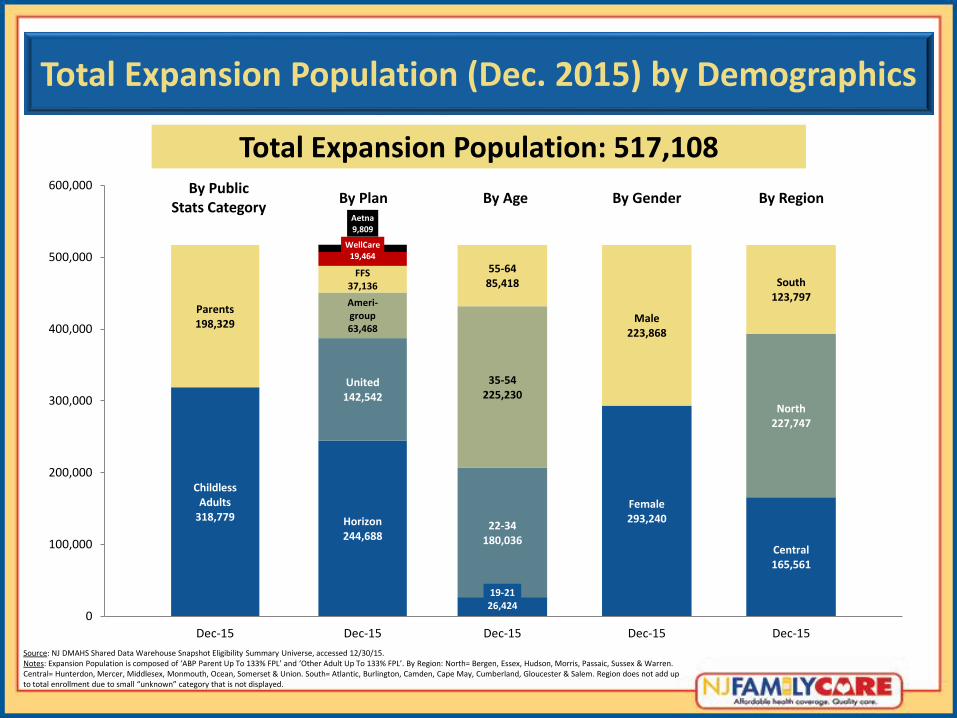
Total Expansion Population (Dec. 2015) by Demographics
Source: NJ DMAHS Shared Data Warehouse Snapshot Eligibility Summary Universe, accessed 12/30/15. Notes: Expansion Population is composed of ‘ABP Parent Up To 133% FPL’ and ‘Other Adult Up To 133% FPL’. By Region: North= Bergen, Essex, Hudson, Morris, Passaic, Sussex & Warren. Central= Hunterdon, Mercer, Middlesex, Monmouth, Ocean, Somerset & Union. South= Atlantic, Burlington, Camden, Cape May, Cumberland, Gloucester & Salem. Region does not add up to total enrollment due to small “unknown” category that is not displayed.
Total Expansion Population: 517,108 By Public
Stats Category
Horizon 244,688
United 142,542
Ameri-group 63,468
FFS 37,136
WellCare 19,464
Aetna 9,809
Dec-15
19-21 26,424
22-34 180,036
35-54 225,230
55-64 85,418
Dec-15
Female 293,240
Male 223,868
Dec-15
Central 165,561
North 227,747
South 123,797
Dec-15
By Age By Gender By Plan By Region
Childless Adults
318,779
Parents 198,329
0
100,000
200,000
300,000
400,000
500,000
600,000
Dec-15
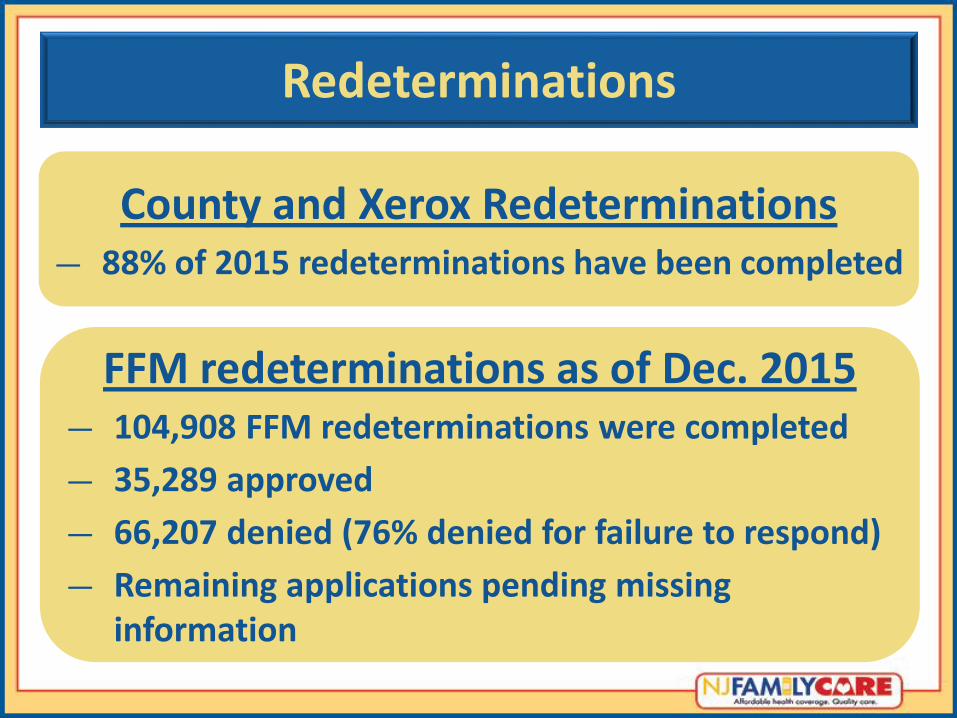
Redeterminations
County and Xerox Redeterminations — 88% of 2015 redeterminations have been completed
FFM redeterminations as of Dec. 2015 — 104,908 FFM redeterminations were completed
— 35,289 approved
— 66,207 denied (76% denied for failure to respond)
— Remaining applications pending missing information