chew packwood n turner
TRANSCRIPT
7/28/2019 Chew Packwood N Turner
http://slidepdf.com/reader/full/chew-packwood-n-turner 1/343
%t
0
votJJ'**1-11,
- University of Surrey -
Modelling of' Buoyant Flow I leat Transfer for
Turboinachinery Rotating Disc Caiiiies
AI IIFSIS
FNGINI-I-RINO
OFTI IF ( JNIVF'RSITY OFSI IRRFY
FORT111-1
DOCTOR OF PI III, OSOPI IY
Alistair S. R. KIII'Oll
2008
Stll)Cl-vlsc(i hy: Prof. l. W. ('IIC\%.
Co-stipci-vised by: Dr A. R. Packwood
Collaborative Supcr\ isor M. T. Turner
7/28/2019 Chew Packwood N Turner
http://slidepdf.com/reader/full/chew-packwood-n-turner 2/343
DECLARATION
I theundersigncdcrcbydcclarehat hework containcdn thisthcsissmyown originalwork andhis notprcviouslyn itscntirctyor in partbccnsubmitted t anyunivcrsity oradcgrce.
Signed: A. /. k
Alistair S. R. Kilfbil
Datc: March2008
-ii-

7/28/2019 Chew Packwood N Turner
http://slidepdf.com/reader/full/chew-packwood-n-turner 3/343
ACKNOWLEDGMENTS
My researchas akenalmostseven earso complete napart-time,Universityof Surrcy-Rolls-
Roycccollaborative asis.During hisperiodor researchhavebeen upportedyanumber f
people othat theUniversityof SurreyandatRolls-Roycend would ike to acknowledgeheircontributions.
Firstly I would like to thankall my colleaguesat Rolls-Roycefor their support, n particular Dr.
EddieWilliams, JohnMylemans, Jcff Dixon, Dr. Colin Young, Guy Snows,Dr. Tim Scanlonand
Chris Barnes rom R-R Derby, andAndy Rose,RichardBeasleyandJohn Ingle from R-R Bristol,
%kho ll helped o secure unding for my researchover the five year periodorthe mainwork.
I wish to give a thankyou to my supervisors,especiallyPror.JohnChewas my university
supervisorandto Dr. Alan Packwood,my co-supcrvisorat the university andto my industrial
supervisorMike Turner for their support, guidanccand invaluableadvicethroughoutmy research.
Also from the Surrey I`hcrmo-Fluid SystemsUniversity TechnologyCentre would like thankboth
Dr. Nick I fills andDr. Zixiang Sunfor their backgroundwork in this field orrescarch of rotating
cavity flows andheat ransfer,especiallyfor their LargeEddy SimulationComputationalFluid
Dynamicswork.
I xvouldalso like to give my thanks o theThcrmo-nuid MechanicsResearchCentreat the
University or Sussex or their experimentalandnumericalwork with the Multiple Cavity Rig. In
particular I thank Prof. PeterChilds, Dr. Chris Long andDr. Alex Alexiou.
I would like to give my full appreciation o Adam Andersonand David Mann from FluentEurope
Ltd. for all their helpwith my FLUENT User DefinedFunctionsprogramcoding problems.
I would also expressmy gratitude o Dr. PeterSmoutfor die proorrcading my thesis.
Finally. would ike to thankmyfamily,especiallymylate ather,RoyandElsieKilroil for without
theirencouragementndbackinghecompletion f myPhDwouldnothavebeenpossible.
I dedicatehisgiesisn thememory f my latemother,hlargarctKilfbil.
-iii-

7/28/2019 Chew Packwood N Turner
http://slidepdf.com/reader/full/chew-packwood-n-turner 4/343
ABSTRACT
In thedesignora gas urbineengine it is importantto havea good prediction of thetemperaturedistribution for componentsof theengine.This researchwork looksat the methodof predicting air
andmct3l temperatures rthc I IP compressordisc drum. It is a commonpractice o supply cooling
air for the turbinedisc andbladesby passing heair axially betweendie boresof adjacentdiscs n
die I IP compressor.some ordic central axial througliflow is known to enterthecompressornter-
disc cavitiesanda parasitictemperature ise occurs n the througliflow air as a resultor the
convectiveheat ransfer.It is importantthat the heat ransfermechanismwithin a compressornter-
disccavity is understood,asthe enginedesignerneeds o know die temperatureof the cooling air
andthedisc temperaturesn order to predict the stressandthe iiie orthe compressor,and alsoto
predict the scal andblade ip running clearances.
In this thesis,computational luid dynamics(CFD) is used o studythe flow andheatmechanism
experiencedby a gas urbine IIP compressor otor. A review of previous researchwork andknowledge n the field of rotational buoyancy-drivcn low hasshownthat die flow within the
compressorntcr-disccavities is highly three-dimensionalandtime dependentn nature.Two
approachesn thenumericalmodelling of the flow canbeconsidered;one is to useCFD as a tool to
model a single inter-disccavity with axial througliflow in full threedimensionswith unsteady low.
Usingthis approach equiresa hugeamount of computationalmemoryandtime to run the CFD
models.A secondapproach s to breakdown this complex flow processnto separate hysical
mechanisms nd introduceapproximatebut computationallycfficicnt modelsfor theseprocesses.Thesecondapproachhas been aken n this thesis,with theaim of producinga method hat canbe
incorporatednto currentdesignpractice.Two underlying flow mechanismsmay be identified for
thiscomplex flow; the first associatedwith the flow within the inter-disccavities andthesecond
associatedwith theaxial througliflow underthecompressordisc bores.
UsingthecommercialCFD codeFLUENT, modelling of thetwo underlying flow mechanisms as
beencombined and a steadyaxis),mmctric modelling methodhasbeendeveloped.This CFD
modellingmethod allows for enhancedmixing of the flow within the intcr-disccavity. The
enhancedmixing model is added o the CFD codeby usingthe User Defined Function (UDF)
functionality within FLUENT. The techniquehasbeenappliedto botha research ompressor ig
andto anactualgas urbine IIP compressor otor. CFD resultsfor both testcaseshave been
compared o measureddatacoveringa wide mngeor buoyancyconditions.For theCFD simulationsof the research ompressor ig good agreementwas achieved or thecavity shroudbeat ransfer
with a maximum error or 9% and for thedisc metaltemperatureswhere heerror was3%. The
cavity shroudheat ransrerpredictedby theCFD agreed easonablewell with theestimatedbeat
transrer or theengine compressor,however herewaspooragreementwith die disc metal
temperatures.Some nstability in the CFD solution hasbeenshown o occur with theapplicationordie enhancedmixing model.These nstability problemsarestill to be fully resolved.

7/28/2019 Chew Packwood N Turner
http://slidepdf.com/reader/full/chew-packwood-n-turner 5/343
NOMENCLATURE
AH
Aw [m21
Bo H
a [M]
b Iml
Cp [J kg" K*11
CP
D
DL4)'ER [m)
Dla)Con [M]
d [nl)
dh Im]
it, Im)
dy Im]
facix 1-1
E [m
Ec 1-1
F MI]G
GrGr# M
[m s21
[M fl]
11 [m)
h [W rn*2K71]
K Fl
k [W m" Kýlj
k# [W m-' K7'1
I [m]
enhanced ixing modelparameter
interiorsurface rea
Buoyancy umber Ro (PATa, 1/2
disc borc,adius
outcrradiusof cavity
specificicat
pressureocMcient QY-p.1(V.,u.,2)(Chapter Equ.5.1)
outcrdiameter r diecompressorotor
enhanced ixing modelayer hickness way romdienearest all
enhanced ixing modelconstantluid propertyayer hickness exttodiewall
depthor water
hydraulicdiameter
distance erpendicularo verticalwall (Chapter )
distance erpendicularo horizontalwall (Chapter )
cavityshroud earwall licat ransrcractorusedn theenhancedmixing model
shapeunctionusedn theenhanced ixing model
totalenergy
Eckertnumber (cor)2/(2p.&T)
licatflux
gap atio - s/b
Grashornumbcr AT L3/V2
rotationalGrashor umberr co'AT 0 p' / (T tO)
gravitational cceleration
appropriatecceleration g,gravityor - f12 , rotation
cavityheight r.- ri, cavitydepthn Chapter
licat ransfer ocfl'icicnt
cavity core actorusedn theenhanced ixingmodel
thermal onductivity
modiricd hermal onductivityn theenhanced ixingmodel
enhanced ixingmodelayer hickness

7/28/2019 Chew Packwood N Turner
http://slidepdf.com/reader/full/chew-packwood-n-turner 6/343
L Iml characteristicength
m [kg s7l] compressorxial hrougliflow
n [RPNI) compressorhall speed
is enhanced ixing modelparameterNu Nusscltnumber hLIk-qL /(AT k) Q/ (A,.AT)
Nub H verticalNusselt umber ased n cavityheight,h
Nul 1-1 horizontalNusscltnumber ased n cavity ength,
P [Pal staticpressure
P [Pal reduced ressurein Equation .8)
PO [Pal SussexNICRcavity pressure
Pr 1-1 Prandtlnumber p Cp kQ [W] heat low
4 [W M-1) heat lux
4A [W m"I heat ransfer yconduction lone
Ra Rayleigh umber Gr Pr
Rai localRayleighnumber
RN rotationalRayleighnumber Gr#Pr
Rah verticalRayleighnumber ased n cavityheigh4hg AThP va
M4 horizontalRayleighnumber ased n cavity ength, -g0 ATI11va
Re# Reynoldsnumber, otational fl bý v
Re, Reynoldsnumber, xial hroughilowW dh v
R.h.j (m) shaftouter adius Ch3ptcrs to9)
Ro F) Rossbynumber-W/ El a
r Iml radial distanceof cavity
ri Iml innerdiscradius
rM Iml cavity Mean adius- (r.+ rj/2
ro [m] outerdisc radius
ro (m) shaft adius
r, 0, Z [m, rad,m] cylindrical co-ordinatcs radial, circumferentialandaxial directions)
R 1-1 CFD mesh geometricalexpansion atio
SIml
cavity widthT JKI appropriateemperature
To [K] gas emperature
T, [K] innerradiusCavityW311emperaturc
-vi-

7/28/2019 Chew Packwood N Turner
http://slidepdf.com/reader/full/chew-packwood-n-turner 7/343
TO [K] outer adiuscavity wall temperature
T. JK] wall temperature
Tb [K] bulk fluid temperature
U,[M ell friction
velocityvW [m $'I] velocity n thecircumfcrcnti,1 ircction
w [m S*11 relativevelocity n thecircumrcrcntial irection
W [m S'11 bulkaverageelocityof dieaxial hrougliflow
X 1-1 radius atioof cavity-r/b
x Iml strcamwiscistance imcnsionChapter Figure5.1)
y nearwall distance
y nornialdistance imensionCh3ptcrFigure5.1)y non-dimcnsionalearwall distance arameter pu, Wp
yp [m) distancerompointPto thewall
Greek
a [m2S'11 thermaldifTusivityk/ (pcp)
a 101 cavitysectorangle0 101 thermal olumeexpansionoefficienta Iml boundary-layerhickness
distanceof fluid ccll centre rom thenearestwall in theenhancedmixing model
AT (K] appropriate emperaturedifference
(D [kg m*1S, jviscousdissipationterm
0 [radians] coneor
disc halfangle
(0-
90' fora
disc)
P [N SM,2j dynamicviscosity
/10 [Ns M-2j modified viscosity in the enhanced mixing model
V [M2S* 1 kinematic viscosity
P Jkgm'31 density
Tw lkg m*1S*2] wallsheartress
CO [radianss"I angularflow velocity
ri[radians
s"'I angularvelocity
-VII.

7/28/2019 Chew Packwood N Turner
http://slidepdf.com/reader/full/chew-packwood-n-turner 8/343
S,I 1-te'savg appropriateverage
b basic luid property alue
C,N, E, S,Wmesh ells
(cellccntrcdvalues) amed
Centre,North, East,Southand
West
core intcr-disccavitycore
corrcl corrl heat ransfer orrelation alue
Exp experiment
9 gas
I/ inner innerradius
inlet air inlet
I local
m metal
NWP nearwall point
o/ outer outer adius
W/W wall
00 frce-strcam
-viii-
7/28/2019 Chew Packwood N Turner
http://slidepdf.com/reader/full/chew-packwood-n-turner 9/343
CONTENTS
DECLARATION
ACKNOWLEDGMENTSABSTRACT
NOMENCLATURE
CONTENTS
LISTOFFIGURES
LIST OF TABLES
ii
iiiiv
v
ix
xv
xxii
CHAPTER INTRODUCTION I1.1An Introductiono theResearch roblem 1
1.2Outlineof theThesis 5
CIIAPTER2 REVIEWOF PREVIOUSWORK 8
2.1 Introduction 8
2.2NaturalConvection uoyancyDrivenFlowswithin aStationaryCavity 9
2.2.1Raylcigh-Binardconvection 92.2.2Naturalconvcctionwith heated idewalls 13
2.2.3Mixed horizontalandverticalconvcction 14
2.2.3.11eat ransfermeasurements 16
2.2.3.2Flowpatterns 18
2.2.3.3Temperatureistribution 19
2.2.3.4Conclusions 20
2.3Convection
lowwithin aRotatingEnclosed avity20
2.4 RotatingCavitywith Axial 71irougliflow 24
2.4.1Singlecavity nvestigations 24
2.4.1.1sothermallow 24
2.4.1.2Nonisothcrmallow 27
2.4.2Multiplecavity nvestigations 31
2.4.2.1Sussex TCmultiplecavityrig build I experimental 31investigations
2.4.2.2Sussex TCmultiplecavityrig builds2and3 33
cxpcrimcntalnvcstigations2.5Stationary ndRotatingCavities- NumericalStudies 36
-Ix.

7/28/2019 Chew Packwood N Turner
http://slidepdf.com/reader/full/chew-packwood-n-turner 10/343
2.6 CrossFlowOvcraStationaryCavity 37
2.7A NumcricalAxisymmctricModclorthc BuoyancyEffcctsn Rotating 38CavityFlows
2.8 Conclusions 41
CHAPTER3 COMPUTATIONALFLUID DYNAMICSSIMULATIONOF 44NATURAL CONVECTION N A CUBE
Summary 44
3.1 Introduction 44
3.2 Descriptionof the Experiment 45
3.3 Test I Icat Transfer Measurements 46
3.4 Numerical Investigation 47
3.5 Numerical Simulation Results 51
3.5.1 Steady low CFD solutions 51
3.5.2 Unsteady low CFD solutionsfor dic I IC configuration 53
3.5.2.1Flow structure 53
3.5.2.21 cat transrcr 57
3.5.2.3Mcsh dependency 59
3.5.2.4Temperature ield 60
3.5.2.5Scaling 65
3.6 Conclusions 67
CIIAPTER4 COMPUTATIONAL FLUID DYNAMICS SIMULATION FOR 68
CONVECTION IN AN ENCLOSED ROTATING ANNULARSECTOR CAVITY
Summary 68
4.1 Introduction 68
4.2 Description of the Experiment 69
431 Icat Transfer Measurements 70
4.4 Numerical Modcl of Convection in a Scalcd Rotating Sector 71
4.4.1 Basic modelling assumptions and the numerical procedure 71
4.4.2 7lic governing equations 72
4.5 Numerical Simulation Results for the 4511Enclosed Rotating SectorCase
73
4.5.1 Unsteady flow FLUENT CFD solutions 73
4.5.1.1 Mean heat transrcr 73
.x.

7/28/2019 Chew Packwood N Turner
http://slidepdf.com/reader/full/chew-packwood-n-turner 11/343
4.5.1.2Flowstructure nd emperatureield 76
4.5.1.3Meshdcpcndcncy 78
4.5.2Solidbody otationCFD nvestigation 79
4.6NumericalnvestigationrConvcction
na
ScaledAnnulus so
4.6.1CFDI lydrasolutionsor the ull rotatingannulus 80
4.6.2CFDFLUENTsealed otatingannulus olution 85
4.7 Conclusions 86
CIIAPTER5 COMPUTATIONALFLUID DYNAMICSSIMULATIONOF 88FLOWPASTA RECTANGULARCAVITY
Summary
5.1 Introduction
5.2 Descriptionor ti,c Experiment
5.3 Numerical Investigation
5.4 Results
5.5 Conclusions
88
88
88
89
91
97
CIIAPTER6 SUSSEXMULTI-CAVITY RIG BUILD 2THERMAL MATCHING 99
Summary 99
6.1Introduction 99
6.2 Nicthods ndAssumptions 101
6.2.1Operating onditions 103
6.2.2Tbcrmalboundary onditions 103
6.2.3Tbcrmalboundary efinitions 106
6.3Results 108
6.3.1Compressorrotoroutersurface III
6.3.2Stage discsurface III
6.3.3Stage .3shroud 112
6.3.4Stage discsurface 112
6.3.5Stationary haft 113
6.3.6Discsstages and3 axial emperatureifferences 113
6.3.7Discsstages and3 radial emperatureifTcrcnccs 113
6.3.8Best-matchedodel 130
-xi-

7/28/2019 Chew Packwood N Turner
http://slidepdf.com/reader/full/chew-packwood-n-turner 12/343
6.4 DiscussionandFurtherAnalysis 131
6.4.1Best-matchedmodel- modelling assumptions 131
6.4.2Heat ransfercoefficientsonthediscsurfaceand cavity shroud 133
6.4.3Cavity flow regimes 135
6.4.4Eckertnumbereffects 137
6.4.5Axial heat low calculations 137
6.4.6Theeffectof internalradiationwithin theMCR build 2 rig 143
6.5 Conclusions 145
CHAPTER7 STEADY FLOW 2-DIMENSIONAL MODELLING METHODOLOGY 147
7.1 Introduction 147
7.2 A 2D AxisymmetricModel of theBuoyancyEffects n RotatingCavity 147Flows
7.3 A Numerical2D Model of theBuoyancyEffects n aStationaryCube 152EnclosedCavity
7.3.12D steadyaminar low CFD 153
7.3.22D unsteadyaminar low CFD 154
7.3.32D unsteadyaminar low CFDwith modifiedfluid properties 156
7.4 A Numerical2D AxisymmetricModel of theBuoyancyEffects n aRotating 158SealedCavity
7.5 Final Implementationof theEnhancedMixing Model 162
7.5.1Cavityshroudheat ransfer ormulationcodedn theUDF 162
7.5.2Cavitycoreenhancedmixing model ormulationcodedn theUDF 163
7.6 User Guide or theEnhancedMixing ModelUDF and heusewithin the 1662D AxisymmetricCFDModel
7.7 Conclusions 167
CHAPTER 8 2D AXISYMMETRIC COMPUTATIONAL FLUID DYNAMICS 168
SIMULATION OF THE SUSSEX MULTI-CAVITY RIG BUILD 2
WITH THE APPLICATION OF THE ENHANCED MIXING MODEL
Summary 168
8.1 Introduction 168
8.2 Description of the Experiment 169
8.3 Test Heat Transfer Measurements 171
8.4 Numerical Investigations of Convection in a 2D Axisymmetric Enclosed 171Rotating Cavity with Axial Throughflow

7/28/2019 Chew Packwood N Turner
http://slidepdf.com/reader/full/chew-packwood-n-turner 13/343
8.4.1 Basicmodelling assumptions nd henumericalprocedure 171
8.4.2Thegoverningequations 172
8.4.3Enhancedmixing model 173
8.5 Numerical SimulationResults 176
8.5.1 Singlecavity, SussexUTC MCRB2cavity no.3 176
8.5.1.1Flow structureand emperatureesults 177
8.5.1.2Heat ransfer esults 183
8.5.2SussexMCRB2- two cavities,cavity2 andcavity3, surrounding 185disc2
8.5.2.1Flow structureand emperatureesults 187
8.5.2.2Heat ransfer esults 191
8.5.3 SussexMCRB2- two cavities,cavity2 andcavity3 with a 193
conjugateheatingsolution or disc2
8.5.3.1Flow structureand emperatureesults 193
8.5.3.2Heat ransfer esults 201
8.6 CFD FLUENT LES Solution 206
8.7 Conclusions 208
CHAPTER 9 2D AXISYMMETRIC COMPUTATIONAL FLUID DYNAMICS 210SIMULATION OF A TYPICAL GAS TURBINE HP COMPRESSOR
ROTOR DRUM WITH THE APPLICATION OF THE ENHANCED
MIXING MODEL
Summary 210
9.1 Introduction 210
9.2 Description of the Engine Test 210
9.3 Test Heat Transfer Measurements 212
9.4 Numerical Investigations of Convection in a 2D Axisymmetric 213HP CompressorRotor Drum with Axial Throughflow
9.4.1 Basic modelling assumptionsand the numerical procedure 213
9.4.2 The governing equations 215
9.4.3 Enhancedmixing model 215
9.5 Numerical Simulation Results 216
9.5.1 Flow structure and temperatureresults 216
9.5.2 Heattransfer results
222
9.6 Conclusions 228
7/28/2019 Chew Packwood N Turner
http://slidepdf.com/reader/full/chew-packwood-n-turner 14/343
CHAPTER 10CONCLUSIONSAND RECOMMENDATIONSFOR 230FURTHERWORK
10.1Conclusions 230
10.2Recommendationsor Further Work 23510.2.1cavity anddiscconjugateheatingwith theenhancedmixing 236
model or transientoperation
10.2.2CoupledCFD- thermal ransientmodel 239
10.2.3Otherrecommendations 241
REFERENCES 242
APPENDICIES 252
Appendix 1 252
Al. 1TheStandard -c TurbulenceModelas used n theFLUENT 252CFDcode
Al. 2 NearWall TurbulenceModelsused n theFLUENT CFDcode 255
A 1.2.1Standardwall functions 255
Al. 2.2Two-layermodel or enhanced all treatment 258
A 1.2.3Enhancedwall functions 260
Appendix 2 ThermalAnalysis(SC03)of theSussexUTC MCR Build 2,266
ThermalBoundaryConditionDefinition for the 'Best-Matched'Model
Appendix3 ThermalAnalysis (SC03)of theSussexUTC MCR Build 2,285Thermal Best-Matched'ModelBoundaryConditionsValuesatthe 'near' StabilisedMaximumSpeedCondition
Appendix 4 EnhancedMixing ModelFLUENT UserDefinedFunction UDF) 293
Listing of theSourceCode comp__enhanced_mixing.'
Programmedn the 'C' LanguageAppendix 5 Listing of theSchemeile 'wall-viscosity.scm' SourceCode o 318
beusedwith theEnhancedMixing ModelUserDefinedFunction(UDF)
Appendix6 UserGuide or theEnhanceMixing ModelUDF and heuse 321
within the2D AxisymmetricCFDModel
-Xiv-
7/28/2019 Chew Packwood N Turner
http://slidepdf.com/reader/full/chew-packwood-n-turner 15/343
LIST OF FIGURES
Figure1.1 Cut awaysectionof atypical civil gas urbineaero-engine. 2
Figure 1.2 Crosssection hroughatypical civil gas urbineaero-engine howing he 3HP compressor,ombustionchamberandHPturbinealong with theinternalsecondary ir systemcoolingflows.
Figure2.1 Schematicof the testcell used n theKirkpatrick andBohnexperiments 15
and hefour experimentalestconfigurations.
Figure2.2 Dimensionsof theannularcavities or threeexperimentalest 21
configurations.
Figure2.3 Schematic iagramof computedlow in a sealed45*segment f a rotating 23
cavitywith a radialheat low (in ther-a plane).
Figure 2.4 Nomenclature for axial throughflow and isothermal flow structure. 25
Figure2.5 Visual impressionsof smokepatternsn an sothermalrotatingcavitywith 26
axial throughflow:Re,,= 5000.
Figure 2.6 Schematicdiagram of the heated flow structure in r-<pplane. 28
Figure 2.7 SussexUTC Multiple Cavity Rig (Build 1). 33
Figure 2.8 SussexUTC Multiple Cavity Rig (Build 3) showing the two LDA 34
instruments.
Figure 3.1 Geometry and surface mesh (I 00x I 00x100) for the water-filled cube. 48
Figure 3.2 Contours of vertical velocity, HC case,AT= I OK. 52
Figure 3.3 Contours of vertical velocity, HC case,unsteady, aminar flow, 55
Figure 3.4
Figure 3.5
Figure 3.6
Figure 3.7
Ra = 5.83xlO9 (AT=IOK).
Contours of temperature,HC case, unsteady,Jaminar low, Ra = 5.83xlO9 56
(AT= I OK).
Calculatedvariationof heat ransferonthetopandbottomsurfacesor 57Ra= 2.3xI010AT=40K).
Heat transfer Numerical (CFD) datacompared with Kirkpatrick and Bohn 58
empirical correlation for the HC configuration.
Heat transfer numerical (CFD) resultscompared with Kirkpatrick and 60
Bohn empirical correlation for various mesh sizes.

7/28/2019 Chew Packwood N Turner
http://slidepdf.com/reader/full/chew-packwood-n-turner 16/343
Figure3.8a Computationalanalysis temperatureecord or HC configurationwith 61AT = 40K for the I 00-cubedmesh.
Figure3.8b Computationalanalysis temperatureecord or HC configurationwith 61AT= I OKfor the I 00-cubedmesh.
Figure3.9 Computationalanalysis mean emperature rofile (timeaveraged)or 62HC configurationwith AT = 40K for the I 00-cubedmesh.
Figure 3.10 Computationalanalysis temperatureluctuationprofile for HC 63
configurationwith AT = 40K for the I 00-cubedmesh.
Figure 3.11 Temperature fluctuation s ectrurn from referencepoint 8mm above 64
bottom plate, Ra = 2.3x 10 0(AT = 40K).
Figure4.1 Geometryof Aachen otatingannulus. 71
Figure4.2 Meshfor Aachenannulus. 71
Figure4.3 Comparisonof thepredictedheat ransferwith experimental orrelations 75for theAachen otating sealed ector,configurationC.
Figure4.4 Wall heat ransfer rom theCFDsolutionand heAachen otating sealed 76
sectorexperimentor R4 = 3.781x10⁹.
Figure4.5 CFDpredicted nstantaneousemperatureontoursor Ra+= 3.78 xIO9.77
Figure4.6 CFDpredictednstantaneousradialvelocitycontours or Ra#= 3.781x109.77
Figure4.7 CFDpredicted emperature lot at thecavity centre or Ra4= 3.781x101.78
Figure4.8 Comparisonof thepredictedheat ransferwith experimental orrelations 79
- CFDmeshsensitivity.
Figure4.9 Comparisonof thepredictedheat ransferwith theAachensealed otating 81
annulusexperimental orrelations.
Figure4.10 Variationsof surfaceheat ransferwith time for cases&4,82
Raý= 2.76x10⁹.
Figure4.11 Instantaneousemperatureontoursor cases&4, Ra#= 2.76x109.83
Figure4.12 Instantaneousemperaturend ts spectrumor cases&4,83Ra,#= 2.76x10⁹.
Figure4.13 Instantaneousvelocity and ts spectrumor case4, Ra4= 2.76x109.84
Figure4.14 Comparisonof temperaturepectra .6mm rom theoutercylinder wall 84
betweenhe wo meshes, "-4= 2.76x10⁹.
Figure4.15 Comparisonof heat ransferbetweenFLUENTandHydracalculations, 85Ra4
=2.76x10⁹.
-Xvi-

7/28/2019 Chew Packwood N Turner
http://slidepdf.com/reader/full/chew-packwood-n-turner 17/343
Figure5.1 A typical CFDmeshused n thesimulation. 90
Figure5.2 Comparisonof CFDandexperimental -velocity profiles takenat three 92
positionsacrosshe testcavity (fVs=1.5).
Figure5.3 CFDpredictedy-velocity profile acrosshetestcavity at various vertical 92distancesn
to and out of thecavity (Ws=1.5).Figure5.4 CFDpredictedand estmeasured ressure istributions Cp)along he 93
testcavitywalls (Ws=1.5),(a)upstrearnanddownstreamwalls.(b)bottornsurface.
Figure5.5 CFDpredicted low patternwith in thetestcavity- contoursof stream 95function.
Figure5.6 HaugenandDhanak low visualizationexperiment water) low patterns 95
within the testcavity.
Figure5.7 CFDpredicted low patternwith in thetestcavity (H/s= 2) using water 96
- contoursof streamunction.
Figure6.1 Extentof theSussexMCRB2geometryn thethermalmodel. 102
Figure6.2 ' Materialsused n theSussexMCR132hermalmodel. 102
Figure6.3 HP shaftspeedused n the SussexMCR132hermalmodel. 103
Figure6.4 Measuredmetal emperaturesnthecompressor rumrotor outersurface 104duringthe transientcycle.
Figure6.5 Locationof thermalboundaryconditions. 105
Figure6.6 Locationof thermocouples. 109
Figure6.7 Temperaturecontoursat stabilised,maximumspeed ondition or the 109datummodel.
Figure6.8 Disc2 bore emperatureTC7). 114
Figure6.9 Disc2 rear surfaceemperature, isccob(TC8). 115
Figure6.10 Disc2 rear surfaceemperature,nnerradii (TC9). 116
Figure6.11 Disc2 rearsurfaceemperature,mid radii (TC 10). 117
Figure6.12 Disc2 rear surfaceemperature,uter adii (TC 11). 118
Figure6.13 Disc2-3 shroudsurfaceemperatureTC12). 119
Figure6.14 Disc 3 front surfaceemperature,uter adii (TC 13). 120
Figure6.15 Disc 3 rear surfaceemperature,mid radii (TC14). 121
Figure 6.16 Disc 3 rearsurfaceemperature,nnerradii (TC 15). 122
Figure6.17 Disc 3 rearsurfaceemperature,isccob(TC 16). 123
Figure6.18 Disc 3 bore emperatureTC17). 124Figure 6.19 IP shaftsurfaceemperature,isc 2 bore(TC27). 125
Figure6.20 IP shaftsurfaceemperature,etween isc 2 and3 (TC28). 126
-Xvii-

7/28/2019 Chew Packwood N Turner
http://slidepdf.com/reader/full/chew-packwood-n-turner 18/343
Figure6.21 IP shaftsurface emperature, isc3 bore(TC29). 127
Figure6.22 Axial temperature ifferencesacross tage2 and stage3 discsat three 128
radial locationscomparing hedatummodeland hebestmatchedmodelwith measurements.
Figure6.23 Radial emperature ifferences discouter radius o cob) for stage2 and 129stage3 discscomparing hebestmatched, atummodel and heCONE
model with measurements.
Figure6.24 Locationof BoundaryConditions or theBest MatchedModel. 130
Figure6.25 Temperaturecontoursat StabilisedMaximumCondition or theBest 131MatchedModel.
Figure6.26 Comparisonof the thermalmodellingapproach sed n thedatummodel 133to thatused n thebest-matchedhermalmodel.
Figure6.27 Comparisonof theheat ransfercoefficientson stages and3 discsand 134
thecavity shroud or the three hermalmodels.
Figure6.28 Timehistoryof Rossbynumber Ro) for MCR build 2 stage2-3 135inter-disccavity.
Figure6.29 SussexMCR build 2 transientaccel decelcycleheat low Nyithindisc 2 140diaphragm- conductioncalculationusingmeasuredest emperatures.
Figure6.30 SussexMCR build 2 transientaccel decelcycleheat low within disc 3 141diaphragm- conductioncalculationusingmeasuredest emperatures.
Figure6.31 SussexMCR build 2 effectof internal adiationwithin thecompressor 144
inter-disccavities emissivity= 1)on metal emperatures.
Figure 7.1 Illustration of the simplified model. 148
Figure 7.2 Stream function contours. 153
Figure 7.3 Velocity vectors coloured by velocity magnitude. 153
Figure 7.4 Vertical temperature distribution through the centre of the cavity for the 154
steady laminar solution.
Figure 7.5 Stream function contours. 155
Figure 7.6 Velocity vectors coloured by velocity magnitude. 155
Figure 7.7 Vertical temperature distribution through the centre of the cavity for the 155
unsteady laminar solution.
Figure 7.8 Enhancedmixing fluid viscosity distribution. 156
Figure 7.9 Enhancedmixing fluid thermal conductivity contours. 156
Figure 7.10 Stream function contours. 157
Figure 7.11 Velocity vectors coloured by velocity magnitude. 157
Figure 7.12 Vertical temperaturedistribution through the centre of the cavity for the 157unsteady aminar flow with modified fluid properties.
-Xviii-

7/28/2019 Chew Packwood N Turner
http://slidepdf.com/reader/full/chew-packwood-n-turner 19/343
Figure7.13
Figure7.14
Figure7.15
Figure7.16
Figure7.17
Figure8.1
Figure8.2
Figure8.3
Figure8.4
Figure8.5
Figure8.6
Figure8.7
Figure8.8
Figure8.9
Figure8.10
Figure8.11
Figure8.12
Figure8.13
Figure8.14
Figure8.15
Figure8.16
Figure8.17
Figure8.18
Figure8.19
Figure8.20
Figure8.21
Figure8.22
Figure8.23
Figure8.24
Figure8.25
Figure8.26
Figure 8.27
Stream unctioncontours. 161
Swirl velocity contours. 161
Mixing factorcontours. 161
Vertical temperature istributionthrough hecentreof thecavity. 161
SussexUTC MCRB2 streamunctioncontours. 166
SussexMCRB2- showing hepositionsof the thermocouples. 170
Stream unctioncontourswith UDF boundaryconditions test 33). 175
A part of the2D CFDgrid. 175
CFDmeshand geometryof theSussexMCRB2 cavity 3.176
Test 33temperaturesfor n=O. ). 177
Test 33 swirl velocities. 178
Test 33discandcavitytemperatures. 178
Test34Temperaturesfor n=O. ). 179
Test34 swirl velocities. 180
Test34 discandcavity temperatures. 180
Test50temperaturesfor n=O. ). 181
Test50 swirl velocities. 181
Test50discandcavity temperatures. 182
Test 33 disc2 rear surfaceheat ransfer. 183
Test 33 disc3 front surfaceheat ransfer. 184
Test 33cavity3 shroudanddiscboresurfaceheat ransfer. 184
CFDmeshand geometryof theSussexMCRB2cavities2 and3.186
CFD Test33 streamunctioncontours. 188
CFDtest33mixing factorcontours. 188
CFDtest33temperatureontours. 189
CFDtest33 swirl velocitycontours. 189
CFDtest33cavity2 (disc I anddisc 2) temperatures. 190
CFDtest33cavity3 (disc2 anddisc3) temperatures. 190
Test33cavity2 (discs and2) surface eat ransfer. 191
Test33cavity3 (discs2 and3) surface eat ransfer. 192
Test 33cavity2 and cavity3 (discs1,2 and3) shroudanddiscbore 192
surfaceheat ransfer.
CFDmeshand geometryof theSussexMCRB2cavities2 and3 and 195
of disc2 with conjugate eating.

7/28/2019 Chew Packwood N Turner
http://slidepdf.com/reader/full/chew-packwood-n-turner 20/343
Figure8.28 CFDtest33 streamunctioncontours. 196
Figure8.29 CFDtest33mixing factorcontours. 196
Figure8.30 Test33 temperature ontours disc 2 modelledwith conjugateheating) 197for a) with andb) without theenhancedmixing model.
Figure8.31 Test 33 cavity2 temperaturesdisc 2 modelledwith conjugateheating) 198for a)with andb) without theenhancedmixing model.
Figure8.32 Test33cavity 3 temperaturesdisc 2 modelledwith conjugateheating) 199for a)with andb) without theenhancedmixing model.
Figure8.33 Test 33disc2 temperaturesconjugate eatingsolution)- with and 200
without theenhancedmixing model.
Figure8.34 Test34 and est50disc2 temperaturesconjugateheatingsolution) 200
- with theenhancedmixing model.
Figure8.35 Test 33 CFDcavity2 (disc I and2) with disc 2 conjugateheating 203- discsurfaceheat ransfer.
Figure8.36 Test33 CFDcavity3 (disc2 and3) with disc 2 conjugateheating 203
- discsurfaceheat ransfer.
Figure8.37 Test33 CFDcavity2 (disc I and2) and cavity 3 (disc 2 anddisc3) with 204disc2 conjugateheating- shroudanddisc boresurfaceheat ransfer.
Figure8.38 Cavity3 shroudheat ransferversesGrashofnumber CFDpredictions 205
comparedo theexperiment.
Figure8.39 Cavity3shroud
heat ransferverses
buoyancynumber
CFDpredictions
205
comparedo theexperiment.
Figure 8.40 LES 120* sector model -instantaneous emperature at the mid-axial 208
plane for the SussexMCRB2 cavity 3 simulations.
Figure 9.1 HP compressorrotor drum (rear stages)geometry. 211
Figure 9.2 HP compressor (rear stages) showing the positions of the thermocouples 212
for the engine test.
Figure 9.3 CFD mesh and geometry of the rear sectionof a HP compressor rotor 214
drum.
Figure 9.4 Engine HP compressorat steady state 1070/oNL- contours of stream 217
function with enhancedmixing.
Figure 9.5 Engine condition 1070/oNL ontoursof mixing factor -for the CFD 218
enhancedmixing model.
Figure 9.6 Engine condition 107VoNLcontours of molecular/laminar viscosity 219
- for the CFD enhancedmixing model.
Figure 9.7 Engine condition 1070/oNL ontours of turbulent/eddy viscosity 219- for the CFD enhancedmixing model.
7/28/2019 Chew Packwood N Turner
http://slidepdf.com/reader/full/chew-packwood-n-turner 21/343
Figure9.8 Enginecondition 1070/oNLontoursof swirl velocity - for theCFD 220
enhancedmixing model.
Figure9.9 Enginecondition 107VoNLcontoursof swirl velocity ratio - for theCFD 221
enhancedmixing model.
Figure9.10 Engine estcondition 1070/oNLemperature ontours or a) with and 223b) without theenhancedmixing model.
Figure9.11 Engine est 1070/oNLcavity 2 temperaturesor a) with andb) without the 224
enhancedmixing model.
Figure9.12 Engine est 1070/oNLavity3 temperaturesor a) with andb) without the 225
enhancedmixing model.
Figure9.13 Engine est 1070/oNL riveconecavity temperaturesor a) with and 226b) without theenhancedmixing model.
Figure9.14 Engineest
1070/oNL PCdisctemperatures
conjugateheatingsolution)
227
- with theenhancedmixing model.
Figure9.15 Engine est 1070/oNL PC disctemperaturesconjugateheatingsolution) 227
- without theenhancedmixing model.
Figure9.16 Engine est I 00%NL HPC disctemperaturesconjugate eatingsolution) 228
- with theenhancedmixing model.
Figure 10.1 SussexMCRB2 (cavities 2 and 3 and disc 2) extendedgeometry and the 237
position of the boundary conditions required by the CFD model.Figure 10.2 SussexMCRB2 full geometry and the position of the boundary 237
conditions required by the CFD model.
Figure 10.3 Engine HP compressor full geometry and the position of the boundary 238
conditions required by the CFD model.
Figure 10.4 SussexMCRB2 (cavities 2 and 3) SC89 coupled CFD - thermal analysis 240
transient model.
-)(xi.

7/28/2019 Chew Packwood N Turner
http://slidepdf.com/reader/full/chew-packwood-n-turner 22/343
LIST OF TABLES
Table3.1 Comparisonsof steadyaminarand urbulentCFDresultswith measured 51heat ransfer or theHC case.
Table3.2 Comparisonsof steadyaminarand urbulentCFDresultswith measured 53heat ransfer or theHHCC case.
Table3.3 Comparisonsof unsteadyaminar CFDresultswith measured eat 58transfer or theHC case.
Table 4.1 Comparison of the CFD results (unsteady laminar flow) with measured 74Heat transfer for the Aachen 45" enclosed rotating sector, configuration C
case.
Table4.2 Comparisonof theHydra CFDresultswith measured eat ransfer or the 80Aachensealedotating annulus,configurationB.
Table6.1 Results egend or eachSC03model. 110
Table6.2 Buoyancyparameter aluesa nearsteady tatemaximumconditionand 136duringthedeceleration.
Table6.3 Comparisonof MCRB2Discs2 and3 diaphragmaxialheat low 142
calculations,SC03predicted,CFDpredictedand a simpleconduction
calculationor
steadystateand ransient accelerationdle to maximum)testpoints.
Table 8.1 SussexMCRB2 single cavity model, cavity 3 shroud surfaceheat 185
transfer.
Table 8.2 Two-cavity CFD solution cavity temperatureresults. 187
Table 8.3 SussexMCRB2 two cavity and disc 2 model, cavity 3 temperaturesand 202
shroud surfaceheat transfer.
Table 8.4 Summaryof
CFD-LESresults
forthe calculated test casesof the
Sussex 207MCRB2.
Table 9.1 Engine HP compressorrotor 2D axisymmetric CFD with the enhanced 215
mixing model - cavity 3 temperaturesand shroud surfaceheat transfer.
. )Cxii-

7/28/2019 Chew Packwood N Turner
http://slidepdf.com/reader/full/chew-packwood-n-turner 23/343
CHAPTER1
INTRODUCTION
1.1An Introduction to the Research Problem.
For a typical civil aero-engine, the main gasstream annulus air temperaturescan be of the order of
1800K at entry to the turbine, where combined with high rotational speeds,of typically 10,000
rev/min on a 0.6m diameter, significant rotational stressesare created.The centrifugal loads
combined with thermal stressescreatedeflections in componentsthat can causea loss in efficiency,
or worse, compromise safety.
The performance of an aero gas turbine engine is characterisedby the thermal efficiency, propulsive
efficiency, specific thrust and specific fuel consumption. Improved engine performance may be
achievedby increasing the overall pressureratio of the cycle and by increasing the turbine entry
temperature.The gastemperaturesexperiencedby the turbine exceedthe melting point temperature
usedfor the turbine components,such asrotor blades,nozzle guide vanesand discs. Having an
effective and efficient cooling systemreducesthesehigh component temperature evels. To achieve
this, cooling air is drawn from the compressorand is passed o the turbine via an internal secondary
air system.On its route, this throughflow of air may be heatedby both convection and viscous
dissipation, and through 'windage' from bolts and other components.Sinceair is bled from the
compressorwhere work hasbeendone to raise its pressure,use of this air usually representsa
parasitic loss to the main cycle. The internal air system asa whole may use20% of the mainstream
airflow and cost up to 5% of the specific fuel consumption in a modem turbofan engine.
The objective of an efficient cooling system s to maintain acceptable component temperatureswith
minimum cost. This involves conveying the air with as little unnecessarypressure oss, temperature
rise and coolant flow loss aspossible. The internal air systemsalso perform other functions, namely
to pressurise he turbine cavities and seals o prevent hot gasingestion from the main gasstream, o
control the radial temperaturegradients in the compressorand turbine discsto reducestressesand
tip clearances, o balancebearing loads on eachspool and to pressurise he bearing chambers o
prevent oil leakageand the possibility of oil fires. In the designof a gasturbine engine it is
important to have a good prediction of the temperaturedistribution for all componentsof the
engine,especially critical rotating componentssuchasdiscs.The researchdescribedhere focuses
I

7/28/2019 Chew Packwood N Turner
http://slidepdf.com/reader/full/chew-packwood-n-turner 24/343
on one parlicular aspeci ofilie cooling sysicill. %%hich %lle fleal iran%f'Cr t) the compressor tinim
and til%cs.
III
IT LIlT iii, 'Itilt
I- gurt. 1.1 ( '111 (of a 1ýpical ON l g-. % til-bille
p1c. )

7/28/2019 Chew Packwood N Turner
http://slidepdf.com/reader/full/chew-packwood-n-turner 25/343
111'tomprc%wrdri%cconc andIIP %lul1
1111(1 tist
.I It
IIVI II ill],and Wad,
I-igurt. 1.2 Cros% %ectioll 1111-ough11'Npical ci%il g. 1%
ill-billeacro-cilgille %hol%illg
Ow III,
comprc%%or. combiwi(m chamber and III, along %%ithfic iniernal %ccomlarý air
%N%IclllCooling flfl%%%.( ollf-tv%% Rolls-RoNct. p1c)
A cul a%kaNection ofa typical c1%t gas turbine cngine I% ho%%III I igtire III lie comprevor
%rux)lcompri%c.%an outer drum and a series okh%cs. which carry and stipporl file blades. Between
cacti pair ot'disc% ofthe compressor. %caledat file periphery by I %hroud. here is an inier-disc
cavity. A cro%%ection through I typical 111'comprcs%orol'a gas turbine engine I-,shown m Figure
1.2. The diagram -, io%k%I typical I III -,pool internal %ccondaryair %ysicm here if is comillon
practice to extracted air from file inam gas slivaill tipstream ofthe 111) ompres%otenwy (region
marked yellow in life diagram). This compressed ; II passesaxially (indicated by black trro%%sn the
diagram) hcmcen I ie bores ofadjacem (11%csit tile 1111compressor and I%ised to condition t ie
turbine tfi%cs.File diagram also shows that ; II- I-, extracted from file rear offlic IIP compressor
(region marked red) and fill,, stjpplieý,cooling air to tile 111'loillc guldc %;ile%and to life 111)urbine
rotor bladcs. As file cooling air from all file %cconclary ir svs1cillssotlrcc%lll\c% back into tile
mainstream in file turbinc stages there I% loss ol'siagnafion prcsstirc III the main gas %Ircamduc it)
%I-killingcI1,Cc1%.I IIN combined with lossesIllrotigh file Cooling system liscli'decreasc-, file o\crall

7/28/2019 Chew Packwood N Turner
http://slidepdf.com/reader/full/chew-packwood-n-turner 26/343
thermalefficiency. I lcnce,the internalair systemmustbedesignedn sucha way to keep he
coolingair flow rateto a minimum but to retaina pressureevel that is sufficicrit to provide the
required low rate andtemperatureor turbinecooling and rim scaling pressurization.
Unfortunately, hebcncijts gainedfrom increasing heoverall pressure atio reduce hecooling
potential of the internalsystemair (higher inlet temperature) nd ncreasehebcaring oadsandscal
leakage lows. As a consequence,he internalsystem low needs o be increased.n ordcr to balance
theseconflicting requirementsandoptimize the internalair system,detailed designrules and
reliablepredictivedesignmethods or the fluid flow andtheheat ransfer n thegas urbine
components rc required.
This researchwork looksat the methodof predictingair andmetaltemperatures f the I IP
compressor.As mentionedpreviously in thedesignora gas urbineengine t is importantto havea
goodpredictionof the temperaturedistribution for all componentsof theengine,especiallycritical
rotating components uchasdiscs.11is is bcc3uscemperatureevelsandgradientshavea very
strongeffect uponcomponent ife. As cooling air flows throughtheborc of thecompressort
interactswith theair insidethe compressordisccavities.Someof this centralaxial throughflow is
known to cnterthe intcr-disccavity and a parasitic emperatureiseoccurs n thethrougliflow air as
a result of theconvectiveheat ransrer rom thedisc surraccsandtheshroudand also, as mentioned
aboveadditionalheatingmay occurdueto viscousdissipationand windage'. During changesn
cngine conditions, he temperatureat therim of thecompressor isc respondsmorequickly to
changesn thetemperature f the main gas stream low thandoes hetemperature t thehub.Ilic
resultingradial temperature radientproduceshigh stresses ndreduceddisc life. Also with the
wholecompressor rum respondingmuchslower than thecompressor asing o changesn tile
annulusair temperaturehe resultingdiffcrcntial expansions nd contractions ead o changesn the
blade ip and scalclc3ranccsaffecting thesurge imit andthecompressor filicicricy. It is important
that theheat ransrcrmechanismn thecompressor avity is understood.astheenginedesigner
needso know the temperature f thecooling air andthedisc temperaturesor both transientand
steadystateoperation.
Sensitivitystudies aveshownhat, n ordcr opredicthestrcss nd he atigueireof the
compressorswell as he otorandcasing learances,omponentemperatureredictions rc
requiredo haveanaccuracy f 5K forsteady tate nd30Kduring ransients.naccurate
prediction f metalcmpcraturcs ayallowthedesignerouseessexpcnsivematerialsor the IP
compressorotorwithconfidcncc ndalso educeheoverallengine roductionycle imeandcost.
4

7/28/2019 Chew Packwood N Turner
http://slidepdf.com/reader/full/chew-packwood-n-turner 27/343
Today'scomputationalmethod of usingthermalanalysis o predictcomponentmetaltemperatures
is supportedby expensive otatingmetaltemperaturemeasurementsn an engine ate in to the
enginedevelopmentprogramme costingup to L2 million per test). It is importantthat thedesign
engineerhas
an understandingof theheat ransrcr
processnsidethe
compressor avities early on
in
theenginedesign,soany changesn designcanbemadebefore heenginevalidation and
certification tests.
I'lic flow in the intcr-disc cavities becomes highly complex when the shroud or the discs arc heated,
with the flow becoming three dimensional and time dependent. Experimental tests have been
pcrrorincd to investigate the flow inside a simple rectangular rotating cavity with a central axial
throughflow, seefor
exampleFarthing. Long, Owen
andPincombe [ 1992a, 1992b]
and
Long
[19941. Also attempts have been made to model numerically the flow within the same rotating
cavity used in the cxpcrimcntal test (Tucker 1993]. An observation from the tests, also captured by
the numerical model, is that some of the central through-flow does enter the cavity. which is the
result orthe buoyancy cfrccts in the centripetal acceleration ficld. As will be discussed later, such
previous research has given insight into this complex fluid dynamics problem. but has had limited
impact on design methods. A major objective or the current study is to develop an improved
predictive capabilityfor
usein
design calculations.
1.2 Outline of theThesis
It has been established that the flow within the inter-disc cavities of aII Pcomprcssor is three
dimensional in nature and time dependent. One approach in the numerical modelling of the flow is
to use computational fluid dynamics (CFD) as a numerical tool and model a singleintcr-disc
cavity
with axial throught'low in full three dimensions with unsteady flow. Using this approach requires a
huge amount of computational memory and computational time to run the CFD models. A second
approach is to break down this complex flow process into separatephysical mechanisms and
introduce approximate but computationally ciTicicnt models for theseprocesses.The second
approach has been taken for this research, with the aim of producing a method that can be
incorporated into current design practice. Full CFD models are used to aid understanding of the
physical mechanisms.
5

7/28/2019 Chew Packwood N Turner
http://slidepdf.com/reader/full/chew-packwood-n-turner 28/343
Two underlying flow mechanismsmay be identified for this complex flow; the first associatedwith
the flow within the intcr-disccavitiesandthesecondassociatedwith theaxial throughflow under
dic compressordisc bores.Both of these low mechanismswill be discussedn thereview of
previouswork in Chapter2. The flow within the inicr-disccavity is a naturalconvection,buoyancy
dominatedmechanism esulting from thedifferential heatingbetween hetwo compressordiscsand
theconnectingshroudat theouter radiusof thecavity. In anengine he temperature f thecavity
shroud s usuallyhottestwith the temperaturedecreasingmoving radially inwardsto thedisc cobs,
whichare cooledby theaxial flow of air underthedisccobs.A small amountof theaxial through-
flow is known to enterthe intcr-disccavity at distinct circumferential positions hatdo vary with
time, but how much flow andat what circumferential locationsstill needs o be fully investigated.
With somegas urbineengines hecompressorntcr-disccavitiesarcscaledwith no flow entering
thecavity. Chapter2 presentsa review of existing work andknowledge n the field of rotational
buoyancy-drivcn low. Both scaledcavity flow and flow in an enclosedcavity with an axial cross
flow arc considered.
In anattempt o understandhe licat transferprocesshesimpicrcaseora completelycncloscd
cavity will beconsidered irst. In thestudythe flow insidethecavity might beassumedo have
solid bodyrotation, rotatingat thesamespeedasthecompressor iscsandhcncc ile relative
velocity of the fluid to thewalls is near zero.As a precursor o therotating flow studies,Chapter3
describesa CFD studyof the flow dueto gravity-drivcn naturalconvection n a stationary hree-
dimensionalcube. lic CFD resultsare comparedwith experimentaldata from Kirkpatrick and
Bohn [ 1986].Tlicseworkersperformedexperimentson high Rayleighnumber naturalconvection n
a cubewith variousconfigurationsof heatedandcooledvcrtical andhorizontalsurfaces.All the
configurationswere variationsof the 'licating from below' case.The CFD resultsare compared
with theexperimentalmeasurementsor heat ransfer, low patternsandtemperature istribution.
A CFD studyof buoyancy-induccd low in a centrifugal force field is prcscntedn Chapter4. This
ch3ptcrdescribesBohnct al's (1993,1994]cncloscd otatingsectorexperimentsandthe three
dimensionalCFD modclling usedof these.With rcrcrcnccalsoto otherworkers' results,similarities
anddiffcrcnccsto naturalconvectionundcrgravity arcnotcd.
The secondunderlying flow mcchanisms associatedwith die axial througliflow under he
compressor isc cobs. n theabsence f buoyancyefTectshis would bea dominantflow
mechanism.Thequestionaddresseds what cffcct theaxial cross low hason the flow within the
6

7/28/2019 Chew Packwood N Turner
http://slidepdf.com/reader/full/chew-packwood-n-turner 29/343
inter-disccavity. A shcar ayerexistsbetween hecross low passingover thecavity andtheair
within thecavity. 11crc is a need o know the levelsor heatand momentum ransrcracross his
shear ayer rrornthecross low to thecavity air and n termsora compressorhe transrcrof heat
andmomentumrom
theaxial througliflow underthedisc
cobs o theintcr-disc
cavities. In Chapter5a relatively simple flow, relevant o axial througliflow mechanisms considered.Comparison s
madewith I laugcnandDhanak's (1966]measurements.bcseworkerscarriedout an analyticaland
experimentalnvestigationaimedat describing he turbulentmomentum ransfermechanismn the
separationlow regionof a rectangularcavity racinganoncoming urbulentboundary ayer.The
chapterdescribes laugcnandDhanakexperimentsandthecomputationalCFD modelsused o
simulate heexperiments.The CFD resultshave beencompared o theexperimentalmeasurements
forcross
lowvelocity, pressures long thecavity walls andffic
flowpatternswithin thecavity.
Relevanceo thecompressor isccavity problemis thendiscussed nd mplications ror modelling
orthe cavity flow are considered.
Chapter looksattraditionaliniteelement asedhermalmodellingechniques.bcscarc applied
toa fully instrumentedesearchig attheUniversityof Sussex2001.Temperatureredictions
obtainedrom he hermalmodelusingCSt3blishcdorkingpracticesrccompared ithmeasured
temperatures.newnatural onvection eat ransrcr orrelationsalsocvaluitcd. 'lie rig testconsisted f an acccleration-dcccierationycleand hcrcrorche ransientemperaturesavebeen
measurednd he hermalmodels ttemptosimulateransientemperaturesswell as hesteady
stateemperatures.
In Chapter7a newtwo-dimensional 21))axisymnictricCFD-basedmodel is proposed or
buoyancy-drivcn lows. I'his is appliedto Kirkpatrick andBolin's [ 19861 tationaryenclosedcavity
experiment.The 2D axisymmetricCFD modelling approachs extended o rotatingcavities withaxial througliflow in Chapter8, and evaluatedusingtheUniversity or susscx estrig data.
Application of the2D axisymmctricCFD modelappliedto an enginecompressors thendescribed
in Chapter9.
In the final chapter,Chapter10,conclusions rom thework carried out to dateandfurther research
work will be discussed. his chapterwill describe he futurethinking of how thenew2D
axisyminctricCFD technique,modelling the two underlying flow mechanisms, anbeapplied
successfullyo link with a transient2D axisyminctric thennalmodel.7lic modelling will need o be
computationallyeconomicand easy o apply.
7

7/28/2019 Chew Packwood N Turner
http://slidepdf.com/reader/full/chew-packwood-n-turner 30/343
CHAPTER 2
REVIEW OFPREVIOUSWORK
2.1 Introduction
To gain anunderstandingof the fundamentalphysicsof thecomplexflow mechanismwithin the
inter-disccavities,the literaturereview will look at two flow mechanisms.Firstly thebuoyancy-
driven flow within an cncloscd otating disccavity and secondly hecffcct of axial throughflow or
thecross-flow through the borc or thecompressor n the flow within the intcr-disccavity.
Buoyancycflects, relevant o the intcr-disccavity flow. canbe brokendown into two further
categories,a stationarycncloscdcavity anda rotating encloscdcavity. Thesearcdiscussedn
sections2.2 and2.3 below. For thestationarycavity thedriving mechanismor the flow is
buoyancyunderthegravitational forcc.To achievc variousdegrees rbuoyancy differential heating
between hesurraccsor theenclosedcavity havc beenused.Naturalconvection n a rotatingcavity
is achievedby rotating thecavity about anoffset longitudinalaxis.At high rotationalspeeds,
centrifugal force dominatesover gravity andtemperature ifferences ead o ccntrirugally driven
natural convection.This is expected o show similarities to thegravitationaldriven convectionbut
will be modified by theCoriolis force in the rotatingcavity. Section2.4 reviewsthework carried
out investigating hecffcct thataxial througliflow hason the flow within thedisccavities.Different
numericalapproaches singComputationalFluid Dynamics CFD) to solvethese ypesof flows arc
discussedn section2.5. In section2.6 thework on thecross-flowovera stationarycavity is
reviewed.The chapter s completed n section2.7 by discussingpossiblemethodsof numerically
simulating these low typesby usinga steady low two-dimensionalaxisymnictricCFD model
modificd to capture he3D unsteady low cffccts.
S
7/28/2019 Chew Packwood N Turner
http://slidepdf.com/reader/full/chew-packwood-n-turner 31/343
2.2Natural ConvectionBuoyancyDriven Flowsmithin aStatlonaryCosity
2.2.1 lla)lclgh-llknard convection
Rayleigh-Bdnard onvection[Rayleigh 1916,Nnard 19011s thenaturalconvectionof hcat
between wo parallel horizontal platcsplaced n a gravitationalficId where he lower plate s heated
andtheupperplatecooled.For natural convection under gravity the Rayleighnumber s an
appropriatecharactcrisingparamctcr.Rayleighnumber,Ra, s dcrinedas
Ra- PrGr (2.1)
whcrePr s thePrandtlnumbcrdefinedas
Pr-pCpk
andGr isdicGrashof umbcrdcrincdas
IXT9Gr w2
(2.2)
(2.3)
I lolland ct al. [ 1975]rcportcdon theexperimentalmeasurementsor naturalconvectiveheat
transport hrougha horizontal layerof air, betweena heatedplateandanuppercooled plate,
coveringthe Rayleighnumberrangefrom sub-critical to 4x 10⁶.Chandrasckhar1961 derivedthe
critical Rayleighnumber o be 1708.At Rayleighnumbersbelow this die fluid layer is stagnantand
theNusscltnumber s unity. r-orair a Nusseltnumberdependencehat is asymptotic o a 1/3power
on the Rayleighnumberasthe Rayleighnumberapproachesnfinity canbecorrelated rom the
combinedexperimentaldata from this testandfrom dataobtained rom GoldsteinandChu
(Rayleighnumberrange5x 103o Ix 10').
I folland ct al's experimentapparatus onsistedof two parallelcopperplates 560mmby 610mm
and I Omm hick) with theupperone cooledandthe lower oneheated o give a Icniperaturc
differenceof die orderof IOKbetween heplates. 'lic plateswere nserted nto a vacuum or
pressure) essel n which thepressure ould bevaried from 10 Pa o 700kPa.7lic plates%%,rc
spacedat 10mm,25mmand38mmapart.Measurementsf fluid tenipcraturcprorilc at high
9

7/28/2019 Chew Packwood N Turner
http://slidepdf.com/reader/full/chew-packwood-n-turner 32/343
Rayleighnumber showboundary-laycr ypestructures,with a nearly isothermal nnercore andhigh
temperature radientsclose o theboundarysurraccs.n their paper lolland ct al. useda conduction
laycr model to model the layeror stagnant luid next to theplatcs.Between heconducting ayers,
theinner core or the fluid was assumedo beperfectly mixed,dueto eddydiffusion, with the
temperature rofile beingapproximately hatobserved rom thedata.The following Nusseltnumber
correlationwas obtainedror air.
Air Nu - 1+ 1.44 1_1708
+Ra
Ra
] [(5830)1'3(2.4)
I lollandct al. cxtcndcdheEquation .4 oobtain he ollowingcorrclationornatural onvcction
in watcrby
%Vatcr. Nu = 1+ 1.44 1-1708
+Ra 1/3
-I +2.0[Rall'II401 (2.5)1
Ra
[(5830) 1"
In theaboveequations heexpressionsn brackets: J* ndicates hat irthe argument nsidethe
bracket s negative, hequantity is to betakenas zero.
Many otherauthorsgivc furthercorrelationsandror high Rayleighnumbers heproportionality of
Nusseltnumber o Ra'13s a good fit to cxpcrimcntaldata. For example,experimental
measurementsn the range3x 103< Ra< 7x 10⁹arc well correlatedby anexpressionderivedby
GlobeandDropkin [19591, or theaverageNusscltnumber,
müdvm0.069Rall) Pro, 74 (2.6)
Grossmannand Lobse 2000] havederiveda systematic heory ror thescalingof tile Nussch
numberandor the Reynoldsnumber n strongRaylcigh.Wnard convection.Grossmann ndLobse
idcntiricd several egimes n the RayleighnumberversusPrandtlnumberphascspace,dcrinedby
whether heboundary ayersor thecorebulk flow dominate heglobal kinetic andthermal
dissipation,andby whether he thermalor thekinetic boundary ayer is thicker. I'lic theoryassumes
large-scaleconvection oll; Grossmann ndLolisecall this the 'wind of turbulence'and it is based
on thedynamicequationsboth in thebulk and n theboundary ayer. The theory is not applicable
ror very large lrandtl numbers or which theccll velocity 'wind' Reynoldsnumber s :550,where
10

7/28/2019 Chew Packwood N Turner
http://slidepdf.com/reader/full/chew-packwood-n-turner 33/343
thewhole flow is viscosity dominated.Also for very small Prandtlnumber n which tile Nusselt
numberattainsa valueor i, the theoryno longer holds. For large Rayleighnumber ile kinetic
boundary ayer becomesurbulent.BcyondtheturbulenceonsetGrossmannandLohscsaythe flow
is bulk dominated.7be theorydoesnot makeany statement bouthow the icat is transported rom
thebottomto tile top. i.e. Whethert is mainly through arge-scale onvective ransportor Mainly
transport hroughplumesrising from theheatedbottom. Both processesMay Contribute,asboth
create hermaland viscousdissipation.
Extending hework by FostcrandWallcr [1985],Asacd3andWatanabe1989] reportedon tile
small-scalestructureof freeconvectionat high llaylcigh number.which was nvestigatedby flow
visualization andtemperaturemeasurement.I'lic experimentalapparatus onsistedof a square
section ank.with sides900mm, n theplan view and700mindeep. 'lic sidcwalls andthe top wall
were nsulated,whilst thebottomwall could be heated.The top wall (or lid) wasplacedon the
surfaceof thewater.I'lic cxpcdmcnts werecarried out usingwaterwith depths angingfrom
I00mmto 150mm.The licat flux through thebottomwaskeptconstant hroughoutall testing.
Changing hewaterdepthaltcrcd the flux Rayleighnumber,Rar,dcrincdas,
Ra. - j7Fgd'1pCj) a2V (2.7)
whereF is theheatflux (W/m2)at time 1-1. which was obtained rom recordsof the temperature t
four different depthpositionswithin thewater,dcrincdasfollows,
F- pCp[T. (t.
+A' At-' + q, (2.8)21)
(t"
%%,ere T. is thetemperatureat waterdepth z. is the thicknessof the layerwhoseaverage
tcmpcraturc s represented y T., andqj is theconductionheat ossperunit time, which was found
to be less han0.5% of theheat nput.
77heranScof the flux Rayleighnumber n thecxpcrimcntswasfrom Ix 101-1xIOl . 111C
temperature istribution near hebottomwas measured singthreehorizontalsensors ositionedat
heightsof 2mm, 4mm and7mm from thebottomplateandanotherat tile Illid. depth.*ThCluid
motionnearthebottomwas visualized with suspended luminiuni particles lluminated by a vertical
or horizontal ight sheetandphotographed. lic velocity field was obtained rom the lengthof the
particlestreaksandtheexposure ime of thephotographs.n sonicexperiments ile temperaturewas
measured t mid depthusing a sensorattachedo theendof an L-sh3pcd od thatwasmoved
horizontally at 8.3mm/s.
II

7/28/2019 Chew Packwood N Turner
http://slidepdf.com/reader/full/chew-packwood-n-turner 34/343
Ile aim of AsacdaandWatanabe'sresearchwasto investigate hecharacteristicsof the thermal
behaviourandthento estimate heheat ransport ate from theconductionboundary ayer to the
interior core. licy determined hat thedominant rcaturcof the flow field was manyconvection
linesor 'shcct-likc plumes' consistingof several hermals,which transportbeat from theconduction
boundary ayer to thecoreregion.Ile authors oundthat theboundaryheatflux andthe fluid's
propertiesdetermined heaveragecharacteristics rthe tiicnnais, namciy.
* Ilic distance rom theboundarywhere he thermalsaregenerated ct
,f<1013) (2.9), d - 27.1Ra,, 0'3 (for 104< Ra
Theestimate fthe amountorheatransportedway rom heboundary ythermals
20-1112 flFg)V4
cx1.2 Y)2] 1.21 2
p _(1.2x
2
_(1.2lATg = 2.08(a(XI)
/2)
]cx
D/2cxp (772)
](2.10)
[
7- -
whereAT is the temperature xcessat theccntre of the thermalsover theaverageemperature
measuredar above hedescendinglow region.L is the longitudinal lengthscale,B is the
transverseengthscale,P is the time periodduring which thethermalwassupplied with theheated
nuid from theconductionboundary ayerand wherethecoefricicntsorx, y, andt arcdetermined
from thedefinitions orL, B andP, respectively,given below.
LId- 33.ORa..1/4
(ror 107< Raf< 1011)
B/d- 16.ORa., 114 (for 10' < Rq(< 1012) (2.12)
Pald2 -9. M., '112 (ror 10' <,Ra (2.13)y< 10")
Itis intercstingtonotc, FosterandWallcr[19851 andfrom tlicircxperimcntal rcsultscstimated he
thermal ime period in dimensionless orm to beMa,, "". only a small difference n theconstant
whencompared o Equation2.13.
* Theupward elocityof the luid in athcrtnal w,(mls)
IVI=,,2
Ra,, III I 2x 2
cx _(1.2y)2 cx _(1.2t
TO(X),
Cxp[-(L12)] P[ i-/d2-)
]
P[112
71icestimate f licat ransportedy the hcrmalswasalmostequal96%)orthat suppliedrom he
bottom. Icatsuppliedrom hebottom s firststoredn theconductionoundaryaycr,and hen
12

7/28/2019 Chew Packwood N Turner
http://slidepdf.com/reader/full/chew-packwood-n-turner 35/343
mostof it is transported o theupperregionby thermalsgenerated long convection ines in the
form of plumes. t is therefore mportantto modelthe thermalsaccurately.The remainingbeat
transfer allowing for losses n theexperimentapparatus)s through theviscous nteractionof the
core with die conductionboundary ayer.
2.2.2 Natural convection with healed side%valls
As for Rayleigh-136nardonvection.a bodyor i tcrature s availablefor convection n cavities with
heatedsidewalls.Examplesor this researcharcdescribedbelow.
PcngandDavidson[20011carried out a numerical nvestigationof turbulentnaturalconvection
flow (Ra- 1.58x Cý,a relatively low Rayleighnumber) n a confincdcavity with two diffcrcntially
heatedsidewallsby meansof largeeddy simulation(LES). The flow was cxpcrimcnt: lly idcntirjcd
by Tian [19971asbeingcharacterized y a relatively low turbulence evel andthcrtnal stratification.
No visible transitionwasdetectedn theboundary ayeralongthe hcatcd/coolcdvertical walls.A
dynamicsub-grid-scale SGS)model modificd for buoyancy low wasused n the simulation.Pcng
andDavidsoncompared heir numericalpredictions
with Tian's testdata.
The naturalconvection low experimentcarried out by Tian usedanair-fillcd cavity with relative
dimensionsof W- D/2, If - D/2 andD in thex, y andz (spanwisc)directions.The two opposite
vertical walls, locatedat x-0 (hot wall) and x-W (cold wall) were maintainedat constant
temperaturewith a temperature ifferenceorAT - 40 K, hot wall to cold wall. The Rayleigh
numberRa- (g 0 AT 113Pr)/v2was 1.58x109.7lic flow wascxpcrimcnt, 1ly dentificd asbeing
charactcriscdby low
turbulenceand no visible transitionwasdetectedn theboundary ayeralong
the icated/coolcdvertical walls. Thebottom (y - 0) andtop (y - 11)walls werehighly conducting
boundaries.Througha well controlled experimentalsct-up,Tian claimedthat thecavity producesa
2D mean low in themiddle sectionof thespanwisedirection(at z- D/2), whcrc themeasurements
hadbeenmade.Thermocouplemeasurements ere obtained or theair temperaturen thecavity.
Two-dimensional LDA wasusedror velocity measurements.
In flic LESsimulationa
finemeshwas usedclose o
thehot/coldvertical walls andnear o the top
andbottomwith 12-13nodesclusteredwithin thenearwall distance,Y"(-Puty/p) < 10.No-slip and
adiabaticwall conditionswere used or thespanwisewalls. The time stepused n thecomputation
13

7/28/2019 Chew Packwood N Turner
http://slidepdf.com/reader/full/chew-packwood-n-turner 36/343
wasAt - 0.0 131o,whereto-II/ q(g 0 AT 11).The resultsfrom the LES simulationwith tile
dynamicSGSmodel(mean low streamlinesn thex-y plane)showthatwithin thecavity several
circulating flow regions exist away from thencar-wall boundary ayer flows. Therecxist several
smallercirculations(orrolls) next
to thewall
flows thatarccomparativelystrong.
With increasing
Rayleighnumbers, heboundary ayer flow maybemore ntensiveandthencighbouring rolls could
beexpected o mergewith eachother to ronn a largecirculating motion around ile core.Pcngand
Davidsonconcluded hat tile LES simulation is ableto reasonablyeproduceheglobal mean low
andthermalficld, as validated in theexperiment.ThedynamicSGSmodel is ableto yield mean
flow quantities hatagreewith the measured ata,however herearc somediscrepanciesn the
prediction of turbulence,particularly in theouter regionof thencar-wall flow where heboundary
layer interactswith thecirculating core region.Pcngand
Davidsonshowed hat the timc-avcragcd
contribution of theSGSshcar stresss significantly smaller han ts resolvablecounterpart,which
illustrates hat thesub-gdd scale urbulenttransport s a secondary ffcct. The mostvisible SGS
contribution is not in thevicinity of thewall but in the regionabout hemaximum velocity in the
boundarylaycr. In theviscous/conductivcsub-laycrorthc boundary aycrclosc to the
licated1cooledertical walls the flow tends o form strcak-likc structures,which do not however
emergen the ncar-wall flow alongthe horizontal top andbottomwalls, whereflow tends o be rc-
laminarizcd.
2.2.3Nllycd horizontal and vertIcal convecilon
Obviously, practical problems may include both vertical and horizontal thermal gradicnts,
combining the types or flows discussed in sections 2.2.1 and 2.2.2 above. I lerc the results from
Kirkpatrick and Bohn's [ 19861studies which include a varicty of heating configurations (and is
particular relevant to the present work) arc discussed.
14

7/28/2019 Chew Packwood N Turner
http://slidepdf.com/reader/full/chew-packwood-n-turner 37/343
Mixedcavity naturalconvoction
Lucits and wall,2 oach
Cooling/healing
plaie, 4 each
Test cell welt 4 each
L-11CM8119O(Iod Coll
$I
I kpMnwfoTow ConlIguivoitons
rýlir
-ýcj-cIf
rc
If 11 if
lic 1111cc Ilcxr 111111C
Figure 2.1Schematicor file test cell usedIn tile Kirkpatrick and Bolln experiments and tilefour experimental test configurations 119861
KirkpatrickandBohnperformedncxpcrimentil nvestigationn high Rayleigh umber atural
convection ithin acubewith four difTercntonfigurationsrdiffercritiallyheated ndcooled
verticalandhorizontal urfaces. schematicrthe testca and he estconfigurationsreshownn
Figure2.1.All theconfigurations erevariations r theheatingrom belowcase. heexperiments
conducted ere odetermine ussclt-llaylcigh umber orrelationsnd odeterminehe low
patternsnd emperatureistributions. he ourconfigurationsestedwere:
" Heatedbottomandcooled op and conductingsidewalls, IIC case
" licatcd bottomand cooledtop with oneheatedandonecooledside wall, 1111CCase
" Heatedbottomand cooling from abovewith two cooledside walls, IICCC case
"I lot andcold sidewallwithaheatcd ottomandhcatcdop, II If ICcase
Ilie cubicalenclosurehadan interior dimensionof 305mm.Theworking fluid used n testswas
dcioniscdwater. lic temperature ifTercntialchosenn thedefinition of theRayleighnumberwasdic temperature ifferencebetween hehot andcold walls. Temperaturemeasurementsn the
enclosurecoreweremadeusinga thcrmocoupIcprobe.which couldbe moved vertically androtatcd
is

7/28/2019 Chew Packwood N Turner
http://slidepdf.com/reader/full/chew-packwood-n-turner 38/343
aboutheccntrc ineof thecubicalenclosure.'lic probe ouldnotbeplaced loserhan8mm rom
the opandbottomsurfaces.he engthscaleusedwas he nteriordimension rthc cube,305mm.
Theheat ransfermeasurementsill beexaminedirst,rollowcdbyadescriptionof tile flow
patternsobserved or the four testcasesand finally the fluid temperature istributionswill be
discussed.
2.23.1 Heat transfer measurements
It mustbenotedthat thetemperatureused n thedcrinition orthe Nusseltnumber s thedifference
bctwccn hewall temperature ndthebulk fluid temperature. be experimentallyderivedaverage
Nussclt-Raylcighnumber icat transrcrcorrelations or each estconfiguration were:
HCcase
Nu-0.09861ta"3 forTopandBottomwalls (2.15)
HHCCcase
Nu - 1.10Rai0.236 for Top andBottomwalls (2.16)
Nu - 0.141Raho-313or Sidewalls (2.17)
HCCCcase
Nu-0.3461tao, 285 for Top, BottomandSidewalls (2.18)
HHHCcase
Nu - 0.223 Ra, " for Top wall (2.19)
Nu - 2.54 ltalo,212 for Bottom wall (2.20)
Nu - 0.233 RahO,86 for Side walls (2.21)
71c I ICcase howedhat hecxpcrimcntallyerived icat ransfer orrelation, quation .13,
compares ell with I follandct al.s [ 1975] onduction-laycrodelequation, amcly
Nu- 0.103 ta113
(2.22)
At this point it is worth comparingKirkpatrick andBohn'shcat ransrcrcorrclationswith those
corrcl3tionsdcrivcd by othcr authors.Thecorrclationscanbecornp3rcdo thestandardand
16

7/28/2019 Chew Packwood N Turner
http://slidepdf.com/reader/full/chew-packwood-n-turner 39/343
gcncrally scdmcanicat ransfcr orrclationsor natural onvcctionromahorizontal latcand
froma vcrlical platc.
Forahorizontalplateof lengthL, Fislicndcn ndSaundcrs19501orrelation's rc;
NULm0.54 Rk 1/4 105< Ra< 2x 10⁷ (2.23)
NUL- 0.14 ROL3 2x 10⁷< Ra< 3x 10¹⁰ (2.24)
andfor a vcrtical piate or licight L, Wcisc [19351andSaundcrs1936] corrclation's are;
NUL 0.59Rk 114104 Ra< 109 (2.25)
NULm0.13ROL 113 109 < Ita< 10 (2.26)
Also Jakob[19491dcrivcd the following corrclations or naturalconvcction n an cncloscd
horizontal irspacc;
Nux - 0.21 Ra 1/4 104< Ra< 3.2x101 (2.27)
Nux - 0.075Ra113
3.2x10³< Ra< 107(2.28)
and oran cnclosedcrticalair spacc;
Nux - 0.2 (Ux)*"v Ra." 2x10⁴< Ita < 2.1x 10⁵ (2.29)
Nux - 0.071(Ux)*"9 Ra113 2.1x 10⁵< Ra< 1.1 W (2.30)
wherc x is the clearancc bctwccn the platcs, L is the platc Icngth, and the imperaiurc diffcrcnce isdefincd as the diffcrcncc in the metal tenipcraturcs orthe two plaics.
FislicndcnandSaunders orrelationshavemultiplying factors hatare approximately wice the
factors or theJakob'scorrelations or botha horizontalplateanda vertical plate in freespace,but
thedefinition of the temperature ifference s not thesame.For die enclosed avitiesthe
temperature ifference between he two walls is used,whilst thewall to bulk air temperatures used
for theplate correlations, his will account or most of thechange n themultiplying factors.The
Kirkpatrick andBolin correlations or an enclosedcavity showtheRayleighnumberpower to lay
between lic values0.25and0.333which appear n theabovecorrelations.No disccmabicpattern
17

7/28/2019 Chew Packwood N Turner
http://slidepdf.com/reader/full/chew-packwood-n-turner 40/343
for themultiplying actorcanbeobserved hencomparingheenclosed avitycorrelationso the
freespace erticalandhorizontal latecorrelations.
2.2.3.2Flow patterns
KirkpatrickandBolinuseda shadowgraphoshow he lowpatternwithinIlic cube.Tbcir
observationsrcsuminariscdelow.
HC case
Thermals osefrom thebottom surfaceandfall from thetop surf3cc.The thermalswere of varying
characteristicsizes,averagingabout I Onim n heightand5mm in width. No overall flow pattern
wasdisccmablc,other thanthe mixing motion of thethcrinals.The thermalsappearedo bereleased
periodicaly from the top of a boundary ayerabout Inini away from the surfaceand propagateat
about50mm/s.Only the largethermalswere ableto penetrateo theoppositesideortic cavity. nc
thermalsusuallymoved at sonic randomangle, ess han45* to thevertical.
HHCCcase
Tbcrewasan nteraction roic thcmialsand heboundaryayer,with tile thermalshinedbytile
sidcwallboundary 3ycrsntotriangularegionsn theupper oldwall tocoldwall comerand o the
lowerhotwall tohotwall comeror tilecavity.KirkpatrickandBohn eport hat ileoverall low
pattern nd heconvection f the hermalswerealong heperimeter r tileenclosuren a clockwise
direction,wlicnviewedwith thehotsidewallontheMI. I'licrmalscausedheboundaryayer o
separatetsomepointalong hehorizontalraverse. irkpatrickandBolmnotedhat hevertical
andhorizontalNussclt
numbers erevery closeo the imitingcases, nd nferredhat he hcrmil
interactionsaveonly asmalleffectontheoverallheat ransrcrrom hesurfaces.
HCCCcase
*nIeoverall flow patternwasa centralplurne rising from thehot lower surracc,which divergedat
the top of thecavity and returnedalongthecold sidewalls.The rising thennalswere ocatednear
thecentrcorthc tankandthe falling thmnals wcrc locatednear hecold sidcwalls.77he atureor
thethennalconvectionon the sidewalls wasa rnixcd freeandrorcedconvection ype,which
18

7/28/2019 Chew Packwood N Turner
http://slidepdf.com/reader/full/chew-packwood-n-turner 41/343
explainedwhytheNusscltnumbers erehigher or thiscasehan or theothercases. hesidcwallheatransfersapproximatelyqualo thevcnicalheat ransfer.
HHHCcase
KirkpatrickandBolinobservedhat hcrcwasvery ittle activity n thecoreof thecavity,especially
nearhe opsurface.'lic motionof the hermalswasconfinedowithin I Ornm f theheated ottom
plate.Boundaryayerswerepresent nthesidcwalls, utnotalong hctopsurface. emperature
stratificationn thecoreoccurred ue otheheatedopplate. 'lic low licat ransferrom he op
surfacesdue o thestable tratificationn thecore.whichalso educeshesidcwallheat ransfer.
2.2.3.3Temperature distribution
I'lic temperature istributionsmeasured y Kirkpatrick andBolin showed he thermals ising from
thehot bottomandfailing from the top of the testcell. The I IC configuration showed hemost
regular hermaldisturbanceorthe fluid from a baseline emperature,with otherconfigurations
beingmore rregular.For the I IC case hemagnitudeof thetemperature isturbancewas of the
orderor IK andperiodor theorderof 4s. hican temperature istributions n thevertical mid-planc
orthe cavity for the IIC, 111CC andI ICCC configurations showed hecorefluid temperatureo be
within 0.5K of thebulk temperature bulk temperature- arcweightedaverageemperature f the
heatedandcooledwall temperatures). or the 11111C casewhere hetop is heatedhecore fluid
temperaturewas within 4K,of thebulk temperature.The resultsof the I fill IC caseshowed hata
nonzerovertical Rayleighnumber,Rah or temperature ifferencebetween op andbottom)was
required o producea &-stratified coreandthe thermalsdid not act as a mixing mechanismor the
core n this case.Both the I IC andIII [CC mean emperature rofiles showa small temperature
reversal,near he top andbottomsurfaces,attributed o thepersistence f the thermals raversing
across hc enclosure.
Resultsrom nvestigatinghe nfluenceof differentverticalRayleigh umbersnthecore
temperatureistributionshowcdhat or the if ICCcase, s hcverticalRayleigh umber%vas
increased,he evelorcorctemperaturetratificationwasdccrcascd. irkpatrickandBohnalso
showcdhat heonsetof stratificationwassudden, t a Rai, rabout0.65x1010.s the einpcrature
19

7/28/2019 Chew Packwood N Turner
http://slidepdf.com/reader/full/chew-packwood-n-turner 42/343
of die bottomwas ncreasedhe ormation f thermals ecameigorous nougho causemixing n
thecoreof thecavity.
2.23.4 Conclusions
Kirkpatrick andBolin concluded hatgenerallytheheated loor promote$mixing in thecavity and
tends o eliminatethe stratificationseen n the limiting caseof a horizontaltemperature ifference
alone.Although the temperature isturbances ssociatedwith thermalsappearedo persist or only a
smalldistance rom thehorizontalsurfaces,he thcrtnalsarccffcctivc in mixing tile core fluid. For
thevertical temperature ifferencecase heonly fluid motion in tile cavity wasthatdueto tile
thermals.17he eat ransfer rom theheated loor compared avourablyto a conduction-laycrmodel.
For thehorizontal temperature ifferencecase herewas rotationof the fluid core with a horizontal
velocity component o the thermals.The heat ransferfrom thehorizontalsurfaceswasnot strongly
affectedby thepresence f a horizontaltemperature ifTcrcncc;however he thermalsdid affect the
heat ransfer rom tile vertical surfaces. [cat transferfrom thevertical surfaceswas reduced f the
top washeated,dueto thestablestratification in the top portion of thecavity core.
I'lic KirkpatrickandBohnexperiment ill berevisitedn Chapter where3DCFDan3lyscs ill be
comparedo theexperimentalata.
2.3Convection Flow %illhin a Rotating Enclosed Cas-Ify
I ligh Rayleighnumbernaturalconvectionundercentrifugalaccelerationhas beenstudied
cxperimentally andcomputationallyat AachenUniversity. Bohnct al [1993,1994] reported
experimentalnvestigations or threerotatingcavity geometries.To achievea centripetalor radial
beat lux insidetheannularcavitiestheouter radii cylindrical wall washeatedandthe inner radii
cylindrical wall cooled.Both end surraccsor theannulus discs)werethermally insulated.Two or
theconfigurations, abelledA and11, Figure2.2) wcrc for closedannuli rotatingaround heir
horizontalaxis.The radius of the innercylindrical wall (ri- I25mm)andthewidth (s- I 20mm)or
theannularcavity was
thesame
or both theseconfigurations.
ForgeometryA theouter cylindrical
wall radius was rý-335rnm,and for geometryB rrMmm. The third cavity configuration,C, had
thesamedimensionsasfor 11, ut 8 radialwalls (all thermally insulated)divided theannulus nto
20

7/28/2019 Chew Packwood N Turner
http://slidepdf.com/reader/full/chew-packwood-n-turner 43/343
45*segments.he est ig hada maximumotorspeed f 3500 cvhninandamaximum avity
pressurer4 bar.The cnipcraturcf theoutercylindricalwall couldbevariedupto I00"C,whilst
the nnercylindricalwall couldbecooledo 15*C n thesununcr nd o 8*C n thewinter.
11
A
C
Cavity
A
11
C
ri
ri ro r. H Hirm a0
(mm) (mm) (mm) (mm) (-) (mm) (-)
125 355 240 230 0.96 120
125 240 182.5 115 0.63 120
125 240 182.5 115 0.63 120 45"
Figure 2.2 Dimcnilons of the annular cas, 11csor three experimental test configurations.
Usingthemeasured verall heat ransferBohnct al wereableto derivea Nusscltnumber
correlationfor each estconfiguration.71c temperature ifTcrcncc,AT. used n thedcrinition orGrashofnumber s thetemperature etween hehot andcoldcylindrical walls. The resultsmaybe
summariscdasfollows.
21

7/28/2019 Chew Packwood N Turner
http://slidepdf.com/reader/full/chew-packwood-n-turner 44/343
ConfigurationA, (I I/r,. - 0.96ands/r. - 0-5)
Nu - 0.246 Ra+ .221 1xI Ol< Ra#< x 1012 (2.31)
Configuration 11,11 r. - 0.63ands/r. - 0.66)
Nu - 0.317Ra#0*211 IxI 0'? Ra#< x 1012 (2.32)
Configuration C, (I I/r., - 0.96,s/r,,, - 0.5and45* scctor)
Nu- 0.365 la#'O-13 1x 10⁷< Ra4< IXIO12 (2.33)
where herotationalRayleighnumber,Ra#- Gr Pr,andtherotationalGrashofnumber,Gr#- r. w2
ATL3P2/(T. p2) with L- 11,r. -(ri+ r.)12andtheNusscltnumbcris dcrincdas NU-414A
where 4 is theheat lux and4, is thc licat transferby conductionalone.
Comparing the results for configuration A widi configuration 1)shows that the change in geometry
hasonly a weak influence on the licat transfer in the rotating annulus. 11c insertion orthc
separation walls, as for configuration C, attenuates the relative circumfcrcntial velocity inside the
cavity, resulting in a decreaseorthe radial component ortim Coriolis force. The natural convection
flow inside the cavity is strcngtlicncd so the heat transfcr is increased. Comparing the results from
Configuration C to those from B confirmed the increase in licat transfer for the separatedwall sector
cavity.
In addition to theexperimentalwork, Bohnct al also carriedout a numerical simulation(CFD
analysis) or thesectoredannulusgeometry,configurationC. Both steadyandunsteadyhree.
dimensionalanalyseswereperfornicd usinga coarsemesh.All computations%%-crcarriedout with
thedensitycalculatedby the idealgas aw andthe flow wasassumedo be laminar, .e. Direct
NumericalSimulation(DNS) - like solutionswhcrethe full Navicr-Stokcsequationsarc solved
directly. Ilicir steadysolutionsshowcd hat the flow insidethesegmentwas confincd to the
boundary ayerson thecylindrical and radial walls with virtually no relative motion in thecore.The
corewasvirtually isothcrmal(with T z:1/2(TI+Tc))with noconductionoccurringin theradialor
22
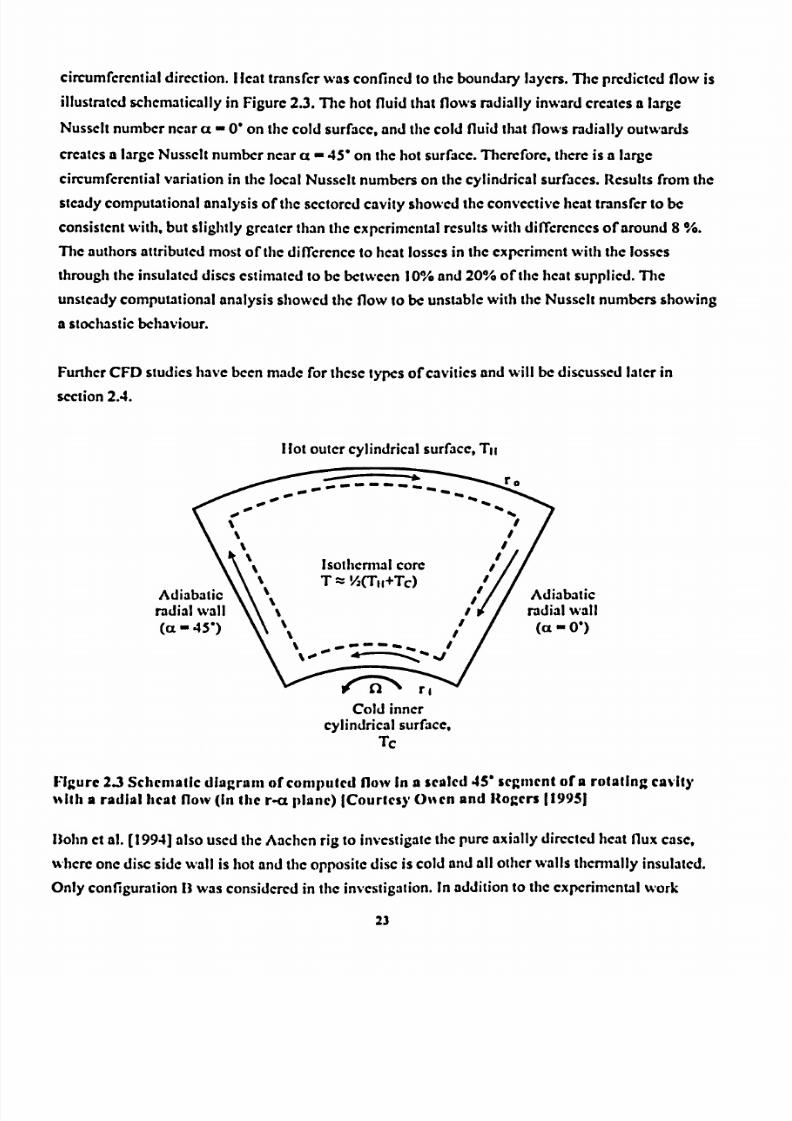
7/28/2019 Chew Packwood N Turner
http://slidepdf.com/reader/full/chew-packwood-n-turner 45/343
circumrcrcntialdirection. I lcat transrcrwas confincd to theboundary ayers.77he redicted low is
illustratedschematically n Figure2.3.77hehot fluid that flows radially inwardcreatesa large
Nusseltnumber near ct - 0' on thecold surface,andthecold fluid that flows radially outwards
createsa
largeNusscltnumbernear ct -
45'on the
hotsurface.
Thcrcrorc. there sa
large
circurnrcrcntialvariation in the local Nusscltnumberson thecylindrical surfaces.Results rom the
steadycomputationalanalysisor thesectoredcavity showed heconvectiveheat ransrcr o be
consistentwith, but slightly greater han theexperimental esultswith differencesoraround 8 %.
Theauthorsattributedmostorthc differenceto heat ossesn theexperimentwith the losses
through he insulateddiscsestimated o be between10%and20%of theheatsupplied.711c
unsteady omputationalanalysisshowed he flow to beunstablewith the Nusscltnumbersshowing
a stochasticbehaviour.
FurtherCFD studieshavebeenmade or these ypesof caviticsandwill be discussed ater in
section2.4.
I ot outcrcylindricalsurface, i,
Adiabatic
radialwall45*)
..
of
0000
IsothennaloreT -- V2(Til+Tc)
Adiibatic
(ctradiit wall
%1(a - 0)
%«...
- M.,«b
1
%, 0wo
Ni
V001-INCold nner
cylindrical surfacc,TC
rigure 2.3Schematic dIagram or computed flow In a scaled45' segmentof a rotating cavity
%%khradial heat flow (in the r-a planc) lCouricsy O"cn and Rogers119951
Bohnct al. [1994] alsoused heAachen ig to investigate hepureaxially directedheatflux case,
whereonedisc side wall is hot andtheoppositedisc is cold andall other walls thmnally insulated.
Only configuration11was consideredn the investigation. n addition to theexperimentalwork
r
23

7/28/2019 Chew Packwood N Turner
http://slidepdf.com/reader/full/chew-packwood-n-turner 46/343
numcricalalculations crealsoconductcd.hederivcd icat ransfcr orrclationrom he cstdata
for thisconfigurationwas,
Nu - 0.364 Rz40.124 2x)0%< Ra< 5x 10¹⁰ (2.34)
Conclusions drawn frorn the axial heat flux work were th3t the numerical and experimental data
were in quite good agreement, with exception of high Ita-riumbers, %%,ere the numerical analysis
predicted higher heat transfer than the experiments showed. 77heheat transrcr ror the axial heat flux
case is much smaller than that ror the radial directed heat flux case.Comparison of the level orhcat
transfer between the pure radial and pure axial directed heat flux cases shows that the radial heat
transrcr is the important mechanism for cavities with the combination oraxial and radial
temperature distributions that occur in gas turbine compressor disc cavities.
Bohnct al's experiment ill berevisitedn Chapter %%,ere urther3D CFDanalyses, ith various
Rayleigh umbers, ill becomparedotheexperimentalata.
2.4 Rotating Ca%ty%s
th Axial Througitnow
2.4.1 SingIc ca%ly Investigations
As noted in Ch3pler 1. the flow in the inter-disc cavities becomes highly complex when the discs
arc heated with the flow becoming three-dimensional and time dependent.71is complexity of the
flow has been revealed by a number orcxpcrimcntal studies. much orthe published work originates
from the University orSusscx. For example, Farthing ct al [19921 pcrrormcd an experiment to
investigate the flow inside a simple rectangular rotating cavity with a central axial througliflow.
2.4.1.1hotlicrnial flow
Farthingct al. s [19921simplemodel ora rotatingcavity with axial throughtlow is shown n Figure
2.4.Two discsoroutcr radius,b, and inner radius,a, areseparated y anaxial gap,S.17herotational
speedor thecavity is n, the flow rotational speeds toandthebulk averageaxial velocity orthc
axial throughtlow is W. Fora fluid kinematicviscosityv, therotationalReynoldsnumber s dermcd
asRe. -0 b2 v, andtheaxial ReynoldsnumberasRe,-W di, v, wheredh s thehydraulic
24

7/28/2019 Chew Packwood N Turner
http://slidepdf.com/reader/full/chew-packwood-n-turner 47/343
diameteror oic inlct. For a cavity with an innerdrive shail or radius, r. dh- 2(a. r') and for one
without an inner drive shaft,dh- 2a.
I Stroud I
I Down*"ancisC
rigure 2.4 Nomenclature for axial throughtlow and Isothermal flow structurc. (I'arthing ct al)
A further non-dimcnsional parameter, the Rossby number, Ro links the effects of rotation and
inertia of the axial througliflow. This is defined as the ratio or the incan velocity of the throughflow
to the tangential velocity at the borc radius;
ROM
V/04M
PRc.
,1
(2.35)j2a(a-rjRc
Laser llumination flow visualisationandLaser Doppler Ancmomctry(LDA) wereusedby Farthing
ct al. [19921 o studythe flow structure n unheatedor isothermal)andheatedcavitieswith a/b
0.1. A seriesof schematicdiagramsof the isothcrmal low structure s shown n Figure2.5. I'lic
principal parameters fTccting he resultingflow arc the Rossbynumber,Ro,andthegapratio, G
Vb. For no rotation,Ro- co, he througliflow generates neor more(dependingon gapratio)
axisymmctrictoroidal vortices.Rotation has hecffcct or suppressinghe toroidal vortexand
dcstabilising hecentralthrougliflow, creatinga changen behaviourof thecentral et. This is
charactcriscdby a numberorrcgimcs oraxisyrnnictric andnon-axisymmctricvortex breakdown.
25

7/28/2019 Chew Packwood N Turner
http://slidepdf.com/reader/full/chew-packwood-n-turner 48/343
Gm0.533
(1) (1) (ill)Ga0.267
(IV) (V)
(1) (9) Pv)(d) Go 0.133
(v)
(1) (il) (iii) (iv) MRo (stationary) 25 421
(Shadedareas representregionsIntowhichsmokeIsconvectedrapidly.
11-1gure.5 Visual Impressionsof smokepatterns In an Isothermal rotating mity %%khxialthrougliflow: Re. - 5000(I'arthing ct al. 119921)
26

7/28/2019 Chew Packwood N Turner
http://slidepdf.com/reader/full/chew-packwood-n-turner 49/343
For urbulentlow (Rc,> 2000)and ora constant ap atio ourscparatecgimcsof voricx
brcakdownwere dentifiedas heRossby umbers decreasedfromaround100 oa valueof less
than1).Theseweregiven lic followingnamesin orderof decreasingossby umber):Modc Ia
(21:5Ro:5 100),Nfodc2a(2.6:5 Ro:52 1).Modc Ib (1.5:5 Ro:52.6)andModc 2b(Ro:5 1.5).Fora
gap atioof G-0.533, thercspcctivc oundariesf theseegimes ccuratRo= 21-23,2.6and1.5.
TheMode regimes rcassociatedith anon-axisymmctricchaviour f thecentralhrougliflow;
Modc2 behavioursassociatedithaxisymmetricehaviour. ecreasinghegap atioappearso
suppresshe ormationof Modc a behaviour. urther ctailsorthe testsanddescription f the
modes f instabilityaregivenbyOwenandPincombe1979]andby OwenandRogcrs1995).
2.4.1.2Nonisothernial flow
When the cavity is heated, the Sussex research has indicated that significantly more of the
throughflow penetrates into the outer part of the cavity. Most observations of tile heated now
structure were made with gap ratios of G-0.124 and 0.267, and a surface temperature distribution
that decreaseswith radius. It was found that this gave a clearly defincd flow structure. Long and
Tuckcr [I 994a] found that the flow structure inside the cavity is heavily influenced by the radial
distribution or surface temperature imposed on the discs. Flow entered the cavity in one or more
radial arms, bifurcated near the outer radius forming one or more pairs orcirculations in the radial-
circumferential, r-O plane. A schematic diagram, in the r-O plane, of the heated flow structure is
shown in Figure 2.6. One circulation rotated in the samedirection as the discs, called the cyclonic
region; the other circulation rotated in the opposite direction, which is called the anticyclonic
region. Under most conditions the regions orcirculations did not merge but were separatedby a
region in which the fluid did not appear to enter. The cyclonic region has a lower pressure than that
of the anticyclonic region. In the experiment with a surrace temperature distribution that increases
with radius it was not possible to obtain clear visual or photographic evidence of the flow structure
in the cavity. I Iowcvcr the overall impression was that significantly more of the central througliflow
penetrated the cavity, the higher velocities leading to an ill-defined flow structure especially in the
region adjacent to the peripheral shroud. These difTercnccs in flow structure may be qualitatively
explained from consideration of thermal stratification in a centrifugal rorce field. A fluid
temperature that decreases
with radiushas
a stable stratification,whilst a fluid temperature that
increaseswith radius has an unstable stratification. resulting in incrcaicd radial mixing. It appears
that heating the cavity introduces buoyancy forces that act to dcstabilise the central througliflow.
27

7/28/2019 Chew Packwood N Turner
http://slidepdf.com/reader/full/chew-packwood-n-turner 50/343
Farthing 1988] found that whenonly theshroud washeatedasimilar flow structure o one
mentionedaboveoccurs, cxccpt therewere multiple radial arms and multiple separation ones.
When both theshroudandthediscswereheated, hesame low structureas for theheatedshroud
wasobserved.T`hcseadial arms appear o exchange luid with thestrong cyclonic flow adj3cent o
theshroud.The cntirc flow within thecavity routes at an averageangularvelocity, w, which is
foundto vary with thedisc gap ratio (axial distancebct%%,cn thediscsto thecavity outer radius).
and s different from (1, theangularspeedorthc cavity. Carcrulexaminationof high-speed ideo
recordingswas used o determine heratio co/fl, and t was found that0.9 < (,A) <I for the Rossby
number,Ro-%V/fla,regionof 0.57< Ro < 9.2.
I
rigurc 2.6Schematic diagram of llic heated flow structurc In r4 plane
Farthingct al (1992)measuredheheat ransrcrrroin thediscsora cavity with a/b- 0.1 andG -s/b
- 0.138. 'licy roundthat for symmetricallyheadeddiscs,where he level andradialdistribution or
temperatures the same, heheat ransferwasthesameon eachdisc, implying symmetryorthe
flow in themidaxial plane.For asyninictricallyheateddiscs, heheat ransferon thecold disc was
round o be lower thantheheat ransferon thehot disc.The radial temperature istributionalsohad
a significantcffcct on the local heat ransfer.The radial variationorthe heat ransferrallowcd the
28

7/28/2019 Chew Packwood N Turner
http://slidepdf.com/reader/full/chew-packwood-n-turner 51/343
discsurfaceemperatureistribution.Forasurfaceemperaturehat ncreasedwith radius,heat
transfcr lso ncreasedndvice versa.From heheat ransrcrestdata,Farthing ta].derivedhe
followingheat ransfcr orrelationor adiscsurfaceemperatureistributionwherehe cmpcraturc
increases
withdisc
radius:Nis 0.0054Rc*,3Gr*-'s
%%-hcrcr = 112rl7(T,- T,,,Xb- r)' v2 ,
T, is thc disc tempcraturcand Ti. is thc inIct fluid
tcmperaturc.
xr.._q(b-
A.T,- TOT94
Theabovc orrclationEquation .36a analsobcexprcsscds,
(2.36a)
Nu - 0.0054Rclo" Rco'12PAT)" (rl bX(bl r) - 1)"" (2.36b)
%%,crc heNusscltnumbcr,Nu=qr
!-AT
Thesignificanceof Equation2.36 is that it suggestshe flow and icat transfer n the(narrowG-
0.138)cavity occursas
aresultof rotationally
induced aminarrrccconvection.71is is supportedby
thework or Long andTucker [1992,1994b], who reportedon licat transrcrmeasurementsrom the
Shroudtscir(ror a/b - 0.1 and s/b- 0.13). Tlicy notedthat thedisc surface emperature istribution
appearso have ittle cffcct on theshroud icat transrcr,providing thecavity air temperatures used
asthercrcrcncctemperature o define theNusscltandGrastiornumbers.The measured hroud icat
transrcr s then in reasonable greementwith the licat transrcrpredictedusingan established
correlationror natural convectionrroin a horizontalsurracc.Tlicse findingsarcalsoconfirmcd in
themultiple cavity
investigationsof
Longct al.
(2003]and
Long ct al. [2006]. The licat transfer
from a cavity with a wider gap ratio (G - 0.36,alb = 0.1) was nvestigatedby Long (19941.
Increasinghegap ratio wasroundto increasehelicat transrcr. n the range4< Ro< 5, therewas a
significant increaseby a factoror 3; ror Ro < 4, theresultswereapproximately heSallie; or Ro>
5. therewas a smaller ncreaseby a factoror2 in Nusscltnumberwith gapratio.Two mechanisms
were dentified asbeingresponsible or the licat transrer, otationally inducedbuoyancyanddirect
influenceor thecentralthrougliflow.
TuckerandLong (1998]carriedout furthercxpcrimcntalwork, aiming to measurehe temperature
field insidea rotating cavity. Tlic cavity used n theexperimentconsistedof two steel lat faced
29

7/28/2019 Chew Packwood N Turner
http://slidepdf.com/reader/full/chew-packwood-n-turner 52/343
discswithan nnerradiusa-48.5mmandouter adius, -484.5mm ndseparatedyadistance,
s-65mm.Tlicscdimensionscorrespondogap atio,G-s/b,of 0.13andan nlct radius atioa/bof
0.1.Theperipheralhroudwasmaderomacarbon-fibre poxy esincomposite. ach avitydisc
was ittedwith5 separatennular .8kW heaters,nabling ontrolof
theadial
distributionr
temperature.heshroud ouldalsobe heated ia anelectrical eater ystem. he nner acesorthe
discswerecoveredwith Imm hickglassibre nstrumentationatsowhichapproximately0
thermocoupleseremounted.lic cavityair temperatureasmeasuredsingaprobe onsisting f
threehermocouplesositioned tthenon-dimcnsionaladial ocations,/b-0.37,0.6and0.87and
theprobewasplaced alfwayalong hecavity at s/2.Tbrccdiscsurraccemperatureonditions
wereconsidered;isc emperaturencrc3singwith radiusandunheatedhroud, isc emperature
decreasingith radiusandunheatedhroud, ndunheated
iscswitha
heatedshroud.
`hcschree
conditionsepresent ngine onditions,ollowingan acceleration,ollowingadecelerationand
during heengine cceleration,espectively.uckerandLong'sexperimentalnvestigationhowed
againhat hecavityradialandcircumrcrcntialemperatureistributions erebothstrongly
influenced ycavitysurfaceemperatures.henhediscswereheated, ignificant ircumferential
cavityair temperatureariationswereobserved,howinghe low tobe hree-dimensional.Vhcn
theshrouds heated nd hediscsunheated,ocircumrcrcntialemperatureariationswere
observed.ests
wereconductedoveringarange f rotationalReynolds
umbers401:
5Rc#:
8x 10⁵ ndaxialReynolds umbersx101: Rc,:S4x 104 nd mportantly howedhatboth he
rotational ndaxialReynolds umbersad ittle cffcct onthecavityair temperatureistributions.
Temperatureime raceswereusedo infcr that heangular elocity atio WO0, w arc hecavity
and luidangular elocities,espectively)s inverselyproportionalo theparameter AT., which
isconsistent ithprevious IDAmeasurementsy Farthing tal [1992].1 cre0 is tile fluid thermal
expansionactor -I /Ti.,Ti. is the nlctair temperature)ndAT.,, - Tn.. - TI.whereT.., is the
maximum avitysurfaceemperature.
Results rom a numericalCFD 31),unsteady low analysisby Tuckcr [19931showcdqualitativc
agreementwith thevisualisationresults n predictionorthe flow structures cfcffcd to earlier.For
thediscand shroud icat transferTuckcr showed hat thederived ocal Nusscltnumbers Nu -qL
AT k) agreed easonablewell with themeasured eat ransferdataand with theFarthingct al.
correlation.
OwenandPowell 20041made elocityand icat ransfermeasurementsn a singlecavity esearch
rig with centralnletandexit,a/b-0.4, s/b-0.2 with ust thedownstreamischeated. ests
30

7/28/2019 Chew Packwood N Turner
http://slidepdf.com/reader/full/chew-packwood-n-turner 53/343
were carried out for 4xIO5< Re#<3.2x 10⁶and lAx I 01<11c, <5404.7lictimc-average LDA
measurements of tangential velocity showed that near to solid body rotation occurs in the cavity.
0.96 <w/ 11r< 0.99, when the downstream disc was heated to 75K above the inlet air temperature,
for the range of dinicnsionlcss radii 0.67 < r/b < 0.97. The radial velocity was found to be
approxinutcly two orders of magnitude smaller than the tangential velocity. 71c timc-avcrage
tangential velocity was also found to increase above w/ 11r-I when the temperature between the
disc surfaces and the inlet air was reduced to below approximatcly 40K. A spectral analysis of the
velocity measurements revealed behaviour that was consistent with one, two or three pairs or
cyclonic and anticyclonic vortices in the flow ficid.
2.4.2,%Iultlplccavity Investigations
An earlier studycarried out on an enginerepresentative eometrywasreportedby Burkhardtct al.
[ 1994). 'licir experimental ig comprised ive cavities with all thediscshavinga commonbore
radii with G-0.256 anda/b -0.286, andtestswere carriedout for rotationaland axial Reynolds
numbers1.9x106: Rc#:55.6x10⁶and2.7x104: Rc,:59.5x104.1cat transrcrresultswereobtained
using measured urracc cinpcraturcsanda conductionsolutionmethod.'lic
testrig also carried acentraldrive shafý which could bc made o rotate n eitherdirection.The licat transrcr roin the
discswasroundto increasewhcn therotational speedor ti,c shaftapproachedhator thediscs.For
thecentraland outer part of thediscstherewasreasonable greement etween hemeasuredocal
Nusscltnumbersandthosepredictedby the Farthingct al correlation,Equation.2.36.
2.4.2.1SussexUTC multiple ca%-I(yig build I ciperlinental Invest gnIons
Furtherexperimentalwork wascarriedout by Alcxiou [2000], to investigate he[teat ransferand
flow physicswithin the intcr-disccavitiesOra gas urbinecompressorwith axial througliflow.
Alcxiou derived icat transfercorrelations rom cxpcrimcnial testdatafrom theSussexUTC
Multiple Cavity Rig (NICR)Build 1. A generalassemblydrawing for this rig is shown n Figure
2.7.The rotor and nner si,an or therig represent artOro 11 compressornternalair systemand
werescaleddown from a Rolls-RoyceTrent acro-cnginc, o a ratio orO.7:1. Temperaturemeasurements ere obtained rom thedrive concanddiscsurfaces.A conductionsolutionmethod
usingthemeasured urface emperatures sboundaryconditionswasthenused o estirnatc heheat
31

7/28/2019 Chew Packwood N Turner
http://slidepdf.com/reader/full/chew-packwood-n-turner 54/343
transfer rom both thesurfaceorthc rig coneandrrom thesurraccortlic disc. Alcxiou roundthat
themeasurementsrom theoutcr surraccor thecone were n reasonable greementwith the
theoreticalpredictionsror theheat ransrer rom a rrcccone n turbulent flow. I [cat transrcr
measurementsrom the inner surraceof thecone revealed wo regimesof heat ransrcr.Depending
on thevaluesor Ro/(pAT,,j)"2, theheat ransrcrwould eitherbedominatedby rotation at a low
value,Ro/(PAT.,&)"2<6 or by through-flow effects at a high value,Ro/(PAT.,, 112 6. In the
rotationallydominated egime, heshaft senseor rotationwasfound to influencetheheat ransrcr
rromthe innersurfaceof thecone.A co-rotatingshaft gavchigherheat ransrcr hana contra-
rotatingshaft. 'lic rollowing correlationswerederivedror beat ransrcrrrom the innerconcsurracc.
Ro<3.5, Nu - 0.0243Rc,O'OK6ro, 2x"," [r (al (2.37)
Ro>3.5, Nu - 8.93x 10" Rc,"341x'3-921 (2.38)
wherc,Gr - fl2r sinOPAT(r/sinO)l/v2s theGrashofnumbcr,and0 is thc conchairang1c.
17he cattransrcr rom thedisc was ower than that rromthe innercone,however heaverage
Nusscltnumbersshowedsimilar behaviour o that from the innerconesurraccandsuggcstcdhe
samenfluencefrom the two regimes.Fromtheheat ransrcr esults n thedisc-conecavity, Alcxiou
suggestedhatat thehigher Rossbynumbers Ro) the througliflow 'drives' a largevortex that rills
thecavity. At lower Rossbynumbcrs hemechanismorccntrifugal buoyancycausesadialoutflow
towards heccntrc of thecavity with radial inflow next to thediscandcone surfaces,which is
consistentwith Farthingct al. s findings.
OwenandPowell [2004] from their single cavity work alsoobscrvcd hat theheat ransfer
measurements avesupport o theexistenceortwo different flow regimes,a buoyancy nduced
rcgime at high rotationalspeedsandsmall axial througliflow, and a througliflow dominated egime
at the lower rotationalspeedsand largervaluesoraxial througliflow.
32

7/28/2019 Chew Packwood N Turner
http://slidepdf.com/reader/full/chew-packwood-n-turner 55/343
HOT AIR OUTP. efý^
rý--- -
COOUNGCD
AIR 1*4
6 mm
42.9 mmaý- 70.1 mm
a, - 66.55 mm
D- 491.3 mm
b- 220.0 mm
Iß 59.75 mm
,Mo: Isc
/r II.
1-igurc 2.7 Sti%%cx" VC %Itj IIi I) e Ca%il.N Rig (Build I) lAle%iou 20001
Q
2.4.2.2 Su%%t-xAV multiple can jý rig huild% 2 und 3 c%perimem.il im e%ligution%
I ong cl al. 12000al canictl otil I 1),, Illcil"Mcillents (111\%o additional 111111(kof 111C tv%,,\ \Itlllllllc
Cw ity Rig. btidd-, 2 and 3. As shown In Figure IS. the rotor has three internal di%c%and together
with the mo end plate th%cs l'our cylindrical cavities are fornied. the disc bores are ol'Iden(ical inner
radius and the central dri\c shall Is stationary. The main dillerence IvIween Build 2 and Build 3 is
the diameter ol'the central dri\c shall, and therefore the annular gap between the shah and disc
bores. The central dri\ c shall has a diameter of' I 20mm in Build 2 with in annular gap I Onim and a
diameter of' I 04mm in Build 3 with ; n I Xmin annular gap. Both builds were itimnimemed with
stationary and rotating thermocouples. For litilld 2 and Build.1
IDA measurements ofaxial and
tangential flo\k \ clocitics within the inter-disc ca\ itics ha%c been obtained. Additional
measurements of"langcmial and radial velocity components %%ere btained in Build.1.
E-1'
I. Iui aATue
IaI Pa f -,ur IICDI MA-, S FýCW
.1.1

7/28/2019 Chew Packwood N Turner
http://slidepdf.com/reader/full/chew-packwood-n-turner 56/343
1 1. It.0 ". 111*1 S0
Figure 2.8 Istj%%t-xW Multiple ( 'a%f.ý Rig( Build 3) %hossing the I-) 1 1) % ll--I I'll Ille'll
11.ong et al. 2000al
I lie taligcIltial N locity of file caN11%1(mdid nol appeal io\ al-Nacloss tile ;mal width of tile C. \ It\.
The axial velocities Inside the cm ily were close to /cro. For lWild 3. with file wider disc bore
annular gap. tile maximurn \; title of'm 'Llr occurred close to (lie inner radius ol'the ca\ ity ; ll(] its
magnitude Increased \\ iih Increasing Ro 1111111her.lie 11011-dilliclislonalangential velocltý
decreased1'rom his maximum it) solul body rotation, m ill I. ; % 1) - 0,0. I-or Iluild 2. smaller
it Ise bore gap, I ie non-d I riens I ona I tallgc Itt I; h clocities (II I not show a Illa\ I ll it Ill till II ISO I(I bo dy
rotiffloll was achieved near to tile Outer railitis ol'ilic cavity. The difference III radial \arlalloll of'
tangential velocity has beell attributed to I dillci-crice ill tile Influence ofilie axial througliflo\% oil
the flo\% Inside the rotating ca\ ities. A narrow armular gap appeared to allentiale Ill's "Itcractioll It
doe-, appear likely that tile behaviour ofilic. 1cl and hence tile mode of'\ orle\ breakdown %%s
affected by the change ill diNc hore geometry. Mcasuremen1% ofilie instantaneous \; Illjc of'radial
\elocilies did show some periodicity ill tile flo\\ %\ ich could be title to cyclone aliticycloric pairs.
I lie radia I \c Ioci I es ýkcrc Iypica I V two orders 01,11m gll It title IO\%cr111.11111 tallgentia I Coll I pollen I's
and comparab Ie to relat I\ e iangentia I \c Iocity. consisicrit will II c ( hwn and 1'()\%cI ob%cr\ aI Ions.
An anaIy%is oft lie frequency spec II-till 10fI lie tan genlia I \e Ioc IIy shO\%CdcI car C\ I(IC[ICCof'
14

7/28/2019 Chew Packwood N Turner
http://slidepdf.com/reader/full/chew-packwood-n-turner 57/343
periodicity in the flow structure.This was inked to theexistenceof pairs orcontra-rotating
vortices,which is consistentwith thecurrent understanding r theheated low structures.
TheSussexMultiple Cavity Rig shroudheat ransferresults rom Build 2 andBuild 3 have been
reportedby Long ct al. [2006b].The heat ransferfrom theshroudwasshownto begovernedby
rotationally induced reeconvectionand wasmainly affcctedby the shroudGrashofnumber.The
axial througliflow ratehad little or no cffcct on the shroudheat ransfer. lic heat ransfcrappeared
also o bevirtually insensitive o thesenseorshall rotation.Earlierwork hasdemonstratedhe
principle that theshroudheat ransfermaybepredicted rom modified cst3blishcdcorrelations or
freeconvectionfrom a horizontalplate in a gravitationalfield. Gravitationalaccelerations replaced
with thecentripetal erm andthecavity core air temperatures usedand not the inlet temperature.
I'lic rig temperaturedatawas consistentwith this approach.T'hercwasa diffcrcncc in theshroud
heat ransferbetweenBuild 2 andBuild 3, with values rom Build 3 beinggreater hanfrom Build
2.This differencewas attributedto thegreater nfluenceof theaxial throughtlow on thecavity air
whentheannulargapwas ncreased.The heat ransfer rom the insideora rotatingconicalsurface
exposedo axial througliflow could alsobepredictedusingthe frcc convcctions,providing the
Rossbynumber,Ro,was small enough.
Disc beat ransfer esultsfrom Build 2 andBuild 3 have been eportedby Longct al. 12006c].71c
discheat ransfershoweda strongerdependenceon axial Reynoldsnumber,Res han the rotational
Reynoldsnumber,Reo. ncreasingRe, cndcdto increaseheaveragedisc heat ransrcr.This was
attributed o thestabilisingcfTcctof theCoriolis acceleration.Wideningthedisc borcgapappeared
to increasehedisc heat ransrcr.Unlike theearlierwork by Farthingct al. andLong using a single
cavity with axial througliflow where hedisc heat ransrcrwas nfluencedby both forcedandrrcc
convectioncffccts, Long ct al's laterwork showed ittle cvidence o suggesthatdisc heat ransfer
wasaffectedby the buoyancydriven flow. It is clear frorn Long ct al's work that theshrouddoes
havean influenceon the flow in thecavity. As mentionedearlier for anunheated hroudand a
narrowcavity and a small radial inlct (aswith the Farthingct al. experiment)heating hedisc
createdbuoyancy orces hatdcstabilisc heaxial througliflow, andthenarrowgap ratio suppresses
rorcedconvectioncffccts. For a wider gapratio (Long [ 19941),orcedconvectioneffectswould be
cxpected o havean cffcct on the flow in thecavity. In bothnarrowandwide gap ratio cases,he
maximumdisc surface emperaturewas comparableo theshroud emperature,with valuesof the
buoyancyparameterbasedon theaveragediscsurface emperature f PAT.q - 0.25. Soeven n the
wider gap ratio cavity. buoyancydriven cffccts occurred owards heouter radiusor thediscs.71c
3S

7/28/2019 Chew Packwood N Turner
http://slidepdf.com/reader/full/chew-packwood-n-turner 58/343
disc icating patternon theSussexMultiple Cavity Rig was quite different to thaton tile earlier
singlecavities.The maximumdisc temperaturewas around25K less hanthe shroud emperature
and ypical valuesof [fie buoyancyparameterwere in tile range0.02< PAT.,j < 0.1.The gapratio
G-0.2 wasalso significantly largerthan in theearliersinglecavity work. Taking into consideration
all these 3ctors,andthepresence f a shaftat a relatively largeradius ratio, it is perhapsnot
surprising hat therewas little evidenceof buoyancydriven heat ransrcrbehaviouron tile disc
surfacesn OleLong experiments.
2.5Stationary and Rotating Cavities - Numerical Studies
LongandTucker 1994a) ttemptedo numericallymodelhe low withinthesame otating avity
withaxial hrougliflowusedn OwenandPowell'sexperimentalest.Thenumericalmodel
reproducedheexperimentalbservationhatsome r thecentralhrougliflowdoesenterhecavity
as he esultof thebuoyancyffccts,nduced y rotation.
Othernumerical tudies avebeencarriedout,forexample y Long,Nforse ndTucker 19971,
TuckerandLong 19951,uckerandLong 1996],Wong 20021 ndbyTian,Too,DingandXu
[2004).n general,heseCFDstudies avegiven esultshatarcqualitatively imilar o
experimentalbservationsndgiveacceptablegreement ithbeat ransfer ndLDA
measurements.he hree-dimensionalumerical tudyby Tianctal. [2004)supportsheearlier
qualitativelow visualisation orkof Farthing t al.The sothermallowstructuresseeno be
axisymmctricndstable, nd otationdecreaseshe nfluence rthc centraloroidalvortex.Fora
heatedcavity he low maybecomenstable ue o the nfluence rrotationallynduced uoyancy.
An instability hatdevelopsloseo theshroudwasseenoaffect he estor thecavityas he
Rayleighnumberwas ncreased.redictedeat ransfer ppearsobeconsistent ith previous
experimental easurementsndshowshedifferentafTcctsr the wo flow regimes r rorced nd
freeconvective eat ransrcr.
Johnsonct al. [2004)developed stabilityanalysis ndappliedhis o thecase f rotating avity
flowwith axial hrougliflow.71canalysis howedhat oraRossby umber,to < 0.1 he low in
thecavitymaybestabilised yadensitygradienthat ncreasesith increasingadius,but his
behaviourceasestRo> 1).For ntcrnictliatealues f Ito,achieving tability nvolvesamore
complexelationship f velocityand emperatureroflics.
36

7/28/2019 Chew Packwood N Turner
http://slidepdf.com/reader/full/chew-packwood-n-turner 59/343
As partof thestudy in to the flow and icat transrerwithin both stationaryand rotating scaled
cavitiesnumericalwork hasbeendoneusing Large Eddy Simulations LES) Cr-D. LES methods
mayhavedistinct advantages ver theunsteadyReynolds-avcragcd avicr-Stokcs(RANS)
methods or this typeof buoyancydriven problem, which is know to give rise to largescale
unsteady low structures. n LES the largerturbulenteddiesarc simulated,with smaller(sub-grid
scale)eddiesbeingmodcllcd. 7he sub-gridscalemodelling is dependentup on the mcshsizeand
unlike RANS is designed o allow developmentof the largerresolvededdies hat interactwith the
mean low.
Concurrentwork by Sun,Kilfbil, ChewandI lills [2004] andby SunandChew [2004] comparing
die useof LES with standardk-c RANS CFD for bothstationaryandrotating cavitieswith and
without axial througliflow will be describedandtheresultsdiscussedn laterchapters.
2.6 Cross Flow Over a Stationary Cavl(y.
As notedabove, or an unheated avity rotating at low speed heaxial througliflow generates neor
moretoroidal vortices in thecavity. Similar cffccts havebeenobserved or planartwo-dimcnsional
flow over a stationaryplanar2D cavity. I fence t is alsoappropriate o consider his simplerplanar
flow. The literaturereview hasrevealeda limited amountof researchwork hasbeencompletedon
this subject. t wasdecided o focusmainly on thestudyby I laugenandDhanak 1966).Ilicsc
workerscarriedout an analyticalandexperimental nvestigationaimedat describing he turbulent
momentum ransfermechanismn the separation low regionora rectangularcavity racingan
oncoming urbulentboundary ayer.
I laugcnandDhanak'sexperimentalapparatus onsistedoran adjustable engthflow channeland a
rectangularcavity with adjustabledepths.The channelwas2.5 in. (63.5mm)wide andhadan aspect
ratio of 10,ensuringa substantially2D flow. I'lic cavity width wasfixed at 2.5 in. (63.5mm)and ts
depthwasvaried up to 4.5 in (I 14.3min).7lic freestrcamair velocity was estimated o be 100 ft/s
(30.48m/s). lic boundary ayer thicknessust upstreamof thecavity could bevaried up to I in.
(25.4mm)andwas found to beturbulent.Staticpressuresweremeasured long thecavity walls by
meansof a micromanonictcr.The staticpressurewas alsomeasured cross heshearayerby a
probeheld normally to thecross-flowdirection. Tcrnporal-incan elocity andturbulent ntensities
weremeasured y meansof a constant-currcnthot-wire anemometer. variablc-position raverse
37

7/28/2019 Chew Packwood N Turner
http://slidepdf.com/reader/full/chew-packwood-n-turner 60/343
mechanismwasdeveloped o move a hot-wirc probe ongitudinally, parallel to the mean low, and
transvcrselyacross hemixing region.The hot-wirc probemeasurements cre used o dctcrminc the
distributionsof the timc-mcan ongitudinal velocity, turbulence ntensity,andturbulcnt shcarstrcss
acrosshemixing rcgion. For flow-visualization studiesa secondexperimental ig with thesame
dimensionswas used.This rig was subjcctcd o flow of waterapproximatelysimulatingthe
dynamicconditions in termsof flow Reynoldsnumberandrelativeboundary-laycr hickness.
Analytical flow models werepostulated or tile threezones,namely,for the flow outside he mixing
processwithin theshear aycr, for the flow within theshcarmixing layerand ror tile now outside
tile mixing zone, nsidethechannel. le velocity profiles calculatcd rom theanalysiswcrc in
agreementwith thehot wire experimentaldata n the rcgion of themixing process.
A conclusiondrawn from this work wasthat the relativesizeor the turbulentboundary ayerat the
upstreamedgeora rectangularcavity appearedo havesignificantcffects on thedragandtile
velocity profiles in theslot. This could be importantto the rotatingcavity problembecause f the
need o know the levelsof heatandmomentum ransferacross heshcar ayer from tile crossflow to
diecavity, or (in termsof a compressor)he transferof heatandmomentum rom theaxial
througliflow undertile disc bores o the intcr-disc:cavities.
Investigationsusing similar typeof cavity geometrieshavebeencarriedout at die University of
Surrey.Experimentalstudieswerepc6ornied by Disimile ct al. (2000]andby Savoryct al. (20001
whilst Czechct al. carriedout both experimentaland numericalstudies.Both theexperimentaland
numericalstudies usingthe RANS standardk-c model)showedsimilar results o the 1[3ugcnand
Dhan3kexperiments.'lic CFD modelpredicted he flow reasonablywc1land t wasconcluded hat
CFD could beusedas a cost-effective ool in thedesignprocess oncerning low overcavities.
This I laugenandDhanakexperimentwill be revisited n Chapter5 where a 2D CFD analysis,with
variouscavity depths.will becompared o the cxpcrimcntaldata.
2.7A NumericalAxisymnictricAlodelor me Buoyancy1,.fccts n RotatingCa%ty llom.
Toconclude
hereviewof previouswork,a
lookat a possible
umericalmohod o modelhe
unsteadyhrcc-dimcnsionallow buoyancy ffcctswithina rotating avitywitha simplesteady
flow two-dimensionalxisymmctricmodelscxamincd. hew 20001n adiscussionnoteon
38

7/28/2019 Chew Packwood N Turner
http://slidepdf.com/reader/full/chew-packwood-n-turner 61/343
axisymmctricmodellingorbuoyancy cffccts in rotating cavity flows postulateda simplificd model.
In this simplemodel flow bctwccntwo coaxial, corotiting, infinite cylindersat difrcrcnt unironn
temperatures asconsidered.Averagingover time, it is expectedhat the flow variableswill not
varywith z or 0 in thenaturalcylindrical co-ordinatesystcm(rO, ). Fromanalogywith turbulent
diffusion, simpledimensionalarguments,andconsiderationortlic stability of rotating flows, Chew
postulatedhat in the interior flow theheat lux (4) is given(in termsortimc averaged ariables)
by the rollowing cquation,
-, 4Ra,kdr dr
dr dr
whcrc he localrotationalRayleighnumbcr'Rai s dermcd s ollows
Ra,= Pr max[(I-)'_r dp,
o22c11 cp dr
(2.39)
(2.40)
I IcreA and n are non-dimcnsional constants, Listhe representative length scale and, P, /1.Pr
(-pC, A). v., CF.T. k and c denote the fluid density, viscosity, Prand(I number, swirl velocity,
specific beat at constant pressure, static temperature, thennal conductivity and the speedorsound,
respectively. In the low Mach number limit this model will promote beat transrer if the radial
temperature gradient is positive. Eckhoff and Storcslcttcn [ 1978,1980] round this necessary low
Mach nurnbcr criterion for the linear stability ora rotating, compressible and inviscid fluid.
ror theconditionsof interest hecontributionorconvcntional thennalconduction o heat ransrcr s
cxpccied o benegligible.T'lien hecoreheat flux is givcn by:
-ARal*kdT
gir(2.41)
For tile limiting conditionorsmall valuesorAp/p, AT/T andEckertnumber IY/2ATCp whereAp
andAT arerepresentative aluesof pressureandtemperature ifferences,solution or tile above
equationor Ole
coreheat
lux, elgives;
39

7/28/2019 Chew Packwood N Turner
http://slidepdf.com/reader/full/chew-packwood-n-turner 62/343
4r [In(r.r,)]
prploTAir-
kAF, PI(2.42)
wherc.JT, is the inncr-to-outcr temperature ise across he interior regionand 7 s a cocfricient orthcnnalexpansion,which canbe takenas I divided by the gas cinpcrature.
Closeo theboundaryylinders,hin layersarcassumedn which heheatconductionsgivenby
modifiedexperimentalorrelationsorconvectionromaheated orizontal latplate n gravity.
I IcretheFislicndcnandSaunders 1950]correlationsareadaptedo includecentrifugal acceleration
radicrthangravity;
Nu - 0.54 Itaoý23 for 101< Ra< 2x 10⁷ (2.23)
Nu - 0.14 Ra0.33) for 2x 10⁷< Ra< 3x 10¹⁰ (2.24)
%%,ereheNusselt umberNu-L4 /(k AT)and herotationalRayleigh umberta - PrWr P20AT
L3 p2andL, AT, Pr,0 (- I/Ts)denotesepresentativeengthscales,luid towal temperature
difference, randtl umber ndcoefficicritof thennalexpansion,espectively.j isOlegas
temperaturet theedgeof the ayer.Choiceof therepresentativeengthscale, issomewhat
arbitrary, s he reeconvectionorrelations based nexperimentalonfigurationsuitedifferent
from hatconsideredere. or a finitecavity hehaircavitywidthwouldbea reasonablehoice.
(Note hat hecharacteristicengthscale, will cancel ut f the low is in thehigh Ra ange s he
Oterm in theRayleigh umbersraisedoa poweror 1/3and heresulting iscancelledut when
theNusscltsconvertedoabeat ransfer ocfficicnt).
Chewsuggestshat oreachpointonthewall surracc nair temperatureouldbeestimatedinternallywithintheCFDcalculation. hismaybedonebyassociatingurface ointswith internal
mesh ointsa specified istance way rom hewall,or (moregenerally) y includinganestimate
orthethermal oundaryayerextentn the terative rocedure. sing hisvalueorair temperature,
the ocalwall temperaturend luid properties,heappropriateatural onvectionicat ransrcr
correlation quationhorizontal late)maybeappliedoestimatehe reeconvectionicat ransrer.
4,,say.The ollowingequationsmight henbeusedoestimateheadditional eat lux, 4. say,due
to buoyancyeffects.
40
7/28/2019 Chew Packwood N Turner
http://slidepdf.com/reader/full/chew-packwood-n-turner 63/343
-, 4Ra,k"T
in the low 'core'dr
(2.43)
r4. - r.4" in thenear-wall egion (2.44)
Sucha methodmight be incorporatedwithin the iterative CFD solution andextended o include the
effectsof cxtra mixing in themomentumconservationcquations.Forconditions in which the frcc
convectionhcattransfcrwasrelatively small thesemodificationsshouldhave ittle cffect on the
CFD solution.
In conclusionCliewrcports the following points thatcnicrSc rrom comparing he 'mixing model'
with experimentaldata rrom Bolinct al's closedannualcavity, and
the innerconecavity on
the
SussexNICR Build 1.
Frccconvcction n thecloscdrotating annulus s supprcssedclativc to thatexpectcd n an
cquivalcnt gravitational ficld. Assumingthis is duc to a uniform 'thcrm3l rcsistancc'across
thecorc flow docsnot Icadto inconsistcncywith mcasurcmcntsor difrcrcnt radius ratios.
The 'rcal' flow appcarso bc morecomplcx thanthis.
Iligh Rayleighnumber icat transfer n the innerconecavity for theSussexrig is quite
different from thatorthe closedannulus.The axial througliflow is thoughtto play a major
role in promoting mixing in thecavity.
'Mis work will be further developed nto a modelling technique n Chapter 7 andaic applicationor
themethod o rig andengine otatingcavities n chapters8 and9, respectively.
2.8 Conclusions.
This chapterhasreviewed heresearchwork carriedout in the ficid or flow within intcr-disc
cavities.Two flow mechanisms,hebuoyancydriven flow within anenclosed otatingdisc cavity
andtheaxial flow throughtheboreof thecompressor, avebeen dentirlcd. Studies n to the
buoyancydriven flowcfTects
or bothstationaryand rotatingenclosedcavities
havebeendiscussed.
ror a stationarycavity casewith a vertical temperature ifTcrenccheheated loor promotesmixing
within thecavity and eliminates hetemperature tratificationwhich occurs or thehorizontal
41

7/28/2019 Chew Packwood N Turner
http://slidepdf.com/reader/full/chew-packwood-n-turner 64/343
temperatureifTcrcnccase.For hevertical emperatureifference aseheonly fluidmotion n
thecavity wasthatdueto the thermals.The heat ransferfrom tile heated loor compared avourably
to a conduction-layermodel.For thehorizontal temperature ifferencecase licre was rotationof
thefluid corewith a horizontalvelocity component o thethermals. [cat transrcrcorrelationshave
beenderived from experiments or thevariousheatingconfigurations,all variations of thebeating
frombelow case,by a number of researchers.1cre is a goodagreementbetween heseheat ransfer
correlations.For the rotatingencloscdcavity, studieshaveshown hat for high rotationalspeeds,
centrifugalforcesdominategravity andtemperature ifferences eadto centrifugally driven natural
convection. Icat transfercorrelationshave beenderivedfrom experiments or pureradial
temperature ifferenceand for pure axial temperature ifferencecases.Heattransferresults
obtained rom thenumerical
studiesorthe experiments
haveshowngoodPgrccmcn4except or the
high Ra-numbcrregionwith axial temperature ifference,%%,ere henumericalanalysispredicted
higherheat ransfer han theexperimentsshowed. lic heat ransfer or theaxial heat flux case s
much smaller hanthat for theradialdirected heatflux case.Comparisonor tile level of beat
transferbetween hepure radial and pure axial directedheat lux casesshows hat the radial heat
transfer s the importantmechanismor cavitieswith thecombinationof axial and radial
temperature istributionsthatoccur in gas urbinecompressor isccavities.Bothexperimentaland
numericalstudiescarried outfor
rotatingcavitieswith axialthrougliflow haveshownthat the
physicsof flow mechanisms re complex,being3D andunsteady.For low rotationalspeedcases
3D unsteadynumericalstudieshave beenableto capture he flow physicsreasonablewell, with the
LESCFD out performingk-c RANS modelling.Fromthesestudies wo flow regimes or heat
transferwere identified,a buoyancy nducedregimeat high speeds nd small axial througliflow,
and a throughflow dominatedregime at the lower rotationalspeeds nd argevaluesof axial
throughflow.Ilic heat ransfer rom thecavity shroudhasbeenshownto begovernedby
rotation3llyinduced ree
convectionandtheaxial througliflowratehad ittle or no efTecton the
shroudheat ransfer.Shroud heat ransferhasshown o havea greater nfluenceon the flow within
tile rotatinginter-disccavity thandoes hedisc heat ransfer.7lic experimentalandnumerical
studiesshowedwith increasingrotational speed he flow within the inter-disccavitiesbecome
increasingcomplicated.To model tile now at thehigherrotationalspeedswill require ncreased
computingmemory andspeed o adequately apture he now physics o achieveanacceptable
accuracywithin a satisfactory ime scale.An alternativeapproachs model thesecomplex flow
processeswith approximatebut
computationallycfficicnt models.As
a partofthis
alternativeapproacht wasnecessaryo review tile research n cross-flowover a cavity, to studytile
interactionof thecross-flowwith the flow within thecavity.7lic mainconclusiondrawn from the
42

7/28/2019 Chew Packwood N Turner
http://slidepdf.com/reader/full/chew-packwood-n-turner 65/343
studies,n termsof a compressorntcr-disccavity, wasthat the relative size of the turbulent
boundaryayerat theupstreamedgeof a rectangularcavity appearedo havesignificant cffccts on
thedragandthevelocity profilcs in theslot. I'his could be importantto the rotatingcavity problem
becauseorthc need o know the levelsof licat and momentum ransferacross heshear ayer from
thecross low to thecavity. To conclude hech3ptera simple2D axisymmctricsteadynow
approach ombining the two flow processes,hecavity flow with theaxial throughflow,hasbeen
postulated,which if achievedwill beableto adequatelymodelthecomplexflow in a computational
efficicrit andtimely way.
43

7/28/2019 Chew Packwood N Turner
http://slidepdf.com/reader/full/chew-packwood-n-turner 66/343
CHAPTER3
COMPUTATIONAL FLUID DYNAMICS SIMULATION OF NATURAL CONVECTIONIN A CUBE
Summary
Thischapter resents FDresults or naturalconvectionn a cube.Two licatingconfigurations
wcrcconsidered,othbeingheatedromthebottomsurface. hecomputations ereperformed
assumingothunsteady ndsteadylow and esultshavebeen ompared ith otherworker's
experimentalmeasurementsor licattransfer,low patterns, nd hemeanand luctuating
temperatureistribution.
Calculated eat ransrcresults ompared ell with theexperimentalderivedicattransrcr orrelationat low Rayleighnumber5.Ox10')with asmalldifferenceat the
higherRayleighnumber3.Ox1010).heunsteadylow computationalnalysis ccuracywasbetter
than hat or thesteadylow analysis,
3.1 Introduction
Publishedresearchn this areaof naturalconvection in anenclosedcavity appears o havebeen
limited to experimental nvestigations.whilst very little computationalmodelling hasbeen
published.The majority of theexperimental researchhas beenperformedfor the limiting casesor
vertical enclosuresheated rom below and cooled from above,andhorizontalenclosures
diffcrcntially heated rom the side.A smaller amountof cxpcrimcrital work has beenperformed for
the mixed cavity natural convection,wheretheenclosure s both heatedand cooled top andbottom
andon the sides.This chaptercornparcs he CFD resultsfor naturalconvection n a cubewith test
data from the Kirkpatrick and Bohn's ( 1986]cxpcrimentst. First, a descriptionorthe experiment
will bepresented ollowed by the licat transrcrresults n section3.2. In section3.3 thenumerical
investigationusing the FLUENT [1998) CFD code will bediscussed.CFD resultswill be presented
in section3.4, firstly for the steady low and secondlyfor the unsteady low solutions.Summary
andconclusions or thechapterwill be in presentedn section3.5.
tAWof thisrescamh orkhasbeenpublithed n PaperNo.OT2004-53528.resentedtdieASNICTurboExpo,
Vienna.Austria.2004 Sun,Kilroil. Chewand fill*. 2004).
44
7/28/2019 Chew Packwood N Turner
http://slidepdf.com/reader/full/chew-packwood-n-turner 67/343
3.2Descriptionor the Experiment.
At Ilia Colorado StateUniversity Kirkpatrick and Bolin conducted wo separateexperiments, he
first to determinethe overall Nussclt-Raylcigh number correlationsand ilia second o determine he
flow patternsand temperaturedistributions. A brief descriptionof ilia experimentsandthe four test
licating configurations weregiven in Chapter2, section2.2.3. All the configurations havea heated
bottom plate.The experimentswerepcrronncd using the testcell shown in Figure 2.1.The cubical
enclosurehadan interior dimensionof 305mm,which wasconstructedorcight 12.7mm hick
aluminium plates. 'lic four inner plates overlapone anotherand were screwed ogetherwith a
neoprenegasketbetween hem to form the enclosure.T'he our outer plates provide heatingand
cooling to the four enclosurewalls via milled channels hroughwhich hot andcold water was
pumped.The outcr plateswere scalcdandboltcd to the inner plates.7lic remaining two vertical
surfaceswere 19mmLucite plates hat allow for flow visualization.The testcell was instrumented
with the top and two sidcwalls having centrally located hermocouplesbored to within 3mm orthe
enclosure's nner surface.The top wall also hadeight additional thermocouples ocatedas shown in
Figure2.1. The purposeor thesecoppcr-constantanhermocoupleswasto determine heaverage
wall temperaturesand spatialvariations in the wall temperatureacross heplate.The spatial
variation was lessthan 10%and typically 5% of theoverall hot-to-cold surricc temperature
difference.The hot and cold surraccswere thercroreconsidered sothermal.For the I IC case, he
two vertical metal walls were considered o beperfectly conductinggiving a linear temperature
distribution along the wall. I'lic overall licat transfermeasurementswere expected o be within: f:5%
of ilia actualconvectivelicat transfer rrom each surface.The working fluid in the testcell was
dcioniscd water. Propertiesorthe water in the testcell wcrc calculated at a tenipcraturcequal to the
averageof the heatedand cooled wall temperatures,crcrrcd to asthe bulk temperature.
Temperaturemeasurementswithin theenclosurecore weremade with a coppcr-constantan
thermocoupleprobe inserted hrough the top plate.The L-shapedprobewas movedvertically ror
vertical scansandrotatcd ror horizontal scans.The probecould not be placedcloserthan 8mm frorn
the top and bottornsurraccsor the testcell, due to the dimensionsor theprobe.The thcrtnocouple
output was sampledby a microvoltinctcr at a 101z rate for a period of 120s. 'lic time constantof
the probe is calculated o be0. Is, anorder ormagnitude smaller than thecharacteristic ime or
thermals.The temperaturemeasurementwasrepeatableo 0.1 K.
45

7/28/2019 Chew Packwood N Turner
http://slidepdf.com/reader/full/chew-packwood-n-turner 68/343
3.3Test I lent Transfer Measurements
Fromthe experimentalresults,Kirkpatrick andBohn wereable to derive heattransfercorrelations
for thevarious heatingconfigurations. in each of the testconfigurations, the bottom surface of the
enclosurewas heated.For thecalculation orthe Nusscltnumber,wall-to-bulk temperature
diff'ercricewas used.
Nu - h.,o
L/k (3.1)
h.,l - Q/( A. I Tw-Tb (3.2)
wherch.,g
s theavcrageicattransfcr odricica
In thedefinitionof theRayleighnumber,Ra, he emperatureifferentialusedwas hedi(Tercncen
temperatureetweenhehotandcoldwalls.
Ra- (g 0 AT L3 / V2) pr
for vcriical Rayleighnumber, Rahg0 AThh' / vabasedon enclosure icight. h
for horizontal Rayleighnumber, Rai -gPATI 11 vabasedon enclosure ength, I
(3.3)
(3.4)
(3.5)
As previouslymentionedn Chapter , section2.2.3.1,or the imiting conrigurationIC me the
Nusscit-Rayleighumber orrelation f the estdatacanbegivenby,
Nu- 0.0986Ra"j (2.14)
The I If ICC case nvolves simultaneousheat ransferrrom the surfaceand vertical sidewall to the
top surraccand opposite vertical sidcwall. Also asnicntioncd previously in Ch3pter2, for the
111CC case he Nusselt-Ray1cighnumbercorrcl3tionsof lite testdataaregiven below:
For the top andbottom surfaces, Nu - 1.10V'216 (2.15)
and for the side walls, Nu - 0.141 RP 1) (2.16)
46

7/28/2019 Chew Packwood N Turner
http://slidepdf.com/reader/full/chew-packwood-n-turner 69/343
Thebottomand opsurfaceNusschnumberswereapproximately5% higher han hesidewallNusscltnumbers.'lic test esultsshowedhat hcdominantmodeof heat ransrcrwas henatural
convectionromthebottom o the opof theenclosureatherhan he aminarboundary-laycreat
transrcrromoneverticalwall toanother.
3.4 Numerical Investigation
Forthe numerical investigation,CFD was used o model the I IC and I If [CC conrigurationsorthe
naturalconvectionexperiments.Comparisonsorthe CFD resultshave beenmadewith the
cxpcrimcntal measurements. he interior gconictry of theexperimental estcavity wasused n the
CFD analysis.Thus, ilia geometricalsize was305mmcubcd.A typical calculation mashror the
geometry s shownin Figure 3.1. Various CFD mesheswcre used n theanalyscs.The base ine
mashwas 106ccils; 100mash ines in cachdirection. This mashhadan expansion atio, R or 1.1
away rrorneach edgeor thecavity. For a study of mashdcpcndency wo further masheswcrc used,
aI 50-cubcdmash(R-1.058) anda 200 cubed mash(R-1.039). Ilia uppcr wall temperaturewas set
to 300K for all cases,with ilia hotter, lower wall icnipcraturevaricd from 301K up to 340K to give
a rangeof Rayleighnumbers rom 5.83 x 10' to 2.33 x 10¹⁰. or the I IC test two metallic sidcwalls
were insulated(the inner conductingplate was insulated from a secondoutcr plate) and the Lucita
front andrcar surraccshada low conductivity. All the sidewalls were thcrcrorcassumedadiabatic
in die CFD analysis.For the I If [CC case. he same ncshwas used n ilia CFD. The uppcrwall and
onesidewall temperaturewereset to 300K ror all cases,with the hotter, lower wall and theopposite
sidewall temperaturesetto 31OK(Ra - 5.83 x 101)and330K (Ra - 1.75x 10¹⁰).
47

7/28/2019 Chew Packwood N Turner
http://slidepdf.com/reader/full/chew-packwood-n-turner 70/343
I
I
4
A
I( peollit'll-N aild %III-lact. lilt-01 ( 1110% 00% 100ý 1411.IIv ý%;lvu-filllvd cubc.
I)It*
k (1111pill. 111oll k 'Iff wd m1f 111k.owwl %'ItIon C(P1.111lill"till 111.1ý . . Mollicillull)
.111dwl 1. III
tile Ntationarv eference tame (co-ordillate .yocill defilled III 1.1glife I
I-( ollsen al oll ot
I-
I
( '1
2. CollNcr%Allollof %lollICIIIIIIII
\ threcilon
threct ion
direciion
4%ý/NI(I
( I/ V,ý-I-Iý
A
(A (1)
"\(ji\
i)
4 V. ('(I) 4 '. (11V, ) ('. ))
V
4 1/411 1
( 1'
)47.
( 7h)
(1 7o
49

7/28/2019 Chew Packwood N Turner
http://slidepdf.com/reader/full/chew-packwood-n-turner 71/343
3. Conservationof Energy
whcreE-h- 'pf+ ulp2
P, P.V+p
g(p. -P)
Of+V- (pEU)
w-pV-U +V-(kVT)+ (1) (3.8)
ris the otalcncrgyandscnsible nthalpy,h- fCpdT. T,,r is298.15Kr,,
and D s theviscousdissipationcnn(sccEquationAI- 10)
isarcduccdprcssurc
is thebuoyancycnn,whcrepo sthe(constant) cnsityorttic now.
Ilic fluid used n the simulationswaswater, to matchKirkpatrick and Bolin's experimental
conditions.The Pranddnumber(Pr) for water was takenas7.0. with specific heatCp- 4200 J/kgK,
thermalconductivity k-0.6 W/mK, dynamic viscosity ti - 0.001kg/msand thermalexpansion
cocfricicnt P-0.0003 K*1.As this is a natural convection problem involving small changes n
temperaturehe Boussincsqapproximation [Vcrsiccg andNfalalasckcra,19951was used o treat the
fluid density (p):
P-POO -PAT) (3.9)
whereAT -T- To,operatingemperature,o- 300 K andoperating ensity,po 1000 g/m)
In theCFDsolver FLUENT 19981,heBoussincsqmodel reatsdensityas a constant alue n all
solvedequations xceptor thebuoyancyerni(bodyrorce erm) n themomentum quation.
(p
-pa)g *I
-poP(T -To) g
The accelerationdue to gravity, g was set as-9.81 nils*2n the vertical downwards direction (i.e.
towardsthe hot bottom surface).
Modelswere un assumingothsteady ndunsteadylow. For hesteadylow models, oth
laminarand urbulent low assumptions ereusedwhilst for theunsteadylow models nly laminar
flow ("pscudo"DNSsolution)wasassumed.orthe urbulent low calculations.hestandard-c
modeland he2-laycrk-c/W nearwall turbulencemodelwereused.Thestandard-cmodelturbulencequationsnd henearwall turbulencemodels sedn theFLUENTCFDcodoarc given
in Appendix1.
49

7/28/2019 Chew Packwood N Turner
http://slidepdf.com/reader/full/chew-packwood-n-turner 72/343
To solvethe systemorcouplcd differential equationsa rinite volume schemewasused.For both tile
steadyand unsteadyflow models, hesegregated olver methodwasused,where ilia governing
equationsare solved sequentially.In ilia segregated olution method, eachdiscrete,non-lincar
equation s linearized implicitly with respect o thatequation'sdependentvariable. Becauselia
equationsarc non-lincar, an iterative solution loop mustbeperformedbeforea convergedsolution
is obtained.Each teration consistsorupdating the fluid properties. he u, v and w momentum
equationsare eachsolved in turn using tile current values orprcssurcs and facemass luxes (update
(fievelocity field), solve the prcssurc-corrcction continuity) equation(updatepressure,acemass
fluxes),solve energy, turbulenceandotherscalarequationsandcompletethe iteration loop by
checkingfor convergence.Temperatures,pressures, ndu, v and w velocities are calculatedand
storedat thecall centrcs.The methodchosenror discrctizationof the scalarand momentum
equationswas the sccond-ordcrupwind scheme.A secondorder schemewasusedror ilia pressure
interpolationand for the prcssurc-vclocitycoupling (prcssurc-corrcction) he SIMPLE algorithm
wasused.
ror theunsteadylow, the emporal iscrctization onnulation hosenwas hesecond rder mplicit
scheme. timesteporO.2 secondsnd20 iterationsper imestepwasusedn theunsteadylow
analysis.Rcrcrringback o thework orAsacdaandWatanabe1989]work in Ch3p1cr , they
derived onnulac o estimate timeconstantor thistypeof flow problem
Timeconstant,- LIU - L'(Pr Rtj)"" la
=LI(gflATL) II
whcrc U is thevelocityscalern/sjandL is the engthscalem)
Fora temperaturedifTercncchot to cold surface,AT or40K. U-0.191m/s and with L -0.305m
the time constantý -L/U-1.6s. For the time step heCFD codeprovider [rLUE- NTý 19951
recommendsaking a time step,At - T/4 -0.4s. Thetinic step usedrorcach or dicManalyscs
was0.2s,clearly within the time stepcalculatedabove.77hercforc. time steporO.2sshouldensure
that die majority of the thermalactivity within thecavity would becaptured.With time stepof 0.2s
die Courant.Friedrichs-Lcwy, CFL number w 13ror theaveragedistanceacrossa cell on. 05nim
that is only acceptablewhenusing the implicit solver.The CFL number s high andcould be
loweredby reducingthe time step,which may help to capture he smallerscaleflow rcaturcsand
die possible he onsetora thermalplume rising rrom theconductionlayer. Furtherscaling
calculationsarc presentedater in section3.5.2.5.
so

7/28/2019 Chew Packwood N Turner
http://slidepdf.com/reader/full/chew-packwood-n-turner 73/343
3.5NumericalSimulation Results
3.5.1Steady low CFD solutions
Steadylow CFDanalyseswerecarriedout rorboth the ICand II [CCheatingconfigurations.Analyseswereperrormcd ssuming oth aminar low and urbulent low models.Two temperature
differences,otto coldsurraccs, eremodelled OKand30Kandall thesimulationswere
pcrrorrncd ith aI 00-cubcdmesh.with agridexpansionatioor i. t rrorneachwall.Table3.1
belowpresents eat ransrcr esultsobtainedromthesteadylow CFDanalyseserformedor the
I ICconfiguration. heCFD icattransfer esultsarecomparedwith KirkpatrickandBohn'sheat
tmnsrcr orrelation. teat ransrcresultsareexpressedn theronnoran areaaveraged usselt
number,Nu,dcrinedby Equations .1and3.2.Thebulk temperature,bwas akenas hemeanor
thehotandcoldsurfaceemperatures.
Table 3.1 Comp2risons of steady laminar and turbulent CFD results %%1111easured licattransfer for the I IC case.
Case AT(K)
,
Pressure(Bar)
Ra Nu
(Exp.)Nu
(CFD)ANuV/0)
NotesAll ror StcatlX Flow
1 _0 1 5.833xlO^ 177 172.2.8 Laminar, 100'incsh. R-1.1
2 10 1 5.833xlO9 177 144 . 18.6 Turbulent. 100' inesh.R- 1.1
3 30 1 1 1.75xlOlo 256 222 . 13.31Laminar, 100' mcsti. R- 1.1H41 30 1 1 1.75xlO" 256 187 .27.0 1
_Turbulent100' inesh.R- I
Table3.1 clearly showsthat the heattransfercomputedby thesteady aminar flow model was
closerto the measurementshan for the turbulent flow model.Tlic steady low turbulencemodel
appearso dampdown the tlicnnal activity within ilia cavity. However, for ilia steady aminar flow
model therearc largediscrepanciesn the licat transteron the hot and cold surraccs.71is error in
thesteadystatecalculationsmay beexpected,asthe flow widiin thecavity is clearly unstableand
thcrcrorc time dcpcndcnLConvergenceof the steady low solutionswere also a problem making the
solutionsdoubtful andunsatisfactory.1 cncc the need o run ilia unsteady low solutions.
Table 3.2 showsthe steady low CFD licat transfcrrcsults rorthe 1111CConriguration.The CFD
heat ransfercompareswell with the measurementsor the top andbottom surraccsbut not for the
sidewalls.Overall, the I If ICC steady low licat transrcrresultsarc closer to the measurementshan
for the I IC configuration
51

7/28/2019 Chew Packwood N Turner
http://slidepdf.com/reader/full/chew-packwood-n-turner 74/343
Kirkpatrick and Bohn Natural Convection in a Box
I R, case Delta TI OK.Velocity in Ilic Y direction (bottom it) (op) - in s
M/S
0.0110
0.0 1B
0.0 160.0 140.0 12
0.0 1a
0.008
OAH
0.004
0.002
a.aoaAA02
-OA04-0.006
-0-aaB-0.0 0-aA 12-0.0 14
-0.0 16
.0.0 A
0.020
Figure 3.2 Contours of vertical velocity, IfC case, AT=IOK.
Furbulent. Sleudý
Laminar. Stead)
Laminar, I'micad)
52

7/28/2019 Chew Packwood N Turner
http://slidepdf.com/reader/full/chew-packwood-n-turner 75/343
Table3.2Comparisonsor s(cady aminar and turbulent CFD results t HISmeasuredheattransrer or the IIIICC case.
Case AT PressureRa Ton& ottomWalls SideWalls Notes
(K) (Bar)
I
Nu Nu ý1ANu Nu Nu ANu All ror Steady
(Exp. ýCFD) M (Expj (CFD (%) Flow
5 10 1 222 215 -3.2 161 143 -11.2 Larnmar,100, Mesh,
6 to 1 5.833404 222 210 -5.4 161 142 -11.8 Turbulent,
1003mcsil,
7 30 1 T 7-5 288 284 . 1.4 227 190 -16.3 Laminar,
1001mcsh.
8 30 1 1.754010- U8 267 7 5 -18.5 Turbulent,I
1:
1001incsh
I,
R-1.1
3.5.2UnsteadynowCFD solutions or (lie I IC conlIguration.
3.5.2.1Flowstructure
Figure3.2 showscontour plots of vertical velocity, andcompares hesteadystatecasesof laminar
andturbulent flow with theunsteady aminar flow case or aI OKtemperaturedifference.The figure
shows hat therewas lessactivity within thecube for the steadycasescompared o theunsteady
case. lic plot of the steady low turbulencemodel showstheapparentdampingor tile thermal
activity mentionedabove.This allowed a nearsteadysolution to beobtained.Overall, the unsteady
laminarmodel produced hebestresultsby capturing the main flow structureswithin thecube.As
will beshownlater, resultsfrorn theunsteady aminarmodelcompareswell with the experimental
results.The unsteady low predictions arc illustrated by a time seriesorinstantancousvcrtical
vclocity componentand temperaturecontourson tile mid-plancof thecube,shown in Figures 3.3
and3.4 respectively.Picturesarc shownat 4-sccond ntervalsover a period lasting 28 seconds.
T`hcscresults were producedon aI 00-cubcdmeshwith the bottom surraccat 31OKand tile top
surfaceat 300K, giving a Rayleigh numberor5.8x 109.Laminar flow was assumed or this
simulation.The range of the temperaturecontours s from 304K (blue) to 306K (red). During the
simulation period, two plumes canbeseen o be released rom the hot bottom surface,migrate
towardsa sideof thecubebcrorc deaching rrorn the surfaceand rising up to the cold top surracc,A
53

7/28/2019 Chew Packwood N Turner
http://slidepdf.com/reader/full/chew-packwood-n-turner 76/343
coldplumeappearso bereleasedromtheuppcrsurrace nd allsdowna sidcwall.but iscurtailed
beforereachingmiddistanceof theenclosure. hevelocityrangeor thecontourss from-0.02mls
to-+0.02m/s.hevelocityplots show luid risingfromthehot bottomplatenear hesidcwallsand
acceleratings t movesupwards.Notshownclearly n thepicturess thehigh evcioractivity in
thedirectlyopposite omer rormcdbetweenhe wosidcwalls)whereplumes irornhecold surracc
appearo flow down heopposite dgeof cnclosurcthebackedgesobscuredn thepictures).lic
generallow patterns thendiagonallyacrosshecoldsurracc.Much essactivity occursn the
other wocorncrs,butagain heplumes ise n onecomerandrail in thediagonallyopposite omcr.
11crcappearso be essmovementn thecentralcore.Thecore emperatures rairly uniformand
constant,hemixed emperatureeing hemeanof thehotandcoldsurfaceemperatures.ome
large-scalestructures f theflow arcevident,with upward low in thecomcrviewed.Thefindings
from hecomputationalnalysis, omparewell with theobservations aderomtheexperimental
work.Allowing for thechangen the emperatureiffcrcnccbetweenhecxperimcntalwork
(approx. 0K)and hecomputation10K),thesize, hespeed rpropagation nd heperiodof
releasef theplumesromthehot bottomsurracc rcconsistentetweenheexperiment nd he
computational ork.Time historyplotswereonly producedorthe IOKunsteadylow solutions
and heonly experimentalatawasgiven or the30Kconditions. 'hevclocity magnitudeompares
well with a valueof -0.02 m/s cstimatcdromtheadapted sacda ndWatanabe's19891
cxprcssionor theupwardvelocityscaleat theedgeof the hermalboundaryayer,Equation .13.
Thiscquationwasdeducedromexperimentsn wateraboveaheatedlat plateandwhenadiptcd o
thecurrentnotationgivesa maximumvelocityof -8.5%1(OATgd)a*"6.
Two movie clips of theCFDrcsults rorthcunstcadylaminar, I OKtcrnpcraturcdifrcrcncc I IC case
showing the vertical velocity andtcnipcraturecontoursarc includedon theCD disc attached o the
thesis.Figures3.3 and3.4 were taken rrom these wo movic clips. Filcimmesarc 'vclmovicdtlO' for
thevertical velocities and 'tcnipmovicdt 10' ror the temperatureplots.
54

7/28/2019 Chew Packwood N Turner
http://slidepdf.com/reader/full/chew-packwood-n-turner 77/343
Figure 3.3 Contours of vertical velocitv, IfC case. unsteady, laminar flow. Ra = 5.83%10'
(AT= 10K).
A 11911 h. Time #4 sec- 0.0 18
a. a Iý
0.006
0.004
0.002
IL^,
bm-9w
0.000 41 450.002
-0.004llqýk
-O.oa6 I'llile 412 ,cc
-0.008-0.0 10
-0.0 1.1
-0.0
14
-a.a 16
0.0 is -7-0-020 4f-j040.
55

7/28/2019 Chew Packwood N Turner
http://slidepdf.com/reader/full/chew-packwood-n-turner 78/343
a. Tinie 0 scc
c. Time ý8 scc
3O1
305.9
305.8
305.6
I
305.2
10 S.1
305.0
104.9
304.8
304.7
304.8
304.5
304.4
304.3
104.2
304.1
104.0
Figure 3.4 Conlours of temperature, 11Ccase, unsteady, laminar flo'A. Ra ý 5.83%109
(A'I'=IOK).
56

7/28/2019 Chew Packwood N Turner
http://slidepdf.com/reader/full/chew-packwood-n-turner 79/343
3.5.2.2 ficat trati%1'er
Figure I. SShows dic calculated licat transfer rales I'Mill the 101) nd bottom stuflicc'. as .1unction of'
hine for a Rayleigh number of'2.3x 101(l.Since these fluxes are averaged o%crthe walls. the
variation withtime
is perhaps surprising. and musthe due to the time dependent large-scale flow
structures. In an experiment some %ariation ofthe top and NIton, surface temperatures might also
he expected. but cannot occur mvith he houndary conditions specified in these calculations. Such
eflects might danip out some ofthe variations in the lical flux seen here. Obviously, with adiabatic
sidewalls, the t1me-averagcd licat input from the bottom plate should equal the output from the top
plate. 'rhe numerical results are seen to satisfy this condition.
11000
Figure 3.5 Calculated %arialion of hem tran%ler on the lop md hollom -. jrf. ice% for 14.1
2..1%10"'(%T 40K).
\ýciagc Ntissclt numhas 161.ach casc \%Cl. ohlamed h\ 11111C\ c1liging the smLik., 11C.1111,111,4ci
rates over a period of' I minute. As previously tiowd the Nu%seltnumber is del ined us,,,, lie
ho(-to-cold plate temperature difference, while thc Ravleigh number definition uses (lie full
temperature differcrice. Unsteady laininar flow CFD heal transfer result-, for four Rayleigh numhers
-ire presented in Table 3.3. The table shows that (lie lical transt'cr is most accurale at the lower end
17
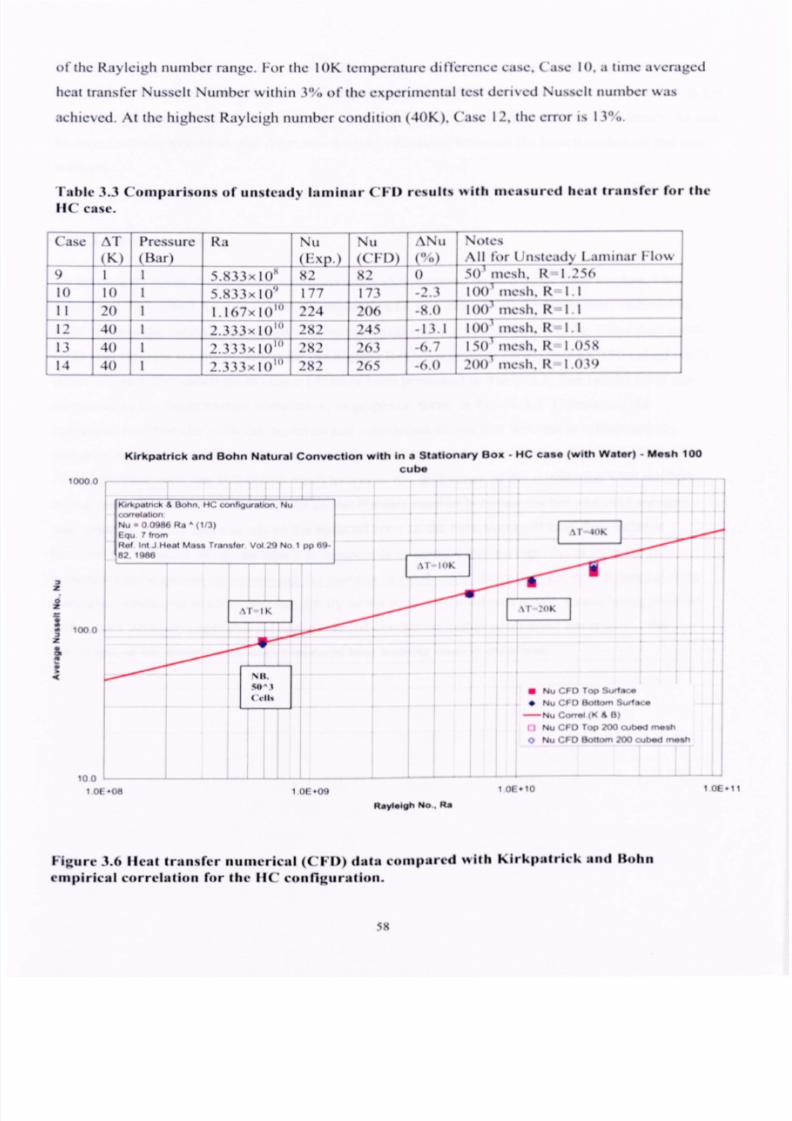
7/28/2019 Chew Packwood N Turner
http://slidepdf.com/reader/full/chew-packwood-n-turner 80/343
of* he Ray eigh number range. I-or ilic I OK temperature (I 'lerence case. Case 10. a time averaged
heat transfer Nusselt Number within .1"o ol'the experimcn(al test derived Nusselt nuintwr was
achieved. At the highest Rayleigh number condition (40K). Case 12, the error is 13"..
Table 3.3 Comparisons of mWea(IN laminar CIA) resufts "ith nica%ured heat (ran%fer for the
11Ccase.
Case
12
1.1
14
10000
AT
(K)
40
40
40
PressureBar)
I
I
Ra
s.833 10.ý5.8,
ý1.1Io"
1.167x 10
2.333xI()
2.33 3,10
2.3.1.1,10
Nu
(1.,Xp.,
177
224
292
282
282
Nil %Nil
82
17.1
206
245
261
265
-2.1
-8.0
-
1.1.1
-6.7
-00
No1c..NAll fOr t Lanlinar Flow
501 IZ 1256
1001 IICNII, Z 11
1o01 lllcili, IZ 11
1001iiieNli, IZ 11
150, nics11.Z I'(M
2()()'tnic%h,[Z 1ýO
l)
Kirkpatrick and Bohn Natural Convection with In a Stationary Box - HC Case (with Water) - Mash 100
cube
K, ti,; ),2tr, c,k & Bohn. HC oonfiguration. Nu
, wolat. on
Nu -0 0986 Ra ^ (113)
Equ r from
Raf Int J Heat Mass Transfer Vol 29 No I pp 69.
82.1986
1000
1001Of -08
MI .". ^3
Celh
I
I OE 09
1(1k
Rayi*igh No. Ra
%I "(I
9 Nw (. 1 D foJI'vulla, -
40 Nu CFO "tom SurfWA
- Nu CornW (K A 13)
fI Nu CFO Top 200 cubed Mesh
0 Nu CFO Bottom 200 Cubed MOO
I OE#IO
Figure 3.6 Ifeal traiisfer numerical (111t.compared "ith Kirkpatrick and Rohn
empirical correhilion for the IfC configuration.
Al, IK
I OE-11
ss

7/28/2019 Chew Packwood N Turner
http://slidepdf.com/reader/full/chew-packwood-n-turner 81/343
The results obtaincd from using the 100-cubcdmcshhave beencomparedwith theexperimental
derivedhcat transferNu-Ra correlation in Figure3.6. The CFD heattransfercompareswell with the
experimentalcorrelation with a small deviation at the higher Rayleigh numbers(13% crror). As can
beseen rom the graphicalplot therewas a small imbalancebetween he heattransferson the two
surfaces.
3.5.2.3Xlesh dependency
To investigatemeshdependency,solutionswerealsoobtained n twoother incrmeshes. 50-
cubedand200-cubcd.n these asesheexpansionactors way romthewalls were educedn
order o keep heratioof maximumo minimumgridspacinghesame sfor the 100-cubcdmesh.CFDheat ransrcr esultsobtained orthehighestRayleigh umber40K)usingaI 50-cubcdmesh
(Case13)and200-cubcdmesh Case14)havebeenpresentedn Table3.3. Theresultshavealso
comparedo theexperimentalorrelation,n graphicalorni, n Figure3.7.Comparinghe
numerical eat ransrcrwith theexperimentalorrelation howshatwith mesh efinementhe
disparitybetweenhenumericalesultsand heexperimentalatacorrelationwas educedrorna
13%difrcrcnccwith the 100-cubcdmesho within6%difrcrcnceorthe correlationwith the200.
cubedmcsh. n addition, hedifferencen theNusselt umber etweenhehotandcold surfaces
was educed. his isduedirectlyto thereduced rror n the imeaveragedicatflow balance
betweenhesurraccs. rom heplot it is reasonableoassumehatnosignificantncreasen
accuracyanbegainedby increasinghenumber f mesh ellsabove200-cubcd.Numericalests
werealsoconductedo show hatsensitivityo the imc-stcp sedwassmall.Considering ossible
differences etweenexperimental ndmodelled onditions ndexperimental ncertainty.he
agreementf thesimulationswith measuredeat ransferatessexcellent.
59

7/28/2019 Chew Packwood N Turner
http://slidepdf.com/reader/full/chew-packwood-n-turner 82/343
Kirkpatrick and Bohn Natural Conv*ction with In a Stationary Son - HC caso O*Ita T- 40 dog (with Water)
zw u
2900
2?0 0
2600
250 o
2400
8 Nu CFO Top Surfam
Nu CFO Botlom Surlacci
Nu Coffel (K & 0)( lIs
2(k)- I
( c1l,
I(X)* I
CCII,
.
a
A
Kw"nck OMM141%0bol
Nu -0 00" ma , (113)
Equ I from
l4of I," i H" Mvas Tt anow Val 29 No I pp
1U06
230 o
0 OF 00 1OE-06 2 OF Oki I OF 0(1 4 OF 06 5 OF 06 n Of -00 Of .06 AOC (14% 9Of -06
CFD Moth Numberof Co*o
Figure 3.7 Ileat transfer numerical (CFD) re%ults compared %OlhKirkpalrick and Bohn
empirical correlation for %arious niesh sii.e, .
3.5.2.4 Temperature lield
Figure.1
Xa sho%%s ;I time series record ot'llic let npcra I tire calctilated at tile inter Im Otm l1k)"It Im"'.
gnim above the bottom surface and Sinin below (lie top surface for the IW configuration. I'liese two
posltl Ions correspond to the thermocouple probe locations Ili the experimental test. Flus particular
lime series is flor the temperal tire diflerence of'40K oil the I W-cubed inesh. The (line step used in
the computation was 0.2 seconds. The plo( shows thermals rising firom the bottom surface and
falling From the top surt'ace Crom the spike-., Ili the temp,erature. The magnitude of'the temperature
disturbance is ol'the order ot'2K. Thc period ot'llie thermals is of* the order of'6 to Ss. Comparing
with the ineasured temperat tire data (temperat tire difference 30K). the magnitudes of* the
calculated temperature fluctuations are similar (IK Ili the test). but the period ol'the thennals is
greater (4s Ili the test). III addition. the number ot'dierinals released over a set time is less Ili the case
of*1he computational analysis compared to (lie experiment. The choice of'the Mile step and Illesil In
the computational analysis may have Ili influence oil the temperature magnitude. the perrod and tile
1'requency of'the release ol'tlic thermals.
4
0
60

7/28/2019 Chew Packwood N Turner
http://slidepdf.com/reader/full/chew-packwood-n-turner 83/343
Temperature record for HC configuration - top and bottom of the enclosure
Temperature difference a 40 degrees
Omm bobw cold top surlace
6mm aWvo hot bottom sudeco
9
4
1'' I,Tinbe (s)
1,
100
Figure 3.8a Computational analysis -- temperature record for IW configuration %%ilh%F
40K for the 100-cubed inesh.
Temperature record for HC configuration - top and bottom of lh* enclosure
Temperature difference - 10 degrees
- Aetwnmk mý iid top eingon
elmm abow0 hat botbwn aufface
4
IK
C) 20 40 60Tinw (*I
so 1w
Figure 3.8h, Computational anulý, sis - lemperal tire record for Ifc configuration "ith NU
IOK for the 100-cubed mesh.
IA)
120
ol
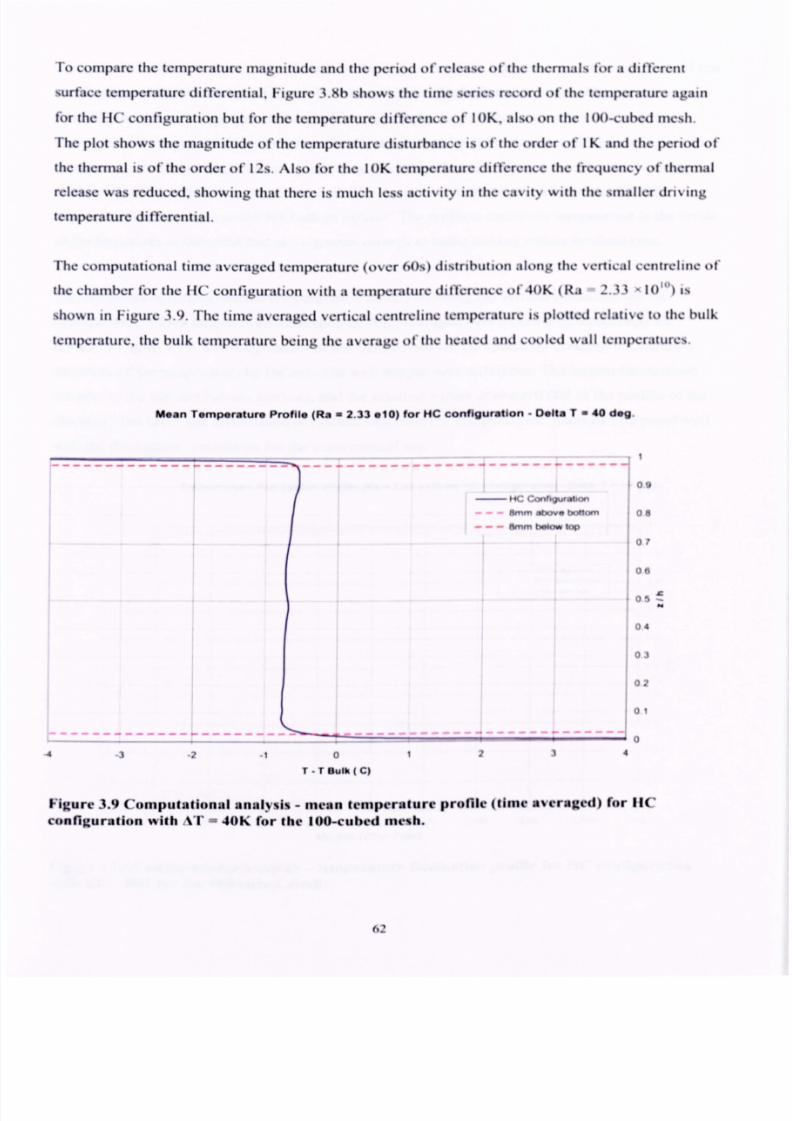
7/28/2019 Chew Packwood N Turner
http://slidepdf.com/reader/full/chew-packwood-n-turner 84/343
To compare the temperature magnitude and (lie period of'release ol'the thernials tor a diflerent
surflace emperature differential, Figure 3.9h shows the unic series record ot'llie temperature again
for the IfC configuration but for the temperature difference of' IOK. also on the I(K)-cuhcd mesh.
The plot shows the magnitude ot'llie temperature disturhance is of' the order of' IK and the 1wriod of'
the themial is ol'the order of' 12s. Also lor the IOK temperature difference the 1requency of*(hernial
releasewas reduced. showing that there is much lessactivity in the cavity with the smaller dri%ing
temperature diflerential.
The computational time averaged temperature (over 60s) distribution along the vertical centreline of'
the chamber flor the I R' configuration with a temperature dillerence of'40K (Ra 2.11 - 10"') Is
sho%knn Figure 3.9. The tune averaged vertical centreline temperature is plotted relailve to the bulk
lemperattire, the bulk temperattire heing the average ofthe heated and cooled wall temperattires.
Mean Temperature Profile (Ra - 2.33 sIO) for HC configuration - Delta Tm 40 dog.
11-------------4
mc C4)nf4px~
Smm abovo "om
Hmm holow lop
012
T-T Bulk ( C)
09
os
oI
06
S
04
() 3
()2
0I
Figure 3.9 Computational analysis - mean lemperature profile (time averaged) for IfC
configuration with AT ý 40K for the 100-cubed mc%h.

7/28/2019 Chew Packwood N Turner
http://slidepdf.com/reader/full/chew-packwood-n-turner 85/343
The plot shows that the core ofthe fluid is within IK ofilie bulk Iempera ire. The experimental test
results showed the core temperature it) be %ýthin 0.5K ofthe bulk temperature. *['lie experimental
results also showed a slight temperature reversal near the top and Nmom stjrf*ace%.ue to the
thernials traversing across the enclosure. The computati.onal results %how he diflerence in (fie nican
temperature and bulk temperature is slightly sinaller than the unilonn core temperature near (fie top
surface but there is no temperature reversal. The mean core icnipera I ire is less than the bulk
temperature except close to the hot bottom stirtace. The uniforin centreline lemperature Is the result
of (fie formation ofthermals that are vigorous enough it) cause mixing within the fluid core.
, he computed non-cliniciisional temperature fluciuations along the vertical centreline llor I R'
configuration with a temperature difference ol'40K. averaged over a period of 60 seconds are
shown in Figure 3.10. The magnitudes of' the flucitiations are computed by (hviding the standard
deviation ofthe temperaitire by the hot-cold wall temperature difference. I'lic largest Iluctuanolls
are near to the top and bottom surfaces. and the smallest values ofahout 0. (9)2 in the middle ofthe
chamber. The level and distribution o I'll tict uat ions 1rom the compulational analysis compared well
" ith the fluctuations calculated lor the experimental test.
Tomp*rature Fluctuadw Prordo (Ra m2.33 *10) for HC connguration - Do*a Ta 40 d*g.
bi- I. V
Ill,Sld D*v I (Thot -Tctpldl
I'.
"1
09
04
01
41
cN
t 11
03
ol
01
Figure 3.14)Computalional analysis temperalure fluctuation profile for IfC configuration
%ith AT = 40K for the 100-cubed mesh.
63

7/28/2019 Chew Packwood N Turner
http://slidepdf.com/reader/full/chew-packwood-n-turner 86/343
Variation of'point values oftemperat tire with time shows randoin fluctuations and is,smular to Ille
thennocotiple measurements. Fhepredicted temperai tire fluctuation spectnim F(m) obtained from
(lie temperature variation with time at a position Smin above the heated plate is showi ill Figure
3.11. qualilit"', is dchiled Such that
T'T' f E((,))(I(,
where (t) is the frequency of the temperature fluctuations J- and the overhar denoles a tune avera...
These results were obtained 1rom simulations on the I 00-culwd mesh for Ra 2.1- 10"'. The Ii me
Step used was 0.2 s and [lie Fourier analvsIs used data from a period of' 120 seconds. The figure
includes a --5/1" trend line to allow comparison with dependency expected for isotropic turbulence
in (lie inertial subrange and observed in many experiments. Qualitatively. the spectrum has (he
properties expected ofa turbulent llo%k,.with numerical effects m the higher 1requencies.
I. E+01
1-E-01
1.E-03
1.E-05
1 E-07
1 E-09
1 E-11
0.01 0.1 1 10
Frequency Hz
Figure 3.11 Femperature fluctualion %pectruin from reference pohil Xmin abo%cbo(lom plate.
Ra 2..1% o", (.%-I- 40K).
Further to Iliesc calculations for the waler-filled cube. additional calculations %%crcerformed for in
air-Mcd cuk A Sun and Clew INNNI also using FLUENT. I-lie 1wrlect gas Ia%%was used in the
(A

7/28/2019 Chew Packwood N Turner
http://slidepdf.com/reader/full/chew-packwood-n-turner 87/343
CFDanda Rayleighnumberof 0.542x10⁸wasachieved ysettingg-9.81 m/s2with a temperature
differenceof 20Kat apressure f 1.013405Pa.A 50-cubcdmcshwasuscd.TheavcragcNussclt
numberwasover 10%higher han hatgivenby KirkpatrickandBolin'scorrelationwhich is ror-
I.OxIO9<Ra<- 1.45x10¹⁰), ut in goodogrccmcntwitlithercsultsgivcnby I lollandsct41(19751
for rrccconvectionwith air ror theRayleighnumber ange I. Ox101 Ra<- I. Ox101. n the
present otationhiscorrelationgivesNu - 2.88+0.111 al/3.
3.5.2.5Scallng
Asacda ndWatanabe1989] ound hatfromtheboundary eat lux and he luid properties
averageharacteristicsuchas he hermalplumedimensions,hevcrticalvelocityof theplume, he
frequencyandperiodof the hermalplumes ouldbedetermined.llickncss of theconduction
boundaryayeraway romthewall canalsobecalculated.
As mentioned n Chapter2 AsacdaandWatanabedefineda flux Rayleighnumber,Rafas,
Raf-go Fd 4 /(pCpCtIV) (2.7)
Avcragc rcqucncyof thmnal plumcsgcncratcd crunit arcaandunit timc,f was hcndeterinincd
as,
(d4 f)/a-5.6x 10'511ar ( 107< Raf< 1011 (3.13)
Pcriod,P,during which the thm-nal was suppliedwith the licatcd fluid rrom theconduction
boundary aycr, wasdetcrrnincdas,
(Pa)/ d' - 9.9 Rar*112 ( 107< Ra(< 1011 (3.14)
Thicknessof theconductionboundary aycr, 8,
8,; d- 27.1 Ilar'" ( 103< Ra(< 1013 (2.8)
I lorizontal longitudinal scale of the thcnnal, L wasdctcmiincd as,
L/d- 33.0 Ra(*"4 ( 107< Ra(< 1011 10)
I lorizontal transverse caleof the thcrmal, B wasdctcrinincd as,
B/d- 16.0Raf 1/4 ( 10' < Ra(< 1012)
65

7/28/2019 Chew Packwood N Turner
http://slidepdf.com/reader/full/chew-packwood-n-turner 88/343
Vcrticalvclocity,w wasgivcnbycquation,
(Raftv,= 8.0(PATgy ý.
L_(2401<ltat<24010)
d'
)(2.13)
and PAT g-2.08 (ct2v)'1112PFg/p pp)114 (2.90)
Timestcp,At At-1/w
where -3.05inm average istance cross cell
(3.15)
Using heaboveequations,or a tcinpcraturc ifference, ottocoldsurface,ATor40K
I [catFlow- 930.628W and Icatflux. F- 10004.1Wm*'. Ra(- 2.972x 10¹¹
f- 2747.92M,2s"' - 255.621 z, (one hermalevery0.004s).P-3.74s L-7.67mm B-3.72mm 8, - 1.4971nm -0.0 1361ns*At - 0.225swhichgivesaCFL- I comparcdoCFLft 0.9for a timesteporO.2s roranaveragedistanceacross ccitor3.05mm.
and ror aAT of I OK
I featFlow- 156.434W and [cat flux, F- 1681.63Wni*', Ra(- 4.997x 10¹¹
f- 461.91M,2g*l- 42.971 z, (one licnnalevery0.023 ).
P-9.12s L- 11.97mmB-5.80mrn 8, - 2.557ininw-0.0087m:Cl
At - 0.351swhichgivesaCFL- I comparcdo Cr-L ms.6 for a timestepof 0.2s oran averagedistance cross ccli or3.05nim.
Both the numerical and the Kirkpatrick and Bolin cxpcrinicnt3I rcsults comparewcll with tile
Asacdaand Watanabecalculationsror theplunic dimcnsionsand tile thicknessof tile thermal
conductionboundary ayer. With theCFD mcshrcrincd nearto the wall. the near wall cell
distribution falls within theAsacdaand Watanabedcrivcd conducting layer thickness. hus
capturing the thermalactivity nearto the walls. With the 100-cubcdmcsheight cells rail within the
conducting layer thickness.The calculatedperiodof plume releasecompareswcll with the
experimentbut the CFD produccd25%-50%longerpcriod. The plume releasevclocity for tile CFD
resultsare in line with thecalculatedvelocity or-o. oinvs.
66

7/28/2019 Chew Packwood N Turner
http://slidepdf.com/reader/full/chew-packwood-n-turner 89/343
3.6Conclusions
In thischapter,esults romnumericalCFDsimulations f ilia experimentalestspcrronncdby
KirkpatrickandBolin for thenaturalconvectionn acubicalenclosurewith diffcrcntiallyheated
andcooledhorizontalandverticalwallshavebeenpresented.articular ttentionhasbeengiven o
theconfigurationIC casewherelia bottomsurfaces heated nd he opsurface ooled.with all
othersurfacesonsidereddiabatic. henumericalesultshavebeencomparedo theexperimental
resultshroughout.
TheCFDderivedheat ransrer ompares ell with theexperimentalorrelationwithonlya small
deviationat thehigherRayleighnumbers. heCFDsimulations lsoshow hat heheat ransrcr
computedy theunsteadyaminar low model tinic-avcrage usschnumber)was hemost
accuratetthe owerendor theRayleighnumberange.'lic steadylow modelassuming
turbulencek-cwith thek-c/W nearwall model) aircd heworst.11c useof this turbulence
modelappearso dampdown he hermalactivity within thecavity.
Comparinghenumerical eat ransferwith ilia experimentalorrelation howshatby refining hemcshhedisparitybetweenhenumericalesultsand heexperimentalatacorrelationwas educed.
Inaddition,hedifferencen theNusscltnumberbetweenhehotandcold surfaces as educed.
I'his isduedirectly o thereduced rror n ilia timeaveragedeat low balance etweenlia
surfaces.
The findings frorn the numericalanalysescomparewell with theobservationsmade rom the
experimentalwork with thesize, the speedorpropagation and the period of releaseperiod orthe
plumesbeingsimilar. The numericalanalysesalso agreewith theexperimental indings that the
heated loor appears o promotemixing in thecavity andeliminatestemperaturestratification.
67

7/28/2019 Chew Packwood N Turner
http://slidepdf.com/reader/full/chew-packwood-n-turner 90/343
CHAPTER 4
COMPUTATIONAL FLUID DYNAMICS SIMULATION FORCONVECTION IN ANENCLOSEDROTATING ANNULAR SECTOR CAVITY
Summary
This chapterextends he CFD simulation of naturalconvection in a stationaryheatedcube
discussedn thepreviouschapterto the modelling orconvection in a rotating enclosedannular
sectorcavity. The computationswerepcrroancdassumingunsteady low andthe resultshavebeen
comparedwith otherworker's experimentalmeasurements ndnumerical predictions for heat
transrcrand other flow ficid parameters.Somegoodagreementwith experimentalvaluesfor mean
surface icat transferhas beenshown for Rayleighnumbersof theorder 1010.1owcvcr therearc
alsosomepoor resultsfroin the CFD simulationsof the scaledrotating sector.The reasonsor the
discrepanciesn the hcat transferresultsbetween heexperimentalandCFD predictionsarc
discussed.
4.1 In(roduction
Both experimental nvestigationsand numericalsimulationswerecarried out by Bohnct al [ 19931
to analyse heconvectiveheat transrcr n a closed,gas-fillcd annulusrotating aroundits horizontal
axis using a rig in the Institute orStcam andGas Turbinesat theTechnicalUniversity orAnclicn. A
brief descriptionor the experimentsandthe threetestconfigurationswere given in Chapter 2,
section2.3. The configurations tested n theAachenexperimentareshownin Figure 2.2. It is to be
notedthat theradial distancebetween he innercylindrical wall and outercylindrical wall ror
configuration A wastwice the distanceorthat for configuration 11.lic axial lengthwaskept
constantfor both of theseconfigurations.Results rorn theexperimentand numerical simulation
werepresentedor thepure radial or centripetal icat flux situation, wherenaturalconvectionradial
licat transrcrfrom the heatedouterwall to thecooled inner wall occurs(with the side wall thermally
insulated),driven by thebuoyancycffect underrotation. Furtherwork to investigate he effect or
dividing theannulus nto sections,by insertingeight radial separationwalls to rorm a 45*sector,
configurationC (configuration 11with a 451sector)wasalso pcrrormcdon theAachenrig. In the
cxperimcntal investigations he range of rotational Raylcigh numberencounteredwasbetween1.0x
68
7/28/2019 Chew Packwood N Turner
http://slidepdf.com/reader/full/chew-packwood-n-turner 91/343
107and 1.0x 10¹². steadystatenumerical investigationwas performedby Bohn ct al. assuming
isothermalcylindrical walls and adiabatic sidcwalls for the45* sectoredannularcavity. Bohn ct al.
[ 19941also used heAachen rig to investigate heaxially directed licat flux case,where one disc
sidcwall washot and the oppositedisc was cold with all the other walls thermally insulated.Only
configuration B wasconsidered n that investigation. In addition to theexperimentalwork, Bolin ct
al alsoconductednumerical calculations for thepurely axial heat ransfercase.
UnsteadyD CFDmodellingof convectionn a rotatingenclosed nnular ector avityhasbeen
undertakenn thepresent tudy.Only the450annular ector ase, onfigurationC,with radial icat
flow hasbeen onsideredn thiscurrentwork.Fortheradialheat low condition,heatwasapplied
to theouter adialcylindricalsurface nd he nner adialcylindricalsurfacewascooledwith all the
othersurfaces ssumedo beadiabatic. Icatflow is thcrcroren a radially nwarddirection,similar
to the IC case onsideredor thestationary ubc.Further oncurrentworkbySunandChcw
[2004]usedunsteady D CFDto model heflow andheat ransrcrwithin thesame nclosed
rotatingannulus singboththeconventional -c turbulencemodelandby LES.
4.2 Description or me Experlment
The dimensionsof theenclosuresare given in Figure 2.2. For theradial beatflux tests.an electrical
heaterplaced at the outcr radius of theannuluswasused o input heat nto thecavity. I feat is
removed rom thecavity by a water-cooled rotor shaft at the inner radiusof thecavity. Both thedisc
surracesof thecavity were thcrnially insulated.The cavity could bepressurized.lic rotor shaft was
driven by a DC motor. The test fluid contained n theenclosureswas air. I feat fluxes from theouter
cylindrical wall to theworking fluid and rrom theworking fluid to the inner cylindrical wall were
determinedby measuring he temperaturedifferencesacross hermally resistant ayers. During the
experiments he rotor speed, hecavity pressure,electriccurrent to theheaterandthe mass low rate
of (hecooling waterwere kept at constantfor each estcondition. For the radial heat flow tests he
maximum rotor speed estedwas 3500 RPNLThe maximumpressuren thecavity could be set up
to 4 bar.I'lic temperatureat the outer heatedcylindrical wall could be increasedup to IOOOC.7hc
minimum temperatureat the cooled surfacewas fixcd by thecooling water,which wastaken from a
water tap,with a temperaturebetween80Cand 15*C.For the purc axially heattransfertests here
wasnine thin-film resistancehermometersocatedacross he lengthof the inner andacross he
outer surfaces.Therewere also 18thin-film thermometersdistributedacross he rotor disc surraccs.
The accuracy n theabsolute emperaturemeasurements as0.01K.
69

7/28/2019 Chew Packwood N Turner
http://slidepdf.com/reader/full/chew-packwood-n-turner 92/343
The emperatureifferenceused n dcrivingtheRayleighnumbers thediffcrcncen temperatures
of thehotandcoldwalls:
Rotating Raylcigh numbcr, Ra, =(r.
w3XTL3 lv2)Pr
RotatingReynoldsnumber,Reo=par. Llp
Nusseltnumbcr,Nit - -2.qA
Eckcrtnumbcr,Ec2c,AT
4.3 Test I Icat Transfer Alcasurenien(s
(4.1)
(4.2)
(4.3)
(4.4)
As mcntioncdcarlicr in Chaptcr2, scction2.3, from the licat tr3nsrernicasurcmcnts,Bohn ct al.
dcrivcd both Nussclt-Raylcighnumbcr and Rcynold-Raylcighnumbcr corrclations or the Icst data
for configurationsA, B andC assurning adial dirccled licat flow:
ConfigurationA: Alit- 0.246Rao.2.11(2.31a) Re= 0.733Rao.173 (2.31b)
ConfigurationB: Alit= 0.3Maoo 111 (2.32a) Re- 1.441Ra.015' (2.32b)
ConrigurationC: Nu = 0.36SRa,.21) (2.33a) Re- 1.615Ra#15% (2.33b)
Ilic Aachen measurements obtained from the radial directed heat flow tests showed that changing
the inner radius to give I Ur,,,- 0.96 (Config. A) and to I I/rn- 0.63 (Conrig. 11)had only a small
influence on the Nu number. At the higher Ila number the heat transrcr was reduced by 11%
moving between configurations A and B. With the annulus divided into sections. by inserting radial
separation walls, the influence or the Coriolis rorccs is reduced resulting in an increase in the heat
transrcr. At the higher Ra number the heat transrcr was increased by 20% moving between
conrigurations B and C. Insertion orthe separation walls attenuates the rclitivc circumrcrcntial
vclocity inside the cavity, resulting in a decreaseof the radial component of the Coriolis force.
Coriolis forces have a damping crfect on the flow, thus by attenuating the Coriolis forces flow
70

7/28/2019 Chew Packwood N Turner
http://slidepdf.com/reader/full/chew-packwood-n-turner 93/343
Insidc Ific C; \ If\ is "lrcllý4111cllcdo Illat llic Iloat liall"k. -I In,. rcaw-, Vot the tadialk ditcctcd licai
flo%%ase heat transfer depends strongly on the Ra number bw onINI %%caklNn the Re number,
4.4 Numerical Model of('olj%t. cIioll ill.1
scaled 14411.11ing Sector
4.4.1 Ba%ic modelikig awimptiol1% and IIIc 1111111crical roct-dul. t.
ii
111111111
4
mill
I 1111.11Ii
II,, mm
I i'ý. Il It,
.4.1 ( 'collicl I'.N of % clicil I olatilig 1111111111% 1.2 Nli-%Il ill %.dIvil
lol. 11111",,ck II It' III. It HIII(IJ1,11111
1
will" 'indOw
Ine"ll used 1,01-ile calc 11it ions I., it III I igmv .421t 1" .1noll t1ill for III Ille"ll %%ilt I
cells I ()()x I ()()x 100 1t ax lal. ladial and cit-cunifei-ent tal dit cc[ Ions. respect I% ly I. ( 'onipai lilt! it)
earlier- %koik. tile inesh iesoltition maý he regai-ded as icasonable for file prewni case. %%lilta
slifficlently fille mesh it) k'apiul-c file 11(m near, lo tile li)l; l(lllg %%aIk A'.-colding to Bolin Ct A
I 1101)1. fllcý obial lied good (TI) ,()lilt Ions %%it ;I mc,, h %%ilt 1(o)(4) cel 1%\%ihin I \% ile range of
Raý leigh minihm AI I&I to M I" kw Ow 45 wool I "o briller "inlies We !well
coII,. Ie ret IIe re. ýIctw;I, cIII to II %%iI1 125AHWceHs150\qI\s ()); IIIti. I t- II IeiIIIIe-, II %kII1.1.17S. o(
cells ( 150% 50\ 1SO)\%cregencrawd (4)check 111c"llicimidelice
Sc%era I lem cases were winianhoed "ah We 6dlo"mg pmamoo% n ANN"wn QIM 40 ads).
I MOK and c; \ itv pressuic, 1',, lbal I, \kas \a II Cd to gI ie a lange tIf Cond II It ns I' mI lie
ina, tinium 1,. considewd ( 140K) gi\ Ing aA F( 1- IJ -10K. the rolanonal Raý Icigh nninher I%
Ra (VPr 33H 109, and Ockert iminhei I,. I-c () () I S*ý.%%ere (lie Icngth scale used in defining Ra
(1 45 dc.t, I.
Aro-*-ýP,11,111,111
I

7/28/2019 Chew Packwood N Turner
http://slidepdf.com/reader/full/chew-packwood-n-turner 94/343
is L-r. - ri.Thetemperatureradient,due o thepressureradientacrosshevortex n tilecavity, s
expectedo benegligible or thissmallvalueor r.c.TheNusscltnumberusedn thissection ollows
thedcrinitiongivenby Bolinct al, andnormaliscsheradialheat lux by thevaluegivenby pure
heatconduction,oNu - 40 . n(r. rj)/kAT.Three urthershroudemperaturesivingAT equal o
IK, IOKand30Kwerealsoconsidered, ith correspondingayleighnumbers,Ra 1.141 8,
1.092E9and2.973139,ndEckertnumbers,Ec- 0.7275,0.0727 nd0.0242respectively. he
working luid wasair for all the estcases. hegridexpands way romeachwall with an
expansionatio or i. i ror tile I 00-cubcdmesh. or the50-cubcdmcshand150-cubcdmcsh ile
expansionatiowassetsothat hefirst ccil distance way romtile wall was hesame sfor the
I00-cubcdmcsh.
The computationscarriedout solve the conservationequations or mass,momentumandenergy
using the FLUENT CFD code. Incompressiblenow with thedensity dependenton the fluid
temperatureonly was assumed hroughoutall thesimulations.Standard luid propertiesfor air were
assumed onstant,with a spccific heat(Cp)of 1004.4J/kgK, thermalconductivity (k) 0.026 %V/mK
anddynamic viscosity (p) 1.855E-5 kg/ms.The CFD calculationswere performed assuming
unsteadyaminar flow ("pscudo" DNS solution). The FLUENT segregated olver, andsecondorder
implicit timesteppingwith the secondorder upwind schemeused
for thespatial
discrctisationwere
chosen or thecalculations.A time stepof 0.0005s CourantCFL numberto2.2 for the average
distanceacrossa cell of 1.15mmwhich is acceptableor the implicit solver) and20 iterationsorthc
pressurecorrectionschemeper time step were spccificd. The time stepwastakeasbeing
approximately 1/100'hof the time for one full rotation ortlic cavity and the numberoriterations was
basedon theknowledgethat the flow solution residuals educedandbecamesteadyafler 20
iterations. The flow wassolved in the relativevelocity reference rame.The Prestoscheme
(Patankar,19801,a secondorder pressurecorrectionmethodwas set for pressurenterpolation for
the velocity. For the pressurecoupling method(prcssure-corrccton), theSIMPLE algorithm was
chosen.
4.4.2The governIng equations
1.Conservation
ofMomentum
Vvlicnhe low equations resolved n a rotating rarne f rcrcrcnce,heaccelerationf the luid is
augmentedyadditionalcnns hatappearn themoincriturn quations.Witha rotating rame he
72

7/28/2019 Chew Packwood N Turner
http://slidepdf.com/reader/full/chew-packwood-n-turner 95/343
problem anbesolvedusingeither heabsolute elocity.V or therelativevelocity,V', as he
dependentvariable.Thetwo velocitiesare relatedby [fie followingequation,
V,.; -(flx; ) (4.5)
here,6 is theangular elocityvector, heangular elocityof therotating rame,andF s [fie
positionvector n therotating rame.
Fora rotating crcrcncerame,hemomentumquationsanbewritten n termsof theabsolute
velocitiesas,
+v-V, 4;) +P(cl x -Vp +v-ý, V; ) (4.6)
at
or in termsof relativevelocitiesas,
a
Lit+V- (p;,
wVw)+1)(2CI ;,, +ClxClxF) - -71) +V- UIVO (4.7)
wherep(26 x ý. ) is theCoriolisforce.
2. Conscrvationof Mass
(4.8)
3.Conservationof Energy
(pE)+ V. (ý(,Pr + P)) . V. (kVr) + (11
01
cit(4.9)
whereE=h-L+ v'and D s theviscous issipationcnn.
1) 2
4.5 Numerical Simulation Results for the 45* Enclosed Rotating Sector Case
4.5.1 Unsteady flow FLUENT CFD solutions
4.5.1.1 Ileat transfer
Table4.1showshe est/model,onditions,otational peed. nd lia temperatureifference etween
thehotandcoldsurfaces,lia cavitypressure nd herotationalRayleighandEckertnumbersor
eachest.For heunsteadylow analyseshe otalheat low intoandout or ilia cnclosurehrough
73

7/28/2019 Chew Packwood N Turner
http://slidepdf.com/reader/full/chew-packwood-n-turner 96/343
thehot and cold surfaces, espectively, calculated from theCFD models were time averagedover a
periodof 5 seconds.T11cime averaged otal heat flow valueswere thenused o calculatethe
Nusscltnumber,Nu. for theappropriate surface. 'lic heat ransfercalculatedfrom theCFD models
wascompared o theexperimentalheat transrcrandthedifferencepresentedas a percentageerror,
ANu - (NUCMINuc,,p.
1).
Table4.1 Comparisonor theCFD results(unsteadyaminar now) %villtmeasuredheat
transfer for the Anchen45*enclosedotating sector,configurationC case.
Case Speed AT p Ra+ Ec Nu Nu ANu Notes
(rpm) (K) (bar) (Exp.) (CFD) (%)
1 2000 1 1 1.141xl5r 07-275 19.0 21.0 10.5 100' MCS1145* model
2 2000 10 1 1.092xlO" 0.0727 30.7 45.4 47.9 100' mcsh45* model
-3 2000 30 1 0.0242 38.0 69.8 83.7 1W MCS1143* model
4 2000 40 1 3.781xlO" 0.0182 40.0 73.6 84.0 100' mesh45*model
R-1.1
5 2000 40 -1 T, .781xl5r 0.0182 40.0 63.6 59.0 50'tncsh43*model11-1.256
6 2000 40 1 3.781xlO 0.0182 40.0 81.5 10.8
150' meshI I I I I43*modelR-1.038
Figure4.3 showsa plot of theaverageNusscltnumber,Nu verses otational Ray1cighnumber.Rao
forthe 1001ccllmesh.The figure also includesan adaptatioll to the rotating annulusoftheColorado Kirkpatrick and Bohn [ 19861 orrelation basedon their cxpcrimcnI of a natural
convectioncubc.The adaptcdColoradocorrelation wasobtainedby using the tcrnpcraturc
difference.AT between hehot andcold walls and rcplacinggravitational accelerationby
centrifugal acceleration.For this configuration it may bewritten,
I/)lum0.051Ra,, (4.10)
The predictedhcat transrcr s much higher than thatgiven by Bohn ct al's corrclation.Therewas
84%difference in theCFD predictedheattransrcrcomparcd,with theexperimental estcorrelated
heat ransfcrat the higher Rayleighnumbers,shownboth from the graph,Figure 4.3 andgiven in
Table4.1.1lowevcr a muchcloser fit is obtainedwhencomparedwith theadaptedColorado
74

7/28/2019 Chew Packwood N Turner
http://slidepdf.com/reader/full/chew-packwood-n-turner 97/343
correlation, with a good agreement at the higher Rayleigh numbers. In a subsequent study Sun and
Cliew 120041conducted a series of*(TD analyses for (lie same geometry using both FLUENT and a
Rolls-Royce code. I lydra overa range of' Rayleigh number%.Sun and Chew found that hoth CH)
codes over predicted the surfilce heat transfer compared to the experiment. Flie over-prediction was
XF. hm less than thebout 10"ý, o 20",, flor the Hydra code and approximately 40"o for FIVE
current predictions.
Bohn at al (Aachen) Heat Transfer in a Closed Rotating Annuli 45 dog. Sector at 2000 rpm
- HC case (wwrithAir)
10000
1X) 0
a
100
I OF 08 101-011
Rayleigh No, Re"I
f-.It. - 000 bir. -OdO
I
a
I OEOIO
Figure 4.3 Comparison of the predicted lical tramfer %0h c%1wrimental corrchiliom for the
Auchen rolaling sealc(l %edor, conliguralioo ( '.
I-igure 4.4 shows a comparison of'surface heat transfer between the CI-D solution and (lie
experiment in the form of time history plot for the 45 ' rotating sector. Fhee --ýertmenta heat
transt'er values were calculated using Bohn et al's heat Iranstler correlation (Fqu. 2.33). The time
step for the CIA) calculanons was 0.0005 s. and a simulation period ofat least 5 seconds was
required before it 'converged' solution could be assumed. Fhe %arialion ot'heat transfer %kth lime
indicates the presence oflarge-scale flow structures in the CIA) soltmons. but they are not ; s
prominent as those predicied by CFD t'or the natural convection in a stimonary heated cube shown
in the last chapter.
Hohý I al HC Nu,
Nu - 0365Rn A 0213
F,g a kom
%f ASME. 93-GT-292
a 100^3 Mesh, Nu CFD inner Radii Surlace
100^3 Mash, Nu CFD Outer Radii SurlaC4
No Corrotl (Bohn at al)
Nu Slatic Box (, orrfgl (Kirkpatnck & Bohn)
75

7/28/2019 Chew Packwood N Turner
http://slidepdf.com/reader/full/chew-packwood-n-turner 98/343
Bohn at at Heat Transfer In a Closed Rotating Annuli 45 dog. Sector. HC case - Delta T 40 dog.. 20OOrpm.
with a Mesh 100 cube, with Viscous Heating,
Inner & Outer Radii Surface Total Heat Flow
1300
1200
1100
1000
900
8001
7 00
Outer Radii Wall
Time Avoragt. (j Total I loat
[jiuw 1102/W--
OLAWRAdo,W id
OtAmr WA Smsc Time A%g
Tom wai Hem Fk)w
-Inner Ra6l W mi
-- Innow Wal 5soc. TIrnmAvU
ý.LUA0 P177771,
Test Total Heat I
Flow - 6.0M! J
Innor Radii Wall
Tmý A, -.. q-I T
1 ILL* 1-' Výý -
600 --
00 052
T nn (s)
Figure 4.4 Wall heat transfer from the CIA) %olulion and the Auchen rotating scaled %ector
c%perimentfor Ra4 3.781
%10"
4.5.1.2 F'Imý %trticitire and teniperature fleld
13 00
-1200
. 700
li 00
E\ammmg ilie flow field, It was lotind that ilic lical iranslcl- Is dominated bý a plllmlrý ýorlc\ I()\%.
instead ofthe radial arm siructures that may he expected for a full Ioo" annultis flow as identified ill
early work oil rolating cavity with axial tlirotjglillo%%by. for example, Farthing et al I 1992a. 1992bj
and Long and Tucker 119941.The flowstructure
is Illustrated by the inslamaneous temperature and
velocity plots in Figures 4.5 and 4.6. respectively. The contour plots are shown for the nud-axial.
mid-radial and mid-circuinflerential planes through the Cavity. Most of the llow actt%ly appears to
happen next to the circtinif'erciifial wall with the hot thernial plume% eaving the outer radial surflace
and moving to a circumferential wall whilst the cold denser plumes leave the inner radial wall and
travel to the opposite circunil'erennal wall. Willi all the ac(lvIiy near to the walls a central core of'
near uniform temperature is formed, with a temperature near to the inean ol'the inner and outer
radial surface leniperal tires. The radial velocity plot shows that the flowis
radially otawards closeto one circunillerential wall and radially inwards on the opposite circumferential wall. In the relative
frame the flow appears to rotate at approximately 5.0ni/s around a s(alionary central core.
76

7/28/2019 Chew Packwood N Turner
http://slidepdf.com/reader/full/chew-packwood-n-turner 99/343
Rohn el A (Aschen) 44" Rolmling Sector ( m%M%.
100 ( ulwil Mesh. Rotational %pred 2000 RP%l
340 0
3380
3360
334 0
I
3320
3300
3280
3260
3240
3220
3200
3180
316 0
314 0
3120
31003080
306 0
304 0
lio-I0
Joo 0
ConfounufMalk lcmpersture(kl
14i
001.1 lempoixtuic 441K
IDimclion of R:wýw=,nil
Figure 4.5 CFD predicted instantaneous temperature confour% for Rao = 3.781%109
Rohn cI al (Amchrn)45" Rcpimdnjj%rvlor( sO I%
100 ( ubed Nfeih. Ripinikinad Slwvti Z(MX) RP%f
I
55
50
45
40
35
30
25
20
1510
os
00
-05
-1 0
A
-30
-35
-40
A5
50
-!)5
1.0(Figurc 4.6 ('Fl) pre(licted instangancotis ra(Iial . clocitý- contours for Ra# 3.781-.10'
I
onkours of kji(UW %elotil% (m/%)
[IWeL-tion
tit R
17

7/28/2019 Chew Packwood N Turner
http://slidepdf.com/reader/full/chew-packwood-n-turner 100/343
Figure 4.7 shows the temperature variations at a monj ortng position at (lie mid-radial point oil the
mid-axial plane. This also clearly indicates the presence ol'small-scale flow acti%ty in the central
core ofthe rotating cavity. The temperature plot shows that there is a distinct drop in temperature
(approx. 0.5K) halfway through the 5-second sampling period. This drop in temperature does [lot
appear to influence file surface heat fluxes. I lowever flor other Rayleigh number casesdismict
changes in the heat fluxes, both increasing and decreasing. have been seen to occur during the CIA)
analyses. Reasons flor these sudden changes have yet to he explained. The first step %%oulde to rull
the solution over a longer time period to see H*acyclic irend is produced or not.
Bohn at &I Heat Transfer In a Closed Rotating Annull 45 dog Seclof. HC case -Oefla T 40 dog, 200orpm.
with a Mesh 100 cube. wAth Viscous Hosting.Cavity Contra Po4nt Temperature
Gowe Pam T--pwdb"
(, w*o IN TwM %soc nu AV
32480 1
32460
32440
00 os 10 10
4
Tim* (a)
lu, ý Aý-wjj I -11mah"
- .114 914 K
40
Figure 4.7 CFD p redicled fentperit I tire plof itI Ili e cit%i ) cc t Ire for Ru# 3.78 1% 0"
4.5.1.3 Mesh dependenc)
Figure 4.9 shows the CIA) mesh sensitivity for (lie highest Ra number case using (lie three meshes.
the 125.000 (50) cell mesh. the ( I()()') cell jilesh and the 3.375,000 ( 150) cell mesh.
UFD predicted lical transfer appears to converge ;,symptotically with the adapted Kirkpatrick &
Bohn correlation with increasing mesh refinemem. I lowever in doing so the heat transfer error
CavltV Contro Point
.114 914 K
79

7/28/2019 Chew Packwood N Turner
http://slidepdf.com/reader/full/chew-packwood-n-turner 101/343
increasescompared with the Bohn et al's correlmion. Therefore tile mesh dependency is small
relative to (lie difference beiween tile Bohn et al. correlation Fhere is a small discrepancy in tile
heat transfer balance lbr the I 50-cubed mesh, which was due to tile solution not being fully settled.
Bohn @I al (Aachen) Heat Transfer In a Closed Rotating Annuli 45 dog Sector of 2000 rpm
-HC
case (with Air)Delta T- 40 dog.
using As50.100
and a150
cubed cell mash
900
W-0
70 () ý
600
Soo
I -Uu
2
w
:I
iýý:::: ii
.Sc30 0
H/(-.,
063 b/r- - 066
200
loo ý
Bohn et al. 14Cooftgurabon. Nu correlabonNu -0 365 Ra '0 213Fig 8 brAn
Ref ASME. 93-GT-292
F-HIII
a Nu CFD Inrww 5utla(»
o Nu CFDOLA«Surfooo
Nu CorfW (BOM of 41)
Nu Stabc Boot CorrW (KO1Kpabxýk& BohN)
00
0 OE-00 5 OE*05 1 OE-06 I 5E-06 oE -06 2 SE -06 IN -06 1 Sf - 06 40( -06
CFO Mesh Coll 14ýn*Pvl
Figure 4.8 Comparison (if (lie predided heal tran%fer isilh experimental correlation% - CFD
mesh sensithi(y
4.5.2 Solid body rotation CFD invesligaliow
An adi abatic
case %%,,, imest Iga cd to I ieIIIIfy
lit)S.,bIcC.1 IScsof IIIc 0%CI-p Cd t -I o IoIIIC. ItII
ai sCI,
noted above. Compared with the theoretical -solid body rolation". tile CFD adiabatic calcu kit lolls
gave relative velocity flucitiations of'over 0.6m, %at a rotational speed ol*2MO rpin. Fills is
significant compared to the velocity fluctuations for tile heat transfer case and is likely to contribute
to the over-prediction. In a flit-ther study Still and Chew 120041also encountered difficulties In
obtaining soltitions for the solid body rotation case %vithFLUENT. I lowever. lie had more . uccess
with the I lydra UFD code, using uniform mesh spacing in (lie circumferential direction. Sun and
Chew's results are described in section 4.6 below.
79

7/28/2019 Chew Packwood N Turner
http://slidepdf.com/reader/full/chew-packwood-n-turner 102/343
4.6 Numerical Investigation or Convection In a Scaled Rotallng Annulus
In complementarytudies,SunandChew 2004)andSunctal. [20041 ave nvestigated olinct
al'sconfigurationB. Forcompletenessheseesultsarc ncludedanddiscussedere.
Thegeometrysexactly hesame s or therotatingsectorabove, xcepthatno radialplaneplates
were nsertedn theannulus.To save omputationalimemostof thecalculationswereperformed
usinga450modelwith assumed ircumferential eriodicity.Twodifferentmeshes ereused.a50-
cubedmeshwith unirorm, rid spacingn thecircumferential irectionanda secondcrincdmesh
with 1,000,000ells, 100-cubcd.Mostof thecalculationswerepcrronned sing he[tolls-Royce
I ydraCFDcodeand hen c-runusingFLUENT. ydrauses second rdernumerical cheme.he
same sused or standardRANScalculations. o speed pthe lydracalculationshe ow N13ch
number rc-conditioncrwasused.Sunct al. have eported imilar resultsromI lydraandFLUENT
forconvection ndergravity n a cubeas studiedn Chapter .1 ydraandFLUENTsolutionsor
the otatingannulus rcdescribedn therollowing wo subsections.
4.6.1CFD Hydra solutions for the full rotating annulus.
Fivcdiffcrcntcascswcrerun coveringa rangeof Ranumbers, .95x 104o 1.1x 10¹⁰. summary
of therunningconditionsand heresultsor theaverage eat ransfer rc shownnTable4.2.
Tablc4.2 Comparison of the I Iydra CFD results %st h measured licat transfer for tile Anchen
scaled rotallne annulus. conflLurallon It.
Case Speed AT p Ra# Ec Nu Nu ANu Notes
(rpm) (K) (bar) (Exp) (CFD) (%)1 2000 24 1 2.76x 10' 0.038 31.2 31.5 2.0 50'mcsh
45* modcl
2 2000 24 2 1.10XIO10 0.038 41.7 42.8 3.0 501mcsit
I 1 1 45* inodcl3 500 28 t 1.95x-IOT- 0.002 17.8 18.5 4.0 50' MCA
45* modcl
4 2000 24 1 2.76x10' 0.038 31.2 32.5 4.0 5Ox5Ox4OOmesh360*model
5 2000 24 1 1-
T.76x10' 0.038
.2I. j 34.2 [ 9.0.0 100' mesh I
_
[
45* model
80

7/28/2019 Chew Packwood N Turner
http://slidepdf.com/reader/full/chew-packwood-n-turner 103/343
The mean Nusselt numbers given in Table 4.2 for cases I to 4 arc shown graphically in Figure 4.9.
Good agreement with Bohn et al's correlation is demonstrated. including the Rayleigh number
dependency. Sensitivity to both inesh size (see Fable 4.2) and whelliera 45" sector ora full. 360"
annulus are modelled is probably within the uncertainty ot'llie experimental correlation. Figure 4.9
also includes an a(hiptation to the rotating annulus ol'the Colorado correlation (Kirkpatrick el af.
[ 19961)basedon their experimentol'a natural convectioncube.The adapicdColoradocorrelation
wasagainderived by using the temperaturedifference. AT helween(lie hot and cold walls and
replacinggravitational accelerationby cennit'ligal accelermion. t maybe wrillen
Nit - 0.05R, i, ' (4.11)
1000
100
10
a
-1u=O 317RaIO 211.
Aachen Annulus. Air
Nu=0.05RaN 1/3).
Adapted Colorado Cor'n
Hydra. 45 deg model
Hydra, Full annulus,:160 deg model
a
i;r-T-
11
.0...... .r
b-
r-T-
11111100
H- iiniIIiIit iiiIIIIiIiiII -L.
L.Li
I -0
;I-
1 OE+08 1 oi * 09 1 OF* 10 1 01 -11
Rayleigh Number Ra,..
Figure 4.9 ComparKon of Ihe predicled lical franJer %%ilh he %-ichen wäleil rotaling annulu%
C%1)Crinientill c(brrei. Itiofl% ISIIII ei al. 20041
I lie predicted ica I ransler Ievel agices %%e%%ithI Io m cIa I's t:mtclation. Much ,I mt,N 1 %c.kcr
Rayleighnumberdependency han theadaptedKirkpatrick & Bohn(Colorado)correlation, As
mentionedearlier, it seems hat theCoriolis force suppressesheconvecil'on.andthe Rayleigh
numberdependencys closer to thatexpected n gravity at lower Rayleighnumbers Ra I(y).
This lower Rayleighnumber regime is sometimes eferredto as laminarcom ect on in the
engincering iterature. I lowever, it is to berememberedhatGrossmanandLolise's 120001results
xI

7/28/2019 Chew Packwood N Turner
http://slidepdf.com/reader/full/chew-packwood-n-turner 104/343
indicate that the low Ra regime is associated with significant re%imanceo heat transfer across the
central core. At high Ra, (irossman and Lolise's work indicates a regime with Nu f Ra' 'In which
heat transter is controlled by the boundary layers on (lie surfaces. 11may he that in the rotating I'low
Coriolis effects suppress heat transt'er across the central core. reducing heat transfer rates and
delaying or preventing onset ofthe RaII dependency as Rayleigh numher increases.
30
25
20
15
10
5
0
"
RAN-oVI VVAVA
-Aachen Correlation
- Hyd - 45 deg model- Hyd -
Full Annulus 360 deg model
Adok AAv---- VJA
0 i. I-a... I&--i
13 14 15 16 17 18 19 20
Flow time (s)
Figure 4.10 Variatiom of surface hea( Iramfer %0h Iline for cases I&4, Ra$ - 2.76%10" ISun
el al. 20041
Figure 4.10 gives an example ol'variation of%urface heal Iransfer %%ill time It cases I and 4 from
Fable 4.2. File linic , cl) for these calculations was 10 's. and a simulation period ofat leas( 5
seconds was require(] before it *converged* solution could lie assumed. Tile figure also %flows ile
results given by tile Aachen correlation. Hie 45" sector heal trall-ster is I X" ofthat for tile I.ill
annulus due solely to tile reduced area. Flie variation ol'heM transfer %vithmile clearly indicates tile
presence of' large-scale flow structures. Such flow structures are indicated by the instantaneous
temperature comour plots in Figure 4.11. Fliese structures , io%,.,similarities to those identified for
the rotating cavity woh axial througliflow by. for example. Farthing el A 11992a. 1992hj and Long
and Tucker 119941.Although tile imposition of'periodicity in tile 45" sector model changes tile
details ofthe flowstructure, it
isapparent
froill tile mean Nussell nuinher results presented in Figure
4.9 that this does not greatly alter the overall level of licat transl1cr.
92

7/28/2019 Chew Packwood N Turner
http://slidepdf.com/reader/full/chew-packwood-n-turner 105/343
I /1
4.11a- 45 (leg model
I OE#ol
I OE 01
I OE-03
I OE 05
I OE 07
1 OE-09
Figurc 4.11 lifflanlancom lemperaturc conlotin for cii%e% 4.k4. Ra# 2.70%1W IStin ei al.2()()41
310
308
306
304
302
300
298296
294
292
290
13 14
"0 45 4.9 Oft t of CP
lqrl MO -, dý T .1 Col
I. I......
15 16 17 18 19
Flow time t (a)
1
10
L'
I
I OE 01 1 OE+00 I OE+01 I OE+02 I OE +03
Frequency Hs
4.111) - .160 (leg model
IOV,4'. Ong T ai ,II
I ty, J Uvo Ong filo, *] I at ( Al
1 OE-11 '
(4.1 2a) Temperal tire history (4.12h) 1'emperal tire Spectra
Figure 4.12 Instiowancous temperature and it%%pectrum for c: %e%&4. Rus - 2.7(ix 109I.Stin
ef al. 20041
Figures 4.12 a ail(i h silow tile jelliperal tire variations oil tile mid-axial plane and their
corresponding turbulent energy spectra lor cases I and 4. In tile legend ('11denotes [lie monitoring
position being ; t a nild-radial point. Hodi 45" and 300'' models give very similar spectra. A
frequency range in which tile slope is close to tile 5.1slope can also he clearly idenlified. A
numerical tail- at high frequencies is noticeable in Figure 4.1211 ndicating that numerical effects
dominate a( tile higher frequencies.
HI

7/28/2019 Chew Packwood N Turner
http://slidepdf.com/reader/full/chew-packwood-n-turner 106/343
O's
04 Va at CP,360 dogrrxxJol,4w
0.3Vr at CP, 360dogmodel. vý\A at CP. 360 deq mDdel. I y, i
02
01NL.
AI
..t
w.w r. .--. I., .I
IrI TV I fy III
I-0.2 [1rn1
-0 3
-04
-0.513 14 15 16 17 Is 19 20
Flow Time I (a)
(4.13a)
4
1
.0
-3>
I Of01
1 OUGS
10647
1 ce -09
I or 1110100 I OEa
Mquoc y 041
cloci(. ý %pectrum
I or 41 i or-a2 1OF-03
Figure 4.13 Instamancous %cloci() and it%%pecirum for caw 4. Ra# 2.76%10" jSun el al. 20041
IHit: Ili ree ýe Iocitý component lustories ant. I lie ir spec Ira fOr II c cAsc 4.11ic (,() simij I;it ion, dit w%%11
in Figure 4.13 also shm% the properties expected ofitirbulent flo%% Fangential and radial %elocliN
fluctuations dominate at lower frequencies. because the axial velocity is much smaller, From the
above results, it is clear that large scale motions lor the Rao 2.76x 10" case. appear in both the 45"
and 360" model results lor the sealed rotatmg annulus case. I'licre are differences hemeen the 45"
and 360" model results. but these do not greatly affect the mcan licat Iran%1'r predictions.
1 OE#()l
1M 01
1 01 (H
I OF o')
1 OE 07
1 OF ()(;
1 OE 11
1M () I
-I
-( flfl%h T njt'r
101 oo I of -()I
Froquency Hz
1 Of+02
5
1 of -o i
Figure 4.14 Comparison of jelliperalure specira 0.6mm from the otifer cýlindvr %%all)ct%,.ccll
the [%%o e%he%, aý 2.76%10 IStIll el .11.20(141
A mesh depewlence clieck was comiucled with the refined mesh ( 100' mcsh cells) I'M Ra#2.76x 10" (case 5 in Fable 4.2). The iijode, I ed coliditions " ere exactly I ie same as flor case 1. except
I'M the greater degree ofniesh resolution. It can he seen Ili-it the difference in surface heat transfer
84

7/28/2019 Chew Packwood N Turner
http://slidepdf.com/reader/full/chew-packwood-n-turner 107/343
between the coarse and title meshes I'Orcases I and 5 (see Table 4.2) are probably, within the
experiment uncertainty. The comparison ol'the temperalure fluctuations spectra froin the two
meshesshown in Figure 4.14 clarifies the influence ot'numerical approximanons. In this case the
spectra are 110r point 0.6 min from (lie outer cylindrical surface. File frequency range exhibiting a
slope close to the 5/3 slope is extended oil the finer mesh. As mvilhclassic large eddy simulation. it
appears that the lower frequency furbulence is imemilive to file exact mechanism oflurbillent
energy dissipation at Iligh frequencies. In this case numerical diffusion dissipaics the turbulence
energy.
4.6.2 CFD FLUENTsealed rolating annulu% %olutioll
Sun and Chew, 120041also ran FH 1F. F lo simulate Bohn c( al's scaled [oLat'llt! annulus I lie
calculation was conducted by using second order Implicit nme stepping %vitht second order tilm Ind
scheme for spatial discretisation. The velocity and pressure coupling me(hmi %kashosen to he
Presto [ Patankar, 19801.;1second order pressure correclion melhod Case I was I. 1%st galed %kII
the coarse 50-cubed mesh. All the boundary conditions and other sellings %%erche %amcI.%hose for
Ilydra except that incompressible Ilow was assumed III FH TNT Instead ofilie comprewble tlo%%
assumed III I lydra.
1*C
UI,
t
a.
10
9
8
7
6
5
4
3
2
1
0
k-ichen Correlation. 45 dog modoll
Ftydra. 45 dog modelF uent, 45 dog model
WLI AdwwTWIM 061-UA kv
r. I.......2468 10 12 14 16 Is 20
Flow tifne (s)
igure 4.15 Comparison of licit II rik its fer heowen FLUENT an (I IIý (Ira Calcula I io n%, Ra#
2.76%109 ISun and Che%%2004, Suit et id. 20041
I.igure 4.15 shows a comparison oft lie surface heal transfer predictions ohla Illed using 1-1.1 -.NV
and I lydra as well as [lie experiment correlation. 11 all I)e ,cell Illat IT( IFN F predicts a higher heat
95

7/28/2019 Chew Packwood N Turner
http://slidepdf.com/reader/full/chew-packwood-n-turner 108/343
transfer, ut theoverallsolutionscomparableo the lydrasolutionand lia experimentorrelation.
Solutionof theadiabatic asewith FLUENTshowcdhigherperturbationromthecxpcctcdsolid
bodyrotation" hanwasobtainedn I lydra.
4.7 Conclusions
Aspart of thepresent tudy,CFDsolutionsor convectionn rotatingenclosed nnular ector avity
havebeenobtained. hisstudywasconductedncollaborationwith SunandChewwho considered
the ull annular avityfromthesame eriesorcxpcrimcnts.Resultswerecompared ith Bohnat
al's experimentalata
andwith convection ndergravity n a cubicenclosure. unandChcw[20041CFDresults howed omegoodagreement ithexperimentalalues ormean urrace eat
transfern therotatingannulusor Rayleighnumbers f ilia order1010,pproachingheRayleigh
numbers ccurringn gas urbinehighpressureompressorisccavities. owcvcr heresultsrom
theFLUENTCFDsimulations rthe scaled otatingsectordidnot agree o well with tile
experiment. hereasonsor thediscrepanciesetweenlia experimentalndcurrentCFDresultsare
still tobe rully understood,utareassociated ith dift"iculticsn numerical onvergencedentified
for ilia solidbodyrotation estcase.Theuseof non-unirorm ircumrcrcntial icsilspacingor tilesector,mayhaveaffectednumerical tability of ilia scheme.
It has beenshownthat in both gravity and ccntrirugally driven convection,theCFD solutions
capture he presenceof large-scaleunsteady low structuresand lower frequency urbulent
structures.The smallest Kolmogorov) turbulent lengthscale$arenot fully resolved, ndicating that
thesecalculationsshouldbeclassedaslargeeddy simulationswith numericaldiffusion contributing
to the turbulenceenergydissipation.Sensitivity to numericalerrorshas been nvestigated.Meanheattransferratesshow only slight dependence n meshdensity,with the variation probablybeing
within the range of die experimentaluncertainties.Due to thepresenceor largescale low features.
thesurfaccaveragedheat ransrcrratesvary significantly with time, introducing rurtlicr
uncertainties n judging numerical convergenceandcalculationof mean icat transrcrrates.use or
eithera 45* sectormodel. with circurnrerctilial periodicity, or a fall annulushas been ound to make
little difference to themeanheattransrcrpredictions.
Following he nvestigationreported bove,LEScalculationsor the low in a rotatingcavitywith
axial hroughflowwereundcrtakcnndreported ySunct al [2004).71mestudies ivefurther
86

7/28/2019 Chew Packwood N Turner
http://slidepdf.com/reader/full/chew-packwood-n-turner 109/343
insight into the flow physicsandwill be referred o in thediscussionof moreelementarymodels n
subsequenthapters.
It is of interest o compare heheat ransfer n thesealed otating annulusconsideredhere o that
from theouter shroud n rotating cavitieswith a centralaxial throughflow.Kim et al (1993]and
Long et al (1994,2003] havereportedexperimental esults or axial throughflowconfigurations. n
therangeof throughflowratescovered,Long et al found ittle sensitivity of shroudheat ransfer o
throughflowrate, andtheNusseltnumberdependencyookscloser o a Ra'13 ependencyhanto
Bohnet al's Rao21 dependency.Kim et al's shroudNusseltnumbersat high throughflowrate also
appear o vary approximatelyasRa'13, ut at low flow rates heRayleighnumberdependencys
weaker.Thus, it appearshat theRadependency trengthenssthroughflowrate ncreases,perhapstending o a Ra'13 ependencyat high flow rates. t is conjecturedhatat thehigh throughflowrates,
theturbulenceassociatedwith axial throughflowstrengthensheheat ransferacross hecentral core
region.The overall level of heat ransfermight thenprincipallydependon theboundary ayeron the
outercylinder, for which a Ra1/3 ependencymight beexpectedby analogy with convectionunder
gravity. However,themixing between heaxial throughflowandthecentral coreflow in thecavity
remains o beunderstood.
It wasconcluded rom these hat theCFD modelsshowpromiseas predictivetools for compressor
disccavity convection.However,several ssues emainedo beresolvedandthecomputing
requirements revery high,which would severely imit applicationof themethodsn design.
Hence,n theremainderof thepresentstudy, t wasdecidedo concentrate n simpler modelsof the
effectsof buoyancy.
87

7/28/2019 Chew Packwood N Turner
http://slidepdf.com/reader/full/chew-packwood-n-turner 110/343
CHAPTER 5
COMPUTATIONAL FLUID DYNAMICS SIMULATION OF FLOW PAST A
RECTANGULAR CAVITY
Summary
In this chaptera CFD studyof theflow passingovera rectangular avity ispresented. seriesof
differing cavity depthshavebeenmodelled.Thecomputationalesultshavebeencomparedwith
otherworkers' experimentalmeasurementsf cavitypressure nd low velocities.The
computationalmodelsimulateshe flow mechanismeasonablywell. However hemodel under
predicts hestrengthof thecirculatingflow within thecavityanddoesnot predict correctly he
shearstrengthof thecross low which drives hecirculating low in thecavity.
5.1 Introduction
As noted n Chapter1,an mportant low mechanismwithin a gas urbinecompressors the
interactionof thecoolingair flowing rearwardshrough hecentrecoreof thecompressor ith the
flow within thecompressornter-disccavities.As mentioned reviously n section2.5, for an
unheated avity rotating at low speedheaxial throughflowgeneratesne or more orodidalvortices
in thecavity.Similareffectshavebeenobservedor planar wo-dimensional21))now over a
stationaryplanar2D cavity.Hence t is appropriateo considerhis simplerplanar low. The
HaugenandDhanak 1966]experimenthasbeenchosenor theCFDstudy,as t is, in principle,a
2D flow problem.
5.2 Description of the Experiment.
HaugenandDhanak'sexperimentwasdescribedn Chapter2 section2.5,but thisdescriptions
nowbriefly repeatedor completeness. heexperimental pparatusonsisted f an adjustable
length low channelandarectangular avitywith adjustable epths.Thechannelwas63.5mm,
(2.5") wideandhadanaspectatio of 10,ensuringa substantially D now. Thecavitywidth was
fixedat63.5mm 2.5") and ts depthwasvariedup to I 14.3mm4.5"). Thefreestreamair velocity
88

7/28/2019 Chew Packwood N Turner
http://slidepdf.com/reader/full/chew-packwood-n-turner 111/343
wasestimatedo be30.48m/s 100 ft/s). Theboundaryayerthicknessust upstreamof thecavity
couldbe increasedup to 25.4mm (I") and,by observation,wasfoundto beturbulent.Static
pressuresweremeasured longthecavity walls by meansof a micromanometer. hestaticpressure
wasalsomeasuredcross
heshear
ayer bya probe
heldnormally
to thecross-flow
direction.
Temporal-meanvelocity andturbulent ntensitiesweremeasured y meansof a constant-current
hot-wireanemometer. variable-positionraversemechanismwasderived or movingthehot-wire
probe ongitudinally,parallelto themean low, and ransversely crosshemixing region.Thehot-
wire probemeasurements ere used o determinehedistributionsof the time-meanongitudinal
velocity, turbulencentensity,and urbulentshearstressacrosshemixing region.For theflow-
visualizationstudiesa secondexperimental ig with thesamedimensionswas used.This rig was
subjectedo flow of waterapproximatelysimulating hedynamicconditions n termsof flowReynoldsnumberandrelativeboundary-layerhickness.
5.3 Numerical Investigation
CFDcalculationsmodelling he interactionof theflow passingoveran opencavity with theflow
within thecavityhavebeencompletedor a numberof differentcavitydepths.A typicalCFDmesh
used n thesimulationss shown n Figure5.1. A 2D quadrilateralmeshwas usedwith themesh
expanding wayfromboththe innerwall and alsoaway romthe threewalls within therectangular
testcavity.Thenon-dimensional earwall distance arameter; , (=pu, ýp) valuesn thecavity
were ess han1.Thismeshhasa totalof 22,800cells,with 9,600of thesecells ocatedn thecavity
section.
As in the experiment, the test cavity width, s, of 63.5mm was held constant for all the numerical
simulations whilst the test cavity depth, h, was altered to give various IN geometry ratios. The
various test cavity depth to width ratios chosenfor the simulations were 1.0,1.5,2.0 and 3.0. For
the purposeof creating a boundary layer upstreamof the cavity and also to eliminate any end
effects which may have had an influence on the CFD solution in the area of the cavity, the
dimension of flow channel external to the test cavity was chosento be 250mm in height and 635mm
in length upstreamand downstream of the test cavity which is 10 x s, the test cavity width. The
inner wall of the external flow channel and the threewalls of the test cavity were set asadiabatic,
no-slip boundaries.The velocities were specified at the inlet with a constantaxial velocity of 30.48
m/s, with a total temperatureof 300 K. Static pressurewas specified as 101.32 kPa at the
89

7/28/2019 Chew Packwood N Turner
http://slidepdf.com/reader/full/chew-packwood-n-turner 112/343
dowliNlream outlet. The far ficid outcr boundar\ of dic emernal flow channel \%a-,%clas a symmon
houndary type and has no influence on the fhm pa%ilic lc%tcavity.
Figure 5.1 A 1ýpical (T 1) me%limed hi the %imulation.
I 11Ccolliptitat loll Carried out solve% he coiiscr%ationequaliolls fol 111011101111111nd clicip I.,
dewribed in Chapter 3. wci ion 3.4. The fluld usctj In the simulatiom " as air %%th conmant fluld
propcrile%.%Nth Npcciflc licat ((',, ) of' 100(1.43Ag IK1, tilerinal conductiN ty (k) 0.0242 Win 'K
clý'Ilaflllc viscosily (it) 1.7894 - 10
defilled III tile model.
cow-imil fluld dclisilY (P) of' 1 22ý k9lli i%%.%
90

7/28/2019 Chew Packwood N Turner
http://slidepdf.com/reader/full/chew-packwood-n-turner 113/343
CFD models were run assumingsteady urbulent flow. Thestandardk-c modelandthe2-laycr k-c
/W near wall turbulencemodelswcrc used.To alter theboundary-laycr hicknessupstreamof the
testcavity the turbulence ntensityspecifiedat the inlet boundarycondition wasvariedbetween1%
and 10%.The resultingrelative boundary-laycr hickness 81s) angewas0.25to 0.5 which
correspondswith boundary-laycr hicknessesrom theI laugcnandDhanakexperiments.
As in Chapter3, themethodchosen or discrctizationof thescalarandmomentumequationswas
thesccond-orderupwind scheme.A secondorderschemewasused or thepressurenterpolation
andfor thepressurc-vclocitycoupling (prcssurc-corrcction)heSIMPLE algorithm was used.
5.4Results
For thesimulationsusingair astheworking fluid, resultsobtained rom theanalysisof tile I I/s -
1.5geometrywith a relativeboundary-laycr hickncssof 0.25havebeenrcporiedandcompared
with theequivalentcxpcrimcntalresults.The bestcxperimcntalresults n termsor themeasurement
quality wereobtained or this case.
Figure5.2 showsvelocity profilcs of x-vclocity (horizontaldirection)versusdistancey (normal
coordinate) or threex (horizontalcoordinate)positionsacross hetestcavity. Coordinatey is
positive in thedirectionout of the testcavity into themaincross low, Whilst a negativey value
givesthedistance nto the testcavity. 71ic CFD resultsarc shown alongside heexperimentalest
results.The velocity plot shows hat theCFD profilc out or [fie cavity in to themaincross low does
notquite replicate heboundary-laycr hicknessn theexperiment M-0.25 CFD, -0.3 Test) but the
profilc is reasonable. lowcvcr, insidethe testcavity thevclocity proriles indicate h3t,heCFD
modelundcr-prcdicts hestrcngthof thecirculating flow within thecavity. It appearshat thek-c A.
I turbulencemodcldoesnot correctlypredicttheslicaror ti,c cross low which drivesthecirculating
flow in thecavity. Figure5.3shows hat the fine nicshemployednear o thewalls (y* < 1)
adequatelycsolvcs he flow in theregion close o the testcavity walls (x/s -0 upstreamand -I
downstreamwalls). The plot also shows hat thevertical velocity risessteeplyat thedownstream
comerof thetestcavity (for y/s -0 at positionx/s - 1)at therecompressionomcr %%Iicrchex
velocity - 0.
91

7/28/2019 Chew Packwood N Turner
http://slidepdf.com/reader/full/chew-packwood-n-turner 114/343
-CFD xf.%-0 15
-CFD Wý, 0 5
-CFD fý%-0 85
x Test wý, 0 15
4 Test w, -0 5
X Test xf%.o 85
11C % "l- IN IIII
'. I
Fignre 5.2 Comparison of*CIA) and experimental %-Nlocilý profiles taken sit three po%ition%
acros% fie test caNty (I 1/.% 1.5).
f
ol
I() V, 0V, M
1 1) y/I 04
(A 0 y/ N. -O
-Cl D-yO. -O
CFD-yf%-O
UID y" 01
(My, 04
,, 4 11 (,
I.
I-igure 5.3 CIA) predicted N-%clocilNpj-()j-jlt. Icl-(,%.,fic test ca%itý sit various %erfical dkiances
in to and oul offlic cu%tý ill/% 1.5j.

7/28/2019 Chew Packwood N Turner
http://slidepdf.com/reader/full/chew-packwood-n-turner 115/343
0.1
L
C.-
I.
"I
03 -
16on
-(, I () (, iwtvd,, w, %tr ..... ý -011
(If D Cawy ý4wmnm all
l"%1-CRmtyd,, MýIr. nfy, w. lll
4 7.. l C.a"Iv, 4,111 V, w"ll
1412Normal 01.1filicc. ý-
(a) VpAream and do%%noreami%all%
I
'le
i
01 .
02
Q3
A
dotamc in I., the :a%ts
08 04 0;
II
01 02 ol 114 11 06 07 ol 09
Non dimommial Micam%owc Olkla"Cc. %N
(h) Bot(oll) Surface.
I-igure 5.4 CIA) p redicied III (I it, %I III cmured prevure d istribil I ioll% a oll lie I v%IC.1%I%
%sall% 1/% 1.5). (.1) upOream and domi%fream (b) bottom %urface.
-CFD-Ca, Aty bottom wall
I 7061-CaAty tXMIMI Wall
93

7/28/2019 Chew Packwood N Turner
http://slidepdf.com/reader/full/chew-packwood-n-turner 116/343
Figurc5.4comparcs FDprcdictcd ressurc istributions long he estcavity walls withmcasurcd
prcssurcs.igurc5.4ashows rcssurcs long heupstrcamnddownstrcarn allswhast igurc 5.4b
showshepressurc istributionalong hebottomsurracc f the cstcavity.71cprcssuresgivcnas
apressurcocfricicnt Cp) dermcd s:
cp-(P-P. )/(`/`/irl! (5.1)
wherep is thestaticpressurePa], u is ti,c x-componentor time-mcanvelocity [ms*lj and p is thc
fluid density [kgm'3]. I'lic subscript,co indicates he frcc-sircamcondition.
The CFD computedpressureprofiles alongthe testcavity walls follow tile trendof the test
measured ressureprofiles,but undcr-prcdict near hetestcavity downstrcamcomcr (yls - 0). This
is againan indicationthat theCFD k-c/k.1 urbulencemodelunderpredicts hestrengthof the
circulating flow within thecavity andtheshcarstrengthof thecross low on thecirculating flow
with in thecavity.
Figure 5.5 shows tile computed flow streamlines within the test cavity. A circulation mass flow per
unit depth (perpendicular to the flow plane) orO. 162 kg/sm is generated by the shcaring of die cross
flow in the main channel. It is interesting to note that only one circulation is generated within the
cavity. For whichever cavity dcpth was chosen, CFD predicted only one circulation. For cavities
with an I Usup to 1.5. test measurement of pressureon the cavity walls indicate that only one
circulation is fornicd. I lowcvcr, tile CFD results conflict with experimental evidence. I laugcn and
Dhanak also carried out flow visualisation experiments using water as the working fluid. Various
cavity depths were tested in the I I/s - 1.0-
3.0 range. The test conditions approximately simulated
the dynamic conditions of the experiments with air in terms of flow Reynolds number and the
relative boundary-laycr thickness (m). Figure 5.6 shows the results from the water tests in tile form
or nowvisualization flow pattern pictures. The flow pattcrns portrayed show that as cavity dcpth is
increased the number orcirculations or vortices generated within tile cavity increases. I laugcn and
Dhanak observed that for I I/s -I (see Figure 5.6 (a) - note that this picture is printed upside down)
there was a single vortex and it was stable, resembling almost a solid body rotation. Around Ills of
1.75 secondary vortices appear in transition, and at a value or I i/s -2a clear second %-orlcx
structure is formed. Transition again seemsto take place around I [Is - 2.5 %%cn the number or
vortices oscillates bctwccn two and three. Finally. for I vs on, three vortices arc fornicd. The
vortices were observed to countcr-rotatc relative to eachother.
94

7/28/2019 Chew Packwood N Turner
http://slidepdf.com/reader/full/chew-packwood-n-turner 117/343
112708-01
,0"0
ime-oi
a wo -cie
3 000 -cia
4000-m
3000-49
2004-02
1 000 -w
I. ION%
16. k.v , in
i
Figure 5.5 CFD predicted flom, pattern i%ilh in the ico cso%ilý confour% ofoream funclion.
Ilatipen &. Dhanak - Momcnium I't-MINICT ( 'I I)&I- \I)C 'l IVII t
(a) II"I ()
Ifs 2.0
II IS
10
1'"m ,ý'. II I-, v., It, I H. -.., ýII
1-igure 5.0 Ilaugen and Dlianak fit),, %j%jj.jj/. jjion experiment (macr) flo%%pallern% %%ilhill file
1c%lca%ilý (From flaugen and Dhanak 119061).
')S
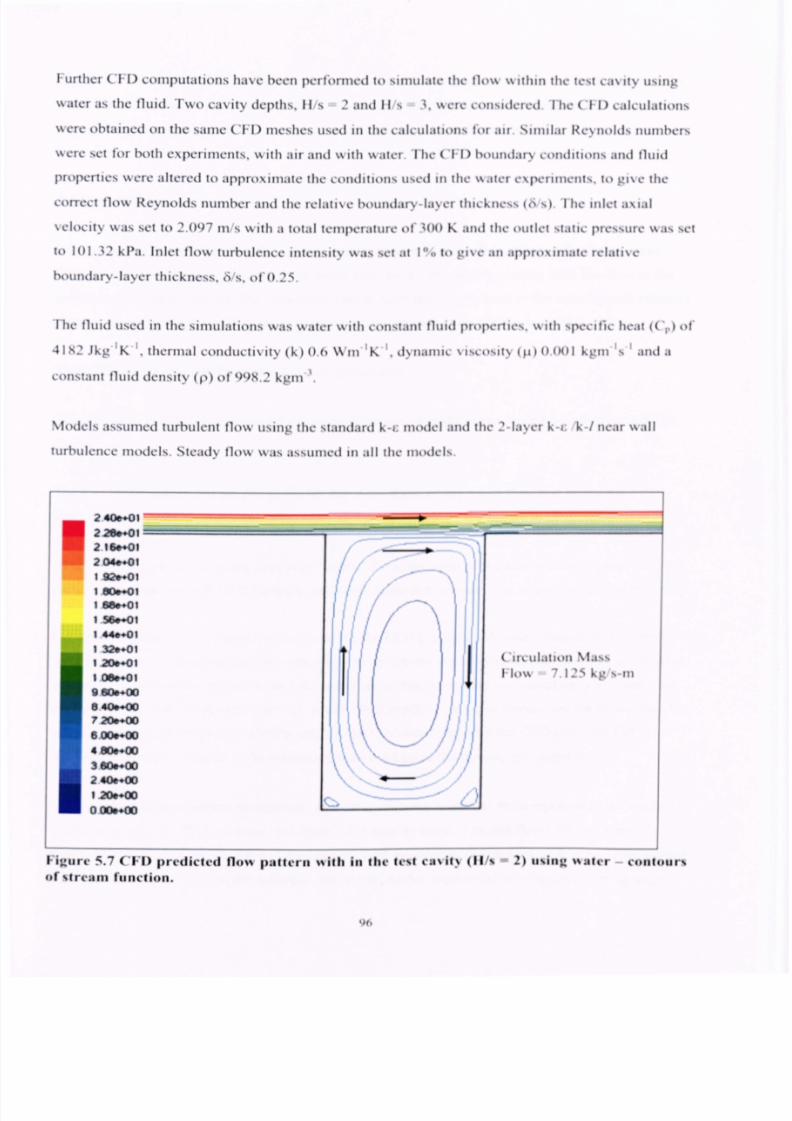
7/28/2019 Chew Packwood N Turner
http://slidepdf.com/reader/full/chew-packwood-n-turner 118/343
F-111111clH) compulat lolls have been performed to simulate the flo%% ithin the test cavily u%ing
%%aicrs the fluid. Two cavity II, 2 and IIS.1. %%re considered. The (T 1)calculailions
were obtained oil Olesame ('I. D meshes u,,cd in the calculation% for air. Similm Reynolds numbers
%%ereet 'm both experiments. %kih air and %%th %%ater.he (T 1) homidary conditions and fluid
properties %%-erelicred to approximate the condmons used in the %%alcr\pcnincrils. to gi\c the
correct I'low Reynolds number and the rclamc botindary-layer thickncs% 6 %).I lie inlet amal
velocily \%as et to 2.097 in , with a iotal icmperature of'.100 K and the oudo siatic pressure \%as cl
to 101.32 kPa. Inlet flow lurbulcrice illiculsitv was set it I,,,, to give an approximale relame
houndarý-laycr lhickness, 6's, of'O.25.
The fluld used In tile simulations was %%aier%kih conmani fluid properlie%. wifli specific 11C.11 (',, ) of'
4182 Ag 'K '. Ihernia I cond tic nN ty (k) ().o \\'ill 'K 1.dynamic \isco%ily (it) OOM kgm 's ' and I
constant fluld density (p) of'998.2 kgm '.
\Iodck assumcd turbolcm flow using flic Ntandardk-c model and tile 2-laycr k--#;k-/ ncar \%aII
turbuicnce models. Steady fioý% 'Is%tilliedll 111ile models.
2400+01228"1
2160+01
2 04+0 1
1 920+01
1 00"01
I sees I
1 36"1
1440+01
1 329+01
120"01
1 Oft*O 1
980*+00a 400#W
720*+00
6,000#00
4806+00
3 OD&*00
2400+00
120*+00
0 000#00
/
I
I-igure 5.7 CIA) predicted 11(m palleni i%ilh iii the ltl%t c3l%ifý (11,%of %freall) filliclioll.
- ----Tlmý
( 'lictliallon11()%% 7.125 kg %-m
2) usilig ' aki contours
96

7/28/2019 Chew Packwood N Turner
http://slidepdf.com/reader/full/chew-packwood-n-turner 119/343
Figure5.7showsheCFDpredictedlow patternor thecavitydepthor i us-2 with wateras he
fluid.TheCFDmodelpredicts nlyonecirculationvortex)s ronnedwhichconflictswith tile
experiment herewovorticesarcshownocxis4asshoAmn Figure5.6(c).
5.5 Conclusions
In this chapter the results from the CFD simulations of experiments pcrrormCd by I laugcn and
Dhanak, investigating the interaction orcross-flow over a rectangular cavity will) tile flow in tile
cavity have been presented. The numerical results have been compared to the velocity and pressure
measurements for the experiments with air and flow visualisation ror tile tests with water.
Theconclusionshatcanbedrawn rom hiswork are:
The urbulent -c/W 2-layermodelundcr-prcdictshestrength f thecirculatinglow withinthe
cavity.
TheCFDmodel
doesnotpredictcorrectlyheshearorceof thecross-flow ndhencehe
momentumransfer etweenhecross-flow nd he lowwithindiecavity s incorrect.
CFD predictedpressures longthecavity walls follow the trendorthe testmeasured ressures, ut
underpredict the strengthof theeffects, especiallynear he testcavity downstreamcomer(y/s - 0).
ror cavity depths up to 3 times the cavity width the CFD predicts only one circulation. For cavities
with I I/s up to 1.5. the pressure measurements on the cavity walk indicate that only one circulation
is formed. I lowcvcr the experiments with water show that more th3n one circulation is formed for
cavity depths, with I I/s greater than 1.5, whilst CFD predicts only one circulation for all depths. 77he
reason why more than one circulation (with water) can cxist and why the CFD analyses rail to
simulate this still need to be fully explained, but could lie in the turbulence modelling.
Theexperimental esultsarc limited but little otherresearchwork hasbeenreported n theareaof
engineapplications.Withsome eservations
CFDmay
beused o model flows for this typeor
applicationand asan initial s1cpwill beapplied,with caution, o thepresentproblemorcomprcssor
inicr-disccavitieswith axial througliflow. I lo%%-cvcr,urthernumerical nvestigationsusing large
97

7/28/2019 Chew Packwood N Turner
http://slidepdf.com/reader/full/chew-packwood-n-turner 120/343
eddysimulationLES)of turbulence re ccommendcd.t is hopcdhatLESwill capture nd
resolvehe urbulencecncratcd ithin thecavityandalson theshearayersof thecross low.
This work is importantbecauseof theneed o know the evelsof heatand momentum ransfer
across heshear ayer from thecross-flow to thecavity and n termsora gas urbinecompressorhe
transrcror heatandmomentum rom theaxial throughlow under hedisc bores o the inter-disc
cavities.In the2D axisymmetricCFD modeldescribedn Ch3ptcr7 and applied n chapters8 and
9. thestandardk-c turbulencemodel will beemployed o model sucheffects.
98

7/28/2019 Chew Packwood N Turner
http://slidepdf.com/reader/full/chew-packwood-n-turner 121/343
CHAPTER 6
SUSSEXAl ULTI-CAVITY RIG BUI LD 2 TI I EICNIALMATO I 14NG
Summary
A temperature atchingexercise asbeenperformed ntheUniversityorSusscxTechnology
Centre SussexUTC)multiplecavityrig build2 using heRolls-Royceiniteelement rogram
SC03.This rig simulateshe nternalcomponentsnd low featuresora high-pressureompressor
(I IPC).Threemodelswereconstructed,irstly adatummodelusingconventionalhermalboundary
conditions.Thesecondmodelusesheboundary onditionsromthedatummodelbutreplaceshe
conventional eat ransfer ocfficicntcorrelationapplied o thediscsurraces ith a-conc
correlation,CONE"whichwasderivedby SussexUTC.The hirdmodel s the"bestmatched"
model o the hermocouplemeasurements.achmodelwas unthrough hesamedle to maximum
speed ccclcration-dcccicrationycle.Resultsromthebest-matchcd odelgave emperature
differenceerrors,measuremento modelprediction,or lesshan5K bothatsteady tateand
accelerationransient onditions. lowcvcr,a temperaturerrororsK issigniricantas he
temperatureiffercnccbetweenhehotmetal nicr-disccavity shroudand hecooleraxial
throughflowair is50Kat themaximum peed ondition.Alsoto achievehebestmatch,extreme
thermalboundaryconditionshad o beassumed,ncludingan mbalanceor licallmasslow in and
out orthe intcr-disccavities.Thisestablisheshequalityof thestatc-or-the-artonventional
methods ndprovidesabenchmarkorcomparinghenewmodellingmethodhatwill be described
in Chapter .
6.1 Introduction
Themultiplecavityrig at theSussexUTCsimulatesile internalair system f ahigh-pressure
compressor.s previouslymentionedn Chapter section .4.2 ileairnortlic Sussexrig was o
provide estdata hatcanbeusedo improve hephysicalunderstandingr tile flow and icat
transfermechanisms
n theIIPCrotatingcavitiesso
hataccurate redictionsan
bemadeofair
system elivery emperatures,rummetal emperatures,iscstressingndcriticaloperating
clearances.
99

7/28/2019 Chew Packwood N Turner
http://slidepdf.com/reader/full/chew-packwood-n-turner 122/343
Build I of tile SussexMultiple Cavity Rig (MCRB I) wasused o investigatetile flow andbeat
transfcrmcchanisms n the I IPC drive cone cavity at the rcarorthe II PC(Alexiou 2000. ICAS-GT
2001,Alcxiou 2002]. The inner drive shaft (rcprcscntingthe intermcdiateprcssurc, P drive shaft)
wasable to co-rotatcor contra-rotateandcontainedholes for turbine disc borc anddisc rear face
conditioning air. From the MCRB I researchat Sussexa licat transrercorrelation for the inner
surfaceof the I IPC drive conehas beenderived.This 'CONE' beattransfcr corrclation hasnow
beencodedinto tile Rolls-Royce internal thcrmal analysiscomputcr program,SC03 [Barnes2002,
Collcy 2001).
TIC SusscxCONE' hcat ransfcrcorrclations,
For Ro/(P,&T)1/2<6 Buoyancy dominated now regline.
Nu = 0.0243Rc,0'0"Gro-316x-l[r-l - 11 0022 (2.37)
For Ro/(PAT)"2 >6 Througliflow dominated flow reginic.
Nu= 8.93xI O'sRc.1.301X'3.521 (2.38)
In theabove,Nu is the local Nusscit number,x- r/b is the radius ratio, Ile, is theaxial througliflow
ReynoldsnumberandGr - C12rinOPAT(r/sinO)'M is theGrashornunibcr, where0 is tile conehalf
angle. Ro is the Rossbynumber.For build 2 orthe SussexUTC Nfulti-Cavity rig (NIC11112)ile
drive coneorMCRB I wasreplacedwith two discsto createrour cylindrical cavities all with the
same nner andouter radii anddisc spacing.asshown in Figure 6.1. A non-rotating constant adius
shaft,with a glasswindow to allow optical access, eplaced he rotating inner IP drive sh. ft. Ilic
MCRB2 provided both steadystateandtransientmetalandair temperatures.n addition, velocitymeasurements rthc flow in the intcr-disc cavitieshavebeenreported(Long et al. 2006s, 2006b,
2006c].
Initially twobase inethermalanalysesmodelswereproducedor theSussexMCRB2using he
Rolls-Royceautomaticiniteelement odeSC03;adatummodelusing heconventionalmodelling
assumptionssedn the hermalmatchingorMCRB1,anda modelwith thestandard atural
convection orrelationsor thediscsurfaceseplaced y theSussexUTC CONEcorrelation. `hcsc
twoSC03 hermalmodelswereproduced ndcomparedo thediscrotating hermocoupleest
100

7/28/2019 Chew Packwood N Turner
http://slidepdf.com/reader/full/chew-packwood-n-turner 123/343
measurementsor a transient cccleration-decelerationycle(Kilfbil 20031.'lic nuin objectiveor
the nitial thermalanalysiswas o achievean accurateemperature atch orMCRB2 hrougha
transient cccicration-dcccierationycleandobtainsomensight ntotheheatconvection rocess.
Thesecondmodelwasproducedn order o evaluateheuseor the"conccorrclation" or disc
cavityheat ransrcr.A third thcrtnalmodelwasproducedoachieve "bestnutchcd"'modcl o the
thennocouplemeasurements.
Detailsof themethods ndassumptionsor thedatumand conecorrelation"modelsarcgiven n
section6.2.Resultsromthe hree hermalmodels regiven n section6.3.Section6.4 isa
discussionof theresults.The hermalboundary onditionassumptionsequiredoobtain hebest-
matchedmodelarcalsodiscussedn thissection.A calculationo estimatehediscaxialheatnow
using hemeasuredemperatureshenrollows.To completehesectionastudyor thecfrcctsor
internalradiationonthecomponentss discussed. hechapterscompletedwith section6.5,
conclusions longwith rccommendatonsonthewayrorwardo model IPC nternalcomponents
and low rcaturcs.
6.2 Methods and Assumptions
SC03 Version7CO)wasused or all thermalanalyses.'lic 2Daxisymmetric eometry sedn tile
thermalanalysesrMCRB2 wassuppliedby theSussexUTCandcanbeseenn Figure6.1. 'lic
rig dimensionsin mm)arealsoshown.Materialsusedn theNICKare&flownn Figure6.2. The
compressorotordrum s titanium TDQ- Rolls-Roycematerial odes).herig casing.ile inner
shaftand hecompressorriveshaftsarc steel AZA andAIIJ). I'lic innerstationary hallhasa
glasswindow(#GLASI AFT- userdefinedmaterial)oallowopticalaccesso therotorcavitiesfor LaserDopplerAnemometerLDA) nowvelocitymeasurements.
101

7/28/2019 Chew Packwood N Turner
http://slidepdf.com/reader/full/chew-packwood-n-turner 124/343
sunf. 1"IC %luld-C. Mly lug Build 1
Modified vAlh Nuild I Modelling cufwfirwr
IIP Rotor DrumDiscs No. I to 4
Inter-discCavities
No. I to 4
L
400KOO
i
HI2
-0
I -)
Figure 6.1 Ex(en( of (lie Sussex NICRB2 gcomcIr. N iii the thermal model.
Figure 6.2 Nia(crials used in the Sussex NICRIQ therivial model.
1-
102

7/28/2019 Chew Packwood N Turner
http://slidepdf.com/reader/full/chew-packwood-n-turner 125/343
6.2.1 Operating condition%
The operating conditions (along with thermocouple test dala) ý%re supplied by the Su...'sex [A U.
The speed ofthe III) shall is shown below in Figure 6.3 for the transient acceleration-deceleratioti
(accel/decal) test cycle.
Sussex UTC MCR82
__ 111ffl3000
2000
1000
------------T-FT-Tl
Fff-
i- -T-l-1-TTI=LLZTTT-FHil
II
III III
Hi
iFT1 II LLLLLL LI-LI-I II1 1-1-"
4000
ill i 1IFT-T-T-F-FT-F-FT-T-F-F-FT-T-TiI 1 1111111 11 11 11 1 Till1. LL
F-TT
Ill III rTT11-4 -- Ill
0 600 1000 1500 2000 25W 3000 3600 4000 46W 5000
Time (s)
Figure 0.3 IIP shaft speed used in lite su....ex mcRB2 Otermal model.
6.2.2 Thermal boundary condilions
-Measuredmetal temperatureswere imposedon the rotor outer surface or the %%holeycle. I-lie
measurementsrom the threethermocouples seeFigure6.6) were linearly Interpolatedand
extrapolatedacross he kill lengili of the compre%soruter surface or each measurement ine point.
Using these emperaturedistribunmis a.
11)graphof temperaturevs.axial distance%s, ycle time
wasproduced seeFigure6.4). The temperaturegraphwasthenusedasthe temperature nput in the
convectionzone on the rotor outer surlace.The definition ol'a convection/.one is gi%enn section
103

7/28/2019 Chew Packwood N Turner
http://slidepdf.com/reader/full/chew-packwood-n-turner 126/343
6.2.3. A very high heat transfer coefficient %%ashen specified it) force the calculaied lemperature to
match the measured metal temperaturcs on ilic compressor outer surflice.
/-I clI*pcIaIuIt
I\,.., I ), .1, ýý
.11,111bgoftillic%-1
I )mIll I littl I
Figure 0.4 Measured mcial temperalurc% on the compre%%or drmn rolor ouler %urface during
the Iramiew eNcle.
.Fhe it Ir system daut. such as ilia ss I ow, flow InI ct iempera Itire itnd ca% t y pressures %%re dcr I% d
from the test dala provided. The mass flow rale 1'()r he axial througlillow ol'air through the inside (it'
the compressor was lield at it constant rate ol'O. 4 kg s 1hrotighoul the accel, decel le%tcycle
considered.
Fhehoundary condinons III ilie cavkv between the rotor outer surf',cc and the inner surflice of 111c
casing drum were implemented III SCO. using [lie -%old" modelling 1emure.shm%n II Figure 6.5 as
V( )24.1 and V025,1. The definition ol'a thermaI void is gi%enIII sectioil 6.2.3. Therma I voids %%ere
ý1so appl Ied Io bolh I ie fron I 1',ce (VO 17.2) and to I ie rear flice (V()27.1 ) of(he rotor (Inini.
Fhe main part of1he imer-disc cavities was again modelled using the void f*cature V03. V05. V06
and V07). The standard modelling technique is to feed each void with (lie heat from 10"o ofthe
axial throught'low air. I lem transfer on the disc surfaces was assumed to he natural convection and
used the natural vertical plate correlation 'NVII(b f s,2-y)* with the characteristic length equal to the
104

7/28/2019 Chew Packwood N Turner
http://slidepdf.com/reader/full/chew-packwood-n-turner 127/343
cavity outer radius. 1)plus liall'the cavity width. s minus the local radius. y. For the dattim model
(his modelling approach was used except that the heat transl.er coefficient for the disc surfaces was
set to 0.5-NVI), which was it direct read across from the Sussex MURBI therinally matched model.
Also in the datum model 0.75 ýNUS(I. ). (where NUS is the natural convection heat transler from
the tipper surface ol'a horizontal flat plate correlation). was used for (lie cavity shroud. The
characteristic length. I., was set as [lie cavity width. In the region heiween the disc cohs 10"o ofilic
axial (hroughtlow was assumed to circulate and was modelled with the thermal "stream" fleature.
For the second inter-disc cavily the thermal streanis are shown in Figure 6.5 as STI I and STI 2.
1hernial streams arc t1cf-ined n section 6.2.3.
1113
ttT*MV-
tooLl-' I
ZU-,
(ý. .."I.:
)
Sunrx I TrC%IulcJ-0MIy Rig PAdid 2
Modillrd with build I modelHagrxpnirner
ý: ýBý,
ei -
3
.dý,ft
.
QoI
LQ
Figure 6.5 Localion of thermal hotjndar. ý conditions.
loo
-..,
-W
AL
OwAt"
0
I lie amal througliflow under the disc cobs vas modelled is a series oflinked conveciing "ducts-
and "sircams". Figure 6.5 shows for the first stage disc. ducts DLJ23A and D1123131*()rhe bore
thermal duct and stream ST 15 lor the thermal stream. Thermal duct is defined in section 6.2.3. In
the disc bores full axial througliflow was applied to the thermal ducts and for [lie inter-disc region
4%%
I
I\... "--: .A
34%ft
105
7/28/2019 Chew Packwood N Turner
http://slidepdf.com/reader/full/chew-packwood-n-turner 128/343
0.9of theaxial througliflowwasappliedo the hermalstream.A smallamountof temperature
mixinghasbeenassumedlong he nnershaftasair fromthe ntcr-disccavitiesmixeswith tile
axialthroughflow.
In the datum model the "internal radiation" featurewas applied to thecasing walls, which surround
the rotating. drum. The cmissivity wassetto 0.5. IntcmaI radiation is dermcd in section6.2.3.
In the secondSC03 model thedisc surraceNVP hcat transrcrcorrelation was replacedby the
SussexUTC CONE correlation using theparametersof thecavity outcr radius,the disc bore radius,
the IP shaft radius, the conehalf angle(ror a disc, W2radians) and theaxial throughflow rate.Also
the factor applied to the cavity shroudhcattransrerwasalteredto 0.677xNUS which gives the
equivalentheattransfcr asthat given by a secondSussexUTC correlation ror the cavity shroudhcat
transferwhich wasderived from the multi-cavity rig experiments.
The hirdSC03modelwasanattemptoobtaina"best"match o the hermocouplemeasurements
bothat steady tateconditionsandduring he ransient ccelerationrom dleto themaximum peed
condition.The hermalboundaryconditionswithin the nter-disc avitieswerealteredo try to
achievehistemperaturematch.The
modellingor
thefinalbest
matchedmodelwillbe described
later n section6.4.
6.2.3Thermal boundary definitions
Convedlon Zone: A convectingzone s usedwherethe fluid temperaturedistribution is known.
This temperaturecould bea single value or could varyin
spaceand time.Convecting
zonesareessentiallyregionsor infinite licat capacity. husthe fluid temperaturespccificd will not change
regardlessof the heattransferbetween he fluid andthecomponent.The surfaceheat flux is given
by;
Q-hA(Tr-Ts) (6.1)
where , isthesurfaceocalmetalemperaturendhe icit transferoefficictit, maybeestimated
using numberf available ussclt umberorrelations.
Vold: A thennalvoid is a regionof negligibleheatcapacity.A thmnal void isused o represent
region hat sat a unironntemperaturetheentirevoid isata single emperature)nd sat
106

7/28/2019 Chew Packwood N Turner
http://slidepdf.com/reader/full/chew-packwood-n-turner 129/343
instantaneousequilibriumwith itssurroundings.n practicehishas hecffcctof providingaheat
tmnsrcrmechanismhat endsoaveragehe cmpcraturcsr thesurrounding oundariesaccording
to the ocalheat lux. Thevoid can hcrcrorcbeused o transfcrheatacross nair cavity.Additional
heatcanbeaddcdo thevoid via apower crm(gcncraly froma masslow at, for example,
temperature.,,.,,, nto thevoid).
Thc void tcmpcraturc s givcn by; TIfhd4
whcrc
(6.2)
(6.3)
Stream:The hermalstrcamsusedodcrinea portionor theboundaryhathasa finite flow of
fluid along ts length. t iscapable f absorbing nergy romone ocationonthesurracc nd
transportingt to another.A strcarn asa finite licatcapacity.The nlct air temperaturerthe strcam
isdcrincdand hevariationn fluid temperaturelong heboundaryscalculated onsidering
convection,heheatcapacityor thestrcamandanyadditionalheating. uchaswindage. hermal
streamsanbe inkedandmixed ogether.
Temperatureick upalong he cngthof a streams givenby;
dT, [Tlli(T, - Tf )] dl
+7 ;,
jJvc dv
(6.4)
where,s is therelative distancealong surface, ip. is the heatpick-up andthemixed temperature,
T. i., s calculatedfrom an cnthalpy balance:
(IP'CPT), (1;C,,T), + (1;C,,T), +... - (1;C,,T). i, (6.5)
Duct: A thmnalduct s identical oa thcnnalstrcamn all respectsxcepthat woportionsof the
boundaryarcdcrincdbetweenwhich heflow occurs.Energy anbeexchangedetweenhefluid
and he wosurfaces nd ransportedia theduct low.
fh T,d,4+ Q.
107

7/28/2019 Chew Packwood N Turner
http://slidepdf.com/reader/full/chew-packwood-n-turner 130/343
Internal and External Radiation:The nternal adiationheat ransfcrboundary ondition sused
todcrineportionsof theboundarywhicharecapable rtransmittingandreceiving adiation rom
dicmsclvcsandcachother.View factorsarc calculated utomatically.
I [eat low:Q6, - ý,., A,a(T, - T2') (6.6)
whcrc a is the Stcfan-Boltzmannconstant- 5.6687x10*8W/rn2K4
--a.2--a0.
I
ano tnc grcy Douy vicw iactor, ;,., -,
(I FI-3 A,-,,
(6.7)
and c is theEmissivity, heproportionof blackbodyradiationemitted romeachsurracc.F is the
shapeactor.
Externaladiationsused o accountor radiativeicattransrcrromarcinotcsourcehat snot part
of the hermalmodel.I'liespccificdvalueof thisremoteemperaturesnot influenced y theheat
transfer o (or from) t.
6.3 Results
Therig 24rotating hermocouplesTC -TC24)connectedoa slip-ringunit.Twenty-one f these
thermocouplesTC -TC21)wereconnectedothecompressoriscsand o thecavity shrouds, s
shownn Figure6.6.A further3 rotating hcrmocoupIcsTC22-TC24)werepositioned xially
along heoutcrsurface f theCompressorrum.Onthe nnerstationary riveshall7
thermocouplesTC25-TC3 )werepositioned long he engthof theshaft.Further tationary
thermocoupleserepositionedo measurehemetal emperaturer thecompressorasing.Air
temperaturehermocoupleserepositionedn theannular pace etweenheoutcrsurface f the
compressorrumand hecasingand o measureheupstreamnddownstreamemperaturef the
air flowingthroughheannularpassageetweenhe nnershaftand hecompressoriscsborcs.
Temperaturemeasurementscrctakenat time ntervals f 2.5secondshroughouthecntirctest
cycle.The SC03modelwas untransiently hroughdiecycleshownn Figure6.3toa specified
accuracy f 0.2K.Towardsheendof theperiodat maximum peedtime-- 2800s)hesolution
approachessteady tatecondition.A temperatureontourplotat thistimepoint s shownn Figure
6.7.
108

7/28/2019 Chew Packwood N Turner
http://slidepdf.com/reader/full/chew-packwood-n-turner 131/343
V. 0
1-ý
too
ho
Uavl(yNo. I
%Uý% I 'I (' %JUJIJ A RIX IIABIld 2
%I, wUncA . 4oh build I
II)It Iý
01, , 11 0
1,1 It ,,
Cavl1v ('. 'I% ty ('. I%týNo. ý
No. INo, ý4
Ino
Figure 6.6 1ocation of Iliermocouples.
A
Figure 6.7 Temperal tire contours a, stj, j)iji. %c(j, 11.1%illitill, -.pced condilimi for (lie datuill
Illodel.
1014

7/28/2019 Chew Packwood N Turner
http://slidepdf.com/reader/full/chew-packwood-n-turner 132/343
The temperature time-plots at the thermocouple positions shown in Figure 6.6 are plotted in Figures
6X to 0.21 for Ilic following models in(] will be discussed below:
" Datum model using conventional modelling ass"I"ptions th.11were used in the thermal
matched MCRIII model.
" Datum model with the standard natural comcction correlations tor the disc surfacc.1%
replaced by the Sussex UTC CONF correlation.
" Final best matched thermal model.
" 'Measured Data
Table 6.1 below gives tile notation that has been used In all the temperature tinic graphs and
temperature difference v. time graphs. Fach thennocotiple nainc/number is given in the figures and
represented in the table by the brackets !,ý.
Table 6.1 Restill% legend for each SC03 model.
Tempt-ralure PredictiII11%
Model NIIIIIC title
I Model
I Model with Sussex Cone Corrclation
lic"t Matched Model
Measured I'csl D. 11a
41 111::
ccll It.::
B111t. A If::
1,1111, + IIII!:
I C111peratureDifferences (measured - S('03 predicted)
Model \'1111c odc
Datum Model
1 Model with Sussex Cone ( 'orrclation
Best malched Model
Ruff (141::
( 11cen di.::
B111c A (11::
FI crenceigures 0.8 to 0.2 1 show the icniperature time graphs (uppcr plot) and temperature (I
time graphs (lower plot) for each thermocouple position. For the tenipcrature difference graphs,
shown as the lower graph in each figure, the temperature difference or error is defined as the
110

7/28/2019 Chew Packwood N Turner
http://slidepdf.com/reader/full/chew-packwood-n-turner 133/343
measuredemperature inus heSC03predictedcmpcrature. igure6.22showsheaxial
temperatureifferencesacross iscsNo.2 andNo.3 at three adial ocationsor thebcst-matchcd
SC03modelcomparedo themeasuredemperatureifferences. igure6.23showsheradial
1cmpcraturcifTcrcncc,iscrim tocobfor stage and3 discs.Results avebeenproducedor the
wholecycle,however,as hematching xercise nlyconsideredhesteady tateand he
accelerationransient, nly theseesultswill be discussed.
6.3.1Compressorrotor outer surface
As aresultof applying hemeasuredemperatureso therotor outersurface ia thegraphical
functionshownn Figure6.4, hemodel emperatureserewithin ±IK of themeasurementsor
both he ransient ndsteady tateconditionsorall models, ndsohavenotbeenplotted.
63.2 S(age2 discsurface Figures6.8(o6.12)
I'lic error (measuredminus predicted emperature)n thedisc No.2 borc temperature TC7)prediction was-1 K at steadystatefor thedatummodeland increaseso a 4K error using the
CONE correlation. Errors for the bestmatchcdmodel arc lessthan IK at steadystate Figure 6.8).
The measuredemperatures n thestage2 disc showthat the upstream left side) surfacewashottcr
than the downstream right side)surface(seeFigure6.22). Predicted emperatures singthedatum
model with naturalconvectionheat ransferon both sides of thedisc do not show this temperature
difference across hedisc, andthis will bediscussed urther in section6.3.6.This is clearly shown
in the temperaturecontour plot, Figure6.7. For thedatummodel,at the near steadystatemaximum
condition therewasanerror of -3K on thedisc diaphragmand a transienterror (on theacceleration)
of IK at the inner (TC9) andoutcr (TC 11)part of thedisc diaphragm,(Figures6.10and Figure
6.12) whilst anerror of 3K occursat the mid radial position (TC 10), Figure 6.11.
With theSussexCONE correlation replacingthenaturalconvectionheattransfercorrelationon the
disc surface, he temperatureerrorsaregreaterat the inner disc radii. I lowcvcr at themid andoutcr
radial positions theCONE correlationappears o reduce he temperatureerror during both transient
andat steadystate.For thedisc cob (TC8) the temperaturecrror was large(-7K) for theCONE
model compared o ±IK for thedatum model (Figure 6.9).
III

7/28/2019 Chew Packwood N Turner
http://slidepdf.com/reader/full/chew-packwood-n-turner 134/343
Forthebcst-matchcdmodel herewasa maximum rroror- IK at thenearsteady tatemaximum
condition oralI positionsalong hedisccxccptat theouter adialposition TC l) where heerror
was 3K. During he ransientollowingtheaccelerationhecrror wasbetween-2K andI K.
6.3.3Stage2-3 shroud (Figure 6.13)
All three thermal model predictions for the intcr-disc cavity shroud(TC 12)agreedwith
measurementso within IK during the transientand- 2K at the near steadystate condition.
6.3.4Stage3 discsurface Figures6.14 o 6.18)
As with thestage2 disc hemeasuredemperaturesntheupstreamleft side)surfacewcrchottcr
thanonthedownstreamrightside)surfaceseeFigure6.22).Forthedatummodel. at thenear
steady tatemaximum ondition he emperaturerror waswithin-2K onthedisc diaphragm nd
during he ransientfol owing heacceleration)hecrrorwas5K at theoutcr,TC 13 Figure6.14)
andmiddle,TC 14, Figure6.15)partsof ilia disc.At the nner adialposition,TC IS(Figure6.16)
an crrorof4K
wasshown ooccur.
As with thedownstreamsurfaceof disc 2, with theSussexCONE correlation rcplacing thenatural
convectionheattransfcrcorrelationon thedisc surface he temperaturecrrors arc greaterat the
inner disc radii. For mid andouter radial positionstheCONE correlationappears o reduce he
temperatureerror at the near steadystatecondition. During the transient heerrors arereduced
along theentire disc surface.For thedisc cob, TC 16 (Figure 6.17) the temperatureerror was-3K
for the CONE model compared o IK for thedatummodel.
Forthebest-matchcdmodel herewasa maximum rrorof IK at thenearsteady tatemaximum
condition or all positions long hediscdiaphragm.During he ransientheerrorwasbetweenK
atthe nnerradialposition TC15)and5K at theoutcr adialposition TC13).
Theerror n thediscstage borc emperaturerediction,TC 17 Figure6.18)waswithin 2K during
the ransient ndat steady tate orthedatummodel.With theCONEcorrelationmodel herewasa
-2K erroratsteady tate.The bcst-matchcdmodelerrorwas esshanIK at steady tate.
112

7/28/2019 Chew Packwood N Turner
http://slidepdf.com/reader/full/chew-packwood-n-turner 135/343
63.5 Staflonary shaft (Figures 6.19 to 6.21)
Generally, the temperatureerrors ncreaseslightly moving axially along the shaft.At the stage2
(TC27) and 3 (TC29) disc positionsthe nearsteadystate error waswithin -3K for both thedatum
model and the CONE correlationmodel. For the bestmatchedmodel theerror wasreduced o less
than lK.
6.3.6 Discsstages2and 3 axial temperature differences (rigure 6.22)
As mentioned reviously,or bothstage2 andstage discs hemeasuredemperaturesnthe
upstreamIcft side)discsurfacewerehottcr hanonthedownstreamrightside)discsurraccsee
Figure6.22)by upto2.5K duringboth heaccelerationndat thesteady tatemaximum ondition.
Predictedemperaturessing hedatummodelwith naturalconvection eat ransrcronbothsidesof
thediscdonotshow histemperatureifrcrcnccacrosshedisc. For hebestmatchedmodel,at the
middleandouter adialpositionsheSC03solutions howvery ittle differenceaxiallyacrosshe
disc diaphragmsonbothdiscs,whilst at the nner adialposition hediscupstreamurracc
temperatureasust IK hotter han hedownstreamurraccor both hestage and3 discsat themaximum ondition..
6.3.7 Discsstages2and 3 radial temperature differences (Figure 6.23)
Comparinghepredicted iscradial emperatureiffcrcnccs, iscoutcr radius for disc 2 mean f
TC3andTC4)to thedisccob meanof TC6,TC7andTC8). for thevarious hermalmodelso the
measuredemperaturei ffcrcnccs howshat hebestmatchcdmodelmatchcdowithin IK of the
measurementstboth henearsteady tatemaximum onditionandduring he ransicnt
(acceleration)omparedo atemperatureifTcrcnccf 3K rorthedatummodeland4K for tile
CONEmodel.
113
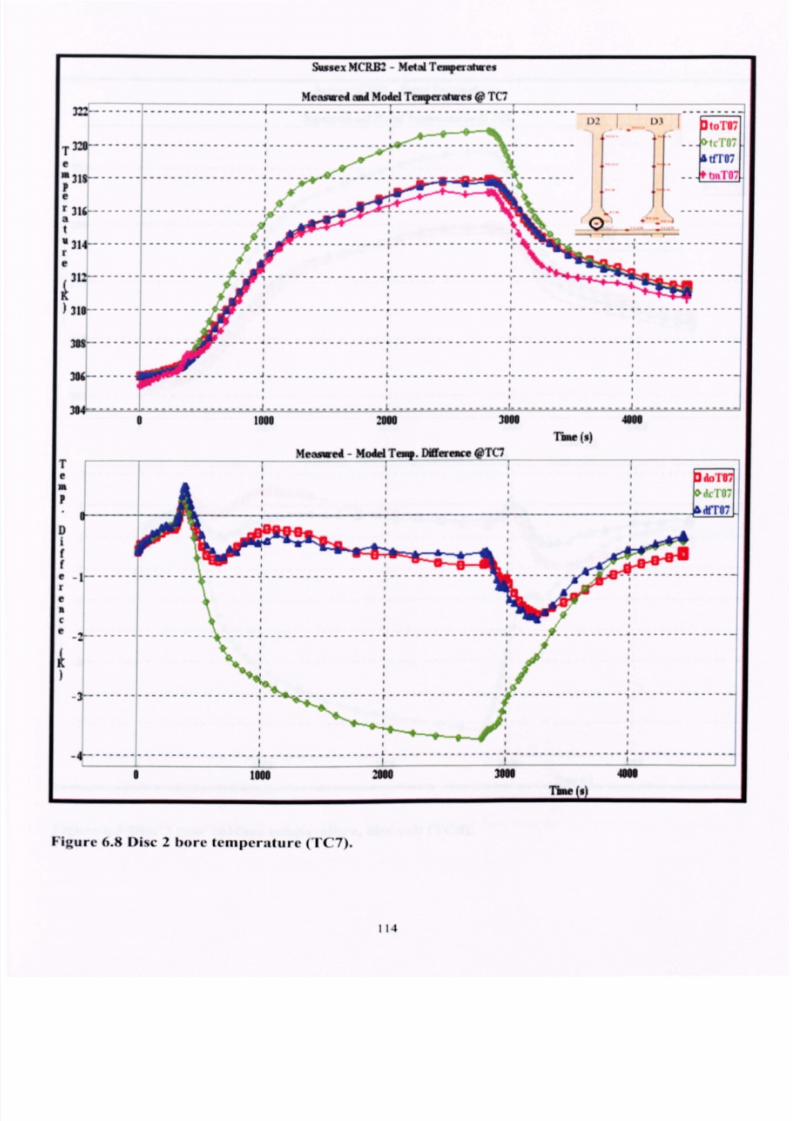
7/28/2019 Chew Packwood N Turner
http://slidepdf.com/reader/full/chew-packwood-n-turner 136/343
SusexMCRIC- MetalTmperahwes
----------------- 4------------------ , ------ ----- -- ----------------1 Im m 3m «
(3)
-------------------------
Memwed- Modd esq.DifferenceTC7
-------------------------i----------------
8 Im 30 3m
Figure 6.8 Disc 2 bore lemperat tire ('117).
TIN* 1)
M
m
114

7/28/2019 Chew Packwood N Turner
http://slidepdf.com/reader/full/chew-packwood-n-turner 137/343
SusexMCRECMetalTengeratwes
M,m,, i mdM,.ýd'Tmjftatwes @ TO
I 3S-
ap
320--------aIar
----------------- ---------------..........
I---------------- 4 . 'r( ---------------------
1001
D2
0.
1)3
OS
t. tJ'
315 1...............
7--,. P ---------------------------------
--------------------------------- --- ----------------
----------------- ----------------- -----------------
U
................. ----------------
zm 4w
Measwei- ModelT"q. Differeace@TCS
e- ------- ----------- ---- ------ ------------ ýdo I us
pI -------------JVhL-,
Ip*O, -
--------------------------------------- :,! I--. Aw. I KIN
ff
__________ ---
0
-21----------------- 1011 " ------------- ; -------------
31 ----------
r
eRc
4-
----------
3m
T"Wes)
or10,
......................
III----------------------------------
- -----------------
...............
-----------
-------------------------
3ý- ---------- --1
............ . --11 Im un
-4---------------- I
---------------
3W
.DILW
Figure 6.9 Disc 2 rear surface (empera(ure, disc cob (TC8).
------------------------------
115

7/28/2019 Chew Packwood N Turner
http://slidepdf.com/reader/full/chew-packwood-n-turner 138/343
SusexMCRB2- Meal TemMatwes
MeamwedandModel emTeratwesTC9
oiAtrro9ý
tin 1 19
1)2 I)
0-
I .-
I I- II
0
-----------------------------r------------------- ----------------................
1011.
01
3m
Tlmes)
'rMeamwedModelTaq. Differeace@TC9
1 ---------- . . -r .... ... .......
e u an i u7i
......................................
------------oa4lw--------------
:--
drrog
----------- ---------- ---------------- -- -------------- ---------------
Adgpl I IN-
ilia1*
------------------ i----------------
"cý ------------ ----------------- i-------- -------
cI -MA&W17- II -11L 4.
e-I
I------------------ I:
-V-oI
..........M-4MC I
....................I...... --------
IiýLII-- -IL)-
iII
..... ..... ------------------ ------------ ------------
-----------------J-----------------L.................
: %,, r------------------------------------------------- 4----------------- t ................................... j ----------------
3W 40
Times)
Figure 6.10 Disc 2 rear surface (emperalure, inner radii (TC9).
116

7/28/2019 Chew Packwood N Turner
http://slidepdf.com/reader/full/chew-packwood-n-turner 139/343
SusexMCRB2- MeldTemperdwes
're
4
Measured- ModelITewt.Difference@TCII
-- ------------------------------------
Ii MN-ý
----------------------------------L.............
MeamedmdMod'elerfastwes@TCII,
2m
----------------------------
Pdo 1101tit
,
I&dfl 10
- ---------------------- ,--------------
---- r -------------- ---------- - lý --------------
1 im !m 3m «
rme(s)
Figure 6.11 Disc 2 rear surface lemperal tire, mid radii (TC10).
im
1)2 l).
71me5)
117

7/28/2019 Chew Packwood N Turner
http://slidepdf.com/reader/full/chew-packwood-n-turner 140/343
Sum MCRB2- Metal eogerehm
II................. ............
MeasuredandModeleoqaalwes@TCII
I
I).
................ I 10111
Iýtfl II
ýi- 111
I
Im 20 3w
Tlmes)
M
Meamei - Model en?.Difference@TCI
------------- ---------------------- -- --- -
eap 3--
--------------- 11---------------- r, ................ I-----------------
11--------------
............... -----------------.................
:----------------------------------
I im 2w 30 m
Time(s)
Figure 6.12 Di%c2 rear surface temperature, outer radii (TCl I ).
-------------------------------------------------------------------------------------
---------------- ..........----------------............
-------------- ...........................W--4L- ýr:
------------I----------------
119

7/28/2019 Chew Packwood N Turner
http://slidepdf.com/reader/full/chew-packwood-n-turner 141/343
SusexMCRB.-MetalTerqeratwes
Meamuredad ModelTaipff atwes@TC .1
im
Plof I.
.............. I
1(11'
tfr 12
I
ý tilt I 1'r
I
2*
................. ------------------------------------
I 3w
I )-l
Ilme(S)
I)i
m
---------------j.................L................... ................
j-ý--------
III
i-* ::................
-------------
--------------- ---------------------------------------------------------- --
---------------- ................. ....................................
- -----------------------1-----------------
L----------------- ------------------
,---------------
8 Im 2m 3m m
TImes)
Figure 6.13 Disc 2-3 shroud surfilce (emperalure (TCl 2).
119

7/28/2019 Chew Packwood N Turner
http://slidepdf.com/reader/full/chew-packwood-n-turner 142/343
SusexMCRB2- MetalTengeratwes
MeaswedmdMod;elTeiVeratwes@TC13
----------------- I ----------------- -----------
I
eNk
p
D
IC
eac
----- ----------------------
I
I
Im
Im
20
D.,
0
f.
[)I
4-li
101
fk,if I'
till I
--- -1 ---------- IIII
3M
Meamed- Model esq.Difference@TC13
. 0 3m
Figure 6.14 Disc 3 front surface temperature, outer radii (TC13).
Time s)
Tbw s)
M
M
120

7/28/2019 Chew Packwood N Turner
http://slidepdf.com/reader/full/chew-packwood-n-turner 143/343
33s---- ----
I
I
e
p
D
I
C
rC
C
C
SusexMCRIr.- MetalTemperatwes
Meamedamd odelTengaotwes@TC14
------------- ------------ ------ -- -------- ...........
im
Measured- ModelITesq. Difference@TC14
TImes)
I)., 1);
M
------------ -------------- a:---------------------------------------
-------------------------I-----------------
im m 3W
Figure 6.15 Disc 3 rear surface (emperature, inid radii (TC14).
Ilne (s)
4m
L toH4
f,ýtff14
do'F
LKI-I 41
121

7/28/2019 Chew Packwood N Turner
http://slidepdf.com/reader/full/chew-packwood-n-turner 144/343
SusexMCREC- MetalTemperatwes
315----------------
I
I
II
II
II
---------- -----------------I
................. ..................................
Ion M 3m
rmw 6)
40
Meamed- ModdITewq.Differeace@TCS
I
------------- --------------------------
F
D
I
e
C
I
C
C
II
II
Ion
Ilme 0)
Figure 6.16 Disc 3 rear surface lemperal tire, inner radii
40
41dul 1 ýýVitIIsNrris
122

7/28/2019 Chew Packwood N Turner
http://slidepdf.com/reader/full/chew-packwood-n-turner 145/343
Susex MCRIC-MetalTemilperatwes
32S
T
-------------------------
p
C
Meamwedad Modelemeratwes-r -----------
93C
IIiml sm
D2
dT16
0 (in'l 16
. ............
3w M
TImes)
Measured-Model,aq. Difference@TC 6
----------------- I ................. I ................ 1- W777-
-----------------
----------------- -----------------
-------------------------4----------------------------------;................. I-------------- --
I Im 20
Figure 6.17 Disc 3 rear surface lemperature, disc cob
(IfF16
---------------------------------
3w
,nw s)
M
a
121

7/28/2019 Chew Packwood N Turner
http://slidepdf.com/reader/full/chew-packwood-n-turner 146/343
Susex MCRBI.-
MeadTeagwatwes
324-
THeasurei- ModdTmq. Differeme@TC 7
-----------------
L
IS -------------
D
..........................
-15 ---------------------------------
II--I----------------------------r-------------------------------
11"
Figure 6.18 Disc 3 bore lemperahire (TCl 7).
MeamedmA odeleo ra!Fev OTC17,---------------- 02
Tlow 1)
i, ýL................I
3m
TUe (s)
fol F
1,1F-
tfr II
tmT -,
vd -1,, -1,
LEE-.
124

7/28/2019 Chew Packwood N Turner
http://slidepdf.com/reader/full/chew-packwood-n-turner 147/343
Susex MCREC- MetalTewperalwes
I
T
e
Meameiad [email protected]
im SN 3w
Tlme s)
M
Memwed- ModelT". Diffezence TM.III
15 -------------------- - -------------------------
p
a
Im
Figure 6.19 111shaft surface lemperature, disc 2 hore (TC27).
30
Tue(s)
II:,
tfIrl 2",
ýL, ,
I ýs

7/28/2019 Chew Packwood N Turner
http://slidepdf.com/reader/full/chew-packwood-n-turner 148/343
Swwx MCRB2 MomiTeogwetwes
Memwedad Modd aVestwesQTC23313............................. .....................
I);
Itol 's
nI 2S
T
em es-
I
................................................................
Im 2m 3w
nmeI)
L)
0
m
.............
MeamwedModel mq. Difference TC23
-25 ........................................... i ..............
I im :0
.I................
im
Týw (1)
Figure 6.20 11'shaft surface temperature. between disc 2 and 3( FC28).
40
126

7/28/2019 Chew Packwood N Turner
http://slidepdf.com/reader/full/chew-packwood-n-turner 149/343
SusexMCR82 MetalTeiVeratwes
MeaswedmdModel nvqertdwm@T('.9 I)' 1);
J) o129
£ tfF9
ý111L-I-,0
366
I Im m Im
MeameA Model mq. Difference T".
llne (8)
M
IIIi
r
-----------------------
vII .................
-----------------2k
.31-
II
II
11---------------------
1 im...... ...... I
so
Figure 6.21 111shaft %urface temperature, di-ic 3 bore (TC29).
An
Tlw (s)
127

7/28/2019 Chew Packwood N Turner
http://slidepdf.com/reader/full/chew-packwood-n-turner 150/343
0
ap
is-
I
IS
k-1.5
I
Im
im
im
Oder R&AW Locatim
Disc2frCll TC3)&Diw](T(-21 -rcu)
II
2m
MW RrAol Locndom
Disc2(TCII TC4) & D6sc 3 (TC21 TC 14),
2w
Iý............. L--- --
Dim. Dcdwm
Ipl" BrorAst Mrmw rd
Dist 3 DAtmk
1h. t I Reld
La 1 1.ý 1 %l mm rd
imTlow (s)
Dimc Doom
Dist liesl
Dioc 2 Meamwrd
Pisc 3 1)., vn
Pi%t 3 Resi
4w
hý RjWWLocadm
Disc 2 (TC9 - TCS) & Disc 3 (TC 19-TC 15)
2m
Tine (8)
0
A Disc2,
Mema CAPW 3 1)tdi»
Digt 3 urbi
Is Dist 3Mraxim d
14m
Figure 6.22 Axial temperature differences across stage 2 and stage 3 discs at three radial
locations comparing (he da(unt model and the best matched model Ailh measurements.
12H

7/28/2019 Chew Packwood N Turner
http://slidepdf.com/reader/full/chew-packwood-n-turner 151/343
DiK 1.md 3 RsAW Tempmetwe Gradad
35......
Slýv22
Disc
----- i ---------------- --------------1
5. ýý, -------------8 Im
21M 3m
Tbw is)
Tbw (s)
DDdm
I ', own -(I Y% :
Bee Mach
It Mramed
D Am
I ý'Ofulll -((I"
A Broi Mcdch
'-It,ý%%n vý
Figure 6.23 Radial temperature differences ((Ii%couter radius to coh) for stage 2 in(] %lage3di%c%comparing the best matched, (flittlill illodel and the CONE model ýOlh nicawremen(s.
121)

7/28/2019 Chew Packwood N Turner
http://slidepdf.com/reader/full/chew-packwood-n-turner 152/343
0.3.8 Be%f-malched model
Figure6.24 showsthe positionsol'the SC03boundarycondition Iýatures.volds. /ones. streamsand
ducts for the bestmatchedmodel. The SC03modelwas nin Iransiently through the cycle shown ill
11gure6.3 to a specifiedaccuracyol'O.2K. Towardstheend of'(he period at maximum speed he
solution approachesa steadystate condition. A temperature ontour plot a( the nearsteadystate
maximum speedcondition time point ( 2800s) s shown in Figure6.25.
The thermal I)OLIndaryconditions used in the 'best nia(ched' model are given in Appendix 2 and tile
evaluated thennal boundary condition values at the 'near' stabillsed maximum speed condition are
given in Appendix 3.
Sussex -CAmityRig Build 2
ModI84 V41t build I Me"ling rqwfira-ýý, o
"Oo T_'
7 II
0141A"
Vý
N t4
wo ..00
. ""_ . "' .---.
"-_ . "_-
I--
IIj
1110100 .,0
I
Figure 6.24 Location of Boundary Condifions for lhe Res( Malched Model.
7 \
.+
I
ý!!!
IN
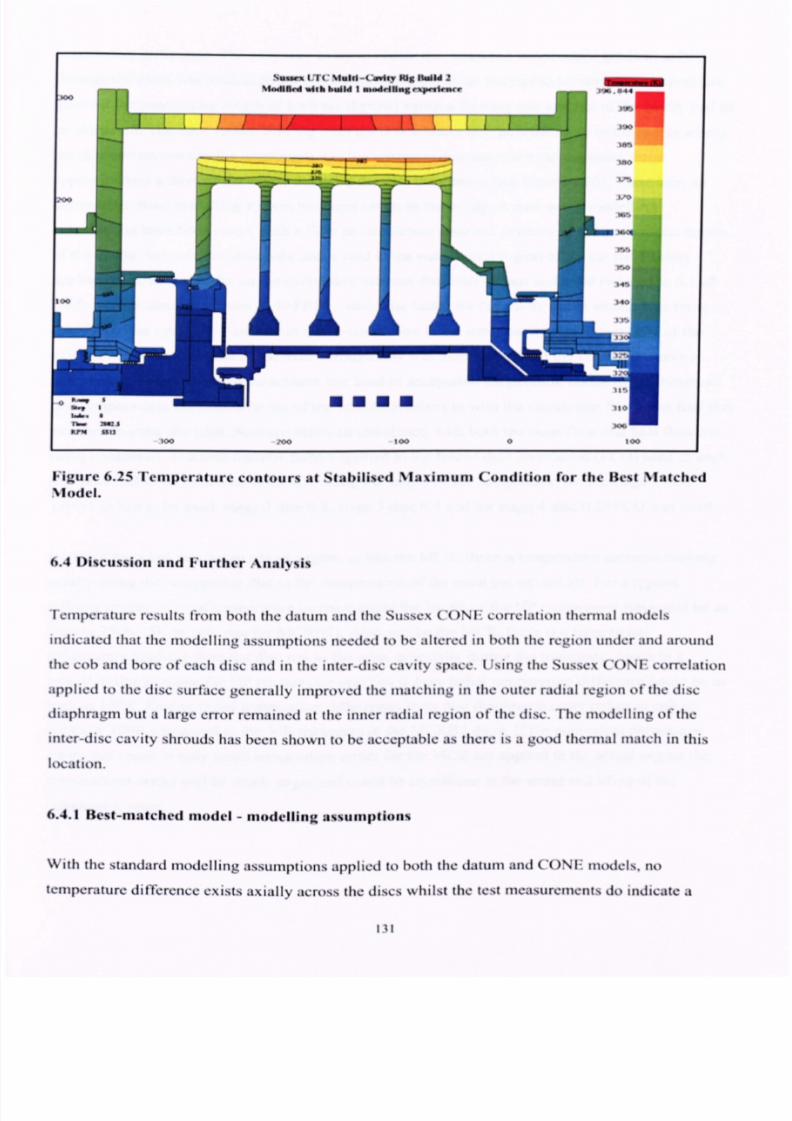
7/28/2019 Chew Packwood N Turner
http://slidepdf.com/reader/full/chew-packwood-n-turner 153/343
P ,ý, jrc
6.25 Tempermure con(()tjrs al Slabilised Nla%iilltjnl Condition for the Best Malched
Model.
6.4 Discussion and FurtherAnalysis
Temperature results Cromhoth the datum and the SussexCONI: correlation thermal models
indicated Illat the modelling assumptions needed to be altered in both the region under and around
tile coband
bore
of*eachdisc
and in [lie inter-disc cavity spacc.
Using the Sussex CONI:correlation
applied to the disc surface generally improved the matching in (lie outer radial region of'the disc
diaphragm but it large error remained at the inner radial region ofthe disc. The modelling of' the
ititcr-disc cavity shrouds has been silowil to be acceptable as there is it good thermal inatch in this
locatiOll.
6.4.1 flesi-matched model - modelling a%%timptions
With the standard modelling assuillptions ýIpplicd to both the dattim and CONF models. no
temperature dillerence exists axially across the discs whilst the test measurementsdo indicate it
131

7/28/2019 Chew Packwood N Turner
http://slidepdf.com/reader/full/chew-packwood-n-turner 154/343
temperatureifTcrcncc. heonly wayto try toobtain hemeasuredemperatureradientaxially
throughhediscswas ochangehemodellingapproach.n an attempto achievehis temperature
gradienthepenetratingengthof both he hermalstreamslowing intoandout of thecavityhad o
be ncreased.he nletstrcamlowingonto hedownstream iscpenetratedpto theradiuswhere
thedisccobnarrowso thediaphragm.Ontheupstream isc heoutletstrcam tarts rom
approximately thirdof thecavitydepthonthedisc diaphragmseeFigure6.26).Thcrcrorc,an
asymmetriclow modellingsystem asbeensetup n thecavity.A newsetof modelling
assumptionsavebeenmade,with a flow rc-circulation ssumedo occur n the nnerradial egion
or diecavity,betweenhedisccobsandavoid in theouter adial egionof thecavity.Factors
appliedo the icattransferonthecavitydownstreamisc nletstrcamhad o bereducedo 0.1of
the orce reedisccorrelation
0.1xFRD),
whilstthe actor or the
cavityoutletstrcamwasseto
0.9xFRD.Theoptimum low rate n therc-circulationn the nnercavity regionwas0.07of the
axial hroughflowand0.08of theaxialthrougliflowwasassumedo reed hevoid in thecavity
outer adial egion. lowcvcrtoachieve nykindof acceptableemperature atch o diemeasured
disc emperaturesheheatnowout or thevoid(thatmixesn with thecirculation low) washalf that
assumedoenter hevoid.So hereexistsan mbalance, ith both hemasslow andheat low not
beingconserved.heheat ransferactorsapplied o therorccdductcorrelationFCD)usedn each
disc borchad o bevaried or eachdiscalong he engthof thecompressor,or thestage discI.OxFCDhad obeused, tage2 disc0.8,stage disc0.4and orstage disc0.2xFCDwasused.
It shouldbenotedthat for an actualcnginc, unlike theNICR, there s tcmperaturc ncreasemoving
axially along thecompressordue to thecompressionof themain gasstrcarnair. For a typical
military enginean axial temperaturencreasealongthe lengthofthe I IP compressor im could beas
high as250K(5K to I OKrisc for NICR132).Also, unlikctheNICR, thcrc is a largeradial
temperaturegradient from thedisc rim to thebore,cspccially during the transients.Again in a
typical military enginethe I IP compressordisc rim to borc radial temperaturediffcrcncc could be as
high as 150K. Engineradial temperaturedifferencesfrom disc diaphragmouter radiusto cob arc
typically IOOKcompared o the30K measuredn theMCRB2 discs. If thecquivalcnt pcrccntagc
crrors that result in only small tcmpcraturecffors for theMCR arc appliedto theactualenginethe
temperatures rrors will be much largerandcould besignificant in thestressand lifing oftlic
compressor otor.
132

7/28/2019 Chew Packwood N Turner
http://slidepdf.com/reader/full/chew-packwood-n-turner 155/343
I hic II I'm
sircaln H'..
Mctmal Void
III"..
II
I I,,V
I)u"lllly sircam w
I emperalurcI ran%lcr
1fral rmnblef --0>
I
4.p.
u
I--,
'
I
ol
(.
--
I
1 (.1) Dattlill Model (b) Re%lMatched Model
Figure 6.26 Comparkon of the thermal modelling approach u%ed in the dalum model to that
u%cd in the hest-malched thermal model.
6.4.2 [feat transfer coefficient% oil tile (fi%c%urface and ca%'i(% hroud
I lie lical transfer cocil-mcm % rialion with linic 1hrough ilic acccl (Icccl cNcle at three position,,.
mid radius on the upstream disc (stage 2). TCI 0. on dic stage 2-3 cavity shroud. I'Cl 2 and on the
downstream disc (stage i), r(, 14 are shown in the Figure 6.27. Fhe figure shows the licat transter
for the three llicrinal models. For both discs the heat transfer coefficient% for the best matched
model are in agreement with the CONI: correlation giving a value 4 times diat giýcn by the
05, NVP natural convection correlation. For the cavity shroud heat transfer [lie damin modcl used
0.75 -NUS natural convection from a liori/ontal plate correlation compared to 0.077- NUS u...cd in
the best-mate ied model. As mentioned earlier this gives the equivalent heat transfcr coefficient to
that produced by the Sussex UFC derived shroud correlation. which .%-;s 0.9 offhat used in the
dalum model. This is shown in the grapli.
131
)f DUL.
ý1.

7/28/2019 Chew Packwood N Turner
http://slidepdf.com/reader/full/chew-packwood-n-turner 156/343
IIr ed Tr MAIIVWCOVfikirM 00 St MgV .2&MIK 0 MW ('A%*Y. %Wtnw
HTCgm UPWREAM DISCVTC14
I
118.14TC
li 8.
T
IM
:8. "
K 6-64
0
I im
:11. Mune -('0% 1
............................................................... ja Brei mdidcä
0
--------------------------------:................I .................
............... ! ................ I
I Im
I
2m
lf'rC na DOWNSTREAM DIS('40T('14
2m
IfTCim CAVITY SHROUD @TC12
Im
AN
A3L
................. j
Tlow (8)
..........
TIme (9)
4M
---------- ------------
................ ............
...............
10
lgvaftitsýw........................................
im IM Im
Figure 6.27 Comparison oftlie licat 1 an%l'er ci)elilcietit% on %tage%2 and I (ii%c%und ilie ca% lN.
%hroud for Ihr three fliermal niodel%.
114

7/28/2019 Chew Packwood N Turner
http://slidepdf.com/reader/full/chew-packwood-n-turner 157/343
0.4.3 Ca%ilý flo" regime%
According to Alexiou 120001lie Rossbyiminbcr (Ro) canbeused o detenninewhetherthe flow i's
buoyancydriven or whether the throughtlow eflectsdominate.
For
For
I-or
Ro - 3.15 buoyancy effects dominate
3.15 - Ro - .1.85 flic flow is transitional
Ro - 3.85 throughtlow effects dominate
For dic MURIQ stage 2-3 inter-disc cavity the time history plot of'Rossby number is given in
Figure 6.2X. During the majority ol'the transient and at the steady state maximurn speed condilion,
the Rossby ritimber plots show that the MCRI32 1% inning in the buoyancy dominated rcginic
Tbw Mgm ni R"sby Nh. RA
IIlifolighlitm 041111111.1111
1
4
I
a
)
I
S
0
I.Iul'. uIli UI I
ii'
Itiu tui I
.S --
A; MAM 4,NM
Z: TMAN @AKUM
C; 2Wa @jullft0. J[Mie 3x717
9: 4m48 UM
r.
Figure 6.28 Time history 44 llos%l)%-t tonher (Ro) f(or %ICR build 2 %1ge 2-3 in Ier-disc cavi I).
A further set of'criteria to determine it'huoyancy ellects are dominant has heen set hy Sussex
University from Ihere work on (lie MUR 131 drive cone cavity. I lere the Iwo flow regimes were
characterised hy:
135

7/28/2019 Chew Packwood N Turner
http://slidepdf.com/reader/full/chew-packwood-n-turner 158/343
Buoyancycffects dominate Bo-Ro/(PAT)1/2 <6
Throughilow cffects dominate Bo-Ro /(0 AT)" >6
Table6.2 belowshowsheBuoyancyNumber Bo)valuesat thenearsteady tatemaximum peed
conditionand or thegreatest T during hedccclcration ack o idle for the hermocoupleositions
onthediscsurfacesorming hestage .3 intcr-disccavity n MCRB2.Theseassumehrought'low
fluid temperaturesf 317K(SC03duct emperature,T24)at themaximum onditionand311K at
the dlecondition.Themetal emperaturesTm)usedn thecalculation rcfromtherig
thermocouples.heRossbynumber,Ro,saconstant alueof 0.8511at themaximum peed
conditionand3.3609at the dlecondition.
Table 6.2 Buoyancy pararne(er values a near steady state maximum condition and during (fiedeceleration.
NearSteadyStateMaximum Deceleration o Idle
ThermocouplePosition AT(K) (PAT)112 flo-Ro/(PAT)"' AT(K) (PAT)"' Bo-Rol(PAT)"
TC-9 stage disc 6.7 0.145 5.86 0.5 0.040 85.13
TC-10 11.9 0.194 4.39 2.6 0.091 36.50
TC-11 29.0 0.303 2.81 6.2 0.141 23.86
TC- 12shroud 50.2 0.398 2.14 7.2 0.152 22.01
1
TC-13stage disc 33.6 0.326 2.61 6.7 0.147 22.85
TC_14 15.0 0.218 3.91 3.1 0.100 33.57
FfC-I 51 10.2 10.179 14.75 1.1 0.059 156.64
Thissecond etof criteriaalso ndicateshat hestage2-3intcr-disc avity soperatingn the
buoyancy ominatedregimeatthenearsteady tatemaximum peed ondition,butattilesteady
statedleconditionandduringmostof the hermal ransientesponsehasesorboth ile
accelerationnddeceleration,heaxialthroughtlowdominates.7his uoyancy umber riterion s
usedodeterminewhichof the woSussexUTCCONE icattransrcr orrelationss tobeused ora
particular avityflow, being
eithern
thebuoyancy
r the hrougliflowdominant
regime.
136

7/28/2019 Chew Packwood N Turner
http://slidepdf.com/reader/full/chew-packwood-n-turner 159/343
6.4.4Eckert number effects
The temperaturewithin thecavitiesrisesdueto thevortex associatedwith theswirl velocity of the
air, which increaseswith radius.The expected ise in relative total temperature or a forcedvortex is
given by the following formula:
.&T,,, - 0' ( r.
2- rj2 2 Cp (6.8)
In theaboveequation,r. is thecavity outer radius(m), ri is thecavity inner radius(m), C1s the
rotationalspeed rad/s)of thevortex andCp s the spccific heatcapacity(J/kg/K).
At thenearsteady tatemaximum peed ondition,Equation .8givesa relative otal temperature
riseof 7K.whilst at thenear dleconditionshe emperatureise s less hanI K. Tlicrcforc, his
cffect sonly importantat thehighcrrotational peeds. t themaximum peed ondition, hecffcct
ontheair temperature ithin thecavity'void' outcrregion san ncreaseor5K. whichhasan cffcct
of increasinghecavity shroudemperaturey 2K. Thisvortex emperatureise wasnot modelled
in anyof the hcrmalmodels.
6.4.5Axial licat flow calculations
Inorder oextractasmuch nformationromtheexperimentalataaspossible,urthcranalysis f
the emperature easurementsasundertaken.emperatureata rom both he ransientest.
describedn thischapter, nd romthree urthersteady tateests testno.33.34and50)havebeen
usedn thisassessment.
Using temperaturesat the threeradial locationson thedisc diaphragmandneglectingaxial
temperaturegradients,equationsmay be deduced or the net axial licat loss from thedisc surraccat
thecentral thcrrnocouplc ocation.This is shownbelow where a control volume including the
ccntral thcrmocouple ocation is considercdandcnergyconservationapplied.
137

7/28/2019 Chew Packwood N Turner
http://slidepdf.com/reader/full/chew-packwood-n-turner 160/343
I leat Hlix (W/1112)
r,, --184.5min
4-
r, 141.75iniii
4Qll
I
IIý,
10 '1,
10 11
l<
t Iflfl1r,
121nim
+I Ica( Flo\N ,, IN to [liedisc Illatclial
-I leat Flow Pý)(!. I
111Cisc Illatclial
r,, (r,,, r,, 2
r, (r. # j/2
- (),
-Q,
T%- Tr
In(
TI.- T,
r
01 licrillocoupIc position',
Sic;,(_JN,feilt How conduction F. uation.
heal flow III heat flow out Q,, 2itI-,, 2no, (6.1)
Fran"'ICIIH ca-1-1-jowConduction F(ttlallollý
11catlow III licat flow out # raic ofincrease III ctithalpy ot'llic "'a1c,
Q,,21rr,, 2n(r,,2- r. - Q, 2mr, -a(I, I (o 10ý
whm T is lime (s).
Disc niaterial is litanium witli a density, li 4421) k-giii 'and at a lemperature of' 1MI' flierinal
conductivity, k 7.72 Win 'K 'and ii)ccit"ic lical Cj, 562 lk-g kl. 'rliick-iies% ot'tlic dic
diaphragni, 1 0.008111
I Is

7/28/2019 Chew Packwood N Turner
http://slidepdf.com/reader/full/chew-packwood-n-turner 161/343
Forall four steadystate ests(tests33,34,50 and for theacccVdcccIcycle maximum speedsteady
statecondition) calculations,thenet axial heat flow is out of thedisc materialto thesurrounding air.
For disc 2,74%. 79% of theheatenteringthedisc diaphragmat theouter radius leavesaxially out of
thedisc diaphragm.Similarly for disc 3,74%-82% of theheat flow leavesaxially out from thedisc
diaphragm.Figures 6.29 and6.30 showthecalculatedheattransfcr(using the testmeasured
temperaturesn Equations 6.9 and6.10) into and out of thecontrol volumeduring theacceleration
(idle to max. speed)anddeceleration max. speed o idle) phases,or the two discs,disc 2 anddisc
3, respectively. lic transientcalculationshows hatat anarbitrary time (740.959s)during the
acceleration a slow acceleration n this test) theheatflow is into thedisc materialat the mid radial
position for both discs.The thermalanalysisshows hat for thesame ime point heat flow canbe
cithcr in to or out from thedisc diaphragmdependenton theradial position. According to the
thermalmodels,at radial positions inboardorr- 0.171mall theheat flow is into thedisc andat a
radiusaround0.175mmthe heat s into thedisc on thedownstreamside of thedisc andout on the
upstreamside.At a radius above0.182mall theheatflow is out of thedisc.
Table6.3compareshe NICR112iscs2and3diaphragm xialheat low calculationswithSC03
predictionsorsteady tateand ransientaccelerationdleto maximum)estpoints.Thetable
showswosetsof handcalculations,hefirstsetusedemperatureseasuredntile rig and he
second etusedSC03 hermalmodelpredictedemperatures.heheat ransrcresults romthehand
calculationsompare easonable ell with theSC03 hermalmodel esultsor bothsteady tateand
transient perating onditions. [cat ransferesultsgainedromtheCFDmodels f theNICRB2
havebeenncluded orcompleteness.heCFDresultsalsocomparewcll with both ilehand
calculations ndwith theSC03predicted eat ransfcror thesteady tateest33casebutnotso
well for thenearsteady tatemaximum ondition rom he ransientcsLThereasonor the
differencemaybe due o therig not reachingull stabiliscd teady tateconditions t tilemaximumspeed oint.Figures .29band6.30bshow hatatthestartof [liedccclcrationhehandcalculated
heat ransferwasapproximately0Woutof thediscswhich smuchclosero theCFDheat ransrcr
results. heseCFDmodelswill be hesubjectmatterorChaptcr8.
139
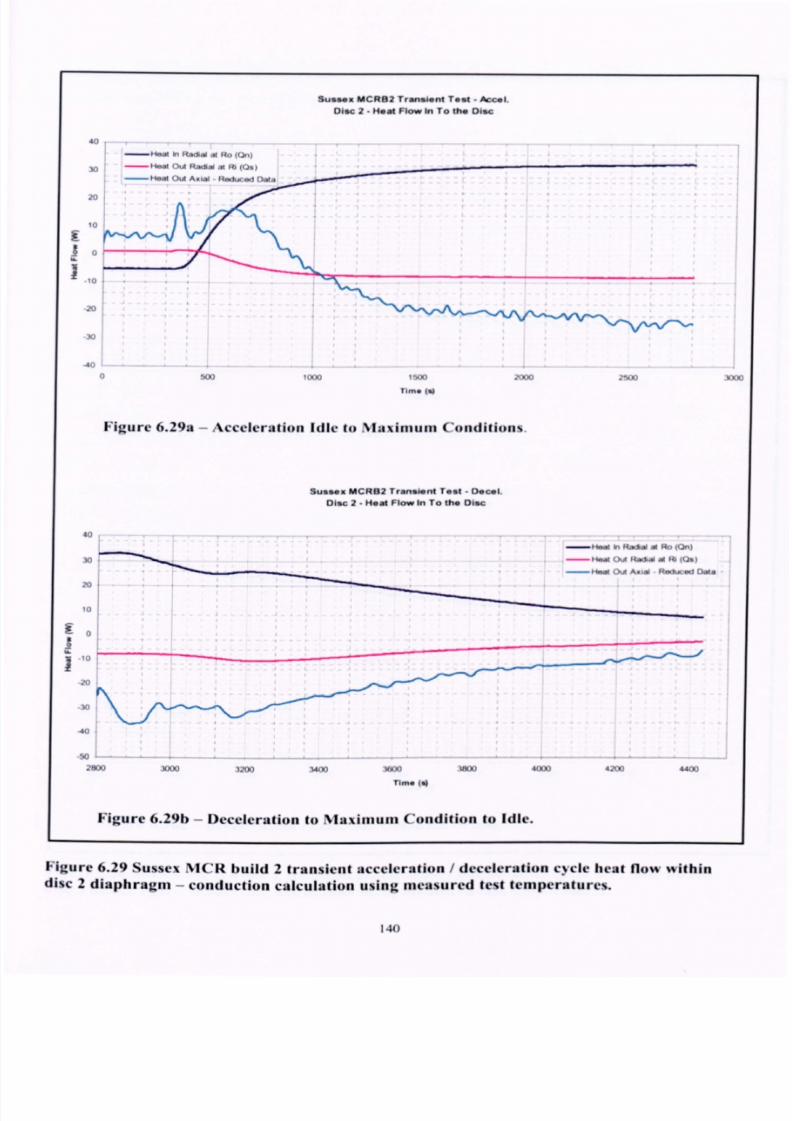
7/28/2019 Chew Packwood N Turner
http://slidepdf.com/reader/full/chew-packwood-n-turner 162/343
Sussex MCRB2 Transient Test - Accel
Disc 2- Heat Flow In To the Disc
4,1
20
10
-H-t I" co,..I 1c, ". 1',
-04" Oul Ra, *al m 1?. (ýj,,
.10
.1,1000 "(XX)1()()
li- 1.1
Figure 6.29a - Acceleration Idle to Maximum Condition%
Sussex MCRB2 Transient Test - DecalDisc 2- Host Flow In To the Disc
2500 UýK,
-1 4" bn Ri"40 41 K. ) (0. )
-e 4" 0,9 $4»cßw a R, (Q%)
-ý t" (>A A.. al N. N. i Dm A
: lux) UNX) W, X) Ak) ww 40ou 4200 4A(X)
Tlýe (a)
Figure 6.291)- Deceleration to Maximum Condition to Idle.
Figure 6.29 Sussex NICR build 2 transient acceleralion / deceleration cycle heat 114mý%iffiindi%c 2 diaphragm
- conduction calculation using measured test temperatures.
140
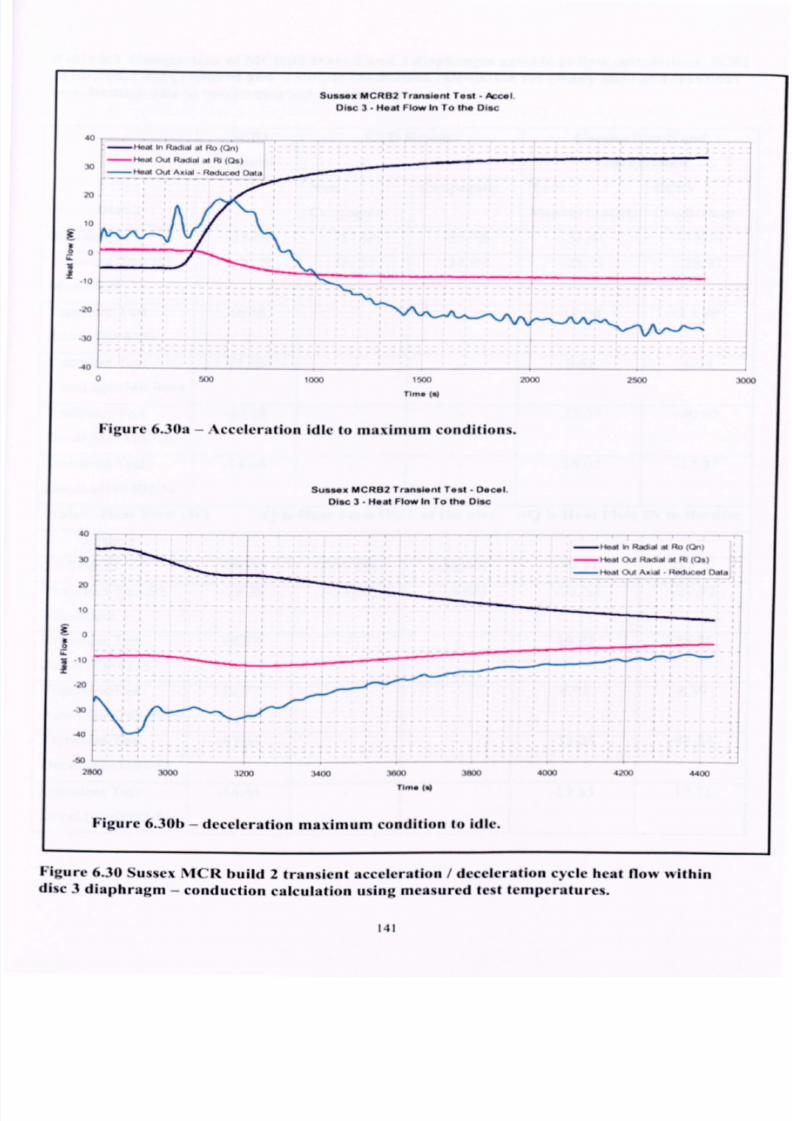
7/28/2019 Chew Packwood N Turner
http://slidepdf.com/reader/full/chew-packwood-n-turner 163/343
Sussex MCR82 Trmnei*nt Test - Accel
Disc 3- Host Flow In To the Disc
-
t ý.. l ( )"t.. I
14ý((,
).)
HOM Out AxIM- Reduced Dal. s
10
10
10
I., ý, ýx K)11-0
K)
Ti- (IL)
Figure 0.30a Acceleration idle lo illaxiIIIIIIII collditiolls.
Sussax MCRB2 Transient Test - DocolDisc 3- Host Flow In To the Disc
-Iinm W,RALUAI At RO ((). )
I 4-M OkA RWSIAO31 Ft (04)
)"1 4". 4 R-l", -1 onla
,A,. tk)O 3000 3200 Wo 3WOvm
Time (0)
Figure 6.301) - deceleralion maximum condifion to idle.
40W 4200 44M
Figure 6.30 Sussex NICR build 2 transient acceleration / deceleration cýcle heat llový %vi(hindi%c3 diaphragni
- conduction calculation using measured test temperatures.
141

7/28/2019 Chew Packwood N Turner
http://slidepdf.com/reader/full/chew-packwood-n-turner 164/343
Table 6.3 Comparison of AICIII12 Discs 2 and 3 disphrognt axial beat flow calculations, SC03
predicted, CFD predicted and a simple conduction calculation for steady state and transient(acceleration Idle to maximum) test points.
SC03 CFD Results Conduction Hand
Results Calculations
Non Conjugate Test SC03
Disc 2 Conjugate Measurements Predictions
SSTest 33-28.88 -27.64 -25.72 -33.41 -35.18
TransientTest SS -20.16 -30.32 -38.89 -24.71 -28.97
Maximum
TransientTest 16.48 17.08 15.89
Acccl.CWt-615s
TransientTest 11.50 8.82 6.45
Acccl.C(Lt-740.969s
TransientTest 40.28 -33.57 40.82
Deccl.Ca,-3167.5s
TransientTest -14.68 -15.07 -17.37
Decci.Cat-3802.5s
Note: Heat Flow (%V) -Q Is Ilcut Flow OUT orthe disc +Q Is Heat Flow IN to the disc
Disc 3
SSTest 33 -30.02 (-31.19) (-30.40) -37.11 -37.31
TransientTest SS -19.38 (-33.26) (-36.68) -26.32 -27.92
Maximum
TransientTest 18.58 19.23 20.55
Acccl.Ca-615s
TransientTest 12.77 8.92 8.39
Acccl.a(t-740.969s
TransientTest -41.61 -33.26 -41.24
TransiWt-T-cst. 14.61 -13.65 -17.71
Deccl.Cdt-3802.5s
142

7/28/2019 Chew Packwood N Turner
http://slidepdf.com/reader/full/chew-packwood-n-turner 165/343
6.4.6The effect or Internal radiation within the AICR build 2 rig.
In thebest hermalmatchedSC03modelan nternal adiationboundary onditionwasapplied o
thecasingwalls,whichsurroundherotatingcompressorrum.Thevalueof cmissivitywassetat
0.5.1owcvcraflcrdiscussionswith theSussexUTCteamt wasdiscoveredhat heMCRbuild2
rigcompressoriscswerepaintedwith a high emperaturelackmattpaint.Thereforet is
reasonableo assumehat hecmissivitycanbesetequal o 1.Alcxiouconfirmedhat hisvaluehad
been heckedwith ahandheld hcrmonictcr nd he hermocouplesn ilia rig.To investigatehe
effectof the nternalradiationwithin theMCRrig compressorrumaSCO3hermalmodelhas
beenuntocompareemperaturesith ilia bestmatchedhermalmodel. nternal adiationhasbeen
appliedoboth
heoutside urfaces f therotatingcompressorrum
ando the nside
surraccs rthecompressorisc drumandstationary haft.Emissivityhasbeenset oa valueof I rorall the
internalradiationboundary onditions.
The wographsn Figure6.31show ile metal emperaturest three adial ocations ndiscs 1.2
and3(andalso hedisc 2.3shroud) or the best'matchedhermalmodel,Figure6.31aand or the
compressorrum nternal adiationmodel,Figure6.31b. Comparinghe emperaturest the near'
steady tatemaximum ondition or the woSC03 hermalmodels howshat he nternal adiation
boundaryondition cmissivity- 1)applied o thecompressorrumdiscsurraccs as ittle effect,
an ncreaseof less hanIK onthediscmetal emperatures,xceptor thedisc I rim where he
temperaturencreases2K,with internalradiationapplied.Alsoduring he ransientsheresno
appreciablehangen discmetal emperatureetweenhe wo thermalmodels.Thercroreor the
SussexMCRwith modestemperaturesndsmalldiscradial cnipcraturc radientst canbe
assumedhat nternalradiationhasonly a negligibleefTcct nthedisc emperaturesothduring
transient peration ndat steady tateconditions.Convection nddiscradialconduction re he
dominant eat ransrcrmechanisms ithin thecompressorrum.
143

7/28/2019 Chew Packwood N Turner
http://slidepdf.com/reader/full/chew-packwood-n-turner 166/343
%. - M( x MI A... 60-4 F. 9
5.1 M... j ý&khd Nuw
rw
wo
IM
I*
$if
I
- II I
Figure 6.31a Alest' matched thermal model
%1( R 21 Aaw D. W t. 0
Db.
r
170
Re
M
144
K
I'
I
$4
no
Ii
A »). q4 %1 omp i,.. ýý, d
0 3031"
4 303M 130521 Db. I (, h
v MA I" II lbwb I
303jo : 1S. 16 ;:: MphSW. mim
I-I
bwb:; 30136
11 ini.. 44 bh)_r5
m ob. 1 Rbu
13013* wbam
INM134 ww"I Dh II sb-: l
=2 34 fig.
31101,119 Majob J,
31MV3 In Db. 1('. h
311111JI, 111,09
jq*1 M130 Wj
I
Rb.
WA.9"
301 M W-4"ý
Dh. I 1%. -A
4m
0-1.1
Figure 6.3 11)Compressor drum internal radialion Ihernial model
Figure 6.31 Stmex NICR build 2 effect of interital riodiatiou %silhiu the compressor inler-disc
ca%fics (entissivity - I) mi metal lemperal tire%.
144

7/28/2019 Chew Packwood N Turner
http://slidepdf.com/reader/full/chew-packwood-n-turner 167/343
6.5Conclusions
A thermalmodelbasedon standardndustrialpracticehasbeenproducedor therVICRI32ig and
predictedemperaturesompared ith rig measurements.ll the emperaturerrors nvolvedarc
modest, eing ess han5K rorall positionsandat all timesduring hecycle.However,heresonly
a30Kradial emperatureifferencebetweenhediscrim and hecob andonlyaSOK iffercricc n
thecavityshroudmetal emperaturend heaxial througliflow luid temperature.he 5K crror
relates, sapercentagef the emperatureifferencebetweenheshroudandaxialthroughflowgas,
toa7%crror at thenearsteady tatemaximum peed onditionandabouta 12%crrorduring he
acceleration.hisrepresentssignificanterror.
Comparisonof theresultsobtainedroma numberof modifiedmodels howedhat heressome
merit n using henew"CONE"correlation n theupstream nddownstream iscsurfaces. verall,
theconecorrelationsseenobecffcctivc n themidandouter egions f thedisc diaphragmor
thesteady tatemaximum ondition,achievingbetter esultshan hedatummodel.Onthese
criteria, heconecorrelationwasalsouseful or modellingconvection t the nnerradiusof thedisc
diaphragm uring hedecelerationo idle. I owcvcr,using heconecorrelation asadetrimental
cffcct onthedisccob andbore emperatures.uring ransientsheconecorrelation roduces disc
temperatureesponsehat sclose o themeasuredesponseor the nnerandmid partof thedisc
diaphragm.lowcvcr n theouter adialpartof thediscthedatummodelproduces better hermal
responsehan hemodelwith theconecorrelation.
Inter-disccavity shroudtemperaturepredictionswere good for thedatummodel and for the model
using theheattransferequivalentto that correlatedby SussexUTC.
Stressesn thediscsarc driven by temperaturegradient.Comparingthe radial temperature
difference,disc outcr radiusto thedisc cob, producedby the thermalmodels o that measured,he
datummodel is shownto perform much better thanthe thermalmodel with thecone correlation,
both at thenear maximum spccd steadystatecondition andduring the transients.Modelling around
thecompressordisc cobshasprovcd to bedifficult. To achievean acccptablematch with thedisc
temperaturemeasurements,he
followingnon-standard
hcrmalboundaryconditions
hadto be
assumed
14S
7/28/2019 Chew Packwood N Turner
http://slidepdf.com/reader/full/chew-packwood-n-turner 168/343
0 Asymmetricnictsandoutflows.
Imbalanceof hcat/masslow in andout of the ntcr-disccavity void.
1 igh and low heattransferon the upstreamanddownstreamdisc cobs,rcspectivcly.
Variation in factorsof
the forcedduct heattransferon
disc boresalong
the
compressor.
The extraordinarymethodsused o achieve a match for this applicationarenot expected o read
across o other situations. I lowcvcr, it is worth noting that thesolution involved increasing he
circulation into the cavity from the"normal" 10%to 15%of theaxial throughilow. orthis 8% goes
into theouter cavity void andthe remainderstays n the throught'lowdominatedzone.
It is clear that traditional modelling approachesor this problemsuffer from,variousdift'icultics and
thatcare s needed n interpreting the thcrtnal analysis.Greaterunderstandingor the flows occurring
in thebuild 2 configuration is required.Build 3 of the Sussexrig will provide velocity
measurementshat will help understandhe flow within the intcr-disc cavities. CFD work will
continueto beusedfor the build 2 andbuild 3 configurationsto supplement he measurements.
Someprogresshas beenmade n themodelling of thecavities with full 3D unsteadyCFD but this is
very computationally intensive.In an attemptto overcome hecomputing time problem a 2D
axisymmctric steadyflow modelling techniquehasbeendevelopedand this method will be
discussedn detail in the chapters o follow. The modelling will need o capture he flow physics,
especiallythe interactionof theaxial througliflow with thecavity flow.
146

7/28/2019 Chew Packwood N Turner
http://slidepdf.com/reader/full/chew-packwood-n-turner 169/343
CHAPTER 7
STEADY FLOW 2-DINIENSIONALMODELLING METHODOLOGY
7.1 Introduction
In thischapter numericalmethodof modelling hecomplexunsteadyhree-dimensionallow
buoyancy ffectswithin a rotatingcavity with asimplesteadylow two-dimensionalxisymmctric
modelwill bepresented nddiscussed. sing heknowledge ainedromthepreviouswork onthe
numericalmodellingof buoyancylowswithin cncloscd avities,a simplesteadylow two-dimensional xisymmctricmodelhasbeendevelopedhatcanbeappliedwithin a conventional
CFDmodel or theseypesof geometries.hechapterwill dctailthedevelopmentf themethod,
followedbyadescriptionof howthemodelwill be inked o conventional FDusinga 'User
DefinedFunction'or UDFwithin theFluentCFDcomputing ode. 'lie UDFmodelwill thenbe
tested yapplication f themethodo an enclosedtationary avity."I'licchapterwill closewith the
method eingapplied o arotatingenclosedavity.Theresults rom heapplication f the
simplifiedCFDmodelwill becomparedo the estdata romtheKirkpatrick& Bohn's 1986]
experimentsor a stationary nclosed avityand romtheBohnct al's [1993,1994]experimentsor
a rotatingscaled avity.
7.2 A 2D Axisymmetric Alodel or the Buoyancy Effects In Rotating Cavity Flows.
A simpleaxisymmctric (or circumfcrcntially-avcragcd)approach o modelling buoyancy-drivcn
heattransfer n thecentrifugal force field bctwccnconcentricrotating cylindcrs has bccn
considered.With reference o Chapter2, the approachadopted s similar to the 'conduction layer
technique' that hasbeenusedby other workers to modelhigh Rayleighnumberfreeconvection
undergravity.
7be flow between wo co-axial, co-rotating. infinite cylindersat different uniform temperaturess
considered irst, and is illustrated in Figure7.1. Averagingover time, it is expected hat the flow
variableswill not vary with z or (D n the naturalcylindrical co-ordinatcsystem rOz). It is also
that the flow canbe treatedas a perturbationof solid body rotation (v. - f1r). From analogy with
147

7/28/2019 Chew Packwood N Turner
http://slidepdf.com/reader/full/chew-packwood-n-turner 170/343
turbulent iffusion,simpledimensional rguments.ndwith theconsideration f thestabilityof
rotatingcompressiblend nviscid luidsby EckhoffandStorcslcttcn1978,19801, hew 2000],
as eportedn Chaptcr2, section .6,postulatcdhat n the nterior low theheat lux (4) is given
(in termsof timeaveraged ariables) y the ollowingequation,
Figure 7.1 Illustration or tije simplified model.
d7* dT-A Rai*T-kT (7.1)
rrr
where he local Rayleighnumber'Rai s defincdas ollows
Ra,= Prp2
V.2V
Max[(! ",)2
_rdp,
O
JUr2cp dr
(7.2)
I lere A andn arenon-dimcnsionalconstants,L is thercprcscntativc engthscale and,p.. U.Pr
(-PcWk), v., C.. T.k andc denote he fluid density,viscosity, Prandtlnumber,swirl velocity,
specific heatat constantpressure,static temperature,hermalconductivity and the speedof sound,
respectively.In the low Mach numberlimit this modelwill promoteheattransrcr if the radial
temperaturegradient is positive. Eckhoff andStorcslcttcn'sstability criteria supporttheuse of the
term in brackets ] in Equation7.2 beingnegative, f the rotating flow is stable andpositive if the
flow is unstable.The stability criterion tcrin maybedcrivcd asdescribedbelow;
148

7/28/2019 Chew Packwood N Turner
http://slidepdf.com/reader/full/chew-packwood-n-turner 171/343
Assuming forcedvortexwith tangential elocityv., theradialequilibriumequations,
dpp
v.dr r
andfor iscntropic flow of a pcrfcct gas,
p= npr
whcrcn is a constant.Diffcrentiating Equation7.4 w.r. . r,
dp= nypy-1
dp
dr Tr
substitutingntoEquation .3,V2
ypF. 3
._rr
With thespccdof sound,
Fira
andusingequations .4and7.7 n Equation .6.
r dp
cdr
(
(7.3)
(7.4)
(7.5)
(7.6)
(7.7)
(7.8)
If it isassumedhat he"iscntropic orcedvortex" s ust stable,t followsfrom Equation .8, he
flow is stablef,
r dp
p dr(7.9)
Using theanalogy with turbulentmixing (Chcw 20001, he tangentialcomponentof the momentum
conservationequation n the axisymmctric model is modified by theaddition of the following term.
d ARa,p[r
ýv ARI*U.
L_ vd(ALaL,, )
7 -( Pr dr Pr rir' Pr r1 rdr p(7.10)
Note hat heaboveerm szero n thecaseof a forcedvortex v cc ). It isalsoassumedhataway
fromthewallsthecontribution f conventionalhermal onductiono theheat ransfcrsnegligible.
T`hcnheradialheat lux in thecentral core"of the low isgivenby:
149
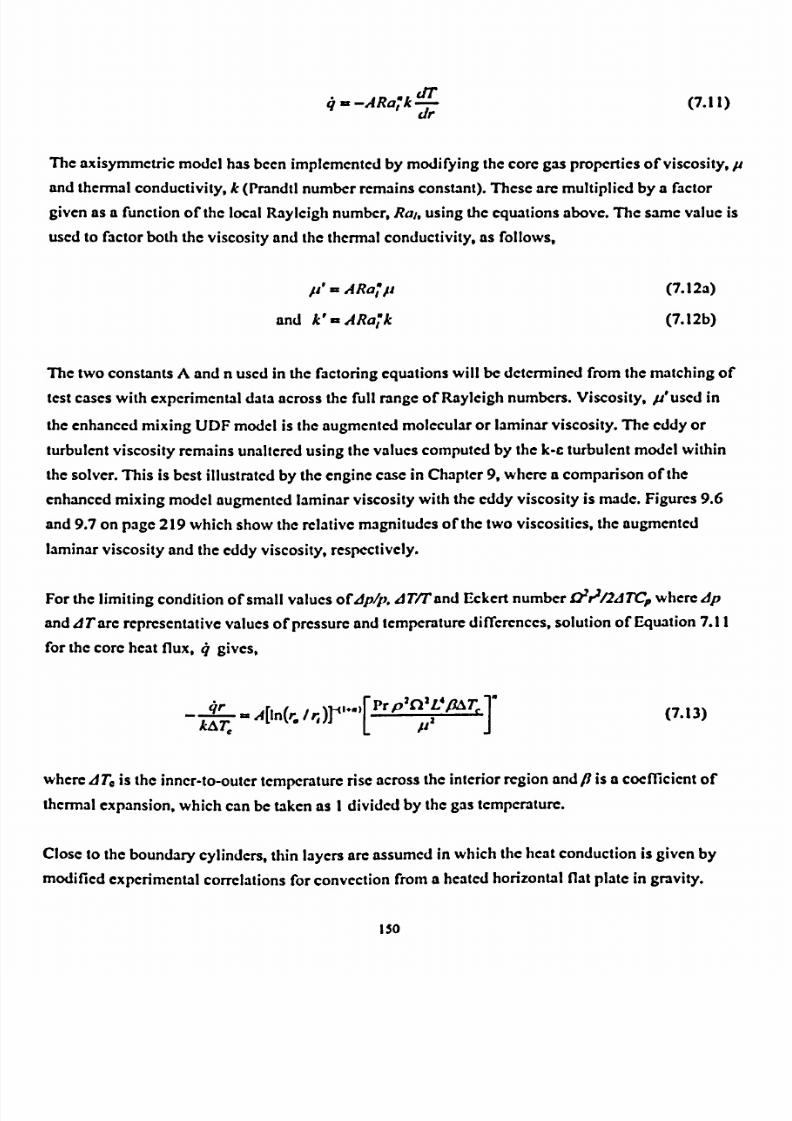
7/28/2019 Chew Packwood N Turner
http://slidepdf.com/reader/full/chew-packwood-n-turner 172/343
-AR IdT
(7.11)Tr
The axisymmctric model hasbeen mplementedby modifying thecore gaspropertiesof viscosity,ju
andthermalconductivity, k (Prandtlnumber remainsconstint). Thesearc multiplied by a factor
given as a function of the local Rayleighnumber,Rai, using thecquations above.The samevalue is
used o factor both the viscosity andthe thermalconductivity, as follows,
p' - ARa, jj (7.12a)
and V-Aft, "k (7.12b)
The two constantsA andn used n the factoring equationswill be determined rom the matchingof
testcaseswith experimentaldataacross he full rangeof Rayleighnumbers.Viscosity. P'uscd in
theenhancedmixing UDF model is the augmentedmolecularor laminar viscosity. The eddy or
turbulentviscosity remains unalteredusing the valuescomputedby the k-c turbulent model within
thesolver.This is best illustratedby theenginecase n Chapter9, where a comparisonof the
enhancedmixing model augmentedaminar viscosity with the eddyviscosity is made.Figures 9.6
and9.7 on page219 which show the relative magnitudesof the two viscosities,the augmented
laminarviscosity andthe eddy viscosity, respectively.
For the limiting condition of small valuesordp/v,. J77Tand EckertnumberOV111TC.. wheredp
and,dTarc rcprcscntativcvaluesof pressureandtemperaturedifferences,solution of Equation7.11
for thecore heat flux, 4 gives,
qr Prp fl'VPAT,! A-T,
= A[In(r, /r)rIPI I"
(7.13)
whcre, T, is the nncr-to-outcremperatureiseacrosshe nterior egionandP isa coefficicntof
thcnnalexpansion, hichcan
be akenas
I dividedby thegas emperature.
Close o theboundarycylinders,hin layersarcassumedn which he icatconductionsgivenby
modifiedexperimentalorrelationsor convectionromaheated orizontal latplate n gravity.
150

7/28/2019 Chew Packwood N Turner
http://slidepdf.com/reader/full/chew-packwood-n-turner 173/343
I JereheFishendcnandSaunders19501orrelations rc adiptcd o includecentrifugalacceleration
ratherhangravity,
A-0.54Ra 0.25 for 105 Ra< 2407 (7.14a)
N4=
0.14RaO.33 for 2407 < Ra< M010 (7.14b)
whereheNusseltnumbcrNu L41(kV) and heRayleighnumberRa- PrS22rp2,8,TL! 1p'
andL,.dT.Pr,fi (- Mi. ) dcnoterepresentativeengthscales,luid to wall temperatureifference,
Prandtl umberandcoefficientof thermalexpansion,espectively. ,,. is thegas emperaturet the
edgeof the ayer.Choiceof therepresentativeengthscale, issomewhat rbitrary,as hefree
convectionorrelationsbased n experimental onfigurationsuitedifferent romthatconsidered
here.Fora finitecavitythehalfcavitywidthwouldbeareasonablehoice. Note hat he
characteristicengthscale, will cancclout if the low is in thehighRanumber ange.
Themodeldescribed bove or theclosedannulus asbeenextendedndapplied o thecaseorco-
rotatingdisccavitieswith axial hroughnow.n these asesheRayleighnumberwill besmallor
zero n theaxialthrougliflow egionandsotheCFDmodelwill revert oconventional
axisymnictricmodel.Equation .14bhasbeen etainedor theshroud onvective eat ransfer.
Conventional FD hasbeenusedn thenear-wall egionondiediscs.Thecorrelationor turbulent
natural onvectionromahorizontalplatehasbeenusedn thesimpleaxisymmctricmodel o
produceheheat ransferonthedisccavityshroud. "hishorizontal latecorrelation roduces heat
transfer,which sgreaterhan heheat ransferproduced y theBolinct al. [ 1993,1994)adialheat
transfer orrelation. lowcvcr,aswill beenseenn Chapter ,whencomparcdo theheat ransfer
calculatedor theSussexMCR Build 2 cavity3 experimentalata henaturalconvectionroma
horizontalplatecorrelationemainsow.
Implementationof themodel n theFLUENTCFDcodewasundertaken.oreachpointonthewall
anair temperature asestimatednternallywithin theCFDcalculation. hiswasdoneby
associatingurface ointswith internalmeshpointsaspccificddistance way romthewall. Using
thisvalueof air temperature,nd he ocalwall temperaturend luid properties quation .14bwas
appliedo estimatehefreeconvection cat ransfer.4,' say.Thefollowingcquationswere hen
usedo estimateheadditionalheat lux, 4. say,due o buoyancy ffects.
dT-, IRa,k Y- in the low 'core' (7.15a)
rr
r4, r. q,, in thencar-wall egion (7.15b)
151

7/28/2019 Chew Packwood N Turner
http://slidepdf.com/reader/full/chew-packwood-n-turner 174/343
Aftereachupdateof the emperatureicid in theCFDsolutiondieadditionalheat lux termwas
estimatedccordingo thefollowingalgorithm,
1. For each wall point rind an appropriate 'free strcam' air temperatureand thcrtnal laycr
thickness.
2. For each wall point calculate 4., using appropriateheattmnsrercorrelations.
3. Associate each interior calculation point with the 'nearest' wall point and use the
appropriate value of thermal layer thicknessto dctcnninc whether or not the interior point
lics in the ncar-wall region.
4. For each interior point calculate 4. from the equationsgiven above using the appropriate
value of4,,.
Thisalgorithmwas ncorporated ithin the terativeCFDsolutionandextendedo include he
effectsof extramixing in themomentumonservationquations. orconditionsn which he ree
convection eat ransfers relativelysmall hesemodifications houldhave ittle effecton theCFD
solution.
7.3A Numerical2D Modelof the BuoyancyEffects n aStationaryCubeEnclosedCavity.
An initial 2D CFDmodelwasusedocheck hatmodifying hefluid propertieswithina stationary
enclosedavity wouldproduce constantemperatureore,with therequiredheat low through he
cavity.A 2D CFDmodelof Kirkpatrick& Bohn's 1986]experimentor astationary nclosed
cavitywasused.The I IC case,witha temperatureifference f 30K wasconsideredirst. Thewall
temperaturet thebottomof thecavity wassetat330Kwhilst thewall temperaturet the opof the
cavitywassetat300K.The woverticalsidcwallswereassumedobeadiabatic.Forthe
temperatureifferenceof 30KtheRayleighnumber,Ra s 1.75x 010.s with theCFDsimulations
discussedearlier n Chapter waterwasusedas he luid andgravitywasassumedoact n a
downwards irection.ThreeCFDcalculations ereperformed sing heFLUENTsegregated
solver.The first assumed teadyaminar low and hesecond ssumednsteadyaminar low; both
of these nalyses sedheconventional FDapproach. he hirdanalysis ssumedteadyamiaar
flow butwith thefluid propertiesmodificd.Similar o the3D analyses, 100by 100-squarcd esh
withacell spacing xpansionatioof 1.1wasemployedor all threeorthcscanalyses.
152
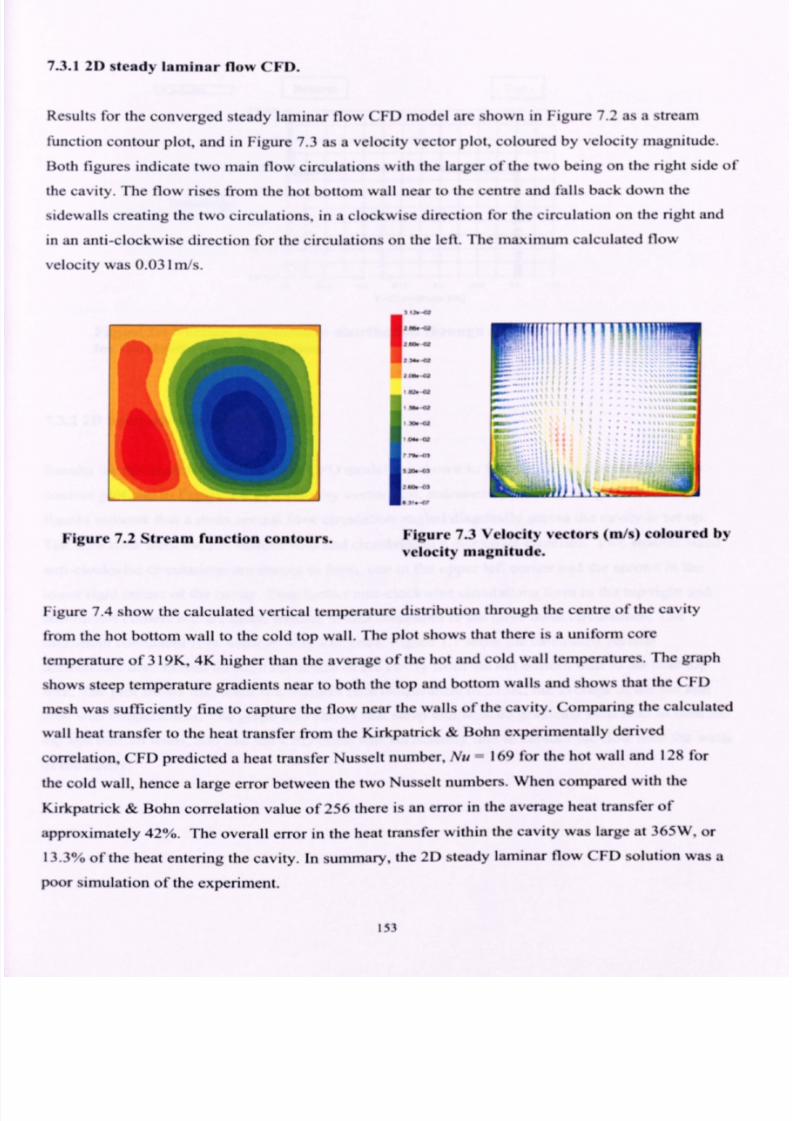
7/28/2019 Chew Packwood N Turner
http://slidepdf.com/reader/full/chew-packwood-n-turner 175/343
7.3.1 21) steady laminar flow CH).
Results 11orhe converged steady larninar flow CFD model are shown in Figure 7.2 as a stream
I*unctioncontour plot, and in Figurc 7.3 as a velocity vector plot. coloured by velocity magnitude.
Both figures indicate two main flow circulations with the larger ol'the two being on the right side of'
the cavity. The flow rises Froin the hot bottom wall near to the centrc and Calls back down the
sidcwalls creating the two circulations. In I clockwise direction flor the circulation on the right and
in an anti-clockwisc direction lor the circulations on the lef). The maximum calculated flow
velocity was 0.03 1ni/s.
Figure 7.2 Stream function contours.
w
Ib 41
0
" 00. U
tn (11n (11
i
flTJl1
:1,.,.,..
aa
It I, ...,,.
__
jFigure 7.3 Velocity vectors (m/s) coloured by
velocity magnitude.
Figure 7.4 show the calculated vertical temperature distribution through the ccntre of the cavity
from the hot bottom wall to the cold top wall. The plot shows that there is a uniform corc
temperature of3 19K, 4K higher than the average ofthc hot and cold wall 1cmpcraturcs. The graph
shows steep temperature gradients near to both the top and bottom walls and shows that the CFD
mesh was sufficiently fine to capturc the flow near the walls ofthc cavity. Comparing the calculated
wall heat transt'er to the heat transfer from the Kirkpatrick & Bohn experimentally derived
correlation, CFD predicted a heat transfer Nussclt number, Nu 169 for the hot wall and 128 for
the cold wall, hence a large error between the two Nussclt number%.When compared with the
Kirkpatrick & Bohn correlation value of 256 there is an error in the average heat transfer of
approximately 42%. The overall error in the heat transt'er within the cavity was large at 365W. or
13.3% ofthe heat entering the cavity. In summary, the 21) stcady laminar flow CFD solution was a
poor simulation of the experiment.
153
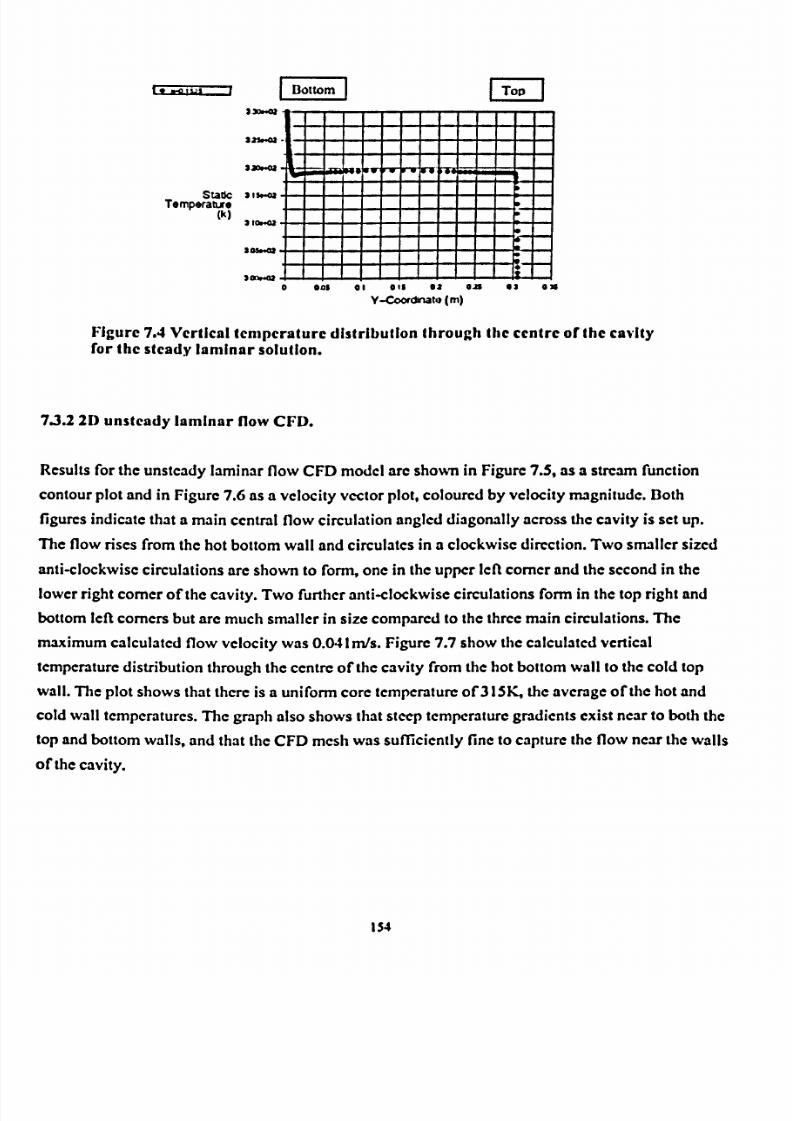
7/28/2019 Chew Packwood N Turner
http://slidepdf.com/reader/full/chew-packwood-n-turner 176/343
_________ Bottom Tot
330"Q
325042-
3JO"W
Static 315"aTompooraue
(k)310&42
303*-W
ODR-0
0 on$
Ifv -+; i-
01 018 ei onY-Co«Mate m)
I
T-16
.
-4-3 036
Figure 7.4 Vertical tenipcraturc distribution through the centre of the cavityfor the steady laminar solution.
7.3.2 2D unsteady lsminarnowCFD.
Results or the unsteady aminar flow CFD modelarc shown in Figure 7.5, as a strcarn unction
contourplot and in Figure 7.6 as a velocity vector plot, colourcd by velocity magnitude.Both
figures ndicate that a main central flow circulation angleddiagonallyacross hecavity is set up.
The flow risesfrom the hot bottom wall andcirculates n a clockwise direction. Two smaller sized
anti-clockwisc circulations arc shownto form, onein theupper lcft comer andthesecond n the
lower right comer of thecavity. Two further anti-clockwisc circulations form in the top right and
bottom left comcrs but arc much smaller in sizecompared o the threemain circulations.The
maximumcalculatedflowvelocity was
0.041nits.
Figure7.7 showthecalculated vertical
temperaturedistribution through the ccntrc of thecavity rrom thehot bottom wall to thecold top
wall. The plot shows hat there s a uniform core temperatureof 315K. the averageof thehot and
cold wall temperatures.The graph also showsthat steep emperaturegradientsexist near o both the
top andbottom walls, andthat theCFD mcshwassufficicritly fine to capture he flow nearthewalls
of thecavity.
154

7/28/2019 Chew Packwood N Turner
http://slidepdf.com/reader/full/chew-packwood-n-turner 177/343
I. . Aw
M. -W
26"-w
0
Ob Al
Figure 7.5 Stream function contours. Figure 7.6 Velocih %ectors (m/s) coloured bv
%,locit% magnitude.
IW-Ll
StatlcTomporaturt,
(k)
3 20W)2
31().. Oj
3-4.
30s.. 432
3 GD. W
' 'E EEHH-i-± . p. 4 . "
ft ft ;i 0030t 013 02 olm
Y-<-ný'r, imtA (m)11
Figure 7.7 Vertical temperature distribution through the centre of the cavityfor the unsteady larninar solution.
Comparing the calculated wall heat transfer to the heat transfer 1rom the Kirkpatrick & Bohn
experimentally derived correlation, the tune-averaged heat transfer Nusselt numbers were Nu-
193
flor the hot wall and 198 flor the cold wall compared to 256 calculated 1rom the correlation giving an
average heat Iranst'er error ofapproxiniately 24"/o. It is ol'interest to note that this is a much larger
error than that produced by the equivalent 31) CFD discussed earlier in Chapter 3. The overall error
in the heat transfer within the cavity was 43AW. or 2.5% ofthe heat entering the cavity. III
summarythe
unsteadylaminar flow CFD
matchesthe
experimental results muchbetter than the
steady laminar flow CFD. However neither CI-D models produced a flow field where the flow
circulates around a central core which was shown to happen with the 31) CFD models in Chapter 3.
". 411
._ 4"
155

7/28/2019 Chew Packwood N Turner
http://slidepdf.com/reader/full/chew-packwood-n-turner 178/343
7.3.3 21) unsteady laminar flo%scFD %sith modified fluid properties.
In anattempt o achievea cavity flow field havinga centralcore the fluld propertieshadto be
modified to give enhancednixing within thecavity. Both theviscosity and thernial conductivity
were ncreasedin proportion to each other.The specific heatcapacityremained it the normal value.
allowing the Prandtlnumberto remain thesarne.The I'linctions (I -cos jYc/2*d,/j) and(I -co.
[x/2*d, //]) were usedto increase fie value of'the two fluid properties rorn a defined minimum
value on thewails to a defined maxinium valuemoving over a setdistance1'romeach ol'the walls.
The cosine unction waschosen o allow a smoothchange n fluid propertiesacross he layer. The
'boundary layer type distance' wasset as I Wo of* hecaviiy wall si/e. giving / 0.0305m.The same
mininiurn and maximum factorsIm both viscosity and thernial conductivity weresetas5.5 and240
respectively.To enable he useol'the enhanced luid propertieswithin the FLUENT solvera User
Defined Functionor UDF was written in the programming anguageC' and incorporatedand
'hooked' to the solver. Figures7.8 and 7.9 show graphically by contour plot how viscosity and
therinal conductivity fluid propertieswere modified in theCIA) model.Figure 7.9 shows he fluld
viscosity on a line drawn through thecentre ofthe cavity and Figure 7.9showsa contour plot of'
therinal conductivity within thecavity. Apart I,om the changesmade o the fluid properties
conventionalCFD was used n the flow analysis.
III. 1!s. I!
Figure 7.8 Enhanced mixing fluid
viscosity distribution.
IIL, I.
m1 11
Figure 7.9 Enhanced mixing fluid
thermal conducthift confours.
Resu s for the unsteady laminar flow 11joijel"it lit lie UDF enhanced inixing are shown in
Figure 7.10 as a stream flinction contour plot, and in Figure 7.11 as a velocity vector plot. coloured
by velocity magnitude. Both figures indicate that a main central flow circulation angled slightly
156

7/28/2019 Chew Packwood N Turner
http://slidepdf.com/reader/full/chew-packwood-n-turner 179/343
across the cavity is set tip. The flow rises From the hot bolloin wall and circulatcs in a clockwise
direction. Four small anti-clockwise circulationsare shown it) form in each comer ol'the cavity,
with the Lipper lcI't and lower right circulations being stronger than the two circulations forined in
the other two corners. The inaxiinum calculated flow velocity was 0.02 1ni/s near to each of'the
Iddex%lls.
W. -W
I Ilk -02
1 31b-02
12t. -W
864-43
G$4-03
04. -,u
% I.J. (13
1ý ol
Figure 7.10 Stream function conlours. Figure 7.11 Velocity vectors (m/s) coloured by
velocity magni(tide.
Figure 7.12 shows the calculated vertical temperature distribution through the centre ol'the cavity
from the hot bottom wall to the cold lop wall. The plot shows that there is a unillorin core
temperature of'3 15K. the average ofthe hot and cold wall temperatures. The graph also shows that
temperature gradients exist near to both the top and bottom walls over the width ol'thc enhanced
fluid property boundary layer thickness.
I_. _. __. II
3
3
3
stancsTemperature
M
I
3
2SIX-1.
aaoo&.02
005 01 ols02 023
y ., q, 10' at.. ((IIý
0, Oil
Figure 7.12 Vertical temperature distribution through the centre of the cavit)
for the unsteady laininar flow with modified fluid properties.
jor. 4W
I10-W
Iu-02
157

7/28/2019 Chew Packwood N Turner
http://slidepdf.com/reader/full/chew-packwood-n-turner 180/343
Theoverallerror n theheat ransferbalance or thecavity wasonly 3.OW,or0.1%or thehcat
enteringhecavity. lowcvcrwhencomparinghecalculatedwall hcat ransrcro theheat ransfer
from heKirkpatrick& Bohnexperimentallyerivedcorrelationheresultswerenot so good.CFD
predicted heat ransferNusscltnumber,Aru 74 for both hehotandcold walls comparedo 256
calculatedromthecorrelationgiving an errorof approximately 1%.This sagaina much arger
error han hatproduced y theequivalent D CFD.In conclusion,heunsteadyaminar low CFD
withenhanced ixingin thecavitymatchesheexperimentalesultsmuchbetter n obtaininga
uniform emperatureentralcorewith flow circulatingaroundhiscorebut heheat ransrcrs much
too owcomparedo theexperimentalalue.
7.4A Numerical2DAxisymmetricModelof the BuoyancyEffects n it Rotating Scaled
Cavity.
In this sectionan evaluationof theenhancedmixing model is presented.The method s applied to a
rotatingenclosedcavity and results from the2D axisymnictric CFD modelare comparedwith the
resultsfrom Bohn ct al. s (1993,1994] experiments.Rotatingcavity Configuration A (seeFigure
2.2) has beenusedfor this CFD simulation. The 2D axisymnictric model wasused o check that
modifying the fluid propertieswithin a rotating cncloscdcavity would producea constant
temperature ore,with the requiredheat flow through the cavity. The cavity was setto rotateat a
speedof 2000 rpm (209.4rad/s).For a temperaturedifferencebetweendie outer and inner
cylindrical surfaceof 30K the Rayleigh number,M4 was4.255x 1010 nd rotational Reynolds
number,Re.,was7.915x101.As with theCFD simulationsof Bohn et al. s experimentdiscussed
earlier in Chapter4, air was used asthe fluid. CFD calculationswere performed using the FLUENT
segregated olverassumingsteady urbulent flow. The standardk-c and2-laycr k-c /W nearwallturbulencemodelswere used.Similar to the3D analyses,a 100x 100meshwith a cell spacing
expansion atio of 1.1wasemployedfor theanalysis.From a convergedsolution using the
conventionalCFD approach heenhancedmixing model implementedusing a FLUENT UDF, was
appliedanda convergedCFD solution for the rotating encloscdcavity with enhancedmixing in the
corewasobtained.
158

7/28/2019 Chew Packwood N Turner
http://slidepdf.com/reader/full/chew-packwood-n-turner 181/343
Usingthe Bohnct al. s heattransfercorrelation for the Configuration A,
for the innerandouter radius walls, Nu, =0.246Ra0.221
Therefore or AT - 30K and a Ra+- 4.255x 10109 uk - 65.21
1
Theexpectedheatflux, 4 through the inner andouter walls are given by,
kFor he nnerwall, q, = Nu* T.
-T,I
Andfor theoutcrwall, 40=k ---NU61T.-Til
r. Inr.Ir, )
(7. 6)
(7.17)
(7.18)
where he fluid thmnal conductivity, k- 0.0242 wm*IK7', cavity inner radius, ri-0.125m and
outerradius,r. - 0.355m, T. and T,aretheouter and inner wall temperaturesespectively.
Evaluating he heatflux for the conditionsconsideredyields inner wall andoutcr wall heatfluxes or
41- 362.85W/m2and 4. - 127.77W/M2respectively.
*Tbencarwall factorf isderivcdas ollows,
Theheat lux at thewall,4. isgivenby, 4W-A
(T. T1.11r) (7.19)
n"P
whereTArirps the fluid temperaturenearto thewall (CFD cclI ccntrcd temperaturen the I" ccll
next to thewall) andnN; 'Ps thedistanceof temperatureposition away from thewall.
NowPfp
Pr- -kp .,.kom
Ucp
Pt(7.20)
cc od ihere V and p' are the modificd thermalconductivity and viscosity rcsP tively. For the m ircd
viscosity near o the wall, p'= fp but now allowing f to vary locally along thewall and
substitutingEquation7.20 into Equation7.19;
filco (T.- TV"
P (7.21)Pr nx, p
where 4c.,j
is the heat flux from the appropriateBohn ct al. s experimentcorrelation.
So for theenhancedmixing model the nearwall multiplication factor. is given by,
159

7/28/2019 Chew Packwood N Turner
http://slidepdf.com/reader/full/chew-packwood-n-turner 182/343
Pr n"vxpromEquation7.21,pcp (T.
- TAN.P)
(7.22)
So or theouterwall, 5279.73 n,..,. (7.23)(T.-
andfor the inner wall, 14994.45 it (7.24)(T.
- TAO.,.
Equations7.23and7.24 werecoded nto the UDF to calculatetile local nearwall factors, . andf,
along heouterand inner walls. The mean nearwall factorfwas calculatedrrom the local factors
along heouterand inner walls. The core factor, K wasassumed o havea rlxcd valueor4300. A
seriesof CFD calculationswere thenperformedfor various inner andouter walls, andsidcwall
layerthicknesses.The CFD calculatedheattransferwascompared o Bolin ct al. s experimental
data o obtain the 'best' CFD model.The bestCFD resultswere obtained with the inner andouter
wall constantboundary ayer thicknessset at 0.002mand thicknessesof 0.005m for the sidCwalls.
In this CFD model the fluid propertieswereonly modified in the inner and outer wall boundary
cellsandno nearwall, f factor was appliedto the sidcwallsallowing conventionalCFD calculations
to beapplied in the0.005mboundary ayer regionson the sidewalls.The functions(I -cos[x/2*d,,n)
and(1-cos[x/2*d/n) were used o derinethe increasen tile fluid properties of thermalconductivity
andviscositymoving away from each wall. The increasen fluid propertiesover the nearwall
boundary ayer thickness, was setequal to 10%of thecavity width (0.12m), I-0.0 12m.
Resultsor thesteadyurbulent low rotatingannulus avityCFDmodel Config.A case)with tile
enhanced ixingarcshownn Figures .13 o7.16.7lic streamlinesn Figure7.13showweak low
in the nteriorwithstrongermotionnear
hewalls
n theregionswhere
heresno enhanced ixing.Theswirl velocitycontourplot,Figure7.14showshat heCFDmodeldoesproducehecxpectcd
solidbodyrotationn thecavity.Themixingfactordistributionn Figure7.15confirms ile
successfulmplementationof themethod howinghat henon-dampedcar-wall egionsmerging
smoothlywith theenhancedmixing region n thecore.Figure7.16showsdiecalculatedadial
temperatureistributionhrough heccntrcof thecavity.Theplot showshat heCFDmodel
Producesuniform emperatureentralcorewith a core emperaturef 317.5K. llic graphalso
showshat emperatureradients xist near o the nnerandouter adiuswalls over hewidth(0-002m)of theenhancedluid propertyboundaryayer hickness.
160
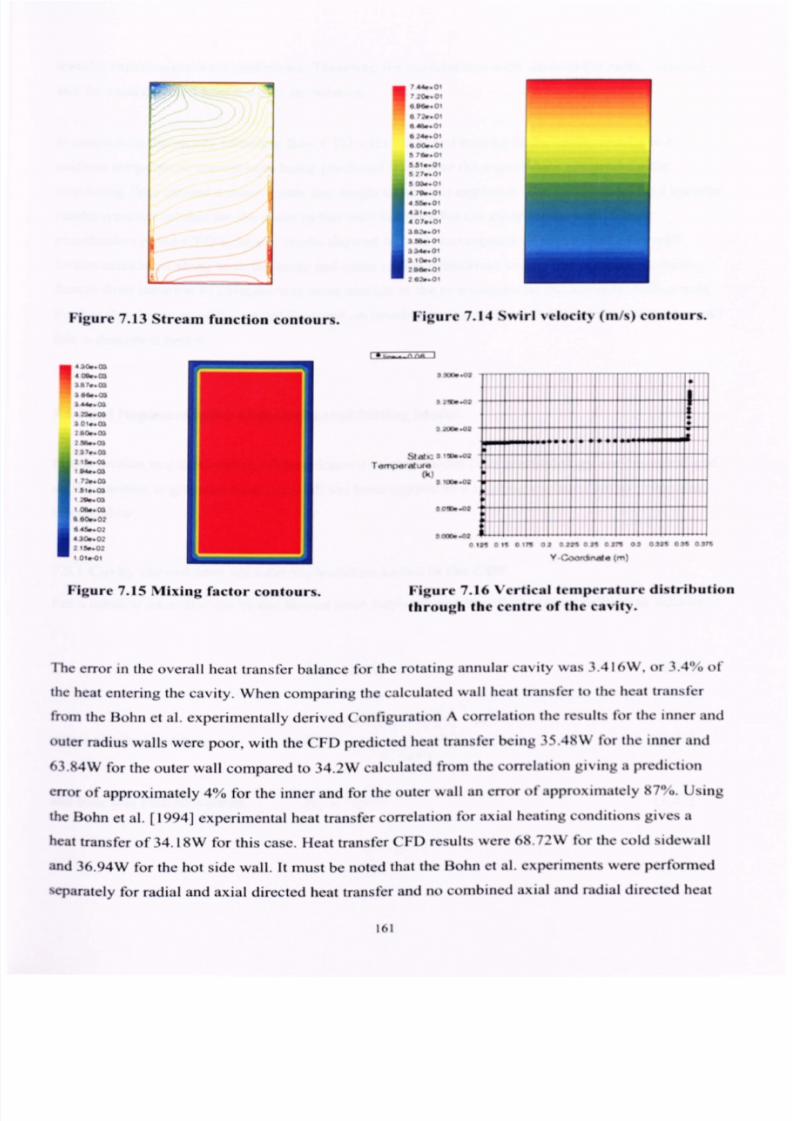
7/28/2019 Chew Packwood N Turner
http://slidepdf.com/reader/full/chew-packwood-n-turner 183/343
L-1
Figure 7.13 Stream function contours.
: 40. m
Oeb: 0
lb7. OJ
elw. ua
301.. 03
2, b. 04
104-03
a00.. O.,
446.0.,
1. QI
Figure 7.15 Mixing factor contours.
,.0
$0. . 0:
qbalw. 0:
0 24.. o
4 00-01
lop. 01
.?.0
Da.: 0
..: W
. 31.0
4 02. . 01
3 4.1.: 01
3 u. W
3 34. . 01
Figure 7.14 SAirl %el(wil% m/%)conlotim
AI
¶2. ¶' P 'M -P- C1 P tfl PUP
V
Figure 7.16 Vertical temperature dioribulion
through the centre of the ca, t%.
Hie error in the overall heat transt'er balance for the rotating annular ca%ty %kas .4 1 AV. or 3.4",, of'
the heat entering the cavity. When comparing the calculated wall heat transfIer it) the heat transfer
from the Bohn et al. experinien(ally derived Configuration A correlation the results for the inner and
outer radius walls were poor, with the CFD predicted heat transfer Ix-Ing 35.48W for the inner and
63.M4W for the outer wall compared to 34.2W calculated from the correlation giving a prediction
error ol'approximately 4(1/,(, fior the inner and for the outer wall an error ol'approximately M7"o. Using
the Bohn et al. [ 19941experimental heat transfer correlation for axial heamig conditions gives a
hcat transfer of 34.18W for this case. I ]eat transfer CFD results were 69.72W for the cold sidewall
and 36.94W for the hot side wall. It must be noted that the Bohn et al. experiments were perflornied
%eparately or radial and axial directed heat transfer and no combined axial and radial directed heat
Ifil

7/28/2019 Chew Packwood N Turner
http://slidepdf.com/reader/full/chew-packwood-n-turner 184/343
transferxperiments ereperformed. herefore lic correlationswerederived or radialdirected
and oraxialdirectedheat ransfern isolation.
Inconclusionhesteadyurbulent low CFDwith enhancedmixing in thecavityresultsn a
uniformemperatureentralcorebeingproduced. owever hemodeldoesnot producehe
circulatinglow arounda centralcore hatmighthavebeenexpected.1c CFDmodelheat ransfer
resultswereacceptable or the inner radius wall but poor for the outer radius wall. Closer
examinationof the CFD solution results showed ack of convergenceof some ocal nearwall
factorscalculatedalong both the inner and outer radiuscylindrical walls. The variation in these
factors rom iteration to iteration was most notable n the two comerson thehot outer radiuswall.
Furtherdevelopmentof the model focussedon rotatingcavity with axial throughflow testcasesand
this isdescribedbelow.
7.5 Final Implementation of the Enhanced Mixing Model.
In thissectionmplementationof theenhanced ixingmodelUDFmethodology redescribednd
anexplanationsgivenonhowtheUDFhasbeenappliedo a rotatingcncloscd avity with axial
throughflow.
7.5.1Cavity shroud heat transfer formulation coded In the UDF
Fora rotating intcr-disc cavity theshroud ocal Rayleighnumber,Ra has bccn definedas follows,
Ra= Gr Pr6 (7.25)
whereGrashofnumber, Gr =
andbaseinePranddnumber,
r.(T.
- To1
,, 2 2(.YP3
Pfl, = I'S'.ka
(7.26)
(7.27)
162

7/28/2019 Chew Packwood N Turner
http://slidepdf.com/reader/full/chew-packwood-n-turner 185/343
I erer. is thecavityshroudadius m),s is thecavitywidth,T. is the ocalshroudwall temperature
(K), 0 is the otorspeedrad/s),T,,s thegas emperatureK) at a positionn theccntrcof the
cavityat85%of thecavityouter adius.Viscosity,4 and hcrrnalconductivity. barc hebase ine
valuesetby theuser n a FLUENT nputpanel.
Thestandardeat ransfer orrelationornaturalconvectionromahorizontalplateassuming
turbulentlowwasused o obtain he ocal heat ransfer long hecavity shroud.
Nu,,,j w0.14Ra*-Jjj (7.15b)
giving a local hcat flux,Nu,.,
jks (T.
- T,(7.28)
V2)
Now usingEquation7.21,the local near wall factorf is given by,
ßäCP(T. - TXWp1
7.5.2Cavitycoreenhancedmixing model ormulationcoded n the UDF
(7.29)
ToobtainheK multiplying actor or thecnhanccdmixingcore,Equation .2for the ocal
Rayleighnumber,RaiandEquation7.11 or theheat lux havebeen odedntotheUDF-
7be ocalRat sgivenby,
where
Ra, Pr,Ra,Raj
Pr,Acp
k,
Ra, p,2 Or,+ 14,1)2ý1, 'r
2dp
Ra, At !L
p dr)
(7.30)
(7.31)
(7.32)
(7.33)
+ W,w 13
whcrc Atli (7.34)-41-.4R-T,
163

7/28/2019 Chew Packwood N Turner
http://slidepdf.com/reader/full/chew-packwood-n-turner 186/343
L=r, - Rsw (7.35)
RAO m) is the outer radius of thecentral shaft forming the inner radial dimensionof the cavity.
R,,44 is specifiedby the user within theUDF. The local fluid viscosity. lit and thermalconductivity,
kiwithin thecore,uses he modificd valuesat eachcomputational teration. 71c local radial cell
Centre osition is r, (m).Thc local fluid relative circumfcrcnti3l velocity is is-1.he characteristic
Icngth,L used n the local Raj number s given by, rrRW and wasdetermined hroughCFD trials
using heUDF. Stability of the CFD computationwasbestachievedwith this definition of tile
charactcristicength. From the Eckhoff andStorcslcttcn(1978,19801stability criterion, Equ3tion
7.9, f Ra2< 0, Ra2 s setto 0 and conventionalCFD is usedwith no enhancedmixing taking place
in that ocation.
Duringengine ccelerationandatsteady tateconditions)hecompressoriscand heshroud
MCMIemperaturesrcgreaterhan hecavity air temperaturend hedisctemperaturencreases
withradius. herateof change f densitywith respecto radius,dp1dr n thecavity will beexpected
tobenegative nd o strengthen ith increasen radius. Icnce he ocalRayleighnumberRa)wil I
increasewith radius.At low radii, whereheaxialthroughflowoccurs,heN13chumberwill be
smallanddpldrwill besmallor maybepositive.n thisregion heRayleighnumberendso zero
Ra: sset ozeroandconventionalCFD sused.This salso ypicallythecaseduringan engine
deceleration.
Thecoremultiplying factor,K wasdefincd as,
Ka ARaj" (736)
This s in thestandardunctionalormexpectedornatural onvection eat ransrcr.ValuesofAandn werevaried o producehenecessarynhanced ixingwithin thecavitycore. n tilenext
ch3ptcr,Ch3ptcr8,valuesof A andn havebeendeterminedhroughCFDtrials.CFDcalculations
werepcrronnedo simulateheflow andheat ransferor theSussexUTCMultipleCavity Rig
build2(MCRD2)experimentsLonget al.2006b].The ntention romthese imulationswas o
obtainagoodagreement ith theexperimentsnd o rindthevaluesof A andn thatwouldproduce
agood it toexperimentalataover hefull rangeof buoyancy onditions. aluesor.4 andn are
hardcodedntotheUDF.Thefunction, - cos[(,/2)(5/1)]wasusedodefine hechangen fluid
Propertiesncreasingaway romthewall.The hickness f this ayer.MAYER. issetwithin the
UDF-Withinthis ayera second onstant ropertyayer s formulated ext o thewall.The
164

7/28/2019 Chew Packwood N Turner
http://slidepdf.com/reader/full/chew-packwood-n-turner 187/343
thicknessf thissecondayer,Dlq)-Con,s alsohardcodedntotheUDF- n thisconstant roperty
layerconventional FDcalculations reperformed ndnoenhancedmixingtakesplace. lowcvcr
inthecavityshroudwall regionenhanced ixingisassumed ith theaverage earwall factor,
I fortheshroudwall used o factor hefluid properties f viscosityand hermal onductivityover
theDIa)-Conayerregion.To estimatehe hickness f theconstant ropertyayerextending way
from hewall, the urbulent low EkmanboundaryayerequationOwenandRogers19951or
rotating avity lowswasused,
0.098A(flr- w)ý'(, r)06 Re.r I' fir
whereRaos therotationalReynolds umber.
(7.37)
FortheSussexMCRB2 experiments he Ekmanboundary13ycr hicknesswithin the rotating
cavitieswascalculatedasapproximately0.002mand wasapplied to theCFD COMPUtAtionsetting
theDIa)-Convaluewithin the UDF. Using the experience rom thepreviousCFD experiments he
DLAYER hicknesswasset to 0.005m.The full sh3pCunction equations o define the cnhanced
mixing corewhich is coded nto the UDF arc as follows,
Forviscosity, po-[f + factx(K -f
)Di# (7.38)
And for thermalconductivity, kP= [f + factr(K - f)ý'b (7.39)
whcre forJ< DL4YER (7.40)
factx -I for J.? I
factx coff (5
- DIqyCon)2
(DL4YER- Dla)Con)
J is thedistance m) of the fluid ccli ccntrc away from thenearestwall.
In summary heoverall cffcct of thenearwall factor. for thecavity shroudand for thecore
enhancedmixing factor,K arc shown in Figure 7.17 for the CFD simulation of two cavities from
theSussexMCRB2 cxpcrimcnt, in the form ora strcam unction plot. 77hesccsultsarediscussedn
Ch3pter8.
165

7/28/2019 Chew Packwood N Turner
http://slidepdf.com/reader/full/chew-packwood-n-turner 188/343
Thefinal versionol'the EnhancedMixing UDF hasa filenameof-comp enhanced mixing-c'. The
LAWwasprogrammedusing the computer languageC. Code listings ol'the UDFand the scheme
file 'wall viscosity.scni' are given in Appendix 4 andAppendix 5 respectively.
Shroud Mai Flux
Nall'oriv. 1fori/Illate
CorTel.,
Nu 0.14Ra""',
Chara. 1, gap 2.
,%I I, I.
I.
I Mass
Rcgsonof I'nharwcd
%ilung
Vn (A Ra" I %%A-I; (X)n 01 andRa fit (d; tit).( hara Ir
11'ressurv( )ullctl
Figure 7.17 Sussex UTC NICRI12 stream function conlour%.
7.6 V%er Cuide for the Enhanced Mixing Model UDF and the u%e Aithin the 21) Axlsýnimelric
CFD Model.
It is inirw1ant to note that the 21) axisymmetric CI- 1) model needs to be setup to use a rotating
rcfcrcnce frame. A simple user guide for the I-.nhanced Mixing Mmiel VDI- and the usc within the
21) axisymnietric CFD model is given in Appendix 6. The user guide gi%c% he order of'operations
lo scl up and run the CFD model with the enhanced mixing model (JDF.
166

7/28/2019 Chew Packwood N Turner
http://slidepdf.com/reader/full/chew-packwood-n-turner 189/343
7.7Conclusions.
In thischapterheenhancedmixingmodelmethodologypplied o thesteadylow 2Daxi.
symmetricCFDmodelhasbeenexplained.nitial testingof themodelwaspcrrormedor botha
stationarynclosedavityand or a rotatingsectorscaled avity.Thisshowedhat t wasrcasiblco
accountor themixingnot captured y a conventional DsteadyCFDsolutionshrough
modification f theviscouserms,and hat hencar-wall reatmentouldbemodified o use
empirical orrelationsn calculatingheheat ransrcrate.71c levelof themixingfactor hat s
requiredoobtainsatisfactorymixing n thecavitycoreand oproducehecorrectevelof licat
transferhroughhecavitywasestimated.
Themodelproposedobviously includesa numberof assumptionshat will limit its generality. It
wasthereforedecidedto concentrate urther developmentand evaluation on the most relevanttest
dataavailable.The implementationwas thereforecxtcndcd to cover rotating cavities with axial
throughflow. In thenext chapter, he enhancedmixing modelwill beapplied to enclosed otating
cavitieswith axial throughflow in the simulation of theSussexNICRB2experimentscovering a full
rangeof buoyancyconditions.
167
7/28/2019 Chew Packwood N Turner
http://slidepdf.com/reader/full/chew-packwood-n-turner 190/343
CHAPTER 8
2D AXISYNINIETRIC COMPUTATIONAL FLUID DYNAMICSSIMULATION OF THE
SUSSEX NIULTI-CAVITY RIG BUILD 2 WITII THE APPLICATION OF THE
ENHANCED MIXING MODEL
Summary
Asdiscussedn Chapter6 themultiplecavity rig at theUniversityof Susseximulateshe nternal
airsystem f aI ligh Pressure ompressorI [PC).11icaimof therig was oprovide estdata hat
canbeusedo improve hephysicalunderstandingf theflow andheat ransfermechanismsn the
I IPCrotating avities. n thischapterhe2DaxisymnictricCFDmodellingechnique sing ile
enhanced ixingmodel o increasehemixingin thecentralcoreof a rotatingenclosed avity s
appliedo theSussexMultipleCavity Rigbuild 2 (MCRB2).Thecomputations ereperformed
assumingteadylow and heresultshavebeen omparedwith theNICRB2 xperimental
measurementsor metal emperaturesndheat ransrcr. heseesultswerealsocomparedo results
froma3D LESCFDmodelof thesame avity.
Usingtheenhancedmixing model in theCFD simulationsof theSussexrig a good agreementwith
experimentalvaluesfor the cavity shroud surface icat transrerfor rotating Rayleighnumbersof the
order 109wasobtained.Also, therewas anacccptableagrccmcntwith themeasured ompressor
discmetal temperatures.
8.1 Introduction
Numericalsimulationsor tile SussexNICRB2o analyseheconvective eat ransfern a rotating
cavitywithaxial hroughflowaredescribedere.A 2DaxisymmctricCFDmodelof a singlecavity
wasconstructedirst.Thecavity chosenor thesimulationwascavitynumber asshownn tile
diagramof the est ig in Figure8.1.Ascanbeseenn thediagram, avity3 is instrumentedwith a
series f rotating hermocoupleshatwere ocated nthecompressoriscsurfaces. onventional
CFDwasusednitially, whichassumedhe low tobesteady, ompressiblend urbulent.Using ile
convergedolution or theconventionalCFDmodelas a starting onditionhecnimnccdmixing
168

7/28/2019 Chew Packwood N Turner
http://slidepdf.com/reader/full/chew-packwood-n-turner 191/343
modelusing heFLUENTUserDefinedFunctionsUDF)was henapplied.Theaim of thismodel
wasosimulatehe3D unsteadylow andheat ransfern a rotatingcavity with a2Daxisymmetric
model. oachievehis, he ncreasedmixing n thecavity centralcorewasusedwith a view to
demonstratinghat hecnhanccdmixingmodeldevelopedn Chapter7 that hecorrectheat ransfer
in thecavitywill beproduced.
ThesecondCFDmodelwith enhanced ixing was or twocavities;cavities2 and3,surrounding
onecompressorisc,disc2 (seeFigure8.1).The hirdand inal CFDmodelalsowith enhanced
mixingwas or thesamewocavitiesbutnowwithcompressorisc 2 included n themodelling. n
thisCFDmodel,disc2 wasmeshed ndconjugate eatconduction olutionswereobtainedor tile
disc.By using heconjugate eatingoption, heheat ransferredhroughhedisc byconduction nd
thedisc emperatureserecalculated. oth heheat ransferhrough hecavity shrouds nd hedisc
2 temperaturesomputed y theCFDmodelswerecomparedo themeasuredeat ransferand
thermocoupleesultsor various ests overingarangeof operating onditions. herangeof
rotatingRayleighnumbers onsideredor tileCFDsimulationswas1.3x 104o 2.7x 10⁹.Results
from he2Daxisymmctric nhancedmixingCFDwerealsocomparedo resultsroma3D LES
CFDmodelobtained y SunandChew 2004]andSunct al. (20041 t theUniversityof Surrey.
8.2 Description or the Experiment
A detaileddescriptionof the SussexMCRB2 experimentalwork carriedout by Alexiou [2000,
2001] andby Long ct al. (2006b], was givcncarlicr in Chaptcr2 section2.3. In summary,with
referenceo Figure8.1, the rotor discsand inncrshaft ofthe rig representpart of al I Pcomprcssor
internalair systemandwere scalcd
down from a Rolls-RoyceTrent acro-cngine, o a ratio of 0.7: 1.
As shown n the figure, the rotor hadthree nternaldiscsand togetherwith the two endplatediscs
rourcylindrical cavitieswere formed.Theouter radiusof eachcavity (b) was220.Omm; he inner
radiusof eachdisc bore (a) was70.1mm (a/b - 0.32)anddisc cavity spacing s) or42.9mm (s/b
0.195).Thestationary entraldriveshaft rs)hada radiusof 60mmgivingan annular apof
10.1mm.Coolingair wassuppliedo therig byasinglestage Iowdcnscrewcompressor.he
airflowwasmeasuredy orificeplates t the nletandat theexit to therig.Theoutersurface f [lie
rotorassembly asheated y impingementf hotair fromtwo I OkWheaters. emperaturemeasurementsereobtainedrom 21rotatinghermocouplesonnectedo theCompressoriscs
(TC - TC21)mainlyondiscs2 and3.A further3 rotating hermocouplesTC22- TC24)were
169

7/28/2019 Chew Packwood N Turner
http://slidepdf.com/reader/full/chew-packwood-n-turner 192/343
po%flionedaxially along [fie outer surface offlie Compressor drum. All tile rotating thenii(Woupics
were led out to a Wendon slip-ring unit. On the inner stationary drive shaft 7 thermocouples (TC25
TO I) werepositionedalong tile lengthofthe shall-Furtherstationary liertnocoupleswere
positioned o measurehe metal temperatureofthe compressorcasing.Air thermocoupleswere
positionedn theannular spacebetween heoutersurfaceol'the compressordrum and the casing,
Thermocouplesmeasured he upstreamanddownstream emperatureoftlic air flo%%ng through tile
annularpassage etween he inner shall and thecompressordiscs hores.Steadystate estswere
pcrfornied or a wide rangeof'operating conditionsandalso a transientaccelcration-dcceleranon
lestwasperformed.For tile transient est, temperaturemeasurementsweretakenat time infervals of'
2.5secondshroughoutthe testcycle. in addition to (lie temperaturemeasurements. DA
measurementsfaxial and tangential flow velocitieswiflun tile cavity .1were obtained.The
accuracyof'tile thermocouplemeasurementsor the steadystatetestswas stated o he fO.02K
(standarddeviation,SI), lessthan0.14), with tile exceptionbeing for lest 31 wheretile accuracý
was ess han ±0.08K (SD lessthan0,29).
mo
SuvwxUrC Muld -Camity ujg lad" 2
I. o
11.0
Cavity
No. I
4 11Cllvilý
No. 2
Ih %c
No. 3
41tI
Ca%if)
No. 4
Th
lojmr,
-300 i-? OO
.
ILI JI
('31%lý
No. 3
0"6; r' -I
150 I** to
Figure 8.1 Sussex NICRB2- showing the position% of file thermocouplew.
a
170

7/28/2019 Chew Packwood N Turner
http://slidepdf.com/reader/full/chew-packwood-n-turner 193/343
83 Testfleat Transfer Measurements
I feat ransferhroughhecavityshroudswascalculated sing he temperaturesbtainedromthe
thermocouplesnthecavityshrouds ndontheoutersurface rthe compressorotor radially nlinewiththeshroudhermocouple.orcavity2 the hermocouplesC23andTO (seeFigure8.1)were
used ndTC24andTC12wereusedor theheat ransfer alculationorcavity3.Thecavityshroud
heat ransferwascalculated s ollows,
I Icat lux, qrwbln(%2b)
(8.1)
D is theouterdiameterof thecompressorotor,b is thecavity shroud adius,k.,, is [fie thermal
conductivity f themetal, itanium,and(r.,,,,
- T.., ) is thedifferencen themetal emperature
acrosshecompressorotorshroudhickness.
7becavityshroudhcat ransf: , as aNusschnumbcr.wascalculatcd s ollows,
Nfi£IW4d
ilf- Tf)
(8.2)
whereC11P -a' (8.3)
2Cp
0 is the compressor otor speed, T es rig ads the air inlet temperature o the Itna is the disc
borc radius.
8.4Numerical Investigation or Convection In a 21) AxIsymmetric Enclosed Rotating Cavity
%Ilh Axial Throughnow.
8.4.1 Basic modelling assumptions and tile numerical procedure
All thecomputationscarriedout solve theconservationequations or mass,momentumandenergy
usingthe FLUENT CFD code.The CFD calculationswere performedassuming2D axisymmetric,
171
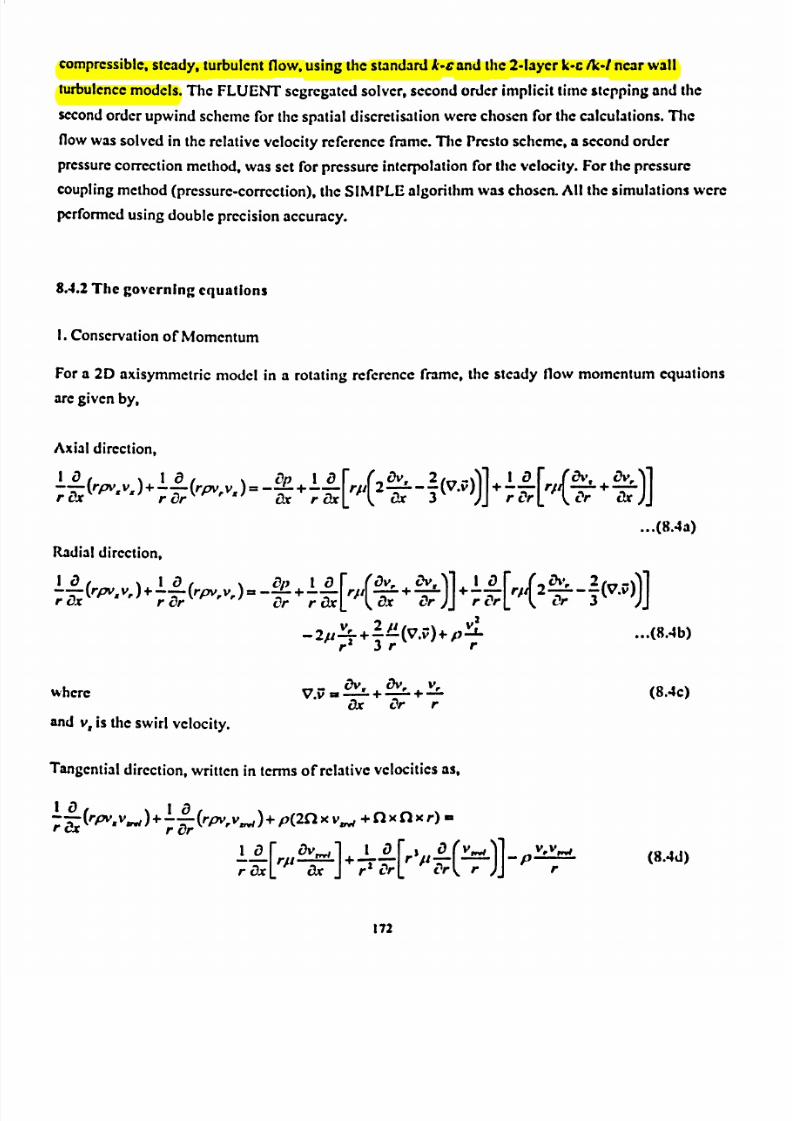
7/28/2019 Chew Packwood N Turner
http://slidepdf.com/reader/full/chew-packwood-n-turner 194/343
compressible.teady,urbulent low,using hestandard-cand he2-laycrk-c/k--Inearwal
turbulence odels. heFLUENTscgrcgatcdolver,second rder mplicit timestepping nd he
secondrderupwindschemeor thespatialdiscrctisation erechosenor thecalculations. he
flowwassolvedn therelativevelocity referencerame.ThePresto cheme, second rder
pressureorrectionmethod,wasset orpressurenterpolationor thevelocity.Forthepressure
couplingmethodprcssurc-corrcction),heSIMPLEalgorithmwaschosen. ll thesimulationswere
performedsingdoubleprecision ccuracy.
8.4.2The governing equations
1.Conservationof Momentum
For a 2D axisymmetric model in a rotating reference rame, the steady flow momentumcqtmtions
aregiven by,
Axial dircction,
Ia (rpv.V. +I 'o (rpv,V, =- LIP-
+Ia2ov,
-2(V.V +1
a UN,+
ON,; Ex
r Or &r ar
[r1j(
.3))]
r&
[rlý
Or &)
Radialdirection,
(IV,+V,Or r
(rpv,v, )+!
-L(rpv, v,).
-Lll-y+!l[rjj(!! V-'+ 1ý'1
11+1
TXr Or Or r& CIX OrT
jr Or Or 3
- 2p V'+1" (M) +P
VI
r2 3rr
wherc
andv, is theswirl velocity.
Tangential irection,written n tcrrnsof relativevelocities s,
Iaa
; E(rpvgv, w)+!(rpvvw)+p(2flxvrw+flxflxr)n
r clr
(8.4a)
(8.4b)
(8.4c)
VIVI-4 (8.4d)TX' ()X r1Or Pr rr
172

7/28/2019 Chew Packwood N Turner
http://slidepdf.com/reader/full/chew-packwood-n-turner 195/343
%4,crc herelativeswirl velocity sgiveby v., - v, -(f1r) andp(2fl x v.,, ) is theCoriolis orce.
Forturbulent flow the Rcynolds-avcragcdapproach o turbulencemodelling is used with the
additionalReynoldsstresses- pu,uj ), due to the Navier-Stokesequationsbeing decomposednto
themean timc-avcragcd)and fluctuating components.which are addedto the momentumequations
givenabove.The additional termsrepresent hecffccts of turbulence.For thek-e turbulencemodel
themethodemployed in FLUENT to relate the Reynoldsstresseso the meanvelocity gradients s
theBoussinesqhypothesis I linze 19751,
p7111-14il,auf
+all/ -3 (/v'
+ len
ax, axj 3 Lax$
)so(8.5)
In thecaseof thek-c turbulencemodel woadditionalransport quations.or the urbulent inetic
energy.A-, nd he urbulence issipationate,c.arcsolved,and he urbulentviscosity,I, is
computedsa functionof k andc. It mustbenoted hatwith theBoussinesqypothesis, is
assumedo bean sotropicscalarquantity.Thestandard-cmodel,kineticenergy, , and
turbulenceissipationrate,c, turbulence quations longwith thenearwall turbulencemodelsused
aregiven n Appendix1.
2.Conservationof Mass
3.Conscrvationr Encrgy
v- (pr"w)-o (8.6)
v- MPE + P)) -v-(k. T) + (1) (8.7)
whercE=h-L+ v'and 1)s theviscous issipationcnn.
P2
8.43 Enhanced mixing model
Theenhancedmixingmodeland ts implementationn a FLUENTUserDefinedFunctionUDr)
weredescribedn Chapter .Thefinalversionof theUDFcodewasdescribedn Section7.4and
instructionson linkingandusing heUDFwithin theCFDsimulationsweredescribedn Section
7.5andAppendix6.Theenhanced ixingmodelwasusedo increasehemixing within thecoreoreach f thecavitiesn anattempto modelunsteadyD flow reaturcswith a2Daxisymmetric
steadylow model.Thiswasachieved y modifying he luid properties f thermal onductivityand
173

7/28/2019 Chew Packwood N Turner
http://slidepdf.com/reader/full/chew-packwood-n-turner 196/343
viscositywithin thecavities.Thesliccificheatcapacityemained naltered y theUDFto keephe
localPranddnumberhesame.All thebaselineluid propertiesweredcrincdas unctions rthe
localgasemperatures.he function I- cos(irS/21)'wasusedodefine hechangen fluid
propertiesncreasingawayrrom hewall.Thethickness r this layer,DL,4YER,wasset o0.005m
within heUDF.A second onstant ropertyayer,Dla)-Coir, ext o tile wall %vasetwith a
thicknessf 0.002m,whichwasalsocodednto theUDF. In thisconstant ropertyayer
conventional FDcalculations rcperformed ndno enhancedmixingtakesplace. lowevcr n tile
cavityshroudwall regionenhanced ixingisassumed ith thesurface eat ransfer onstrainedo
matchhe reeconvection orrelation.Figure8.2showsheregionswhere heenhanced ixing
modelwasapplied.Thecavityfluid temperaturehatwasusedn the ocalGrashornumber
(Equation .29)and n tile heat lux (Equation7.32)calculationswas akenat apositionof 8s%or
diecavityshroud adius.As mentionedn theconcludingemarksn Chapter7 thereweresome
instabilityandconvergenceroblems. o overcomehese roblems n under-rclaxationactor urf
normally et o 0.1) hasbeenappliedo thefactoredluid properties ndalsosmoothingnsmoollt
normally et o 10passes) asappliedacross ach, rthe CFDmesh ells within tilecomputational
fluiddomain.Flowficld ccil ccntred moothingwasappliedo thefluid properties rthe
augmented olecularor laminar)viscosityand hermal onductivity.To illustrate hesmoothing
algorithmwithin theUDFprogram,
Figure8.3belowshowsapartor
tile2D CFDgrid.
Thefigure
showsourcellsnamedN, E, SandW thatarcattachedy edgeso thecentralcell,Cwhich s to
besmoothed.hesmoothingormula or theaugmentedaminarviscosity,i is Equation .8given
below,
p, -Ui, +p,, +pf +ps +pw)/ 5 (8.8)
wherepc' is thesmoothedell ccntrcdvalueorlaminarviscosity orccll, C.
Smoothingof theaugmented hermalconductivity uses hesamerormula.71c smoothedcell
ccntredvalue is the meanof thecurrent valuesorthc centralccll plus the four connecting cells. All
thecellswithin the solution spacearc smoothedandthis is repeated tsm(wh times ror eachCFD
iteration.
174
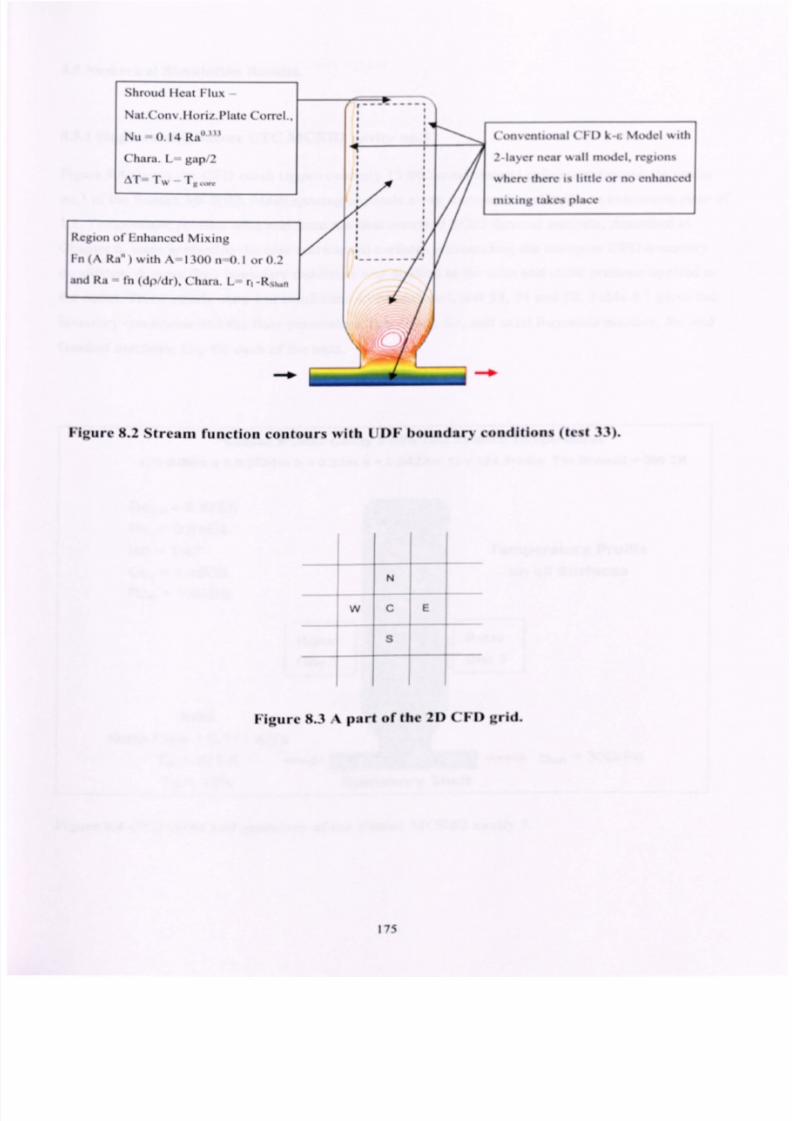
7/28/2019 Chew Packwood N Turner
http://slidepdf.com/reader/full/chew-packwood-n-turner 197/343
Con%critionalCFD k-c Modcl with
2-laycr near wall nuxicl, region%
where there is little or no enhanced
mixing takesplace
Rcgionof'Enhanced Mixing
Fn(A Ra") with A 1300it 0.1 or 0.2
andRa th (dp/dr), Chant. 1. r, -Rjh, ,
Figure 8.2 Stream function con(ours "ith (lDF boundary condilion% (te%l 33).
N
w C E
S
Figure 8.3 A part of ihe 21) ('Fl) grid.
175

7/28/2019 Chew Packwood N Turner
http://slidepdf.com/reader/full/chew-packwood-n-turner 198/343
8.5 Numerical Simulation Restills.
8-5.1 Single Cavity, Sussex UTC NICR112 cavity no.3
Figure 9.4 shows the CFD inesh (approximately 15. X)Oquadrilateral cell%) constnicled I*orcavity
no.3 ofthe Sussex MCRB2. Mesh spacing expands away from each wall %ith ; n expansion ratio of"
1.1.Temperature prol-i es obtained from the best matched SC03 ihmial analysis. dmribcd in
Chapter 6, were applied to the disc and shroud surfaces summiding the cavity as CF`D lunindary
conditions. A mass flow boundary condition was applied to (he inlef and suific pressure applied to
the outlet. Three steady state test conditions were analysed. test 33.34 and 50. ýrahlc X. give% he
boundary conditions and (lie flowparameters.
rotational. Re, and axial Reynolds number. Re. and
Grashot'numbers, flor each ol'ilie tests.
Sussex MCRB2 Cavity 3 with Test 33 Metal Temperatures
r. a 0-06m a-0.0701m ba0.22m sa0.0429m (I a 124.5rad/s Tm Shroud m390,2K
Rell. b'= 8.47E5
Re, = 3.64E4
Ro = 1.47 in Temperature Profile
Gr,p= 1.45E8 on all Surfaces
Ra,p = 1.03E8
Inlet
Mass Flow = 0.171 Kg/s
T,, = 321 K -110.
Tu = 10% Stationary Shaft
Figure 8.4 CFD mesh and geometry of the Su%. c%NICR112 ca%t%
-I-
= 300kPa
17o

7/28/2019 Chew Packwood N Turner
http://slidepdf.com/reader/full/chew-packwood-n-turner 199/343
8.5.1.1 Him structure and temperature rc%tilt%
A contour plot of stream function for test 33 was shown in Figure X.2. I lie figure sho%%ng that %%it
the application ol'the enhanced mixing mmiel a central core was fonticd. In the rcgion of the disc
cobs a circulation was shown to florm between the axial throught'low and the central cavity core
region. Across the three test simulations the extent ol'ilic circulation region %,.s %cry similar. A
contour plot ol'teniperature, Figure 8.5 shows that the central core has a near uniflomi core
Imperature of'334K. compared to the inlet fluid tcmpcraturc of 320K and the shroud melal
Imperature of'390K. The swirl velocity contour plot. Figurc 8.6. shows that near solid body
rotation wasachieved in the cavity central core. (Nil to compare both ternperalure and the swirl
vcloclty within (lie cavities across all tests, the temperature contour rangc of 316K to.190K was set
-ind the swirl velocity maximum was set to 54 ins" I'm all the tests)
3.9 ae4 02
3.84 P- 02
3.8Oe4 0;1
3.76e- 0,
3.7 2e 4o.,
3.68e- 0,
3-64e 02
3.6 0m (I:
3.56e - U.
3.52e-02
1.4 Re- V
!. 4 4eo K,
3.4oe. K
i. A3o4 02
i. 32e- o"
Max. lemp. 390K
InIct lemp. 320K
Figurc 8.5 Te%t33 lemperatures (K) (for ot 0.1).
177

7/28/2019 Chew Packwood N Turner
http://slidepdf.com/reader/full/chew-packwood-n-turner 200/343
I
4.80e. 0I4.6of94014.40e-Ol4.20e*O 14.00640 13-80o-Ol
3. i 0r. ui3.40e-013.20oi3.002.802.6001
.4Or- 01
1.60r-1.40,ý - 11I-01IA C-o I
I U'. 00
11 l 004J (I ou
.7.1 (1,100
UJ oe. 00
%tax. %cl. 2,711L..
Figure 8.6 Test 33 s%sirl%clocifics (m/%).
Sussex MCRB2 Cavity 3 Steady State Toil 33
Temperature from CFO
400
41
380
370
350
b.
340
330
40 0 4p
310 1
000
:.
aa
a
a awa
lo.0 ur
OF
0
/"". ____l
...... "s__________a00,e0*- 40 4- -0
I
005 008 01 012 0 14016 Old
02 0172ftdial Oletance (m)
Figure 8.7 Test 33 disc and cai if.% emperalure%.
oe' -*-
*00
04, l'0
., neue
--1..-....
e .00 wo19
.(ü in
46: b,
abc 2
* b%c3 o3b
23 4hroW
W A. oWCAvft CFO A-1 300 m-0 2
W AxvO OWft CFO A-1 300 m-0 i
k4o"ured - Cbbc2
ku0sured DOC I
M-04,0. d lpwmad
I.,
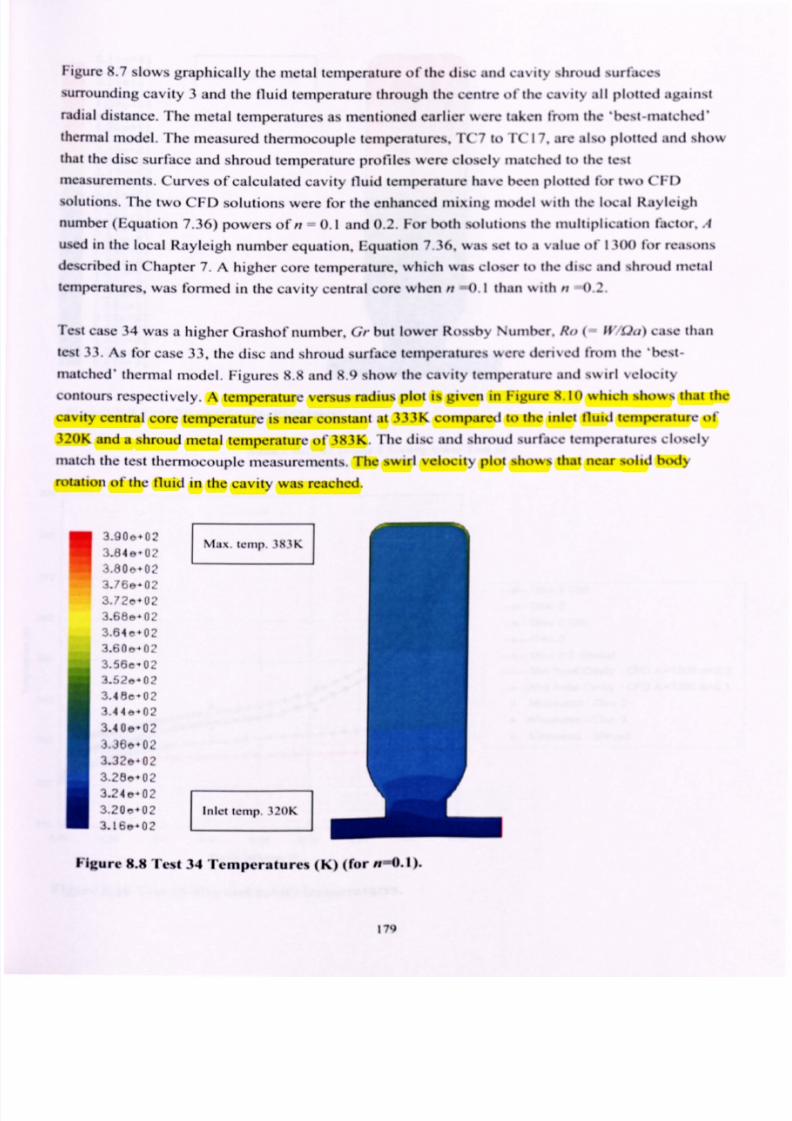
7/28/2019 Chew Packwood N Turner
http://slidepdf.com/reader/full/chew-packwood-n-turner 201/343
Figure8.7 slowsgraphically the metal temperatureofthe disc and cavity shroudsurfaces
surrounding avity 3 and (lie fluid temperaturehrough the ccnirc ol'thc cavity all plotted against
radialdistance.The metal temperatures s mentionedearlier were takenfirointhe 'hem-inatched'
thcrinalmodel.The measured hermocouple emperatures.TC7 (o]"Cl 7. arc also plotted and show
thatthedisc surfaceand shroudtemperatureprofiles were closely matched o the testmeasurements.urvesofcalculated cavity fluid temperaturehave beenplotted for two CH)
solutions.The two CFD solutionswere flortheenhancedmixing model with the local Rayleigh
number Equation7.36) powersofn 0.1 and0.2. For NO solutionsthe multiplication factor..4
used n the local Rayleigh number equation.Equation7.36.was set to a valueof 13M for reasons
dcwribcd in Chapter7. A higher core temperature.which was closer to thedisc and shroudmetal
temperatures,was l'brinedIn thecavity centralcorewhen it 0.1 than%kitht 0.2.
Test case 34 was a higher Orashol'nuinher. Gr but lower Rossby Number. R(P 11'Qij) case (han
Icst.1.1.As flor case 33, the disc and shroud surface temperatures were derived I'min the 'he%,-
inatched' thernial model. Figures 8.8 jild X. ) show the cavity temperature and swirl %clocity
contours respectively. A temperature versus radius plot is given in Figurc 8.10 %%hichshows that IIle
cavity central core temperature is near constant it 333K compared to the inlet fluid temperature of'
320K and a shroud metal temperature of 383K. The disc and shroud surface temperature. %closely
match the test thermocouple measurements. The swirl velocity plot shows that ncarM.)Itd body
rotation ol'the fluid in (lie cavity was reached.
3.90o#02
:1.840.0 ,,3.8 00. V
3.769-0,,
3.72o4 V,
3.68e- 0
3.6 4e-0
3.60&- 0
3.56e- 02
3.526- 0: 1
14 Be 0
'1.4 4is 0
3.409,02
3-3604 OL'
3.32e, 02
"ll- ,
80+0 "1
3.24 e-0 Z'ýý-20e402
3.16&- 02
Figure 8.8'1'est 34 Temperstures (K) (for tiA. U.
179

7/28/2019 Chew Packwood N Turner
http://slidepdf.com/reader/full/chew-packwood-n-turner 202/343
S-4 U*4 Ll I
5.? om. 01
5.0 Oe, 01
4.80e4 01
4.60e4O4.4
0040 1
I
4.2 0a,4014.0 Oco013.8 U0,0 1
3.60e-O 13.4 oe4o I
013.0a2.8 001
2-60e, 40 I
,.4 Ue*U I
: . 20e, O1.000-011.80e, 011.60". 0 1
1.4 Oe,*O I1
. _'06401
1.000401
6.0 Oe* 00
6.0 Oe, Ou4.000-06AOL
1Aor- 00
Figure 8.9'1'es( 34 swirl velocifles On/0.
Sussex MCRB2 Cavity 3 Steady State Ted 34
Temperatur@ from CFD
380
3yo
I
300 ;
340
13U
m
-... a@0
jjwmoopomý #*.0..
#0 #00
..
Sio L-
006 008 0.1 0 12 0 14 016 Ole 02
Modlol Ololanc* (m)
Figure 8.10 Test 34 (Ilse anti cavity temperatures.
190
"-
:... "'
022
4k I ), -., "( ýJ,
4D -DOC 2
0 Oisc 3 Cob
Doc 3
Oisc 2-3 Shroud
o Mid Axial Cavty - CFD A- 1300 noO 2
* Mid Axial Cavity - CFD As 1300 nmO
" Measured - Dec 2
" Measured - 01sc 3
" Measured - Shroud
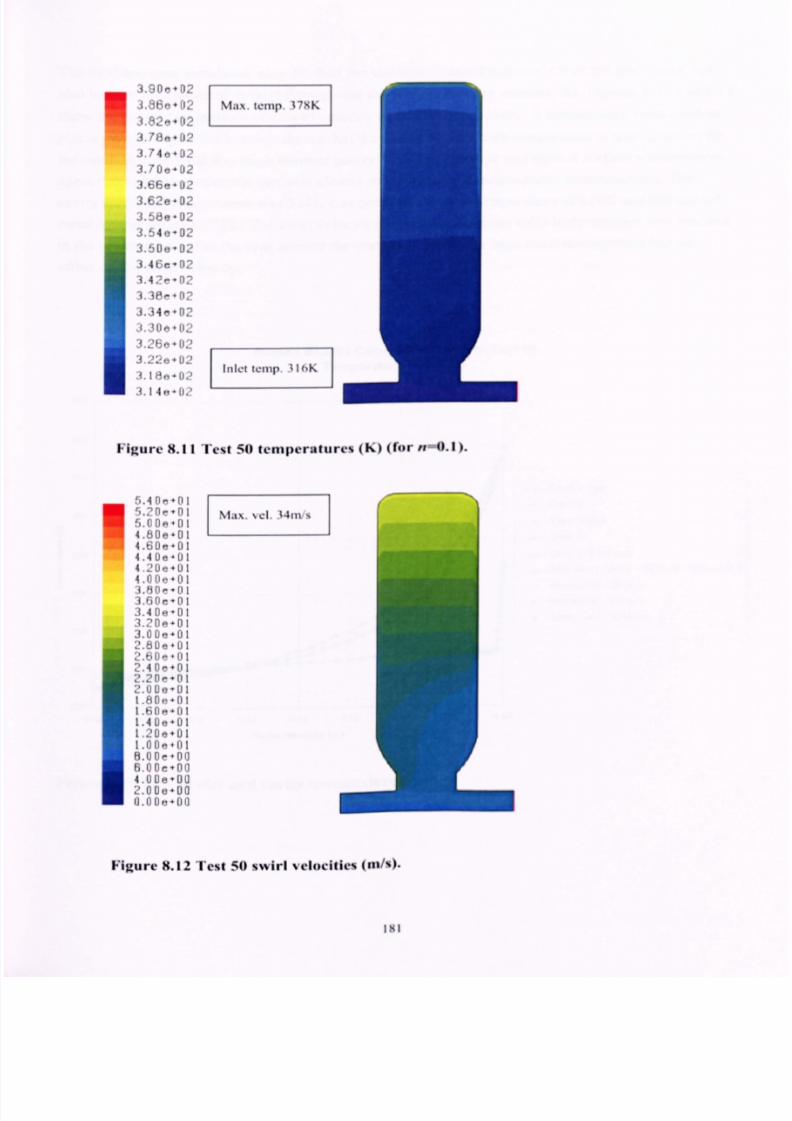
7/28/2019 Chew Packwood N Turner
http://slidepdf.com/reader/full/chew-packwood-n-turner 203/343
`ý9'2'
0' '
78a*02
3,74a*02
3.70e-02
3.66e-02
3.UAe
54e 01
5Oe*02
46c-02
i.4. e--02
38e402
1.30+02
i..-;Ue#02-'6e+02:-'2e*02
14 [1,
Figure 8.11 Test 50 (emperatures (K) (for it OA).
").4Dm+1)15.2or'n.0 0
F4-01
4.80e 014.60e UI4.4 0e-UI4.
-1Uý+U1
4 1) (1ý5 40
3.4 Dti -013.20p-p 13.0 De-01? An^ 4nI
1.60 D1
22.4 e 01
UU01
i tin nII.6fl 11140,, -DII .
20e 4 [11
I. 00m001
H. 0 Or to Qh. 0 Pr 00
4. UUUa;,. (IuU0
1).0D0
1]
Iax. vel. will/'s
Figure 8.12 Test 50 s%virlvelocities 00/0-
181

7/28/2019 Chew Packwood N Turner
http://slidepdf.com/reader/full/chew-packwood-n-turner 204/343
The final test case simulated, case 50, had the smallest (frashot'number. (It- offhe three tests. but
also had the highest axial througliflow giving tile highest Rossby number. Ro Figures 8.11 and X.12
%how ile cavity lemperature and swirl velocify contours respectively. A tcnipmaturc versus radius
Plot is give in Figure 8.13 which shows that the caviiy central core lemperalure is near consfant for
thesolution witil
local Rayleighnumber power. it 0.1.
The discand shroud surface temperatures
again derived from a thennal analysis closely match (lie test thennocouple nicasuremcnis. I lie
cavity core fluid temperature was 324K compared it) (lie inlet Icnipmatirc of'3 I OK and tile shroud
metal temperature ol'378K. The swirl velocity plot shows that near solid I-xxly rotation was reached
in the cavky core but in the area around tile disc cobs where tile high axial throughilm-6,has ; n
CITCCIil tile "\%II \ Clocity.
340
.1, ý
I3N J
150
WO
:1V,
Lý,p1 Oda
110r) (11,
Radial Distance (m)
Figure 8.13 Test 50 disc and cavi(ý temperal tirm
Sussex MCRB2 Cavity 3 Steady State Test 50
Temperature from CFD
0-40
A0,
10
o'0
008 () I () %, o 14 () 16 () 111 0.1
3 Cob
3
2-3 SNVW
M-0 Axisi CAvly - CFO A* 1300noo I
Mg-asurid Disc 2
Moclaurad- Oloc 3
%4oisutvd SIw
IN2

7/28/2019 Chew Packwood N Turner
http://slidepdf.com/reader/full/chew-packwood-n-turner 205/343
8.5.1.2 Heat transfer results
Figures8.14to 8.16show hediscand cavity shroudsurfaceheat flux results or theenhanced
mixingmodelCFD simulationof cavity 3 for testcase33. Thesurfaceheat lux isplottedagainst
radiusor
thedownstreamaceof disc 2 (Figure8.14)andfor theupstreamaceof disc 3 (Figure8.15).Both solutionswith Rayleighnumberpower,n=0.1 andfor n=0.2 areshown n these wo
plots.Foracomparisonheheat lux results romSC03 hermalanalysisare shownand plotsshow
that heCFD solutionwith n=0.1 produceshebettermatchespeciallyat thelower radialpositions.
Howeverat thehighestradial locations heCFD solutiondoesnot match heSC03heat lux values.
Heat lux results or thediscboreand hecavity shroud ocationsplotted againstaxialdistanceare
given n Figure8.16.Results rom both CFD solutionsare shownalong with theSC03 hermal
model esults.Also plotted s thecavity shroudsurfacemeanheat lux for theexperiment,
calculated singEquation8.1. Similar to thediscsurfaces,hecavity shroudheat lux solutionwithn=0.1 produced hebettermatch o thethermalanalysis lux valuesandto theexperimental
calculatedmeanheat lux.
Sussex MCRB2 Cavity 3 Steady State Test 33
Surface Heat Flux - SC03 to CFD Comparison
N
E
aI'
CS
Radial Clistance (m)
Figure 8.14 Test 33 disc 2 rear surface heat transfer (Wm-2).
--o. -Dsc 2 Q)b - CM A= 1300n=0.2
ý Disc 2- CFDA= 1300n=0.2
-Cksc 2 Cob- CFDA=1300n=O.
-Otsc 2- CFDA= 1300n-O,
& Drsc2- S003
183

7/28/2019 Chew Packwood N Turner
http://slidepdf.com/reader/full/chew-packwood-n-turner 206/343
Union MCMD Cavity 3 Steady State Tod 33
Surface Host Flux-
SC*J to CPO Companion
IKXK,
42M
4cx,
34KX
YXX
Mx,
6EXI
AW"A
3 Q* (YO A-I 3W -6
ý].,: (IDA-13M-0:
'I, CAb CPOA-1300.. Gt
aolm 11
vx,044 Ole
a
03
ftds. i Di. 1ý . (-)
Figure 8.15 'I'c%t33 disc 3 front %urface heat fran%fer
Suessix MCR82 Cavity 3 Steady State Tod 33
Surface Heat Flux - SC03 to CFO Comparison
am)
S
I2
em)
4(KX,
2m)
"w** *
-0
?m
186
.01, 016 0 14
Mist Distance (m)
4
4
aju
40 :W'M.. (I DA -1300 -, U.1
w 'Moo (JUA-11COM-0)
ýb.. ' IV-oiod CP0A-I3Wn-0Z
I bb, ýMvv LVDA-1300--01
I b. ý Ift" CMA-IJWn-01
(bb, II Shrowd-
CPO A- 1300 ft-0 I
I bb, ; ra" SM3
tb" 3 obwe SW3
Ww"As
., -j" A., j
ii'! ýw
Iigure 8.16'1'e%l 33 cavity 3 shroud jn(l (li%cbore %urface heat lran%fcr (%%t)
IS-1

7/28/2019 Chew Packwood N Turner
http://slidepdf.com/reader/full/chew-packwood-n-turner 207/343
Table8.1SussexAIC11112inglecavity model,cavity3 shroud surface icat transfer.
Case Test33 Test34 Test 50
N
-(RPM)
1188.9 2302.8 1482.3
hi-(Kg/s)
0.173 0,171 0.599
A (Pa) 299268 297648 238835
ReesP%VdWtt 4.41E4 4.35rA 1.5 E.
Re# pflOp 1.04E6 1.99F6 1.031:
Ro WWI 1.46 0.75 5.03
Grcgv3n2PA'rb(s/2)3/v2 2.32E8 7.41E.8
1.871'18
Bo,,.) Ro/(PAT)O-s 3.0 1.65 11.5
ShmudfeatTransfy (DeviationCF tol"xmimentExperiment tj (WM*2) 4400 5800 3350
CFD LES(I20* model) 4 (Wni-2) 3250(. 26% 4250(-27%) 355 (410
CFD 2D AxIsymmetric 4 4630(+S%l 5690(. 2%)---4230(+260,4)-
Modilled A-cwhit W layer near wall model (A-1300 11-0-1)
Table8.1 summariscs hecavity 3 shroudheattransferresults,comparing tile 2D axisyllimciricenhancedmixing modelCFD resultswith tile calculatedheat ransferWin the experiments ar the
three estcases.Also shown in the tablearc ilia licat transrcrresultsobtained rroin a 3D 120' sector
LESCFD modelof thesamecavity by Sunct al. (2004).The table shows hat (lie heat ransrer
results rom the 2D axisymmctric enhancedmixing modelcompire well with tile experimcntil
values or the first two tests,cases33 and34, within an error or so,,; onip3rcdwith 27%error for
the3D LES model. However ror thehigher axial througliflow case50 tile 2D axisymmetric
enhancedmixing model performs poorly whencompared o experimental icat transrerwith an error
or26%. For the same estcase ile 3D LES modelpcrronns muchbetterwill) an error or
approximately6%.
S.S. SussexAlcI1112. twocavities,cavity 2 andcavity3. surroundingdisc 2
Thesecond artof thework was o apply heenhanced ixingmodel o the2D axisymnictricCr-Dsimulations f two connectedavitiessurrounding singledisc. RererTingo Figure8.1,cavities2
and3 Otatsurround isc2 wereusedor thisCFDanalysis.
Iss

7/28/2019 Chew Packwood N Turner
http://slidepdf.com/reader/full/chew-packwood-n-turner 208/343
For the two-cavity CFD simulations the same enhanced mixing model parameter %alue%%ere
uscd as those used I-or the single cavity sI Intilat ions. The shape lunclion ,I cos(x, 5/21) * was used
with a thickness of the /)LA YER set to 0.005m and constant property layer. Phti-C(m. next to the
wall set to a thickness of*0.002m. The modified fluid property tinder relaxation factor. ut-/ %%;%set to
0.2 the smoothing, nsmooth was set to 10 passes. Figure X. 17 %ho%%he CIA) mesh consinicied for
the two cavities, cavity no. 2 and cavity no. 3. which surround disc no. 2 ol'iho: Sussex MCRI12. I lie
mcsh size I'M this simulation was 26,600 quadrilateral cells. Mesh spacing expands away from each
wall with an expansion ratio of' 1.1. A temperature profile obtained from the 'hcm-matched' SCOI
thcmial analysis and applied as CFD boundary conditions to the di%c and shroud %tjrf*;cc%
surrounding the two cavities. A mass flow boundary condition was applied it) the inlet and static
prcssure applied to the outlet. The saine three steady state lest condition% as for (hesingle
cavity
%%erenalysed, test 3.1,.14 and 50. Retcr to Fable S. I for the lest condilton% and flo%%pataincler-s.
NIUSSFlow
Inlet
('P'I) of the Sussex NICR Ruild 2 Ca,. ilies 2 and 3
Rotor
Disc I
011110
Figure 8.17 CFD inesh and geornclrý of the Su%%ex%1CRB2 ca%lllc%2 and 3.
196

7/28/2019 Chew Packwood N Turner
http://slidepdf.com/reader/full/chew-packwood-n-turner 209/343
8.5.2.1 lowstructure and tenipcratureresults
Figure8.18showsa contour plot of stream unction for test33 showing that with the application or
dieenhancedmixing model a central core was formed in each cavity. Figure 8.19 showsa contour
plotof themixing factor, formed by theenhancedmixing model.A circulation is formed betweentheaxial througliflow and thecentral cavity core region for eachcavity. Temperaturecontour plot,
Figure8.20,showsthat the central corehasa nearuniform temperatureof 331K for cavity 2 and
334Kfor cavity 3, compared o the inict fluid temperatureor320K and the shroud metal
temperaturesf 384K and390K for thecavities 2 and 3 respectively.The swirl velocity contour
plot, Figure8.21,showsthat nearsolid body rotational wasachieved n thecoreorboth cavities.
Figures8.22and8.23 show graphically the metal temperatureof thedisc and cavity shroudsurr; cCs
surroundingboth cavities andthe fluid temperature hrough theccntrc oreaci, cavity plottcd against
radialdistance.The measuredhermocouple,TC I to TC7, temperatures replotted on the Figures
8.22rorcavity 2 and thermocouple emperatures, C7 to TC 17are plotted on Figure 8.23 ror cavity
3.TheTC I measured emperatureon thedownstreamsurfaceordisc I was7K lower than theSC03
thermalprediction. Both plots show that ror all theother thcrinocouplepositions the disc surfice
andshroud emperatureprofiles wereclosely matched o the testmeasurements.Only theenhanced
mixing model local Rayleigh number(Equation7.36) powcr it - 0.1 curve orthe CFD calculated
cavity fluid temperaturehas beenplotted for the two cavities.Also, asWorc the cnhinced mixing
multiplication factor,A used n the local Rayleighnumberwassetto a value or 1300.The cnh3nccd
mixing modelUDF uses he cavity fluid temperatureat a position of 8s,.,,4orthe cavity shroud
radius o calculated he local shroudheat ransferandwall factor. I (Equation 7.29) for eachcavity
independently. t was reassuring hat the two-cavity simulation solution ror all the testcases
produced hesamecavity 3 central core temperatures s far the singlecavity solution. Table 8.2
shows heCFD temperatures or eachof the tests.
Table8.2Two-cavityCFD solutioncavity temperature esul(s.
InIct Cavity2 Cavity3
Temperature
(K)
ShroudNictal
TemperatureK)
CavityFluid
TcmpcraturcK)
ShroudNIctal
TcrnpcraturcK)
CavityFluid
TemperatureK)
Case-3 320 384 331 390 334
Case 4 320 378 332 38 334
Case 0 316 374 323 378 324
187

7/28/2019 Chew Packwood N Turner
http://slidepdf.com/reader/full/chew-packwood-n-turner 210/343
I \\
___T rFigure 8.18 CIA) (est 33 stream fuilclioll
I-IIý0.4 (II
9.98e4 fj'i
9.46&40
8.9 3e- 0
8.4 1f,+U-i7.8 8-ý+0
7.36o4fl
6.83e- 0
6.3 1c-to i
5.7 8,n#
5.2 5a +
4.7 3e- 0'34.2 09+(1-1,
1.68c* 0ýj
3.1 5e4 (i j,2.63e- 01
2.10 e., U
1.58cfD
I. 111ý4Iýj
. ..)4F--nI
Figure 8.19 CFD test 33 Illixing factor contoll"S.
199
/

7/28/2019 Chew Packwood N Turner
http://slidepdf.com/reader/full/chew-packwood-n-turner 211/343
3.66e+ 2
3.62e+ 2
3.78a#023.74a+02
3.70e+02
3.66e+023.62e+023.58e 023.54e-023.50e,02
3.46r, 0
3.42c+023.38e+023.34e+02
3.30e+02
3.26e+023.22e+023.18o-02
3.14e-02
Figure 8.20 CFD les( 33 teill peral tire (K) conlours.
I
5.40e+O 15.20
+015.0 0014.80 014.60 014
.40014.20e+O 14.00o+0 13.60 f--013.60 c, 1)13.40e+0 13.20 a -.013.000-11 12.80o+O
-60 e+02.4 0+01
2.20 +01
,.0 a-aI
1.8084.0 11.60 e, 01
1.40a4.0
11.20e+01
1.000+01
a.Doc,0P).aC+04.00e+902. D0e000.0aaa0
Max. vel. 271n/s
Figure 8.21 CIA) (est 33 swirl (m/%)con(our%.
I st)

7/28/2019 Chew Packwood N Turner
http://slidepdf.com/reader/full/chew-packwood-n-turner 212/343
Sussex MCR82 Cavity 2 Steady State Test 33
Temperature trom CFO
VA)
M)
170
360
0 IN,, I Cob Raw
. (N,, I Raw
" IN., I Cob V'-I
" D-sc 2 From
" DOC 12 stv-1
" Wd A.. 41 CAwly (J 0A-I UX)
" Mossuled Doc I Rý
" K4"surd Doc 2 F". q
ef;
.01_p "
I
ý so
.W
008 01
008
016
Figure 8.22 CFD test 33 cavily 2 (disc I (li%c2) temperalurc%.
Sussex MCR62 Cavity 3 Steady State Test 33
Temperature from CFO
CYI
2 C. 1, N...,
N- 2 Rew
0h"I Cýh I, 'w
IN., JFýl
IN., 2.3 Showl
M"J A-141 GOWY (J 1) AýI UX) -0 1
Mensw*d L)-.1
14-,
... wed -Disc II -I
Sh"N"I
35.0
1 0",
35.0
3.L
0061
0 14
R&dial 04slence 0"1
0 12Radial (Nollance IM)
() I
IM
016
Figure 8.23 CIA) (est 33 cavil-, 3 (disc 2 all(I (Ij%c3) temperal tirm
02
11.1.1
6
022
1W

7/28/2019 Chew Packwood N Turner
http://slidepdf.com/reader/full/chew-packwood-n-turner 213/343
8.5.2.2 Ifeat transfer results
Figures 9.24 to 8.20 show the disc and cavity shroud surface heat flux results lor the enhanced
mixing model CFD simulation for the test case 33. The surface heat flux is plotted againm radiu%for
the disc I downstream and disc 2 upstream surlaces in Figure 8.24 and for di%c2 downstream anddisc 3 upsiream surfaces in Figure 8.25. Comparing the licat flux results on the diso.surfitces
surrounding cavity 3 lor (lie two-cavity simulation to the single ca%ty simulation %hows he heat
transfer has reduced for (lie two-cavity model even though the disc st rl*,ce Icnipcralurc profile
remained unaltered. This is consistent with the CI: D cavity 3 core temperature being %lighthigher
than that 1'c the single cavity, The licat transtler results remai n 1)(x)r at the outer radii of*(lie di%c%
The heat flux results are also lower dian the SC03 therinal analysis value%.Heal I'lux result,, for he
disc bore and the cavity shroud locations plotted against axial distance arc given in Figure 8.20,
Also plotted are (lie cavity 2 and .1shroud surf. ce inean heat lltj\e% for the experiment. calctilated
using I'quation 8.1. Comparing the ca%ty 3 CFD heal translcr to the experimenial \altic. CI. 1)
under predicts (lie mean heat transCerby 4"o in contras( to ; n over prediclion ol'5% from file single
cavity CFD solution. The general trend was that the cavity 3 -shroudheat transtler \?.,.%ess for the
two-cavity CFD solution compared to tile single cavity solution. A large error in the cavily I shroud
heat transfer remains for Test 50 with over prediction of*24%.
Sussex MCR82 Cavlty 2 Steady State Test 33
Surface Host Flux - SCO3 to CFO Comparlacm
1000
1600
1400
1200
1000
400
1)
Ot
- Disc I Cob Rom-
CFO A- 1300 n-0 I
-Disc I Row-CFOA-13OOn-0 I
-Oisc 2Q)bFnx*-CFO
A-13OOn-0 I
-Oisc2F-)m (; FDA-1300. -Ol
Madlel Oftlance Iml
Figure 8.24'1'est 33 cavity 2 (discs I and 2) surface heat transfer (Wni I ).
191

7/28/2019 Chew Packwood N Turner
http://slidepdf.com/reader/full/chew-packwood-n-turner 214/343
Sussex MCRIE12Cavity 3 Steady State Test 33
Surface Hoat Flux - SC03 to CFO Comparison
45N
4000
3500
3000
2500
2000
1500
1000
500
01
006
-500
1000
- Disc 2 Cob Rear -CFD A- 13W n-0 I
- Disc 2 Rom - CFD A- 1300 n-0 I
- Disc 3 Cob Front - CFD A- 1300 n-0 I
- Disc 3 Front- CFD A- 1300 n-0 I
Disc 2 Rear- SC03
Disc 3 Front- SC03
0 12
I&a
.6
0 14 016 Ole
Radial Distanco (m)
Iigure 8.25 Tes( 33 cavity 3 (discs 2 and 3) surface heat (ran%fer 0%in
Sussex MCR82 Cavities 2&3 Steady Slat* Test 33
Surface Heat Flux -SC03
toCFD Compartsort
sooo-
4sw
4000
3500
.500
2000
14nn500
1000
SOO
a
a
a
«,-, **7v-- -- -
04)24 ()
.11, () .1
Ili Ih 14
AmI&Ioialmnce (m)
ý00a
Figure 8.26 Test.13 cavi(v 2 and c: %t%
.1((Ii%c% .2 and 3) %hroud And (11%core
%urface heal fransfer
a
0.2
£
£
£
022
('*w i Www 0 A- 1300 M-o 1
-MK I Owo Cf 0 A- 1300 n-0 I
- Oaac 3 Ikorw ýCFO A- 1300 n-O I
- Oiec 12 Shr*ud UO A- 1300 n-0 I
CNar 2.3 Stw*W.
r-FD A- 1300 n-0 I
Diec 2 Som
-
S(; 03
* (Noc 3 Gorw SOO]
* 0-oc 23 StwoW SC03
Cap Avg ShroW Doe 1-2
F op Avg ShpoW Ojec 2-3
ýI, III

7/28/2019 Chew Packwood N Turner
http://slidepdf.com/reader/full/chew-packwood-n-turner 215/343
8-S. Sussex kICRI12- WO Cavities, cavity 2 and cavity 3 vilth a conjugate heating solution for
disc2.
The hirdand inalpartof theCFDstudy or theMCRB2was o apply hecnhancedmixingmodel
tothe2DaxisymmctricCFDsimulations f twoconnectedavitiessurrounding singledisc forwhicha conjugateicatingsolutionwascomputed. hesamewocavitieswerechosen,avities2
and3,anddisc2 wasmeshed. hissolutionwouldallowthedisc 2 temperatureso bepredicted
from heCFDsolution.Thesame nhancedmixingmodelparameteralueswereusedhereas or
thepreviousCFDmodel.Figure8.27showsheCFDmesh onstructedor the wocavities, avity
no.2 andcavityno.3,and or thediscno.2 solidmaterial.Themeshsize or thissimulationwas
25,500quadrilateralellsfor thefluid domainand3900cellsror diesoliddomainof theno.2disc.
Meshspacing xpands way romeachwall with anexpansionatio or t. I. A temperaturerofile
obtainedromthc'bcst-matched'SC03 hermalanalysiswasappliedasCFDboundaryonditions
to thedisc I downstreamsurface nd o theupstreamurface rdisc 3,and o bothcavityshroud
surfaces. masslow boundaryconditionwasappliedo the nletand staticpressureppliedo the
outict.Thematerialorall of thediscswas itaniumandaconstant alue orthedicniial
conductivity f 7.72W/mKwasset n theFLUENTsolver.An extraboundarywas equiredor the
disc2 rim metal emperatures. temperaturerofilewasobtainedoreachostcaserontthe
thermal nalysis ndwasappliedasaboundary ondition.Inaddition o the hreesteady tateest
conditions,est33,34and50,twoextracaseswereanalysed.hesencludedest3 1,a high
rotational peed, ighGrashofnumber,ow Rossby umber aseanda maximum peed teady
condition aken romanacccicration-dccclcratontransientycle.The atercasewasahighspeed,
highGrashofnumber ndmid rangeRossby umber ondition.11crcroTable8.3rorthe est
conditions nd low parameters.
8.5.3.1Flow structure and temperature results
Figure8.28showsacontourplotof strcamunctionor test33showinghatwith theapplication r
theenhanced ixingmodela centralcorewas ormcdn eachcavitywith tile flow Pattern eing
verysimilar o the wo-cavityonlysimulation.Figure8.29showsacontourplotor tilemixing
factor, ormcdby theenhancedmixingmodel.Twotcinperatureontourplotsareshownn Figure
8.30comparinghecavitytci-npcraturcs,) with theenhanced ixingmodelappliedandb) without
themixingmodel,whereconventionalCFDusingunmodirtedluid propertieswasused.
193

7/28/2019 Chew Packwood N Turner
http://slidepdf.com/reader/full/chew-packwood-n-turner 216/343
Comparinghe wotemperaturelotsclearlyshowshatenhancedmixing model cduccslia radial
temperatureradientn thecavity andnearunironilcore emperature as ornied.At amidradial
positionwithincavity3 theradial emperatureradient ot theconventionalCFDwas362K/m
comparedo40 K/m, ot theenhancedmixingmodel.Comparinghecavitytemperaturesot ilia
two-cavitywith disc2 conjugate eatingmodelsolution o ilia two-cavityonly solution ot test33
therewasno significant hangen thecavitytemperaturesetweenhe womodels.lia core
temperatureas330K rot cavity2 and333K rotcavity3,comparedo thecavity emperaturesr
331Kand334K,respectivelyot theearliermodel.Figures .31and8.32showgraphically ot test
33, hemetal emperaturef thediscandcavity shroud urfacesurrounding othcavitiesand he
fluidtemperaturehroughheccntrcof cachcavityplottcdagainst adialdistanceor3)with tile
cnhanccd ixingmodelappliedandb) without hemixingmodel.Themeasuredhermocouple,
TC toTC7, emperaturesrcplottedon theFigures .31 ot cavity2 and hennocoupic
temperatures,C7toTC 17arc plottedon Figure8.32 ot cavity3. Forcavity2.Figure8.31,TCI
was heonlythcn-nocouplenthedownstreamurracc rdisc I (measurementas7K below he
thermal rediction) nd he emperaturerortleplottedwas he(hernialmodelpredictionusedasa
CFDboundarycondition.Similarly, hermocouplesC13 oTCl 7 positioned n ilia upstream
surracef disc3 (Figure8.32)havea thermalmodelpredictionemperaturerorile plottedagainst
themeasured
emperaturesndagainwasusedas he
CFDboundary ondition.The wocavity
shroudhermocouples,C2 rot cavity2 andTCl 2 rotcavity3 shown%%,rctestmcasurcmcnts;ith
predictedemperaturerofilesplottedagainsthemagainwith theprofilc beingused ot theCFD
boundaryconditions. he hermocouplesf real nterestwereoil disc 2,TO toTC6ondie
upstreamurrace ndTC8toTCII on thedownstreamurracc ndTC 7 positionedn thediscbore.
Figures .31and8.32show heCFDpredicted isc3 surraccemperature.heplotsclearlyshow
thatdieuseof thecnhancedmixingmodelsignificantlymproveshepredictionorthedisc 3
temperatures.herewasgoodagreementn thepredictedCFDdisc3 temperaturesiongmostorthediscsurraces, ith the argest rrors overprediction) ccurringat ilia middiscdiaphragm
positionsTC4andTC10)onbothsidesof thedisc.Alsoplottcdonbothfiguresarc hemidcavity
fluid temperaturesnd,asmentioned bove,heplotsclearlyshow hat hecnhanccdmixing model
reducesile radial emperatureradientanda nearunirorm emperatureorewasestablishedn both
cavities.Thefluid temperaturesot cavity3 arcpresentedn Table8.3for all tile testcases
analysed.
194

7/28/2019 Chew Packwood N Turner
http://slidepdf.com/reader/full/chew-packwood-n-turner 217/343
Rolor
Disc I
Mass Flms
lnle(
i talionan Shall
Rolor
Di%c.1
llre%%ure
()tlllcl
Figure 8.27 CIA) mesh and geome1r) of lhe -Sti%%c%ICRR2 caillic% 2 sind .1and of
di%c 2 Ailh conjugale licaling.
Figure 9.33 compares the CIA) predicted disc 2 metal temperatures for test.1.1.ý%th and %%lhotit tile
enhanced mixing model being used. For tile enhanced mixing model solution tile predicted di%c
Icinivratures were within 5K corresponding to in error of'9". %%-heremir 01red-WaO I-iit%c
nm-l*lnlc(). this compares to a dillerence of 19K. that is a 350oerror for the comcntional
Alw. flor comparison the crror in SC03 therinal anaksis. predicted temperatures arc gi%cii using tile
%ame rror criteria. The I gtire sho%vshat for tile majority offlic disc tenipcraturcs fileCIA)
%%thenhanced mixing predictions were more accurate than tile 1herinal analyms predictiom I tic a%cragc
error for tile (+`D predicted temperat tires was 3.06"o compared to 3.09*o for file therinal analyms
predictions. 11*11lewo ,,,(I-(Ilsc (Ijaphragin lemperat tires were not included (he a%cragecm)r would
be 1.56% compared to 3.3 PO. Hence there is a significant improvement in (he prediction ofilic
disc 2 Icinperal tires using the enimliced inixing CFD modcl compared it) tile SC03 thcrinal model
prodictions. The UFD enhanced mixing model predicted disc 2 temperatures for tc%t%.est.14 and
test 50 are shown in Figure 8.34. Good agrevincrit hem,ccii the CFD results and the tc%t
Measurements is silowil flor both tests, with (lie largest percentage error being 3.4% (1 9K) for tc%t34 and 1.5% (O.XK) for test 50. Cavity 3 CFD temperature results for the five tc%Ls rc %hown n
Table 9.3.
193

7/28/2019 Chew Packwood N Turner
http://slidepdf.com/reader/full/chew-packwood-n-turner 218/343
I
0
Figure 8.28 CIA) test 33 %tream filliction confoum
1. 11 -4 1,.1
IlAbc +1ý
1). 6e -8.9 3L%-8.4 17.8 8
7.36e
6.83e,
A ll.. ý
5.7ae
5.25e-4.73e-
4.20e-
-ý.jac 1.1
I 5e
". 63e
).10e
5c -
Figure 8.29 CIA) les( 33 llii%illg factor comour%.
I
196

7/28/2019 Chew Packwood N Turner
http://slidepdf.com/reader/full/chew-packwood-n-turner 219/343
ith [lie Enhanced Mixing Model
W.,
I
3.9
3.86e+02
3.82e+il:,
3.T8a fl,3.T4e,.0,
3.7De U2
3.66e 02
3.621-- 02
3.5Be+o,,
3.54e+11.3.50.5+ 13.4 6e-
3.4 2e-
3.36a4.]34 (1
+0
Max lemp. I'A)K
1111clCIIIII 120K
Withollf file Enhanced Mking Modd
.1. ýju, #o
,I-86e40
,3.82e,402
3.78e+02
3.74o#02
3.70e-02
3.66e- 0?
3.62e402
3.58e4 0'
3.5 4eU, ':3.50eU. '
46e, U.,
424!ý-0..,
-A 4402
"040"
:-16k-02
i.2a#02
11.18e402
i. Ae402
max. lemp. IINK
Inlet lemp. 120K
Figure 8.34)Test 33 temperature confours Wkc 2 Illodelled with conjugate healing) for a)
with and b) without (he enhanced mixing model.
l')7

7/28/2019 Chew Packwood N Turner
http://slidepdf.com/reader/full/chew-packwood-n-turner 220/343
:1)
390
3W
3TO
3W
350
340
IN
320
Stjs%ex MCRB2 Cavity 2& 01,,, ý1 CoIli ulpir I Tc,%I II
Tompoorature from CUD
0 14 016
Radial Didance (M)Ole
b" II, t.
Gob Ffonl (0 DI
I h" I Fford(CFT)i
(ks,-
12 Slwoud (,, 0 1,
0 WA. wiilCavity ODA IW(X),, III
0 k%ssurod Doc I How
310
1
() (Xi 00a
b)
IM)
380
VO ,
Sussex MCIRE12Cavity 2A Disc 2 (Conjugate) Sleady Stele Test 33
vAthout the Enhanced Mixing Model (No UDIF)Ternimrature from CFD
a-I b%, I CAjb fbw (sco. 1)
-Ih, I F4"r (SC03)
b, I Cob Front (CFO PA)AVi
I Front (CFD No Lirl
a12 Shroud (scO3)
"W A-WO CRv*y-
CFD PA, k4*
" Measured- (bac 1 14pa,
M-1-Iffed 08ý I,, -, I
N, ... . ýl Sh-A
0
330 -
320
310
1
006 008 OA 12 0 14 0 ifi
Radiel Ode"mce (m)Ole
02
02
022
..,2 1110(jelled%%ilhonjtiga(c healing) for a) %%ilhigure 83 11 e%(33 cavily 2 lemper-.11,11-cs(Ii.
and h) AiIII(IIII the enhanced mixing model.
JQS,

7/28/2019 Chew Packwood N Turner
http://slidepdf.com/reader/full/chew-packwood-n-turner 221/343
SussexMCRE12avity3& Disc2(C(mlugate)SteadyStateTest 33
TorqmrstureIrc" CFD
4(X)
390
380 -
370 ,
h)
4(M)
390 ,
380
370
340
ISO
0 hi, I Gob How ((J Di
0 b- 2 Fbar (CFD)
0 b- 3 Cob Front (sc 0 1)
*Ib. c 3 Front (SC03)
4, (Isc 23 Stwoud (sco Ii
" PM A. mWCavity-a 1) A
" Kuasufod Disc 2 14.4,
" Mermsured D%c :11, -1
a 0A."Sawed ! W-1
IVNI"ý,
0 12Radial INGUnce (M)
016 Ole
Sussex MCRB12Cavity 3& Disc 2 (Conjugate) Steady State Test 33
%vithout he Enhanced Mixing Model (No UOF)Terqmralure from CFD
-4b- 1W I Cob How (M) P*, iAv
0 (ý, - ýPaw(CFDWLO)
* (b. - I Ch Front (%,.03)
Disc 3 Front (sc03)
Orsc 2.3 Stwoud (%, 0 ti
NWAmmilGovily (II)N, tAV
k%asured-
Olac
0 12Radial EiAMCS (m)
016 1.
02 022
FiRure 8.32 Test 33 c. %i ý31 emper at ures (d i%c2 modelled A t h conjuga Ir hen in g) for a) %%Ih
and b) Ailhoul Itic enhanced inixing model.
I)()

7/28/2019 Chew Packwood N Turner
http://slidepdf.com/reader/full/chew-packwood-n-turner 222/343
%%ilh Enhanced Mixing
' Os)
.III
rm -. 171.4
1411(10
Icto
fifu)
C"i
.I
, 111 LL8
I -(1 1
I-I 'I
I-N II
1 4161
%%ilhoul Fnh. mccd Mixing
Im 0 'A k1ý
-IIIV,, -46, . A I romp IkI
1-1Wo. word IrmpikiI:
i( 1 1) Pred. -%I rotor MI ramp (k 11
1)4.c kim. Im-I '4k
I hrough fie" %if.
I in - 420. Ik
11)1rt- (Ilfmi Mm KTtn Tins
4)
, 10
ItsCC7o
fc?
Figure 8.33 Tesl 33 disc 2 lemperal ure%(conjugale licalilig %ld"fiOll) - -Alth and i%ilhoW dir
enhanced mixing ino(fel.
I'I'e%t34 - %%th Fithallce(I Nli,, illg
IN) A
4604
(. 41 ýj
F-11I I--I
.Tm - 374.3 K
II
I
( 11
1,10
I't-%t 50-
%%th Enhanced %li%ing
. m - 10.7 k
-\ lp I-
t 1) P, Mkl,, d 1,-. p 4k)
ete %Ira%orrd I rmp (k I
(( W Prrd. %Irasa red I emp ik ii
(I NI[-ý-
4"..1
D-e. I
T
Me
ý; -I
CFD I-war - (Prvd
".I""'LE.-rouI:h thm W. I in - 12o.,
WAS I(Im
.0
I--
Ir,
rTin i
1
I,
ý (141
o;I
AI,11LO
- --) (41i( 41 T qi"ý'j =
Figure 834 Test 34 and test 50 disc 2 lempersoluro. (conjugale healing %olution) - %%Ithhe
enhance(] mixing model.
'I II
II;
0Itt to
It 1*
2(g)

7/28/2019 Chew Packwood N Turner
http://slidepdf.com/reader/full/chew-packwood-n-turner 223/343

7/28/2019 Chew Packwood N Turner
http://slidepdf.com/reader/full/chew-packwood-n-turner 224/343
Table83 SussexNICIII12 wo cavity anddisc2 model,cavity 3 temperaturesand shroudsurfaceheat ransrcr.
Case Test 31 Test33 Test 34 Test 50 Trans.
INIAX.SS
N (RPM) 5871.6 1188.9 2302.8 1482.3 5513.0
xf-(Kg/s)
0.165 0.173 0.171 0.599 0.376
P. (Pa) 298343 298268 297(Ag 238835 240285
Re, - p%Vdh/tt 4.17E4 4.41E4 4.35 F4 1.53r-._9.49E4
Rc4 - PM24i 5.02F6 1.04F6 1.99F6 1.03E6 3.77F6_
Ro- W/a! 0.28 1.46 0.73 3.03 0.86
GEiv",= f12PATb(s/2)1/v2 3.83r.9 2.32F8 7.41EIR 1.97FR 1.951.9
jlo,,, ) - Ro/(PAT)O-s 0.7 3.0 1.65 11.5 2.24
InletTemperature K) 322 320 321 316 315
ShroudMetal TemperatureW 385 390 383 367
Cavity Fluid Temperature K) - T 3441 337 337 325 328
Shroud featTransfer(Deviation C- to Experh MY-
Experimentil (Wni-2) 8250 4400 5800
3350 6450
CFD LES(I 20* model) (Win'2) 3250
(.26%)-
4250
(.271%)
3550
(-61,
CFD 2D Ailsynimetric (%Vm'2)
1
8060
(-2'Yo) 1
4305
(. 2%)---
5300
69%)
3880
(+6%)
6820
Modliled 4--civith W layer near wall model (A-1300 it-0-1)
Tests31,33,34, So& Trans Max. with Disc 2 Conjugate Healing
202

7/28/2019 Chew Packwood N Turner
http://slidepdf.com/reader/full/chew-packwood-n-turner 225/343
Sussex MCRB2 Cavity 2& Disc 2 (Conjugate) Steady State Test 33
Surfaca Host Flux
1, )0
low
I
I
OW
Wx)
(X)
; NX)
700
- Disc I Cob Row-CFD
A- 1300 n-0 I
- D4sc I Row-
CFD A- 1300 n-0 I
- Disc 2 Cob Frarg - CFD A- 1300 n-0 I
-D, %c2F, ml CFDA-IW-ol
() 08 (). I 012 () 14
Radial Distance (m)
016 Ole 02 OP2
Figure 8.35 Test 33 CIA) ca%ty 2 ((Ii%c I and 2) %%ilh11%c.1conjugale healing
di-scsurface heal fran%fer ONm
Sussex MCRB2 Cavity 3& Disc 2 (Conjugate) Steady State Toot 33Surface Heat Flux
4500
3500
III
3000
2500
20(X)
Isoo
1000
Soo
I(XX)
'-Dific2CobR*or CFDA-1300-ol
Disc 2 Row-
CFD A- 1300 n-0 I
Disc 3 Cob Frr"-
CFD A- 1300 n-0 I
Disc 3 FrorA-
CFD A- 1300 n-0 I
Disc 2 Rear- SC03
a Disc 3 Frcoti4 S(, 03
RediM Distonce (m)
Figure 8.36'1'est33 CIA) cavily 3 (di%c2 and 3) Allh disc 2 conjugule heating
disc surface hem transfer (Win 2).
£
a
aa
aa
aa
203

7/28/2019 Chew Packwood N Turner
http://slidepdf.com/reader/full/chew-packwood-n-turner 226/343
Sussex MCRE12 Cavities 2&3 & Omc 2 (Conjugate) Steady Slat* Test 33
Surface Hrat I lux
"(KX)
4500
4000
3500
3000
2
2-, X)I
11500
IOOD
Soo
ýý'j
A£
I
I
aaa #%
a&
Diac 2 mcm cro A. 13W M.4 I
r)wc 3 Gore Cfn Aý I 3W n-Q I
2 SPWOA cro A. I= "a I
3 shrmA CFO A- I wo "-a I
Galv SC03
I Sh"A SCO3
" VWMA ow 12
K, A-j *bfý DMK 23
qw" *0-0-0
o IN
Awiel 04 ,, (094
() 14
ýaaa
Figure 8.37 Te%l 33 CIA) ca% h 2 ((Ii%c I and 2) und ca% fý.1
((Ii%C 2 211d di%c.1)
,Ailh disc 2 conjugate heating %hroud mid di%c bore %urface lit-at Iramfer 0% m
I 19111X ;S'and Figure 8.39 show graphs ofca%it ý shimid Iica I ia it%I i I,It Itct again ,I( ii-i'dit II
number. (or and agaill.st I)tI,)yjIIcy number. Ho I*Orile Sussex MCR Both plot%%ho%%xperimental
data I'M cavilies 2 and 3 Crom imids I and 2 (build I as 'Other rig Ie%Idata. When file ztvoal
1hrought1mv s do,11111.1,11ile ( Irasliof* number is lo%%,ile buoyancy number v. high. and the C; % 1ý
shroud heat transler is Im%.When tile buoyancy %%111111ile ca%ly Is dmitinant. tile Gra%hot'number
is 111911.ile bilovancy number is lo%%and tile shroud heat transfer is high. File criteria ihal is used to
d0ennine file flow regime is. O'llo -6 the llo%%s III buoyancy dominant regime and ifliti - (i the
flow is lit 1hroughtlow reginic. Flus I., shmim by tile experimental data in 11gure 9.11) I-lie
exrxi-imcnial results Fromilic 1-1%cests that 11,1%eeen %imulawd ire slumn tonthe graph-, .1% olid
diamond symbols. The corresponding CIA) heat transfer rc, 1111%iroill the conjugate heating. 21)
ax,%yrilmetric enlLinced mixing model soltmons are plotted as black rings. 1*ocomplete the plois tile
-11)120- sector I. F.S CFD model restills ; re slumn as solid squates I-lie dclinittom offfic (irashof
number and Buoyancy number are I gi%en in Fable 8; Bt)ih graph-, %ho%%lia[ 21) avitsymnictric
enhanced mixingmodcl
hem transIlerresults correlate
well with the test data. %%ill all file testIumnis
lying within the scaller of1he experimental dam, File graphs also show illat file full rangc of'
buoyancy conditions have been analysed by tile iivc 21) axisyrnmetric CIA) %imula(tom
2(m

7/28/2019 Chew Packwood N Turner
http://slidepdf.com/reader/full/chew-packwood-n-turner 227/343
Sussex MCR Build 2 Test & CFD Romilts
250
200z
.ol50E3z
100
50
-; ý-l G"v I
.I Mhw .0 t"l 40.
I pwwlwg T-131
*I . Pý-., A
-PW%I-A T"Iio
wits ýLmq
aIL Sý Oft. 1. T"Iso
SCJ 0 A) A,, oym
rp, II
u:
0
1.OE+10
Figure 8.38 CavifN 3 %hroud heat (ran%fer %er%e%r-i%hof number prt-diclion%
compared lo (he e%peritnent.
Sussex MCR Build 2 Test & CFD Results
1 OE+08 1 OE+09
Grashof Number Gr,h
1.5E-04
1 OE-04
NUsh/Re,1.3
5.OE-05
m
IIIII iii
111,111 .w,U. aM.
I
*
., -W ý
&
O.OE+00III SSSI
0
.
10I
A£ ALIAS
t. 'ý 1.01 3
1,0". G ftw 406
*r". -a T. 031
*r. vw-o tdW23
*I I. Mbi
to
i
05 10 15
Buoyancy Number Bosh=Ro/(IIAT)O 5
HL'ure 8.39 Ca%ilý 3 shroud lical fran%fer %ci-%e%moýancý nunihcr ( -1- ) pre(liction%
cOmPared 14) he c%perimew.
2()',

7/28/2019 Chew Packwood N Turner
http://slidepdf.com/reader/full/chew-packwood-n-turner 228/343
8.6CFDFLUENT LESSolution
In acomplementarystudy,SunandChew [20041carriedout CFD simulations for the Sussex
MCRB2cavity 3 using Large Eddy Simulation (LES). Forcompletenesshe results rrom the 3D
CFDLES simulationsare includedanddiscussedbelow. Simulationswerecarried for threetests.33
and34wereconductedat Surrey,whilst test50 wascomputedat Volvo Acro Corp. [Abrahamsson,
2001. Tests 33 and 34 areconsidered o be in thebuoyancydominatedflow regime whilst test50 Is
in thehigh throughilow regime.Most of the calculationswereconductedwith a 3D 120*sector
modcl,whilst for test33,45* and90* sector modelswerealsocalculated.77hemeshsizesemployed
for thesemodelswere 1.36M, 3.14NIand4.07M cells for the45%90* and 120*modcls,
respectively.I'lie mcshspacing n theaxial and radial directionsexpandedaway from die walls with
a finc mcshnext to the walls to captureand resolvethe flow adequately n the nearwall rcgion. I'lic
meshspacing n the circumrcrcntial direction wasuniform. I'lic boundaryconditions wcre set,as
theywere for the 2D axisymmctric models,accordingto theexperimentaldata.The inlet flow
turbulencentensity was set to be 20% (10% wasused n the2D axisymmetric models).as t was
consideredhat therewould bestrong mixing clTectsbetween lia axial througliflow andthe swirling
flow in thecavity. As only partial domainswere simulated,all thrcc modelswere applied with
circumrcrcntialperiodicity.
The FLUENT codewasusedfor thecalculations.The LES Smagorinsky-Lilly sub-grid scalemodel
waschosen or the calculations.The Smagorinsky-Lilly modelconstantC., which represents
relationshipbetween he mixing-Icngth, associatedwith the sub-grid scales,andthe filicring cut ofT
length,was set to 0.23. The temporalandspatialdiscrctisationswere2"Jorder implicit with the
time stcpbeing I.Omsand the 2"dordercentral differcncing scheme. cspcctively.
A summaryof the shroudheat ransrerresults from the three3D LES-CFD Inodell is I; %-cnn Table
8.4.
206

7/28/2019 Chew Packwood N Turner
http://slidepdf.com/reader/full/chew-packwood-n-turner 229/343
Table8.4Summary of CFD-LES results for the calculated test casesof the Sussex MC11112ISunand Chew, 20041.
_Case Model Experiment 4r,,;, Win" CFD4c-tDWM'2 A4c-rl)/4r,,
p
Tcst33 45' sectormodel 4400 2350 42%
90*sectormodel 3150 .28%
120*sectormodel 3250 -26%Test34 120*sectormodel 58DO 4250 .27%
Test501 120'sectormodel ~3350 3550 6%
TheLESshroudheat ransrcresults avealreadybeen omparcdo tile2DaxisymmetricCFD
modelesultsn
theprevious ection ndareshownnTable8.3.Tile LES
shroudheat
ransferresultsorthe120*sectormodelwerealso ncludedn Figures .38and8.39. n theseigureshe
LESresults rcgivenby thesolidsquare ymbols.Sunetal.observedhat herearc some
differencesn tile shroudheat ransrcr etweenheLEScalculations nd hecxperitnentalesults,
althoughheuncertainty f themeasurementsnd heuncertainty r theboundary onditions
specifiedortheCFDmodelmaycontributeo tiledeviations.n addition, t canbeseenroinTable
8.4 hat, ortest33,tile larger hedonla.nor tile sector.hebetterheCFDresultsare.For his
reason EScalculationswereonlyperrormcd sing ile 120'sectormodel or the woother ests.
Sunct al.wereveryencouragedy theLESresults,with tilecapture f tilebroad rendsor tileNusscltnumber ariationwith Grashof ndBuoyancy umbers.
The large-scalestructuresof the flow capturedby the LES areclearly visible in the Sectionalviews
of the instantaneousemperature,shown in Figure8.40.Cold andhot "an'W' penetrate lia cavity.
Theboundarybetweenthecold axial througliflow region and relatively hot, rutationally dominated
buoyantouterswirl flow region is clearly visible too. The existenceorthe ine-wale structuress
consistentwith ilia experimentalevidence.A sharp nicrracebetween hecold central flow
througliflow and ilia main cavity is mostapparent or test50. The 2D axisyninictric CFO modelwith theenhancedmixing also captures heboundarybetween hecold througliflow andcentralcore
cavity swirling flow, but this boundary s ilia circulation regionsetup between lia disc cobs.17here
is no evidence hat the 3D sectorCFO modelscomputea circulation region although ilia solutions
My not havebeenexaminedfor this rcaturc.
207

7/28/2019 Chew Packwood N Turner
http://slidepdf.com/reader/full/chew-packwood-n-turner 230/343
Stj%%e%iiiii(12 / Fluent LFS / (, mitteilt. %al eili(1-2%iill uläne
(a)Tesl 33 LES
Rolal ion
\ýf
(C) Volvo LES
Test 500
14401.1lioll (b) I'e%l 34 LES
Hgure 8.40 LES 120 sector model - insillillancous temperature at the plane for the
Su%%cx ICRI12 cavily 3 simulations IStin et al. 20041.
8.7 Conclusions
Numerical simulations 11,1veieen carried out Ilor the Susse\ NIURB2 It, analýse the co1I\CcI1%eical
transtler n a rotating cavity with axial 1hrougliflo\% A 21) amsymmetric CFD mixielling lechnique
using the enhanced inixing 111odelo increase the inmrig in (lie cenlral core ol'a rotating ;:.I\ ltý has
bccn used. The comptitat Otis were perflornied assuilling steady flow and the rcstilis ha%chccn
compared with the experinienial measurements for inetal iemperatures and licat iran.-ler. I'lic
simulations were broken down into three sections. first the simulation ofa %ingleca%fy. cavity .1.
wcondly simulations ol*(\vo colinected c;, %,tlcs. cavities 2 and 1. and thirdly %imulations for the
s3nic Iwo Connectedcavities but with the dist: 2 Iijodelled %kthin the CIA) tising conjugate licaiing,
Finally the restilts were also compared to results 1rom a .11)%cciorITS intx1cl ofthe --inic c.1%ly
L'sing the enhanced mixing model good agreement with experimental Valtics for the ca%ty shroud
%url'ace eat transfIer has been shown for rotating Rayleigh numbem of the order 10". All the steady
209
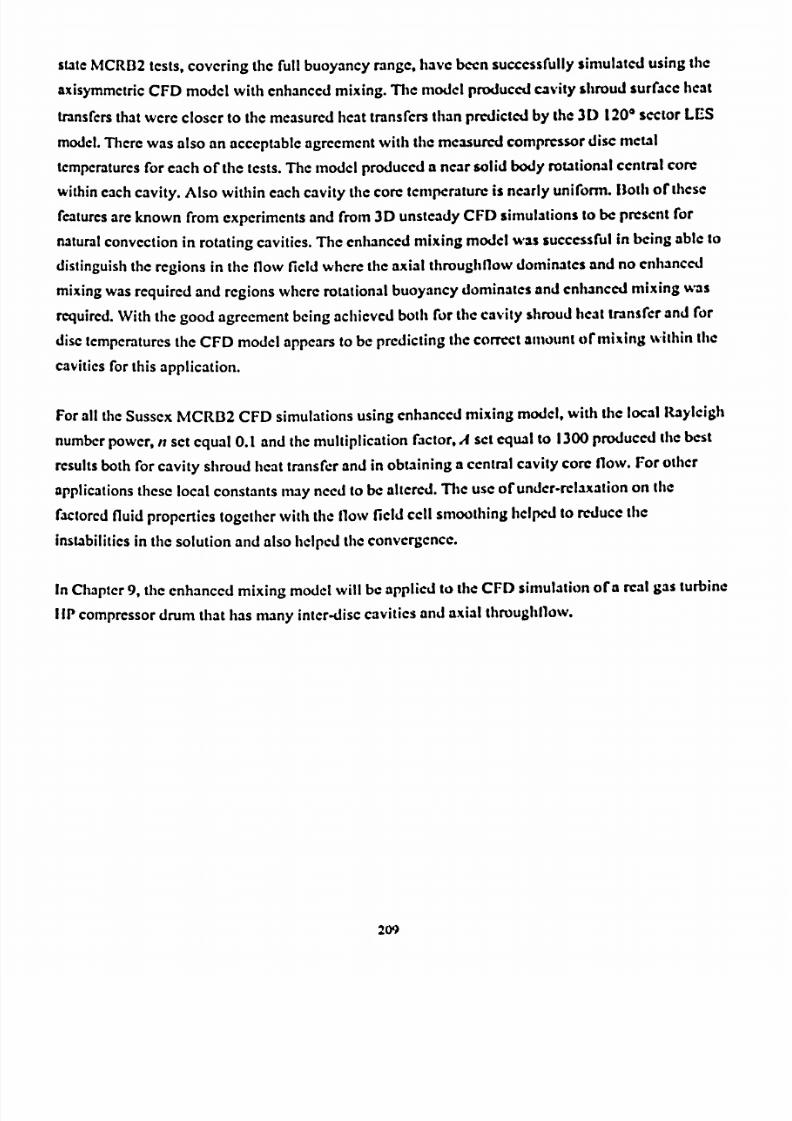
7/28/2019 Chew Packwood N Turner
http://slidepdf.com/reader/full/chew-packwood-n-turner 231/343
stateMCRB2ests, ovcring hefull buoyancyange,havebeensuccessrullyimulated sing he
axisymmctricFDmodelwith enhanced ixing.Themodelproducedavityshroudsurracc eat
tmnsfcrshatwerecloser o themeasuredeat ransrcrshanprcdictcdby the3D 12011ectorLES
model. herewasalsoan acceptablegreement ith themeasuredompressoriscmetal
temperaturesor eachof the tests.The modelproduceda nearsolid body rotationalcentral core
within eachcavity. Also within eachcavity thecoretemperatures nearlyunirorm. Both or these
featuresareknown from experimentsand from 3D unsteadyCFD simulationsto be present or
naturalconvection n rotating cavities.The enhancedmixing model wassuccessful n being able to
distinguish heregions in the flow field wheretheaxial througliflow dominatesand no cnhanccd
mixingwasrequiredand regions whererotationalbuoyancydominatesandenhancedmixing was
required.With the good agreementbeingachievedboth ror thecavity shroudbeattransrcrand ror
disctcmpcraturcshe CFD model appearso bepredicting thecorrectaniountormixing within the
cavities or this application.
Forall theSussexMCRB2 CFD simulationsusingcnh3nccdmixing modcl, with the local Rayleigh
numbcrpowcr, t sctcqual 0.1 andthemultiplication factor,A set equalto 1300produccd(lie best
resultsboth ror cavity shroudheat ransrcrand in obtaining a centralcavity core flow. ror other
applicationshese ocal constantsmayneed o bealtered.The useorunder-rclaxation on the
factorcd luid properties ogetherwith the flow ficId cell smoothinghelped o reduce he
instabilities n the solution andalso liclpcd theconvergence.
In Chapter9, theenhancedmixing modelwill beapplied to theCFD simulationof a real gas urbine
I IPcompressor rum that hasmany inter-disccalviticsandaxial througliflow.
1.109
7/28/2019 Chew Packwood N Turner
http://slidepdf.com/reader/full/chew-packwood-n-turner 232/343
CHAPTER 9
21)AXISYAINIETRIC COMPUTATIONAL FLUID DYNAMICS SIMULATION OF A
TYPICAL GASTURBINE IIP COMPRESSORROTOR DRUM WITH THE
APPLICATION OF THE.
ENHANCEDMIXING MODE j
Summary
In thischapter he2D axisymmctric CFD modelling techniqueusing thc enhancedmixing model
hasbeenapplied to a typical gas urbine I IP compressor otor drum. The computationswere
Performed ssumingsteady low and the resultshavebeencomparedwith enginetestmeasurements
for metaltemperaturesandheat ransfer.An acceptableagreementwith enginetestmeasured
compressor iscs temperatures asbeenshown.
9.1 ntroduction
Numcricalsimulationswerecarriedout ona typicalgas urbine IP compressorotor oanalysehe
convectiveeat ransfern a series f connectingotatingcavitieswith anaxial throughflow.A 2D
Axisymmctric FDmodelof the car hreediscstages nddie driveconeof aI lp compressorotordn'mwereconstructed.hecavityusedn thesimulationssshown n Figure9.1. Figure9.2shows
thepositionof therotating hermocouplesnthediscs hatwereusedn theengineest.As in the
previous hapter, onventional FDwasusednitially. whichassumedheflow to bestc3dy,
compressiblend urbulent.Theenhancedmixingmodelusing heFLUENT UDFwas henSPPlicd-hethreecompressoriscswcrcmodelledwithin FLUENTusing heconjugate eating
$Olvcr. y usingconjugate eatinghedisctemperaturesouldbecalculated. hedisc emperatures
prcdictcd y theCFDmodelswerecomparedo themmurcd thermocouplecmpcraturcs.
91 Descriptionof the EngineTest
Incontrasto theSussexMCRB2, hegeometry f theengine III compressorotor smuch11nore
complex,with the ntcr-disccavitieshavingvaryingshroud iameters nddiffering discbore adiiforeachof the hreediscstages. lso theLPshaftdiameter ariesalong he engthof compressor.
210

7/28/2019 Chew Packwood N Turner
http://slidepdf.com/reader/full/chew-packwood-n-turner 233/343
Alm) di flerent tot lie M UR 112,1 ie compressor rotor rear dri ve cone cavity was mmicl led I'lic
9COMCIryofthe rear stages ofthe engine I III compressor is shown in Figurc 1) 1 In the diagram the
dirrictisions for cavity number 3 are given. The outer radius thc cavity (h) was I 73.9mm. the inticr
radius of disc 4 bore (a) was 80.5min (a/b 0.46) and disc ca% ty %pacing (s) %%-a%9 Xmm (%,
0.29). The 1-1)%hall (rj rotates in the same direction as the IIP rotor but at 0.9 ofilic IIP rotor speed
and had a radius ot'52.15iiiiii. giving in annular gap of 28.35inni. at thc disc 4 localion. I'lic airflow
axially through the compressor was predicted from a sccondary air vy%tcrn modcl offlic criginc 1cm.
Thc material of'the I IP compressor rotor was titanium. whilst the 1 1)%haft matcrial %%astccl.
Tompcrature measurcinenis were obtained from 49 rotating (licnii, wouples connected to thc 1hrCC
rotor discs and drive cone. Figure 9.2 shows the 24 locations ofthe 1hcnmx: ouplc% %%th two
thcrITIOCOuPlespositioned at each location. The thet-niocoupic% werc lahellcd a%%16214 (on the
Cavity I shroud) through to M6229 (on the curvic coupling). Fwo ncar %icady statc maximum I
rotor %pecdtests points. taken from an acceleration deccimmon irarimcni icst cycic h.i%c hccii
%imulatcd.
L%%*Il
1-1ý1n-id
% IIP ( comprrsaforRolor (Hror mor")
I INOff $me
ll, t- ( ,n, ( . %. ,
Pov~v 4kilki
-6ý -
1-11 hall
Figure 9.1 HP compressor rotor drum (rear %tage%) conidn.
I
211

7/28/2019 Chew Packwood N Turner
http://slidepdf.com/reader/full/chew-packwood-n-turner 234/343
FT"P,--,. &% urbine oir ( omprr%mr ihom (meet %tow"i
I
. 4.111
064
lp ý
HXure 9.2 IIP compressor (rear stages) - shiming the imiliom tol' he lhvrm(woup1v-. for the
rogine fell.
9.3 Test Ileal Transfer Measurements
Ibc heat Iransfer through (lie cavity shrouds was estimated using the 1cinpuaturc% oblamcd from
the thcrinocouples on the cavity shrouds and by using the predicted icinpcraturc% from the ouNdc
surfaceofthe shroud obtained froin the 'hest-inatchcd' SC03 thmnal analv%i% uidcl ofilic 111'
compressor rotor. The cavity shroud heat transf'cr was then calculated in the %aincway a% n the
Pirrviouschapter, using following equations.
flux.
F==TNF-.
q,.bln(1),
h)
(91)
Dlb theouter diameterofthe compressor otor. 1) s the cavity shroudradius. k_, mthe thermal
Mkluclivlty of the metal, titanium. and(T..,.,,
- 7'.,._
)is the difference in the metal temperature
Scrusshecompressor otor shroudthickness. t is ofnolc that thecalculatedheat fluxc%u%ing
k(T, i__. )
212

7/28/2019 Chew Packwood N Turner
http://slidepdf.com/reader/full/chew-packwood-n-turner 235/343
r-
Lquation.1comparedwell with theSC03 hermalmodel esults.
7becavityshroudheat ransfer, saNusschnumber.wascalculateds ollows,
Nurw ,dk1lT..... - T,r
hcrc TS= Tjj, +fll(b2 -A
2Cp
f) isthecompressorotor speed ndT,.wis theair inlettemperatureo the est ig.
(9.2)
(9.3)
9.4Numerical Investigation of Convection In a 21) Axisymnictric 111,Compressor Rotor
Drum %I(hAxial Throughflow.
9.4.1Basicmodelling assumptionsand the numerical procedure
All he omputationsarriedout solve
heconservationquations
ormass,momentum
ndenergy
usingheFLUENTCFDcode.TheCFDcalculationswereperformed ssumingD axisymmctric
compressible,teady,urbulent low,using hestandard -cand he2-laycrk-C W nearwall
twbuicnccmodels. heFLUENTsegregatedolver,second rder mplicit timestepping ndwith
thesecondrderupwindscheme sedor thespatialdiscrctisation erechosenor thecalculltions,
The lowwassolvedn therelativevelocity crcrcncemnle.The Presto cheme, second rder
Mssurccorrectionmethodwasset orpressurenterpolationor tile velocity.Fortilepressure
couplingmethodprcssurc-corrcction),heSIMPLEalgorithmwaschosen. ll thesimulationswerePerformedsingdoubleprecision ccuracy. oth hestandardluid properties f air and ile
M'ICTi3l roperties f the ip compressor erespecifiedasrunctions f temperature.
Figure .3showsheCFDmesh onstructedor the nternalcavitiesanddiscsof thercarsection r
the IPcompressorotordrum.The otalmesh ize or thissimulationwas$3,800qu3drilatcml
cells,72,200luid cellsand11,600 ells or thesoliddomainorthc three otordiscs.hleshspacing
expandsway romeachwall withan expansionatioof approximately. I. Temperaturerofilcsforthecompressorallswereobtainedromthe best-matchcd'SC03hermalanalysis f the IP
compressorngineest.TemperaturesereappliedasCFDboundary onditionso all thewalls
213

7/28/2019 Chew Packwood N Turner
http://slidepdf.com/reader/full/chew-packwood-n-turner 236/343
surroundingthe compressor apart from the three discs where tile conjugate heating solution was
applied.Predicted inetal temperatures for tile disc rinis were also applied as conjugate heating
boundaryconditions. A inass flow boundary condition was applied to each ofthe inlels and a %tatic
pressureapplied to tile two outlets. As tile CFD model was axisymnictric the R3 I inlet rotaling
holeswere modelled as a circumferential slit with the equivalent area oftlic 90 l(mini discreic
1101CS.wo near steady state niaxinlurn rotor speed test conditions were analvscd. These were at
1071,16NI.and I 00%NI-, 1.11compressor rotor speed condition%. For the flo%knlet. R.1 an estimate
of the anlount of'swirl was niade I'M each of the two test conditions. %%ich was approximalciv 600,6
thecircumferential velocity ofthe rotor. This swirl was estimated froin (tic ratio oftlic flow
residence imes ofthe holes. the time for the flow to pass through tile hole to tile rotational passing
time ofthe hole. Forthe
flowthrough tile
frontcurvic coupling. inlet
R91). ullrotor SIVcd Was
assumed.As can be seen in Figure 9.3, for the outlet at right hand side ot'thc geometry. the mesh
wasextendedbeyond the curvic coupling. This extension was included %o flat tile outlet %kouldnot
haveany influence on the flow under tile curvic coupling. The IT shall rotates at approximately 0.9
of the speedofthe 111)compressor rotor and in the same direction. A turbulent intensity of' 10"oand
the hydraulic diameter was specified to estimate the level ofturbulence in tile llo%k or tile Iwo
Inlets. Table 9.1 gives the boundary conditions and the flow parameters, rolalional. Re, and axial
Reynolds number, Re. and Orashot'numbers. Gr, for each of the test conditions. The Kilt and nuts
through the front CUrvic coupling (see tile area within tile dashed line in Figure 19.1 have not been
modelled in this current analysis.
ýPrcscrib d Metal Teinneraturcs on the 1111 olor
II PrescribedMetal FenilwFatilicsof, dic IP Sho'll llrr%,%urr hitlet
Figure 9.3 CFD mesh and geometry of the rear section of it IfP compre%,or rotor drum.
214

7/28/2019 Chew Packwood N Turner
http://slidepdf.com/reader/full/chew-packwood-n-turner 237/343
Table9.1Engine IP compressor otor MaxisymmetrICCIFI) A th theenhancedmixingmodel cavity3 temperaturesand shroudsurfaceheattransfer.
Case I(W%Nl, 107%Nl,
n(NJ NQ (RPM) 15142/13U)915519/14543
Nf- (Kg/s) 0.23915 0.25163
Po (Pa) 213969 224421
Re1_-!
ýPWdVp 4.457r; -4.538r.
REj=nb2/jt 2.5(AE6 2.5791'6
Ro- W/af) 0.111 0.113
soo f)2PATb(s/2)3/v2i 5.35HE9 5.824E.9
Bocoo Ro/(PAT)-s 0.205 0.201
AxialThroughflowRd. Total TemperatureK) 439 - 449ShroudMctalTcmpcratureK) (AV) 631
CavityFluidTcmpcraturcK) 509 531
Shroudicat Transfcr DcviationCFD o ExperimcnMermal Prediction)
EXPcfimcntTlicmial Prcdiction4 (Wnf2) 31140 34230
CFD21)Axisymmciric 4 (Wm'2) 31620
J+2
36570
(+7%)-
CFDderivedNusscitNumbcr,Nuh 151.7 153.7
CFDdcrivcdNu.h Rc..3 1.3 1E4 1.357134
AlodIfIcdA-swith W laver nearwall model A-1300n-0.1)
9.4.2Thegoverning equations
Tbe2D axisymmctric CFD model calculationswere performed usinga rotating reference rame.the
steadycompressible urbulent flow equations or conservationof mass,momentumand cncrgYwere
asgivenby equations n Chapter 8, Equation8.4,8.6 and 8.7, respectively.
9.4.3Enhancedmixing model
Theenhancedmixing model FLUENT UserDefincd Function (UDF) methodology formulated and
describedn Chapter7, hasagainbeenappliedto the CFD of the engineIIP compressor otor with
Axialthroughflow.The final version of theUDF codewasdescribed n Section 7.4 andhow to link
21S

7/28/2019 Chew Packwood N Turner
http://slidepdf.com/reader/full/chew-packwood-n-turner 238/343
anduse heUDFwithin theCFDsimulationswasdescribedn Section .5andAppendix6.The
enhanced ixingmodelUDFparameter alueswcrc,4 - 1300andn-0.1 -Thesameunction
"I- cos(,S/21)'wasusedwith a thickness f theDL4YER et o 0.005mandconstant roperty
13yer,I,7)-Con,ext o thewall set o a thickness f 0.002m.Although hesame alueof A usedn
thesimulations f SussexMCR-B2wasusedhe luid viscosityusedn thecalculation f the ocal
Rayleighnumberwasaltered romthestandardemperaturearyingviscosity alue o theenhanced
mixingvalue.This has hecffcct of reducinghe ocal Rayleighnumber ndhencereducinghe
enhanced ixingfactor.Figure9.4showsheregionswhere heenhanced ixinghadasignificant
CffCcL hecavityfluid temperaturehatwasusedn the ocalGrashof umberEquation7.26)and
in theheat lux (Equation7.28)calculationswhichwas henusedocalculatehe ocalnearwall
factor. (Equation .28) or theshroudwall)was akenatapositionof 85%of thecavityshroud
radius.To overcome tabilityandconvergenceroblemsn thesolution heundcr-rclaxationactor,
Urf.set o0.1.wasapplied o factored luid properties nd10passesf smoothingnsmoofh)was
alsoappliedacross achof theCFJDmesh ellswithin thecomputationalluid domain.Also to help
with thestabilityof theheat ransfernear hecavityshrouds moothing f the ocalnearwall factors
hasbeenapplied.
9.5NumericalSimulation Results
Table9.1 summariscshe cavity 3 shroudhcattransferresults,comparingtheconjugateheating,
enhancedmixing model resultswith thecalculated icat transfer from theexperiments or the two
engine estconditions.The tableshows hat theheattransferresultsfrom the2D axisymmctric
enhancedmixing model comparcwell with theexperimentalvalues(from the 'best matched' SC03
thermalmodel) for all the tests,with largesterror bcing7% for 1000/*NL/ 107%NLIcst condition.
9.5.1 Flow structure and temperature results
Figure9.4 showsa contour plot of strcarn unction for the steadystate107%NLtestcondition
showingthat with theapplication of theenhancedmixing modela centralcore was formed in each
cavity. In theregionof the disc cobstheplot shows hat the axial throughflow wasthedominant
flow feature.Figure9.5 showsa contour plot of the mixing factor, formcd by theenhancedmixing
model.The mixing factor plot clearly showsregionswhere the flow is buoyancydominatedand
216

7/28/2019 Chew Packwood N Turner
http://slidepdf.com/reader/full/chew-packwood-n-turner 239/343
enhancedmixing hasbeenapplied. In tile disc bore regions where tile axial throughtlow is
dominanttheplot showsthat no enhancedmixing was applied. The mIxIng faclor plot %hows
rippling effect in tile outer radial regionsof'the ca%fies. This is relatedto tile stabilily problem 111.11
waspresentli
tileMitial s111,111ý1tionsfthe
SussexMCR132.eported in
ChapterS.and
has
reappearedII tile enginesimulations.The stability problemsencounleredwith Stjs%c\%1('Rwere
rc.wlved by introducing multiple smoothing oftlic flow field flind properties augmented i%cosily
andthenrialconductivity), this was achievedby repeatninning of'the snux)Ihingalgorithm at each
itcration. I owever, evenwith InUltiple smoodungapplied to tile fluid propertiesfor tile engine
simulations he instability ol'the solution could not be flully resolved.As the in%tabilttýc\i-..,%.n
local regionsaway 1rom he cavity gastemperaturesampling rk)si ion used n tile ci% t\ .hroud lical
transfercalculation,tile beattranster into thecavitieswasnot directly aflectcd. llo\%ever he level
of mixing within file cavities illay beafTected y tile instabilities and hence ile ca\ itý iemperal ire',
Illay alsobe'11,1ccted.
Shroud I leat Flux Nal.Convilon/ Plate CorTcl
Nti 0.14 Ra" '" Chara. 1, gap,2AF *1',AI'm-,
Rcgion of Enhamcd Mixing
Fn(A Ra" ) with A- I YX) n
Ra- fn (di-,, r). Cham I t,
Figure 9.4 Engine fill compressor of sleady %tale 107%Nl, - conlours of %tremillfunction with enhanced mixing.
217
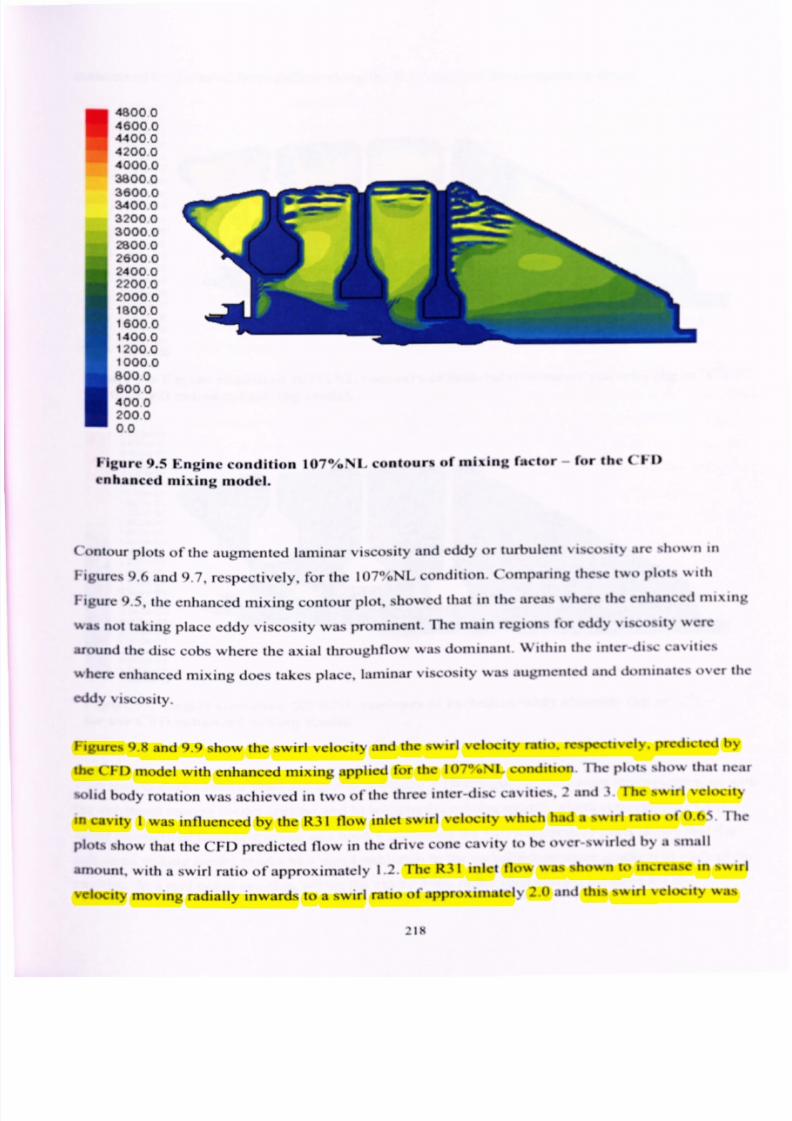
7/28/2019 Chew Packwood N Turner
http://slidepdf.com/reader/full/chew-packwood-n-turner 240/343
I
48000
46000
44000
42000
40000
38000
36000
34000
32000
30000
28000
26000
24000
22000
20000
18000
1600014000
1200 0
10000
8000
6000
4000
2000
00
Fi&,.ure 9.5 Engine condition 107%Nl, contour% of inking factor for the (11)
enhanced mixing Illodel.
Contour plots ofthe augmented laininar viscosity and eddy or turbulcnt viscosity arc shown in
Figures 9.6 and 9,7, respectively. for the 107"oNL condition. Comparing thc%.c two Plot%wIth
Figurc 9.5, the enhanced mixing coniour plot. showed that in the arcas whcrc the crillariccid mixing
was not taking place eddy viscosity was prominent. The main rcgions for eddy viscosity wcrc
around the disc cobs where the axial throughtlow was dominant. Within the micr-disc C. % 11C%
wherc enhanced mixing does takes place. laininar viscosity was augnicntcd and dommatc%over thc
oddy viscosity.
Figures 9.Mand 9.9 show tile swirl velocity and the swirl velocity ratio. rc%rwdi%CIN. predicted by
the UFD model with enhanced mixing Ipplicd for the 107"oNi. condition. The pit)(%show that near
m)hd body rotation was achieved in two ofthc three Inier-disc cavities. 2 and 3. TbC %%,irl velocity
in cavity I was influenced by tile R31 flow jillet swirl velocity which had a %wirl ratio of 0.0 File
ploLsshow that the CIA) predicted flow in tile drive cone c.1vity to he ovcr-swirled by a --mail
amount, with a swirl ratio ol'approximately 1.2. The R31 illici flow was %ho%no increase in swirl
velocity moving radially inwards to a swirl ratio ol'approxinuitely 2.0 and this %%kirlelocity was
218
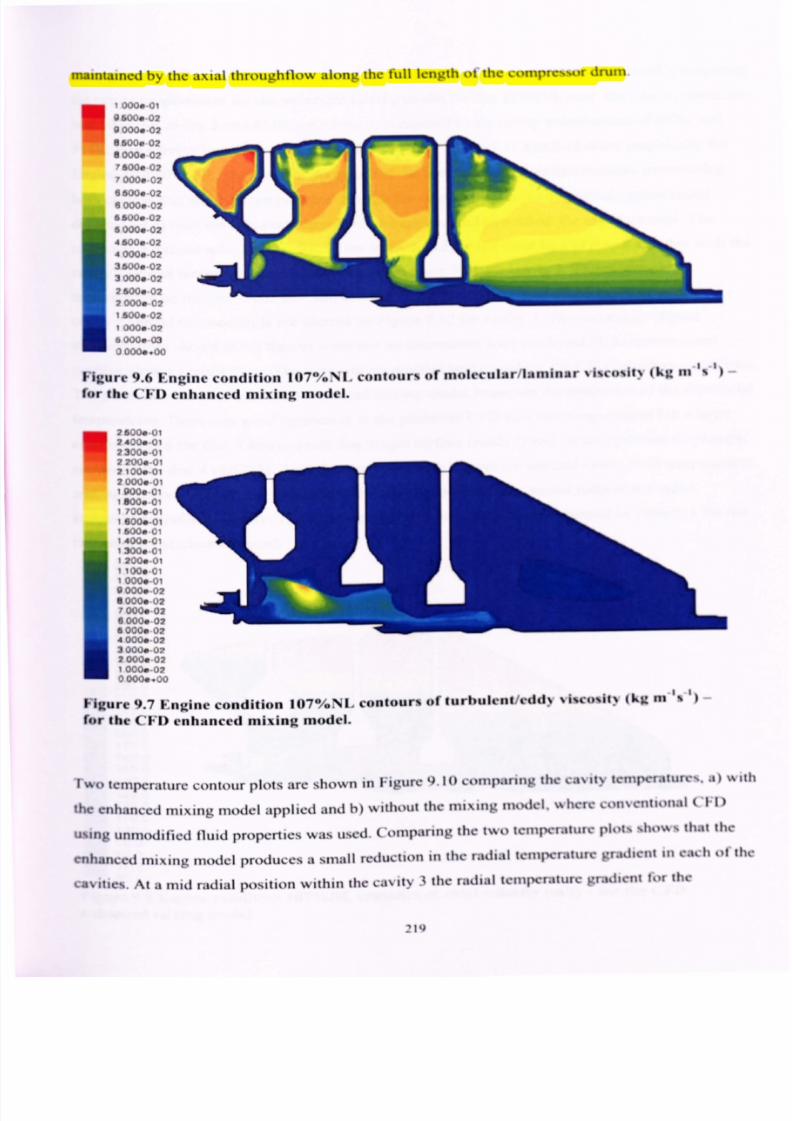
7/28/2019 Chew Packwood N Turner
http://slidepdf.com/reader/full/chew-packwood-n-turner 241/343
maintained by the axial throught'low along the full length of the comprc%%or ruin
0 10000-0196W4 02
9 OWO 02
oboog 02
0 WO@
0:7 6000 0: ) Z
70me 07
65000 02
8000907
66000 02
6000902
4600002
40009 07
36009 02
30000 02
28000 02
70000 02
, 6000 02
1 fflos 07
e,o000 03
) ü000.00
Figure 9.6 Engine condition 107%Nl. contour% of molecular/lantinar %%co-.l) (kg m1%
for the CFD enhanced mixing model.
26000 ol
24009.01
23000 01
2200001
21000 01
20006 01
1 PWO 0118000 01
1 7000 ül
16000 oi
16000 (, ,14009 Gi
13000 ci
1 2000 01
1 1()00 C,
1 0000 ei90000 (.7
80000 ("21000407
60000 02
a 0000 0?
40006 02
30000 02
70000 o2
1 0000 07
00000. co
Figure 9.7 Engine condition 107%NT contours (of furbulent/rd(lý %wmilý (kU ns
for the CFD enhanced mixing model.
I)
'I wo temperature contour plots are shown in Figure 9.10 comparing the ca%ty IC11111craturcs.) %%
theenhanced mixing model applied and
b) without the mixing n1micl. %%hereonventional (T-D
using unmodified fluid properties was used. Comparing the two teiiipcraturc plots %ho%%hat the
enhanced mixing 111odel roduces a small reduction in the radial tciiipcraturc gradient in cacti of'thc
csvltics. At a inid radial position within the cavity 3 the radial tcniperaturc gradient for the
219
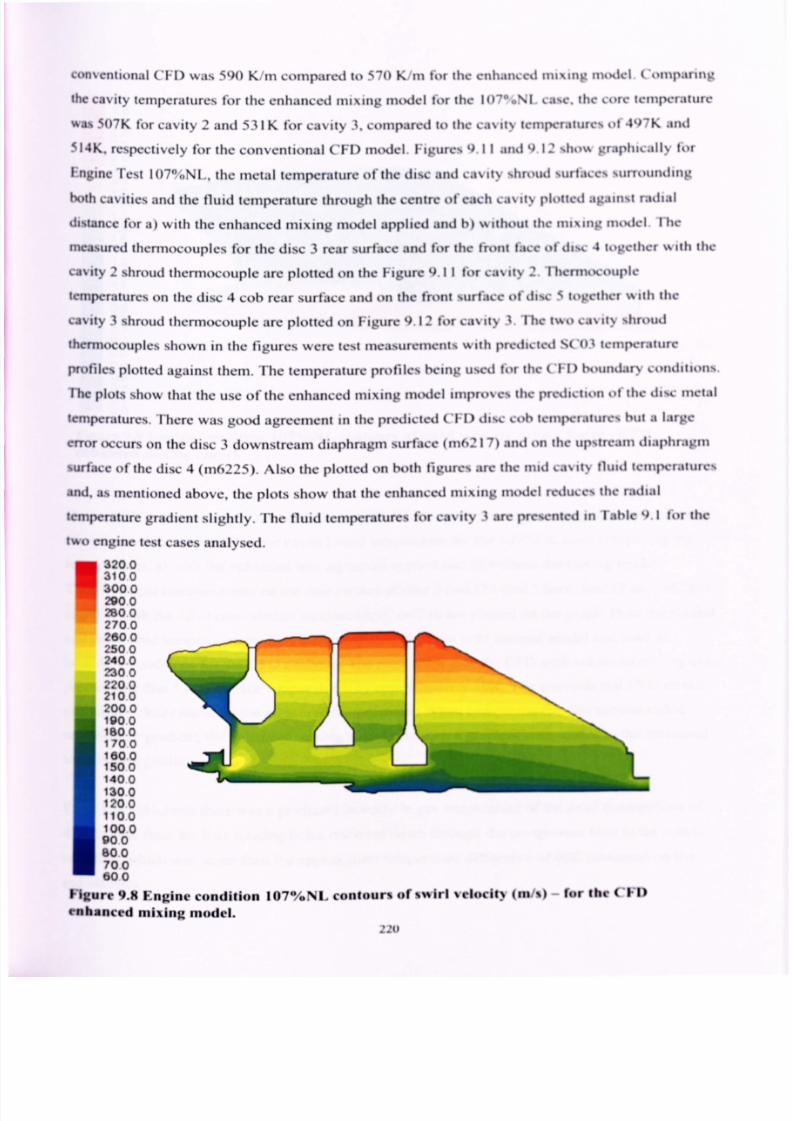
7/28/2019 Chew Packwood N Turner
http://slidepdf.com/reader/full/chew-packwood-n-turner 242/343
conventional (TI) was 590 K/in compared to 570 K'in t.or the enhanced inixing model. Comparing
the cavity temperatures flor the enhanced inixing niodel for the 107'. Nl. case. the core Icniperalurc
was 507K flor cavity 2 and 531 K flor ca%,iy 3, compared to the ca% ty temperatures of 497K and
514K. respect I vely flor the convcntlona I CFD inodel. Figures 9.11 and 9.12 show graphically for
Engine'rest 107"oNl., the inetal temperature ofthe disc and cavity shroud %urfaccs surrounding
both cavities and the fluid temperature through the ccnirc of each ca% ty plotted against radial
distance flora) with the enhanced mixing model applied and b) %%thout the mixing model. The
mewsurcd thermocouples l'or the disc 3 rear surl'acc and f*()r the front I'acc of di%c 4 together %%th the
cavity 2 shroud thermocouple are plotted on the Figure 9.11 for cavity 2. Thcnnocouplc
temperatures on the disc 4 cob rear surtace and on the front surface of disc 5 together A ah the
cavity 3 shroud 1herinocouple are plotted on Figure 9.12 for cavity 3. The two cavity shroud
thermocouples shown in the figures were test measurements with predicted SC03 temperature
profiles plotted against thein. The temperature profiles being used for the ('I. D boundary conditions.
The plots show that the use ol'the enhanced inixing model improves the prediction of'thc disc inctal
temperatures. There was good agreement in the predicted CFD disc cob temperature% but a large
error occurs on the disc 3 downstream diaphragm surface (in621 7) and on the upstream diaphragm
surface of'the disc 4 On6225). Also the plotted on both figures arc the mid cavity fluid temperatures
and. as mentioned above, the plots show that the enhanced mixing model reduce% the radial
temperature gradient slightly. The fluid temperatures for cavity 3 arc presented inTabic 1).1 for the
two engine test cases analysed.
3200310030002900MO 02700260025002400MO 0
220021002000190018001700160015001400130012001100
. 000noo
100
1
:00boo
Figure 9.8 Engine condition 107%Nl. confours of %wirl veltwit) (m/%) for the CFD
enhanced mixing model.2
-1)

7/28/2019 Chew Packwood N Turner
http://slidepdf.com/reader/full/chew-packwood-n-turner 243/343
765
4i3
I
Zd212019181710151413121110090807
06050403020100
Figure 9.9 Engine condition 107%. N 1. contours of s-A rl . elocil, * ratio for I he ('1- 1)
enhanced mixing model.
Figure 9.13 shows the disc 5 rear surface anti 1111 rive cone temperatures along %%ithhe mid cavi Iy
(line drawn diagonally across the cavity) fluid temperature for the 107'oN[. case. comparing the
temperatures. a) with the enhanced mixing niMel applied and h) without the mixing rnMel.
Tllcrm()coIjplemeasurements on the rear surface of'disc 5 (rn6230 disc 5 bore. m6232 and in6233)
together with the drive cone shroud thermocouple, m6236 arc plotted on the graph. lIoth the shroud
and drive cone temperature profiles were predicted from thc. %-L,3 thermal m(Xicl and used as
boundaryconditions for the CIA) analyses. The plots show that the CFD with enhanced mixing over
PrcdicLs the disc 5 rear surl'ace temperatures by approximately I OK. The conventional CFD nuxicl
Produces a closer match to the measured tempera ttires. When comparing the dim. surface radial
temperature gradient. the enhanced mixing model proKitices a gradient comparable to the mcasuml
tempcraturc gradient.
From CFD solutions there was a predicted increase in gas iemperalurC ofthc amil 1hroughtlOWOf
45K to 50K froin the R31 rotating holes rearward down through the comprc%u.r Ix)rc to the curvic
coupling. which was lower than the approximate temperature difYcrcticc ofWK mcasurcd on thc
enginc tests.
221

7/28/2019 Chew Packwood N Turner
http://slidepdf.com/reader/full/chew-packwood-n-turner 244/343
Figures9.14and9.15 compares he CFD predicteddisc metal temperatures, IPC discs 3,4 and5.
for thenearsteadystate107%NL condition, with andwithout the enhancedmixing model being
used, espectively.For the enhancedmixing model solution the predicteddisc temperatureswere
within 21K or anerror of 16%wherecrror - (Prcd-Nicasy(Tdiscrim-Tinlet) compared o 28K. a
21% error for theconventionalCFD. Also for comparison hecrror in SC03thermalanalysis
predicted emperaturesarcgiven using the sameerror criteria. '17heigure shows hat for tile
n*ajorityof thedisc temperatureshe CFD with enhancedmixing predictionswere lessaccurate
than hethermalanalysispredictions.The averageerror for theCFD predicted emperatureswas
7.7%compared o 3.3% for the thermal analysispredictions.I fencetherewasno improvement n
thepredictionof thedisc temperaturesusing theenhancedmixing CFD model compared o theSC03 hermalmodelpredictions.CFD enhancedmixing model predicteddisc temperaturesor tile
nearsteadystate100%NL condition arc shownin Figure9.16.There was a small improvement n
theCFD predicteddisc temperatures or the 100%NLcasecompared o the 107%NLcasewith the
largestpercentage rror being 14% (18K).
9.5.21ent transferresufts
Table9.1summariscshecavity3 shroudheat ransrcresults, omparingheconjugate eating.2D
axisymmctric nhanced ixingmodelCFDresultswith thecalculated eat ransfer rorn he
experimentsorthe woengineests.Thetableshowshat heheat ransreresultsrom he2D
'XiSymmetricnhanced ixingmodelcomparewell with thecxpcrimcnt3i aluesor bothengine
tests,with anerrorof 7%for the 107%NLestandan erroror2% rortheMOM test.
Figure8.37andFigure8.38 n Chapter8showed raphs f cavityshroudicattransrcr lotted
againstGrashofnumber,Grandagainst uoyancy umber,Do for (lieSussexNICIL t is interesting
tonote hat orbothengineestconditionshecavity3 shroudheat ransferNusscltnumbers,
derivedromCFD, ieontheGrashornumbcrurvespread f datapointsproducedor tileSussex
MCIL Also forbothconditionshebuoyancy umberwasvery ow andhcnce ying in tile
buoyancy ominantregime.The CFDderived,Nuh/ Re, ) valuesarehighandagainie within the
curve it spread f datapointsproducedor theSussexNICR.
222

7/28/2019 Chew Packwood N Turner
http://slidepdf.com/reader/full/chew-packwood-n-turner 245/343
II
690068006700
66006500
6400
630062006100
6000
59005900
5700560055005400
53005200510050004900
480047004600
4500
440,0430.0
69006800670066006500
640063006200610060005900
5800570056005500
54005300520051005000
4900480047004600
450,044004300
a) With (he Enhanced Mixing Model
Mi=
b) Without the Enhanced Mixing Model
Figure 9.14)Engine test condition 107%Nl, temperature contours (K) for 2) 'Aith and h)
without the enhanced mixing model.
223

7/28/2019 Chew Packwood N Turner
http://slidepdf.com/reader/full/chew-packwood-n-turner 246/343
a)
620
$Do
aw i
480
M
440 ý
004
620
9
Engine HPC Cavity 2 (Disc 3 and 4 Cavity) - Steady State Man Cond IOT%W
Enhanced Mixing CFO k-e Modell
- Cavity 2 Shroud
- Disc 3 Downstream
- Disc 3 Cob Downstream
-Disc 4 Upstream
- Disc 4 Cob Upstream
- Cavity 2 Contra Line
- Disc 3 Bare Centre Line
- Disc 4 Bore Centre Line
* Cavity 2 Shroud Measured
* Disc 3 Dwn Sirm Measured
* Disc.4 Up Sinn Monsufod
b)
006 0,06 01 012RO" Coordkum (-)
014
Engine HPC Cavity 2 (Disc 3 and 4 Cavity) - Steady 840101111811Ond 10?0^4t
Conventloctal CFO k-0 Model
am CavNy2 Shroud
Disc 3 Downstream
580Disc 3 Cob Downstream
Disc4 UpstreamDisc 4 Cob Upstream
5W i- Cavity 2 Centre Line
- Disc 3 Bore Centro Line
- Mar, 4 R- r-w- I. -
Cainty 2 Shroud Measured
Disc 3 Dwn SIrm MeasuredVO Disc 4 Up Sirm Measured
6.
Soo
4au
4w i
004 006
00
006 ol 012
Radial Coordkwft (-I
e
014
le
016
Hgure 9.11 Engine test 107%NLcavity
2 temperatures for a) %ith and h) mAithoutthe
enhanced mixing model.
In
Ole
224

7/28/2019 Chew Packwood N Turner
http://slidepdf.com/reader/full/chew-packwood-n-turner 247/343
Engine HPC Cavity 3 (Disc 4 and 5 Cavity) - Steady State MEN CAWW10r%W
Enhanced Mixing CFO k-e Model
ow
640
Wo
ow
580
Sao
540
5A
5001
4440 ,
004
ow
640
- Cavity 3 Shroud
- Disc 4 DownstreamDi%(:4 Cob Downstream
D,,., 5 Upstream
- Disc 5 Cob Upstream
- Cavity 3 Contra Line
- 0116c; Bore Centre Line
- Disc 5 Bore Centre Line
* Cavity 3 Shroud Measured
* Disc 4 Dwn Sinn Measured
is Disc 5 Up Sinn Measured
h)
006 008 () 1 012
Radial CoordIns" 0")
014
Engine HPC Cavity 3 (Disc 4 and 5 Cavity) - StesdY 311810kl8m Cand 10? %ML
CA)nvervtkmW CFO k-e M04W
Cavity 3 Shroud
Disc 4 Downstream
Disc 4 Cob Downstream
-Disc 5 Upstream600
DISC5 Cob Upstream
S@DCavity 3 Contra Line
Disc 4 Ekxe Centre Line
Disc 5 Bore Centre Line
0 Cavity 3 Shroud Measured
540, Disc 4 Dwn Strm Measuf,
I
Dtac 5 Up Strm Measured
6.Wý
&W
400
004
aS
006 000 01 0 12Radid Coordkuft Im)
014
() 16
() la
Figure 9.12 Engine test 107%Nl, cavity 3 fernperatum for a) %ith and b) 'Aithout the
enhanced mixing model.
ký.
- ýý 4 Lmn ýtrm measufou
s utac ") up z)trm measurna
all
aI$
225

7/28/2019 Chew Packwood N Turner
http://slidepdf.com/reader/full/chew-packwood-n-turner 248/343
8) Engine HPC Drive Cone Cavity (Disc 5 and Drive Cone Cavity) - Steady State Man Cond 107%NL
Enhanced Mixing CIFID -e Model
7(w
Goo
660640
Drive Cone Cavity Shroud
- Disc 5 Downstream
- Disc 5 Cob Downstream
- Drive Cone
- Drive Cone Cavity Centre Line
620
g 600
560560
540
520
Soo
480
4410
- Disc 5 Bore Contra Line
* Drv Cons Cavity Shmud
* Disc 5 Dwn Strm Messumd
440 1
004
?00
aw I
640
GN
gem56D
sw
sw
sm
900
400
006 008 01 v I.,
Radial Coordinals (m)
14 0 16
Engine HPC Drive Cone Cavity (Disc 5 and Drive Cone C&v*Y) * Steady $tml* ill" Cond 107"t
Conventional CFD k-o Model
Drive Cons Cavity Shroud
DISC5 Downstream
Disc 5 Cob Downstream
Drive Cone
Drive Cone Cavity Centre Line
Disc 5 Bore Centre Line
* Drv Cone Cavity Messurod
* Disc. S Dwn St" Monmewl
ols
Ole
Filture 9.13 Engine test 107%Nl, drive cone cavity lemperature% for a) 'Aith and h) -Ailhoul
the enhanced mixing model.
226

7/28/2019 Chew Packwood N Turner
http://slidepdf.com/reader/full/chew-packwood-n-turner 249/343
IN.I-
IN.. I lOIn.
tIn - '4').
K
114
. 6216
kil WN R.4. -j, 1,. p11. - 410k
" II
-I II,
U.
Figure 9.14 Engine test 107%Nl, IIII(Aisc temperatures (conjugate heating %oluflon) - %ilhthe enhanced mixing, model.
J--
116.1 som1. - %4qk
I/
(
I ýMG21610,--
*" 2)
hdo Mo. Alt lrmprr Iwo",- 418k
4 '.
41W
4
-
I. "
. 4%
4-1
(. 221
too.
so25
1. - "Ok 41sk
Ift. 4
4!!ri4&1
4*1
416
(-Ito
4149,
oil
r-ýk4
9711
"S'a
I in. -
f7U
0!0710
4dL723
I."' J
'SI
/\
Figure 9.15 Engine test 107%Nl, IIP('disc lemperatures (conjugate healing %olution) -without the enhanced mixing model.
(2II'll
dis2i/ (. 22)
17-
--
I
4ý 71 I It)t'a. kd 1. P, k.
-jID I", I. -I M, ., ýI,,, I ý.
glek1. -4W&
47--ý771
1. - t64h
2-1
. 42220
I*I=
1"""'
227

7/28/2019 Chew Packwood N Turner
http://slidepdf.com/reader/full/chew-packwood-n-turner 250/343
41
(II
riI IWO
,4. lu, I-P
11. - 422k
I 'I
I., )
I. r., e.
SI, .... d
II)P.. 4 M.... d I. pcfl
II-r.. I '4 I...
F----71 to
Figure 9.16Engine test 100%N1. IIPC disc temperatures
(conjugate heating%olution) - %,iththe enhanced mixing model.
9.6 Conclusions
Numerical siniulat ions have been carried out on a typical gas Iurbi Ile 111) oniprc%%ort) ana ý%c ie
III axionvective heat transfer in a rotating cavity with ax'al through1lo%.
Fhe 21) *svinmctric
m(xiclling technique using the enhanced mixing model to increase (he mixing in the central core of*
a rotating cavity has been used. The computations were pcrf*()nned assuming steady flow and the
rcsults have been compared with the engine test measurements for metal temperatures. I'lic
simulations were performed on the three rear compressor disc stages that formed three inter-
connecting inter-disc cavities, which was also linked to the I IP comprcs.m)r drive shatl cone cavity.
The three compressor discs were modelled and conjugate heating solutions wcrc ob(amcd from the
combined CIA) simulations. Two near steady state maximum operating conditions wcrc chown for
the simulations.
.1y using the enhanced mixing model good agreement with Icst values l'br the cavity shmud %tjrf*, c
hcat transfer has heen shown for rotat ing Rayleigh numbers ofthe ordcr 10". Both cnginc Icst
. ý. 11
ý.4-7)
f-- I
4-
I'
---I
.ý .11;
228
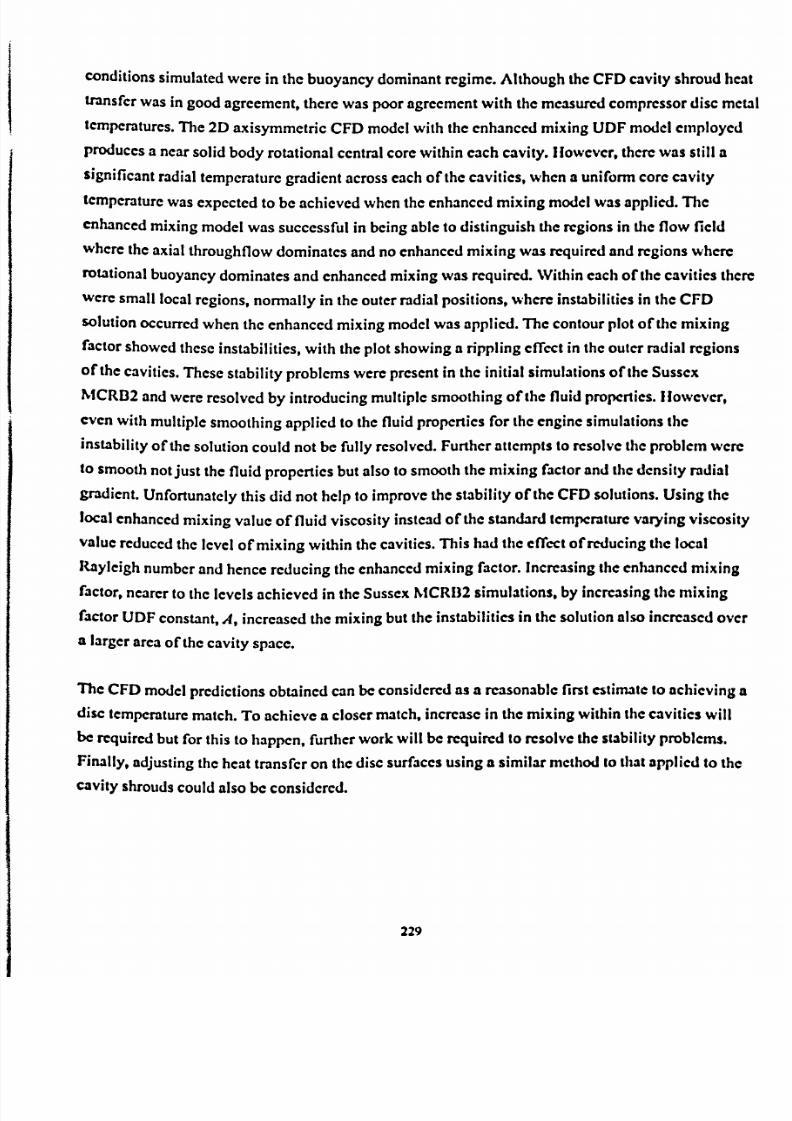
7/28/2019 Chew Packwood N Turner
http://slidepdf.com/reader/full/chew-packwood-n-turner 251/343
conditions imulatedwere n thebuoyancy ominantegime.Although heCFDcavityshroudheat
transferwas n goodagreement,herewaspooragreement ith themeasuredompressoriscmetal
temperatures.he2DaxisymmctricCFDmodelwith theenhancedmixingUDFmodelemployed
Producesnearsolidbodyrotationalcentralcorewithin eachcavity.I owcvcr, herewasstill a
significantadial emperatureradientacross achof thecavities,whena uniformcorecavity
temperaturewasexpectedo beachievedwhen heenhancedmixing modelwasapplied.'lic
enhancedmixingmodelwassuccessfuln beingable o distinguishheregionsn dieflow field
where heaxial hrougliflowdominatesandno enhanced ixing was equired nd egionswhere
rotationalbuoyancy ominatesandenhancedmixingwas equired.Withineachof thecavities here
weresmall ocalregions,normally n theouter adialpositions,wherenstabilitiesn theCFD
solutionoccurredwhen heenhancedmixingmodelwasapplied.The
contourplot of themixingfactorshowedhesenstabilities,with theplotshowinga ripplingeffect n theouter adial egions
of thecavities.Thesestabilityproblemswerepresentn the nitial simulations f theSussex
MCRB2andwere esolved y introducingmultiplesmoothing f the luid properties.lowcvcr,
evenwith multiplesmoothing pplied o the luid propertiesor theengine imulationshe
instabilityof thesolutioncould notbe fully resolved. urtherattemptso resolveheproblemwere
to smooth ot ust the luid properties utalso o smoothhemixing factorand hedensityradial
gradient.Unfortunatelyhisdid nothelp o improvehestabilityof theCFDsolutions.Using helocalenhanced ixingvalueof fluid viscositynstead f thestandardemperaturearyingviscosity
value educedhe evelof mixing within thecavities.Thishad hecffcct of reducinghe ocal
Raylcighnumber ndhenceeducingheenhanced ixing factor. ncreasingheenhancedmixing
factor,nearero the evelsachievedn theSussexNICR132imulations, y increasinghemixing
factorUDFconstant, , increasedhemixingbutthe nstabilitiesn thesolutionalso ncreasedover
a largerareaof thecavityspace.
The CFD modelpredictionsobtainedcanbeconsidcrcdas a rcasonablc irst csti=tc to achieving a
disc temperaturematch.To achievea closermatch, ncrease n the mixing within thecavities will
be requiredbut for this to happen, urther work will be rcquircd to rcsolvc the stability problems.
Finally, adjustingthe heattransferon thedisc surfacesusing a similar method o thatapplied to the
cavity shroudscould also beconsidered.
229

7/28/2019 Chew Packwood N Turner
http://slidepdf.com/reader/full/chew-packwood-n-turner 252/343
CIIAPTER 10
CONCLUSIONSAND RECOMMENDATIONS FOR FURTHERWORK
10.1Conclusions
It has ongbeenestablishedhat heflow within the ntcr-disccavitiesof aI IPcompressors thrcc-
dimensionaln natureand imedcpcndcnt. o enable greaterunderstandingf thenatureorthisflow andassociatedeat ransfer, neapproachs to model heflow usingCFDrcsolving he hree-
dimensionalandunsteady ffccts. lowcvcr hisapproachcquircsa hugeamountorcomputational
memoryand ime o runtheCFDmodcls.A second pproachs to brcakdown hiscomplex low
processntoseparatehysicalmechanismsnd ntroduccapproximate utcomputationally fficient
modelsor these rocesses.hesecond pproach as aken or thisrcscarch,with theaim of
producing methodhatcanbe ncorporatedntocurrentdesignpractice.Two undcrlyingnow
mechanisms aybe dcntificd for thiscomplexlow; thefirst associated ith theflow within the
inter-disccavitiesand hesecond ssociatedith theaxialthroughflowunder hecompressorisc
bores.Bothof theselow mechanismserediscussedn thereviewof previouswork. In the nter.
disccavitiesbuoyancyn thecentripetalorce ielddominates. heaxialthroughflow esultsn a
$hear rivencirculationn the nnerpartof thecavity.
Anevaluationof the useof CFD to simulate he
flowand natural convection
ina scaledcube
has
beenpresentedKirkpatrick andBohn, 1986].Two heatingconfigurationswere considered,both
being heated rom the bottom surface.The computationswere pcrrormed assumingeither unsteady
or steady low for laminar or turbulentnow models.A range of temperaturedifference between he
hot andcold surfaces I OKto 40K) wereusedgiving a range of Rayleighnumbers,Ra- 5.83x 10⁹
to 2.33x10¹⁰. he CFD resultswerecomparedwith other worker's experimentalmeasurementsor
hc3ttransfer.flow patterns, andthe meanandfluctuating temperaturedistribution. I'lic CFD
simulationsshowedthat the time-avcragcdhcat transfercomputedby theunsteady aminar flow
model ("pscudo" DNS solution) was the mostaccurate.Calculatedheattransrerresultscompared
well with the experimentalderived hcat transrcrcorrelation at low Rayleigh number(-3% error)
with a small difference at the higher Rayleighnumber(6% to 13%error). The steady low model
230

7/28/2019 Chew Packwood N Turner
http://slidepdf.com/reader/full/chew-packwood-n-turner 253/343
assumingurbulencek-c with thek-c /W nearwall model)performedheworst.Theuseof a
turbulencemodelappearso dampdown he hermalactivity within thecavity.Comparinghe
, umerical eat ransferwith theexperimentalorrelation howedhatby refining hemeshhe
disparityetweenhenumericalesultsand heexperimentalatacorrelationAas educed-13% to
-06 error) or the200-cubcdmeshat thehigherRayleighnumber).n addition,diedifferencen
theerror n theoverallheatbalance lsoreduced nthefincr mesh.Thenumerical nalyses
compared ell with otherobservationsmade romtheexperimental ork.Thecalculated ize, he
speed f propagationnd heperiodof release f theplumesromtheheated ottomsurface f the
cubeagreedwith experiment. henumerical nalyseslsoagreedwith theexperimentalindings
that heheatedloorappearso promotemixing n thecavityandeliminatesemperature
stratification.
TheCFDsimulation f naturalconvectionn astationary eated ubewasextendedo the
modelling f convectionn a rotatingenclosed nnular ector avity.CFDsimulations f convective
beat ransferwithinascaledotatingsectorandwithinascalcd otatingannulusor theBolinct al's
(1993,1994]experimentsavebeenpresented.hecomputations ereperformed ssuming
unsteadylow and heresultscompared ith
experimentalmeasurementsndnumerical redictions
forheat ransfer ndother low ficld parameters.orthescaledotatingannulus omegood
agreementetweenheCFDresultsand heexperimentalaluesor mean urface eat ransferhas
ken shownor Rayleighnumbers f theorder1010,pproachingheRayleighnumbers ccurringn
gas urbinehighpressureompressorisccavities.For hehigherRayleighnumberan error of 4%
wasshownor the ull 360"annulusCFDmodel ising o a9%errorfor the4311nnulus ectorCFD
model. Iowevcr herearc somepoor resultsromtheCFDsimulations rthc scaled otatingsector.
At the owerRayleighnumberhedifferenceromexperimentwas 10% whilstat thehigherRayleighnumberherewasan84%difference.n a subsequentFDstudybySunct al. [20041 or
thesame eometry singbothFLUENTandaRolls-Royceode, Iydraoverarangeof Rayleigh
numberst was ound hatbothCFDcodes verpredictedhesurface eat ransfer omparedo the
experiment.heovcr-prcdictionwasabout10% o20% or theI Iydracodeandhigher or
FLUENT,40%approximately, hich s less han hat ound or thecurrcntpredictions. hereasons
for thediscrepanciesetweenheexperimentalndcurrentCFDresultsarestill to befully resolved,
butare houghto beassociated ith difficultics n numerical onvergence.heCFDresults
cOnfirmheexperimentalmeasurements,hichshowed reduced eat ransferanddifferent
Rayleighnumber ependencyor therotatingannuluswhencomparedo gr:kvity-ddvcn onvection.
231

7/28/2019 Chew Packwood N Turner
http://slidepdf.com/reader/full/chew-packwood-n-turner 254/343
Thenextpartof thestudy ookedat thesecondlow mechanism,heaxial hroughflow nder he
compressoriscboresand nteractionof thiswith the low within the nter-disc avities.A CFD
studyof the low passing ver a rectangular avity for a seriesof differingcavitydepthswas
presented.hecomputationalesultswerecompared ith experimentalmeasurementsf cavitypressurend low velocities.Thecomputationalmodclsimulatedhe lowmechanismeasonably
well for theexperiments ith air. I lowcvcrtheCFDturbulentk-C/W 2-13yermodelunder
predictedhestrength f thecirculating low within thecavity anddid notpredictcorrectlyhe
shear trength f thecross low whichdrives hecirculating low in thecavity.For heexperiments
usingwaterCFDfailed opredict hemultiplecirculationswithin thecavity.Thercasonwhy the
CFDanalysesailsto simulatehecirculations till needso be fully explained. heworkwas
consideredo be mportantbecausef theneedo know he evelsof heatandmomentumransrer
acrossheshearayer romthecross-flowo thecavity and n termsof agas urbinecompressorhe
transrcr f heatandmomentumromtheaxialthroughflowunder hedisc boreso the ntcr-disc
cavities.
To gaugehebenefitsof anew2D axisymmctricCFDmethodo model heheat ransferwithin the
compressorntcr-disccavities t wasnecessaryo performathermalanalysis sing raditionalmodellingechniquesor the hermalboundary onditionswithin thedisccavities.For his
assessmentheSussexMCRB2wasusedandatemperature atching xercise sing heRolls.
Roycehcrmo-mcchanicaliniteelement rogramSC03wasperformed.Therig simulate$ile
internalcomponentsnd low features f ahigh-pressureompressorI IPC).Threemodelswere
constructed,he irstbeingadatummodelusingconventionalhermalboundaryonditions.A
secondmodel hatusesheboundary onditionsromthedatumbutreplacesheconventional eat
transfer ocflicicntcorrelation pplied o thediscsurfaceswith a-conecorrelation,CONH"which
wasderivedatSussex y Alcxiou (2000],using estmeasurements.he hirdmodels the"best.
matched'model o the hermocouplemeasurements.achmodelwas unthroughhesamedle to
maximum peed cccicration-dcccicrationycle.Resultsromthe best-matched'modelgave
temperatureifferenceerrorsof less han5K bothat steady tateconditionandduring he
accelerationransient.lowcvcr,an errorof 5K issignificant or therig cycleas herewasonlya
30Kradial emperatureifferencebetweenhediscrim and hecob andonly a50Ktemperature
difference etweenhehotmetal ntcr-disccavityshroudand hecooleraxial hroughnow ir atdie
Maximum peed ondition.Thereforehe5K errorrelates, sa percentagef the cnapenturc
between ieshroudandaxialthrougliflowgas,o a7%error at thesteady tatemaximum peed
conditionanda 12%errorduring heacceleration.his s a significanterrorwhenconsideringhe

7/28/2019 Chew Packwood N Turner
http://slidepdf.com/reader/full/chew-packwood-n-turner 255/343
larger temperaturesoccurring in engines.Comparisonof the resultsobtainedfrom both the CONE
model andthe 'bcst-matchcd'modcl with the datummodel, showedthat therewas some merit in
using the conecorrelationon the disc surfaces.Overall, theconecorrelation wasshownto be
cffcctive in the mid andouter regions of the disc diaphragmfor the steady state nuximum
condition, achievingbetterresultsthan the datummodel. I lowcvcr. using theconecorrelation hada
detrimentaleffect on thedisc cob and bore temperatures.During transients hecone correlation
Produceda disc temperature esponse hat wascloseto themeasured esponseor the inner andmid
Pall of thedisc diaphragm.But in the outer radial part of thedisc die datum modelproduceda better
thermal response han the model with theconecorrelation. Inter-disccavity shroudtemperature
Predictionswere good for the datummodel and for themodelusing the heattmnsrcrCquivalent o
that derivedat the SussexUTC [Long ct al. 2006b].Stressesn thediscsaredriven by temperature
gradient; socomparingthe radial temperaturedifferenceproducedby the thermalmodels to that
measured,he datummodel was shown to perform muchbetter than the therrnalmodelwith the
conecorrelation, both at the maximum speedsteadystatecondition andduring the transient$.
Modc1lingaroundthecompressordisc cobs proved to be difficult and to achieveanacceptable
matchwith thedisc temperaturemeasurements xtreme hcrmal boundaryconditions Ind to be
assumed, ncluding an imbalanceof hcat/rnasslow in andout of the inter-disccavities.
To increasetheunderstandingf theflowsoccurringn theNICRB2CFDwill continueo beused.
Someprogress asbeenmaden themodellingof thecavitiesWith ull 3D unsteadyCFD but this s
computationallyntensive.n anattempto overcomehecomputingimeproblema2D
axisYnlmctric teadylow modelling echnique asbeendeveloped. newCFDmodelling
techniquewas ntroducedandused o increasehemixingwithin the ntcr-disccavities.The
enhancedmixingmodelmethodologywasappliedo steadylow axisymmctricCFDmodels.nitial
testingof theenhancedmixingmodelwasperformedor bothastationwyenclosedavity and or a
rotatingsector caled avity.Goodagreementntheheat ransrcror thestationary nclosed avity
betweenheexperiment nd heCFDwith themodifiedcore luid propertieswasobtainedinner
andouterwall heat ransfer2% errorfor thehigherRayleighnumber). lowcvcr herewaspoor
agreementetweenheenhancedmixingCFDmodeland heexperimentsor dieradialheat
transferhrough hecore or therotatingannulicavity(87%error).From heseestCFDsimulations
the evelof themixingfactor hat s requiredoobtainsatisractorymixing n thecavity coreand o
producehecorrectevelof heat ransferhroughhecavitywasestimated. he estsllustratedhat
theenhancedmixingmodelhas hepotential obeusedo model hecomplexunsteadyD rotating
cavityflow with a2DaxisymmctricCFDmodel.TheFLUENTUserDefinedFunction UDF)
233
7/28/2019 Chew Packwood N Turner
http://slidepdf.com/reader/full/chew-packwood-n-turner 256/343
Programor theenhanced ixingmodelwas henapplied o enclosedotatingcavitieswith axial
throughflown thesimulation f theSussexNICRB2cxperimcntsoveringa full rangeof buoyancy
conditions.
Tte axisymmctricCFDmodelling echnique sing hecnhancedmixing model o increasehe
mixing n thecentralcorcof a rotatingenclosed avitywasapplied o theSussex ICRB2.711C
computations ereperformed ssuming teadylow and heresultswerecompared ith
Cxpcrimcntalmeasurementsor metal emperaturesndheat ransfer.Forthe inalsetof simulations
Of heSussexMCRB2, woconnecting avitiessurroundingnediscwereused.The discwas
modelledwithin theCFDanda combined avityandmetalconjugate eatingCFDsolutionswere
obtained.Using heenhanced ixing modelproduced goodagreement ith cxperimentalaluesfor thecavityshroud urface eat ransferor rotatingRayleighnumbers f theorderIe. For he
steady tateMCRB2 ests,he2D axisymnictricCFDwith theenhancedmixingmodelemployed
wasable o successfullyimulatehe ests themaximumheat ransfererrorwas94%).lic CFD
modelproduced avityshroud urfaceheat ransfershatwerecloser o themeasuredeat ransrcrs
thanpredicted y usinga3D 120"sectorLES-CFDmodel SunandChew,2004) aheat ransrcr
crrorof -25%). An acceptablegreement ith themeasuredompressoriscmetal emperatures
for eachof the estshasbeen hown -3% error).77hexisymnictricCFDmodelwithenhanced
mixingproduced nearsolidbodyrotationalcentralcorewithincachcavity.Alsowithin each
cavitythecore emperatureasshown o benearlyuniform.Bothof theseeaturesmknownrrom
CxPcrimcntsnd rom3DunsteadyCFDsimulationso bepresentn naturalconvectionn rotating
cavities.Theenhanced ixingmodelwassuccessfuln beingable o distinguishheregionsn the
flow fieldwhere heaxialthroughflowdominatesndnoenhancedmixingwas equired ndregions
where otationalbuoyancy ominates ndcnhancedmixingwas equired.Withthegoodagreement
beingachieved oth or thecavityshroudheat ransfer ndror disctemperaturesheCFDmodel
appearso bepredictinghecorrectamountof mixingwithin thecavities or theSussexMCRB2
application.Forall theCFDsimulations sing heenhancedmixingmodel.with die ocalRayleigh
numberpowcr,n setcqual0.1and hemultiplicationactor,A setequal o 1300producedhebest
resultsbothfor cavityshroudheat ransferand n obtainingacentralcavitycore low.Theuseor
under-rclaxationnthe actoredluid propertiesogetherwith theflow fieldccll smoothing elped
to reducehe nstabilitiesn thesolutionandalso
helpedheconvergence.
Tocompletehe estingof theaxisymmctricCFDmodelling echnique sing heenhanced ixing
model. t wasappliedo atypicalgas urbine1111ompressorotordrumwithanaxial hrougliflow.
234
7/28/2019 Chew Packwood N Turner
http://slidepdf.com/reader/full/chew-packwood-n-turner 257/343
Tbccomputations ereperformed ssuming teadylow and heresultswerecompared ith engine
testmeasurementsor metal emperaturesndbeat ransfer. besimulationswereperformed n the
three earcompressoriscstageshatformed hreentcr-connectingntcr-disc:cavities,whichwere
also inkedto the IP compressorriveshaftconecavity.Thethreecompressoriscsweremodelled
andacombined avityandmctal conjugate catingCFDsolutionwasobtainedor twonearsteady
statemaximumoperating onditions.By using heenhanced ixing modelUDF in theCFD
simulations oodagreement ith testvalues or thecavity shroud urfaceheat ransferheat
transfererrorof -7%) hasbeenshown or rotatingRayleighnumbers f theorder109.Bothengine
testconditions imulatedwere n thebuoyancy ominantegime.Although heCFDcavityshroudbeat ransferwas n goodagreement,herewaspooragreement ith themeasuredompressorisc
Inct3l emperatures-16% error).TbeCFDmodelproduced earsolidbodyrotationaln thecentralcore or eachcavity.Ilowcvcr,therewasstill a significant adial emperatureradient cross ach
of thecavities.Theenhancedmixingmodelwasagainsuccessfuln beingable odistinguishile
regionsn theflow fieldwhere heaxialthroughflowdominates ndno enhancedmixingwas
requiredand egionswhere otationalbuoyancy ominatesndenhancedmixing was equired.
Unfortunately,nstabilitiesn theCFDsolutionwereshownooccurwithineachcavityeven
thoughmultiplesmoothing f theflow field fluid properties,hemixing factorand hedensity adial
gradientwereappliedo thesolution.Reducinghe ocal Rayleighnumber, encereducinghe
enhancedmixing factorappearsodecreasehe evelof instabilitybutthis is to thedetriment r
beingable oobtaina uniform emperatureore low within thecavities.To achieve closerm3tch,
to themeasuredisctemperaturesn ncreasen themixingwithin thecavitieswill berequired ut
for thisto befeasible,urtherworkwill berequiredo resolvehestabilityproblems.
10.2Recommendations for Further Work
Researchcarriedout for thisthesishasshown hat heaxisymmctricCFDwith theenhanced ixing
UDFmodelappliedadequatelyaptureshe3Dtimedependent ow physicswithin thecompressor
intcr-disccavities or the low fieldandheat ransfer tsteady tateoperating onditions.Further
work is requiredodevelophemodellingprocessouse or transient ngineoperation.During
engineoperation heflow within the ntcr-disccavitieswill mainlybe n thebuoyancy ominated
regime.Duringaccelerationndat steady tatemaximum peed onditionsilecavitynowwill be
in thebuoyancyregimewhilstduring hedecelerationndat low speeddleconditionshe low
may all into theaxialthrougliflowdominant egime.Twoapproachesanbetakenomodel he
235

7/28/2019 Chew Packwood N Turner
http://slidepdf.com/reader/full/chew-packwood-n-turner 258/343

7/28/2019 Chew Packwood N Turner
http://slidepdf.com/reader/full/chew-packwood-n-turner 259/343
lltc%t:lh"i Metal I crilpetaluirl
I Pfcýflhýj Nicial
on IIIC ', 131-nan ( cnital %h. ft
Figure 10.1 Su,%%ex ICR112 (cavilles 2 and 3 and di%c 2) oilended gromon sind the po%itionof the boundary
conditions requiredh) the CIA)
model.
Immomr,
I
I t-_J
Pfrw, hýl "Icifi-I
flu. Sul"qwN %Imfl
I
\ 1.I
'..igure 10.2 Su%%ex ICRI12 full geotnews and the po%llion of lhc houndar-% conditions
required by the CIA) model.
ý.m
,117

7/28/2019 Chew Packwood N Turner
http://slidepdf.com/reader/full/chew-packwood-n-turner 260/343
Further testing ol'the combined cavity and disc conjugate heating 21) axisyminctric CFD WHIItile
enhanced mixing method could be applied to tile engine III, compressor geometry used I'M file
steady state CFD simulations in Chapter 9. 'rhe CFD geometry would need to he extended it)
include the compressor drurn discrim,
the front drive ann and the I ill comprcs-wr drive cone. For
the CFD model to run through a transient operating cycle, transient temperatures on the compressor
drum outer surface, on tile front drive arm. on the drive cone and along the IT central %haflwill
need to be specified. The Cullengine I IP conlprcssor geometry and the ix)silion of tile boundary
conditions f'or the CFD model are shown in Figure 10.3.
Prescnbcd Metal'rcnTwtotuirc%
on the HPC
ýrom Drive Armouter
Strfacc
I N Ih-( ww 0,11cl sm I. -
P..ý lear"alwc. ml
(AUCI
1'rc%crthctiMetal I-enipcraturcisonI ic 1111C otor I hum (hiter Stirfiocc
11elliprtnitucý tm ihr 1 ' %häft
Figure 10.3 Engine IlP compressor full geomewt and the po%ilion (of the boundsrý condition%
required by the CFD model.
During transient operation the flow field (velocities and pre%surc%)%%thin the ca, iltc%ý%ll re%l-kind
much quicker than the temperature field. especially during a deceleration. for hoth the air and (he
solid. To solve a combined conjugate heating CFD problem for a transient to required temperature
accuracy will require the time steps to be small. Also to achieve "pscudo" steady state convergence
at each time point many iterations per time step will be needed. This implies long computational
times to solve relative simple transient problems. such as an acccicration-decclerai ion cycle. To
238

7/28/2019 Chew Packwood N Turner
http://slidepdf.com/reader/full/chew-packwood-n-turner 261/343

7/28/2019 Chew Packwood N Turner
http://slidepdf.com/reader/full/chew-packwood-n-turner 262/343
Following on from the testing of the axisymmetric enhanced mixing modcl coupled with the
thermal model using the SC89 program on MCR132 two-cavity model. testing on the engine 111'
compressor geometry in Chapter 9 could be perf'Onned.
llwrnul N&vdcl%4'01Houndatv Condo am
c, ti ng Amm
Figure 10.4 Sussex MCRB2 (cavities 2 and 3) SC89 coupled CFD thermal anal) %is ranslent
model.
In conclusion the SC99 coupled CFD thermal analysis is the favourcd and the most feasible
approach flor transient analyses as it is automatic with the user specifying the solution accuracy and
the program is 101 to determine the timestep
intervals required to achieve this accuracy throughout
the solution. The combined CFD conjugate heating approach has the limitation that the houndary
temperatures need to he specified. which could he difficult. especially for transient analyses. If has
been shown that this approach produces g(x)d results for steady state analyses. where the houndary
temperatures are known flor tile steady state condilions. For transient analyses this appnmch is more
problematic. With a transient analysis the problem is to determine the rate of heat transfer through
the solid metal and thus the user. from guide lines and experience. will need to make a judgement
when an acceptable solution has been obtained for each time step and the user will alu.have
tojudge the time step intervals. This knowledge can only he gained from validating tmn%.cnt
conjugate heating CFD analyses over a wide range of applications. engine type..and operating
cycles.
240

7/28/2019 Chew Packwood N Turner
http://slidepdf.com/reader/full/chew-packwood-n-turner 263/343
101.3Other recommendations
Otherrecommendationsnclude hefollowing,
Forbuoyancyype lowsresearchiteratureor bothgeophysicalndmeteorologicallows
shouldbereviewed.A comparison etweenheseypesor nowsand herotatingcavity
flowspresentwithin agas urbinecompressorouldpossiblybemade.Similarly,
environmentallow literatureshouldbereviewedor cross-flowover acavity.
ThecnhanccdmixingCFDmodelneedso bevalidated cross widerrangeof applications
to determinetheenhancedmixing model ocal Rayleighnumberpower ndices,n and he
multiplyingfactor,A valueso achieveherequiredmixingwithin the ntcr-disccavities.t
is tobehopedhatsinglevaluesor the woenhanced ixing p3ramcicrswill cover he ull
rangeof applications r an algorithmcouldbederived or eachof the woparameters.
To invcstigatcheuscof othcr urbulenccmodclswithinthe2Daxisymmetricwith
cnhanccdmixingCFDmodcl.
To investigatemethods o solve the solution instability problems with the enhancedmixing
model andto improve theconvergence ateof the solution so the method canbeusedmore
CRIcientlywith the coupledCFD - thermalanalysisprogram,SC89andobtaina transient
solution within acceptable imcscalcs.
Finally,to rciinetheenhanced ixingmodel, t shouldnowbeapplied o other ig andenginecompressors,ncluding heSussexEnginePartsRig' (acivil enginecompressornd
turbinespool ig), to largecivil enginecompressorsnd o smallhelicopterengineaxial
compressors.
Theserecommendationsandthe research eported n this tlicsis are consistent with the recently
announced virtual engine" modelling at Rolls-Royce.The ultimate Aimof this initiative is to have
CFD and FEA-bascdmodels for completeengines.Limiting factors for the approacharemodelling
inaccuraciesandcomputing limitations. Useof computationallycfricicnt CFD-bascdmodels
matched o experimentaldataoffer advancesover current techniqueswith a frameworkthat canbe
extended o includeothermethods suchasLES) ascomputingpower improves.
241

7/28/2019 Chew Packwood N Turner
http://slidepdf.com/reader/full/chew-packwood-n-turner 264/343
REFERENCES
M. B.AbbottandD. R. Basco 19891,
ComputationalFluid Dynamic3an Introduction for Engineers.
LongmanScientificandTechnical,1989.
11.Abraharnsson2001],
ICAS-GT Task 2 CFD work by Volvo.
Volvo Reportfor ICAS-GT Work Package2 Task2.3, Final Report, 2001.
A. Alcxiou [2000],
Flow and lleaVTransfer In GasTurbine 11.11. ompressor Intcrnal Air Symms.
D. Phil.thcsis,Schoolof Engineeringnd nronnationTechnology,Univcrsityorsusscx,2m.
A. Alexiou[2001,
Multiple Rotating Cavities.
SussexReportor ICAS-GT2WorkPackageTask2.2.FinalReport, 001
A. Alexiou 12002],
Multiple Cavity 111g.
SussexUTC Annual Report, CAS-GT2 Work Package , June2002
T. AsacdaandK. Watanabe 1989,
The Mechanism of 11catTransport In Thermal Convection of Illgh Ila) lelgh Nunllwrs-
Phys.FluidsA. Vol. 1,No. 5, pp. 861-867.1989.
C. Bamcs[2002),
SC77 (version 2AI)- Thermal Systems Utility I'lugin for SC03, Subroutines (%'OILX &
CONE).
Rolls-Roycepfc,DNS 75270,ssue ,Mir. 2002.
A. Ilejan[19841,
Convectionicat Transfer.
JohnWileyandSons,New York-,1984.
242

7/28/2019 Chew Packwood N Turner
http://slidepdf.com/reader/full/chew-packwood-n-turner 265/343
M. I I. Binard [1901,
Les tourbillion3 cellulaires dan une nappe liquide transportant de la chalcur par convectlon
en rftime permanent.
Annales eChimicct daPhysiquc, 3,pp.62-144,1901.
D. Bohn,E.Deuker,R. Emunds, ndV. Gorzelitz 19931,
ExperimentandTheoreticalInvestigationof I leafTransfer In ClosedGas-rined Rotating
Annuli.
ASMEPapcr, 3-GT. 92,1993.
D. Bolin, R. Emunds,V. Gorzelitz andU. KrOger 19941,
Experiment and Theoretical Investigations or I [cut Transfer In Closed G25-rilled Rotating
Annuli 11.
ASME Papcr,94-GT.175,1994.
C. Burkhardt,A. Mayer andE. Rcile [1994].
Transicnt Thermal behaviour of a Compressor RoloriA Ith Axial Cooling Air Flow and Co-
rotating or Contra-rotating Shaft.
ASME, J. Turbomachincry,Vol. 116,pp. 542-547,1994.
S.Chandrasckhar1961,
HydrodynamicandHydrornagneficSlal)ililY-
OxrordUniversityPress, 961.
J.W.Chew 2000],
DiscussionNote on Axisyntructric Modelling of Buoyancy EXCCtsn Ilotilting CSk%'Ilylo'As.
Rolls-Royce nternalnote.March2000.
A. B. Colley [2001 ,
SussexAlulti-Cavity 111g: C03Conversion and ISIGHT Matching.
Rolls-Roycepfc., DNS 73947, ssue1,March2001.
243

7/28/2019 Chew Packwood N Turner
http://slidepdf.com/reader/full/chew-packwood-n-turner 266/343
M. Czech,E.SavoryandN. Toy,
The FlowOverYawed,RectangularCavities n a Low-Specd, urbulent Boundary Layer.
FluidMechanics esearch roup,Departmentf Civil Engineering. niversityorSurrcy.
P.J.Disimile,N. ToyandE.Savory2000],
Effect or Planform Aspect Ratio on Flow Oscillations In Rectangular Ca%tIcs.
Journalof Fluid Engineering,Vol. 122,pp. 32-38,March 2000.
K.S.EckhoffandL. Storcsfetten19781,
A Note on the Stability of Steady Inviscid I Iclical Gas FloAs.
J. Fluid Mcch. Vol. 89,part 3. pp. 401411,1978.
ýLS.EckhoffandL. Storcslctten1980],
On the Stability of Rotating Compressible and Inviscid 17lulds.
I Fluid Mcch. Vol. 99, part 2, pp.433448,1980.
P.R.Farthing1988],
The effectof Geometryon FlowandHeatTransfer in a Rotating Cavity.Ph.D.Ibcsis, Schoolof EngineeringndAppliedSciences, niversityor Sussex, 988.
P.R.Farthing,C.A. Long,JAI. 0%%,nandJ.R.Pincornbc1992a].
1992a,RotatingCavitywith Axial Througlillow of CoolingAir: Flow Structure.
ASME- .Turbomachincry,ol. 114,pp.237-246,1992.
P.R. Farthing,C.A. Long, JAI. 0%%-cnndJ.R. Pincombe 1992b),1992b,Rotating Cavity with Axial Throughnow of Cooling Air: Heat Transfer.
ASME J. Turbornachincry,Vol. 114,pp.229-236,1992.
X1.FishcndenandO.A. Saunders1950],
An Introduction to Hent Transfer.
Oxrord: ClarendonPress,1950.
FLUENT 5 User'sGuide[1998).
Flucnt nc.Lcbanon,Nil, USA, 1998.
244

7/28/2019 Chew Packwood N Turner
http://slidepdf.com/reader/full/chew-packwood-n-turner 267/343
FLUENT 6.1 User's Guide [2003].
FluentInc. Lebanon,Nil, USA, 2003.
T.D. FosterandS. Wallcr[1985],Experimentson Convectionat Very Ifigh 11ay1cighurnbcrs.
Phys.Fluids.Vol. 28,No. 2, pp.455461,1985.
S.GlobeandD. Dropkin 1959],
Natural ConvectionHcutTransfer In Liquids Confinedby T%%oorizontalPlatesand 11calcif
from Below.
J. I featTransfer, 1,24-8,1959.
S.GrossmannandD. Lohse 2000],
Scaling n Thermal Convection:a UnifyingTheory.
J.FluidMech.Vol.407 pp.27-56,2000
R.L. I laugcnandA.M. Dhanak 1966),
MomentumTransfer In Turbulent Separatedjow i,osta RectangularCovily.
J.AppliedMechanics.pp.641-646,September966.
J-0. II inze 1975],
Turbulence.
McGraw-l ill PublishingCo.NewYork, 1975.
K.G.T. I lolland,G.D. RaithbyandL. Konicck 19751.
CorrelationEquations or FreeConvectonI IcatTransfer In I forliontal Lnycrsof Air and
Water.
Int.J. I lentMassTransfcr.Vol. 18,pp.$79-884.1975.
J. Illingworth [2004],
CFD-SC03 Coupling.
Tr-NIRC,Universityof Sussex,une2004.
245

7/28/2019 Chew Packwood N Turner
http://slidepdf.com/reader/full/chew-packwood-n-turner 268/343
M.Jakob 194 ),
Ileat Transfer.
I' Edition,Vol. 1,pp.534-542,Wiley,Ncw York, 1949.
B.V. Johnson,.D. Lin, W.A. DanielsandR.Paolillo120041,
rlow Characteristics and Stability Analysis or Variable Density Rotating t1o%%$n
Compressor Disc Cavities.
PaperNo. GT2004-54279,Presented t flic ASME Turbo Expo.Views, Austria, 2004.
S.Kaka;andY. Ycner 1995
Convectiveicat Transfer.CRCPrcss. "dEdition,1995.
W.M. KaysandM. E. Crawrord 119801,
Convective Heat and MassTransfer.
McGraw-l fill, 2"dEdition, 1980.
A.S.R-Kilfbil [2003],SussexUTC Aluld-Cavity Ilig Build 2 sc03Thermal Analysis and Validation of Ileat Transfer
Modelling Methods.
Rolls-Roycep1c.,DNS 93772, issue1,June2003
S.Y. Kim,J.C. I Ian,G.L. MorrisonandE-.E-lovic19931.
Influence of Surface lleating Condition on Iocal Heat Transrer In Enclose'd lotskling D66
Ith Axial Throughtlow.
ASNIEpapcr93-GT-258.1993.
A. T. Kirkpatrick andM. Bolin [1986).
An Experimental Investigation of Allied Cavity Natural Convection In the Illgh Itslyltigh
Number Regime.
Int. J. I featMassTransrcr. Vol. 29,No. 1,pp.69-82,1986.
246

7/28/2019 Chew Packwood N Turner
http://slidepdf.com/reader/full/chew-packwood-n-turner 269/343
C.A. Long(1994],
Dise [cutTransfer in a RotatingCavity with anAxial Through lowof CoolingAir.
InternationalJournalof I IcatandFluid Flow, Vol. 15,pp.307-316,1994.
C.A. LongandP.O.Tucker 19921,
ShroudI lentTransfer Measurementsrom a RotatingCavity %ilthanAxial Throughnowof
Air.
37'hASMEInternationalGasTurbineConference.aper 2-OT-690,Cologne,1992.
C.A. LongandP.G.Tucker I 994a],
NumericalComputationor Larn na Flow In aI leafed R0fJ'1Inl:CM%'I1Y'ýII, anA%Ial
Througliflow of Air.
Int.J.Num.Meth. or I IcatandFluid Flow,vol.4 pp347-363.1994.
C.A. LongandP.G. Tuckcr I 994b],
ShroudI [catTransfer Measurementsrom a RotatingCjkvIIy%IIhsinAxial Through lowof
Air.
ASXIIýJournalof Turbomachincry, ol. 116pp.525-534,1994.
C.A. Long,A. P.MorscandP.G. Tuck-cr 19971.
Measurement and Computation of Ilcut Transfer In High Pressure Compressor Drum
Geometrieswith Axial Througliflow.
ASME,JournalorTurbomachincry, ol. 119.pp.51.60,1997.
C.A. Long,A. AlexiouandP.D. Smout20031,
Heat Transfer In 1111,omprcssor Inurnal Air Systems:Alcasurements front the Peripheral
Shroud of a Rotating Cavity with Axial Througliflow.
I IEFAT 2003,2" InternationalConrercriceon I IcatTransfer,Fluid Mcclumicsand
7bcrmodynamics,Victoria Falls,Zambia,PaperNo. LC 1.2003.
CA. Long,N.D.D. hficW andP.R.N. Childs12006a),
FlowAlcasurementsnsidea licated ýJulflplc
RotatingCovityit
Ith Aflal Througliflow.
TFNIRC,Dept.of engineeringndDesign,Universityof Sussex, IOWT,2006.
241

7/28/2019 Chew Packwood N Turner
http://slidepdf.com/reader/full/chew-packwood-n-turner 270/343
C.A. Long,N.D.D. Mich6andP.R.N. Childs12006b],
Shroud I lent Transfer Measurements I nsidc aI leatetl Multiple Rotating Cavity%fth Axial
Througliflow.
TFMRC,Dcpt.of engineering ndDcsign,UniversityorSussex,DRAFT,2006.
C.A. Long,P.R.N. ChildsandN.D.D. hiW16 2006c).
Disc I feat Transfer Measurements I nsidc aI leafed AlulliPIC 110121ing4vIIY Akh Axial
Throughilow.
TFNIRC,Dept.of engineeringndDesign.Unimsity of Sussex, RAFT,2006.
J.M. Owcn andJ.R. Pincombc 19791,Vortex Breakdown In a Rotating Cylindrical Csk%'Ity-
J. Fluid Mcch., 90,109-127.1979.
JAI. OwenandJ.Powell 20041,
Buoyancy Induced Flow In a Heated Rotating CavIlY-
PaperNo.GT2004-5321,PresentedtdieASNICTurboExpo,Victins.Austria,2004.
JAI. OwenandR.11.Rogers 19951,
Flow and Heat Transfer In IlotatIng-Mic Systems,Volume 2: Hot2ting Covitles.
RSPLtd. Taunton;Wiley, New York, 1995.
SA 1.PengandL. Davidson20011.
LargeEddySintulation for TurbuIcnt BuoyantFlowIn a ConfinedCA%ty.
Int.J. I featandFluid Flow,Vol.22 pp.323-331.200 .
S.V. Patankar19801,
Numerical I [cut transfer anti Fluld Flow.
I lcmispherc,WashingtonD.C., 1980.
S.B. Pope2000].
Turbulent Flows.Cambridge ress, 000.
248

7/28/2019 Chew Packwood N Turner
http://slidepdf.com/reader/full/chew-packwood-n-turner 271/343
L. Rayleigh 1916),
On Convection Currents In aI forizontal Layer of Fluid %henIhe I ligherTemperature Ison
the Underside.
Phil.Mag.. 32,529-546,1916.
Rolls-Roycepic. [20041,
SC03 User's Guide.
Mechanical ciences, ristol, 2004.
O.A. Saunders1936].
Proc. Roy. Soc.(London).SeriesA, Vol. 157,No. 89 1,pp.278-291.1936.
E.Savory,N. Toy,S. Okamoto ndY. Yamanishi 20001,
The Internal FlowField Associated%vith ai%cd hrec-DinienslonalRectangularCa%tIcs.
Journalof FlowVisualisation nd m3gcProccssing,ol. 7,pp.217-229,2000.
Z. SunandJ. Chcw 20041,LES developmentsanti fundamental studles for rotallng cavily flow and lical franifir.
ICAS-GT'2Work Package2 Task 2.3.2,Finsl Rcport,11cport T-SUTCr.00-116.2004.
Z. Sun,A. Kilfbil, J.W.ChcwandNJ. I fills 120041,
Numerical Simulation of Naturalconvect ion in Stationary and Rotating Ca%ltlcs.
PapcrNo. GT2004-53528,Prcscntcdat Oic ASNICTurbo Expo, Vicnns, Austria, 2004.
11.TennckcsandJ.L. Lumley 11972],
A First Course In Turbulence.
TheMIT Press, 972.
S.Tian[19971,
LowTurbulenceNatural Convectionn Air Fillcd SquareCa%ty.
M.D. thesis,SoudiBankUnivcrsity,1997.
249

7/28/2019 Chew Packwood N Turner
http://slidepdf.com/reader/full/chew-packwood-n-turner 272/343
S.Tian,Z. Tao,S.DingandG. Xu [2004],
Investigationof Flowand 11cat ransfer InstabilitiesIn a Rotating Ca%tyAlth A%Ial
Throughnowof CoolingAir.
PopcrNo.G17004-53525,rcscntcdt thcASNIETurbo Expo,Vienna,Austria.200-1.
P.G.Tucker 1993,
NumericalandExperimental nvestigationof FlowStructureand HeatTransrcr In a Rotallng
Cavitywith anAxial Througliflow of CoolingAir.
Ph.D. thesis,Schoolof Engineering, niversityof Sussex, 993.
P.G. Tucker andC.A. Long [ 1995],CFD Prediction of Vortex Breakdown In a Rotating Cavity % th an Axial Throughflow.
InternationalCommunications n I [catandMassTransfer,Vol. 22, No. 5, pp. 639-648,1995.
P.G.TuckcrandC.A. Long 1996).
NumericalInvestigation nto Innucnceor Geometryon F*Iown a IlotatinaCiavity%1111n
Axial Througliflow.
International ommunicationsn I leat, ndMassTransrer,Vol. 23.No. 3.pp.335-344,1996.
P.G.TuckerandC.A. Long 19981.
Fluid TemperatureDistributionsIn a RotatingCa%,ty%lth anAxial Througliflow.
Int. Comm.HeatMassTransfer, ol-25no.4 pp.511-320,1998.
J.Verdicchio2001,
Computation Fluid Dynamics and Finite Element Codesfor Soh Ing "Industrial Problems".NO Tbcsis,University or susscx,July 2001.
If. K. Vcrstccgand W. Nialalasckcra 19951,
An Introduction to Computational Fluid Dynandes,the Finite Volume Mah(A.
Longman,1995.
R.Weise1935].
I [catTransfer by Free Convection rom Square 'lates.
rorschungLeipzig).Gcbicte ngenicum.Vol. 6No.6,pp-281-292,1935.
230

7/28/2019 Chew Packwood N Turner
http://slidepdf.com/reader/full/chew-packwood-n-turner 273/343
L.S. Wong 2002],
Flow and Heat Transfer In Rotationally Induced Buoyancy flow.
D.Phil.Timis, Schoolof Engineeringnd nformationTechnology,Universityof Sussex, 002.
ICAS-GT 2001
Rotating Cavity Flow and Heat Transfer, Experimental IN'ork-hIultlplcCgviIy.
ICAS-GT Final TechnologyReport, March 2001,Task2
251

7/28/2019 Chew Packwood N Turner
http://slidepdf.com/reader/full/chew-packwood-n-turner 274/343
Appendix I
Al. l. The Standard k-c Turl)ulcncc Alodel as usedIn the FLUENT CrD code
Ilie standard-cmodel A I] isa semi-cmpiricalmodelbasedon model ransport quitions or tile
turbulenceineticenergyk) and tsdissipationate r). 11Cmodel ransport quationor k Is
derived rom heexactequation,%%ilethemodel ransportquationor c wasobtained sing
physicaleasoningndbearsittle resemblanceo itsmathematicallyxactcounterpart.
RgmMrt Ugglions
Turbulcntkincticcncrgy,k
D(fA)+ vf,/Nku)v /I +
p, Vk +G#+G,, -pe-), wdi
1(
76-)
1
Rateof dissipation,c
LIPHI+V+ W",-)Vc] + Cl, -f
(GI +C.4
Gj - Cl,dt
'Ikk
The turbulent (or eddy) viscosity./4, is computedby combining k andc as follows.
P
A-Pc, 7
%%Iicrc# saconstant.
r-orall the CFD computations he following dcrault valucs %-cre scd'
Cl,rw 1.44,C2e 1.92,C1, 0.09.cris 1.0.al, - 1.3
(A1-3)
Gi isrepresents icgeneration r turbulenceincticenergy ue o themean clocaySfadicnts,
252

7/28/2019 Chew Packwood N Turner
http://slidepdf.com/reader/full/chew-packwood-n-turner 275/343
Gi - -pu, u,air,
To evaluateGA n amanner onsistent ith theBoussincsqypothesis,
Gj - pS 3
%%hereis the modulusof the mean atc-of-straintensor,defincd as,
S= 42-Sv-S1
Gb s the generationof turbulencekinetic energydueto buoyancy,
(AW)
(M-5)
(A 1-6)
G* 1107" (Al-7)Pr,27,
herePri s the urbulentPrandtlnumberorenergy-0.85deraultvalue)andg, isdiecomponctit
of thegravitationalector n the thdirection.lic cocfficientof thennalcxpansion,7 sdefinedas,
(A1-8)
I'lic degreeo whichc isaffected y thebuoyancys detcnnincd y theconstantC), C), Is
calculatedo thefollowingrelation A21,
C,u n tanhý
.,
UV1(A .9)
wherev is flic componentf the low velocityparallel o thegravitationalectorandU sthecomponentf the low velocityperpendicularo diegravitationalector.Cie%kill eequal for
buoyantshearayersor %%hichiemain lowdirectionsalignedwith thedirectionorgravityand
Z,rororbuoyantshcarayershatareperpendicularo thegravitationalector.
Turbulentheat ransportsmodelled, sing heconcept r Reynolds' nalogyo turbulent
momentum. quation .8 s the-modelled"energyequation,%%here). heviscous issipationerm
is givenby,
253

7/28/2019 Chew Packwood N Turner
http://slidepdf.com/reader/full/chew-packwood-n-turner 276/343
where r,),ff isthedcviatoricstrcsscnsor,dcrincdas,
ail
clu,t5v(LarL,
3 ar,
(Al. 10)
1)
also he hmnal conductivity, in theenergyequation, quation .8, s replaced y diecffectiveflicrmalconductivity, ff givenby,
ke,nk+,c /1,Pr,
I'lic defaultvalueof the turbulent Prandtlnumber, 1r, s 0.83.
(Al . 12)
Forhigh-Mach-numberlows,compressibility ffectsurbulencehrough o-calleddilatation
dissipation",which snormallyneglectedn themodellingorincomprcssiblelows JA31.
Neglectingthedilatationdissipationails o predictheobservedecreasenspreadingatewith
increasingMich numberor compressible ixingandother rceshear 3ycrs.o accountor these
CfTectsn thek-cmodcls n thecode.hedilatationdissipationerm.Ym. s ncluJcdn theA
equation. 1iis erm smodelled ccordingo aproposal y SatkarJA4):
Ymw2pcilfl
%here f, s the urbulentMachnumber. efinedas
mt
-F;-s
whcrea (-4yRI) isthespccdof sound.
(AI-14)
Ilis
compressibilitymodificationalwaysakes
efrcct%henie
compressibleorm
ofthe deal
gaslaw sused.
254

7/28/2019 Chew Packwood N Turner
http://slidepdf.com/reader/full/chew-packwood-n-turner 277/343
A1.2. Near Wall Turl)ulcncc Models used In the FLUENT CI-'D ctxlc.
A1.2.11. tandard wall functions
I"he standardwall functions in thecodearebasedon die proposalor LaunderandSpalding AS],
andhavebeenmostwidely used or industrial flows.
Momcnitim
711caw-or-the-wallor mean elocityyields
UOn ln(Ey*)
ulicre
uo mucvAll,
r. lp
(AI-15)
(Al .16)
* pCVAkV')#Y Ir V
11
PP (AI-17)
%licreK is dic von KdrmAnconstant - 0,4187).E is an empirical wall functionconstant -9.793),Up s themeanvelocity oraic fluid at point P,Apis he turbulencekinetic energy at 11,-pis the
distance rom point P to the wall and j is thedynamicviscosityof the fluid.
1"heogarithmic law for meanvelocity is known to bevalid rbr.)ý > about30 to 60.111hecode, he
log-law is employed%%-Iicny*11.225.Wicri the mesh s such hat. ý < 11.225at thewall-adjaccnt
cells, thecodeappliesthe laminarstrcss-strainelationship hatcanbe%Titicnas,
uf my* (Al-19)
It shouldbenoted hat, n thecode,he a%%,-or-thc-%%*allor mean elocityand emperaturere
basedonthewall unity .. ratherhany* Viesequantities reapproximatelyqual n
equilibrium urbulentboundaryaycrs.
253

7/28/2019 Chew Packwood N Turner
http://slidepdf.com/reader/full/chew-packwood-n-turner 278/343
Encre
Reynolds'analogybetweenmomentum ndenergyransport ivesasimilar ogaridimicaw ror
meanemperature.s in the aw-or-the-wallor mean elocity, he aw-or-the-wallor temperature
employedn dic codecompriseshe ollowing wodifrcrcnt aws:
linear law for the thermalconduction sublaycr%%hereonduction s important
logarithmic law for the turbulent region%%hereffccts orturbulcncc dominateconduction
Tbe thicknessof the thermalconductionlayer is, in general,different rrom die thicknessorthe
(momentum)viscoussubl3ycr, andchanges rom fluid to fluid. For example, ile thicknessof tile
thermalsublayerfor a high-ilrandti-nunibcr fluid (e.g.. oil) Is much less hanIts momentum
subl3ycr hickness.For fluids of low Prandtlnumbers e.g.. liquid metal). on thecontrary, it Ismuch
largerthanthe momentumsublaycr hickness.
In highlycompressiblelows, he emperatureistributionn thenear-wallegioncanbe
significantlydifferent rom hatof low subsoniclows,due o the icatingbyviscous issipation.n
thecode,he emperatureall functionsncludehecontributionrom heviscous eating A61.
Ilic law-of-dic-wallmplementedn thecodebs the ollowingcompositeorm:
rv4, t V)0, .<
)'r*)
,*
(r.-Tp)lvpCv4kv3
Pr )-* + Y;tilr ur,
Tm4=Iv4kVI
Pf,A:
ln(E),O)+I']+VaPC"
4"
(Pr,U,.+ (Pr-
(A 1.19)
%%hereiscomputed y using heronnuI3givenby Jayatillckc A71:
P=9.24
r(Pr [I
+ 0.2Se*4 (A 1-20)
andp is die fluid density,cp s the spccific licat of the fluid, 4 It the%%allicat flux, TpIs the
temperatureat thecell adjacent o the wall, T. is die temperatureat Oicwall, I't is die molecular
256

7/28/2019 Chew Packwood N Turner
http://slidepdf.com/reader/full/chew-packwood-n-turner 279/343
Prandtlnumber(pqlk IC rM3r, is the turbulent Prandilnumber(-0.83 at die %%ill), /is th the I
conductivity of the fluid and U, is the mean velocity m3gnitudeat jo*- Yr
Note hat, or thesegregatedolver, he erms
v2ppr and VSf Pr,U; + (I)r- pr,
qUp
q
will bc includcd in EquationA1. 19only for comprcssible low calculations.
Thenon-dimensionalicrmalsublaycrthickncss.'r, in EquationA1-19 scomputeds ile Y*%, luc
atwhich he ncar awand he ogarithmic aw intersect, iven ilemolecularPrandilnumber f tile
fluid beingmodcllcd.
Tlic proceduref applyinghe aw-or-the-wallor temperaturesas ollows.Oncehephysical
propertiesf thefluid beingmodelled rc spccificd,tsmolecularPranddnumberscomputed.
11cn,given hemolecularPrandd umber.he hermal ublaycr iicknessyr, Iscomputedrom he
intcrscction
of theinear
andogarithmic
rorilcs,andstored.During he teration. cpcnding
onthe
.ývalueatdienear-wall ell, cidicrthe inearor the ogarithmic rofile n EquationAl-19 is
appliedo compute ic wall temperature. or licatflux 4(dependingnthe ypeof thed1cmial
boundaryconditions).
IV-rhulcncc
In thek-cmodels nd n theRSNI if theoption oobtainwall boundaryonditionsromdieA
equationsenabled), ie k equationssolvedn thev%holcomainncludinghe%ill-adjaccrit ells.
7110oundarycondition ork imposed tdie%%ills,
a
Oil
%here is the ocalcoordinateonnal o thewall.
(A I2 I)
Tbeproduction f kineticenergy,GA,and tsdissipationate,e,atthewall-adjuentcells,%hich
are hesourceermsn thek equation. rccomputednthebasisoraic localcquaibriwn
257

7/28/2019 Chew Packwood N Turner
http://slidepdf.com/reader/full/chew-packwood-n-turner 280/343
hypothesis. nder hisassumption,heproduction f k and tsdissipationateareassumedobe
equaln diewall-adjaccnt ontrolvolume.
Tlius. heproduction f k is computedmm,au r.Gi x r. j- - r.
. g(4kVIkrc"e p Yp
andcis computedrom
rV402
cp
(AI-22)
(A1.23)
The c equation s not solvedat the wall-adj3cent cells, but instead s computedusing EquationAI-
23.
Note hat,asshownhere,hewall boundary onditionsor thesolutionvariables,ncludingmean
velocity, emperature,andc arcall takencareor bytile wall functions. 7herctore,here snoneed
to beconcernedbout heboundary onditions tthewall$.
Thestandard all functionsworkreasonably ell rorabroad angeor %kall-boundedows.
I lo%%,cvcr, hey end o becomeess eliablev%hcnheflow situations epartoomuch minthe deal
conditionshatarcassumedn theirderivation.Amongothers, ieconstant-shcarnd ocal
equilibriumhypothesesarc heoneshatmost estrictdieuniversality rthe standard all
functions.Accordingly,whcn henear-walllowsarcsubjectedo severe ressure radients,nd
%%,cn the flows arc in strong non-cquilibrium, thequality orthe predictions s likely to be
compromised
A1.2.2. Two-layer model for enhanced vall treatment
Enhancedwall treatmentsa ricar-wallmodellingmediodhatcombines t"o-layer modelwith
enhanced all functions.f thenear-wallmeshsfineenougho beable o resolvetic11minar
sublaycrtypicallyy*m, y*-AyWv-v1(,.1p)), hen heenhanced%%illreatmentwill be denticalo the
traditionalwo-layer onalmodel.
In thencar-wallmodel, heviscosity-affcctcdcar-wall egion scompletelyesolved ll theWAYo
theviscous ublaycr.lic two-laycrapproachsan ntegralpartorthe enhanced%%allreatment nd
258

7/28/2019 Chew Packwood N Turner
http://slidepdf.com/reader/full/chew-packwood-n-turner 281/343
is used o specify bothc andthe turbulent viscosity in the near-wall cells. In this arproach,die
whole domain is subdivided nto a viscosity-afTectedegionanda rully-turbulcnt region.Ilic
demarcationoroic two regions s determinedby a wall-distancc-bascd,urbulentReynoldsnumber,
Reý,definedas,
ým,rk-Reyn,P
whcrey sthenormaldistance rom hewall at thecell centrcs,
), a mi+ - F.P.Or.
(A1-24)
(AI-25)
%%,ere F is the position vectorat the field point, and F. s the position vector on the wall boundary.
r. is the unionof all the wall
boundaries nvolved. Thisinterpretationallows).
to beuniquelydefined in flow domainsof complex shape nvolving multiple wans. rurthermorc,)-defined in this
way is independentof die mesh opology used,and is definableeven on unstructuredmeshes.
Re' -200), die A-cmodel (describedearlier In Sectionn the fully turbulent region (Re.,> Re*'I,
ALI) is employed. n theviscosity-affcctcdncar-wall region(ReP< Re'$''),
theonc-equationmodel
or Wolrstcin [A8] is employed. n die onc-cquationmodel, the momentumequationsandthek
equation s retainedasdescribed n SectionALI. However,the turbulentviscosity..u, is computed
from,
A.14, n CI.. (A1-26)
%khcreie engthscalehatappearsn EquationA 1-26 scomputcdrom A91
1'. - )TA, - C-141A.) (A 1-27)
The wo-layer ormulationor turbulent iscositydescribedbovesusedasapartordic enhanced
wall treatment,n which he wo-laycrdefinition ssmoothlyblendedwith thehigh-Rcynolds.
nurnbcrp,dcfinition fromtheouter egion,asproposedyJongenA 10):
A.,.A - AIA + (1- AdA.24.1
(Al-28)
whcrc.p, is the high-Rcynolds-numbcrdcrinition asdescribed n SectionA 1.1ror die A-cmodels.A
blendingrunction,A, is defined in sucha way that it is equalto unity rar from walls and s zero very
near o walls. I'lic blending function choscn s,
259

7/28/2019 Chew Packwood N Turner
http://slidepdf.com/reader/full/chew-packwood-n-turner 282/343
A, m11+ tanli21
1A(A 1-29)
Theconstant determinesile width or theblending unction.By defininga widthsuchhat ile
valueof A, will bewithin 1%of its far-fieldvaluegivena variationoraq. theresult s,
A M,
J'i Ile'l(AI-30)
tanh(O.8)
Typically, Alley would beassigneda valuethat is between5% and20% or Re" n rposc,,.
The mai pu
of the blending function A, is to prevent solution convcrgcnce rom being Impeded%%Iicnhek-c
solution in the outer layer doesnot match with the two-laycr rormulation.
Thec field iscomputcdrom,
C0AVI
11
Ile lengthscalcs hat appear n Equation A1-31 are again computed rom Chenandflatel (A91:
It - )-C,,- C.
)(A1.32)
If the%%holelow domain s inside heviscosity-affectcdegion Iter< 200).c Isnotobtained y
solving he ransport quation;t is instead btained lgebraicallyromEquationA1-31.111Code
uses procedureor thec specificationhat ssimilar o thep,blending norder oensure smooth
transition etween iealgcbraically-spcciriedin the nner egionanddiec obtainedromsolution
or the ransport quationn dieouter egion.
Ilic constantsn the lengthscale onnulas, EquationsA 1.27andA1-32.am takcn from [A91:
CJOK p-V4.40, -70. .4,-2cl (A 1.33)
A1.23. Enhancedwall functions
Tohaveamethodhatcanextendtsapplicabilityhroughouthencar-%%Illegion i.e.. aminar
sublaycr, ufferregion,and ully-turbulent uter egion) t Isnecessaryo formulatehe aw-or-the
wallasasinglewall law rortheentirewall region.7lic codeachieveshisby blendinginear
Oaminar)and ogarithmicturbulent) aws-oklic-wallusinga functionsuggestedy Kadcr A I 11:
'%606

7/28/2019 Chew Packwood N Turner
http://slidepdf.com/reader/full/chew-packwood-n-turner 283/343
U+. Cr, -Jew. FL (A1-34)
where heblcnding unctionsgivcnby:
cj(v* (AI-35)I
c -exE
-1.0 (A 1-36)
a-O. Olc (AI-37)
bm5c
where -9.793 andE" scqualoElf, %ýeref,sa roughnessunction.
Similarly.hegcncralqu3tionor hederivative"*
is14WOO
_dutly, dy
(AI-38)
(AI-39)
'Mis approachallows the fully turbulent law to beeasily modified and extended o take nto account
odicr effectssuchaspressuregradientsor variablepropcrtics.This formula also guarantees ie
correctasymptoticbehaviour for largeandsmall valuesor J, andrcasonable eprcscntationof
velocity Profiles in die cases%%Iicrc* falls insidedie wall bulYcrrcSion(3 < j, " < 10).
Theenhanced all functionsweredevelopedysmoothly lendinganenlunccdurbulent%vallaw
widi the aminarwall law.Thecnhanccdurbulentaw-or-thc-%vallorcompressiblelow withheat
transfer ndpressureradients asbeen erivedbycombiningheapproachesf W1111Cnd
CristophA 12]and luangctal. [Al 31:
-
-k('-'1'-(yrv' A)'
(At-40)
261

7/28/2019 Chew Packwood N Turner
http://slidepdf.com/reader/full/chew-packwood-n-turner 284/343
hcre somI+ay* for 0" < ).. )
(AI4 1)11
+ a),, for (), * < y, )
and amv. dp p !/ip
r. u* dx dr
,on
C... T. lvpu*T.
(A142)
(A143)
y ff,
(Ully
(AI44)2c,,T.
%%here, is the ocationat which he og-lawslopewill remainixed.By derault, 60.The
cocfficicnta in EquationA140 representshe nfluencesrpressurc radients%Oilche
cocfYicients/7ndy representhermal ffccts.EquationA140 isan ordinarydifferentialequation
and hecodewill providean appropriatenalytical olution.ra. fl andy all equal0,ananalytical
solutionwould cad o theclassicalurbulentogarithmicaw-of-the-wall.
Tbclaminaraw-of-thc-walls determinedrom he ollowingexpression:
21*k= -I+
91Y(AI-43)
Note hat heaboveexpression nly includes frcctsorpressurc radientshrougha,%%Ililcle
aects orvariablepropertiesue o licat ransfer ndcompressibilitynOle aminarwall laware
neglected.1icsecffectsareneglected ecauseheyare hought o beof minor mporunce%%en
theyoccurcloseo alewall. Integration rEquationAl 43 resultsn,
# y. +a,,,AM(2)
(A 146)
Enhancedthcnnalwall functions ollowthe same pproachc%,clopcd ortheprofile or u*. ne
unifiedwall thmnal fonnulationblendshe iminar and ogarithmic rorilesaccordingo the
method f Kadcr A I fl:
I
crTL. + tj T (A 147)
262

7/28/2019 Chew Packwood N Turner
http://slidepdf.com/reader/full/chew-packwood-n-turner 285/343
here r= --- (AI48)I+b I'r' Y*
wherePr s themolecularPranddnumber, ndOiccoefficients andb aredefinedas n Equations
A1-37andA1.38.Apartfromtheaboveormulationor T%ctiliancedlicniial%%,ll functions
followthesameogicaspreviouslydescribedorstandard iernial%%illunctions. bcboundary
conditionor turbulence ineticenergys diesame s or standard all functionsEquationAl -21).
1owevcr,heproduction f turbulenceineticenergyGAscomputed sing hevelocitygradients
thatareconsistent ith dieenhanced3w-or-dic-wallEquations l-34 andA 1.39).cnsuring
formulationthat svalidthroughouthencar-wallegion.
Al. REFERENCES
Al. B. E.LaunderandD. 11.Spalding.
lActuresIn AlathernaticalModelsofTurl)ulcnce.
AcademicPress, ondon,England,1972.
A2. R.A. W. hi. I lenkes,F.F.vandcrFlugt,andC.J. I loogendoom.
Natural Convection Flow In a Square Cavity Calculated "11h LOw-licYnOlds-Number
Turbulence Models.
InI. J. lkatAlass 7Miqfer, 34: 1543-1557.1991.
A3. D. C.Wilcox,
Turbulence Modelling for CFI)-
DCWIndustries,nc., La Canada, alirOmiA, 998-
M. S.Sarkar ndL. 13alakrishnan,
Applicationorm tcynolds-SircssTurbulence %ItWclo file COMPfvssll)lchearLayer.
ICASERcport90.18,NASA CR 192002,1990.
AS. B. E.Loundcr ndD. B. Spalding,
TheNumericalComputationo(Turl)ulcnt Flo"s.
ComputcrMcthodsn Applicd MechanicsndEnginccdng. :269-289.1974.
1.63

7/28/2019 Chew Packwood N Turner
http://slidepdf.com/reader/full/chew-packwood-n-turner 286/343
A6. J. R.Vicgas,Nf. %V. ubcsin, ndC. C. I lorstman.
On the Useof Wall Functions as Boundary Conditions for TiAo-Dimensional-ScParated
Compressible Flows.
TechnicalReportAIAA-85-0180, AlAA 23rdAcrospice Scienceshlecting, Reno.Nevada, 1985.
A7. C. Jayntillckc,
The Influence of Prandil Number anti Surface Roughnesson the Resistanceof the Laminar
Sublayer to Afoinentum and I lent Transfer.
Prog.I featMassTransrcr,1: 193-321,1969.
A8. M. Wolrstein,The Velocity and Temperature Distribution or One-DImensional tlow -Ath Turbulence
Augmentation and PressureGradient.
Int.J. I IcatMassTransfer,12:301-318,1969.
A9. If. C. ChenandV. C. Patel,
Near-Wall Turbulence Models for Complex 11ows ncluding Separation.
AIAA Journal,26(6):641-648.1988.
A 10.T. Jongcn,
Siniulation und Nlodelling of Turbulent lnconipressit)10
11)iD iesis,EPF Lausanne,Lausanne,S%vl'ucrländ,992.
A 11.13.Kader,
Ternperature und Concenimlion Proralesn Fully Turbulent Iloundäry Lii)ert.
Int. J. 1 cat NiassTransfer, 24(9): 1541-1544,1993.
A 12. F. Mite andG. Christopli,
A Simple New Analysis of CompressibleTurbulent Skin rriction Under Arbitrary
Conditions.
Tcchnical RcportAr-FDL-Tit-70-133, rebruary 1971.
264

7/28/2019 Chew Packwood N Turner
http://slidepdf.com/reader/full/chew-packwood-n-turner 287/343
A13. P.Iluang,P. Bradshaw,andT. CoAlcy,
Skin Friction anti VelocityProfilc Family for Compressible urbulcnt BoundaryLayers.
AIAAJournal,31(9):1600-1604,cptctnbcr 993.
265

7/28/2019 Chew Packwood N Turner
http://slidepdf.com/reader/full/chew-packwood-n-turner 288/343
7?.M.tj
cl6-
%20
*a
6 '1
3
I
'SIC. "39
1.166
I
4,,
II
IIIt
III
II
w0
a
aa
'. 4-
t 4. N.
-- 40 CA44
.. %ý 4b% - 4; -a
4 A%-0 wa44 to 64 -* ý-SfI
"r)- *
*"U**4 00-
Itbd to
E1I. .4
''C

7/28/2019 Chew Packwood N Turner
http://slidepdf.com/reader/full/chew-packwood-n-turner 289/343
Od
In U
It 19
=in ua0
7 ;;;48ý-
ý ;; Ho.ý;. 'Ow-
041
.:A
ý2W19
21 Vl
mt.
"4
t. lý le . lý1115bZ
.4: r;:Z:...
.4.00 P- omsw 0 Pe Po j.Zýe;
04M
r. IcA
V1'fli ?, t. '..
;Ar, zi ra ;3i: ;30 5ýFE oRz I-Mz4; %;
04 orf. V-
267

7/28/2019 Chew Packwood N Turner
http://slidepdf.com/reader/full/chew-packwood-n-turner 290/343
fto gop. 1.9 ad M
a
-- Nm m . ifl flO
ei
-a4' ei
'. v
Roll du-w9 it 42 cz Zd z ii! ii iz i-4 t iz 4- fK fe Aýe fe e ft Pi e lt ft e ft IN*j Q0 do uu di uu di 00 41 0u 60 UwW %7 w-w %0 WwwW-w
II1011aaIIII101100asIII1000a410101*000 41S40
tif12
r. - - F. - ýýeýgý exý Ký.immým-
ad 11 od * *A mWet--rý, -e9-. e9-eý-m.: 9u
4w u- ýw 01ý4
U %4
-4-0 lb. -0 %4 V 4w 'a %. 90 td V %a V V- V r.
. -4 M -NP A
tw :Z
Pd
U
.WV
--- *6 60 *a a 60 j 60 ad &# 6,-
:: 9Z. ;; --!!:! :: 11; Z;4 0%
0% IP% 0ti v d»
Hug5-e,5- -eZ,5me5-ü55'WV-«,ý ' i
---- ---. ý-----e--,-- -
0 .4 #4 0% ge0ý 04 PO 44 m 09 00
--up "
.1.U9=14--,v ""t;X10-08 *IfOil 60*0B""
tUU
1.68

7/28/2019 Chew Packwood N Turner
http://slidepdf.com/reader/full/chew-packwood-n-turner 291/343
ih 0
09 W lw WW id lw WW ýd9 « Am lwdi *i äj di w *d Z 6.4 *j I AO 0 Od
6.- do -4 ýw 2----2
61 *d t Z:
14 P% 0" -e ZA vý %0 ýo f- e- d»f4 011 mPW li *r r14 i NM -v 0 rl4 0%
M4
10
bi W,i
oi
ä
6,
tm«ta9808808084, a, 08808040040$90 li *4060*444 41 *4
A %0 04 en -p--
e- to 0% 0 4.4 .-A--1-4 -
en-
04101- 0- 4»Z'm
2a. f4 U lý. 14 04
v %4
269

7/28/2019 Chew Packwood N Turner
http://slidepdf.com/reader/full/chew-packwood-n-turner 292/343
I'
qr6d
.4ý OC00"A
%0 f» 0 14
g*A C& MA eo VN
Ad W dd id id60 d.0 40 4.0 gi e
114 C4 N C4 N I
-di 0 di W 60 &j
&M in. r- ch m ý4 ýs f" en 'm Gn
-F On w1wn ON
CD
00 4to09di
I 1 di didi di di di äh äj *1 41 60 !ý!
oj ý; ý; ;;q. -r %a %a m to no fq -- **
rrr -r -W -w 6n 6m 11 y! !!
M. ein
44 - 01 - i% - te te -
60 U %2 dU- 'j --0--0--w--"---
#0004aa01010aIIoI1011 1140
0 -4 4qp to (1) 0 94 -p
d" in p AP %0 w t» -v 0 tn f4 %n -ir inelt 90 0" ý pO -e ý qp Mr ý %0 pý 44 A t) or
dm -p 9w 'n
49 4mGlý
41) di 40 &d .m
U.- .%M, '. j
. ý4 1,
%.%MIO6490
1
%wV1 tw 131
tw 9u1.19
1,., u b4V
II
$ ")
'Cli
4I
II4
iI -ri 1;
0I
270

7/28/2019 Chew Packwood N Turner
http://slidepdf.com/reader/full/chew-packwood-n-turner 293/343
Z
ri
02 4).
43 1 *e
gn2ýýt>
14
0.4 V-4
2wý
4r, 4 "
0-
-- I.
- . *tJiA 4.0
$4
t4. zt4
z $4
$4 I s.. J$4
0
9
;j 'oIr .4 id Ly
.. _4A .4uw L%
A
tip-j t.--
qw. JA V-__-
f16
- up. :. 46 0. =-
40 C)
c2- - Z;e-n
r.
f" "4 bd --8
ti ?"I.. s-I IL
zW:"-. O: 'I. ) I"1.1a r
5" p1 9( II.Il) 1
.
0
0 C)
-0 l;elo ZON0- w
tj I.;
Rp 46
wVý
C)JI-
4.1 m '4 1*
a i,.. 4.1 ..
1.
a
-v 44 wjogeo
fl
"8I
.i *n 6.
t! ý
otý4
4ýu *jx
M4
a
271

7/28/2019 Chew Packwood N Turner
http://slidepdf.com/reader/full/chew-packwood-n-turner 294/343
E
t.
-4
q# C>
cury 40 r4
r4en Cb .4M f4 rý %D f4
H cu
C. ; .gg
4w.R
9zz
0
40 C3,4340 44 ýft Ga " ip.,
ý0.4
--------------
w. t44P. "-; .4fT.
IiiS (. I
C, '. t-. . ..) p
------- -------
;; Z;
P.04
là -
,;; - !itu ý
tu t! jýr- m
- .uI Ifl 4.0
tIut 14
5. K.
aalP
*
b- t*m*4 ""U"- *4 Ua.CØO 4C
Pomi
------- ---
40 . !! ýo - ". #ý .0.. 6.40 -UI; - to
ý.0 .4
ac06. bt 4c 00
w r- ý WI- tW
44
M0',24 N-', mt14ýS :3ý ;I is b; :1i ;4bgý P0P1? 6 , !! ýi e v- iIt!-F-ý----
-1 -
4
272

7/28/2019 Chew Packwood N Turner
http://slidepdf.com/reader/full/chew-packwood-n-turner 295/343
0 -4
nZ*eA
41L,
14 - 44 tg u r- pf oc
------- -------
@ý0.4 cc
t)
0"
6n
wi. bt
.40 0£ ii m u4 die
0a
pý. wýw
E4n
oco
Ep. 2
ic 00Z
1.3 ý 14
CK 0:
in t4
------- -------
t»
w
Zo 4"
273

7/28/2019 Chew Packwood N Turner
http://slidepdf.com/reader/full/chew-packwood-n-turner 296/343
PZ
rn
I
4nC4 -
w aZ5
Itt ý4 41.1 lt
tv) RRa.
w .4
erke
eh
a
E hk
24
z
PC 0
a. 2
w
mdu
44
C, 46
wlot
,. O%nin 4pq It.
P,
274
-r it N 40 ac 10 in
-------- ----
44
M OK a *LPý

7/28/2019 Chew Packwood N Turner
http://slidepdf.com/reader/full/chew-packwood-n-turner 297/343
0 90m -p 00-4
0. X. A. de.
--- --------
40 In
Eft a! 4A %a wd
tc;,k, 2C; )
0. x 0.04
A. ;>A. ý1X cä.
---- --------
0
0
sfl 'V
A
0 W; -a
IL.
tORA 0
U
I
ý-- 0. ýtC6
0 *1
2Z
a
.. r. 4 ()4L
mIn
U14 N
N
f4 CA r-; Sý
..t Iz
oc
9;
09,; wkNt
96
Ö3 lllIAUt4 x
ý- 1. v-= 4b bc i.4a,93,
n
0 f6
.w tig f4 a4
c;
. ad cc
4" 0"
w %jo31
469 22
41,41ýý "Iý 4n W 0- V)
.
Iz----------------
on-.
c
IlýX
bi
.rM
tot
*
275

7/28/2019 Chew Packwood N Turner
http://slidepdf.com/reader/full/chew-packwood-n-turner 298/343
tn
or- ýnd ý4
M
fi
V) C, in 0 V)
. 41.
da. x6 CL. a ba
In Z2 =H2 ,e2------- --------
(. 4
0
(.
-V
0Ron
in
x0.nz
ýge "'
- IldfA3 (Ad
"S ION.0 ýI - 0- - in- -
qr
9
1n sn0
b4 C> A tm
c,Aub
0 t4
. c6ta 0.2
XQ f- U)
it
gn
. od 99w
ad
444.
Wx
.40m 0%04 64 ý .4m«, 64 et in im f4
a.
14-Ont;*""owb m44-c0 61t4 4 t4
lä. x r- 6. x
9ýý2flrl ý ýSltlII IM4
im0. t) i» 46. tlw :i
0 "1i
I.V)
:961.44rk
%0en
0O's
Iý M 04 vr, A in
c2,m VN on4 M Vll$ A
o 44 o 4414 ýq
vit;
0 V) 0 ub
. 46 Xoý tj
46
w 42 f. ihXj -0 "04N
-'C-:3U a' M* 44 i
276

7/28/2019 Chew Packwood N Turner
http://slidepdf.com/reader/full/chew-packwood-n-turner 299/343
rý0"
"0
0"
I---
99mxOC
E -z1; Rt In
z
w Cie on f"M :24 ý- ýZRt
14 in :z S6t
fA
-.C4 . ju cc
-0;6 tie
wad W ta ".
06d ck. %g
1-6. ý j4 s.O
ý9
6,
ýL ý12a, 2ý0.i,rn -0 fý n No.m"M %0ei 0. in x0 0- 61
-2 "2?.e-. -2 Mw-. e------- -------- -------- ----- I
S
a:a:a
mclm -to 10
40 T-
. ph 9ke #-% en
3,0r.dc - fm 11ommcz & ýo
4- 3r 44dc tri to o
2:z
tzR 11.144
4f.-
n
i1i ; ---9t0 1"
dc
ý- t1l t
. 0. a: . 91,1%1,3
u H
44
Q ti K Wo QPOýý2uo
Hvi-2p
9- 5
11ýp 112Q-
ZZn-.
11*
-qzw It ý 12
------- -------- -------- --------
I--V.
zn
I
tpý& -
277

7/28/2019 Chew Packwood N Turner
http://slidepdf.com/reader/full/chew-packwood-n-turner 300/343
I-.
+
I..
U
I.
ot
0*99 41p 99:,
dc
. 4a'S4,
4;
p.
a.,
6A n in #-6 w In 94 at 0-4
:z tn
. g%. x. gl. CK . 96 X. th. die4d 0. w 0. w 0. k) 464C6
2
ad xa81ýýý
"i
ýx59.
9 (4 e0 u) 00044 x $-$ 0Xmý Li
tu
5
-1-
2. raZe0:x
2?-=U.2624
2ýa.h.
e*ý x: 3: cw
e-iN
----- -------- -------- --------
co
S
z0cc r "r .4po in a: m f6
rc 4ir
0 V) zz0a 41.
ý
in
9 Liz!
-a-c.0-
-CFo
100 .4
C6 0: . C6 ae
CD C6 Ao
96 10. wWEN
Pau.96 96
aAa
0.0 40 im
0.19*0m2i.fl,zx a- GoZ
14
"z 1ý1: Q-.
ýý '"
kI-
It "
-------- --------
27S

7/28/2019 Chew Packwood N Turner
http://slidepdf.com/reader/full/chew-packwood-n-turner 301/343
cýCb cb 94 f4
in 4n %0etX
ez
3A
4x0 tn 99OND C 99ollfx 49c»«, V1.1
),, --ý'; o b!<;v) 0Zc;oc;ý0ooin Komok .0 oc c;ýa0o t4 dc ý0C01
-------- --------
C6 46
41. Od x
Sul 16
Ad 0
Wwa0ca
fA v
ýI-=wý1. .2?!! WCýUI
Hi------- -------- -------- -------- --------
SI SI
N
a4b Q 4p
%0
*r W
$4aeOn -1
. 11, el: . 00 cc . A. 06Ad tA3 A, 0 95.
ow9, F;
ýýý2w-ý9a.d
le
z --: z5,"ý1 :5
2: C-L. "X0.
Uý. ý?
"2: 4A.
uý"-3:
6-6
-------------------------------
"4
279

7/28/2019 Chew Packwood N Turner
http://slidepdf.com/reader/full/chew-packwood-n-turner 302/343
'-XI-
.oil
x6
C4
ot
An4ý
wOt
CDC!
43DC4
0th.
fý fý99 on m E.,
ac o
. 4%. X
9.44 0. CP%
0N
0:
0 to
-aoa
00*
i ll# 40
r. r.4 04
04 th 0X 0% 0
09 =O fi;,ýA3ý-1fl 12 , #- 4. -t4. -ci. 46
t!o a.
:ZL"Z46 .x tb.
----------
Cho
e oc L>
u la v
41 zt ;zta0 ac 004
ý05
- V)
w 13
G.----------
in"
o9o00*
--00
oo*
(3 (3
. 4 -
vz
Mm
06E! c 42.1
----------90
. 96 96
----------
280
4c
96
w06 r) 41C
W
QW
ac
46
ka
'4
----------
a
----------
i44C
.. .<'U
4ndc- 4"m
is
4ft

7/28/2019 Chew Packwood N Turner
http://slidepdf.com/reader/full/chew-packwood-n-turner 303/343
in Ln
Cý m
CC%M14 z
c C, C6: L
@c in
ta ý 1%,0.
4-r x22,r. 5ýUý... a, ?I--I -
to
ýjgzýýE= lid = 4;
0
in
6n-V r
-r
N
0
aIn
1.4
F.4d
oc m. 0, ad
lk, oca. :9ý
Ao
o0..
M %D to g*
to
LJ 2
----------
0 v) oc tn*e in
5H20-2X Ci.
oa..
fn in
as0.
up ý
f. . -*
049 44&
4-2
99!.; 0 4-11L,
0XL,
----------oc 0
. A, 0.w 46 dc ein
ýýHwuw. t' gb.
Uela oc 44 0
----------
ri Ili Ili pi
oý M lý M
f- 94 tn m?Z2; k 2;
0% ec ule f414 Z; & Z;
0-cb. 2
C, imw
---------- ----------
c6 c6c6
,
0.9- in 42-
ý,
cýý0
---------- ----------
9» Nü0: 0-
f. tý
gib obM 9-1
o0S
0; PZ
po .. --2.-
4h.20
46 9
----------oc96
-C
v ".3
4" 16.tn ac
;92 1x woýew (XN; db. X tä.
oo.S
lý 0" «! Mf. we
94 4x Z,m'11
ec ;, 0. . t6
----------oc so46 46
e A. OC
fL 01W. 46 Ir.
------- ----
--4I
281

7/28/2019 Chew Packwood N Turner
http://slidepdf.com/reader/full/chew-packwood-n-turner 304/343
0
410 cc4; C;
0! Ci00a0in in
IIin in
w 14 .4It It
(4 C4.;
04 N
-0 99 -XD2DCd
---------- ----------, C 0
. Clo 0.
wu
-- tý c--- sc0 i4 4C a
44 inh4" I"9
2 ell'"R
09
ýN
9.
312F4iiE; WRFWk
a
0
----------
to
It= Ell Em=-= -to x
.1 -P; -0;x
-----N.;
Iz,=1
1241M92±
04
(1--
0 4K -X4K Xaa f4K2", :z -Z
C.lalm a
4111.e 14 z
----------
----------
a
;_-;; 0Pr0- :Z- Z
ZZ Ad kd Z UQ hd 4x in z 4%1" z&6. oc 69 w I; p lb ift %P &ý GN 4% 6.4 tj %F ww %P --ý -#
.G- Cl c; In -t 13 - tn -6---- 04% ig p qr 0 ow 4x -r
r-ý2-ý li rtk
t?
ý; ;A; = :: ýI., If = r., = 1.4 ;; On N 44 0%. 4 4ý "0
w oc 0 oic
960:
A. 04 916
U3 oc E 03 e OC11 1 11" IC
uu 4-4 uW9w
----------
------------------------------
----------
6c 0 ic 09in 9 in
96 * 96 0. N. 46 A,
20 w A. oc 0w 06p< po 2 86 2 *cx52", 04 xA2u
ug uUT. uh64 64 m
ý204 29
A.
9
gil 96
U
m
a. X &W 62-9 ad
---------- ----------
A
282
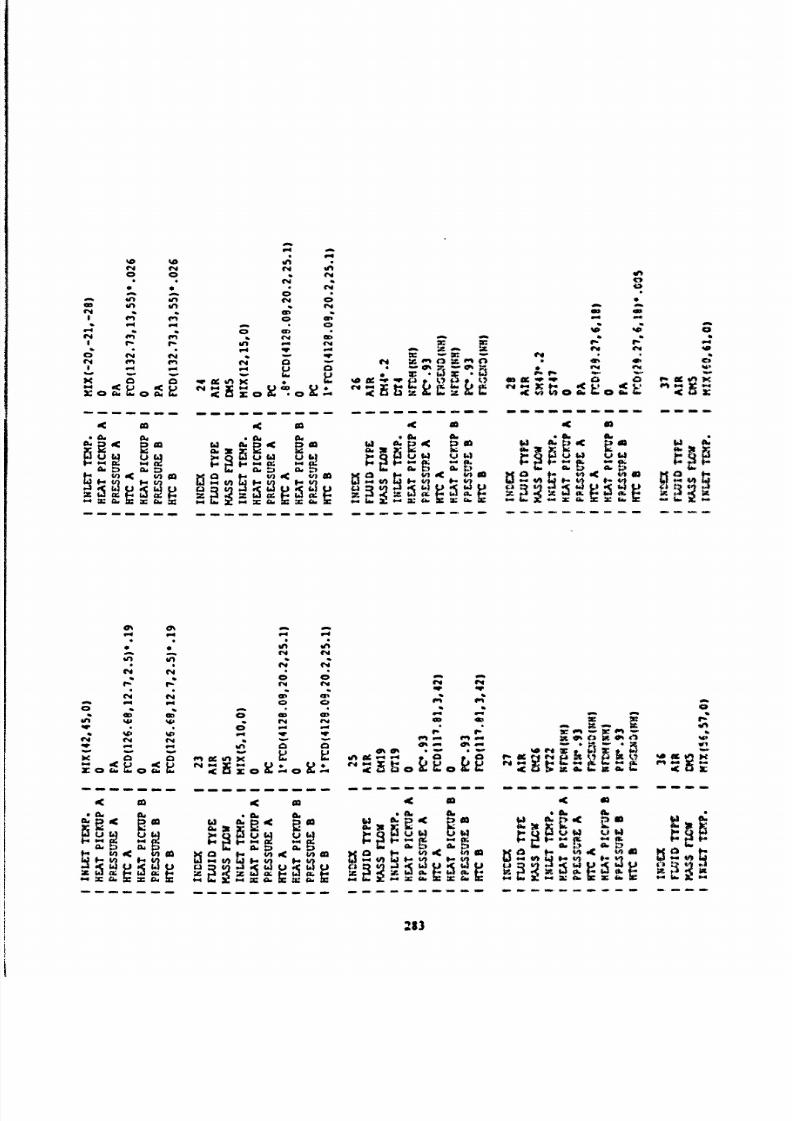
7/28/2019 Chew Packwood N Turner
http://slidepdf.com/reader/full/chew-packwood-n-turner 305/343
rý Vý ý4 -
e EMQ
0oc -mit<: CD cw
20e29x. k)10
)2 *'2fi txr.
=C
55 t;
a.2. L pl Z2
------- ---------- ----------Ic 0 oc 0 oc da
. 4. AL . A" A. . 0.
44290w'. 4w dk,2 ocy2242
InxW
10.W,F"
9PUW 06ý
C6
ts Aý r in se in ot
"=v. = 4W "2: 96 = a.
C6
------- ---------- ----------
----------41C
w"
-oi. UW i.. W-eu.
:3VIS 121-.
C-6.
-WE
-- p4 p4
*" 4.
Oý44
-NN
NN
C--f..: r.
ý 04 64 04 44
4 tz Co; gorZ lý li lle 9 lý Ili-
It66 -Z z&& go %Tf.
Ir, in
ZN -t et ýM .0 btVa9*1"%X I.;% - rl
z04.E
ac x C,
R.
C,
Rýe
4c 46
t
itc4x
---------- ----------oc in oc 0
41C 02
. J6 0, . A. &0:
& 46ell oc rA3 A. CDc 43 40C 03
13 133Z W.
H.z
------- ---------- ----------
----------ac in
6:&
2u IC
n vi $aU.Z:3ua-jxw. tw, t A:, -2:
(ý
------ -- -- -
1.183
7/28/2019 Chew Packwood N Turner
http://slidepdf.com/reader/full/chew-packwood-n-turner 306/343
4n('a
(a0(4
0
«2
(4
itsN
N
CN
0
U,N
Eric
oc go0. did
Qu
V) oc in to
C.
f4
aR7C, k! .
4c 0
40
Ad
04
.o
V)
lb284
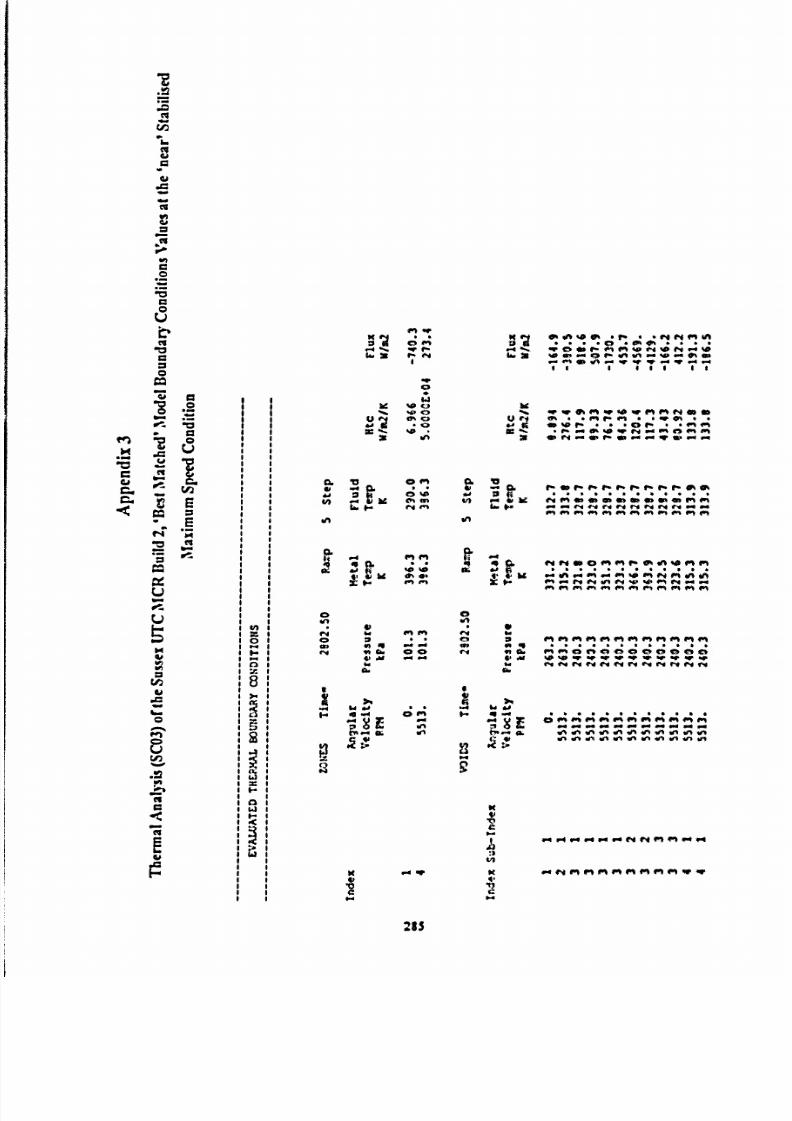
7/28/2019 Chew Packwood N Turner
http://slidepdf.com/reader/full/chew-packwood-n-turner 307/343
ei192 oon 11117e r- v ý. w CN 4» f. M ein %P " %0 N .0 %0
f. N u- ein WN
Ja
o
ci
E
E
U
M40
-V
936 IV
40 - L36
AJ 2 40
ýw «P wr 0%0% -v ** w 49 fIN f4 g» mom -- -p Xh ,-
bi l» %0 f- .. -0 f% -- f9 einIC m V» NP 14 *0 ein 0m dm
w 1- g» " ow -r m0m
r% q. f% t- V. 0%
ü> Ai ät th m t4 M ýbäc f4 m l» g»esm es m qo%n m fm44 m p. .. -r
4A in
ý -.ý. .! ! ý -. C! li rý11 *e! P!1 ;; 0" #M A* #M f4 0% AA
ein d" 94 04 w %0 om rt «9M fm 0" 4-N Mm d" ein im m
C3,2 .. co :1 94 on mM I" " 4" " 04 M" Im"aý .4 4"
400.9; C;
04 f4 ev 44 et ro pq 4N tv 04 04
:e:bd Ad -4 bd w
4c; ............0 om Pt im 0% OM IM om P% M f% d"
tn.
iL tr%9-4lý
N:Z;; ý; ;:: 4'OM*; *týM; Z:2C2ýC Geiw-tWi t wi in wem wl es re
po p404 ew9-9 o44 14 m" fo V-4
I
04 -qp K
285

7/28/2019 Chew Packwood N Turner
http://slidepdf.com/reader/full/chew-packwood-n-turner 308/343
t4 ý!
w kl ., 9 t» %0 ob o ON
m 42 «24 14»ho»N
r4 44 e 0-
IM .- -4r- **; 0.,ýeZ;, -: -; «; . t4 en d'C eb
mýeein e e
PN m %0 94 -''f. e. c> %0 10cm ý
*If4 A
r!w NP "P
c;rýt4
Co 0M'"W
e 0,4 C, M0* 0 ob 40 A 10
0,4 %0 . 0, MA . «I
cce- 0 ';
ein im in 3 e:A-. 0%e
MMf4 e4 94 44
vMu;
44 00 lw w
.Z'*'n ew 04 f4
c;C,P, -ý e4 M ein m 1-N f"f-b m
en0.% 0" ein 0" M
14
m
"4 .4 19 0 ý4 94 e4 e4 r4 r4 r4 e4 e4ein MM
gm 0-%MM ein
mmm ein in in t" t" m--m In l" ,
m -40 -ft » e» in 0%-A 4-C> 0 44 0,
';Z----j; Oin.et. so. 44.
tu 94
ChON%W 4 c2, o'n;
c; enetm''0 ir m t" ft eine t"
ein 10 %0 en
mM im ein l`N (`N (M Im q" gn mMIM l" ein
PN m rb p% m
en ein tm Am
m Vonein
...... ;ý: Z4.ý Z: -4:.: :; 0, C, , g> C, C, t> ý00r
f" tm tm 99 tm tm (M
e;c; 0o0 t>ft
ZN.. eic; c; c3. c> c> 0 CI" 1.
r ,,rrr -r
4,4444 rg rw
r -r -r Z -p rrZ ty 44e4 f4 c4 (4 44 NN r4 44 - c4 ,
ý; C;C;C;C; C; C; 00a"
:2:! ::..In d
.4d
14 4 4Z C;C;C; .4AA 04*A4d V% 4% 4A in om 4m
.4 pw o* ---rm tm 4A in in
I" pf I in m%A%MtA
4A 4n in
'n 6n 41 in6A 4m
tn 4, *n in to in to in In 010
44 m"'. 4 t,, m on m .4N-- F4 V4 0404 et 04 0, qq4" r4 "N
t4
1ý r. r. r. f. '.. f. 0% od 14 P,
, f. r. w"r W 4r
w ýv w %D - r, T, 4 .4 VA -
286

7/28/2019 Chew Packwood N Turner
http://slidepdf.com/reader/full/chew-packwood-n-turner 309/343
d;14 44n -v m
1ý1ý ý4 Prn "r
1-
o- .o.q. e
, ;ý; ; -; :j vicze ý : '; 014m1,4r , 0,"000,tý ! e:9: 1 '" Z e: Z0; c;l *0'124 > -; 0;111"
. -4 X (2 Co tn -9 0 -4 0 qc) tn in 14 44 th m 0% c2e d4J
e; ri r4 414 . -0 0, -A f4 ý #4 MA
bdC2,0 wvýN 40 cc %D"N. 4 M go wvýr- r% ze! r- ot4p- r. mvýo a t% No 44"'a
... onm - . 4min ..J
di on in N on in r- in %0 op 0 f. in w 4" 0" 0'. Cot- 4nVA94410 ýf- q. 4*04wo"t"PI
X f" mm .4m 44 ýo r4 44 m C4 f4 ý4 ý-;ý
.4;z-
4-1 44 - 44 t4 m rv 4-1 43ý 04 on 0" 40V N
CL41
ý4a) 0; 0; e;
AAp;
tw ko 44 f4 ;:;; ;;M en MM dm M en rm MZx;; ;;;; ;: g;; ;Zx;; ;: Z;; Z 94 e" 0"
in
1* 0 44 -r 0% em th Ch 0% 0% CO%m r- 0 fm -p et (F4 lb 0 et tn 4.4 » en
dm M ip 41 L 44 ;4: cý e:r: 0;c; ý cýAAv; -; 04m; 4 ;e: :Ae: e: e; e: c; ijc; tý ; -;In M -r x b4 M en en 04 n .4 ffl g- 04 f4 ý ;: ffl ;:;; ;: mZ; ;:;; 04 04 Z f4 r4 04 " ;: - r4 f4 M 49
M qm im d" en MMMMM g" e" «i ein M Im f" f" en M t" f" M 04 mmm
4"M m
.4.4.4
Q Cl C3,ýý ýo
8).
ý04
04C;14 1*1; 1; C;1; 1;44A 04A 14 4C;C;14 4C;C;4;C;04AAA%; 1;C;C; ; 1; 4; C;14A.4 .4;; .4ý .4-. 4 ;; ý 00 ý
4n 6n 4n in in in on 0 Irv *M I^ in6m GM GA 0 4n414161ý%n n 'A 4n $n let on onW11
0%n
cl44 wa 0% 0% 0% 0% 0% Oý 0% f" fn fn 4-W n f" MM In M On " fn M fn 04 P% MM rt 4q 04 on ON fn rW
tv fe .II11ad -r -0 W -W -P -W -W -V C; C; 14 C; 4; C; C; 4; 4; C; C; C; 4ý C; C; C;
Ad rwww -P -r -r -r 4A -0 W wr -V wW -V -W -W -V -01 -W -V ýr
94 N C4 94 44 q4 NNN 14 "" f4 44 94 e4 94 C4 ft " V4 ro ft ft ro 04
9L0.
V)
io %non 4A 4m sn in .0 on vi wl40tp
44 04 04 P4 94 04 f4 f4 44 f4 et f4 94 04
00000000 0? te: x3- 00
1444t4844444.1 12 m d. ) L2 Li ww k) La ta tb ta t. 3
eN si 0000 CN 2,2,>
r, ZG Zib 4; 4; ;w;
4; Zi ii Z; ii d»
%. 00 C> 0 -p -F 04 e4 (0 mm 40 e4 ý ýo " <» cl 10 ýo pen c) 0 cb 0 en wm l" -r» ýo C) c> f- r- f- e- %0 *r p -e p 0.1 m 0% '04 d%
, bi N 44 r4 r14 .40 .4 -0 0o00M 41%MMm -4 M im %0 wm"mýýM 04 m ffl 44 ew
-..................
P-9.9d
-Vsm.4 N 44
7
C; C; C; 4ý W; C; 0 c; in W qr6
ci 06 'co 00
4.1 Aj 7
64 " id 6d iw a 6d 64 W 6d 6d .7 '*
7
Od 60 6d
10 41 4v4v0q0"0 'o &4 f9 4w to
I di II di so 60 60 *0
""0""0a" In 0 6% 0aa000
xf" -e 4A 40 #-Q) .4 f4 4-N -F 4A %0 f- to 0% 0 p. rt
-------------
287

7/28/2019 Chew Packwood N Turner
http://slidepdf.com/reader/full/chew-packwood-n-turner 310/343
4
c; c;0;v;tý c; ýt; c;4ýý49 ;c;7 r: A c; : 0; ; o!d; i lee:o!e!C!o! 0f41tc4.. 4.c; Ic; c; c; .ý4.m 40 44 w 40 f- m c> %0 -r e- ed - ew .4 %0
6n w Ci. -P f. -p %0 Z 4n Nu -« r4 0% Z: et c» m -4 0 th «M es %0 d" m *%
rm M 0% 00 ffl 14 AM *F f" w rt f- m »% «lb 0" " r4 -m ffl
114,1804,640116,44,049tt4e
t; C;'ý 1ý
C; 4ý C; C; C; C; 4ý C; 4ý 9;"! el el rý cl 61 rý 4ý ý -. ý
40 on V. '. r. in .4p w an -0 -0 %p #ý
NN .4"N wo N 4" 44 ý en N- q4 40 w CP ww 10 0$ 40 op do 0% 0141%
00 t4 44 t» 110 N t, 0C %0 %0 N t4 M 0% C310w0 qP A 40 44 tn t» A 9- -p A -v *% ßn W%*A f- f- -p *n V» M #4 M f-
-; -; «;1; iv; v; -; i «;-; 0;4;e;4; r: e: ý; ';
ý-; -; r: N; '; e: 0; e: eý f: ez jj0;
e;0:4: J týo*Slý 444 ei im m t3;zz; ý ZZZZ;; en 0-% e" 0-1 f" w NP -p -p
9 19 ! ý 9 Ci9 19 C!9999 lý 7 le ri t! i li lý C!o! ý "! o!19 !eý ne1e 1991w!
ce c! '! m-
40 to (C (YN %0 w %D %0 %0 %0 w %0 Ab %D p4 f" (M -r 44 fm Z .4 in 04 e- to tn lb m 0% in %0 r. *m e- w %0 d» 410 40 ýq -p -p00 r- fý 0 C2 C> 92 000000 04 44 04 44 44 04 14 M 44 -« 04 d4 M--;: f4 f4 04 r4 Ad eb t> ;: - Cb C> 0% M 0%
d" g" dm qm in f" in f" t" d" f" 0-1 d" f" M d" 9-4 ein dm MM d" m 0" qm MMM ein fm eb ein d" d" MMmm f" mM in M
li e!4ýC;I lib ro ýýV
--r Q -w -W rrr -V -A- AWwW -V on on on f" 9" 1 Z; 10f" 4-1
2 C', 44 Pll"P, 2!: 2c
-I- -"..
-4 C4 C4 (4 C4 C14N C4 44 94 44 N 94 N ft "N ft " ed N 44
AAAAAAAAAAAAc; ý c; c; c; c; 4ý ; c; c; c; #4A #4 4 4 4 ' c; c;m 4A in 'n in in in
:zV;; :;;; ;; V
on nnmnnn" tn in sn in in %nvs %ew, %nwl 4n A tn 4n io on in v, ors nn
f4 94 94 94 94 44 94 94 N f4 f4 f4 m ed PN mMm f" f-b f" M PN fA 44 04 14 " 44
0 c> 000 CD 0 C> 00 CD 0 C) 00 (r gy 0o0wwww4.1. ) w 44 la4 ta 4.1 t-, www wl wl t,
',8.13wl 9.3
e» ci C) C» ci lu c» C) t» t> la c3 ci 12b 44 g4 pp t» m (0 to In g» c» f» CJ tb te c) ei cs mm ýgo 4ýe cs %s g» tu e6 eb t) 4, 4,
Cm (D Cb C:b 40 Cg) CU M r4 f4 f4 f4 t4 #4 0% th 00 WP 'W -e p «4 r4 w -0 c3 eb el, ejý ep ei -p -r (9 " tr ce -e -r rN -m ei, ti ul,
c>w c> 0 c) 000 0" g" m 0" en m %nm V-bn 000c eN 04 Y% K-A-G ICN- l' --- ýK20
29 lý ý9 C!C:9 lý ý e i lý e lý p: e!1i-: i -: 1:9 te le9 fý lý rý lý 14 4 1ý ýmen0
9 en 0" 41) 0" 44 e4 rw f4 f4 e4 000000 cx 0000 x> p -r -r «r ýp Ar 00ý t" gA 00mm
di lu 0 lö m lu 41 " 41 10 41 l" k# 1 -0 -1 7 ow 2
bwd er
li 7 64 7 IJ 2M70 ä* 0 &0 44 0 *A 0
bd c 6d cwc Nd c k4 a bd c tw bd bd bd bd
4, to m 41 0e le
di di di 4j tj 4j ti tj Iti od W *0vi v) 0 vl en " u) v) u) Ub m 14 Im fq 10 M lob
to cr, 0m f4 M -r 0.9 e4 en -p A to f- «b t% "-#, 4 "N -e 9A ý6A
" fý ry 44 t14 rýd N qm en mMMMM en rm r -e -e Ne -Ir -e -p
288

7/28/2019 Chew Packwood N Turner
http://slidepdf.com/reader/full/chew-packwood-n-turner 311/343
C!o!1 *:c; c; c; c; c; c; 4ý c; c; c; c; cý lý l'! e: 7IA -r 4ý 4
%e-! c;
'! 9c; c;
qý-! c; 4w 04 tn tm m
j 44 Pb d" 0 Cb e C» 0%dm MM IY% %0 f4 t» %0 -F'r
brb bm Me tý to 0% 2 f.
ry .4 -v 44 4» m 44 M 04
18181111$141
w 4ý N ý* 0%
on ............ftý *r "o
imaccoccoc, 00400, M ...... CC, 0"
4!4; 0.
-14 40 940. IJO
grý14 4n 04 4ft Vý ý r4 an V4 -W N. A,
;e;
4;
NN f" N 0% C" N C4 on 44 41%1" A" #4 :1
on
00001ý ý., 9 0! 1ý t! r! r: Vý rý 1ý a., 0.1 i 1ý .ý -1 .1410! "! r! C! a, '1
.1C!II10: 1ý *i li ?t
bc1; 1; 14 1;
-4 :: 0% gfý ON MMa CD OD co %0 ýo or qp 0% awwf. I- in 6A 0 "d 4n in a0 6m in 40% 0% t% Vh 0% th
:;0.,
ý 6n in io 10 %a to V4 4,4 V4 44 .. 4ý;; e4 g4 f4 f4 IL t'd V4in fn en m fn f" en fn f" f"
;:f" f" en 4-1 1., 0"
0 A&P. M
1ýýC! 19C!19C!C! 19 C!Ql ! r: 1 -1 ýý9'! ýC!V! ! I C!C! l It C!94: A0N fin%0 D DaAD%D %00o0%" rZrr %o%* 4"40 sm *0 0%00 CIO 04
"gc,a f4 44 r4 r4 ýq -4 el cpaaooa C2 aa;; r4 r4
fn mm f" fn m fn en fn c" in in mMM en I" f" en on 0" 4-0 4, V" PI 0-t
ei
c; c;c; 4ý ; ý c; c; c; c; c; c; t; c;c;0 -4 -4 000000 c2100 c2 c) 000 0- " di.
2 C,C: -v rZw -v p -pr -p -r -p -p -p -p rm W
-4 -4 44 44 44 rt 44 44 m" e4 rt (4 r4 t4 Z
S"""
4ý A #4AAAc; AAAAAA4; c; c; c; #4#44 ý4 .4 10 -4 14 W .4ý .4 ;ý
4n im in on in in tn tm in Loi n in 0 on tn in 6n %^ n 0,;;:; ;:;;
ý 4L------ýAA In nA $mds on V% n 40 4A in in
IH
04 M g" r4 r4 f4 r4 m e4 e4 t4 N r4 N ty mN ed et 94 14 44 f4 f4
CD 00000 c3 0 CD C> 0 C> 00000
4..... wl wl 4dI wtaw tdw 43 wwW, lä') W,Jx
w' W, W, W, 9.3 w W, wCb uU C) C> 0 C) c3 lu C* ci C. C) c" C) tj c> %0 %do b c* u ci c» ci 40 %0 " Co 94 44 90 f»
000 10) In C) 0 C, (2 cb Co P 0. c3 C» %0 %0 -p Z -p r c# cli v» ww -v -e -p M g" 44 "
0V C> r- f- 0 4. 12 0 fi 0 42 000 in wi
v
..
Ilý lý -i -: iiýf! el '! '! 1 11 lý
..
qld r4 M en -4 -0 -4 -4 en m . 4.4 A eb Wr0 C) 0m tn tn -rw 0C C) C0C
64 Nd c b4 wwr. w4Wb. wwufe 04 #0 iv fe 40 du 40 #0 &A -0 .m. du 41 m 6,4 w4t, du 4,0 t, 46m&
16.4 ýi -i ad w bi 1 4'. 60 diig m in ir? ii «ii -ii ii i) in 19 mm""ww
wo 4-0 po poCD 9-4 NmW U-V to #- m IM " .0NM -v
W in &M in 6m 0 in 6m to in w %a to %a w
219

7/28/2019 Chew Packwood N Turner
http://slidepdf.com/reader/full/chew-packwood-n-turner 312/343
9 -ne dm-r:CD
911 M 44 AM -P «Pe; r:
j Cý :j -ý fý C! Ne Pl Pl 1 fý 1 dj 0! e 6! 4: 'j fl (ý 1
m en'! 1
4iA
c»* c; 40 to w -w w rf «e 44 m f4 0" %0 1.0 e) U-4 m0 tn 0% w ti m th -»d" f4 M 4n e4 :::: 0 Z; Nu -p r» - gri "m 14 m- r- eýe 0 eýb eb fý f-
0d in -r im A i* «'b -e f4 mm im m f4 ew 0" PN m 0-1 ein m
f- r- 0 to %0 kcCO%ýd C], tn A 1% cn to 00 49 -w A 0% M0 40 00 0% d» 00 ew po om 44 *0 0.4 ow fw fb eN 44 Mm d» d» 0)
0 einN 0.4 u -p vie m 0m0 .4........................,,, C, Irz u
fl, er- to 9" MM 04 44 f4:x -r «r -p w AD Na 40 Ad> ein f" 0" ein m----ý-- 0% mmm 04 """ eg NNm
cocco
C;4C;C;ý
% ch m a% 4-A" C4 44 rld 94
f- f. f. bm %0 tn evm -r ein f- m f. m t» 0% 10 th m 04 to 0% 10 0% d» ON
.4 «4 (4 44 94 04 04 94 ty en -p m e;4;
d4 04
A04
AA
f4 04 p; e;
4
e; 44 14 fý e;is. ý -4 ý-9ý .4ý0 e4 9 94 ZXx :ZZ;; xxm ffl ;Z ffl zm94 MM dm d" MMm en mM
:Z ;Zx;;M Pt 0-4 4-N fm
in
0:0:C! e i 1ch A e- ew bc r- r. 00 f- NM0" -8 ei fe 04 m -d r% e- e- m d» %0 in wwww up w 0%toMM d" mm d" d" f" 0" m t" ein d" mmý ed et f4 - -« -ýZX;; 9-ZZ 111 9ý
in t" ein f" d" m en f" m t" A" mmmmmmmm PN 4-b en fm
C;C;C;C;C;
gAd
c; tý c; tý c;j
c; c; Cb, t; f ý 04j
c; 04 44 m;A
04A
04 44*AAA
04 04 p;
s. ýýE ;; m;; mým 00 ý -A
2.0
"Z". 0 ý.. ffl "
in in umom n *n in in «'t m teeve tm qmWb4m *A V-eA tre tn tn tm in im A vl vi VN ei in m WN%M n A In
N
ýd "4 .4 .4 04
a
C4 ow f4 N 94 C4 f4 rld C4 eq r, ed ft #4 P4 94 NN "d 14 C4 4-d f4 "d
04 NNN f" m 0" mNNNN P* N
cw qa co c, q, aa tj tj to co &P co ""a0 C), o -P w ir -W -* -W w -v wýwr
a co c) 4o o C3 a0C, <;p Qa co (1 0 ci t. rý 1,9. q. fft7777771! 1ý It, 1ý 1ý 17 Pý
000a00aýýýa, CD w0a00O. M imom 0-4 in 4A OA 4A 4A. M
ococ00 @cc00 dc c 00 dcoc00 ococ0 in 4c4c o 40 ec 4c do 40 ec 9m to
44 to 19 t$ in t# in iv 0) 41 0W ei 4f 0 40 ob 9v le to in w le w 10 49 m to m #0 m
49 14 r4 Mvtn f* f. w
290
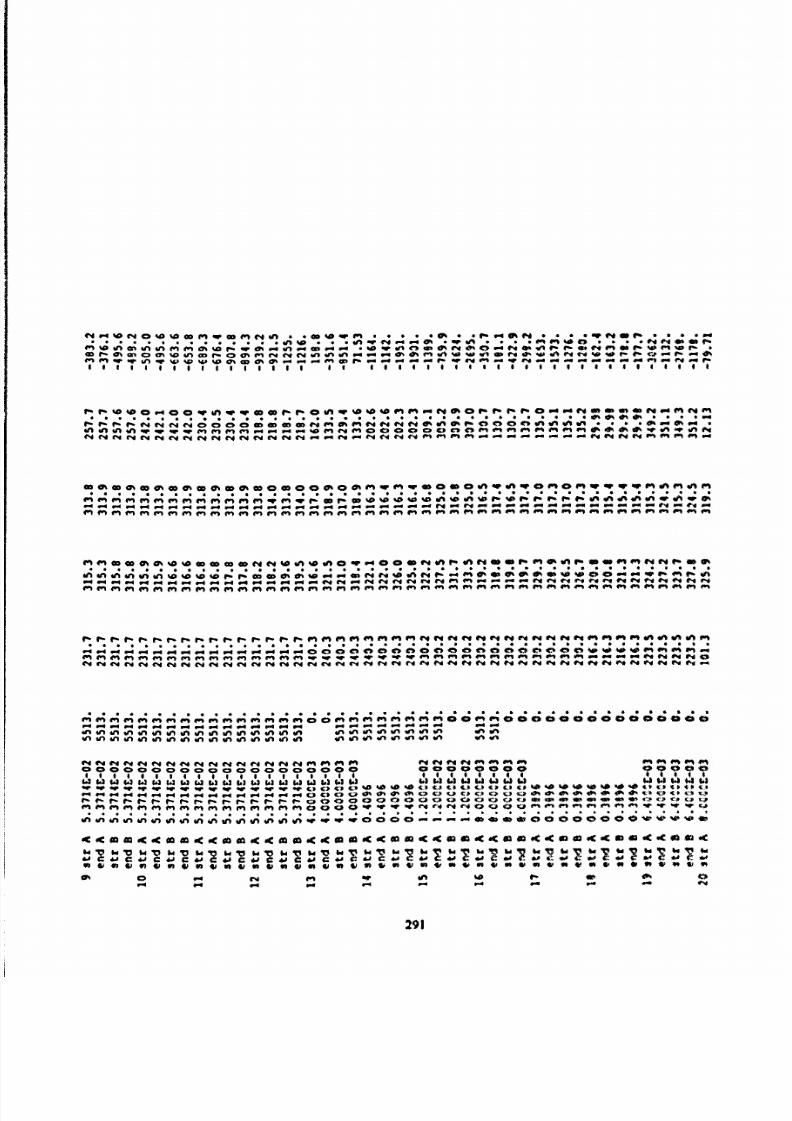
7/28/2019 Chew Packwood N Turner
http://slidepdf.com/reader/full/chew-packwood-n-turner 313/343
'I 'I el 9 'ý f "! r! '! Q! elw! ;; *! 'ý Im44: .4a; J r; I '! 0!eý44s: a;p 6nm intm in m 0% %1* 1- w 0% .4 'n"Co ro . 44! 10 Winn r- 00440"400- -4-wr-
f- O%a, o v%ýotm wrý a oý m r4c4ry wv4nno -oýw wwl_ P440. t- V. P. Mr. -"0%
WW in wwwww 0% m0%4" oil W C4 W e, 'o I" t-
g» ob l» 40 44 4.4 g" 04 ein
r. 0. f. f. 14 f4 f, f4 4, C, C, 0 Cb m Co Co 04 en eh en f4 f, 4 44 fi 0% 4n gh f- 0 in 0 ei 'm A UN tm
tA in tn 41) F, wwmm 4-, -, ZZ.. ýo m 44en 0 c, c> C, 0 C, n e»en en Ammm 0-%0% gh 44 0% -r *A rm ew
e4 44 94 44 44 r4 t4 r4 N r4 g4 f4 4,4 44 f4 -em r4 ew e4 4,414 m 0" pl t-- -------ý f4 rw m 44 m"" ein m
o! ý9 lýI9IlýI
e ý9 lý o! ý e19 !19 lý9 lý i lý17 le9 o!9i qý i ýCii C! !Ilý1i 10! i p!bi
m, m. e. 0 r. m %0%0%0 * %0Aw 4pew dy%14ý ;; Wýýýý99;: ;Z ;Z r4 ý r4 z-zg" M dm qm mm en MMMM d" d" d" mm en m 0" OMg" o";
Z; z Z;;; Z ; Zz; gg-b 4-N
li li le e ý ý.li li 9 le o!oeý i le v! e i C!7 li 9 19 ! Wiý i ri o!w!ý ! e v!rýo!«:1i li l"! ýo! ýtn tn tn 4n n tA t» %0%0 » f- rZ ob cb 0% , J -4 « tn f4 f4 %* n rd f- ;: #MC%M0% % % 9 %ÜW00;: - -» 4- PN - In0 -9 -4 -9 "4 le .4 -4 #.0 -4 .4A .4ý .4eX ef et M 04 04 e4 14 r4 ;4 ein ft rt --- e4 04 f4 04 f4 04 14;;
mm M% PN m et P% mM Ae PN Mm ein
lý p:rý rýr: rý r: r: r: r: rý rý r: rýr: rz r! r! 11 li ll! 1 P! «i i Ili i lý li eiei eir! f! l! P! ti 0!W!i 1--4 .40 -4 -4 .40 -4 ýd .4 14 -4 Mw -4 .40m c> 00 Cb 0n00 43 0n0 CN C% <b Cb C) 4m %0 »» 10 W 44 f4 0% PM mein ein MM im qm rm dm d" f" f" en mmmmppp -e ýw -v Zv Im MMM 0" MM 0" 0" 0" f" dm :; ZýZ 94 rw 04 04 0
e4 r4 44 rd 44 44 44 94 c4 44 f4 ry ry ei f4 rw ed ry ew ty f4 f, 4 f4 r4 f4 04 04 rw f4 N 04 ew et " et ro ew re Pw et -
4404140414441414A 1414440414A 1; C;C;AA 141404044414C; C; 0404C; C; C; C;44C; C; C;C; 4; C;4ýz C;in in tn 4A6A; n in o in in in %nfIl
kn in Gn n 6n n in 4n n in %n A6A%non nn wl n 406m in in
44 q4 NN 14 N 44 NNN rd NNmmm 0" 44 94 N 44 #04 f" m Oft N" m fft "m?,? Oar,
www 44 14 wwww9.3 9.3 1.1 U3 9.1 www1.3 4.1 w 6.1 14 www Aj wwu tj 14 4.3 S.-V -V w -W -P -r -V wr cl 40 40 40 to c& to co 44 0-0 to %# 64 W 40 Ww No ýft 4#c04040 V'!Z" -4 .44.4 .4 ý4 #4 .4C; p 0% ch IM to " to 0 Cý, 0 %a 0ý Ok 0% Vý 4% 04 404 0% V.w0t0 cl, V. .IZ rý f, t- f- r- rý fý r- f- f- f- r- r- fý C) a. c: 0000 40 Co 000 <0 0"Ma. 4* 4" *ý cy co to to %ýp
m fn mmM00 .00r -W -V -V CA V4 rj P% A" f" 4-1 -V -e -V %r C,#
64 V; 4; 4; V;;;; 4C;
C; 4ý C;;
.4*;ý
4ý 4; 4ý ký 1ý lhý 1ý 0;
OCc0 dc sc sc 00 ic oc 0 da sc oc 00 sc sc 00 @C c 0M tc dc In dm @C@C du 40 4c OC 00 WC @C 00 «C OC 40 92 9bo to bd 7 ba 7 ld 7 b9 7,69 bd
di ad c di c ii c ad c di C Ad 41 di li 4.0 4.0 W ýw 60 . *0 to to w *t 64 lw - *om 4juit)ukti 040 040 in 40 u) 004$9). " VIA 401441 Inti444019400 40 in w*V 0 410 qwil*" w"
0% 0 94 r14 ein -p bm %do e- m th 0
ýq "0 "Q -m- rw
291

7/28/2019 Chew Packwood N Turner
http://slidepdf.com/reader/full/chew-packwood-n-turner 314/343
WwVr
M, m
U3 wwWON 4-4 c.......
-4-N .6- -in -alf-aw Wýfv
4- N C2,4n ý4 go M %D W -W .4 f" qr qr f. 40 4DC4 r COON%a " . 0" - %* P. co. 44c. )*Pý4nf. %
ID f. CD .4 .4 V4 4" ON 9" %p 0" %P ch 4D
M Mtn 47%Coco fý MmM CF. ý 0 -W win in io 40 e4c 140 f- 'D C%f- o----ý on 0414f. f. " fý aar cn "r M.................... 4M --m.. to %ft --
r; t4r; r; " Mtn "M am -r;; z orlm w w4nop%m'404:: Ma40 %a lo 'o ý4 :; .4 in 4-1ýý 4n n 4n tA 2: V4*4 2 ::. "I := 1ý r 110::; "Iw. w, .1-. W-. 4 -. 4 4 ý4 1.0 ýq NNNN -qp -P -W MMvv f" 4" 41,on r. w0 Cl
W
le 99 lýo! ýrý9 r: 19ý
ýcýoý! g!di1 w! ti 111.1!71 Ilýi e li0% 0 th t> ob .4 f4 p414 0%0% 0% 04
0% 0% tr% M -4 m -0 CD 6n m tn r) ein 0" mwwZw -r Co wm 4n0 tn 0 onc1bmn 0; -A4 4; d; 0; w;J 4; 0; 0; v;ýýý1: ) 000 f-. f- f- f- ý .4ý ýo .4 .4 r4 f4 r4d . ""
;; " 4'" 04 e" 0Nm et x Z; -m;; 0x"m in M-r «r -F mm e" m r" mm #mm .'", Xmm en t" 0" Mm 0" ein 0" dm Pt g" 0" 0" PN mM 0"
9 fý9 rý i oeý le ý 79i lýI9 lý ceM!&l! P!9i li li wi i li ie0: 1 oý o! i e ri 1 lý li lif- 4n %0 fý r. fZ f. e. n %0 . CD r. mwr. O> wwr. th f» m ein Nn f- 0 14 m ty% 0% tA w in e 04 0 *P in 44 f4 tn %0f4 N f4 e4 44 f4 ra N r4 f4 ry -4 ýo ;: -4 .4 ffl ý% ;; 94 f4 f4 f4 44 f4 « 94 04 94 re " r4 w4 r4 rt Z fld ;: 9 #'d #4M in mmmm ri mm t" 0" 0" g" d" M 0" en f" M 0" en MMmmmm 0" 0" MMMM "N AN M
IIIV! Vi1! i 1!bi bi1!0!ý-, ý1ý0! e! IIIIIIIII40 0 40 M Mon MM on M M. -Wr w -rr -r pog V zoo 00 0 C9 4ft
00 -W w0wwr -V wr -V
.4 .44.. ýq .4 14 -0 .4 -4 ýq NNN C4 " f4 --- r4 V4 I., q4 est 44 N"ýý- ro ft f4 04 #4 " *4 em
c; c; c; c; c; c; g; c; AAc; c; c; c; 4 c; c; a #4#4AA iý c;c; e; c; c;AAc; c; AAýc;
in An VA 0 4% 4A :;:; *In,;4n 6A 4n in in *m *n in v% 4m to 4m
OM in ein om M 9-N PM r4 04 M -P -P -p *P9 fM M 04 44 94 N 9414 4444
W' s! ta ta t. ) Cb taJs
4.1 4,4 w W, t')ta wwww 4-3w 1.3 w 8.o c) c) c-i c) cs cb au t-1 ci 00ao0000 K3 &j q;# t'0 c) 00 c) 00 ci 0u c> ýo %0 %0 Ndo e0 ea %0 No 'ts 0 tf c» u cb lt, -b
U CJ e C» e» 43 4'* t-) Ki h* -« ýlo -» Nu ýo Na MO
42 <> r4 r4 f4 e4 ww vi w r- r. m r- e. e. rý e. ce 42 Ge 0 Co u c> uv<. 4 Q0 tý» 0Qy 0- 4-------
2 Ilý9iiliý. ' lýIý oýl! li ll! li li li r: i lý i lý 7 lý lý It' lý ll: 'ý lý ýýc:c! "e -! -! -! -! -! 1 411
O> es Co ed N e4 N ey ty 44 44 0000000 ID %0 w NP Nu ý-m--" te r -r w00 l> 00000
#c m0 #C oc 00 oc ac 0 93 oc oc 0m oc oc m on oc 4c 83 do oc OCM 83 OC OC v da NC sc 00 4c 4c is 0 oc OCdo dl
di c di di di ti di di c di w di m 60 di od . *, IW*0 .
41 in w in e 49 tf in to ob w ei to f) so u) to 01 w 49 to 19 w 09 f» 6 in 6 01 . IN in $A.0 44 f" -p 4m 4» f- m44 e4 f4 f4 N 44
292

7/28/2019 Chew Packwood N Turner
http://slidepdf.com/reader/full/chew-packwood-n-turner 315/343
EE
U
E
1u
"r
0
-E 0m 4-- "ö ei
.!n
04
.
cy
C4 m wr on No f% 00 47ý
%D 1- 00 ON
ce R Ad od
!Coopoo
0000
< e
w-l L<&.9<J. Z.ý-uvv,
u4j4jmvmvcCcCccC:t-S= L= t= t= = t= t= t= t=
e;gjetel-eae.eeleele293
0
26 aSý4 6 Cý
.1. - 7: 0
a ýaZ'ýo00Cm0CD vi v%70
e%

7/28/2019 Chew Packwood N Turner
http://slidepdf.com/reader/full/chew-packwood-n-turner 316/343
-u
&t% ýýý ;zL,!Qv sina',
;z -r g Z46 -r in
t= t=
-:ý 4
CY,VN to r4V'b a to 00 r' Vi MQ CD r U*b00r-
a0> Vlb ""41 f, -:ý Qý,
.:-!
d-, m f7 .Z100,1<D pl !e"0i
%t ru U : t Uu xt
<0
a r-<zo
uuXxxxQG;.9
t= t= t=
-ýuýeýuýet
o
294

7/28/2019 Chew Packwood N Turner
http://slidepdf.com/reader/full/chew-packwood-n-turner 317/343
t4
79
V!S
dot
40-1-
3J)
r0r
0
0
**
'0I, "
- Ii
fl U
C
CU
U
19
!! Thi 1!= .= .= .=LL.
; 49 ý -. i -. i -" Fiee- eeeeZ-
Z:ti*
P-c
"1
t4c
'? .S"a
t,4 cf
0...
qa
r or or or or or000-Qr
C:, 0
W. LA. &A. &A. U. ý LA.
Uý LIE, rip tf tr3 tf tf
14 vN 0-'% Oý #ý Gp IZOft*lz
--,-.2 'wP czad0; 2&!Ooooooo
oo
I: t, 4--l"f tf "I-_, It';1%1;',,ýtý%ý :ýt; :;; ::; :::; ;
- == 00-. 0-- o- 4-. 00ýý 4eý 0,11ul an
: .3
:D :D
w %0
293

7/28/2019 Chew Packwood N Turner
http://slidepdf.com/reader/full/chew-packwood-n-turner 318/343
r3
1
.=. zz
0--ý zp
. -ro
81Z1ý1
fi1-I
Ia
-
1 .2
.i
> -.. a
na.
=U 11
CD
11
;p
0U
ri
-0U
U
00
296

7/28/2019 Chew Packwood N Turner
http://slidepdf.com/reader/full/chew-packwood-n-turner 319/343
16*4
6w
-a ZN'l
H
izIs
.;,
.Il
"z
arc *rolK
EoOB
..
I^q00-11-A.. um,, to ffl
=
---
297

7/28/2019 Chew Packwood N Turner
http://slidepdf.com/reader/full/chew-packwood-n-turner 320/343
"e"""""""""
"""" . _"" ."
"It
S
13.fl
.EE
-Li
*>A-
:ý9
* -7 -..ý
N&. 0 -0 =-Z= -- t! N" w
: es11 &.:.2 -E v-* li,»K. - .-4, -
;ýz
;0.9pa
40 6.1-4, -
Z) *
.mIJ I .%
:-n ýýt 101--," <"
"r -- 0, ); >;ý. .' t-"% "h20
-5 G:;Eý80 0: F0
W
tp
-5 E-
Z, -,11 t',--:191
.%#
t4
h- tý ?- e- e-
t e- ý tot
t491 ev
0-. l=1xt.
W
I
298

7/28/2019 Chew Packwood N Turner
http://slidepdf.com/reader/full/chew-packwood-n-turner 321/343
4"!- uý
C-16:
-I
46.
0I'
2
t*)I
00
0-1 011
tz
:D1U:: ý Pte ce.
<<
9
le-1z
1Z)
1D1
uUuUU
kk
9
SS
H
00
lwftkluu
tz
uu
299
,at V 79
=*= 0
(71I
11
a-
-. - 11
.: j F1
75IW.A.,
6168196 11
1
CH

7/28/2019 Chew Packwood N Turner
http://slidepdf.com/reader/full/chew-packwood-n-turner 322/343
(L)
. ID
10
; -Z
r.
10
> %2
4n
5..C-10
v
03
6 ii_Z- ý
= -010).
-20
.52ci
Iý..
CIS
10EX
x
el
ceeQ
55mt Z:,.Öl)11 *&)cu uGA
C
EX
cts
cts
10
CISM
6
C's
ZW
clcncn
U
,Z> d Z>p PC-)-1
300

7/28/2019 Chew Packwood N Turner
http://slidepdf.com/reader/full/chew-packwood-n-turner 323/343
4.
CIS0
uUZ
Z0c64
E- L)
c)I
0
0
U
cocd>
II II
LL
Cd
I'
ýl
Co
0"
I' iý
ce
!,..A: (n
-*,
cl
03
c
C. U
to
301

7/28/2019 Chew Packwood N Turner
http://slidepdf.com/reader/full/chew-packwood-n-turner 324/343
lu
to
A
uu
4d
C:
I
ý,v
0.
00
-J
G:
U
zij K
u Cd
fný
CV
U
4J
0
o
.90
ri, u
t1i
-
.0
ILA
Z lu
r--
luýý 11U
11 ".ý11
ýp 1115 11 C5 dCA w
C13
ý ;ý
0W00 In.
ý4 ý-0ýý
"I
In t2pS
Cd 11II
fi
T;
I-
Aý -Ci
U0
bfl
ug0.
iý
oz 'A r-
. -im m
u
-0 -M:2 :p0q.
rJ
L..
Imw j.
-
II LE
0
0Cd
E-
waý
:5 ;L--ýD IQIU
0 --0
I
.0
302

7/28/2019 Chew Packwood N Turner
http://slidepdf.com/reader/full/chew-packwood-n-turner 325/343
U
1-0
;Z
uu
- P-" :A:.;
L5ggHg .6
.-., - m" -0
i, .- V (D x
0-ý 4::
= %ftw 0ý
-S
Ww 0.4
303
t9
to MM

7/28/2019 Chew Packwood N Turner
http://slidepdf.com/reader/full/chew-packwood-n-turner 326/343
'Jo
U
00
t2241 00.41
l? 0
e
'1
Z, ce %t
2ýCo li'-'C')C')0
---: -I z
. > ci U0CoF- ue-
mE ein
- 11 1::mt4,2;>:
,0,1 u)
t: ýazwut4cy
wO Z. u
k P,
4;
S
e
iýlb4.Z
*0
W
13xM
,0*'I ý-%
I, "
-I '-
0 :
CL (6-
_I U
k
t4
A
46-0
0 2ý
Z.
4
0-ý
I.
304
7/28/2019 Chew Packwood N Turner
http://slidepdf.com/reader/full/chew-packwood-n-turner 327/343
tlo
4.-0
46 u :DIU. T 1-022 A 1,11,: tr 40' 4d
tj i, qx UL ,10 21 R
ý'egg
ýg>, ':
-4
er1
S.I
A to it ý I.,
ý'T,
t IR
ticW
94
9z
Cd
't*4
oiý
0
t4 _0 1-11!%-- .0:: ý. 17 ýIo
eloil il
-T-1 %:
-6. w Li-
c2n
m lý'U 'U .=
e-et 0-1 4
t-
30S

7/28/2019 Chew Packwood N Turner
http://slidepdf.com/reader/full/chew-packwood-n-turner 328/343
UU-
.p
I
u. il
toZP-l
9
"V"S"p
>+
9 -0j!:11 %.
I
U
'10
.A
Lft. -O
ti -'-% u
Ml
1 -11,19
aII
-S
%. 0a-
0, : :--10W-
U) W
h-.- ?. t. t P- t.
0
0ýleel
ft
I
0"SSS*I"S"S*S"S"S"SS"IS"-
" _QSS
S1*
" "ri S
t4
0-C 41." -S""" ;"c." r."* c-SS" Ja
-g
gý:U*-*.. _*
*r "*
""r" '-S
" a. .SI 5
*! .1*
2: < :
-:' :
306

7/28/2019 Chew Packwood N Turner
http://slidepdf.com/reader/full/chew-packwood-n-turner 329/343
4.2
ri vil ji. '.1
YÄ -0- le0 ý!., a<;,: 4CD
"'- '"' ll.k ,m1
9
fi ti
D
rl
0
I
H
W-t 6ý .; -
oý %0.. % u Z;
a
Cd I-- -41a
9.9-, I
e. u
62.
7-. %. f ýA-fl 0% ý-- 0
tde4-% ON *It -OA t-4 .
W.7 IZ 8
-.8
wurft t. "-.. '
e.
lie 09
ar "I ý- -ti IIý.9 iý I.
r-1u
zw Gl u eý- G 0-. Li
2,2 ý2 ri cz -52 'ücý3, .5tA
U. ý U, ri tZ, I- W., 0ýI-
WIr 1u -tjti. Uýý ""-
9
oil.
307
LL
I
a.

7/28/2019 Chew Packwood N Turner
http://slidepdf.com/reader/full/chew-packwood-n-turner 330/343
****
***
**
**
00*0000000***
**"=**
**""
-12.8
I 'e;* I-.-*.
*0*
: -*=
**"" II""*
: -. .'
.> 11cl
tu
0-ý U fe-
5
ri
I
4-NN93
N. de- fow.
I
r-
00rt
im-n i
rU308

7/28/2019 Chew Packwood N Turner
http://slidepdf.com/reader/full/chew-packwood-n-turner 331/343
. wa110,
, 9111,F -a M3
99999 11 -9 111
. *0
01
U
5
C-,
0
C
0
8
%ký
lp
I'll
.LZF-
u
309

7/28/2019 Chew Packwood N Turner
http://slidepdf.com/reader/full/chew-packwood-n-turner 332/343
r
-S
> tA M
ticccccDo
.g .2r, tz ,2 t; t.4 u
P.tE
. r.
U
"0
*3 0fe.
!ýA0 '1if k-
u
ZE
zU
310
i%I:%I:::
IVQU
. .
ý, ', Z41 41 II j
000U1.w %.. %.ýo*
CYCYClrrrýý e% e%- 0-
J t:s Eit ri riý, %Q0%;., -w<<
tA.cc: ad C19j ::S'.".
%ý
Ul
II %ý
url: rcd
0e - Ol
CZcd =, V)
V) V)
t. k
0;tw
;1-ý WO
z Lä. ..
p
.. - -1 -ý.
I i-:
, -w M
=0'
if
fe!'Qu
ýju- -
17
0-,
7/28/2019 Chew Packwood N Turner
http://slidepdf.com/reader/full/chew-packwood-n-turner 333/343
0-ý0-1-
0V-
a0
00;H II "
t-
- _I" - ft
I.)
tu
h-- ..0 4A owý
0R
p
nH
fid0
U- U-
W
ýxo od
6op
ta.
k t.
311

7/28/2019 Chew Packwood N Turner
http://slidepdf.com/reader/full/chew-packwood-n-turner 334/343
OLZ.
tV.
od
ýe
92
, g ýo-- oot A
..91
u
er
leM',
H
CD
lp 9-. ýw
Imv
omý
co
u
H
j
%,W
312
7/28/2019 Chew Packwood N Turner
http://slidepdf.com/reader/full/chew-packwood-n-turner 335/343
tr
a
H
9
e.0
I3
01:
o0-
I,
UU
UUU
313
:e
UZ 1-
ITý2
.yPa
6ý .0
cecd6d
> ..000
j-s 14
. 01 It
7L,d H
hi 6%;: %-, tjIýd-
0.151 ý5
11
;-t L),Ci' i' teb#J'-
0
6 *-, - 1; ot
offlý
0ý
A;

7/28/2019 Chew Packwood N Turner
http://slidepdf.com/reader/full/chew-packwood-n-turner 336/343
.,
9 ..0-ý
iýL
<A.
010. e.
91
-r
91
igý 0-% 0-% 0-%
o
t.. o 000 ti. &J. L.
% 1 0=u ot I:
D191
t4 uu u> ul
E
t.
r
;.Zft
..r
Q
ELt
0,oe.
iý
7-
t4
(1 L-
Zroot ti
t5
t4l
0
.e. --
ot
r- k
U
u
tz
w*
.2
0-. ý
Cl
ll5 Ad
t)
I__ "
U
I%W
k oo-ý
314

7/28/2019 Chew Packwood N Turner
http://slidepdf.com/reader/full/chew-packwood-n-turner 337/343
G --ýw PACowoOU
<
u lu0U
-ul 2RU ;.
ii
It6A
ro11
u
460
315

7/28/2019 Chew Packwood N Turner
http://slidepdf.com/reader/full/chew-packwood-n-turner 338/343
"0
oI-
0-0
11'
t. &Z
6cl v
W 'p46j
.0aUTv
'a ",*
%q ý *214 9-rza
aýU4; .wC4 14' ý:e.. t opwv
cq I'llý
ý=ý-
I ct4 u.ýd
t4 u #-. W.0;11 K
OA .- V-0
41 -ýd ý--"..
ILA
IA.
mot9
rhfs
21
L5
ý.4
«Z i ýz
Lm-
11 -Z Xtz
ul co15 4 w-
Ut=
- WI
wAuA
316

7/28/2019 Chew Packwood N Turner
http://slidepdf.com/reader/full/chew-packwood-n-turner 339/343
1'2
t:e_
W
44
P, A. -k
317

7/28/2019 Chew Packwood N Turner
http://slidepdf.com/reader/full/chew-packwood-n-turner 340/343
aZ09
I6-
omý
ILO12
In
0 -2-,Go :3
Q.,
Ie
.1w4)E60
.0cz
.40-i
i.
a
-4
= "Zo
71
-I
11
00 -4 p4 0
.,4 WCn %0
; 04 00 -4 *1
ti
>O 4. = 0.0 %. %. ll41 2 >q >q
di 10 49 du di di *i
-0wx
uQ,
1" .4 .4"ii de u) u) In
416 000uvV :104
d di wV) U) V) 41
N-v 11 1! to 1: If!L, m"ýa. p w?
ci k ;i -A ci 't i10.d 4) 0.4 .4 .4u
to P. V 44 .4ý ý4 wlbw C to 00 f" .4
di 4) >0M. 4 0444 . r. 1 -V 0WW bd --4
c, 0.41 #0 40
w>>>de P. 0.0.
Nd b4 6411
" 2
8-44" :28 .49 dV %441
.4.. 10
aZ2 Jul
X
go aj
wj N
0-U'ii
dw >-4
-0 W
te 4f *I >% >
t> %. 43 CM4 w) C 0%
4d ct0C" -0 0 t"
ki dd qm ý^ ffl >u NdZ-"61 1 «1 #0
do 0U"XX:
01di od
C bd " A; a, wm
Aw - 60 0 -0 60 40 IV6. bd 4A.
AJ *j di
-d 60 41 4L) W
.0"V
0.4 On 04
C""C. %d vu 'i
I
I"
.4- 0
Aj D. U-
318

7/28/2019 Chew Packwood N Turner
http://slidepdf.com/reader/full/chew-packwood-n-turner 341/343
>1
'-4
a
a'.4
.4 Id
Z -4
:
. -4 -09) c00
413 1
*a I c"40 01CxV) u
xu >1
0 >1 >
.. 4
V) u.0
u 10 ý4V) 4) V) C
. 14 ,q0>>u
*.. 1ý1 0
>1 >1 diA. 41 u
-4 .4 ý4 -. 4 .4M11 Al I V) M %w0oo
uuuV) V) 4)
-4 W)r>>
III
14 "0 ý4 P4 10
0.4 to )r P4 ý4 cto 4) 0 to m
4 to
di 1 10wxwwI
fa 0. u 40 to c>>>
Aj Aj aj4) 4)
qn V)26 0. :3
64 OP
W)
a>1
-WCA.
ua o< .404) %4
P4 ý4 -4 W ý4 M
m 0. ý4 .021; "1" 4ý 10 11ou C Aj ...
1 00 u
w1
0
w &Aj
, -4.0 1 1ý 44
0. -
0. di -
w
u) - 4) x
tyN di dbi 0) u
0 Go
. 1,4.4
319
Aj
to
(Ac0
114
w 11
W-s40
41 6.1
In ý4 W0
I
C0N
is
-4
1
SSSSS
'I
4,
I,
lu9)
-4
U
tz.n
.0 .g40 x
*4 .
Nw
Ajc
. -400
, z!
I
C; 43u.q
rnI
4)
iwAj -.4c2
-.4 -0
*0 #arW
Qv
40In
7/28/2019 Chew Packwood N Turner
http://slidepdf.com/reader/full/chew-packwood-n-turner 342/343
ýq ý4
it 1400wu
-4
3
0
I
AJ
41E
V)
I Aj -14) 0.
u
0
14
0)&14 -0U
di M
-0 lw4soc
61
"1
:1.
320

7/28/2019 Chew Packwood N Turner
http://slidepdf.com/reader/full/chew-packwood-n-turner 343/343
Appendix 6
User Guide forthe EnhanceMixingAllodel UDF and the use 141thinhe2DAxisymnictric
CFD Model
The2DaxisymmaricCFDmodelneedso besetupo usearotating cfercnccrame.
71icorderof operations o set up and run theCFD modelwith die enhancedmixing modelUDr
is as follows,
1. Pcrfon-n conventional FDanalysiswith wall temperaturesf known)usingstandard
k-c urbulencemodeluntil a converged olution
sobtained.
2. Read n dieCFDmodel.cas,caseile.File-> Read-> Case...
3. Read n theschemeile, wall_viscosity.cm. rile ->Read.> Scheme...
4. In theUDr panel. ompile,ink and oad heUDFsource ode.
Define-> Uscr-Defined->
1. Functions->Compiled...
AddSource ile"comp_cnhanced-mixing."
LibraryName usedefaultnameibudo
PressBuildbutton
Press oadbutton
Setdie UDFFunction looks.
2. Functionsilooks...
Set heUDFhooks,nitialization-> initJactor andAdjust-> adjust-factor
Set henumber r UDFNlemoryocations.
3. Mcmory...
Set heNumber r User-Defmcd emoryLocationso 10
5. In the fluid matcriMspanelset hemodified nuid propertiesUDr- parameternanics,
Define -> Niatcri3ls->
I'liennal Conductivity > uscr-derined> factorc4_conductivity
Viscosity -> user-defined> factorcd-viscosity