chemtura corporation - jefferies - the global … to execute upon these strategies in 2014 and...
TRANSCRIPT
achieving our vision
NYSE / EURONEXT: “CHMT”
Chemtura Corporation
JEFFERIES 2014 GLOBAL INDUSTRIALS CONFERENCE PRESENTATION
August 13, 2014

Forward Looking Statements
Caution concerning forward-looking statements
2
This document includes forward-looking statements within the meaning of Section 27(a) of the Securities Act of 1933, as amended and Section 21(e) of the Exchange Act of 1934, as amended. These
forward-looking statements are identified by terms and phrases such as “anticipate,” “believe,” “intend,” “estimate,” “expect,” “continue,” “should,” “could,” “may,” “plan,” “project,” “predict,” “will” and similar
expressions and include references to assumptions and relate to our future prospects, developments and business strategies.
Factors that could cause our actual results to differ materially from those expressed or implied in such forward-looking statements include, but are not limited to:
The cyclical nature of the global chemicals industry;
Increases in the price of raw materials or energy and our ability to recover cost increases through increased selling prices for our products;
Disruptions in the availability of raw materials or energy;
Our ability to implement our growth strategies in rapidly growing markets and faster growing regions;
Our ability to execute timely upon our portfolio management strategies and mid and long range business plans;
The receipt of governmental and other approvals associated with the sale of the Chemtura AgroSolutions business and the successful fulfillment of all other closing conditions for such a transaction
without unexpected delays or conditions;
The successful closing of the sale of the Chemtura AgroSolutions business and the separation of that business from the rest of our businesses;
Declines in general economic conditions;
The ability to comply with product registration requirements of regulatory authorities, including the U.S. Food and Drug Administration (the “FDA”) and European Union REACh legislation;
The effect of adverse weather conditions;
Demand for Chemtura AgroSolutions segment products being affected by governmental policies;
Current and future litigation, governmental investigations, prosecutions and administrative claims;
Environmental, health and safety regulation matters;
Federal regulations aimed at increasing security at certain chemical production plants;
Significant international operations and interests;
Our ability to maintain adequate internal controls over financial reporting;
Exchange rate and other currency risks;
Our dependence upon a trained, dedicated sales force;
Operating risks at our production facilities;
Our ability to protect our patents or other intellectual property rights;
Whether our patents may provide full protection against competing manufacturers;
Our ability to remain technologically innovative and to offer improved products and services in a cost-effective manner;
Our ability to reduce the risks of cyber incidents and protect our information technology;
The risks to our joint venture investments resulting from lack of sole decision making authority;
Our unfunded and underfunded defined benefit pension plans and post-retirement welfare benefit plans;
Risks associated with strategic acquisitions and divestitures;
Risks associated with possible climate change legislation, regulation and international accords;
The ability to support the carrying value of the goodwill and long-lived assets related to our businesses;
Whether we repurchase any additional shares of our common stock that our Board of Directors has authorized us to purchase and the terms on which any such repurchases are made; and
Other risks and uncertainties described in our filings with the Securities and Exchange Commission, including Item 1A, Risk Factors, in our Annual Report on Form 10-K.
These statements are based on our estimates and assumptions and on currently available information. Our forward-looking statements include information concerning possible or assumed future results of
operations, and our actual results may differ significantly from the results discussed. Forward-looking information is intended to reflect opinions as of the date this press release was issued. We undertake
no duty to update any forward-looking statements to conform the statements to actual results or changes in our operations.
JEFFERIES 2014 GLOBAL INDUSTRIALS CONFERENCE PRESENTATION, AUGUST 13, 2014

Managed Basis Financial Measures
See Appendix for reconciliation to GAAP computations
Managed Basis Financial Measures
The information presented in this Presentation includes financial measures that are not calculated or presented in accordance with Generally Accepted Accounting Principles in
the United States (“GAAP”). Our managed basis financial measures consist of adjusted results of operations that exclude certain expenses, gains and losses that may not be
indicative of our core operations. Excluded items include costs associated with the bankruptcy reorganization; facility closures, severance and related costs; gains and losses on
sale of businesses and assets; increased depreciation due to the change in useful life of assets; unusual and non-recurring settlements; accelerated recognition of asset
retirement obligations: impairment charges; changes in our pension plans as a result of dispositions, merger or significant plan amendments, and the release of cumulative
translation adjustments upon the complete or substantial liquidation of any majority-owned entity. They also include the computation of Adjusted EBITDA. In addition to the
managed basis financial measures discussed herein, we have applied a managed basis effective income tax rate to our managed basis income before taxes. Our managed basis
tax rate of 31% in 2014 and 2013 represents refined estimated tax rates for our core operations to simplify comparison of underlying operating performance. Our projected
managed basis tax rate for 2014 is lower than 31%. However, as we will need to subsequently revise our tax rate to reflect the sale of our Chemtura AgroSolutions business, we
will defer revising the rate to avoid two potential changes in one year and to assist investors with the comparability of our reported managed basis results. Reconciliations of
these managed basis financial measures to their most directly comparable GAAP financial measures are provided in the attached financial tables. We believe that such managed
basis financial measures provide useful information to investors and may assist them in evaluating our underlying performance and identifying operating trends. In addition,
management uses these managed basis financial measures internally to allocate resources and evaluate the performance of our operations. While we believe that such
measures are useful in evaluating our performance, investors should not consider them to be a substitute for financial measures prepared in accordance with GAAP. In addition,
these managed basis financial measures may differ from similarly titled managed basis financial measures used by other companies and may not provide a comparable view of
our performance relative to other companies in similar industries.
3JEFFERIES 2014 GLOBAL INDUSTRIALS CONFERENCE PRESENTATION, AUGUST 13, 2014

Presenters:
Craig Rogerson Chairman, President and Chief Executive Officer
Dalip PuriVice President, Investor Relations and Treasurer

DELIVERING SUBSTANTIAL NEAR-TERM AND LONG-TERM VALUE TO SHAREHOLDERS
Portfolio Actions
Recent portfolio actions are simplifying our portfolio and generating cumulative proceeds of $1.5 billion:
Completed sale of the Antioxidant & UV Stabilizers business on April 30, 2013 for $200 million
Completed sale of the Consumer Products business on December 31, 2013 for $300 million
Entered into a definitive agreement to sell our Chemtura AgroSolutions business for approximately $1 billion on April 16, 2014
Maximizing value to shareholders
COMPANY OVERVIEW 5
Divestiture net cash sale proceeds being returned to shareholders:
First use of net cash sale proceeds is to pay down debt to maintain our total debt to Adjusted EBITDA ratio at pre-divestiture levels
As of July 28th, 2014 we had repurchased 6.9 million shares for $165 million year-to date and had $30 million remaining under our original
share repurchase program authorization of $291 million to return proceeds from the Consumer Products divestiture to shareholders which
we target completing prior to the closing of the sale of Chemtura AgroSolutions
Our Board of Directors has further increased the share repurchase authorization by $100 million to $391 million to permit repurchases to
continue once the prior authorization is complete
Upon the closing of the sale of Chemtura AgroSolutions expected in the fourth quarter of 2014, we will return net cash proceeds after debt
repayment to shareholders. Method to return those proceeds will be determined based on market conditions at that time
Focused industrial specialty chemical company with leading market and technology positions:
Have undertaken investments for capacity expansion and growth
Ankerweg HVPAO plant, The Netherlands and Nantong multipurpose manufacturing plant, China
Acquired the remaining 50% interest in DayStar Materials LLC joint venture in May 2013
Capacity expansions within the Industrial Engineered Products segment to service the growth in insulation foams and mercury control
Will consider bolt-on acquisitions to enhance growth of portfolio businesses
JEFFERIES 2014 GLOBAL INDUSTRIALS CONFERENCE PRESENTATION, AUGUST 13, 2014

CONTINUING TO EXECUTE UPON THESE STRATEGIES IN 2014 AND BEYOND
Our Strategic Building Blocks Remain In Place
Achieving our vision by focusing on:
REGIONAL GROWTH
Through Building Local
Presence and Utilizing
Global Scale
PERFORMANCE
Through a Performance
Driven Culture
PORTFOLIO
Through Active Portfolio
Management
TECHNOLOGY
Growth Through
Industry Focused
Innovation
Focus on innovation and
technology
Differentiation through
technology
Investing in sustainable
technologies and
applications
Expand global footprint and
infrastructure
Increased exposure to faster
growing regions
Regional shared service
centers enable cost and
strategic flexibility
Continuous improvement
Accountability
Greater customer intimacy
and focus
Sustainability
Actively managed portfolio to
optimize value
Sharpened focus on
Transportation, Electronics
and Energy markets
COMPANY OVERVIEW 6JEFFERIES 2014 GLOBAL INDUSTRIALS CONFERENCE PRESENTATION, AUGUST 13, 2014

Capacity Expansion and Regional Growth Through Industry Focused Innovations
El Dorado, Arkansas and West Lafayette, Indiana (USA):
Emerald InnovationTM “greener” flame retardant product line expansion
Geobrom® Mercury emission control
Nantong & Nanjing, China:
- First phase of Nantong plant (synthetic grease) completed and
commercial sales commenced in 2014. Second phase (synthetic fluids),
production to commence in 2015. Third phase (urethanes) to commence
in first half 2016. Nanjing provides application development for our
Industrial Engineered and Performance Products segments
Ankerweg, The Netherlands:
- First High Viscosity PAO (“HVPAO”) facility in Europe. Products are
being qualified and expect commercial production to begin in the 3rd
quarter of 2014
DayStar, South Korea
- Purchased remaining percentage of this JV in 2013 to facilitate our
manufacturing capacity expansion of high purity capability for LED
lighting precursors and other optoelectronic products
Bergkamen expansion
- Commercial production of single site catalyst activator MAO operational
and increasingly utilized. Expansion of feedstock supply for MAO and
MOVCD LED and semiconductor precursors close to completion
Launching from a position of strength
COMPANY OVERVIEW 7JEFFERIES 2014 GLOBAL INDUSTRIALS CONFERENCE PRESENTATION, AUGUST 13, 2014

Geographic Diversity to Support Growth Initiatives
After the completed divestiture of the Consumer Products business
57% of LTM 2014 Net Sales outside North America
Operates 24 manufacturing sites in 12 countries
* Plants to be closed soon.
North America
El Dorado, AR
Mapleton, IL
Pekin, IL
Adrian, MI*
East Hanover, NJ
Fords, NJ
Perth Amboy, NJ
Gastonia, NC
Elmira, Canada
West Hill, Canada
EMEA
Latina, Italy
Bergkamen, Germany
Accrington, UK
Droitwich, UK*
Trafford Park, UK
Ankerweg, The Netherlands
Asia/Pacific
Nantong, China
Nanjing, China
Gajraula, India
Kaohsiung, Taiwan
Hyeongok, South Korea
Latin America
Rio Claro, Brazil
Altamira, Mexico
Reynosa, Mexico
Asia/Pacific
LTM 2014
Net Sales
19%
Europe/Africa
LTM 2014
Net Sales
29%
Latin America
LTM 2014
Net Sales
9%
North America
LTM 2014
Net Sales
43%
Manufacturing Plants
by Region
COMPANY OVERVIEW 8JEFFERIES 2014 GLOBAL INDUSTRIALS CONFERENCE PRESENTATION, AUGUST 13, 2014

Business Segments:
Industrial Performance Products
Industrial Engineered Products

23%IEP
42%IPP
35%CAS36%
IEP
43%IPP
21%CAS
Business Segment Overview
10
LTM Adjusted EBITDA(1) as of 6/30/2014
by Segment(2) - $265 Million(3)
Corporate Segment:
Stewardship (public company cost, corporate management) and legacy costs
LTM as of June 30, 2014 were $64 million. Includes $10 million of stranded
costs now eliminated, and excludes $17 million of costs related to the CAS
divestiture. Excluding these items, these costs LTM were $40 million
LEGEND
Industrial Engineered Products (IEP) Industrial Performance Products (IPP)
LTM Net Sales as of 6/30/2014
by Segment - $2,278 Million
Announced agreement to
sell Chemtura
AgroSolutions expected to
close in fourth quarter of
2014
(1) See GAAP reconciliation in appendix for the computation of Adjusted EBITDA
(2) Chart and percentages exclude corporate segment and other expenses
(3) Adjusted EBITDA includes $6 million and $17 million of expense in 2013 and LTM 2014, respectively, related to the sale of Chemtura AgroSolutions
Focus on delivering continuous growth in all our business segments
PROJECTED 2014 FY ADJUSTED EBITDA YEAR-OVER-YEAR GROWTH OF 15% - 20%
BUSINESS SEGMENTS
Chemtura AgroSolutions (CAS)
JEFFERIES 2014 GLOBAL INDUSTRIALS CONFERENCE PRESENTATION, AUGUST 13, 2014
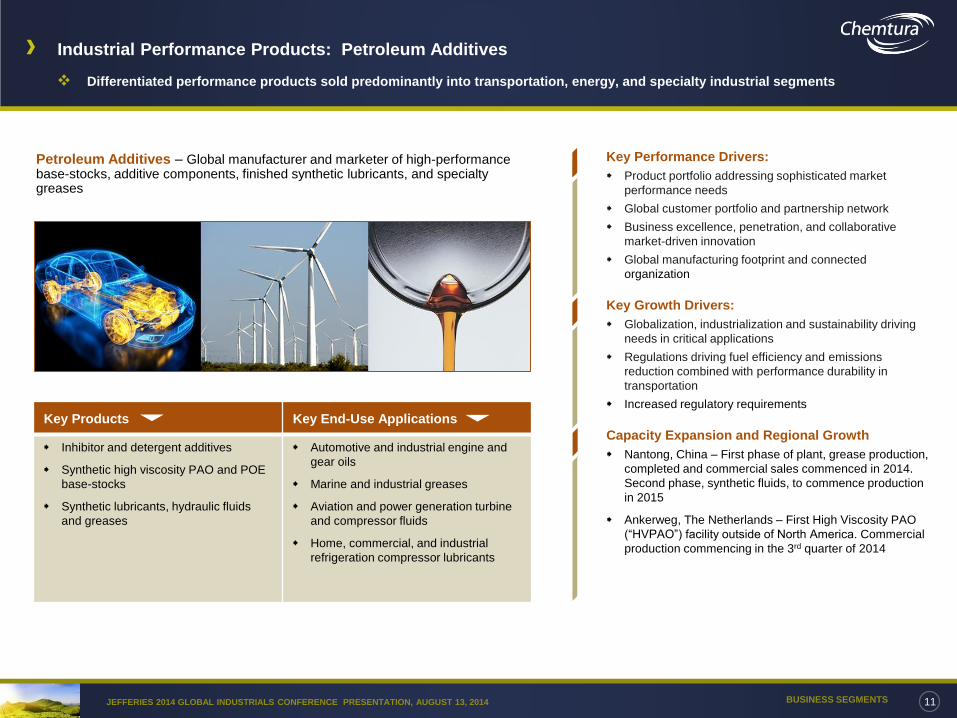
Industrial Performance Products: Petroleum Additives
11
Differentiated performance products sold predominantly into transportation, energy, and specialty industrial segments
Petroleum Additives – Global manufacturer and marketer of high-performance base-stocks, additive components, finished synthetic lubricants, and specialty greases
Key Products Key End-Use Applications
Inhibitor and detergent additives
Synthetic high viscosity PAO and POE
base-stocks
Synthetic lubricants, hydraulic fluids
and greases
Automotive and industrial engine and
gear oils
Marine and industrial greases
Aviation and power generation turbine
and compressor fluids
Home, commercial, and industrial
refrigeration compressor lubricants
Key Performance Drivers:
Product portfolio addressing sophisticated market
performance needs
Global customer portfolio and partnership network
Business excellence, penetration, and collaborative
market-driven innovation
Global manufacturing footprint and connected
organization
Key Growth Drivers:
Globalization, industrialization and sustainability driving
needs in critical applications
Regulations driving fuel efficiency and emissions
reduction combined with performance durability in
transportation
Increased regulatory requirements
Capacity Expansion and Regional Growth
Nantong, China – First phase of plant, grease production,
completed and commercial sales commenced in 2014.
Second phase, synthetic fluids, to commence production
in 2015
Ankerweg, The Netherlands – First High Viscosity PAO
(“HVPAO”) facility outside of North America. Commercial
production commencing in the 3rd quarter of 2014
BUSINESS SEGMENTSJEFFERIES 2014 GLOBAL INDUSTRIALS CONFERENCE PRESENTATION, AUGUST 13, 2014

Industrial Performance Products: Urethanes
12
Differentiated performance products sold predominantly into mining, consumer and specialty industrial segments
Urethanes - Leading global supplier of a broad range of high-performance conventional and low-free monomer cast urethane pre-polymers, thermoplastic polyurethanes, custom curatives, and urethane chemicals
Key Products Key End-Use Applications
Branded Hot cast urethane pre-
polymers and curatives
TPU and water-based PUDs
Polyester polyols
Polyurethanes Dispersion
Oil & gas extraction, mining, steel
processing equipment
Electronic semiconductor polishing
pads
Consumer, recreational, and sporting
goods
Key Performance Drivers:
Industry leader in hot cast elastomers
Customer loyalty via superior Technical Sales and
Service (TSS)
Strong IP (Duracast®) for innovative solutions
Global manufacturing footprint
Key Growth Drivers:
Safer technologies: Duracast®, Mercury-free Quasi
system
Custom products across a broad range of specialty
industrial, consumer and military applications
Capacity Expansion and Regional Growth
Nantong, China – production for Urethanes will be the
last phase of the multi-purpose facility
BUSINESS SEGMENTSJEFFERIES 2014 GLOBAL INDUSTRIALS CONFERENCE PRESENTATION, AUGUST 13, 2014
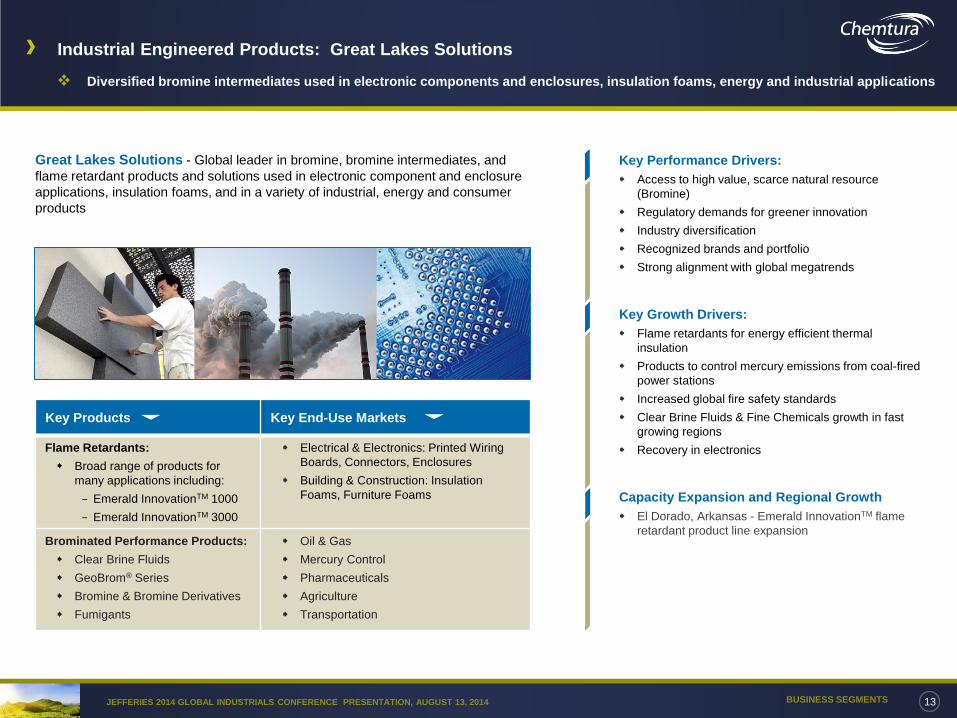
Industrial Engineered Products: Great Lakes Solutions
13
Diversified bromine intermediates used in electronic components and enclosures, insulation foams, energy and industrial applications
Great Lakes Solutions - Global leader in bromine, bromine intermediates, and
flame retardant products and solutions used in electronic component and enclosure
applications, insulation foams, and in a variety of industrial, energy and consumer
products
Key Performance Drivers:
Access to high value, scarce natural resource
(Bromine)
Regulatory demands for greener innovation
Industry diversification
Recognized brands and portfolio
Strong alignment with global megatrends
Key Growth Drivers:
Flame retardants for energy efficient thermal
insulation
Products to control mercury emissions from coal-fired
power stations
Increased global fire safety standards
Clear Brine Fluids & Fine Chemicals growth in fast
growing regions
Recovery in electronics
Capacity Expansion and Regional Growth
El Dorado, Arkansas - Emerald InnovationTM flame
retardant product line expansion
BUSINESS SEGMENTS
Key Products Key End-Use Markets
Flame Retardants:
Broad range of products for
many applications including:
- Emerald InnovationTM 1000
- Emerald InnovationTM 3000
Electrical & Electronics: Printed Wiring
Boards, Connectors, Enclosures
Building & Construction: Insulation
Foams, Furniture Foams
Brominated Performance Products:
Clear Brine Fluids
GeoBrom® Series
Bromine & Bromine Derivatives
Fumigants
Oil & Gas
Mercury Control
Pharmaceuticals
Agriculture
Transportation
JEFFERIES 2014 GLOBAL INDUSTRIALS CONFERENCE PRESENTATION, AUGUST 13, 2014

Industrial Engineered Products: Organometallics
14
Differentiated performance products used in polymer production, thin-film solar energy, LEDs and semiconductors, and fine chemicals
Organometallics - Develops, manufactures and markets specialty organometallic
products used as polymerization catalysts components and the synthesis of fine
chemicals and pharmaceuticals as well as metal organic vapor chemical deposition
agents
Key Performance Drivers:
Backward integration to TriMethyl Aluminum (TMA)
Excess industry capacity for TriEthyl Aluminum (TEA)
used as component in polyolefin polymerization
catalysts impacting performance – exploring options
to address impact
Full MVOD product portfolio for LED applications with
commercial Korean production
Key Growth Drivers:
High performance Metal Organic Vapor Chemical
Deposition (MOVCD) growth in LED, semiconductors
and other optoelectronic products
Industrial growth through MAO single site catalysts
Capacity Expansion and Regional Growth
Hyeongok, South Korea – Purchased remaining
equity interest in DayStar Materials LLC Joint Venture
in 2013 to facilitate our high purity capability for LED
lighting precursors and other optoelectronic products
Bergkamen, Germany – Commercial production
expansion of single site catalyst activator MAO
operational and increasingly utilized. Expansion of
feedstock supply for MAO and LED precursors close
to completion
BUSINESS SEGMENTS
Key Products Key End-Use Markets
Organometallics:
Axion® Series:
Axion® CoCatalysts
Aluminoxane Activators
External Stereomodifiers
Axion® DEZ
Axion® Reagents
Metal Organic Vapor Chemical
Deposition Agents
Polymerization catalyst components
Synthetic Rubber
LED and Semiconductors
Pharma and Fine Chemical Synthesis
Thin-Film Solar Energy
JEFFERIES 2014 GLOBAL INDUSTRIALS CONFERENCE PRESENTATION, AUGUST 13, 2014
Financial Summary:
Annual Historical Financials
Segment Adjusted EBITDA Trend
Pro Forma Capitalization
Chemtura Investment Highlights

$1,914
$2,184 $2,196 $2,231
$2,278
$1,600
$1,800
$2,000
$2,200
$2,400
2010 2011 2012 2013 LTM 2014
$193
$285 $313
$275 $265 10.1%
13.0%14.3%
12.3%11.6%
$0
$100
$200
$300
$400
2010 2011 2012 2013 LTM 2014
$105
$142 $136
$159
$127
$0
$50
$100
$150
$200
2010 2011 2012 2013 LTM 2014
$88
$143
$177
$116
$138
$0
$50
$100
$150
$200
2010 2011 2012 2013 LTM 2014
Financial Summary
Annual historical financials as of June 30, 2014
Adjusted EBITDA(1)(2)Net Sales
Capital Expenditures Adjusted EBITDA less CapEx
( $ in Millions ) ( $ in Millions )
( $ in Millions ) ( $ in Millions )
(1) See GAAP reconciliation in appendix for the computation of adjusted EBITDA
(2) Adjusted EBITDA includes $6 million and $17 million of expense in 2013 and LTM 2014, respectively, related to the sale of Chemtura AgroSolutions
FINANCIAL SUMMARY 16JEFFERIES 2014 GLOBAL INDUSTRIALS CONFERENCE PRESENTATION, AUGUST 13, 2014

Segment Adjusted EBITDA Trend
The path to expanded Adjusted EBITDA1 margins
Industrial Performance Products
1 See GAAP reconciliation in appendix for the computation of Adjusted EBITDA
$ in millions and % of Net Sales
Industrial Engineered Products
Margin expansion led by revenue growth and application of commercial
excellence initiatives, will drive segment towards our financial goals
Growth will come initially from existing products and applications for both
lubricant additives and synthetic base stocks
Growth will be supplemented by product and application innovation over time
New plants in The Netherlands and China as well as existing capacity will
support this growth
Segment projects year-over-year improvement for FY 2014
Proven ability to meet our strategic and financial performance goals
Demand from electronics applications was soft in 2013, but modest
improvement expected in 2014
Customers steadily switching from HBCD to Emerald InnovationTM 3000 in
styrene based insulation foam applications
Near term will benefit from cost reduction and capacity management actions
taken
Revenue growth from mercury control, MOCVD, MAO, bromine and oil and
gas applications
Segment projects improvement in second half of 2014
17FINANCIAL SUMMARYJEFFERIES 2014 GLOBAL INDUSTRIALS CONFERENCE PRESENTATION, AUGUST 13, 2014
$134 $145
$129 $140 $139
16.0% 15.4% 14.5% 14.3% 14.0%
2010 2011 2012 2013 LTM 2014
$107
$173 $185
$99
$76
14.7%
19.9% 20.6%
12.3%
9.3%
2010 2011 2012 2013 LTM 2014

Capitalization
Capitalization
As of July 28th, 2014 we had repurchased approximately 6.9
million shares of our common stock year-to-date for $165
million under our share repurchase program. As of the same
date, there was $130 million remaining under our authorized
share repurchase program of $391 million
The announced agreement to sell Chemtura AgroSolutions
for approximately $1 billion is expected to close in the fourth
quarter of 2014. We continue to expect to return the net after-
tax sale proceeds to shareholders having first repaid sufficient
debt to maintain our total debt to Adjusted EBITDA ratio at the
level it was prior to the divestiture
In 2014, we expect higher to deliver operating earnings
(before the sale of Chemtura AgroSolutions), as well as
reduced cash outflows related to capital expenditures,
pension contributions and interest expense, improving the
Company’s free cash flow profile
18
(1) See GAAP reconciliation in Appendix for the computation of Adjusted EBITDA
(2) Total Net Leverage is defined as Net Debt/Adjusted EBITDA
FINANCIAL SUMMARYJEFFERIES 2014 GLOBAL INDUSTRIALS CONFERENCE PRESENTATION, AUGUST 13, 2014
($ in Millions) June 30, 2014
Cash $235
$450 Million 5.75% Senior Notes due 2021 $450
Senior Secured Term Loan due 2016 $207
7 7/8% Senior Notes due 2018 $100
Other Debt $43
Total Debt $800
Credit Statistics June 30, 2014
($ in Millions)
2014 LTM Adjusted EBITDA(1) $265
2014 LTM Interest Expense $52
Debt/2014 LTM Adjusted EBITDA 3.0X
2014 LTM Adjusted EBITDA / Cash Interest Expense 5.1X
Total Net Leverage(2) 2.1X

Chemtura Investment Highlights
19
Portfolio Actions:
Simplified portfolio and divesting three business for cumulative proceeds of $1.5 billion
Completed the sales of the Consumer Products and the Antioxidant businesses in 2013
The sale of Chemtura AgroSolutions is consistent with our value creation strategy. This transaction will transform Chemtura
into a ‘pure play’ industrial specialty chemicals company while returning substantial value to shareholders when it closes,
which is expected in the fourth quarter
Chemtura Going Forward:
A sharper, more focused, specialty chemicals company `
Leading positions in portfolio of global specialty chemicals businesses serving diverse end-markets
Driving growth and differentiation through product and application innovation
Regulatory Requirements
Continued expansion in faster growing regions
Emphasis on continuous improvement
Experienced management team
Delivering value through a more focused, simplified and strengthened portfolio
FINANCIAL SUMMARYJEFFERIES 2014 GLOBAL INDUSTRIALS CONFERENCE PRESENTATION, AUGUST 13, 2014

Appendix:
2014 Modeling Assumptions
Quarterly Historical Financials
GAAP Reconciliation
GAAP Reconciliation - Segments

2014 Modeling Assumptions
To Assist In Modeling – May Be Subject To Change
21APPENDIX
Depreciation & Amortization $105 - $115 million (Managed Basis)
Capital Expenditure $110 - $120 million
Stock Based Compensation – (expense) $14 million
Pension & OPEB – (income) $2 million
Pension & OPEB – (cash) $40 - $60 million
Interest – (expense and cash) $42 - $46 million
Environmental Remediation – (cash) $20 million
Taxes – (cash) $25 - $35 million
Shares Outstanding (Diluted) 94 million1
(1) Amount represents estimated weighted average Diluted Shares Outstanding and does not include share repurchases made after Q2 2014.
JEFFERIES 2014 GLOBAL INDUSTRIALS CONFERENCE PRESENTATION, AUGUST 13, 2014

534583
546 533 528590 569 544 556
609
$0
$200
$400
$600
$800
1Q 2Q 3Q 4Q 1Q 2Q 3Q 4Q 1Q 2Q 3Q 4Q
7992
7963 68
83
59 6557
84
15%16% 14%
12%
13% 14%
10%
12%
10%
14%
$0
$50
$100
$150
$200
1Q 2Q 3Q 4Q 1Q 2Q 3Q 4Q 1Q 2Q 3Q 4Q
28 2732
4946
34 35
44
23 25
$0
$10
$20
$30
$40
$50
$60
$70
1Q 2Q 3Q 4Q 1Q 2Q 3Q 4Q 1Q 2Q 3Q 4Q
51
65
47
14
22
49
2421
34
59
$0
$20
$40
$60
$80
1Q 2Q 3Q 4Q 1Q 2Q 3Q 4Q 1Q 2Q 3Q 4Q
Quarterly Financial Summary
Quarterly historical financials as of June 30, 2014
Adjusted EBITDA(1)Net Sales
Capital Expenditures(2) Adjusted EBITDA less CapEx
( $ in Millions ) ( $ in Millions )
( $ in Millions ) ( $ in Millions )
(1) See GAAP reconciliation for the computation of Adjusted EBITDA
(2) Excludes capital expenditures for the Antioxidants and Consumer Products businesses, which are now reported as discontinued operations
2012 2013 2014 2012 2013 2014
2012 2013 2014 2012 2013 2014
22APPENDIXJEFFERIES 2014 GLOBAL INDUSTRIALS CONFERENCE PRESENTATION, AUGUST 13, 2014

GAAP Reconciliation
Reconciliation of Net Earnings (Loss) to Adjusted EBITDA
23APPENDIX
NOTE: Adjusted EBITDA includes $6 million and $17 million in costs for 2013 and LTM 2014 , respectively, related to the sale of Chemtura AgroSolutions
JEFFERIES 2014 GLOBAL INDUSTRIALS CONFERENCE PRESENTATION, AUGUST 13, 2014
LTM
($ in Millions) 2014 2013 2012 2011 2010
Net Earnings (Loss) from continuing operations $22 ($22) $103 $68 ($654)
Depreciation and amortization 102 101 100 103 136
Interest expense 52 60 64 63 191
Loss on extinguishment of debt 50 50 1 - 88
Income tax expense (benefit) (5) 18 26 17 15
Facility closures, severance and related cost 23 42 11 3 1
Environmental reserves - 21 - - -
Gain on sale of businesses - - - (27) (2)
UK pension benefit matter - (2) - 8 -
Changes in estimates related to expected allowable claims - - 1 3 35
Reorganization Items, net 1 1 5 19 303
Non cash stock-based compensation 12 13 22 24 8
Impairment charges - - - 4 57
Other expense (income), net 5 (9) (20) (1) 7
Other Operating Adjustments 3 2 - 1 8
Adjusted EBITDA $265 $275 $313 $285 $193
Year Ended December 31,

GAAP Reconciliation - Segments
Reconciliation of Segment Operating Income to Adjusted EBITDA
24APPENDIXJEFFERIES 2014 GLOBAL INDUSTRIALS CONFERENCE PRESENTATION, AUGUST 13, 2014
LTM
($ in Millions) 2014 2013 2012 2011 2010
INDUSTRIAL PERFORMANCE PRODUCTS
Segment Operating Income $102 $109 $102 $116 $110
Depreciation and amortization 34 28 25 26 23
Stock-based compensation expense 1 1 2 2 1
Other Operating Adjustments 2 2 - 1 -
Adjusted EBITDA 139 140 129 145 134
INDUSTRIAL ENGINEERED PRODUCTS
Segment Operating Income $34 $55 $140 $130 $25
Depreciation and amortization 41 43 43 42 99
Stock-based compensation expense 1 1 2 2 1
Other Operating Adjustments 1 - - (1) 2
Adjusted EBITDA 77 99 185 173 127
CHEMTURA AGROSOLUTIONS
Segment Operating Income $101 $88 $65 $30 $21
Depreciation and amortization 11 12 13 10 9
Stock-based compensation expense 1 1 1 2 -
Other Operating Adjustments - - - - 3
Adjusted EBITDA 113 101 79 42 33
Year Ended

Visit us at:
INVESTOR RELATIONS CONTACTS:
Dalip Puri, VP, Investor Relations and Treasurer
Daniel Murray, Senior Investor Relations Analyst
Investor Relations Tel: 1.203.573.2153
http://investor.chemtura.com
NYSE/EURONEXT: CHMT
visit us: www.chemtura.com