chemistry 215 - sfu.ca - simon fraser university€¦ · web view · 2005-08-23reports should be...
TRANSCRIPT
CHEM 215-4Introduction to Analytical Chemistry
Laboratory Manual2004-1
Instructor : Dr. Paul Li

Schedule for Experiments
WK1 and 2 3 and 4 5 and 6 7 and 8 9 and 10
1 Lab briefing and grouping
2 A B C D Break
3 B C D Break A
4 C D Break A B
5 D Break A B C
6 Break A B C D
7 E F G H I
8 F, J G H I E
9 G H I E F, J
10 H I E F, J G
11 I E, J F, J G H
12
13
Experiment Videoa Difficultyb Duration b Page #
A Gravimetric Determination of Chloride * ** 9
B EDTA Titration ** ** 12
C Thermal Gravimetric Analysis (TGA) Yes ** *** 14
D Acid-Base Titration ** *** 20
E Flame Atomic Emission Spectroscopy Yes ** ** 24
F Potentiometry (Ion Selective Electrodes) ** *** 29
G Cyclic Voltammetry (Redox Complexes) Yes ** * 38
H Gas Chromatography - Mass
Spectrometry
Yes ** ** 46
I Literature Study *** *** 52
J Comparison of Analytical Methods * * 53
a) Video must be watched in advance. b) *: easy and short; **: ok and not too long; ***: difficult and long.
1

Table of Contents
General instructions…………………………………………….
…………………………..
3
(A) Gravimetric Determination of Chloride…………………………….……………………... 9
(B) EDTA Titration………………………………………………………….………………… 12
(C) Thermal Gravimetric Analysis (TGA)…………………………………………………….. 14
Appendix 1: Operation of TGA-50…….……………………………………….………… 17
(D) Acid-Base Titration…………………………………………………………………….….. 20
Appendix 2: Calibration of pH
meter……………………………………………………....
22
(E) Flame Atomic Emission Spectroscopy……………………………………………..
………
24
Appendix 3: Operation of the Flame Atomic Spectrometer………………………….
…….
27
(F) Potentiometry (Ion Selective Electrodes)…….…………………………………………… 29
Appendix 4a: Calibration of pH meter for mV
measurement……………………………...
32
Appendix 4b: Theory of ISE………………………………………………………………. 33
(G) Cyclic Voltammetry (Redox Complexes)…...…………………………………………….. 38
Appendix 5: Operation of the CV Instrument……………………………………………... 41
Appendix 6: Cyclic Voltammetry…………………………………………………………. 42
(H) Gas Chromatography - Mass
Spectrometry………………………………………………...
46
Appendix 7: Use of the GC-MS instrument……………………………………………….. 50
(I) Literature Search...…………………………………………………………………….…... 52
(J) Comparison of Analytical
Methods………………………………………………………...
53
2

General instructions
I. OVERVIEW
In this laboratory course, you will analyse various unknown samples using different methods
of analytical chemistry.
First, you will be given an unknown inorganic solid mixture. It contains CaCO3 and NaCl and
may contain an unknown amount of inert impurities. This unknown sample will be used for the first
six different experiments so be sure to use only reasonable quantities of the unknown solid in each
experiment, and store the remainder in the original box. To calculate the amount of unknown sample
to be weighed out for each experiment, assume that the sample contains equal amounts of CaCO3 and
NaCl.
Second, you will perform an electroanalytical study of the behavior of K3Fe(CN)6 under
varying conditions by using a popular electrochemical technique, cyclic voltammetry.
Third, you will determine the concentration of an organic mixture (n-undecane and n-
dodecane) using Gas Chromatography- Mass Spectrometry (GC-MS). The use of an internal standard
(n-decane) is illustrated in this experiment.
In all cases, calibrations using standard solutions are performed and linear regression analysis
is used for data process and analysis.
The theory of each experiment performed in the laboratory, will be covered in lectures.
However, the order that you will carry out the experiments is not in the same as the order of lectures.
Unfortunately, because of limited apparatus and instruments, there is no way to avoid this situation. In
some cases, you will perform an experiment after covering the material in lecture, and some cases, the
situation will be reversed. In both cases, the analogy to conducting scientific research can be made,
sometimes an experiment precedes the theory and sometimes not. Consequently, the experiments
performed in the CHEM 215 course are an excellent opportunity for you to develop scientific
reasoning in the case of an experiment leading the explanation in lecture and also in the case of theory
leading the experiment.
For these measurements, you will need to use equipment to which you have not been
previously introduced, your instructor or teaching assistant (TA) will answer your questions regarding
the theory of these instruments. Therefore, if you are well prepared for the laboratory, and quickly
learn how to operate the instrument, you will find the experiments rewarding and relevant to the
3

lecture materials. However if you are not prepared for the laboratory, you will encounter difficulty
and frustration.
II GENERAL LABORATORY INSTRUCTIONS
1. Each experiment will be performed in groups of two. You will be paired up by the instructor
according to the class list (pairs will be posted). During the experiment, you and your partner
are encouraged to divide the work equally. Answering problems within each experiment, and
preparing the laboratory results can be done with your partner. Individual effort in a group
setting can be very beneficial to your understanding of the material. However, plagiarism is
unacceptable; individual reporting of laboratory results is mandatory.
2. The instrument demonstration, instructional video, or detailed instruction sets, will be
provided for each experiment when appropriate. The TA and course instructor are available to
help you with questions and problems that you may have regarding methodology and/or
theory of each experiment.
III. YOUR OWN SUPPLIES
1. Safety glasses and laboratory coat.
2. All the measurements, observations and caluculations will be recorded in a hard-cover
laboratory notebook. At the end of the semester, this laboratory note book shall be turned in
together with Lab on comparison of analytical methods for grading.
3. A 3.5" high-density computer floppy disk.
4. Scientific calculator.
IV. SAFETY IN THE LABORATORY
1. No student may work in the laboratory unless an instructor or TA is present.
2. Eye protection must be worn at all time in the laboratory. Regular prescription glasses are an
adequate substitute for safety glasses only in the absence of an explosion hazard or where no
hazardous chemicals are being used in the laboratory. Contact lenses must NOT be worn
because many chemical vapours that are present in this laboratory can degrade the polymer
contact lens.
3. Laboratory coats must be worn when working in the laboratory; no open toe shoes are
allowed.
4. No smoking, eating, or drinking is permitted in the laboratory.
5. No unauthorized experiments may be performed.
4

6. Leave coats, bags, and books in the closet besides the main entrance, or at the side or back of
the laboratory where they do NOT obstruct the corridor.
7. Safety Equipment: note where the primary and alternate fire escape routes are in the lab, as
well as the location of the fire extinguishers, the eye wash station, first aid box and the
emergency shower.
8. Rinse any area of skin exposed to direct chemical contact with water for a minimum of fifteen
minutes. Your laboratory partner is responsible for assisting you to an eye-rinse station or
shower, if necessary, and stay with you until you are safe. Also, you or your partner should
ensure that the T.A. or the course instructor is made aware of the accident as soon as possible.
9. In case of laboratory evacuation, leave the room in an orderly fashion.
10. Report all accidents to the TA or the course instructor. Clean up chemical spills immediately.
11. Only students taking the class are permitted in the laboratory. If you wish to talk to someone
who is not a member of the class, please do so outside the laboratory.
12. Wash your hands before leaving the laboratory.
V. OPERATION IN THE LABORATORY
1. Please ensure that the instruments you used during the laboratory period are clean. Wipe up all
spills immediately.
2. Preparation of standard and sample solutions is to be performed only on the benches where
they are well away from electronic equipment. This is to ensure that chemicals are not
accidentally spilled on the electronic components.
3. Use of Chemical reagents
1) be sure to read the chemical reagent bottle label carefully!
2) take only the necessary amount of reagent (make an effort to minimize the waste
chemicals)
3) do not return unused reagents to the supply bottles, please dispose of these agents in
the solid or appropriate liquid waste containers
4) always record weights to as many significant figures as are available. Record the
volumetric error of any liquid dispensing tool that is used
5) put back bottle lids and stoppers immediately after use
6) put back reagent bottles from the plastic containers in the supply area immediately
after use so that other students can find them easily.
5

4. Laboratory Skills
1) PRELAB: Be prepared before you come to each laboratory. Read thoroughly the
information regarding the instrumental technique to be used, do the calculations you need
for the lab, and if available watch the video for the experiment you are going to carry out.
The prelab calculations will be checked by your T.A. or instructor before you can start the
experiments.
2) Record all data and observations in ink in your laboratory notebook
3) The notebook may be checked by the T.A. at the end of each laboratory session
4) Your chemistry skills and general conduct in the laboratory may be evaluated by your
instructor and T.A.
VI. LABORATORY REPORTS
1. ONLY typed reports are acceptable. All laboratory reports are due one week plus one day
after the experiment is complete (by 5 pm). For instance, students who complete the
experiment on Tuesday should hand in the report by 5 pm next Wednesday. Penalty for late
reports will be 10% deduction for every eight-hours late. Reports should be handed in the
marked drop boxes on the other side of the Inorganic Chemistry Lab on the C9000 level. It is
the student’s responsibility to ensure that their TA knows when reports are handed in.
2. Every effort should be made by you, your partner, and the course instructor to facilitate the
exchange of ideas and concepts, but you must write your laboratory reports in YOUR OWN
WORDS. PLAGIARISM IS NOT ACCEPTABLE.
3. Obtain and photocopy all data before leaving the laboratory. The excuse that your parter is at
fault will not be accepted as a justification for a late report.
4. Each report will be graded. You can view the graded report but it is not to be removed from
the laboratory. At the end of the semester, you may sign out your laboratory reports for the
purpose of preparing for the final exam.
5. Format of Laboratory Report
1) TITLE: Expt. D: Thermal Gravimetric analysis
John Smith Student number: 123456 Sections: D0101(Tuesday)
Unknown number: 123 Date of Expt: September 2, 2003
2) ABSTRACT: The abstract should summarize very briefly what was done and what were
the most important findings. It should be written in the past tense, and should normally
be no longer than three sentences.
6
3) INTRODUCTION: The introduction should include the purpose of the experiment and a
brief background of the theory involved, e.g., important chemical reactions and
mathematical equations. Place the number of any references cited, directly in the text as
per the style used in the Analytical Chemistry (Anal. Chem.). The “introduction” should
be written primarily in the present tense.
4) EXPERIMENTAL: Do not copy the procedure from the lab manual as part of your
report. State the most important steps, and describe in your own words any amended
procedures using the past tense.
5) RESULTS AND DISCUSSION: This section should include the pertinent observations
and the calculated results. Data should be presented in the form of tables and graphs as
outlined in the lab manual. The experimental observations should be written in the past
tense. For experiments that involve a number of repetitive calculations, only one sample
calculation is required. All calculations must involve the appropriate error analysis and
attention to the correct number of significant figures.
6) DISCUSSIONS: The discussion involves interpretations of any problems or
experimental errors. If questions appear in the lab manual, they are to be answered in
this section.
7) CONCLUSION: A concluding statement should be made summarizing your most
important findings(s).
8) REFERENCE: Identify your references using the following format take from Analytical
Chemistry, i.e., Author (s), Standard Journal Abbreviation, Year, Volume, Page number.
7

6. Lab reports from A to J will be marked equally as 10 % of the total lab marks. Labs A-H are
marked on a scale as outlined below: (The scale for labs I and J will be some what different,
you will receive this information later on.)
Abstract 5%
Introduction+References 10%
Experimental 10%
Results and Calculations 50%
Discussion 20%
Conclusion 5%
_______________________________________
Total 100%
VII. CHECK-IN PROCEDURE
a) Write down your group number here .
b) Write down your first experiment number here .
c) Write down your unknown sample number here .
d) Check in the items on the assigned bench for each experiment.
VIII. CHECK-OUT PROCEDURE
1. Clean up your working area, ensure instruments are clean and return the chemicals and
equipments to their original location.
2. Please notify your T.A. and your instructor of your final results before you leave the lab.
8

Experiment A: Gravimetric Determination of Chloride
1) Objectives
To determine the weight percent of chloride in the unknown sample.
2) Prelab
a) Read the Gravimetric Analysis Section in Chapter 27 (Sections 1-3).
b) Calculate the weight of the unknown sample needed to produce a 40 ml [Cl-] solution of about
0.02 M (Why 0.02 M?). Assume that the weight percent of NaCl in the unknown is 50%.
3) Theory
Silver chloride, a water-insoluble substance, is formed as a white precipitate when a solution
of silver nitrate is added to a solution containing chloride ion:
AgNO3 + NaCl AgCl + NaNO3
Chloride ion is the limiting reagent in the reaction.
The mixture is warmed for a short period to facilitate coagulation (forming of larger, more
easily filtered particles) of the precipitate. The solid silver chloride is then filtered and dried in an
oven to constant weight.
The porcelain filter crucibles, filter papers and the AgCl are heated to dryness. Then they are
cooled in a dessicator prior to weighing. This procedure is to be repeated until constant weight is
attained. The dessicator has a drying agent, called drierite that should be dried in an oven periodically
throughout the semester.
4) Experimental
Chemicals:
0.02 M AgNO3, 0.1 M AgNO3 (dropping bottle), 6 M HNO3, 1 M HNO3, unknown sample
Equipment:
Ceramic filter crucibles, hot plate, oven
Procedure
1. Dry your unknown sample for 15 min in the oven (take off the lid and put in a beaker,
cover it with a watching glass).
9

2. You are provided with three ceramic filter crucibles. Each one has a number permanently
marked on the side. Record the numbers. Place a piece of 1-cm filter paper in each
crucible. Put the three crucibles into a 400 ml beaker labeled with your name and group
number in the drying oven. Dry them for 10 minutes, remove the beaker from the oven,
and place the crucibles in a dessicator to cool for 10 minutes. Weigh each one accurately
on the analytical balance. Repeat until constant weight is attained (i.e., to within 0.001 g).
3. While the empty crucibles are in the oven, proceed with the experiment. Label three 250
ml beakers with the numbers of your crucibles.
4. Put a known weight of unknown sample in each of the three 250 mL beakers. Add 40 mL
of distilled water to each beaker using a graduated cylinder. Stir each solution with its own
stirring rod. Leave the rod in the beaker.
5. Add about 1 ml of 6 M nitric acid from the reagent bottle on your bench top to each
beaker. (1 drop is ~ 0.05 ml, so 20 drops are required). (Why do you need to add nitric
acid? And how do you know if it is sufficient?)
Note: SILVER NITRATE WILL CAUSE BLACK STAINS ON SKIN, DO NOT GET IT ON
YOUR HANDS! WARE GLOVES FOR PROTECTION.
6. Using a graduated cylinder, add 30 ml of the silver nitrate solution to each of the beakers
containing the unknown. Stir and record your observations. Add more AgNO3 if needed
(How do you know?).
7. Now, warm the three beakers containing the precipitates on a hot plate for 30 minutes. Use
a setting of 2-3 on the dial. Stir the suspension occasionally.
8. Cool the mixtures in an ice-water bath; use a plastic tray to contain the ice-water slush.
Be careful that your beakers do not fall over and spill their contents.
9. Set up the filter flask for suction filtration as directed. Filter each mixture into the crucible
of the correct number, making sure that you transfer all of the silver chloride onto the filter
paper. If any precipitate sticks to the walls of the beaker, scrape it off, using the rubber
policeman on the stirring rod. Make up some dilute HNO3 (i.e., 1M), and wash the
precipitate with it.
10. Return the crucibles to the 400 ml beaker and put them into the drying oven for 20
minutes.
11. Remove the beaker from the oven and place the crucibles in a dessicator for cooling. Cool
for 15 minutes and then weigh the crucibles and filter papers with their precipitates.
10

12. Return them to the oven in the 400 ml beaker for 10 minutes, cool again for the same time
as the empty papers, and re-weigh. Repeat the dry-cool-weigh procedure until a constant
weight is obtained.
4) Report
Results and calculations
1. Report the observations during the experiment.
2. Tabulate the experimental measurements and calculated results.
3. Calculate the weight percent of chloride in the unknown sample for each replicate
determination. Show one sample calculation.
4. Calculate the average weight percent of chloride in the unknown sample.
5. Show the calculation of the standard deviation of the determination. Also write the
values (e.g. 50.0 ± 0.1 %) in the table in Report J.
Discussion
Explain the needs for performing the following steps:
a) Warm the three beakers containing the precipitates on a hot plate for 30 minutes.
b) Wash the precipitate with several small portions of dilute HNO3.
c) Place the crucibles in a dessicator for cooling.
d) Repeat the dry-cool-weigh procedure until a constant weight is obtained.
11
Experiment B: EDTA Titration
1) Objectives
a) To standardize an EDTA standard solution using the primary standard: CaCO3.
b) To determine the total concentrations of Ca2+ and Mg2+ in tap water.
c) To determine the weight percents of Ca in the unknown sample.
2) Prelab
1. Read Ch 13 (Section 13-2, 6 & 7) and Experiment 11 at http://www.whfreeman.com/qca/.
2. Calculate the weight of disodium EDTA necessary to prepare 500 ml of about 0.005 M of
EDTA solution.
3. Calculate the weight of the unknown sample to produce a 250 ml [Ca2+] solution at about
0.005 M. Assume that the weight percent of CaCO3 in the unknown is 50%.
4. Dry the unknown sample.
5. Find out the color range of the Eriochrome black T indicator.
3) Theory: See Ch. 13
4) Experimental
Chemicals
Na2H2Y•2H2O(s), CaCO3(s), 6M HNO3, Eriochrome Black T indicator (kept in ice)
pH 10 buffer, unknown sample
Equipment
pH meter or litmus paper, burettes
Procedure
1. Prepare 500ml of standard EDTA at about 0.005 M.
2. Prepare 250 ml of a primary standard of calcium carbonate at about 0.005 M. Add 10 ml of
distilled water. Then add a minimal volume of 6M HNO3 to dissolve the carbonate and then
dilute with 100ml of distilled water. Raise the pH of this sample to 10 using 25ml of the
buffer (Add the buffer inside the hood). Dilute to the mark.
12

3. Standardize the EDTA against a primary standard of CaCO3. Refer to Experiment 11 on
Internet for instructions and procedure, i.e. indicator and color change. Repeat the titration
twice (i.e., three titrations in total for this step).
Hints for all titrations: good titrations consume ~ 25-35 ml of titrant to reach the endpoint.
(An exception is the titration of a tap water sample which will take considerably less titrant
to reach the endpoint.) 2-3 drops of indicator should be sufficient.
4. Add a small volume (2-3 mL) of pH 10 buffer to a 50 ml aliquot of tap water and titrate it
with your EDTA standard solution. In this titration, any transition metal present in the water
aliquot would be titrated. Note that local Vancouver drinking water contains predominately
Ca2+ and Mg2+. Repeat the titration twice.
5. Prepare a 250 ml solution of your unknown sample at about 0.005 M.
6. Add a small volume (2-3 mL) of pH 10 buffer to 25 ml of unknown solution, then titrate this
sample with EDTA.
7. Repeat step (6) twice.
5) Report
Results and calculations
1. Tabulate all data (i.e., mass of samples used, volumes of samples used per titration, etc.).
2. Calculate the EDTA concentration, weight percent of Ca in the unknown sample and their
standard deviations. Show sample calculations.
3. Calculate the propagated uncertainty and show if it is smaller or greater than the standard
deviation.
4. Determine the total concentrations of Ca2+ and Mg2+ in tap water.
Discussion
1) Explain why these titrations were performed at pH ~ 10.
2) Explain if the titration would reach a satisfactory endpoint if the titration had been performed
at pH = 6?
13
Experiment C: Thermal Gravimetric Analysis (TGA)
NOTE : this laboratory is very time intensive with respect to acquiring the TGA analysis data.
Come to the laboratory on time and be prepared to run the first sample immediately, otherwise you
will NOT be able to finish all of the TGA runs. There is a short instructional video describing the use
of the TGA instrument. Please view the video to understand how to use the balance pan because it is
very small and is easily broken. If you are unsure of the operation of this balance, obtain assistance
from your instructor before continuing. The average time for a single heating cycle is about 60
minutes (30-45minute for the heating stage followed by a 15 minute oven cooling stage). There are
altogether 4 TGA runs.
1) Objectives
a) To obtain and study the TGA curves of CaC2O4, poly(ethylene)glycol and the unknown
sample.
b) To determine the weight percents of Ca in the unknown sample.
2) Prelab
1. Watch the TGA instruction video. This video illustrates how samples can be run on the TGA
instrument. Also, read through the instruction provided in Appendix 1 on the operation of the
instrument.
2. Consult a reference textbook, such as the Handbook of Chemistry and Physics, CRC Press to
obtain the temperatures at which the solids in your unknown sample thermally decompose.
(Hint: check the melting point).
3. Read Ch 27-2: Product Composition.
3) Theory: See Ch 27-2
4) Experimental
Chemicals
The solid sample size for a TGA run is about 3 mg.
a) CaC2O4 (s); b) poly(Ethylene Glycol) (s) (Average Molecular Weight = 8,000)
c) Unknown sample
14

Equipment
TGA-50 Thermogravimetric Analyzer (Shimadzu)
Procedure
NOTE: THE WEIGHING PAN ON THIS BALANCE IS VERY DELICATE, AND THE
BALANCE ARM IS EVEN MORE DELICATE, PLEASE BE CAREFUL.
1. Acquire TGA data for the heating of the following samples. A detailed set of instructions for
proper use of the TGA-50 are included below. Sample size per run is about 3 mg. Be sure to
save the data for each TGA run with a unique filename.
a) CaC2O4 (s) (heating rate 30 ºC/min., max. temperature = 880 ºC)
b) poly(Ethylene Glycol) (s) (heating rate 30 ºC/min., max. temperature = 700 ºC)
Share the results from sample (a) and (b) between the two groups of students
c) Your own unknown sample (heating rate 30 ºC/min., max. temperature = 880 ºC)
It is informative to make visual observations of the sample before and after the TGA run.
2) For each sample, the computer will provide two overlay charts. On the top chart, mass is
plotted against temperature; whereas on the bottom one, the first time derivative of mass (or
the rate of mass change) is plotted against temperature.
3) The gravimetric data is automatically downloaded from the TGA-50 onto the hard drive of the
computer for each run (provided the computer-TGA communication is functioning properly) -
you must provide a unique data file name for each file (see instructions for TGA for proper
file
extension protocol). At the end of the laboratory period, copy the data onto a separate floppy
disk for each student to perform further data analysis using a spreadsheet program, such as
EXCEL.
5) Report
Results and calculations
1. Using a spreadsheet program, prepare a hardcopy graph for each TGA run that was acquired
for each sample, with mass or rate of change of mass on left Y axis and temperature on the X-
axis. On the same graph paper, but using the right Y axis because the relative scales are quite
different, plot the rate of mass change against temperature. Include in each plot the sample
name, initial mass, and heating rate.
2. Indicate on each graph an equation for the chemical reaction taking place at each mass loss
transition.
15

3. From the TGA run on your unknown sample, deduce the weight percent CaCO3 and its
uncertainty.
Discussion
1. Do you think that the samples need to be dried before doing TGA? Why?
2. Explain if you can determine the composition of a mixture of CaC2O4 and CaCO3.
16

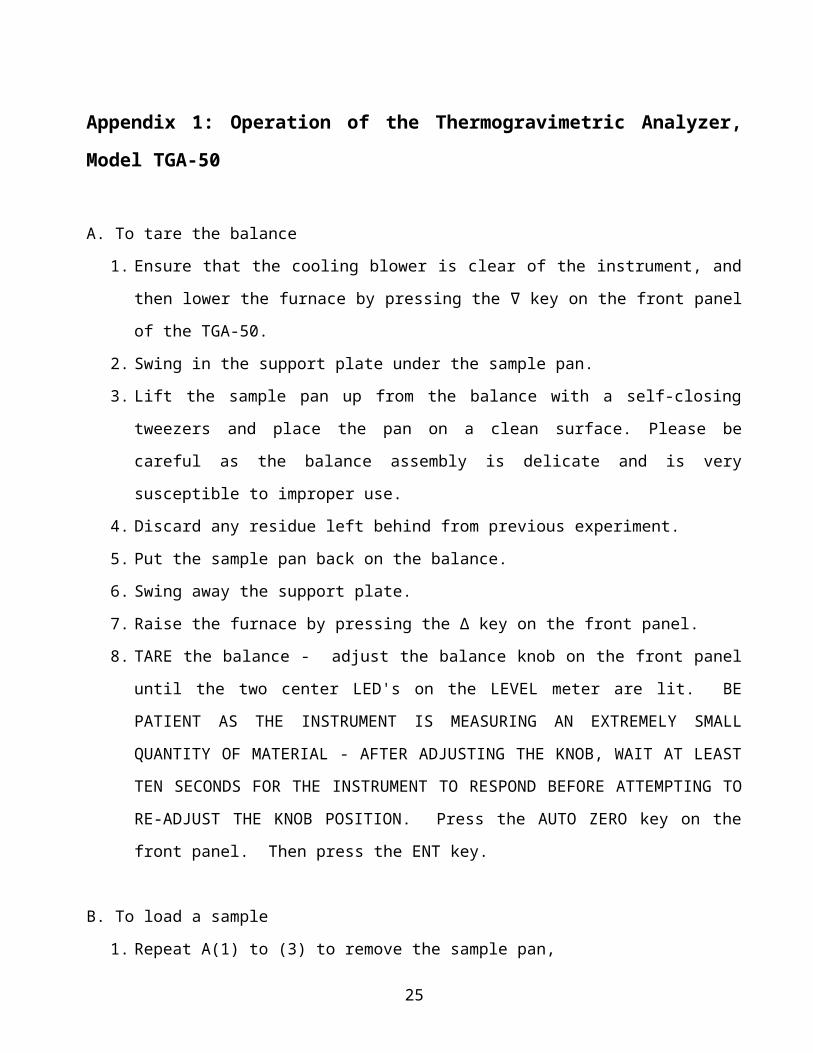
Appendix 1: Operation of the Thermogravimetric Analyzer, Model TGA-50
A. To tare the balance
1. Ensure that the cooling blower is clear of the instrument, and then lower the furnace by
pressing the ∇ key on the front panel of the TGA-50.
2. Swing in the support plate under the sample pan.
3. Lift the sample pan up from the balance with a self-closing tweezers and place the pan on a
clean surface. Please be careful as the balance assembly is delicate and is very susceptible to
improper use.
4. Discard any residue left behind from previous experiment.
5. Put the sample pan back on the balance.
6. Swing away the support plate.
7. Raise the furnace by pressing the ∆ key on the front panel.
8. TARE the balance - adjust the balance knob on the front panel until the two center LED's on
the LEVEL meter are lit. BE PATIENT AS THE INSTRUMENT IS MEASURING AN
EXTREMELY SMALL QUANTITY OF MATERIAL - AFTER ADJUSTING THE KNOB,
WAIT AT LEAST TEN SECONDS FOR THE INSTRUMENT TO RESPOND BEFORE
ATTEMPTING TO RE-ADJUST THE KNOB POSITION. Press the AUTO ZERO key on
the front panel. Then press the ENT key.
B. To load a sample
1. Repeat A(1) to (3) to remove the sample pan,
2. Add a sample until it fills approximately one third of the pan. Ideally, you want to put in
about 3 mg of sample.
3. Continue with A(5 ) to (7).
4. Set the control switch on the cooling blower to “control” (in this mode, the blower will not
turn on until the TGA run has completed),
5. Place the cooling blower so that the nozzle faces up toward the heating element of the furnace.
C. To Program a TGA run
17

1. Press the TEMP PRG key on the front panel of the TGA-50 in order to display the
temperature program on the screen. Use temperature program number one.
2. Press the ENT key until the ºC/min adjustable parameter on the screen is underlined. Use the
∆ or ∇ key to adjust the HEATING RATE to the desired setpoint (e.g. 30 ºC/min). (By
holding down the ∆ or ∇ key, the rate at which the displayed parameter changes more rapidly)
3. Press the ENT key until the FINAL TEMPERATURE ºC adjustable parameter is underlined.
Use the ∆ or ∇ key again to adjust the FINAL TEMPERATURE to the desired setpoint (e.g.
890 ºC).
4. Press the ENT key and then press the TEMP PRG key to store the above setpoints in volatile
memory of TGA-50.
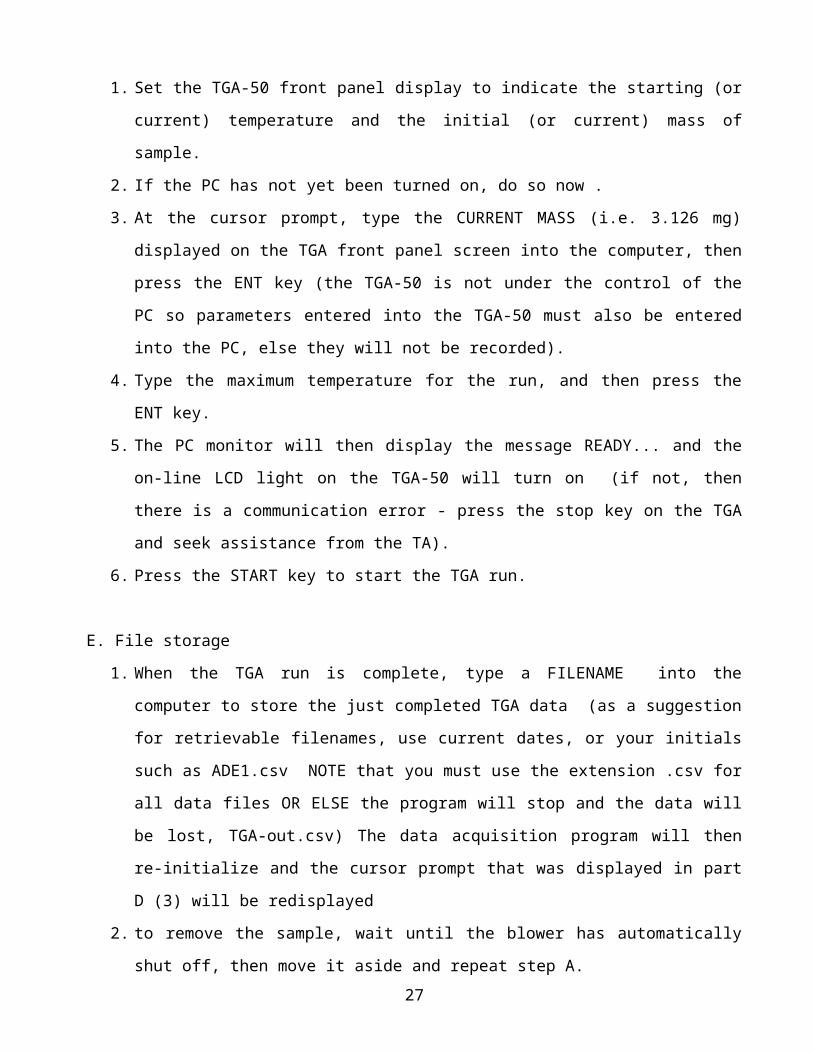
D. Acquiring thermogravimetric data
1. Set the TGA-50 front panel display to indicate the starting (or current) temperature and the
initial (or current) mass of sample.
2. If the PC has not yet been turned on, do so now .
3. At the cursor prompt, type the CURRENT MASS (i.e. 3.126 mg) displayed on the TGA front
panel screen into the computer, then press the ENT key (the TGA-50 is not under the control
of the PC so parameters entered into the TGA-50 must also be entered into the PC, else they
will not be recorded).
4. Type the maximum temperature for the run, and then press the ENT key.
5. The PC monitor will then display the message READY... and the on-line LCD light on the
TGA-50 will turn on (if not, then there is a communication error - press the stop key on the
TGA and seek assistance from the TA).
6. Press the START key to start the TGA run.
E. File storage
1. When the TGA run is complete, type a FILENAME into the computer to store the just
completed TGA data (as a suggestion for retrievable filenames, use current dates, or your
initials such as ADE1.csv NOTE that you must use the extension .csv for all data files OR
ELSE the program will stop and the data will be lost, TGA-out.csv) The data acquisition
program will then re-initialize and the cursor prompt that was displayed in part D (3) will be
redisplayed
2. to remove the sample, wait until the blower has automatically shut off, then move it aside and
repeat step A.18
F. File transfer
1. Type -999 into the PC to exit from the TGA-50 data acquisition program. QBASIC will still
be running. To exit QBASIC and enter DOS, press the ALT key and F key down
simultaneously, release these keys and then press the X key. (From within DOS (at the c:
prompt), type qbasic /run c:\tga50 to re-enter the data acquisition.)
2. Once in DOS, copy all your data files to diskette so that the data may be analyzed later using a
spreadsheet program.
19

Experiment D: Acid-Base Titration
Acid/base characteristics of molecules are said to be a cornerstone in the operation of proteins
as catalysts, and as such, knowledge of the acid/base behavior of molecules is the study of the
building blocks of life. Proton concentration measurement, and acid/base dissociation equilibria
remain a fundamental step in the characterization of a compound.
1) Objectives
1. To standardize an HCl solution using the primary standard: Na2CO3.
2. To standardize a NaOH standard solution using standardized HCl.
3. To determine the weight percent of CO32- in the unknown sample via a back titration.
4. To construct the acid-base titration curve of histidine, and estimate their pKa values.
2) Prelab
1. Read Ch 7-1 (titrations).
2. Read “Reference Procedure: Preparing Standard Acid and Base” on page 256 of the text book
to understand the standardization procedure of a 0.01M HCl solution. What is the volume of
the HCl aliquots used for standardization?
3. Describe, with calculations, the preparation of 100 ml of a 0.01M carbonate solution from
Na2CO3 (s).
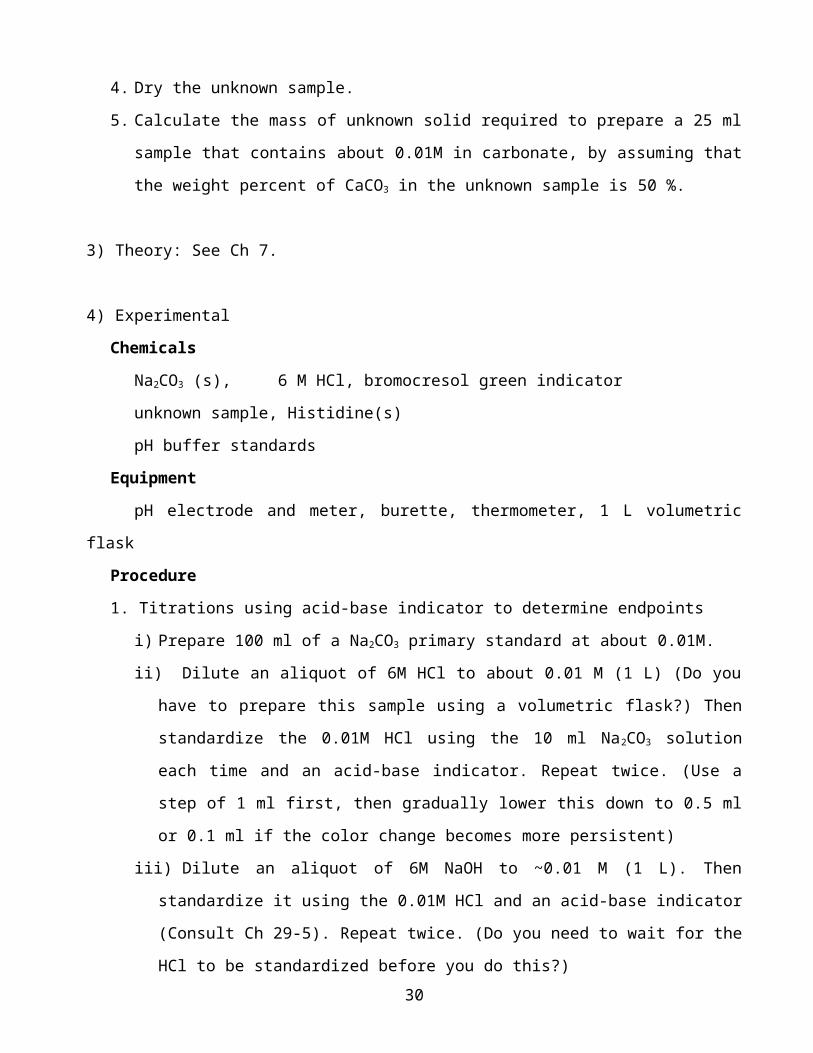
4. Dry the unknown sample.
5. Calculate the mass of unknown solid required to prepare a 25 ml sample that contains about
0.01M in carbonate, by assuming that the weight percent of CaCO3 in the unknown sample is
50 %.
3) Theory: See Ch 7.
4) Experimental
Chemicals
Na2CO3 (s), 6 M HCl, bromocresol green indicator
unknown sample, Histidine(s)
pH buffer standards
20

Equipment
pH electrode and meter, burette, thermometer, 1 L volumetric flask
Procedure
1. Titrations using acid-base indicator to determine endpoints
i) Prepare 100 ml of a Na2CO3 primary standard at about 0.01M.
ii) Dilute an aliquot of 6M HCl to about 0.01 M (1 L) (Do you have to prepare this sample
using a volumetric flask?) Then standardize the 0.01M HCl using the 10 ml Na2CO3
solution each time and an acid-base indicator. Repeat twice. (Use a step of 1 ml first, then
gradually lower this down to 0.5 ml or 0.1 ml if the color change becomes more persistent)
iii) Dilute an aliquot of 6M NaOH to ~0.01 M (1 L). Then standardize it using the 0.01M HCl
and an acid-base indicator (Consult Ch 29-5). Repeat twice. (Do you need to wait for the
HCl to be standardized before you do this?)
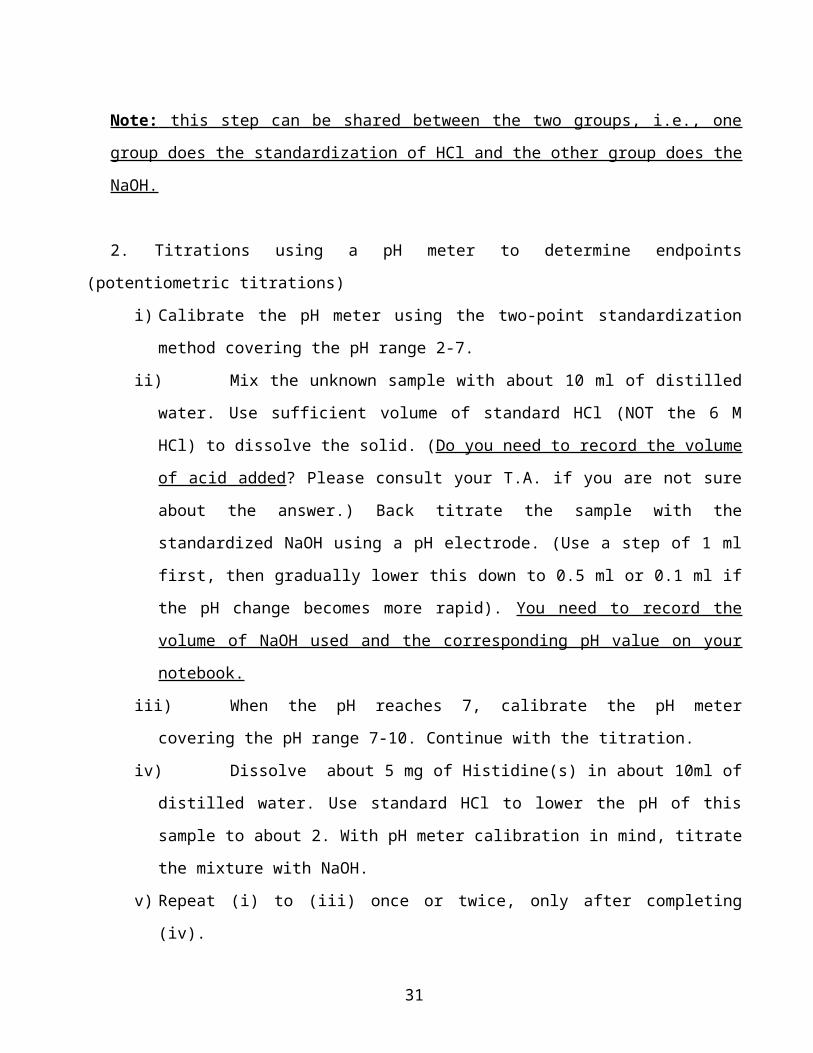
Note: this step can be shared between the two groups, i.e., one group does the standardization of
HCl and the other group does the NaOH.
2. Titrations using a pH meter to determine endpoints (potentiometric titrations)
i) Calibrate the pH meter using the two-point standardization method covering the pH range
2-7.
ii) Mix the unknown sample with about 10 ml of distilled water. Use sufficient volume of
standard HCl (NOT the 6 M HCl) to dissolve the solid. (Do you need to record the volume
of acid added? Please consult your T.A. if you are not sure about the answer.) Back titrate
the sample with the standardized NaOH using a pH electrode. (Use a step of 1 ml first,
then gradually lower this down to 0.5 ml or 0.1 ml if the pH change becomes more rapid).
You need to record the volume of NaOH used and the corresponding pH value on your
notebook.
iii) When the pH reaches 7, calibrate the pH meter covering the pH range 7-10. Continue with
the titration.
iv) Dissolve about 5 mg of Histidine(s) in about 10ml of distilled water. Use standard HCl to
lower the pH of this sample to about 2. With pH meter calibration in mind, titrate the
mixture with NaOH.
v) Repeat (i) to (iii) once or twice, only after completing (iv).
5) Report
21
Results and calculations
1. Tabulate all raw data, and a sample calculation for the standardization of the HCl and NaOH.
2. Plot the pH curves for the back titration of unknown samples based on the record volumes of
NaOH and corresponding pH values.
3. Determine the weight percent of CO32- in the unknown sample. Determine the standard
deviation of the determination too. Put the mean value and standard deviation of the weight
percent of CO32- in Report J.
4. Overlay the titration curve, and its first derivative curve, for histidine (for details, read Ch 12-
5: using derivatives to find end point).
5. Estimate as many of the pKa values as possible from the titration curves of histidine.
Discussions
1. What are the advantages to use a pH meter instead of an indicator for acid-base titrations?
2. Explain why we cannot determine all the three pKa values of histidine from the titration curve.
Appendix 2: Calibration of pH meter (2-Point Standardization)pH electrodes rarely reproduce the Nernstian theoretical output of 59.16 mV per pH unit at
25oC, and all glass electrodes will drop in efficiency with age. Therefore, to measure the pH values of
samples that vary over a range wider than 2 pH units, a two-point standardization method should be
employed to compensate for less than 100% electrode efficiency. The STANDARDIZE control is
used to set the first point, and the SLOPE control sets the second.
At pH 7, the SLOPE control has no effect on the reading. But as readings increasingly differ
from pH 7, the control's effect becomes more pronounced. For this reason, a buffer very close to 7
should always be used as the first standard.
To perform a two-point standardization, proceed as follows:
1. Set FUNCTION selector to STANDBY position and SLOPE control to 100%.
2. Obtain two buffer solutions with values that bracket the desired measuring range (e.g., pH
7.00 and pH 10.00 for samples that fall between pH 7 and 10).
NOTE: For best results, all solutions should be at the same temperature.
3. Place a beaker, containing the buffer nearest in value to pH 7, in position and immerse
electrode(s) into the solution.
22

4. Set TEMPERATURE control to corresponding room temperature (e.g., 22 C). If an ATC
probe is being used, the temperature will be automatically set.
5. Set FUNCTION selector to pH position.
6. Adjust STANDARIZE control until digital display indicates exact buffer value (determine
from the temperature of the buffer).
7. Set FUNCTION selector to STANDBY position.
8. Remove electrode(s) and thermometer from buffer, and rinse electrode(s) with distilled
water.
9. Place a beaker containing the second buffer in position, and immerse electrode(s) into the
solution. NOTE: With buffer and sample solutions maintained at the same temperature,
there should be no need to readjust the TEMPERATURE control.
10. Set FUNCTION selector to pH position.
11. Adjust SLOPE control until digital display indicates exact buffer value (determine from
the temperature of the buffer).
12. Set FUNCTION selector to STANDBY position.
13. Remove electrode(s) from buffer and rinse with distilled water.
14. Measure pH of samples as previously described, being careful not to change positions of
STANDARDIZE or SLOPE controls.
NOTE: When using manual TEMPERATURE control, be sure to set the control to the sample's
temperature.
23
Experiment E: Flame Atomic Emission Spectroscopy
To date, graphite furnace atomic absorption techniques remain in widespread use in analytical
laboratories, especially when solid and or extremely small quantities of sample are available. Also,
the fundamentals on which plasma mass spectrometry is based are also the same as flame atomic
emission or absorption spectrometry. Hence, knowledge of flame atomic emission spectroscopy lays
the groundwork for understanding the modern elemental analysis techniques in use today. Atomic
spectroscopy techniques provide rapid and reliable ways in which solution concentrations of cations
can be determined, and as such, tens of thousands of elemental analyses are conducted worldwide
each day.
By all standards, modern elemental analysis has been supplanted by plasma mass spectrometry
(Inductively Coupled Plasma-Mass Spectrometry) because of the very low detection limits (sub part
per trillion (ppt)) that this technique affords. The first elemental determinations were performed by
EDTA titration around the time of the 1940-1950's. Titrations are able to provide parts per thousand
detection limits. With the introduction of flame atomic absorption and emission spectrometry in the
1960's, titration determinations of metal ions in solution was replaced with the new technique that was
faster and provided lower detection limits (parts per million (ppm)). In the 1970's plasma emission
spectrometry replaced flame absorption because it was capable of simultaneous multi-element
analysis with part per billion (ppb) detection limits.
1) Objectives
1. To determine the weight percents of Ca2+ and Na+ in the unknown sample using calibration
curves.
2. To determine the Ksp of CaCO3.
2) Prelab
1. Read Ch 6-3: solubility product and Ch 9-3: systematic treatment of equilibrium from the
course textbook.
2. Watch video available that describes the use of the flame atomic emission spectrometer.
3. Dry the unknown sample.
4. Using your unknown sample, calculate the mass of unknown solid required to prepare a 100
ml solution that is 100 ppm in Ca by assuming that the sample contains 50 wt % of CaCO3.
5. Calculate the mass of CaCO3 and NaCl to prepare 500 ml of 100 ppm standard solutions.
24
6. Describe how you can prepare the 1, 3, 5, and 10 ppm standard solutions from the 100 ppm
standards.
3) Theory: See Ch 21.
4) Experimental
Chemicals
Pure CaCO3 (s) and NaCl (s), unknown sample, boiled distilled water
Equipment
Flame Atomic Absorption/Emission Spectrometer
Procedure
1. Preparation of unknown sample for solubility product determination of CaCO3: Use about 100
mg of the unknown solid sample. Place the unknown solid sample into a 25 ml beaker and add
about 20ml of boiled distilled water. This suspension should be stirred often, and allowed to
equilibrate for more than 1 hour. WITH THE SOLID SAMPLE STILL IN THE SOLUTION,
filter the suspension. It is essential that you filter this sample, otherwise the nebulizer on the
atomic emission instrument will be clogged. Measure the pH of this sample (see Appendix 3
for details of calibration and operation of a pH meter). Because atomic spectroscopic
techniques are sensitive, this sample needs to be diluted so that [Ca2+] falls in the calibration
range.
2. Preparation of unknown sample for total metal content determination: This sample (sample II)
will be used to quantitate both the Ca2+ and Na+ in the sample. Based on your calculation from
the prelab. Accurately weigh the mass of unknown sample. Put in 10 ml of distilled water.
Add a minimum amount of acid (HCl or HNO3) to dissolve the unknown solid. Transfer the
solution to a 100-ml volumetric flask and then dilute it to the mark.
3. Preparation of standard solutions: prepare 500 ml of 100 ppm stock solutions of Ca2+ and Na+.
The standards should be diluted to contain 1, 3, 5, and 10 ppm each of Ca2+ and Na+.
4. Ensure that the instrument is operating properly - nebulize the 10 ppm standard and ensure
that a signal is being detected. Check with your TA or instructor prior to continuing.
5. Introduce the 1 ppm Ca2+ standards, with a blank in between, then from the lowest to highest
concentration. Record in your lab notebook five replicate measurements of the signal, and
calculate the average and standard deviation.
6. Use a graph paper, plot the signal from the instrument versus [Ca2+]. Is the plot linear? If
there is any outliners, measure the signal for that standard again. If a linear response is
25
observed for the external standards, dilute your unknown sample accurately until a reading for
the Ca2+ in your sample (sample I and II) falls into the range of signal intensity covered by the
external standards. This is called bracketing and it is essential to the method that this criteria
be meet, otherwise the calibration is not accurate. Again, be sure to record five signal intensity
measurements for [Ca2+] of the sample that is bracketed.
7. Wait for another group to finish the experiments with Ca2+. Then repeat steps (4) to (6) for Na+
to determine [Na+] only in sample II.
5) Report
Results and calculations
1. Tabulate the experimental data for the preparation of the two unknown samples used in this
experiment.
2. Construct a calibration graph for [Ca2+], and mark on it the signal intensity for sample I and II.
Report the linear regression equation for the calibration line.
3. Construct a calibration graph for [Na+], and mark on it the signal intensity for sample II.
Report the linear regression equation for the calibration line. Note that the determination of
the uncertainties (standard deviations) of the slope and intercept of a fitted line can be found
on Page 84 of the text book (Finding sy, sm, and sb with a Spreadsheet).
4. From the determined values of [Ca2+] and [Na+] in sample II, calculate the weight percent of
each of the two cations in the original solid sample plus their uncertainties. Report these
values in report J.
5. From the determined values of [Ca2+] in sample I, calculate the Ksp of CaCO3.
Determination of Ksp of CaCO3 based on the measured pH and the following equations:
(1)
(2)
(3)
(4)
(5)
26

Discussions
1. In the preparation of sample II, explain why a minimum amount of acid should be added
to dissolve the sample.
2. Explain why distilled water needs to be boiled.
Appendix 3: Operation of the Flame Atomic Absorption/Emission
Spectrophotometer
1. Turn on the instrument. Power is applied to this instrument via the green toggle switch
located on the lower left-hand side of the front of this instrument.
2. If the monitor is not currently displaying the array of stored elements available for analysis by
this instrument, press the white key: element select. Initialize the instrument for Calcium
atomic atom determinations. Type in the number 20, and then select the green key: element
by pressing the gray key associated with it. (20 is the element number for Calcium in the
element-list array stored in the instrument memory).
3. Change the subroutine of the computer by pressing the white key: setup. With this subroutine,
the desired wavelength (of the selected element), which the monochromator is to be set to, is
displayed in the top middle of the monitor. Note this wavelength in your lab notebook. The
actual current wavelength of the monochromator is displayed on the lower middle section of
the monitor. While the wavelength of the monochromator is being scanned, the wavelength in
the lower middle section of the monochromator will be flashing.
4. Change the subroutine to program the instrument by pressing the white key: Program. Ensure
that the spectrophotometer is initialized to operate in the EMISSION mode of operation, by
selecting the green key: emission. Ensure that the hollow cathode lamp current is 0. If the
Hollow Cathode Lamp (HCL) Current is not zero, use the arrow and numeric key pad to
change the HCL current to zero. Note also the other parameters that can be controlled by the
user of the instrument (i.e. integration time, etc.).
5. Press the white key: setup. You will see a bar graph displaying the detector signal intensity.
6. Ask your T.A./instructor to light the flame. (Air on/C2H2 on/red key/sound/light)
7. Aspirate distilled water (the blank).
8. The bar graph will now be off-scale. Press the white key: gain. The bar graph intensity should
be mid-scale now. Depressing the gain key in the setup mode causes the photomultiplier tube
27
(PMT) high voltage to be adjusted to the optimum range and the bar graph is set to a mid-
range value.
9. Aspirate the 10 ppm Ca standard. You should see that the bar graph display indicates an
increased intensity of photons striking the detector. If there is not an increase in intensity,
seek instruction from your T.A./instructor.
10. Press the white key: gain. The bar graph intensity should return to mid-scale.
11. Press the green key: wavelength. The instrument will then run a subroutine to establish that
the wavelength of the monochromator is set to the optimum wavelength for detecting the
calcium atomic emission. Note the actual wavelength of the monochromator in your
notebook.
12. Continue to aspirate the 10 ppm Ca standard. Press the white key:cont to enter the continuous
mode. You will now see a trace showing the variation in signal intensity recorded at the PMT.
Press the white key: gain. Depressing the gain key in the continuous mode while aspirating the
most concentrated solution sets the full scale range of the PMT.
13. Change subroutines to the run mode by pressing the white key: run. Select the green key:
autozero while aspirating the blank.
14. Establish the calibration response of the instrument for the calcium standards. At this time, do
not press either the gain or zero key again. Beginning with the blank, press the blue key
“read” to record five measurements of the emission intensity for this standard, then repeat for
each successively higher concentration standard up to 10 ppm Ca.
15. Next measure the Ca atom emission signal intensity for the samples. Dilute these samples
accordingly until the emission signal intensity of the Ca is within the range defined by the
calibration response function obtained with the standards.
16. Repeat the experiments with Na. Note that you need to select 11 for sodium.
17. When you have finished all experiment, ask the T.A. or instructor to extinguish the flame.
(C2H2 off/Air off/Atom Contr/Check gases/ fuel/oxidant)
28

Experiment F: Potentiometry (Ion Selective Electrodes)
In this experiment, you will use the ion selective electrode (ISE) to measure,
potentiometrically, the concentration of analyte ions in solution. Also, some very fundamental
concepts in wet chemistry are also introduced (serial dilution, constant ionic strength) that are used
extensively in all areas of chemistry.
1) Objectives
1. To describe the effect of constant ionic strength on the ISE measurement of [F-].
2. To determine the selectivity coefficient for the F- electrode relative to OH-.
3. To establish the calibration curves for F- standards and to determine the amount of F- in tap
water
4. To establish the calibration curves for Ca2+ standards and to determine the amount of Ca2+ in
the unknown sample
2) Prelab
1. Read Appendix 4: ISE, and Ch 8-1 and -2: Ionic strength and activity.
2. You need to understand how to prepare a set of calibration standards using the method of
serial dilution. Serial dilution means that an aliquot from a concentrated standard is transferred
to a new volumetric flask, and then diluted to mark. The new standard at a known lower
concentration, based on the dilution factor, can then be further diluted in the same manner.
This procedure, which is known as the method of serial dilution, will generate a set of
calibration standards for the analyte species.
For example, suppose a 0.1M sample of NaF has been prepared. This solution is called
the stock solution. For instance, two calibration standards be prepared with the F-
concentration at 0.01 and 0.001M,
a. 1st dilution: Take a 10ml aliquot from the 0.1M stock solution of NaF and deliver
this to a 100ml volumetric flask, and dilute to mark. This is the first standard
(standard #1) of the two required standards. What is the F - concentration in this
sample?
29

b. 2nd dilution: Take a 10 ml aliquot from standard #1 and deliver this to a 100ml
volumetric flask, and dilute to mark. This is the second standard (standard #2) of the
two required standards. What is the F- concentration in this sample?
3. Dry the unknown sample.
4. Calculate the mass of unknown sample required to prepare a 250 ml sample that is ~ 1×10 -3 M
in Ca2+, by assuming that the weight percent of CaCO3 to be 50%.
3) Theory: See Appendix 4b
4) Experimental
Materials
Total ionic strength adjuster for F- (TISAB): Slowly add 230 ml of concentrated acetic acid,
232 g of NaCl, and 15 g of EDTA in a 4 L flask. After the solids have dissolved, allow the solution to
cool to room temperature. Slowly add 150 g of NaOH. After the solids have dissolved, allow the
solution to cool to room temperature. Adjust the pH to 5.25 with small addition of 5 M NaOH. Fill to
the mark with distilled water.
Ionic strength adjuster for Ca2+ (ISA ): 4 M KCl (Dissolve 2.98 g KCl in 10 mL of distilled
water). Note that these two solutions have been prepared for you.
0.1M NaF solution (check for accurate molarity from your T.A. or instructor)
6M NaOH
tap water, unknown sample, toothpaste
Equipment
Fluoride and Calcium ion selective electrode
pH meter/voltmeter
Procedure
1. Fluoride ion-selective electrode
All fluoride containing solutions should be prepared in normal laboratory glassware and then
used within 2 hours. Solutions not used within 2 hours should be discarded.
Measure the fluoride ion-selective electrode response of test solutions using a plastic beaker.
(Note, the electrode potential may drift during the course of the measurement. Stirring the
solution with a magnetic stirrer helps to minimize electrode drift. If there is substantial drift in the
30
electrode potential, record the potential for each solution at a fixed time after immersing the
electrodes in it.)
Operation of the ion-selective electrode meter will be demonstrated by the TA or course
instructor. The fluoride ion potential is measured by sensing the potential on each side of the
doped LaF3 crystal using an internal electrode within the fluoride ion-selective electrode and an
external reference electrode that is also in contact with the solution.
1. Prepare, by serial dilution, a set of 5 external standards spanning the range from 1×10 -6 to
1×10⁻² M NaF.
2. Measure the response of the fluoride ISE for this set of standards in as short a period of time
as possible. (Do you think you should measure the most dilute standard first? Why?) Check
the ISE response with a blank (i.e., distilled water).
3. Add 10 ml of TISAB to 10 ml of each of the five standards and the blank. Then measure the
response of the fluoride ISE for this set of standards with controlled ionic strength. Check the
ISE response with a blank. Do you think this blank should be different from that in (2)?
4. Measure the fluoride ISE response for a sample of tap water and toothpaste. Remember to add
TISAB.
5. Determination of kF-, OH- using the separate solution method. Using 6 M NaOH, prepare a
solution with pOH of 3. Check with a pH meter. Mix this solution with an equal volume of the
pF 3 solution, and this is solution A. Mix the pF 3 solution with an equal volume of distilled
water, and this is solution B. Then measure the response of the fluoride ion selective electrode
for solutions A and B.
2. Calcium ion-selective electrode
1. Soak the Ca2+ ISE in 0.1 M Ca2+ for 30 min. before taking any measurement. Do not wipe or
rub the sensing membrane of the ISE.
2. With the help of acid (HCl or HNO3), prepare a 250 ml solution of the unknown sample (~
1×10⁻³ M in Ca2+).
3. Using solid CaCO3, with the help of acid, prepare a stock solution of Ca2+ at 0.1 M. Then
prepare, by serial dilution, four Ca2+ standards ranging from 1×10⁻² to 1×10⁻⁵M.
4. Add 1.0 ml of the ISA to every 20 ml of sample or standard solution. Then measure the
response of the Ca2+ electrode to the calibration standards. Then measure the response of this
electrode to the unknown [Ca2+] in the carbonate sample. Dilute the carbonate sample
accordingly to ensure that the [Ca2+] is bracketed by the response of the Ca2+ in the two
31
calibration standards (alternatively, if the response to Ca2+ in the unknown carbonate sample is
lower than the response to the Ca2+ from the 1×10⁻⁵ M Ca2+ standard, then dilute this standard).
5) Report
Results and Calculations
1. Tabulate all the data for F- and Ca2+ ISE on one page.
2. Establish the working curves for the two sets of F- calibration standards. Properly label the
title and axes on each plot. Indicate the linear region of the curve? (This means, for what range
of solute concentration does a linear relationship exist for the electrode response.) Did the
calibration obtained at constant ionic strength generate better data? (Hint: What should be the
magnitude of the slope of this regression line? Examine the Nernst Equation.)
3. Determine the amount of F- in tap water and toothpaste and their associated uncertainties.
4. Calculate the selectivity coefficient for the F- electrode relative to OH- (kF-, OH-).
5. Plot the calibration curve for Ca2+ ISE response and determine the weight percent of Ca2+ in
the unknown sample. Report the equation of linear regression line and the uncertainty
associated with the determination.
Discussions
1. Calculate the ionic strength of the four standard solutions used in the Ca2+ ISE experiments
(with and without adding of the ISA).
2. What are the purpose of using TISAB and ISA?
Appendix 4a: Calibration of pH meter for millivolt measurement
The meter is a convenient tool for measuring electrode potential and indicating results in
millivolts. The procedure is similar to that for pH determinations except that a metallic indicator
electrode (or element if using a metallic combination electrode) is employed instead of a glass
indicator electrode. Additionally, there is no need to standardize the instrument with a buffer
solution. Readings can be taken as soon as the millivolt zero reference is established.
With preliminary procedures completed, perform millivolt or redox measurements as follows:
1. Set FUNCTION selector to STANDBY position.
32

2. Connect the Shorting cap to the INPUT jack of the meter.
3. Set FUNCTION selector to MV.
4. Adjust STANDARDIZE control until digital display indicates 0 millivolts.
5. Set FUNCTION selector to STANDBY.
6. Remove shorting cap from instrument.
7. Mount and connect electrode(s) as directed by Electrode Installation under
PRELIMINARY PROCEDURES.
8. Immerse electrode(s) into sample solution.
9. Allow sufficient time for electrode(s) to reach thermal equilibrium with sample solution
(normally about two minutes).
10. Set FUNCTION selector to MV.
11. Read potential of sample from digital display.
12. Set FUNCTION selector to STANDBY.
13. Remove electrode(s) from solution.
14. To avoid contamination of one solution with another, rinse electrode(s) with distilled water
before proceeding with next measurement.
15. Repeat steps 8 through 14 for remaining samples.
Appendix 4b: Theory of ISE
Potentiometry depends on the fact that the potential of an electrode is determined by the
concentration (more correctly, activity) of one or more species in solution to which it is sensitive.
Other parts of the equipment are the reference electrode and a potential measuring device. The ideal
indicator electrode would respond specifically to
only one species - a condition never fully realized in
practice; instead, indicator electrodes are selective
in performance, responding to a limited number of
species in solution. The potentials of the reference
electrode and the liquid junctions should stay
constant with respect to the solution of the analyte of
interest. Common reference electrodes are the
calomel, Hg(s) | Hg2Cl2(s) |Cl-) and Ag(s) | AgCl(s) |
Cl- electrodes.
33
Typically, an ISE consists of (i) an internal reference electrode, (ii) an internal reference
solution, and a (iii) an ion selective membrane. The potential across the membrane depends on two
activities - that of the internal "membrane active" ion (or ions), and that of the external "membrane
active" ion(s).
For solutions containing only one ion An to which the ion selective electrode is responsive, or
for electrodes that are truly ion specific, the cell potential is given by
when the membrane behavior is ideal. A is the activity of the ion An, and the value , the
electromotive efficiency, is close to one. For solutions containing interfering ions with the same chare
as the primary ion, the cell potential is approximately given by:
where AX is the activity of an interfering species (X), and kA,X is the selectivity coefficient.
In a solid state electrode, the membrane may be (i) glass, (ii) a single crystal of an insoluble
compound of the ion, (iii) a pellet or mixed pellet of insoluble salts, or (iv) an active component in an
inert binder. The internal filling solution is usually a 0.1 M solution of the sodium salt of the ion and
0.1 M sodium chloride. Electrical contact is made with a silver-silver chloride wire which forms an
internal reference. When the electrode is immersed in a solution of the ion being measured, an
electrical potential difference is established across the membrane and its magnitude depends upon the
ratio of ion concentrations (activities) in the inner and outer solutions.
The fluoride electrode has a single crystal of an insoluble pure rare-earth fluoride such as
LaF3, NdF3, PrF3. Lanthanum trifluoride is usually used. The crystal is 1 cm in diameter and 1-2 mm
thick. This is sealed to the end of a plastic tube with an epoxy resin. It is critical that this seal be
waster-tight. Pure rare-earth fluorides are unique among known crystalline materials in having a high
electrical conductance that results from mobile fluoride ions in the crystalline lattice. This is further
enhanced by doping the crystal with the divalent ion, Eu2+, which creates lattice defects with
dimensions that are optimal for the fluoride ion. The lower concentration limit of usefulness is
limited by the Ksp for LaF3. La3+ can also be determined with the electrode, provided fluoride is
absent.
The potential of the electrode is measured against a standard calomel reference electrode. The
cell may be represented by
The response of the F- electrode can be described in the form of
34
(1)
The constant is determined by several factors but it is accounted for by calibrating the
response of the electrode to a known standard solution of fluoride ion.
Equations 1 is obeyed over a range of fluoride ion concentration, from 1 M down to 10 6 M,
(i.e., pF 0 to 6). Below 106 M, the potential becomes almost constant. This is thought to be due to
the fact that at this low concentration the lanthanum fluoride membrane contributes more fluoride ion
to the solution than is originally present.
The fluoride ion selective electrode responds to both fluoride ion and hydroxide ion. To
reduce the interference from hydroxide ion, the pH is lowered to less than seven. Fluoride ion is also
a weak base (pKa (HF) = 3.14) and forms complexes with beryllium, aluminum, ferric and some other
multivalent cations. To provide accurate results one must (i) buffer the solution (so that [F ]/[Ftotal] is
constant in every sample), (ii) complex metal ions with suitable ligands such as citrate, phosphate or
nitriloacetates (to prevent the formation of fluoride complexes), and (iii) adjust the ionic strength
(remember, the activity coefficient depends on the ionic strength). One way to simplify the analytical
procedure is to add a total ionic strength adjuster buffer (TISAB) to the sample. A common TISAB in
fluoride determinations contains NaCl (1 M), an acetic acid/sodium acetate buffer (pH 5.0), and 1.2-
cyclohexylenedinitrilo tetraacetic acid (CDTA) (very similar to EDTA) to complex metal ions.
Concentration vs. Activity
To be accurate, a specific ion electrode measures the activity of an ion in solution. In
analytical work, however, concentration is the quantity normally required. Activity and molar
concentration are directly related by a parameter called the activity coefficient. The latter varies in
value, depending on the ionic strength of the solution. Ionic strength is determined by the
concentrations and charges of all of the ions in solution. The relationship of activity coefficient to
ionic strength is complex, and is given by the Debye-Hückel equation (see equations below):
(Ax is the activity, x is the activity
coefficient)
(, the ionic strength, z, change)
(Debye-Hückel equation)
( is the effective hydrated radius)
35

In very dilute solutions, is very close to unity and the activity and the concentration of an
ion are equal. In solutions where ionic strength is higher than 10 -2 M, the discrepancy between
activity and concentration can no longer be ignored (see Table 4). Since an electrode responds to
activity, it is evident that identical concentrations of an ion in solutions of different ionic strengths
will produce different responses. Clearly, STANDARDS and UNKNOWNS should have the same
ionic strength - achieved by using a total ionic strength adjuster buffer (TISAB).
Practical Considerations in the Use of Specific Ion Electrodes
Every specific ion electrode is subject to interference from other ions. The hydrogen ion
electrode cannot be used in high concentration of sodium or hydroxide ion. The fluoride electrode is
not affected by such common anions as chloride, nitrate, bicarbonate, sulfate, phosphate or acetate,
but significant interference comes from hydroxide ion which is similar in charge and size to fluoride.
When the concentration of the hydroxide equals that of the fluoride, interference is significant, and it
increases rapidly if the hydroxide concentration exceeds that of fluoride. If the pH is 8 then the lower
limit of fluoride concentration is 106 M but if fluoride is higher, e.g. 102 M, then the pH can be as
high as 12 without serious error.
In samples where no metal fluoride complexes are present, fluoride concentration can be
determined by calibrating the electrode against solutions of known concentrations. The concentration
of the unknown sample is then measured directly. The total ionic strength of the unknown compared
to that of the standards will influence the accuracy of the measurement, as this is the factor which
determines the difference between activity and concentration (Note it is activity that the electrode
measures). In dilute solutions, in less than 103 M of total ionic strength, the ionic strength difference
between the sample and standards can be in the ratio 5:1 without serious error but for = 0.1 to 0.01
M, the samples and standards must be within 20% in ionic strength. The choice of the TISAB
depends on the composition of the sample. It is assumed that the final ionic strength is dominated by
the TISAB and is insignificantly affected by the original level of ions in unknowns and standards.
When ions that combine with or form complexes with fluoride ion (e.g. hydronium, ferric,
aluminum, magnesium, beryllium) are present, the total fluoride ion concentration can be measured
only by destroying the complexes and then adjusting the sample solution to a fixed total ionic
strength. A polyvalent anion such as citrate or phosphate which preferentially complexes with the
metal(s) is added to release the bound fluoride (e.g. from a complex such as FeF63-). The total ionic
strength must also be adjusted. This is achieved by adding a total ionic strength adjustment buffer
(TISAB), usually composed of 1 M KCl, 1M KOAc and 0.001 M potassium citrate (or phosphate).
36
This adjusts the pH and the citrate (or phosphate) complexes any polyvalent cation. This buffer is
used for all water analyses, where samples come from many sources.
In acid solutions, fluoride is bound by hydrogen at pH < 5 forming HF and HF 2-. The pH
must be adjusted to the very weakly acid region using a large amount of sodium or potassium acetate
solution. This also has the effect of fixing the total ionic strength.
37
Experiment G: Cyclic Voltammetry (Redox Complexes)
There are numerous variations of electrochemical techniques available to the modern chemist
ranging from voltage to current measurement of an electron exchange reaction. Many of the modern
techniques are quite specialized, and as such, some prior knowledge of the electrochemical behavior
of the species being studied is crucial. The chemist often turns first to cyclic voltammetry, in order to
measure the redox behavior (reversible or non-reversible) and obtain an estimate of the chemical
reaction rates of the species of interest. In this respect, cyclic voltammetry is indispensable as a tool
in its ability to provide much information rapidly and easily about the electrochemical behavior of a
compound.
1) Objectives
1. To study cyclic voltammograms of K3Fe(CN)6 in terms of different support electrolytes.
2. To study cyclic voltammograms of K3Fe(CN)6 in terms of various voltage sweep rates.
3. To study cyclic voltammograms of K3Fe(CN)6 in terms of different analyte concentrations.
4. To determine the values of E’, Ipc, (Epa – Epc) for the reduction of K3Fe(CN)6 in 0.1 M KCl
2) Prelab
1. Read Appendix 5 for the operation of the cyclic voltammetry instrument.
2. Read Appendix 6 (Kissinger, P. T.; Heineman, W. R. J. Chem. Educ. 1983, 60, 702–706).
3) Experimental
Chemicals
0.1 M KCl, 0.1 M Na2SO4
1×10⁻³M potassium ferricyanide (K3Fe(CN)6) in 0.1 M KCl
5×10⁻⁴M potassium ferricyanide (K3Fe(CN)6) in 0.1 M KCl
1×10⁻³M potassium ferricyanide (K3Fe(CN)6) in 0.1 M Na2SO4
Equipment
Floppy Disk
EG&G Potentiostat
Electrochemical Cell Stand and Faraday Cage
Electrode kit:
38

1. Reference electrode: Ag|AgCl|3 M NaCl (this electrode is stored in 3 M NaCl, please keep
this electrode immersed in the 3M NaCl solution until ready to use. At the end of the
experiment, return this reference electrode immersed in the solution of 3 M NaCl)
2. Working electrode: platinum
3. Auxiliary Electrode: platinum Wire, model MW-4130
4. C2 cell stand beaker
Procedure
1. Polish the working electrode and set up the instrument (see Appendix 5).
2. The scan limits are from + 0.8 V to -0.2 V relative to the reference electrode. This is
considered as a negative scan.
3. Acquire a single CV scan at 20 mV/sec for the solution of 1×10⁻³ M K3Fe(CN)6 in 0.1 M
KCl. If you do not have a good scan, seek assistance from the T.A. and instructor
immediately. There may be problems with electrodes, electrical connection, electrode
cleanliness, and so on.
4. Be sure to record all parameters for each of your CV file on your notebook.
a. initial and final point potentials of the CV scan
b. scan rate
c. the sample solution
5. Clean the solution from the cell beaker into a larger container, not directly into the sink.
6. Put in the 0.1 M KCl solution. Then acquire a CV scan at 20 mV/sec for this solution at
the same condition outlined above.
7. Put in the solution containing 5×10⁻⁴ M K3Fe(CN)6 in 0.1 M KCl. Acquire a CV scan at 20
mV/sec for this solution.
8. Acquire two independent CV scans at 20 mV/sec for the solutions: (a) 1×10⁻³ M
K3Fe(CN)6in 0.1 M Na2SO4 (b) 0.1 M Na2SO4
9. Repolish the electrode, and acquire 12 CV scans on the solution (1×10⁻³ M K3Fe(CN)6 in
0.1 M KCl) over the range of scan rates from 5 to 200 mV/sec, starting from the high scan
rate. After each CV scan, allow for a 'rest' period of 2 min before proceeding to the next
scan rate. Also, ensure save your data for each scan as a separate file and record the file
name and parameters for the scan.
4) Report
39

Results and calculations
1. Identify on the CV curve obtained at a scan rate of 20 mV/s with the solution 1.0×10 -3 M
K3Fe(CN)6 in 0.1 M KCl the following information:
a) the initial point of the CV, label this point a
b) the peak cathodic current, Ipc, label this point b
c & d) the two inflection points, one on each side of the Ipc and label then respectively
points c and d
e) the turn around point for the potential scan, label this point e
f) the peak anodic current, Ipa, label it f
g & h) the two inflection points, one on each side of the Ipa and label then respectively
points g and h
2. Measure E' for the reduction of K3Fe(CN)6 in 0.1 M KCl. How does this value compare with
the standard electrode potential (E)?
3. From the two overlay CV scans (using Excel to read the two files, and plot the two CV curves
together), explain the difference in the shape of cyclic voltammogram of the solution of
K3Fe(CN)6 in KCl in two different concentrations.
4. From the 2 overlay CV scans, explain the difference in the shape of cyclic voltammogram of
the solution of K3Fe(CN)6 in two different supporting electrolyte.
5. From the 12 overlay scans, measure ipc at all scan rates. Tabulate the data. Plot ipc versus
square root of scan rate. What do you find?
Discussion
1. Why does the current (either cathodic or anodic) rise to a maximum, and then drop to a lower
value that then becomes fairly constant. (Hint: see Fig. 3 from appendix 6).
2. What was the voltage separation between Epc and Epa at all scan rates? What does the Nernst
equation indicate this separation should be?
40

Appendix 5: Operation of the CV instrument
1. Add two drops of polishing fluid on the polishing pad. Polish the working electrode for at
least 2 minutes. Use distilled water, not methanol, to rinse the electrode after polishing. If the
polishing fluid dries out, add water to moisten the pad. Wash the pad thoroughly with water
after all experiments.
2. If you want to blot off the water adhering to the electrode surface, do this very gently.
3. Ensure that the power to the potentiostat at the front (left-bottom corner) is OFF.
4. Place approximately 15 – 20 ml of the solution (e.g., 1×10⁻³M K3Fe(CN)6 in 0.1 M KCl) in the
C2 cell stand beaker (cell beaker should be at 2/3 full).
5. Connect the electrodes to the electrical leads as follows;
a. Green cable - working electrode
b. White cable - reference electrode
c. Red cable - auxiliary electrode
6. Apply power to the potentiostat by turn on the main switch at the front.
7. Ensure that there are no bubbles on the electrodes. If there are, gently tap the electrode to
dislodge them. Ensure that the active area of the working electrode is immersed in solution.
8. Turn on the computer (turn on the monitor first then the main switch).
9. Activate the CV program by double-clicking on the program icon “power-suite” from the
windows.
10. Choose “Open” from the experiment menu. In Power CV open “215”, press select.
11. To start a new scan, click on the on the data menu to clear the previous scan, click the
“experimental properties” button, under the “scan definition” chose parameters (i.e., initial
potential (+0.8 V), vertex potential (-0.2 V), final potential (+0.8 V), and the scan rate (20
mV/s)), then press OK.
12. To acquire a run, click on the on the data menu.
13. After a run, right click on the graph, from the pop-up menu, chose export data, save your data
to C:\ drive or your floppy disk.
41

Experiment H: Gas Chromatography - Mass Spectrometry (GC-MS)
The emphasis of this laboratory is on the information that a mass spectrometer can provide
about the constituents in a sample.
1) Objectives
i) To calculate the standard deviations for the retention times and peak areas for each n-alkane in
different injections.
ii) To determine the amount of n-undecane and n-dodecane using the SIM method with n-decane
as the internal standard.
2) PreLab
1. Watch the instructional video on the operation of the GC-MS instrument.
2. Calculate the molecular masses of n-decane, n-undecane and n-dodecane
3. Read Ch 5-4: Internal standard
4. Calculate the volumes of stock soluitions (10 g/ml) needed to prepare four 10 ml standard
solutions of n-undecane and n-dodecane in hexane, covering the calibration range of 150
ng/ml, 100 ng/ml, 50 ng/ml and 10 ng/ml. Ensure that each standard contains 100 ng/ml of n-
decane.
3) Theory
The separation technique called gas chromatography (GC) is used to separate chemicals that
are volatile in the range of temperatures from ambient (i.e. 293 K to ~ 690 K). A volume of gas or
liquid is injected with a syringe into the injection port of the GC. The injection port is maintained at a
temperature higher than the boiling point of the solutes in the sample, so a liquid sample injected into
injection port will be vaporized. The inert carrier gas, helium, then sweeps the sample vapor down
the GC column that is a 30-50 m long fused silica capillary whose inner walls are coated with a
liquid. This liquid is called the stationary phase and is covalently bound to the wall. Based on the
temperature of the column (which is often different than the injection port temperature), the solutes
will partition between the vapor phase (termed mobile phase) and the condensed phase (termed the
stationary phase in GC). The fraction of solute in the mobile phase versus the condensed phase is, to
a first approximation, inversely proportional to the boiling point of the solute. Hence, a low boiling
point solute will be carried by the carrier gas through the column faster and elute off the column
before another solute that has a higher boiling point. In this manner, complex samples (i.e., hundreds 46
of solutes) can be separated from each other (further details of the GC technique are discussed in
Chem 316).
The mass spectrometer is a very selective technique. This statement means that when a solute
is detected with a mass spectrometer, the “signals” that form the mass-to-charge spectrum are
characteristic of the molecular weight of the ion. Fundamental to the mass spectrometer are the three
components; ion source, mass-to-charge analyzer, and detector. There are many different types of
ions sources, mass-to-charge-analyzers, and detectors. In this experiment, an Electron Impact (EI)
ion source is used. High energy electrons (~ 70 eV) are used to bombard the sample molecules
emerging from the GC column. Some of the solute molecules are ionized according to the general
equation:
M + e M+* + 2e
where M is a neutral molecule, and M+* is the ionized molecule (actually a radical - count the number
of electrons) that is highly excited internally as indicated by the asterisk.
The highly excited molecule will fragment (usually quite rapidly) because the internal energy
exceeds the energy of one or more bonds in this ion, producing a range of fragment ions that are
highly characteristic of the structure of the original molecule M. The mass-to-charge analyzer used in
this experiment is a linear quadrupole mass spectrometer. This mass-to-charge analyzer separates
(filters) the ions emerging from the ion source, and the detection of the abundance of ions (signal
magnitude) at each mass-to-charge value is used to generate a mass spectrum. Characteristic mass
spectra generated with an EI ion source have been tabulated and stored on optical disks to permit
identification of unknown solutes from complex samples using database search-algorithms.
In this experiment, you are introduced to the basic concepts of using the information rich
technique of GC-MS. The first GC-MS experiment was performed before SFU opened its doors
(1965), yet, because the high solute separation efficiency of a GC when combined with the selective
detection afforded by MS is almost unparalleled, GC-MS continues to be a cornerstone of the modern
chemical analysis laboratory.
4) Experimental
DO NOT SWITCH OFF THE GC/MS
DO NOT SHUT OFF THE HELIUM FLOW TO THE INSTRUMENT
DO NOT ADJUST THE ION MULTIPLIER SETTING
Materials
10 g/ml each of n-decane, n-undecane and n-dodecane in hexane
47
an unknown sample mixture of n-undecane and n-dodecane in hexane with 100 ng/ml of n-
decane as internal standard.
hexane
Equipment
microliter syringe (10 l and 100 l)
five 10 ml volumetric flasks and sample vials
GCD (Gas Chromatograph Detector)
The column mounted in the GC is a Hewlett-Packard column, model HP-5. This
column is recommended for separation of alkaloids, drugs, fatty acid methyl esters, and
halogenated compounds. The internal wall of this column is coated with a mixture that
contains 5 % diphenyl and 95 % dimethylsiloxane. This mixture is non-polar. The coating
thickness is 0.25 µm. The column itself is 30 m long and 0.25 mm I.D. The recommended
temperature range for this column is -65 to + 300 oC.
The detector for the GC is a mass spectrometer that is fully functional in terms of its
capabilities, yet the user accessible functions of the mass spectrometer are limited
(intentionally designed this way by the manufacturer). The mass range of the analyzer is from
10 - 425 Da. The ion source is electron impact. By software control, either the full mass
range can be scanned or selected ion monitoring (SIM) is possible. SIM refers to monitoring
specific values of m/z that are characteristic of a particular compound. The internal mass
calibration agent for the mass analyzer is perfluorotributylamine (PFTBA). This compound is
stored in a vial inside the vacuum chamber, and an electronically controlled valve permits the
headspace sampling of this compound.
Procedure
1. Use the 10 l and 100 l syringes, prepare four 10 ml standard solutions of n-undecane and n-
dodecane in hexane, covering the calibration range of 150 ng/ml, 100 ng/ml, 50 ng/ml and 10
ng/ml. Ensure that each standard contains 100 ng/ml of n-decane. Rinse the syringe
thoroughly (i.e., 10 times) with hexane to avoid contamination. Transfer the solutions into
sample vials for storage in the fridge.
2. Set up the TIC method.
3. Each student will each make a single 1.0 µl injection of the standard mixture (containing 150
ng/ml of n-undecane and n-dodecane, plus 100 ng/ml of n-decane). Variations in injection
reproducibility will be compared in the data analysis section of this report.
48

4. Load the TIC method and run it. When the instrument is ready for an injection, insert the
syringe fully into the septum of the sample injection port, and depress the syringe piston.
Remove the syringe and press the START key on the front panel of the GC.
5. Do not respond to the message displayed on the computer monitor (override solvent delay?),
because you want to have a solvent delay. The message will disappear in two minutes.
6. Save the data file in the directory c:\chem215.
7. Obtain a hard copy of the TIC chromatogram.
8. Also obtain a single hard copy of the mass spectrum for each of the n-alkanes, and the
averaged background mass spectrum.
9. Set up the SIM method and perform GC-MS run for the 4 standard solutions and the unknown
sample.
10. Copy the information of peak areas for the standards and sample.
6) Report
Results and Calculations
1. Draw the structures of the three species used in the experiments.
2. Tabulate the retention times, peak areas for each of the n-alkanes for the four injections made
by different students. Calculate the mean and standard deviations for the retention time and
peak area for each of the n-alkanes.
3. Calculate the ratio of peak area of n-undecane to that of n-decane, and the ratio of peak area of
n-dodecane to that of n-decane. Comment on the interpersonal variability of peak areas,
retention times and peak area ratios.
4. Tabulate the retention times and peak areas for each of the n-alkanes for the four standards
and one sample. Calculate the peak area ratios. Plot the 2 internal standard calibration curves.
Report the equations of the linear regression lines.
5. Determine the concentrations of n-undecane and n-dodecane in the liquid samples and the
associated uncertainties.
Discussion
What are the advantages of using the internal standard.
49
Appendix 7: Operation of the GC-MS instrument
1) Activate the GCD control program by double-clicking on the program icon “GCD top” from
Windows.
2) Instrument verification: This the one of the most important routine quality control checks that
can be performed. This operation is run under computer control and takes seven minutes to
complete.
Perform an instrument verification operation (choose only “tune(detector optimization) and
disable “acquisition and review data”). This procedure, under computer control optimization
algorithms, optimizes the performance (signal intensities, mass accuracy, and mass resolution)
of the mass spectrometer. Running this instrument check is critical for the use of established
METHODS to be provide valid data. There is a small vial of perfluorotributylamine (PFTBA)
attached to the vacuum chamber. When the Tune procedure is initiated, the head space above
the PFTBA is opened to the EI source. Successive mass spectra of the PFTBA are used during
the tune procedure.
View the results of the verification procedure just performed. Printout a report copy of the
verification procedure.
3) The split ratio of He gas has been set to 100 to 1 by your laboratory instructor. (Of the total He
gas flow entering the injection port of the GC, the split ratio is the ratio of gas flow going through
the column versus gas flow allowed to bleed out of the injection port.) Use of split injection
improves quantitative results and decreases the amount of sample actually injected onto the
column so that it is not overloaded. (Only in analyses of very dilute samples utilize non-split
methods.)
4) TIC method: Load the method file: Chem215a.M. This method file is located in the directory c:\
hpchem\1\methods. Check the parameters to ensure that the Chem 215a.M method have been reset
to a temperature program that is isocratic at 100oC and that the mass range is set to scan from 10
to 200 Da. If necessary, change the appropriate parameters and save the method.
5) All data files that you will store should be placed in the directory c:\chem215.
6) During the chromatographic run, the total ion current (TIC) from the ion detector will be plotted
as a function of time. After the acquired data has been automatically saved to a file, double
clicking with the RIGHT-mouse-button on a peak in the TIC will open a new window where the
mass spectrum of the molecule that generated the peak in the TIC will be displayed.
50

7) Background subtraction: Individual mass spectra are more easily interpreted by performing
background subtraction. To do this, expand the region around the peak of interest in the TIC
using the LEFT-mouse-button. Then point the mouse to the maximum of the peak of interest and
double-click with the RIGHT-mouse button (the mass spectrum of this compound should now be
displayed in the mass spectrum window), then point the mouse to a region of the baseline in the
TIC that is flat and double-click with the right-mouse-button (a mass spectrum of the background
should now be displayed in the mass spectrum window), then go to the command bar and select
subtract. A background subtracted mass spectrum of the analyte compound will be displayed. The
feature of mass spectrum averaging provides more representative mass spectra. While performing
these steps, notice the mass spectrum number for the currently displayed mass spectrum in the top
menu bar OF THE MASS SPECTRUM WINDOW.
8) Retention time and peak areas: Run the GCD data review software. If the chromatogram is not
shown, load the data file. Go under the drop down menu item “chromatogram”, and select
“percent report”, and “send the report information to the computer screen”. The report file
contains retention times of the molecules and the peak areas. Write down these two values for
each peak in each chromatogram acquired.
9) SIM method: In this section, you will now revise the chem215a.M method. Run the GCD data
review software. If the TIC chromatogram is not shown, load the data file. Go to the submenu
“Method” and select “Automatic SIM Setup”. The software will select the different SIM groups to
monitor the ions specific to each peak. After the process, the method: chem215a.M is modified.
51

Experiment I: Literature search
Based on search of chemical literatures (e.g., Textbook, Journal of Chemical Education,
Internet, etc.) derive an experiment the determination of Ni2+ and Zn2+ by polarography.
1. Providing that you were given an unknown solid sample (i.e., a mixture of NiCl2, ZnCl2 , and
other inert impurities. Based on the literature search about the polarography, you were asked
to design an experiment including the principles and procedures, following which the
composition of your unknown could be determined.
2. Write up a maximum of four page report following the same style as outlined at page 8, but
will be marked on a slightly different scale:
Abstract 10% A summary < 200 words
Introduction 30% Principles of the method
Experimental 30% Chemicals, Equipment, Procedures
Results/Discussion 10% Expected observation and data processing
Conclusion 10% What you learned from this lab
References 10% The original literatures used for the lab
------------------------------------------------------------------------------------------------
Total 100%
3. Numerical values should be included based on general experimental practice, e.g., the
concentration made for standard solutions.
4. This experiment is scheduled for two weeks, therefore your report should be handed in at the
third week.
5. This is a new type of lab for most of our students, but it is challenging and not that hard.
Enjoy and good luck.
52
Experiment J: Comparison of Analytical Methods
1. Objective
To critically evaluate the analytical chemical methods (Exp. A to F) that were used to
characterize the unknown sample.
2. Report
Results and Calculations
Tabulate the results (plus uncertainties) of the weight percents of Ca2+, CO32-, Na+ and Cl- in
the unknown sample as follows:
wt % Ca2+ wt % CO32- wt % Na+ wt % Cl-
Expt. A (grav)
Expt. B (EDTA)
Expt. C (TGA)
Expt. D (AES)
Expt. E (acid-base)
Expt. F (ISE)
Discussion
Compare the determined values and their uncertainties of the wt % of Ca2+ and CO32-
determined in various experiment. Comment on what techniques provide the most reliable
information, ease of use, etc.
NOTES: This report is due at the same time as your last experiment report, and will be graded based
on your precision, accuracy, and your lab book.
53