the final fifteen feet of hose - sfu.ca
TRANSCRIPT

THE FINAL FIFTEEN FEET OF HOSE
The Canadian Gasoline Industry in the Year 2000
n Canadians are well served by the current market systemthat determines gasoline prices. We enjoy some of thelowest gasoline prices in the world.
n The rapid increase in world crude oil prices is the mainculprit in rising Canadian gasoline prices. Retailers caninfluence often only approximately 4.5 cents of the pumpprice of gasoline.
n The volatility and uniformity in gasoline prices is a directresult of the competitive nature of the business at thestreet level and the unique way that gasoline prices areposted on large signs outside each retail outlet acrossthe country, as well as the volatility of crude oil prices.
n Big box operators are a potential source of new compet-ition in the Canadian gasoline marketplace, especiallyas gasoline becomes one of many products sold at aparticular retail outlet.
HIGHL
IGHTS
January 2001

About The Conference Board of CanadaThe Conference Board of Canada is an independent, not-for-profit research organization with affiliates in the UnitedStates and Europe. Our mission is to help our members anticipate and respond to the increasingly changing globaleconomy. We do this through the development and exchange of knowledge about organizational strategies and prac-tices, emerging economic and social trends and key public policy issues. Since 1954, the Board has been committed toresearching innovative practices, designing new strategies and providing our members with the most up-to-date infor-mation, analysis and expertise to help them excel in Canada and around the world.
About the Economic Services GroupThe Economic Services Group is a research division at The Conference Board of Canada. The Group's purpose is toaddress the specific information requirements of the Conference Board's members by conducting financed research.Services include customized economic forecasting at the municipal, provincial and national levels; economic impactanalysis; custom-tailored econometric models; consumer and business attitudes surveys; and analysis of the economicimplications of changes in public policy.
AcknowledgementsThe study was made possible through funding by Industry Canada and Natural Resources Canada. In keeping withConference Board guidelines for financed research, the design and method of research as well as the content of thisstudy were determined solely by The Conference Board of Canada.
Authors Michael Sperber, Principal Research Associate • Kip Beckman, Senior Research Associate • Frederic Clavet, Research Associate With Contributions From Marie-Christine Bernard, Luc Bussière, Jim Frank and Mario Lefebvre
Editing Julie Swettenham • Design & Layout Holly W. Michael
Recycled paper
©2001 The Conference Board of Canada*
Special ReportPrinted in Canada • All rights reserved • ISBN 0-88763-494-X
*Incorporated as AERIC Inc.

CONT
ENTS
The Final Fifteen Feet of Hose: The Canadian Gasoline Industry in the Year 2000
Glossary of Terms ..................................................................................i
Executive Summary ..............................................................................iii
Introduction ..........................................................................................vii
Purpose ............................................................................................vii
Background to the Study ....................................................................vii
Mandate ......................................................................................vii
Pre-research Meetings with Stakeholders ..................................viii
Chapter 1: The Gasoline Industry in Canada from a
North American Perspective ........................................................1
Overview ..............................................................................................1
Upstream ............................................................................................1
Industry Structure..........................................................................1
Crude Oil Prices............................................................................3
Wholesale ............................................................................................4
Industry Structure—Refineries......................................................4
Wholesale Gasoline Prices............................................................6
Empirical Analysis of Wholesale Prices ........................................8
Stakeholder Concerns ..................................................................9
Retail ............................................................................................11
Industry Structure—Retail Sites..................................................11
Retail Gasoline Prices ................................................................21
Empirical Analysis of Retail Prices..............................................29
Stakeholder Concerns ................................................................30
Chapter 2: Comparison of Canadian Centres ................................33
St. John’s, Newfoundland ..................................................................34
Charlottetown, Prince Edward Island ................................................35
Saint John, New Brunswick ..............................................................36
Halifax, Nova Scotia ..........................................................................37
Quebec City, Quebec..........................................................................38
Montreal, Quebec ..............................................................................39
Ottawa, Ontario ..................................................................................40
Toronto, Ontario ................................................................................41
Winnipeg, Manitoba ..........................................................................42
Regina, Saskatchewan........................................................................43
Calgary, Alberta..................................................................................44
Vancouver, British Columbia..............................................................45
Smaller Centres ................................................................................46
Whitehorse, Yukon ......................................................................46
Sault Ste. Marie, Ontario ............................................................47
Dauphin, Manitoba......................................................................48
Smithers, British Columbia ........................................................48
Chapter 3: Conclusions ......................................................................50
Canadian Perceptions ........................................................................50
Consumers..................................................................................50
Major Integrated Oil Companies and Regional Refiners ..............52
Independents ..............................................................................53
Appendix A: Data Characteristics ....................................................56
Sources of Data..................................................................................56
Price Consistency ..............................................................................56
Price Volatility....................................................................................56
Margins ............................................................................................56
Independents ....................................................................................56
Appendix B: Detailed Methodology and Statistical Results ......58
Wholesale Regressions......................................................................58
Canadian Wholesale Prices................................................................59
Retail Regressions ............................................................................59
Price Asymmetry................................................................................66
Margin Analysis ................................................................................66
Long Weekends ................................................................................67
Cross-Subsidization ..........................................................................68
Price Volatility....................................................................................69
Appendix C: Review of Literature ....................................................70
Canadian Studies ..............................................................................70
American Studies ..............................................................................73
Asymmetry Studies ............................................................................74
Studies on Below-Cost Sales Legislation ..........................................75
Appendix D: List of Stakeholders Consulted ................................77

INDEX OF TABLES, CHARTS AND EXHIBITS
Table 1—Gasoline-Producing Refineries in Canada ..............................................5
Table 2—Average Outlet Throughput by Region ..................................................13
Table 3—Actual Service Stations in Eastern Canada ............................................15
Table 4—Applied Taxes on Gasoline in 1999 ......................................................22
Table 5—Market Characteristics for 1999 ............................................................33
Table 6—Return on Capital Employed for the Downstream Sector ......................51
Table 7—World Gasoline Prices in June 2000 ....................................................52
Table 8—Results of the Wholesale Regression ....................................................58
Table 9—Results of the Canadian Wholesale Regressions ..................................60
Table 10—Results of the Retail Regressions ........................................................65
Table 11—Results of the Asymmetry Regressions................................................66
Table 12—Results of the Margin Analysis ............................................................67
Table 13—Results of the Long Weekend Analysis ................................................68
Table 14—Results of the Cross-Subsidization Analysis (First Equation) ..............69
Table 15—Results of the Cross-Subsidization Analysis (Second Equation) ........69
Chart 1—Average Refiner Margin in Canada ..........................................................7
Chart 2—Refiner Margin Comparison: Canada vs. United States ..........................9
Chart 3—Average Throughput per Station ............................................................14
Chart 4—Average Canadian Retail Margin ..........................................................20
Chart 5—Retail Margin Comparison: Canada vs. United States ..........................20
Chart 6—Price Components of a Litre of Gasoline ..............................................21
Chart 7—Price Components of the Retail Price of Gasoline for November 2000 ....21
Chart 8—Comparison of Price Components of a Litre of Gasoline
by Province and Territory................................................................................23
Chart 9—Gasoline Taxes as a Percentage of the Retail Price................................23
Chart 10—Total Margin Comparison: Canada vs. United States ..........................24
Chart 11—Average Retail Price and Average Crude Oil Price in Canada..............25
Chart 12—Average Throughput per Outlet............................................................26
Chart 13—Daily Retail Prices for Vancouver (Ex-tax) ..........................................31
Chart 14—Charlottetown and Average Canadian Retail Price (Ex-tax)..................32
Chart 15—Comparison of Various Cities by Throughput and Retail Margin ........33
Chart 16—Comparison of Various Cities by Throughput and Retail Margin ........34
Chart 17—Retail Price for St. John’s (Ex-tax) ......................................................35
Chart 18—Retail Margin for St. John’s ................................................................35
Chart 19—Retail Price for Charlottetown (Ex-tax) ................................................36
Chart 20—Retail Price for Saint John (Ex-tax) ....................................................36
Chart 21—Retail Margin for Saint John................................................................37
Chart 22—Retail Price for Halifax (Ex-tax)............................................................37
Chart 23—Retail Margin for Halifax......................................................................37
Chart 24—Retail Price for Quebec City (Ex-tax) ..................................................38
Chart 25—Retail Margin for Quebec City ............................................................38
Chart 26—Retail Price for Montreal (Ex-tax) ........................................................39
Chart 27—Retail Margin for Montreal ..................................................................39
Chart 28—Retail Price for Ottawa (Ex-tax)............................................................40
Chart 29—Retail Margin for Ottawa......................................................................40
Chart 30—Retail Price for Toronto (Ex-tax) ..........................................................41
Chart 31—Retail Margin for Toronto ....................................................................41
Chart 32—Retail Price for Winnipeg (Ex-tax) ......................................................42
Chart 33—Retail Margin for Winnipeg ................................................................42
Chart 34—Retail Price for Regina (Ex-tax)............................................................43
Chart 35—Retail Margin for Regina......................................................................43
Chart 36—Retail Price for Calgary (Ex-tax) ..........................................................44
Chart 37—Retail Margin for Calgary ....................................................................44
Chart 38—Retail Price for Vancouver (Ex-tax) ......................................................45
Chart 39—Retail Margin for Vancouver ................................................................45
Chart 40—Retail Price for Whitehorse (Ex-tax) ....................................................46
Chart 41—Retail Margin for Whitehorse ..............................................................46
Chart 42—Retail Price for Sault Ste. Marie (Ex-tax) ............................................47
Chart 43—Retail Margin for Sault Ste. Marie ......................................................47
Chart 44—Retail Price for Dauphin (Ex-tax) ........................................................48
Chart 45—Retail Margin for Dauphin ..................................................................48
Chart 46—Retail Price for Smithers (Ex-tax) ........................................................49
Chart 47—Retail Margin for Smithers ..................................................................49
Chart 48—Retail Market Outcome Margin for Calgary ........................................61
Chart 49—Retail Market Outcome Margin for Halifax ..........................................61
Chart 50—Retail Market Outcome Margin for Montreal ......................................62
Chart 51—Retail Market Outcome Margin for Ottawa ..........................................62
Chart 52—Retail Market Outcome Margin for Quebec City ..................................62
Chart 53—Retail Market Outcome Margin for Regina ..........................................63
Chart 54—Retail Market Outcome Margin for Saint John ....................................63
Chart 55—Retail Market Outcome Margin for St. John’s ......................................63
Chart 56—Retail Market Outcome Margin for Toronto..........................................64
Chart 57—Retail Market Outcome Margin for Vancouver ....................................64
Chart 58—Retail Market Outcome Margin for Winnipeg ......................................64
Chart 59—Average Price of Crude Oil, Rack and Retail (Ex-tax) Gasoline............69
Exhibit 1—Pipeline Infrastructure in Canada ..........................................................2
Exhibit 2—Canadian Crude Oil Pipelines ..............................................................3
Exhibit 3—From the Ground to the Pump ..............................................................4
Exhibit 4—Bulk Fuel Terminals in Canada that Post Rack Prices ..........................5
Exhibit 5—Rack Prices ..........................................................................................6
Exhibit 6—Import Alternatives ................................................................................8
Exhibit 7—Branded Independents ........................................................................13
Exhibit 8—Changing Environmental Standards ....................................................17
Exhibit 9—Price Volatility and Uniformity ............................................................25
Exhibit 10—Price Restorations ............................................................................28
Exhibit 11—Market Outcome Margin....................................................................30
Exhibit 12—Do Prices Increase Before Long Weekends? ....................................32

i The Conference Board of Canada
Ad–valorem tax—an indirect tax that is expressed as a percentage of the price of a commodity,e.g., Goods and Services Tax (GST), Provincial Sales Tax (PST) and Harmonized Sales Tax (HST).
Agency—a mode of operation for a gasoline retail outlet where the outlet operator acts as an agentfor the company that supplies the branded product. The supplier determines prices.
Ancillary services—services provided by a retail gasoline outlet in addition to the sale of petroleum products, such as convenience stores, car washes and fast-food outlets.
AQUIP—Association Québécoise des Indépendants du Pétrole, the representative association of theindependent retailers in the province of Quebec.
Bulk plant—a storage facility used in the wholesale segment of the industry, comprised of a gathering of small- to medium-capacity tanks.
C.p.l.—cents per litre.
Coking—a refining process for thermally converting and upgrading heavy residual into lighterproducts and by-product petroleum coke.
CPPI—Canadian Petroleum Products Institute, an association of petroleum refiners and marketers in Canada.
Crack spreads—price per litre of wholesale gasoline over the price per litre of crude oil.
Cracking—a refining process under which heavy molecular weight hydrocarbons are broken up intolighter hydrocarbon molecules by the application of heat and pressure, with or without the use ofcatalysts.
Crude oil—the raw material from which petroleum products are manufactured.
Dealer—a generic term referring to a retail outlet operator. There are several different modes of operation used, including company owned, commission retailer, lessee operator, independentbranded and independent non-branded.
Downstream—the segment of the oil industry involved in refining and/or marketing of petroleumproducts such as gasoline, diesel, heating oil, lubricants, etc.
Excise tax—a federal or provincial tax on retail gasoline purchased by consumers, established at a certain level of cents per litre. An excise tax is a flat tax.
Ex-tax pump price—the retail price of gasoline, excluding all taxes.
Grade differential—the difference between the price of regular unleaded gasoline and premium or mid-grade gasoline.
Independent marketer—a retail petroleum operator who is not involved in the refining of petroleum products, and therefore must purchase its supply of petroleum product.
Integrated oil company—a fully integrated oil company is involved in the upstream (i.e., exploration and production) and downstream (i.e., refining, marketing, distribution and retailing)segments of the industry. A partially integrated oil company is involved in all aspects of the downstream segment only.
GLOS
SARY
OF TE
RMS

IRGMA—Independent Retail Gasoline Marketers Association of Canada, an association of independent retailers in Canada.
Lessee—the operator leases the retail outlet from the product supplier.
Majors—multinational and national integrated oil companies (Imperial Oil, Shell and Petro-Canada).
Market share—volume of gasoline sold by one company divided by the total volume of gasoline sold in a particular market.
Marketer—see Retailer.
Marketer’s margin—see Retail Margin.
OPEC—the Organization of Petroleum Exporting Countries.
Outlet—generic term referring to a retail gasoline station.
Pump price—unless qualified, the self-serve pump price for regular unleaded gasoline (RUL).
Rack—refers to the wholesaling of gasoline products. Unqualified, the term refers to the wholesaling of gasolineproducts from a bulk plant or terminal location. Qualified as “at the gate rack,” the term refers to wholesale purchaseof gasoline products at the refinery.
Rack point—the point where refined product can be purchased at the rack price to non-refiner suppliers/marketers.
Rack price—the posted wholesale price of gasoline.
Refiner—an organization that produces a range of petroleum products from crude oil suitable for consumer use.
Refiner’s margin—the difference between the wholesale price of gasoline and the price of crude oil, the amount thata refiner receives to cover its operating costs.
Regionals—regional integrated oil companies (Ultramar, Sunoco, Irving, Husky, Chevron, Parkland, Federated Co-op and Arco).
Retail margin (gross)—the difference between the cost to acquire product at wholesale and the selling price of the product at retail, exclusive of taxes. Usually expressed on a per-unit basis, for example, in cents per litre.
Retailer—an organization that sells gasoline to end-users.
Supplier—an organization that supplies end product to retailers.
Tankwagon—tractor trailer used for short–haul delivery from a bulk plant or terminal to a retail outlet.
Terminal—storage facility used in the wholesale segment of the industry, usually comprised of a gathering of large-capacity tanks.
Throughput—the volume of petroleum sold at a retail outlet in a given period, usually expressed in litres per monthor per year.
Upstream—the segment of the oil industry involved in the exploration and/or production of crude oil.
ii The Conference Board of Canada

iii The Conference Board of Canada
The purpose of this report is to present an up-to-date profile of the Canadian gasoline industryand try to address some of the preoccupations of industry stakeholders and the perceptions of Canadian motorists.
The gasoline industry in Canada follows eco-nomic rules of supply and demand, over whichit has little control. The price of gasoline’s majorinput, crude oil, is determined outside Canada’sborders on world markets highly influenced byOPEC decisions on increased or decreased supply.In addition, even the wholesale price of gasolinein Canada is as much determined by U.S. condi-tions as it is by cost, supply or demand withinour borders. We live in a continental market for gasoline.
Pump prices vary tremendously from one city to the next. On November 14, 2000, a litre ofregular unleaded gasoline was 90.9 c.p.l. inCornerbrook, Newfoundland, and 65.8 c.p.l. inEdmonton, Alberta. However, when taxes areremoved from the retail price, we see a commoditythat has similar prices across Canada, differenti-ated predominantly by local competitive condi-tions, average sales volumes and freight costs.
The gasoline industry in Canada has a limitednumber of key players who, through theirvertical integration and sheer size, are oftenexpected to have power in the marketplace. Atthe same time, on occasion, we see the vulnera-bility of these Goliaths to independent Davidsand new market entrants whose aggressive
EXEC
UTIVE
SUMM
ARY
Approach to the Research
This study of the gasoline industry in Canada represents the culmination of more than six months of intensive researchundertaken by The Conference Board of Canada. During the initial phase, which started in April 2000, the Board held discus-sions with many stakeholders in the industry from every region of the country. The meetings included the major and regionalrefiner-marketers and both large and small independent operators. Associations that represent consumers, independents andrefiner-marketers were also contacted, as were individual station owners, employees and interested Canadian consumers.
As a result of these pre-research consultations, a number of specific research issues were identified. During the empiricalresearch phase, these questions were answered and a Draft Research Report was prepared. The report included a detailedempirical examination of issues ranging from the factors that influence wholesale and retail prices at the city level to thequestion of price increases before long weekends.
Post-research dialogue sessions were held with stakeholders in five cities across Canada in order to validate the findings of theDraft Research Report and to identify areas in need of clarification. Following these sessions, a final report was completed. Itupdates and modifies the draft in light of the comments received. Several new sections that address issues raised by the sessionparticipants were also added.
While the Conference Board is aware that earlier studies of the gasoline industry in Canada have already been carried out, weare confident that our study will shed new light on, and provide some additional insights into, the workings of the industry.Past studies of the industry have focused on specific issues without explicitly addressing the views of key players in theindustry. Our extensive consultations enabled us to provide a balanced perspective on the many contentious issues that affectthe industry. Throughout the report, the reader will find sections devoted to the concerns of the different stakeholders in theindustry and the Board’s views on these issues. Also, the consultations provided us with an important insight into the day-to-day operations of the industry. These insights permitted us to explain in simple terms to Canadians issues such as pricevolatility, price wars and the uniform movement of retail prices at the street level.
Our empirical analysis makes use of a new approach that we believe provides a greater understanding of how retail prices reactto changes in wholesale prices. As a result of competition, a retail market outcome margin exists in each city based on localconditions. This margin becomes the basis for price changes in that market and reflects a margin at which most competitors are able to sustain themselves. The response in the retail price following a change in the crude and wholesale price differsdepending on whether the actual margin in place is higher or lower than the market outcome margin.

pricing policies precipitate price wars that have implicationsacross the entire industry and throughout the country.
This report tries to present a balanced portrait of theCanadian gasoline industry. Below are some of our majorobservations about the questions that preoccupyCanadians from both within and outside the industry.• Crude oil and taxes make up about 84 per cent of
the average price of a litre of regular unleadedgasoline. This leaves approximately 16 per cent to cover the costs of refining and marketing, as well as the retailer’s operational and fixed costs. This implies that on average in mid-November 2000,the downstream gasoline industry (refining, marketing and retailing) has influence over just 11.9 cents on a 75.9-cent litre of gasoline. Retailersinfluence only about 4.5 cents of the pump price of gasoline.
• The rapid increase in world crude oil prices is themain culprit in rising Canadian gasoline prices.Over one month, a one-cent increase in the per litreprice of crude oil results in approximately a one-centincrease for Canadian motorists. The timing of theincrease and its initial magnitude depend on thecompetitive conditions in the market. The Can. $29.63(U.S. $20) increase in crude oil prices since January1999 has caused Canadian pump prices to increase by about 20 c.p.l.
• Consumers in Canada are very well served by thecurrent market system that determines gasolineprices. Retail margins have been declining throughoutthe 1990s as a result of improved efficiencies in thegasoline industry. This has benefited consumers asthey have profited from prices that are lower thanthey would have been in the less efficient industrythat existed prior to 1990.
• The volatility in gasoline prices is a direct result of the competitive nature of the business at thestreet level and the unique way that gasoline pricesare advertised to motorists—they are posted on largesigns outside each retail outlet across the country. Theimpact of posting prices is enhanced by the sensitivityof Canadian consumers to price differentials, a lack ofbrand loyalty as well as the accepted perception thatgasoline from one outlet is basically identical to thatfrom any other dealer.
• Uniformity of prices reflects the rapid response ofindividual dealers to the actions of their competitors.Retail prices at competing dealers often change in stepwith each other. This reflects a high degree of compe-tition at the street level and protection of marketshare rather than a conspiracy among companies. Inthe same way, the setting of wholesale prices takesinto account similar factors for all refiners, mainly thecost of crude oil and the technology of production,and it is natural that prices should be similar.
• Average sales volumes per outlet have an importantimpact on retail margins and prices because eachoutlet has fixed costs to cover. The difference inprices between urban and rural communities, which insome instances is viewed as being way out of line,even after transportation costs have been accountedfor, demonstrates the importance of sales volumes indetermining retail prices. In smaller communities, theaverage throughput at each outlet is generally farlower than in larger communities. Lower throughputsimply that a dealer must make a higher margin in orderto cover fixed costs as well as operating expenses.
• Differences in gasoline prices between cities aregenerally influenced by the different competitiveconditions found at the street level. Varying localmarket conditions in each city in Canada can pushgasoline prices in directions that reflect intense rivalryamong sellers. It takes only one dealer who is deter-mined to increase market share at the expense ofcompetitors to upset the balance and bring about asituation where retail prices bear little resemblance tofactors like transportation costs, rack prices or normalmargins. Abnormalities can last from days to years,depending on local conditions.
• There is no empirical proof that gasoline pricesincrease before long weekends. While it is true thatprices do sometimes shoot up before long weekends, theyare just as likely to increase prior to any other weekendthroughout the year. The fact is that dealers attempt toincrease prices, normally in the middle of the week, inorder to restore margins that have been reduced becauseof street level competition. If they do not succeed, pricestend to drift down on Friday and on the weekend.Increases before long weekends may more likely beaccepted by competitors in anticipation of the higherholiday demand, but this cannot be proven statistically.
iv The Conference Board of Canada
v The Conference Board of Canada
• There is no proof of asymmetry in price adjust-ment in the retail market. Price asymmetry refers to the phenomenon of retail prices responding morestrongly to increases in crude oil prices compared withdecreases. Our empirical research found that retailersappear to have adjusted their prices in the samemanner for both an increase and decrease in crude oil prices in the 1990s.
• The price of gasoline in Canada and the UnitedStates, excluding taxes, is very similar. Canadiansenjoy some of the lowest gasoline prices in the worldthanks to a highly competitive retail sector and thefact that the Canadian refining industry must remaincompetitive with the United States, despite a largergeographic area and a smaller population base. U.S.wholesale prices, which are an important considerationin determining Canadian wholesale prices, generallylead to lower prices for the Canadian consumer.
• Big box operators are a potential source of newcompetition in the Canadian gasoline marketplace.Big box operators may not make inroads into Canadaas quickly as they have in Europe or the UnitedStates. However, following developments in the indus-try over the past 15 years, the influence of big boxoperators is likely to increase. The operators are ableto sell gasoline at very low margins because they cangenerate large gasoline throughputs, introduce cutting-edge technology, and because gasoline represents arelatively small part of their overall revenues. Aspricing tends to be influenced by the most efficientoperator in the market, big box stores are likely toexert continued downward influence on margins.
• It is our judgement that cross-subsidization existsto some extent between the different activitiesundertaken in the gasoline industry. However, theinter-financing of activities is neither illegal norunusual as a business practice across the Canadianeconomy. Moreover, our empirical work could not findconclusive evidence of either the extent or magnitudeof cross-subsidization, given the data that are avail-able. The lack of information about the actual pricespaid by most retail dealers for their supply makes it
impossible to draw any definitive conclusions on themagnitude of this issue.
We recognize that independents and major/regionalrefiners strongly disagree about the degree of cross-subsidization in the industry. In this study, cross-subsidization refers to the practice of using revenue fromthe upstream or refining sectors to support the retailsector. Majors and regionals contend that price supportis limited to exceptional circumstances. On the otherhand, independents claim that the practice is morecommon and underlies the refiners/marketers’ ability tosustain low retail margins. Despite basing retail marginson rack prices that may not accurately reflect realgasoline procurement costs, our research findings areconsistent with the existence of inter-financing betweenactivities. However, the extent of the activity was eitherstatistically insignificant or of a low magnitude.
• Branded dealers have an advantage over the inde-pendents during a price war. Independents mustpurchase product from the terminal at a posted rackprice or with a minimal discount and are, therefore,not in a position to provide financial relief for theirdealers. Branded dealers, on the other hand, cansometimes obtain an undisclosed discount off the rackprice that may better enable them to survive theeffects of a prolonged price war.
The rationalization that took place in the 1990s throughreducing the number of outlets and cost cutting will con-tinue in the present decade. All competitors will have tobecome more efficient in order to survive. In the 1980s,independents were able to gain market share from themajor and regional refiners by creating a lower price advan-tage and offering ancillary services through conveniencestores. In the 1990s, the major oil companies learned fromthe independents and expanded upon their lessons. Thetraditional players in the gasoline industry will have tocontinue to look for ways to innovate and remain competi-tive to survive in the 21st century, particularly as gasolineis treated more and more as just another product amongmany that are sold through a particular retail outlet.


vii The Conference Board of Canada
Purpose
The purpose of this study is to present a realis-tic and unbiased portrait of the Canadian gaso-line industry in the year 2000. Its goal is to give Canadians a better understanding of howdomestic retail and wholesale gasoline marketswork and how prices are determined at the all-important pump level—“the final fifteen feet of hose.”
The study attempts to take into account manyof the current perceptions about gasoline pricesin Canada and view the issues from an historicalperspective, while recognizing the changingstructure of a relatively complex multi-stageprocess. The project team has listened toCanadians involved in the petroleum industryfrom all perspectives. We have tried to take intoaccount their concerns and address the issuesthat they feel are key for the future of thegasoline industry in Canada.
The report attempts to avoid jargon and explainthe issues as clearly and objectively as possible.The report may not change strongly held opinions about the gasoline industry, but will attempt to set out the facts, as we havebeen able to determine them. Some issues, such as taxation and competition policy inCanada, are beyond the purview of the study.Nevertheless, we have tried to present a balanced view of the gasoline industry.
The Conference Board of Canada is not a government agency. Established in 1954, TheConference Board of Canada is an independent,not-for-profit, applied research institutionknown for its balanced analysis and its expertisein building consensus among diverse groups.
The Conference Board of Canada is non-policyprescriptive, therefore, the study will not make
recommendations about legislation or govern-ment policy.
Background to the Study
Mandate
The Conference Board of Canada was given amandate by Industry Canada and NaturalResources Canada to carry out a study examin-ing the nature and functioning of the Canadiangasoline industry. The study involves a thoroughinvestigation of the gasoline industry, and theresults are to be used as the basis for a dialogueamong stakeholders and other interested parties.The study began on April 1, 2000, and the finalreport was completed by December 31, 2000.
The study comprises two distinct components—research and dialogue sessions.
The research component was designed to addressa broad spectrum of issues that were raised bystakeholders across the country and relate tothe gasoline industry in Canada.
Specifically, the research component has tried toexplore the nature and functioning of the retailand wholesale gasoline markets by examiningthe relationships between the prices of crudeoil, retail and wholesale gasoline, as well asrelated issues such as price volatility, the speedof price adjustment and the nature and mannerof price increases. The research has also lookedat retail prices and supply and demand factors;the conduct, structure and performance of thegasoline industry in Canada and the differencesbetween the Canadian and U.S. markets.
The Stakeholder Dialogue component consistedof a series of five regional symposia held inVancouver, Calgary, Toronto, Montreal andHalifax. Their purpose was to create an
INTRO
DUCT
ION

environment for diverse interests to share their concernsand to start to develop a common understanding of the issues and their origins; to develop a regional perspectiveon the issues; and to validate the empirical research. A separate report on these sessions is available.
Pre-research meetings with stakeholders
Over 60 meetings and teleconferences were held withstakeholders throughout the country prior to the researchbeing carried out. The purpose of the meetings was to
inform the project team of stakeholder concerns as wellas to obtain a better sense of how the gasoline industryfunctions. The mandate of the study was sufficientlyflexible that it could be expanded to try and addressthese stakeholder concerns.
Stakeholder preoccupations vary among the main groups—majors and regional marketer-refiners, independent gaso-line retailers and Canadian motorists. We have attemptedto consistently place the topics covered in this reportwithin the context of the concerns raised by each group.
viii The Conference Board of Canada

1 The Conference Board of Canada
Overview
The gasoline industry in Canada is highly con-centrated. Three major integrated companies—Esso, Petro-Canada and Shell—are visible at theretail level across Canada, have a presence in oilexploration and extraction in Canada and are adominant force in refining, wholesaling andretailing. Adding in the regional refiner/mar-keters (Irving, Ultramar, Arco, Chevron, Parkland,Sunoco, etc.), they comprise virtually the entirerefining and wholesale sectors, as well as about80 per cent of the volume of retail sales.
Over the last decade, the industry has beencharacterized by considerable rationalization. The number of gasoline-producing refineries inCanada fell from 40 to 18, while the number of retail outlets declined by 40 per cent. TheCanadian experience has been consistent withthat of the United States, where major refiner-marketers, in particular, have been trying toincrease performance and efficiencies by increas-ing per outlet throughput and closing less efficient stations and under-utilized refineries.This occurred partly because the majors lost animportant portion of their market share to lower-priced independents during the 1980s. The moreretail margins declined due to increased competi-tive efficiency, the more the viability of manyless efficient outlets owned by both majors and independents became doubtful. Aggressivepricing policies, both by majors and independ-ents, which led to local price wars within theindustry, only made the situation worse.
Upstream
Industry Structure
The oil industry consists of two separate enti-ties: upstream and downstream. The main activ-ity of the upstream industry is the exploration
and development of crude oil, the raw materialfrom which gasoline is distilled. The upstreampart of the industry consists of a broad range of activities, including exploration for crude oil,drilling, production and transportation of thecrude to the refinery.
Crude oil is a commodity that is traded globallyand, as a result, Canadian producers must com-pete with the major oil-producing countries ofthe world to sell their product to refineries. Forinstance, much of Canada’s crude oil, which isnot consumed by national refineries, is exportedto the United States via crude pipelines.Consequently, crude from Canada must competewith U.S. domestic supply and offshore imports.Virtually all of the major and regional refiners in Canada must purchase crude oil from otherproducers. This means that the major integratedcompanies’ total crude production is far lessthan (usually around a third of) their refineryrequirements. As a result, the majors have toimport much of their crude from other parts of the world or buy it from other Canadianproducers at world prices.
Canada produces around 2 million barrels ofcrude oil per day, while total world productionis about 74 million barrels per day. That meansthat Canadian producers have no influence overworld prices because total domestic productionis a small fraction of total world production(about 2.7 per cent). Canadian producers ofcrude oil are therefore referred to as “pricetakers” as opposed to “price setters.” Oil pricesare set in the international marketplace andreflect global conditions rather than ones thatare particularly Canadian.
Crude oil is delivered to Canadian refineries byboth pipeline and boat, using oil tankers. Themajor pipeline infrastructure is shown in Exhibit 1.Canada has 15 pipelines that move domestic
The Gasoline Industry in Canada from a North American PerspectiveCH
APTE
R 1

crude oil across the country and to the United States.There are also two pipelines that carry imported crudeinto Canada from the United States. Exhibit 2 shows thedifferent pipeline routes. There are product pipelines thatcarry gasoline and other refined products to marketsacross provincial borders, as well.
The refineries in Quebec City, Halifax and Saint Johnobtain their crude from oil tankers sailing from the NorthSea, as well as from the Middle East, West Africa or SouthAmerica. The Montreal refineries receive crude from theMontreal–Portland pipeline because the harbour inMontreal is not large enough to accommodate large oiltankers. Before 1998, Montreal also obtained crude oilfrom the Line 9 pipeline from Sarnia. However, in 1999the pipeline was reversed to permit imported crude totravel to the Sarnia refineries from Montreal. In addition,Sarnia and other refineries in southern Ontario receivecrude oil from pipelines originating in Chicago and fromwestern Canadian pipelines.
In western Canada, Edmonton is the key pipeline junction.Pipelines from northern parts of Canada deliver crude toEdmonton. From there, other pipelines route crude tolocations in the United States such as Montana, Washingtonand Michigan, as well as other domestic refineries. Forinstance, the Trans Mountain Pipeline carries crude oil fromEdmonton to Burnaby, British Columbia. At the border, thispipeline connects with another pipeline that delivers crudeto refineries in northwestern Washington. Refineries insouthern British Columbia obtain crude from Edmonton orget imported crude from oil tankers.
Refineries locate sources for their crude oil taking intoaccount transportation costs and the type of cruderequired by the refinery. Canada produces around twomillion barrels of crude a day, and its refineries use aboutthe same amount (1.9 million barrels a day). However,while the demand and supply are almost equal, it is lessexpensive for refineries in eastern Canada to use importedcrude because of the high cost of transporting it from
2 The Conference Board of Canada
Exhibit 1Pipeline Infrastructure in Canada
Source: The National Energy Board.

western Canada. Also, most of the crude oil from westernCanada is of a heavier grade than the light crude oil fromthe North Sea or the Middle East. The latter is moresuitable for some of the refineries located in eastern and central Canada.
Crude Oil Prices
The cost of crude oil makes up about 73 per cent of the ex-tax price Canadians pay for a litre of gasoline(November 2000). A one-cent per litre change in theprice of crude oil results, within a month, in a one-centincrease in the ex-tax pump price of a litre of gasoline.Consequently, increasing crude oil prices are the mostimportant factor in the steep rise of gasoline prices atthe pump.
For example, since January 1999, the price of a barrel ofcrude oil has risen by around Can. $29. A barrel of crudeoil represents 159 litres. The increase in the price ofcrude alone accounts for 18 c.p.l. When GST is included,this amount rises close to 20 c.p.l.
Crude prices are determined internationally by fluctua-tions in worldwide demand and supply as well as specu-lation about future crude prices. As explained earlier,Canada is a price taker and has no influence on pricessince it produces about 3 per cent of world supply. Crude oil markets have been shaken up since 1998 as a result of a severe recession in East Asia and excess oil production. Prices fell by approximately 30 per cent in 1998, and in January 1999 the price of a barrel of oil dropped to approximately Can. $19(U.S. $13). Substantial oil production cutbacks by world producers, especially OPEC members, and strongdemand in many recovering Asian countries and in North America have pushed prices back up to an average of approximately Can. $44 (U.S. $30) per barrel so far in 2000.
Despite the fact that the market determines the price ofcrude oil, OPEC remains the dominant force in terms ofthe direction that price takes. The 11-member cartelincludes: Algeria, Indonesia, Iran, Iraq, Kuwait, Libya,Nigeria, Qatar, Saudi Arabia, United Arab Emirates and
3 The Conference Board of Canada
Exhibit 2Canadian Crude Oil Pipelines
Company Line Route
Trunk LinesTrans Mountain Pipeline Trans Mountain Pipeline Edmonton to Puget Sound (Wash.)Alberta Energy Company Express Pipeline Hardisty (Alta.) to Casper (Wyom.)BP Canada Rangeland Edmonton to MontanaMurphy Oil Milk River Hardisty to U.S. borderMurphy Oil Wascana Regina to U.S. borderEnbridge Main Line Edmonton to Clearbrook (Mich.) and Sarnia
Feeder LinesEnbridge Athabasca Ft. McMurray (Alta.) to HardistyAlberta Energy Company AOSPL Ft. McMurray to EdmontonGibson and CNRL Echo Pipeline Cold Lake (Alta.) to HardistyHusky Oil Hardisty Lloydminster (Alta.) to HardistyHusky Oil Lloydminster Cold Lake to LloydminsterAEC/Koch/CNRL Cold Lake Cold Lake to EdmontonAEC/CNRL/PanCanadian/Chevron Pelican Lake Pelican Lake to Wabaska and MitsueMurphy Oil/Van Horne Manito Pipeline Kerrobert (Sask.) to Enbridge SystemKoch Pipelines Bow River Hay River (Alta.) to Milk River Pipeline
Pipelines that Carry Imported CrudeEnbridge Line 9 Montreal to SarniaPortland Pipeline Portland pipeline Portland (Maine) to Montreal
Source: Natural Resources Canada.

Venezuela. Currently, oil production in Iraq is not at fullcapacity because oil sales are permitted only to finance“humanitarian” purchases. OPEC members together repre-sent about 40 per cent of the world’s oil production. Theytry to maximize the long-term benefit to be derived fromtheir resource by influencing world supply and expecta-tion of supply by controlling the production levels oftheir members. While some dissent among members andthe actions of non-members often weaken OPEC’s posi-tion, no other country or group exercises as much influ-ence on crude oil prices. Non-OPEC producers, such asMexico, Norway, the United Kingdom and the UnitedStates, are also important suppliers to the Canadianmarket. However, while these producers exert someinfluence on prices, the dominant force remains OPEC.OPEC’s production cutbacks are the main cause of therecent volatility in Canadian pump prices.
Wholesale
Industry Structure—Refineries
The petroleum refining sector is the manufacturing stageof the gasoline production process. Refineries take crudeoil and manufacture a range of refined petroleum prod-ucts, including gasoline, diesel, heating fuels, jet fuelsand lubricants. The mix of products produced is called theproduct slate. Different products are produced at differenttemperatures or during different stages of the refiningprocess. Gasoline is the largest single product; it comprisesabout 40 per cent of total refinery production.
Canada currently has 21 refineries. Three of these refiner-ies, located in Sarnia, Lloydminster and Moose Jaw, donot manufacture fuels. Therefore, 18 refineries in total(see Table 1) manufacture gasoline and other distillates,mostly for domestic consumption but also for export. Allof the output from the North Atlantic refinery in ComeBy Chance, Newfoundland, is either used domestically inNewfoundland or else exported to non-Canadian markets.This is because of a restrictive covenant signed by thepurchasers of Come By Chance when the mothballedrefinery was bought from Petro-Canada and reopened.
The modern refinery is a sophisticated work of engineeringwith a high capital cost that typically involves an invest-ment of over $1 billion, excluding property costs. Plantoperations are similarly costly and involve high levels ofenergy, labour and maintenance. In addition, refineriesrequire regular upgrading and high investment to maintainworker safety and meet changing environmental standardsand new regulations. While there are a number of differentrefineries, the two major types are referred to as cokingand cracking. Both refineries take crude oil and producegasoline and other fuels. However, the coking refineryrequires larger investments because it has the capability ofproducing more lighter-end products (e.g., gasoline) from abarrel of heavier crude oil. Cracking refineries, which arethe dominant type in Canada, have not made the invest-ment to process heavier crude and, as a result, rely onlighter (and subsequently more expensive) crude oil.
The refineries in Quebec and Atlantic Canada are crackingrefineries. They rely primarily on the lighter imported
4 The Conference Board of Canada
Exhibit 3From the Ground to the Pump
To understand how quickly crude oil price increases translate into higherprices at the pump, it is useful to look at how little time is involved intransforming oil into gasoline. How quickly oil is pumped out of the ground,refined into gasoline and delivered to your service station depends ondifferent factors. For example, a refinery located in Edmonton gets its crudeoil from oil fields in northern Alberta. The oil is then transported to therefinery via pipeline. If the oil field were 400 kilometres from the refinery,this would take approximately two days. If the refinery receiving the oil werein Sarnia, it would take longer to transport the oil. A refinery in AtlanticCanada receives its crude oil supply by tanker from the North Atlantic.Again, the travel time depends on the distance and the means of transport.
Once the crude oil arrives at the refinery, it is stored in a crude tank. On average, a barrel of crude oil would be in the storage tank for two days, but this can vary depending on the refinery’s production capacity. The actual refining process is very quick. Once the crude oil enters thedistillation tower, it is transformed into gasoline in four to eight hours,depending on the technology in place. After production, gasoline is stored in a product holding tank for one or two days while it waits to be transportedto service stations.
The location of the eventual retail outlet determines how the gasoline will betransported. In our Edmonton example, if the service station is located inEdmonton, the product will be picked up by truck and delivered to the retailoutlet within a day. If the service station were located in Winnipeg, thegasoline would have to be transported by pipeline the 1,300 kilometres fromthe refinery. This would take four to five days. Once in Winnipeg, it would bestored in another product holding tank one to two days before delivery bytruck to retail outlets in the city. Once the gasoline is delivered to the servicestation, it is stored in underground tanks until the motorist is ready to fill up.
In anywhere from one to four weeks, crude oil can go from being taken fromthe ground to being gasoline in the tank of your car.

crude oil from the North Sea and the Middle East. Twocoking refineries in western Canada can process the heaviercrude oil extracted from Alberta and Saskatchewan. Theproportion of light conventional crude oil from westernCanada declined from 51 per cent in 1985 to 33 per cent in1999. This drop has been offset by the increased produc-tion of non-conventional crude from the oil sands innorthern Alberta.
The United States, by contrast, has a total of 163 refiner-ies, with a combined capacity of 15.4 million barrels perday of crude. Of that capacity, coking refineries produce1.8 million barrels per day. In comparison, Canada has acoking capacity of only 39,000 barrels per day.
Twenty Canadian cities across the country have bulkterminals where marketers can purchase gasoline at theposted rack price and then deliver it to their retail out-lets or other clients by truck (see Exhibit 4). Some of theterminals are located at the refinery site, while most arelocated at storage facilities where gasoline is receivedfrom product pipelines. It should be noted that not allrefiners offer gasoline at the wholesale level. Gasoline
production at the Irving and Chevron refineries, forexample, is generally limited to supplying branded stations of these two refiners.
Rationalization
The 18 fuel refineries that currently operate in Canadarepresent a significant change. In the early 1980s there were40 refineries, and in the 1970s there were 58. The extensiverationalization was a result of decreased profitability due tounder-utilized capacity, increased competition and reduceddemand for gasoline. Throughout the early 1980s, demandfor gasoline dropped sharply due to weak economic condi-tions and high crude prices following the oil price shocks in 1973 and 1979. Gasoline consumption in Canada fell by18 per cent between 1981 and 1987. In the late 1970s andearly 1980s, demand for heating oil fell as well because ofincreased competition from natural gas and electricity. Also,the fuel efficiency of most cars improved, and this too
5 The Conference Board of Canada
Exhibit 4Bulk Fuel Terminals in Canada that Post Rack Prices
City Company
Saint John, N.B. Esso, Petro-Canada
St. John’s, Nfld. Ultramar
Halifax, N.S. Esso, Ultramar, Petro-Canada
Quebec City, Que. Esso, Ultramar, Shell, Petro-Canada, Olco
Montreal, Que. Esso, Ultramar, Shell, Petro-Canada, Olco
Ottawa, Ont. Esso, Ultramar, Shell, Sunoco, Petro-Canada, Olco, Coastal
Toronto, Ont. Esso, Ultramar, Shell, Sunoco, Petro-Canada, Olco
Hamilton, Ont. Olco, Sunoco
London, Ont. Esso, Ultramar, Shell, Sunoco, Petro-Canada, Olco
Sarnia, Ont. Esso, Ultramar, Shell, Sunoco, Petro-Canada, Olco
Thunder Bay, Ont. Petro-Canada
Winnipeg, Man. Esso, Shell, Petro-Canada
Regina, Sask. Esso, Shell, Petro-Canada
Calgary, Alta. Esso, Shell, Petro-Canada
Edmonton, Alta. Esso, Shell, Petro-Canada
Kamloops, B.C. Esso, Shell, Petro-Canada
Vancouver, B.C. Esso, Shell, Petro-Canada
Nanaimo, B.C. Petro-Canada
Victoria, B.C. Esso
Barepoint, B.C. Shell
Source: Bloomberg.
Table 1Gasoline-Producing Refineries in Canada
CapacityRefinery (barrels of
Company location crude per day)
Imperial Oil Dartmouth, N.S. 84,000Irving Oil Saint John, N.B. 237,500North Atlantic Refinery Come By Chance, Nfld. 99,750Ultramar St-Romuald, Que. 155,000Petro-Canada Montreal, Que. 105,000Shell Montreal, Que. 129,900Imperial Oil Nanticoke, Ont. 112,000Imperial Oil Sarnia, Ont. 122,000Petro-Canada Oakville, Ont. 83,000Shell Sarnia, Ont. 71,400Suncor Sarnia, Ont. 82,400Co-op Regina, Sask. 52,000Imperial Oil Edmonton, Alta. 179,600Parkland Industries Bowden, Alta. 6,000Petro-Canada Edmonton, Alta. 120,000Shell Scotford, Alta. 94,350Chevron Burnaby, B.C. 52,000Husky Oil Prince George, B.C. 10,250
Total 1,796,150
Source: Natural Resources Canada.

reduced the demand for gasoline. After 1987, the demandfor it slowly started to recover and increased graduallyduring the early and mid-1990s. Demand continued to pickup in the latter part of the decade.
Between 1970 and 1979, 18 refineries were shut down inresponse to weak demand and declining margins. Another10 closed their doors in the 1980–84 period. In 1991,Petro-Canada closed the Taylor and Port Moody refineriesin British Columbia and crude-processing units at itsMississauga refinery. Shell closed its Burnaby refinery and Esso closed its refineries in British Columbia and theNorthwest Territories. In the early 1990s, Ultramar alsoclosed its refinery in Halifax.
In the present decade, the biggest challenge facing therefining industry is environmental regulations. Hugeinvestments will be required, incurring costs that must berecovered by the refiners. The most recent of these regu-lations came into effect in 1999, requiring lower benzenelimits in gasoline. Canadian gasoline benzene specifica-tions now exceed those required in many countries,including Japan, and most regions of the United States.
In 1999, the federal government passed legislationrestricting the level of sulphur permitted in gasoline. This will be accomplished in two steps. Step 1 restrictsthe level of sulphur to an average of 150 parts per millionin the period from July 2002 to December 2004. Thesecond step requires reducing the level of sulphur to anaverage of 30 parts per million by January 1, 2005. Tomeet these standards, the refiners will have to investapproximately $1 billion over the next few years. TheUnited States will be imposing similar sulphur standards.However, it will be phasing them in over a longer periodof time.
Wholesale Gasoline Prices
A key pricing activity for the refiners is setting theapproximate wholesale price that retailers pay for gasoline, or what is referred to as the posted rack pricefor gasoline. The rack price provides a reference for thewholesale price of gasoline purchased at the terminallocations. There are usually between three and fivedifferent companies that post rack prices at each
terminal. Rack prices are reviewed on a daily basis at eachterminal, with changes generally made two to three timesa week. The refiners provide rack-pricing information totheir customers either directly or in the Bloomberg OilBuyers’ Guide publication, OPIS (Oil Price InformationService), Reuters, as well as other industry services.
The integrated petroleum companies give their largestcustomers—independent branded or unbranded dealers,wholesalers and big box operators—discounts from theposted rack prices. These are based on the customers’volumes and long-term supply arrangements. The dis-count values can be affected by other factors as well. For instance, if the supplier has too much inventory in a terminal and faces a containment problem, thediscount may be increased in order to move the productquicker and reduce inventory levels. The reverse mayoccur in the case of a supply shortage. During a pricewar, discounts to branded retailers may be increased toensure a minimal margin to the dealer while allowinghim/her to remain competitive. Discounts are not madepublic and are subject to negotiation between the whole-saler and the customer.
The integrated petroleum companies provide many oftheir own stations with product that remains theirs until the customer purchases it at the pump. It is there-fore difficult to determine the actual wholesale value ofthis product, as the rack price does not apply. Majorintegrated companies use an internal market acquisitionprice for this product, which has some relationship torack price as well as volume discounts. However, thisinformation is proprietary to the companies themselvesand not made public.
6 The Conference Board of Canada
Exhibit 5Rack Prices
Rack price is used as a proxy for the wholesale price of gasoline throughoutthis report. The weakness of this assumption, however, should be clearlyrecognized. Eighty-two per cent of the gasoline sold in Canada is soldthrough branded outlets (Kent Marketing), whose acquisition price is likelyto be different from the rack price. In addition, as outlined above, large-volume independents may also receive a discount from the rack listing. As a result, the rack price applies to only a small portion of wholesale gasolinesold in Canada. Nevertheless, rack prices are the only readily accessibledata on wholesale prices, and trends in rack prices represent movements in wholesale prices.

Every day, each supplier of wholesale gasoline determineswhat the appropriate rack price should be for their termi-nals. The factors that are considered in the setting oftheir rack price include:• Crude Oil—The crude oil price is generally established
at New York harbour. Possible changes to the underly-ing trend in crude are monitored closely by the majors.
• Refiner Margin—The refiner margin is the differencebetween the price of wholesale gasoline and crude oiland is also referred to as the crack margin. High or lowrefiner margins provide a good indication of supplyconditions in the different markets across the country.For instance, a high refiner margin would indicate thatsupply is tight in a particular market. This factor is animportant input into determining what the daily rackprice should be. Average refiner margins in Canada areshown in Chart 1. Much of the fluctuation in therefiner margins is likely caused by factors of season-ality, given the technology of producing fuels. Demandfor gasoline is much higher in the summer months.Gasoline is often in excess supply during the fall andwinter months as large amounts of gasoline are pro-duced as a by-product of the refineries’ concentrationon home heating fuel supply.
• Competing Posted Rack Prices—The majors also con-sider the rack prices of their competitors when deter-mining the appropriate price. These prices are publiclyavailable through the many services to which mostwholesalers subscribe. Competitors’ rack postingssometimes differ due to the unique market conditionsthat a particular competitor has to contend with or to
their different interpretations of the direction ofmarket forces. However, due to the high sensitivity ofgasoline demand to price changes, posted rack pricesgenerally are very similar to each other.
• U.S. Rack Locations—For terminal locations in easternCanada and the lower mainland of British Columbia,the U.S. rack price is probably the most importantfactor in determining their own rack prices. Demandfor wholesale gasoline is extremely price sensitive and,as a result, if rack prices in Canada are not competi-tive, customers can import gasoline from the U.S.border rack locations. In the case of Ontario, borderrack locations such as Buffalo, Detroit and Duluth areviable alternatives for customers wishing to obtaingasoline. In Quebec and Atlantic Canada, the rackprice in New York harbour is closely watched. Theimport alternative is not as important a factor in thethree prairie provinces because of the greater distancesinvolved. Consequently, factors like crude oil costs andcrack spreads are more important in determining rackprices. In Vancouver, however, where imported productis a viable alternative, the U.S. rack price in Seattlemust be monitored on a daily basis.
In general, U.S. rack prices are the most important consid-eration in determining Canadian wholesale prices. Gasolineproducts can be freely exported and imported betweenCanada and the United States. The result is that thewholesale industry regards American product and Americanrefineries as its competition. As a result, prices are alsodetermined by supply and demand factors in the relevant
7 The Conference Board of Canada
Chart 1Average Refiner Margin in Canada(cents per litre)
Source: M.J. Ervin.
Jan.-91 Jul.-91 Jan.-92 Jul.-92 Jan.-93 Jul.-93 Jan.-94 Jul.-94 Jan.-95 Jul.-95 Jan.-96 Jul.-96 Jan.-97 Jul.-97 Jan.-98 Jul.-98 Jan.-99 Jul.-99 Jan.-00 Jul.-0002468
1012141618

U.S. markets rather than only by conditions in Canada. For example, in early 2000, the northeastern coast of theUnited States experienced colder-than-average conditions,which resulted in an increased demand for, and productionof, heating oil and thus reduced available supplies ofgasoline. This resulted in a sharp increase in northeasternU.S. rack prices for gasoline. Although central Canada hada much milder winter, gasoline prices were neverthelesspushed up as a result of the high U.S. prices.
From the consumer’s point of view, this continentalcompetition results in wholesale prices that are influ-enced by the much larger U.S. market rather than by just the limited number of players who operate within the Canadian refining industry.
The decision to change the rack prices is based on the trends in the U.S. rack prices, crude oil and crack spreads.Sometimes the indicators all move in the same direction and,consequently, the new setting for the rack price is relativelystraightforward. However, in many cases, the indicators movein different directions and a great deal of judgement maybe required to establish a competitive rack price.
Refiner Margins
Refiner margins declined in Canada in the early 1990s,stabilized from 1993 to 1999 at an average of around 7 c.p.l. and have been rising since the beginning of 2000 (see Chart 1). Profitability has been maintained byrationalization and a drastic reduction in operating costsas opposed to increased product prices. Because thewholesale price in Canada is in large part influenced byU.S. wholesale prices and crude prices are determined onworld markets, the refiner margin in Canada is heavilyinfluenced by outside factors, as opposed to internal costs.
Chart 2 shows a comparison of Canadian and Americanrefining margins. Their relationship is clearly visible, andthe difference in margins is due to the cost of transport-ing the import alternative. The increase in U.S. marginsin mid-2000 reflects the introduction of reformulatedgasoline into selected U.S. markets. Reformulated gaso-line (RFG) is a general term for federally mandated gasoline in the United States that is specially processedand blended to reduce the emission of pollutants such as hydrocarbons, toxics, and nitrogen oxides. Whencompared to typical gasoline, RFG reduces hydrocarbon emissions by at least 15 per cent, according to U.S.Environmental Protection Agency estimates.
Empirical Analysis of Wholesale Prices
The empirical analysis confirmed the finding that changesin U.S. rack prices are closely linked to changes inCanadian wholesale prices (see Appendix B). The changein wholesale prices for 11 Canadian cities were regressedon the change in wholesale price in New York. The resultsindicate that the U.S. wholesale price, both present andlagged one month, are significant in explaining themovement in wholesale prices for all 11 cities. For mostof the cities, the results revealed that a one cent(Canadian) per litre increase in wholesale prices in theUnited States eventually led to a one cent per litreincrease in Canadian wholesale prices. The close relation-ship between Canadian and U.S. wholesale prices is notsurprising. The majors and regional refiners in Canadaclosely monitor U.S. wholesale prices and set their pricesto attempt to remain competitive with imported gasoline.If Canadian wholesale prices were not competitive with
8 The Conference Board of Canada
Exhibit 6Import Alternatives
It is well known that Canada both exports and imports crude oil. At the sametime, refined product, such as gasoline, crosses the border freely betweenCanada and the United States.
In 1999, Canada exported almost 6 billion litres of gasoline while importingover 2 billion litres. Most of Canada’s gasoline trade is with the UnitedStates. Exports are particularly heavy in the winter months, when an excesssupply of gasoline is produced in Canada as a by-product of acceleratedhome heating oil production. Imports tend to be more significant in thesummer months when Canadian demand is highest.
The fact that Canada and the United States exchange gasoline supports theCanadian refiners’ need to remain competitive with their American counter-parts. If Canadian rack prices for gasoline were significantly higher than rackprices in neighbouring U.S. markets, Canadian refineries could lose much oftheir business to imports, and could become economically unviable.
For independent gasoline distributors in Canada, an available importalternative allows them a supply option other than that presented by therelatively concentrated Canadian refining industry.
For consumers, the U.S. import alternative and the Canadian wholesaleindustry’s need to remain competitive on a continental basis translate into competitive prices at the rack level, which in turn lead to lower prices at the pump.

U.S. prices, imported product would flood the Canadianmarket and hurt the refinery business in Canada.
Stakeholder Concerns
Implications of a Continental Wholesale Market
Independents, in particular, are concerned about a per-ceived lack of competition in the wholesale market forgasoline in this country. Generally, their complaints centredon two specific areas: pricing and access to supply.
In eastern Canada, the majors set their rack prices at a level designed to remain competitive with importedproduct. Some independents believe that rack pricingbased on this formula places them at a competitivedisadvantage. These independents argue that the postedrack price in Canada would have to be higher than in theUnited States if the rack prices set by the majors werebased on their costs. They assume that all Canadianrefineries have higher unit costs then their U.S. counter-parts, an assumption that cannot be proven. As a result,they contend, the retail prices at the stations run by the majors would be higher. This would then enable theindependents to import product from the United States at a cheaper rack price and have a slight advantage overthe majors at the retail level.
If the majors based their rack prices on cost as opposed tothe import alternative, it might be possible for the inde-pendents to gain a competitive advantage, depending on
the market conditions. However, from the majors’ point ofview, pricing to keep imported product out of their mar-kets makes sound economic sense. Imports reduce thedemand for product from their refineries and could poten-tially damage that portion of their overall business.
The fact that the rack price in Canada is highly influencedby economic conditions in the United States leads to somepricing decisions that, at first glance, would seem to placethe industry in Canada at a disadvantage. In March 2000,for example, wholesale prices increased in the UnitedStates because of tight inventories. Inventories in Canadawere at reasonable levels at that time, indicating that aprice increase was not required. Yet, because of the inte-gration of the two markets, wholesale prices also increasedin Canada. But if Canadian rack prices had not increased,U.S. marketers would have had an incentive to purchaseproduct in Canada. This would have reduced inventoriesand would have eventually led to increasing rack pricesuntil the price differential excluding transport costsbetween the two countries was eliminated. In the shortterm, though, Canadian retailers and consumers paid ahigher price for their gasoline than they would haveotherwise. It should be noted, however, that this pricingalso benefits Canadian retailers and consumers when thereverse is true and U.S. inventories are high. When thishappens, Canadian retailers pay lower wholesale pricesthan may be warranted by Canadian conditions.
The observation that rack prices may sometimes be set to keep out imports is a double-edged sword for
9 The Conference Board of Canada
Chart 2Refiner Margin Comparison: Canada vs. United States(cents per litre)
Sources: M.J. Ervin and U.S. Energy Information Administration.
Jan.-96 Apr.-96 Jul.-96 Oct.-96 Jan.-97 Apr.-97 Jul.-97 Oct.-97 Jan.-98 Apr.-98 Jul.-98 Oct.-98 Jan.-99 Apr.-99 Jul.-99 Oct.-99 Jan.-00 Apr.-00 Jul.-000
2
4
6
8
10
12
14Canada United States
independents and motorists. While it denies independ-ents a cheaper import alternative, it provides them with less expensive domestically refined gasoline. In short, it may keep importing independents fromobtaining a competitive edge, but it also generallyprovides Canadians with lower gasoline prices than might be the case if the limited number of Canadianrefiners did not have to contend with potential U.S. competition.
Uniformity of Rack Prices
The other major complaint about rack prices in Canada isthat they appear to be nearly the same at each terminaland to move uniformly. Some stakeholders claim that thisrigidity indicates that there is less competition in Canadathan in the United States. They also contend that it ismuch more difficult to obtain discounts in Canada, espe-cially when the independent dealer is not purchasing alarge quantity of gasoline.
To a certain extent, the differences between the rackprices in Canada and the United States reflect the largersize of the U.S. market and the presence of many morecompetitors. However, from the perspective of the majorsand regional refiners in Canada, the uniformity of rackprices within the markets across the country reflects thepricing formulae that are used to determine rack prices.All of the majors and regionals post their rack prices insome relationship to the same benchmark U.S. price and,given that gasoline is a homogeneous product, it is notsurprising that they are similar. Local market conditionsimply that a rack price posting that is significantlyhigher than the competition will result in a severe loss of business.
The move to rack postings in the mid-1990s significantlychanged the market and made it much more difficult forthe independent dealers to obtain discounts, althoughmany operators still receive limited discounts. Prior torack postings, it was possible for an independent to get a product’s price from a major and then go to anothermajor and negotiate a better discount. The posting of all rack prices prevented the independents from using a potential lever for them to attempt to negotiate abetter deal.
Discounts
Discounts from the rack price as well as non-priced sup-plies of gasoline to refiner-owned retailers are contentiousissues for many independents. They believe that while therack price determines the cost of their supply, brandeddealers have access to arrangements that are not subject tothe same transparency as their pricing and, as such, rackprices do not necessarily represent the actual cost incurredby competing dealers. The implication is that brandedretailers, as well as those who receive discounts, includingindependents, have higher retail margins than thoseactually estimated for statistical and analytical purposes.
Export Prices
Refineries export product to the United States, particu-larly in winter months when inventories are at highlevels. In order to sell product south of the border,refineries must absorb some or part of the freight coststo ensure that the product is competitive in the U.S.market. As a result, depending on the market condi-tions, the export price is frequently lower than thedomestic price. Some independents contend that, to befair, the domestic rack price should be the same as theexport price. However, if the domestic price matched theexport price, the refinery would potentially lose money.
Product Supply
Many independent stakeholders contend that one oftheir biggest problems is obtaining a reliable supply of product from the terminals across Canada at a compet-itive price. The problem is viewed as more serious inwestern Canada. The Prairies have limited import options into Winnipeg, and importing product to thisregion is more expensive than to other parts of thecountry. Independent dealers in this part of the countryregard long-term contracts with major oil companies orregional refiners as a necessity in order to remain inbusiness. A frequently heard comment was that, whileindependents have not yet encountered serious problemsobtaining supply, in a crunch the majors would lookafter their own interests and leave their independentcustomers in a lurch. However, this claim was not sub-stantiated by the past behaviour of refiner-marketers.
10 The Conference Board of Canada
Even in eastern Canada, where the import alternative isviable, independents reported problems in being able toobtain product supply from outside Canada. Detroit is anexcellent source of imported product because it is re-garded as a very competitive market. However, the onlyoption for the independents to obtain supply from thismarket was by truck since there is no product pipelinefrom Detroit to Sarnia. Since trucking product to theheartland of Ontario is more expensive than supplying itby pipeline, the majors can account for this factor whenthey determine their rack prices. It was noted that apublic pipeline from Detroit into Canada would ease thedifficulties that some of the independents encounter inobtaining product. Buffalo, another alternative market forimported product, was not regarded by some independ-ents as being viable because it is a very uncompetitivemarket dominated by one supplier.
Difficulties in obtaining imported product from the UnitedStates are likely to intensify due to Canadian environmen-tal laws. Restrictions on the amount of benzene in gaso-line may make it difficult for Ontario independent retail-ers to import from Michigan since their product does notmeet Canadian federal guidelines. In addition, changes tosulphur content regulations that are not in step with theU.S. regulatory timetable may also seriously hamper thesupply of alternative product from the United States.
Tax Collection
Major and regional refiners have an advantage over inde-pendents in terms of tax collection. Independents must paythe excise taxes (federal and provincial) on gasoline imme-diately upon delivery of wholesale product. On the otherhand, branded dealers pay the excise taxes only after theproduct is sold at the retail level. This provides the brandeddealers with a cash flow advantage over the independents.
Refiner–Independent Retailer Interface
In consultations with stakeholders, it became clear thatserious problems are seen to exist between refiners andindependent retailers.
Canada has a limited number of refiners who sell theirproduct at the wholesale level. All these refiners are
also involved in retail operations that directly competewith their independent customers. This situation differssignificantly from the U.S. situation where multiplesuppliers exist, many of whom operate exclusively at the wholesale level.
Independents believe that Canadian refiners do notactively compete for their business and set rack prices inorder to prevent independents from obtaining alternativesupply. In addition, they contend that branded dealersare regularly provided with product at preferential pricesor guaranteed margins that give them an unfair advan-tage at the street level. Because negotiated contracts areconfidential, it is impossible to know the real acquisitionprice paid by retailers.
Retail
Industry Structure—Retail Sites
There are currently close to 13,250 retail outlets sellinggasoline in Canada, down from 22,000 in 1989. Thisrepresents a reduction of just under 40 per cent. Thismirrors the experience in the United States where the number of gasoline outlets diminished by almost 45 per cent, from 279,000 in 1972 to 155,000 in 1992.
The competitors in the retail gasoline market are many andvaried. The current make-up of the retailers is as follows:• Two integrated refiner/retailer multinationals—Esso
and Shell. These companies are also involved to varying degrees in oil exploration and production,although they are net purchasers of crude oil.
• One national integrated refiner/retailer—Petro-Canada.Petro-Canada is also an oil producer, but its productiondoes not meet the requirements of its refineries so itmust buy crude oil from other suppliers.
• At least one integrated refiner/retailer in each majorregion in Canada—Ultramar, Irving, Sunoco, Chevron,Arco, Husky, Federated Co-op and Parkland. All ofthese companies, with the exception of Irving,Federated Co-op and Parkland, are part of large inte-grated companies that are also involved in oil explo-ration and production worldwide. Husky, however, isthe only company that is self-sufficient in its Canadianoil production.
11 The Conference Board of Canada

• A number of big box store retailers, such as CanadianTire, Real Canadian Superstore, Save-on Foods andCostco.
• A large number of small independent retailers.• A number of private branded distributor networks
such as Wilson’s Fuel, Mr. Gas and Domo.
According to Kent Marketing’s city-based data, thedecline in the number of retail outlets in the 1990s wasled by the majors, down 36 per cent, and the regionals,down 25 per cent, while the independents declined by 10 per cent. The proportion of sites for the independentsincreased from 26 per cent to 32 per cent between 1990and 1999, while the proportion for the regionals andnationals either declined or remained flat. There are anumber of factors behind the increased proportion ofsites for the independents, some of which include:• The increased involvement of convenience stores,
which often brand under their own names, in gasoline marketing.
• The rising number of grocery store chains and othertypes of marketers offering gasoline.
Several independent chains experienced strong growth insales in the late 1990s through the acquisition of smallerindependent chains. At the same time, independent chainshave been slower to close stations than the majors. Whilethe proportion of stations they own may have increased insome markets, their sales volumes per outlet are signifi-cantly smaller than those of the refiner-marketers.
Retail Modes of Operation
The retail gasoline infrastructure involves two mainstakeholders: the supplier and the dealer. The supplier,whether it be a refiner-marketer or an independentchain, holds initial title to the product as it leaves theterminal and may also own the brand name at the retailoutlet, while the dealer manages the day-to-day opera-tions of the outlet. Several possible relationships existbetween the retail dealers and their suppliers, including:• Company Operated—The supplier owns the retail
outlet, and the dealer and attendants are salariedemployees of the supplier. The supplier determines thepump price. Only 10 per cent of all Canadian outletsare company operated.
• Commission Operated—The outlet facilities and inven-tory are owned by the supplier, but the dealer is paida commission generally based on the volume of gaso-line sold at the outlet. Again, the supplier determinesthe price. Thirty-two per cent of Canadian servicestations are operated in this fashion.
• Lessee—The supplier owns the outlet facilities, whichare then leased out to the dealer. The lessee (dealer)purchases gasoline from the supplier and then resellsit to the customer at a price established by the lessee.Only 12 per cent of gasoline outlets in Canada arelessee operated.
• Independent Dealer—The dealer owns the retail facili-ties and purchases the gasoline from a supplier, andthen resells at a dealer-established retail price.Independent dealers make up 46 per cent of theCanadian retail gasoline market.
In the first two relationships, it is important to note thatthe gasoline belongs to the supplier until it is sold. Thishas important implications for what the actual retailmargins for such stations are. In the case where thedealer purchases the gasoline, the purchase price isclearly established at that point. Usually it is the whole-sale price, or some price discounted on the basis ofarranged volumes or long-term negotiated supply. Thishelps define the retail margin, which is the differencebetween the selling price and the rack price. Undersupplier-owned or consignment arrangements, the actualprice paid for the gasoline is less clear and may distortthe actual margin that the retailer receives. There arealso tax implications in the relationship. Independentretailers pay tax when they receive their product.Consignees are responsible for the tax only when theyactually sell the product to the customer.
While the relationship between the supplier and retailermay vary from station to station—and the ownership ofthe product may, too—it is important to note that allretailers are operating in the same market. As a result,the actions of any one retailer can have a major impacton the pricing decisions of all their competitors, regard-less of ownership structure. Technically, 58 per cent ofretailers are able to set their own price. However, theycannot ignore the price-setting activities of the other 42 per cent of outlets for which the suppliers fix prices.
12 The Conference Board of Canada

Per Outlet Sales Volumes
Although independents increased their proportion ofretail sites in the 1990s, a different picture emerges whenexamining average sales volumes per station or through-puts. The market share of volume for the independentsdeclined from 23 per cent in 1990 to 18 per cent in 1999.
Over the sub-period 1995–99, the majors’ market shareincreased slightly from 56.5 per cent to 58.6 per cent,while the regionals grew to 23.4 per cent from 19.7 percent. The regionals’ market share increased due in part totheir acquisition of independent chains. Because of this,the independents’ share dropped from 23.7 per cent to 18per cent. However, some of the larger independents,including Pioneer, managed to retain their market shareduring the 1995–99 period while others lost marketshare. Pioneer, however, is a special case. While itsactions and pricing policies are consistent with those ofan independent, it is 50 per cent owned by Sunoco, aregional refiner, with whom it has a supply arrangement.
The changing role of independents can also be seen byexamining how the average sales volume per stationchanged during the 1990s. Table 2 shows the averagethroughput figures at both the national and regional levels.Chart 3 shows the change in average throughput for majors,regionals and independents between 1990 and 1999.
The decline in the number of outlets selling gasolineduring the 1990s, combined with a 16 per cent increasein sales volumes, naturally resulted in a significant gainin average throughput per outlet. At the national level,average throughput increased by almost 65 per cent, from1.95 to 3.2 million litres. Every region of Canada recordedan increase in average throughput in the 1990s. Quebecand Atlantic Canada showed the lowest increase at about47 per cent and Ontario the highest at approximately 80per cent. Most of the majors and regionals managed tosell more gasoline in the 1990s, even though somereduced the number of outlets by close to 40 per cent. Onaverage, the traditional independents have much lowerthroughputs than the major refiner-marketers. (See thesection “Comparison of Canadian Centres.”)
Chart 3 shows how majors have led the rationalization ofretail outlets and the important impact rationalizationhas had on their average station throughput in the1990–99 period. Neither regionals nor independents havekept pace with the majors’ rate of increase. As a result,the average throughput of a major compared to that ofan independent retailer has increased from 36 per centmore in 1990 to 102 per cent more in 1999. In the UnitedStates, the U.S. Energy Information Administrationreports that the average sales volume for all stations,
13 The Conference Board of Canada
Exhibit 7Branded Independents
Forty-six per cent of retail gasoline outlets in Canada are operated byindependents, 70 per cent of which have no affiliation with a refiningoperation. Therefore, 14 per cent of Canadian retailers are independentsaffiliated with a major or regional refiner.
The situation of these branded independents is both similar to and differentfrom other Canadian gasoline retailers. Like other independents, brandeddealers own their facilities and purchase the gasoline from their brandedsupplier and sell it at a price that they appear to determine themselves, butwhich is really established by market conditions. Branded independentsusually have three-to-five year contracts to carry a certain banner. However,the supplier may cancel these contracts at very short notice, often less than30 days. With the dramatic rationalization of outlets by majors over the pasttwo decades, many branded independents have found themselves with theircontracts cancelled and scrambling to find an alternative supplier or to exitthe business completely. This cancellation of contracts may be even moremarked when their supplier upgrades a nearby company-owned facility intoa high-volume, low margin superstation.
Branded independents have been subject to changing arrangements withtheir suppliers over the past decade. Their supply price is based on abranded rack price that is higher than the listed price (although discountsusually apply). Charges once borne by the supplier have now been passeddown to the retail level, including credit card costs and loyalty-programexpenses over which the retailers themselves have no control. In addition,with the high degree of competition at the street level and marketingpractices such as zone pricing, branded independents claim they seldom areable to truly determine their prices or make an adequate return on their timeand investment.
Table 2Average Outlet Throughput by Region(millions of litres)
Region 1990 1995 1999
Atlantic 1.64 1.98 2.41Quebec 1.59 1.97 2.36Ontario 2.36 3.32 4.25Prairies 1.83 2.36 2.85British Columbia 1.96 2.73 3.31Canada 1.95 2.58 3.20
Source: Kent Marketing.

including majors, regionals, convenience stores andjobbers, was 4.02 million litres in 1998. The comparablefigure in Canada was 3.20 million litres. The most effi-cient outlets in southern Ontario operate at a par withequivalent U.S. stations, selling about 6 million litres peryear. The fact that throughputs in most other regions arelower in Canada reflects the different population densitiesand the geography of the country.
Ancillary Revenues
Another major structural change in the industry over the past 10 years has been the growing importance ofancillary revenues from convenience stores, fast-foodrestaurants and car washes. Petro-Canada, for instance,reported that sales of non-gasoline products haveincreased by close to 40 per cent since 1992. Gasolinestations have evolved over the years into outlets withmultiple product and service lines. Convenience stores at many of the larger stations offer an array of groceryproducts and, in some sites, bakeries, video rentals andbanking machines, as well as other goods and services.The proliferation of convenience stores is designed togenerate non-gasoline revenue since greater sales ofother goods and services are required to offset declininggasoline margins and to help cover fixed costs. Theimportance of ancillary sales becomes evident when site economics are taken into account.
Site Economics
Throughput is not the only measure of a retail gasolineoperation’s viability. Efficiency of operation, the role ofancillary activities and incomes and a fair return oninvestment are also important factors. A major concern of independents in particular is the sustainability of their stations as stand-alone operations. Table 3 shows a typical operating statement for three different types of operations.
Site A represents a high-volume urban outlet in a population centre of over 150,000 with an average gasoline throughput of 8.5 million litres per year. Site A has a convenience store with high sales but relatively low convenience store margins (9.2 per cent).
Site B is located in a small-town secondary market not too far from an urban centre with a population of less than 75,000 and a gasoline sales throughput of 4.9 million litres. Site B has both a small conveniencestore as well as a fast food outlet. Convenience storemargins are 13 per cent of sales, although the volume of sales is less than 40 per cent of that of Site A.
Site C is a rural outlet located in an area with a population of between 10,000 and 25,000, with a relatively low throughput of 2.8 million litres. Site Calso has a convenience store of moderate size withhealthy ancillary margins of over 22 per cent of sales.Sites B and C are situated within competitive distanceof Site A, and their margins are therefore similar, beingin the 6–6.4 c.p.l. range.
These tables illustrate the types of fixed and variablecosts faced by operators. They also show the increasedimportance of ancillary sales, particularly in the face of low gasoline margins. All sites are dependent to agreater or lesser degree on ancillary sales in order tomeet fixed costs.
While the table shows three independent operators, costsfor majors and regional refiner-marketers would probablybe similar, with higher costs for advertising and promo-tion and possibly higher corporate costs.
14 The Conference Board of Canada
Chart 3Average Throughput per Station(millions of litres)
Source: Kent Marketing.
Canada Majors Regionals Independents0
0.5
1.0
1.5
2.0
2.5
3.0
3.5
4.0
4.5 1990 1999

Retail margins clearly affect viability. The operatingstatement would change if the retail margins on gasolinewere to decline.
At a margin of just over 6 c.p.l., all three sites are viable,returning pre-tax profits of between 13 and 26 per centon capital employed. If the margin is reduced to 4.5 c.p.l.,sites A and C still provide a return of over 10 per cent. Site B, with its lower volume and lower ancillary profits, provides a return of only 6 per cent. With a low 3 c.p.l. margin, the return on investment remains posi-tive but barely break-even for Sites A and B. Only Site C,despite its low volumes but with its profitable conven-ience store operation, continues to provide a viablereturn of almost 9 per cent.
New Entrants in the Canadian Market
Prior to the 1990s, Canadian Tire was the main massmerchandiser that sold gasoline at some of its outlets. Inthe early 1990s, this changed as other retailers, such asCostco and various grocery chains, entered the market.The market penetration in western Canada is significantas there are currently over 40 mass merchandisers indifferent locations selling gasoline.
These new entrants are successful because they providean extensive product service offering and a differentapproach to pricing compared with the traditional gaso-line marketers. Many big box stores succeeded in gainingmarket share by pricing below the prevailing market price
15 The Conference Board of Canada
Table 3Actual Service Stations in Eastern Canada
SITE A SITE B SITE C
Annual volume (litres) 8,467,610.00 4,945,795.00 2,812,902.00 Retail margin (c.p.l.) 6.29 6.05 6.43Gross fuel margin $532,613.00 $299,221.00 $180,870.00 Convenience store sales $1,258,703.00 $475,003.00 $749,572.00 Gross margin-c-store $116,159.00 $63,999.00 $167,971.00 Fast food rental $53,371.00 Total gross margin $648,772.00 $416,591.00 $348,841.00
Site operating costsWages $112,884.00 $97,782.00 $85,415.00 Benefits $11,500.00 $10,794.00 $6,733.00 Heat, light, power, taxes $13,232.00 $18,860.00 $29,981.00 Advertising & promotion $37,312.00 $19,849.00 $722.00 Cash over/short $4,624.00 $4,142.00 ($3,428.00)Credit card charges $36,369.00 $23,968.00 $14,943.00 Vehicle expenses $4,688.00 $1,322.00 $2,707.00 Other $18,058.00 $9,353.00 $9,169.00 Maintenance $25,730.00 $18,361.00 $9,179.00 Site operating profit (gross) $384,375.00 $212,160.00 $193,420.00 Service: General & administration (avg. corporate) $101,611.00 $59,350.00 $33,755.00 Site operating profit (net) $282,764.00 $152,810.00 $159,665.00
CapitalLand $265,000.00 $220,000.00 $100,000.00 Building $430,000.00 $655,000.00 $475,000.00 Equipment $325,000.00 $240,000.00 $85,000.00 Working $73,500.00 $68,325.00 $72,300.00
TOTAL $1,093,500.00 $1,183,325.00 $732,300.00
Simple return before tax 25.9% 12.9% 21.8%If retail margin were 4.5 c.p.l. 12.0% 6.4% 14.4%If retail margin were 3.5 c.p.l. 0.4% 0.2% 8.6%
Source: IRGMA.

or through price discounts in the form of coupons thatare redeemable in the nearby store.
Traditional outlets offer gasoline as their primary prod-uct. Mass merchants offer a wide variety of consumerproducts, with gasoline as only a complementary prod-uct. Mass merchants charge competitive prices for gaso-line to reinforce their low price image, since gasoline isviewed as a high-profile product. Petroleum is an idealproduct to increase traffic since it is used by almostevery customer and is purchased with a frequency thatsupports the mass merchandiser’s other products. Cross-merchandising moves the gasoline customers into thestore, and vice versa.
The phenomenon of the big box store is not onlyCanadian, it is global. Big box stores have increasedtheir importance in the United States and have cap-tured major market share in Europe. In the UnitedKingdom, grocery stores and other mass merchandiserspeaked at close to 40 per cent of the market in themid-1990s. Their share has fallen as traditional outletshave become more competitive. Nevertheless, massmerchandisers still control approximately 25 per cent of the U.K. market.
There is still a significant difference between Canada and the United States in terms of the penetration of supermarkets and big box stores into the retail gasoline business. Mass merchandisers are expandingtheir number of gasoline outlets, and the number ofgrocery store chains that have started marketing gaso-line in the United States has increased. Large chainstores have carved out 5 per cent of the U.S. market and are expected to grow to 15 per cent within the next 10 years.
Big box stores may also make significant breakthroughsin Canada through the introduction of new technology.Unmanned fueling is not yet available in Canada due tozoning and safety requirements. This service has becomeavailable in parts of the United States and is likely toeventually be offered in Canada. Big box operators aregenerally on the cutting edge of technology and maygain an advantage in the market by introducing newer,more efficient technology.
Barriers to Entry and Exit
In the 1990s, the industry also experienced another struc-tural change—increased costs to both entering and exitingthe retail business. New environmental regulations make itmore expensive to open a retail outlet because the under-ground tanks must meet strict guidelines. Also, someindependents contend that it was more expensive to obtaincredit in the 1990s because banks started to require anenvironmental assessment of existing sites before lendingmoney to develop new outlets. The costly environmentalassessments are necessary because the banks must ensurethat existing sites are not a financial liability in the eventthat the potential borrower goes out of business. It cancost up to $1 million to have an underground tankremoved from a site if gasoline has seeped into the soil.This is mainly a problem for outlets built in the 1960s and1970s, where tanks may have corroded over 20 or 30 years.
Entering the retail business is also more difficult becauseof lower retail margins that have been a fact of lifethroughout most of the 1990s. Low margins mean that ahigh throughput is required in order to attain a reason-able return on investment. Large throughputs require anexcellent location as well as ancillary products, both ofwhich require larger investments. In the 1980s, whenmargins were much higher, it was possible to enter orstay in business without as large a capital investment.
Capital requirements are large for entry: fixed facilitiescan cost up to $2 million per location—excluding landcosts—and inventories, start-up costs and customercredit also require extensive capital.
There are several other barriers to entry that may dissuadenew retail entrants. Economies of scale currently exist inthe industry that would force a new participant to enteron a large scale or else face serious price disadvantages.These economies are relevant for all areas of the industry,including production, distribution, research, marketing,human resources and financing. Brand identification andcustomer loyalty also work against new entrants.
Is it likely that any of the above factors will deter invest-ment in new outlets? For the majors and mass merchandis-ers, the answer appears to be no. They have the revenue
16 The Conference Board of Canada

base to spread the additional costs required to open a newoutlet. Even some of the larger independents will not bedeterred. Some independents plan to invest in new proper-ties in the short term. However, higher entry and exitcosts will likely deter the smaller operators who would findit difficult to obtain the credit to enter this business.
Regulatory Environment
Over the past decade, both the federal and provincialgovernments in Canada have introduced a number ofenvironmental regulations. These include the requirementfor low vapour pressure gasoline in the early 1990s andthe requirement for low sulphur diesel in the mid-1990s.As mentioned earlier, the most recent legislation cameinto effect in 1999. It requires that the content of ben-zene in gasoline be limited to 1 per cent. In 1999, thefederal government also passed a regulation restrictingthe level of sulphur permitted in gasoline in two separatephases. Step 1 restricts the level of sulphur in gasoline toan average of 150 parts per million in the period from
July 2002 to December 2004. The second step requiresreducing the sulphur content to an average of 30 partsper million by January 2005.
Some jurisdictions in the United States also regulate thegasoline industry. In some cases, their laws are muchtougher than the comparable laws in Canada, while inother cases the opposite is true. Canada does not yetrequire reformulated gasoline, as is the case in manyurban centres in the United States, as well as the state of California. Reformulated gasoline (RFG) was introducedinto one fourth of the U.S. marketplace with the purposeof reducing ground level ozone, or smog.
Two provinces in Canada regulate gasoline markets. PrinceEdward Island controls the price of gasoline both at thewholesale and retail levels. In Quebec, the Régie del’énergie monitors and regulates the minimum price forgasoline to ensure that it is not sold below cost. Also, the Régie has the power to determine and implement aminimum retail margin to cover the operational costs ofoutlets. To date, this provision of the law has never beenapplied. Other jurisdictions have attempted price regula-tion but have since abandoned these attempts.
In the United States in 1993, nine states had Motor FuelSales Below-Cost Laws prohibiting the sale of gasolinebelow cost. Today, a total of 23 states have General SalesBelow-Cost Laws. A 1999 study of predatory pricing andstate below-cost-sales statutes in the United States,written by Terry Calvani for the Competition Bureau of Canada, summarizes:
The economic literature concludes that stateretail gasoline below-cost sales legislation hasincreased costs to consumers. Interestingly, suchlegislation appears not to have provided inde-pendent dealers either higher profits or greaterstability. Thus the laws appear to come at a costwithout the attendant benefit to the channel ofdistribution the legislation sought to protect.
A 1998 study found that gasoline prices were 2 cents(U.S.) per gallon higher in states that have specificgasoline sales-below-cost laws (Anderson & Johnson,Antitrust and Sales-Below-Cost Laws: The Case of Retail Gasoline).
17 The Conference Board of Canada
Exhibit 8Changing Environmental Standards
Most Canadians strongly support any steps that have the long-term goal ofprotecting our environment. However, changes in gasoline standards relatedto benzene and sulphur levels that are out of step with similar measuressouth of the border threaten to have a large impact on the gasoline industryin Canada as well as on the prices Canadian motorists pay for gasoline.
Currently, Canada’s benzene standard is higher than that of the UnitedStates. Canada will soon be implementing sulphur content standards that are approximately two years ahead of similar U.S. standards. What will thismean for Canadians?
The lack of conformity in standards will mean that Canadians and Americanswill be purchasing two different types of gasoline. Unless some U.S.refineries decide to undergo the expensive process of customizing theirproduction for the Canadian market, imports will become less of a threat forCanadian refiners until U.S. standards fall in line. When California imple-mented emission standards that were more rigorous than those found inother U.S. states, California refiners could exert more control over pricesand, as a result, that state’s motorists experienced significantly higher pumpprices. During 2000, the introduction of reformulated gasoline also resultedin a spike in gasoline prices in the U.S. Midwest. If Canada decides toincrease its environmental standards beyond those of the United States, it will likely result in:• an increase in Canadian refining costs to meet these new norms, • a lessening of import opportunities for independent wholesalers, • less competition for Canadian refiners and, consequently, • increases in Canadian wholesale prices that will be passed on to the
Canadian consumer.

A major difference between the two countries is U.S.state divorcement laws. These laws stop refiners fromowning and operating service stations. Currently, theUnited States has divorcement legislation in five jurisdic-tions: Connecticut, Delaware, Maryland, Nevada and theDistrict of Columbia. Neither Canada nor the provinceshave divorcement legislation (which would fall underprovincial jurisdiction). U.S. studies have found thatconsumers derive no benefit from divorcement laws. Inaddition, these laws have not stemmed the decline inretail outlets nor affected the composition of retailestablishments.
Why Did the Gasoline Market Change in Canada?
In the 1990s, the retail gasoline industry experienced areduction in the number of outlets, which enabled higheraverage throughput and greater reliance on ancillary ornon-gasoline revenues at the retail site.
Twenty years earlier, the typical gasoline station includedpumps and a service bay that provided car service andrepairs. This model began to change in part due to theeconomic downturn caused by the OPEC-induced surge inoil prices in the early 1970s. In addition, the auto repairsegment of the business became increasingly less attrac-tive to the majors because of the competition provided byspecialized repair shops, such as Canadian Tire, as well asextended warranties from automobile manufacturers. Themajors and regionals began to invest in self-servicestations in order to reduce average costs at each outlet.In 1973, the industry operated only 93 self-service sta-tions, but by 1980, this number increased to 2,758. Thetotal number of outlets began to decline rapidly in the1970s as the majors closed five traditional stations forevery new self-service station converted or opened up.Today, the vast majority of service stations in Canada andthroughout North America are self-service.
The early 1980s recession and the increase in sales offuel-efficient cars resulted in a significant decline ingasoline consumption. It declined by 18 per cent between1980 and 1987. Not until 1999 did the volume of gasolinesold return to the 1981 level. The majors continued thedrive to rationalize their operations—they reduced thenumber of outlets by 10 per cent between 1985 and 1990.
Their share of retail outlets fell from 61 per cent in 1985to just less than 50 per cent in 1990, while their marketshare fell from 68 per cent to 54 per cent. The regionalsand independents, on the other hand, increased theiroutlets to 25 per cent and 18 per cent of the market,respectively. In some cases they achieved this by takingover stations closed by the majors.
The increase in the number of outlets enabled the independents to increase their market share by volumefrom 21 per cent in 1985 to 26 per cent in the early1990s. The average volume of gasoline sold at independ-ent outlets increased as well, although it still laggedbehind the average throughputs at outlets run by themajors. During this period, while the independents wereincreasing market share at the expense of the majors,they were also becoming relatively more inefficient. They were slower than the majors in upgrading theirfacilities, and their corporate planning does not appear to have taken into account the eventuality of lowermargins. The ability to delay efficiencies was strength-ened in the latter part of the 1980s by the return tohealthy retail margins. As might be expected when prof-itability increases, this paved the way for new entrantsinto the market, such as mass merchandisers sellinggasoline at their store locations.
In the 1990s, the drive for greater efficiency throughincreased throughputs continued. The majors recapturedthe market share that they lost in the 1985–93 period by rationalizing their outlets and making significantinvestments to improve the throughput at their remain-ing or new stations. This included the construction ofconvenience stores and car washes. They competedaggressively on the price side and, consequently, as aresult of the flexibility that their increased per outletsales volumes gave them, retail margins began to decline.The independents also began to rationalize their opera-tions and invest in convenience stores. However, mostindependents did not have the resources to construct $2 million super-stations along the lines of the majors’new offerings. The independents had, in many cases,waited too long before rationalizing, and many could not obtain the resources to upgrade or overcome thebarriers to entry and exit. As a result, their market share started to decline in the mid-1990s.
18 The Conference Board of Canada

The Relationship among Competitors
Many Canadian consumers have expressed concerns aboutthe relationship among Canadian oil companies. Theybelieve that uniform gasoline price increases might be aby-product of this relationship. It is, therefore, importantto examine the interaction that exists between the oilcompanies.
There is no evidence whatsoever that gasoline companies,whether they be major integrated refiner-marketers,regionals, or retailing independents, perceive their com-petitors as anything other than rivals for market share.That having been said, a strong degree of common inter-est exists among refiner-marketers, as it does amongindependents.
Refiner-marketers compete actively for market share.However, developments in the 1990s have brought aboutcircumstances in which there is co-operation in a numberof areas. Examples of this include gasoline swaps at theirrefineries, joint control of some product pipelines, as wellas joint public relations and lobbying efforts throughindustry associations.
Product swaps at refineries are a direct result of theclosure of refineries during the 1980s and early 1990sand the lack of refining representation of the major oilcompanies in all regions of the country. Basically, oilcompanies and regional refiners will arrange to receiveproduct supply at the refineries of their rivals in returnfor a similar amount of product to be delivered to theircompetitor at their own refineries. For example, Ultramarmay provide product to Petro-Canada at its St-Romualdrefinery to service Petro-Canada’s Quebec City stations. In return, Petro-Canada would provide a similar volume of product to Ultramar for its Montreal market at itsMontreal refinery. Companies would add their formulatedadditives to the product before delivery to their ownstations. Swap arrangements are advantageous to refiner-ies—they keep major companies competitive in regionswhere they do not have refining capacity and may benefitconsumers by minimizing transportation costs.
Major companies also co-operate in controlling productpipelines. In this instance, major companies are often
partners in the pipeline in return for guaranteed pipelineuse. These arrangements can be at the expense of inde-pendents who may be unable to use the pipelines or haveonly a low priority on their use. For example, Shell andPetro-Canada effectively control the product pipelinefrom Montreal to Ottawa. Independents in the Ottawamarket are then limited to buying from the majors or else trucking imported product in from Montreal.
Major oil companies as well as regional refiner-marketersrecognize that they have many common interests, partic-ularly when it comes to lobbying politicians and theCanadian public about their preoccupations. They haveformed industry associations that put forward theirconcerns and produce public relations information for the Canadian public. An example of this is the CanadianPetroleum Products Institute (CPPI). Joint lobbyingefforts are common in Canadian industry. Independentgasoline retailers have formed their own associations topublicize their concerns. Examples of this include theIndependent Retail Gasoline Marketers Association(IRGMA) as well as the Association Québécoise desIndépendants du Pétrole (AQUIP).
The relationship between major oil companies, regionalrefiners and independent retailers is complex. There isintense competition among these segments of the gaso-line industry and yet a dependency also exists. Whileindependents are clearly rivals, they are also very impor-tant customers, buying most of their product from themajor refineries or terminals. Major and regional refiner-marketers compete among themselves for the business ofthe independents, and traditionally the relationship hasbeen business-like and generally co-operative.
While the rapport is still positive, several new factors nowinfluence it. The closure of many refineries in the 1980sand early 1990s meant that much of the under-utilizedrefinery capacity in Canada dried up. This has meant thatthe independents are less able to negotiate prices now thanthey were 15 years ago. The publication of rack prices hasalso lessened the capacity of independents to play onesupplier off against another for greater discounts. Moreaggressive pricing policies by the majors and regionals havealso deprived many independents of the price differentialthat was a cornerstone of their business in the 1980s.
19 The Conference Board of Canada

Retail Margins
Retail margins for the cities examined in this report havegradually declined since the early 1990s. After peaking at slightly over 10 c.p.l. in the early 1990s during thePersian Gulf War, margins have averaged about 4–5 c.p.l.in the latter part of the decade (see Chart 4). Margins aretypically highest in the North, Quebec and AtlanticCanada and lowest in southern Ontario and Vancouverand somewhere between these two extremes in thePrairies and the rest of British Columbia. Margins differ from city to city and at different points in time,depending on local competitive conditions such as pricewars and changes in per outlet sales volumes. Greater
street-level competition in the industry is the main factorbehind the decline in retail margins.
Chart 5 reveals that since the mid-1990s, retail marginsin the United States have been slightly higher thanCanada’s. Since 1996, U.S. retail margins have remainedgenerally above 5 c.p.l. (all figures in Canadian dollars)and soared to almost 8 c.p.l. in the late winter of 1999and early spring of 2000. With a few exceptions,Canadian retail margins tracked at just below the U.S.level. As was the case in the United States, marginsrebounded in the early part of 2000 and briefly hitalmost 7 c.p.l. in April before falling back. In August2000, the average retail margin in Canada was 4.4 c.p.l.
20 The Conference Board of Canada
Chart 4Average Canadian Retail Margin(cents per litre)
Source: M.J. Ervin.
Jan.-91 Jul.-91 Jan.-92 Jul.-92 Jan.-93 Jul.-93 Jan.-94 Jul.-94 Jan.-95 Jul.-95 Jan.-96 Jul.-96 Jan.-97 Jul.-97 Jan.-98 Jul.-98 Jan.-99 Jul.-99 Jan.-00 Jul.-000
2
4
6
8
10
12
Chart 5Retail Margin Comparison: Canada vs. United States(cents per litre, Canadian)
Note: The Canadian average retail margin is based on monthly Ervin data for 10 cities—St. John’s, Charlottetown, Halifax, Saint John, Montreal, Toronto,Winnipeg, Regina, Calgary and Vancouver. The U.S. average retail margin is based on monthly Ervin data for five cities located close to Canadian mar-kets—Bangor, Maine; Plattsburgh, N.Y.; Buffalo, N.Y.; Minneapolis, Minnesota; and Seattle, Washington.Source: M.J. Ervin.
Jan.-96 Apr.-96 Jul.-96 Oct.-96 Jan.-97 Apr.-97 Jul.-97 Oct.-97 Jan.-98 Apr.-98 Jul.-98 Oct.-98 Jan.-99 Apr.-99 Jul.-99 Oct.-99 Jan.-00 Apr.-00 Jul.-003
4
5
6
7
8Canada United States

compared with 6.6 c.p.l. in the United States. A possibleexplanation for the lower margins in Canada may be thedifferent pricing market structure, as well as the greaterprevalence of price wars.
Retail Gasoline Prices
What Are the Major Components of Retail Gasoline Prices?
Retail gasoline prices consist of three major components:taxes, crude oil and a refining/marketing component. Thecomponents, including the refining and retail margin as ofNovember 2000, are shown in Chart 6. In this document,all references to gasoline prices are for regular unleadedgasoline sold at a self-serve outlet. Chart 7 demonstrateshow all price components are added up to give the finalretail price that consumers see when filling up their cars.
Taxes and crude oil make up 84 per cent of the averagepump price of a litre of gasoline. This leaves 16 per cent orjust under 12 c.p.l. within the influence of the Canadianpetroleum industry to cover refining, marketing and retail-ing fixed costs and operations. Only 6 per cent or just over4 c.p.l. were within the influence of gasoline retailers.
Tax
Taxes are the largest single element in the pump price ofgasoline in Canada, making up about 42 per cent of theprice on average. The taxes can be divided into three
components: federal excise tax, provincial consumptiontax and the Goods and Services Tax (GST) as well as theProvincial Sales Taxes (PST) where applicable.
When fuel taxation was first introduced, its primary purposewas to finance the costs of building transport infrastruc-tures. The federal government began supporting highwayconstruction as early as 1919. With the implementation ofthe Trans-Canada Highway Act of 1949, the federal govern-ment confirmed its commitment to national infrastructure.
21 The Conference Board of Canada
Chart 7Price Components of the Retail Price of Gasoline for November 2000(cents per litre)
Source: M.J. Ervin.
Edmonton Montreal St. John's0
102030405060708090
Crude oil
Refiner margin
Retail margin
Federal excise tax
Provincial excise tax
Transit tax
GST
PST
HST
Chart 6Price Components of a Litre of Gasoline(price components for the average retail price in November 2000)
Source: M.J. Ervin.
Taxes42%
Retail margin6%
Refining margin12%
Crude oil40%

A 1996 study by Statistics Canada placed total fuel taxesat about 3 c.p.l. in 1957. The Ontario government had a 0.75 c.p.l. (3.0 cents per gallon) tax on gasoline as early as 1925.
Federal excise tax on fuel was introduced in 1975 at 1.5 c.p.l. The initial purpose of the excise tax was tolower demand for gasoline following the 1970s oil crisis.The federal excise tax increased to 3.5 c.p.l. in 1986; 5.5 c.p.l. in 1987; 6.5 c.p.l. in 1988 and 7.5 c.p.l. in1989. In the early 1990s, the federal excise tax wasraised to 8.5 c.p.l. and in 1995 reached its current levelof 10.0 c.p.l. The federal excise tax is a flat tax and isimposed across Canada. This tax is added on to the otherprice components of gasoline (crude oil, refining marginand retail margin).
Provincial governments also charge a consumption tax on gasoline that varies from province to province. In 1971, the average provincial tax for the 10 provinceswas 4.4 c.p.l., with Newfoundland the highest at 5.9 c.p.l. and British Columbia the lowest at 3.0 c.p.l. By 1999, that average provincial tax had increased to 12.9 c.p.l. Newfoundland remained the highest at 16.5 c.p.l., while Yukon has the lowest consumptiontax at 6.2 c.p.l.
During the 1970s, the consumption tax in seven of theten provinces remained at the same level, the major
exception being Alberta. From 1978 to 1988, theGovernment of Alberta eliminated the provincial consump-tion tax completely. At the same time, British Columbiaand Newfoundland motorists saw a small increase.
During the 1980s and the early 1990s, the trend wastowards increasing provincial consumption taxes ongasoline. Saskatchewan was the exception; it abolishedthe tax from 1983 to 1988. Since the mid-1990s, provin-cial consumption taxes have remained at the same level.Like the federal excise tax, the provincial consumptiontax is a flat tax, but it varies among provinces (see Table 4). The provincial consumption tax is added on top of the other price components.
Since the introduction of the federal Goods and Services Taxin 1990, this value-added tax of 7 per cent has been addedto the cost of gasoline. The GST was originally introduced to replace the manufacturing taxes that had previously been levied on gasoline. These taxes were as high as 12.0 per cent in 1971 and as low as 0.5 c.p.l. in 1973. TheGST is levied on all components of the price of gasoline,including the federal excise tax and the provincial consump-tion tax. All Canadian provinces pay the GST, although forNew Brunswick, Nova Scotia and Newfoundland, it is part ofthe Harmonized Sales Tax (HST) of 15.0 per cent. The HST isapplied to the total cost of gasoline, including the federalexcise and provincial consumption taxes. Quebec is the onlyprovince in Canada to explicitly charge a Provincial Sales Tax
22 The Conference Board of Canada
Table 4Applied Taxes on Gasoline in 2000
Provinces Federal Excise Tax Provincial Consumption Tax GST PST HST(c.p.l.) (c.p.l.) (%) (%) (%)
British Columbia 10.0 11.0 7.0 0 0Alberta 10.0 9.0 7.0 0 0Saskatchewan 10.0 15.0 7.0 0 0Manitoba 10.0 11.5 7.0 0 0Ontario 10.0 14.7 7.0 0 0Quebec 10.0 15.2 7.0 7.5 0New Brunswick 10.0 10.7 0 0 15.0Nova Scotia 10.0 13.5 0 0 15.0Prince Edward Island 10.0 13.0 7.0 0 0Newfoundland 10.0 16.5 0 0 15.0Yukon 10.0 6.2 7.0 0 0Northwest Territories 10.0 10.7 7.0 0 0
Source: M.J. Ervin.
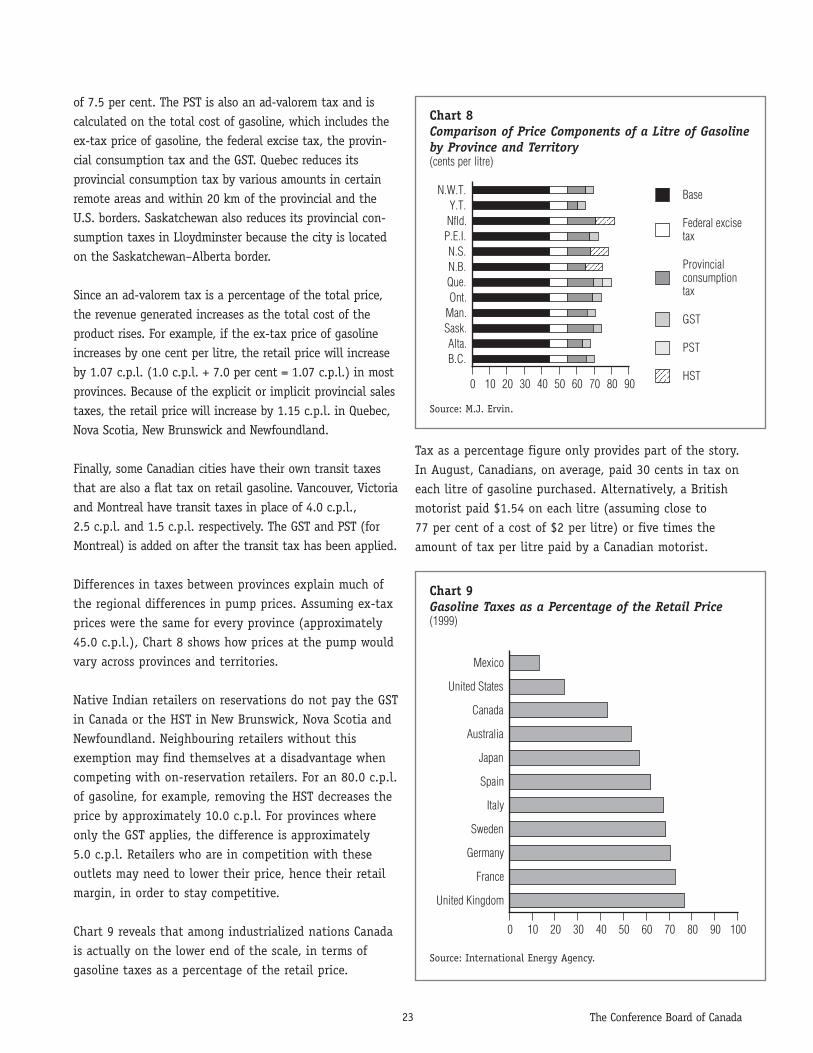
of 7.5 per cent. The PST is also an ad-valorem tax and iscalculated on the total cost of gasoline, which includes theex-tax price of gasoline, the federal excise tax, the provin-cial consumption tax and the GST. Quebec reduces itsprovincial consumption tax by various amounts in certainremote areas and within 20 km of the provincial and theU.S. borders. Saskatchewan also reduces its provincial con-sumption taxes in Lloydminster because the city is locatedon the Saskatchewan–Alberta border.
Since an ad-valorem tax is a percentage of the total price,the revenue generated increases as the total cost of theproduct rises. For example, if the ex-tax price of gasolineincreases by one cent per litre, the retail price will increaseby 1.07 c.p.l. (1.0 c.p.l. + 7.0 per cent = 1.07 c.p.l.) in mostprovinces. Because of the explicit or implicit provincial salestaxes, the retail price will increase by 1.15 c.p.l. in Quebec,Nova Scotia, New Brunswick and Newfoundland.
Finally, some Canadian cities have their own transit taxesthat are also a flat tax on retail gasoline. Vancouver, Victoriaand Montreal have transit taxes in place of 4.0 c.p.l., 2.5 c.p.l. and 1.5 c.p.l. respectively. The GST and PST (forMontreal) is added on after the transit tax has been applied.
Differences in taxes between provinces explain much ofthe regional differences in pump prices. Assuming ex-taxprices were the same for every province (approximately45.0 c.p.l.), Chart 8 shows how prices at the pump wouldvary across provinces and territories.
Native Indian retailers on reservations do not pay the GSTin Canada or the HST in New Brunswick, Nova Scotia andNewfoundland. Neighbouring retailers without thisexemption may find themselves at a disadvantage whencompeting with on-reservation retailers. For an 80.0 c.p.l.of gasoline, for example, removing the HST decreases theprice by approximately 10.0 c.p.l. For provinces whereonly the GST applies, the difference is approximately 5.0 c.p.l. Retailers who are in competition with theseoutlets may need to lower their price, hence their retailmargin, in order to stay competitive.
Chart 9 reveals that among industrialized nations Canadais actually on the lower end of the scale, in terms ofgasoline taxes as a percentage of the retail price.
Tax as a percentage figure only provides part of the story.In August, Canadians, on average, paid 30 cents in tax oneach litre of gasoline purchased. Alternatively, a Britishmotorist paid $1.54 on each litre (assuming close to 77 per cent of a cost of $2 per litre) or five times theamount of tax per litre paid by a Canadian motorist.
23 The Conference Board of Canada
Chart 8Comparison of Price Components of a Litre of Gasolineby Province and Territory(cents per litre)
Source: M.J. Ervin.
B.C.Alta.
Sask.Man.Ont.Que.N.B.N.S.
P.E.I.Nfld.Y.T.
N.W.T.
0 10 20 30 40 50 60 70 80 90
Base
Federal excisetax
Provincialconsumptiontax
GST
PST
HST
Chart 9Gasoline Taxes as a Percentage of the Retail Price(1999)
Source: International Energy Agency.
United Kingdom
France
Germany
Sweden
Italy
Spain
Japan
Australia
Canada
United States
Mexico
0 10 20 30 40 50 60 70 80 90 100

The monies generated by fuel taxes represent an impor-tant source of revenue for the federal and provincialgovernments. For 1996–97, the revenue from the federalexcise tax on gasoline was $4.02 billion. This number hassteadily risen as demand for gasoline continues toincrease. The provinces also have benefited from theprovincial consumption taxes. For 1996–97, the revenuegenerated by all provinces from the provincial consump-tion tax was $5.64 billion. Ontario is the province thatreceived the largest amount, approximately 44 per cent of the total amount ($2.49 billion). The GST, HST and the Quebec sales tax cannot be estimated because allrevenues from those taxes are aggregated.
When fuel consumption taxes were first introduced, theywere to be used to offset costs related to the mainte-nance and construction of highway infrastructure. Today,they represent an important source of government rev-enue. According to the Canadian Automobile AssociationNational Office, only about 4 per cent of the estimated $5 billion in fuel taxes collected by the federal govern-ment is invested back into highway infrastructure.
Crude
Crude oil is the base product used to refine gasoline. Itaccounted for close to a third of the retail price of a litre ofgasoline in 1999 before rising to over 40 per cent this year inline with the increase in crude oil prices. As mentioned earlier,the volatility in gasoline prices in the spring and summer of2000 was mainly caused by the dramatic fluctuations in the
price of crude oil. World crude prices have almost tripledsince 1998 and, given that the cost of crude makes up over40 per cent of the pump price, it should not be surprisingthat pump prices have increased significantly in Canada.
Refining/Marketing
The refining and marketing portion constitutes the finalcomponent of retail gasoline prices. This portion of theprice covers the cost of operations—such as the costs of refining the crude into gasoline, transportation anddistribution charges, as well as the marketing and opera-tional expenses at the retail level. This portion of theprice should also account for a reasonable return oninvestment for both the refiner and the retailer.
This is the only component of the final retail gasolineprice over which the gasoline industry has influence. InNovember 2000, when the average price for gasoline was75.9 c.p.l., this portion accounted for 11.9 c.p.l., or 16 per cent of the pump price of gasoline. The refiningmargin was 7.7 c.p.l. and the marketing margin was 4.2 c.p.l. As Chart 10 shows, the total refining/marketingmargins for Canada and the United States are similar.
How Are Prices Set?
On a broad scale, prices at the retail level are determinedby factors such as crude oil and transportation. If onewere to take an average retail price for unleaded gasolinefor the entire country, the price would follow changes in
24 The Conference Board of Canada
Chart 10Total Margin Comparison: Canada vs. United States(cents per litre, Canadian)
Sources: M.J. Ervin and U.S. Energy Information Administration.
Jan.-96 Apr.-96 Jul.-96 Oct.-96 Jan.-97 Apr.-97 Jul.-97 Oct.-97 Jan.-98 Apr.-98 Jul.-98 Oct.-98 Jan.-99 Apr.-99 Jul.-99 Oct.-99 Jan.-00 Apr.-00 Jul.-006
8
10
12
14
16
18Canada United States

the world price of crude oil very closely (see Chart 11).However, national and even regional prices hide thecomplex process that determines prices at the street levelacross Canada. Each market has different dynamics, andthis implies that prices are determined by local conditionsthat in some cases diverge from the rack price of gasoline.Also, the formulae and strategies for determining retailprices at the local level differ from region to region.
Another factor that makes the retail pricing of gasoline avery complex process has to do with the unique way inwhich prices are posted on large signs outside eachoutlet. No other commodity is subject to this much priceawareness. The display of prices in this fashion meansthat both consumers and competitors are informed almostinstantly of price changes within their region. Outletsmust keep a careful eye on what the competition is doingbecause demand could decline significantly if their ownprices are out of line with competitors within a wideradius. Prices can therefore change three to four times aday during periods of high price volatility.
Majors and Regionals
Most of the majors and regional refiner-marketers employ a set of tactics to ensure that each of their retail outletsremains competitive within their local markets. The followingsteps are generally taken before initiating a price change:• Each outlet identifies the key competitors within a
particular market (usually two or three) and then price
relationships are established with respect to these keycompetitors. The relationship depends on the character-istics of the key competitors. For instance, at a sitewhere a full-service major is competing with a similaroutlet, the pricing tactic would be to entirely matchprice reductions initiated by the competitor. If, however,a full-service major is competing with a branded
25 The Conference Board of Canada
Chart 11Average Retail Price and Average Crude Oil Price in Canada(cents per litre)
Sources: M.J. Ervin.
Jan.-9
1Apr.-9
1Jul.-9
1Oct.-
91Jan
.-92
Apr.-92Jul.-9
2Oct.-
92Jan
.-93
Apr.-93Jul.-9
3Oct.-
93Jan
.-94
Apr.-94Jul.-9
4Oct.-
94Jan
.-95
Apr.-95Jul.-9
5Oct.-
95Jan
.-96
Apr.-96Jul.-9
6Oct.-
96Jan
.-97
Apr.-97Jul.-9
7Oct.-
97Jan
.-98
Apr.-98Jul.-9
8Oct.-
98Jan
.-99
Apr.-99Jul.-9
9Oct.-
99Jan
.-00
Apr.-00Jul.-0
005
1015202530354045
Crude oil Retail (ex-tax)
Exhibit 9Price Volatility and Uniformity
Price volatility refers to the frequency of changing gasoline prices. Priceuniformity refers to Canadian motorists’ observations that posted gasolineprices within particular areas are identical or similar among all gasoline outlets.
Changing gasoline prices can be partly attributed to the frequent changes inthe price of crude oil, which is the primary input in gasoline. While it takesup to a month for crude prices to be passed on to motorists, the frequentchanges in world oil prices are a factor in fluctuating gasoline prices. Theother important factor is the highly competitive nature of the gasolineindustry at the street level.
Gasoline is the only commodity in our society for which the price is postedon large signs that can be read at 60 kilometres an hour. Both motorists andother service station operators become aware almost immediately of pricechanges among their competitors.
Canadian motorists are perceived as being very sensitive to gasoline prices,and this is borne out by their behaviour in the marketplace. Canadians willchange stations for price differences of fractions of a penny, even though theimpact of the price differences may only amount to five or ten cents on anaverage fill-up. Retailers, aware of this price consciousness among con-sumers, are concerned about losing sales and therefore reduce their pricesalmost immediately to match those of their competitors. This results infrequent price changes and accounts for the uniformity of gasoline priceswithin an area in which outlets are competing.
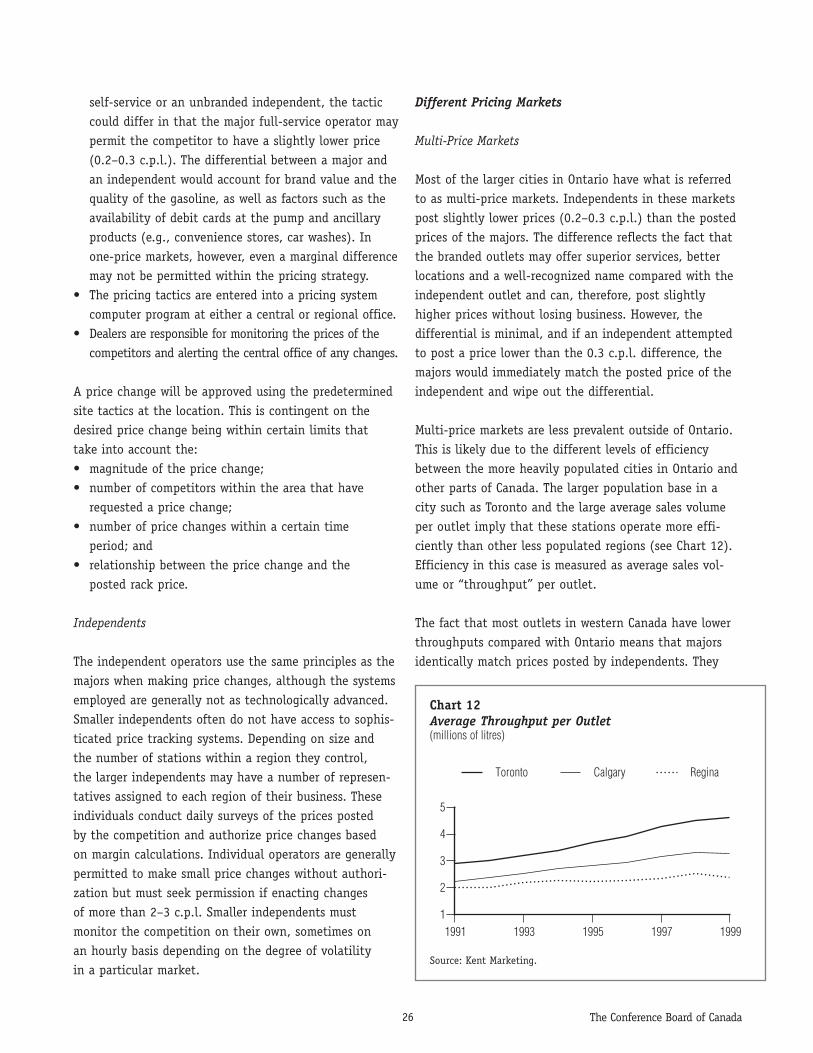
self-service or an unbranded independent, the tacticcould differ in that the major full-service operator maypermit the competitor to have a slightly lower price(0.2–0.3 c.p.l.). The differential between a major andan independent would account for brand value and thequality of the gasoline, as well as factors such as theavailability of debit cards at the pump and ancillaryproducts (e.g., convenience stores, car washes). Inone-price markets, however, even a marginal differencemay not be permitted within the pricing strategy.
• The pricing tactics are entered into a pricing systemcomputer program at either a central or regional office.
• Dealers are responsible for monitoring the prices of thecompetitors and alerting the central office of any changes.
A price change will be approved using the predeterminedsite tactics at the location. This is contingent on thedesired price change being within certain limits that take into account the:• magnitude of the price change;• number of competitors within the area that have
requested a price change;• number of price changes within a certain time
period; and• relationship between the price change and the
posted rack price.
Independents
The independent operators use the same principles as themajors when making price changes, although the systemsemployed are generally not as technologically advanced.Smaller independents often do not have access to sophis-ticated price tracking systems. Depending on size and the number of stations within a region they control, the larger independents may have a number of represen-tatives assigned to each region of their business. Theseindividuals conduct daily surveys of the prices posted by the competition and authorize price changes based on margin calculations. Individual operators are generallypermitted to make small price changes without authori-zation but must seek permission if enacting changes of more than 2–3 c.p.l. Smaller independents must monitor the competition on their own, sometimes on an hourly basis depending on the degree of volatility in a particular market.
Different Pricing Markets
Multi-Price Markets
Most of the larger cities in Ontario have what is referredto as multi-price markets. Independents in these marketspost slightly lower prices (0.2–0.3 c.p.l.) than the postedprices of the majors. The difference reflects the fact thatthe branded outlets may offer superior services, betterlocations and a well-recognized name compared with theindependent outlet and can, therefore, post slightlyhigher prices without losing business. However, thedifferential is minimal, and if an independent attemptedto post a price lower than the 0.3 c.p.l. difference, themajors would immediately match the posted price of theindependent and wipe out the differential.
Multi-price markets are less prevalent outside of Ontario.This is likely due to the different levels of efficiencybetween the more heavily populated cities in Ontario andother parts of Canada. The larger population base in acity such as Toronto and the large average sales volumeper outlet imply that these stations operate more effi-ciently than other less populated regions (see Chart 12).Efficiency in this case is measured as average sales vol-ume or “throughput” per outlet.
The fact that most outlets in western Canada have lowerthroughputs compared with Ontario means that majorsidentically match prices posted by independents. They
26 The Conference Board of Canada
Chart 12Average Throughput per Outlet(millions of litres)
Source: Kent Marketing.
1991 1993 1995 1997 19991
2
3
4
5
Toronto Calgary Regina

simply cannot afford to allow their competition to have alower price for fear of losing an important part of theirrelatively smaller sales volumes.
The United States, however, is a multi-price market thatplaces greater emphasis on product differentiation. It is notunusual to have four outlets on a corner posting differentprices for their products. One outlet might have a muchlower price for regular unleaded gasoline, while anothercould have super gasoline posted at a less expensive price.Also, an outlet with a prime location can post a higherprice than the competition without losing market share.
Single-Price Markets and Zone Pricing
Most Canadian markets outside Ontario are now single-price markets—the result of price wars and aggressivecompetition. This means that a single price will becharged within a market regardless of type of service,ancillary services, or whether a dealer is a major or anindependent. Full-service stations charge the same priceper litre as self-service. With split stations, i.e., thoseoffering both full and self-service, a premium may bepaid for service. An example of a single-price market isfound in many Quebec markets. There, the dominantregional refiner/marketer, Ultramar, announced itsValuePlus program, whereby it promises to match anyprice within the relevant zone. This has rendered inde-pendents unable to differentiate themselves from com-petitors through lower prices. Differentiation may nowtake the form of discount coupons, rebates or giveaways.This type of pricing has become more common through-out Canada. Regional pricing characteristics are discussedlater in the study when individual cities are considered.
A further variation on the single-price market is zonepricing—that is, single pricing among all retailers withina particular region. The size of the zone can vary bymarket—a large city may contain 50 zones, a smaller cityand its outskirts may be considered a single zone. Thesize of the zone is determined by each company individu-ally and is based on market composition and competitiveconditions within the area.
Many independents believe that zone pricing, like single-price markets, is detrimental to their competitiveness as
it discourages the use of efficiencies to differentiateservice by price. Any price reduction that a retailer canpass on to consumers to increase his/her market sharewill almost immediately be met with a similar pricereduction by other dealers in the zone. Branded dealers,it is argued, can meet these prices because supports are available through their supply branches to ensuretheir competitiveness.
Within a zone, it is also asserted, branded dealers mayattempt to increase their market share by aggressivelyreporting changes and attempting to maintain the lowestprice possible. Under zone pricing, they are alleged to be able to maintain lower prices because their supplierwould reduce their wholesale price, which effectivelyprotects their margin. This would be detrimental toindependent retailers, who may have no such supportsystem and who would see their margin cut.
In theory, single-price markets and zone pricing benefitconsumers by forcing all retailers to adopt the price ofthe most efficient operator. Reality, however, may bedifferent. If a retailer is reluctant to lower prices to passon savings to consumers as there is no sales advantage todoing so, prices will not be reduced to their lowest levels.
When a zone price is also extended beyond an urban area,the practice may pose a major disadvantage to unbrandedindependent dealers who may not enjoy the high through-put of urban competitors. While the lower margin may besustainable based on high volumes, the rural dealer doesnot enjoy this situation. Again, branded dealers may enjoysome protection through their suppliers, but this wouldnot extend to most independent retailers.
Price Increases
The decision to increase prices is monitored very closely bythe majors and regional refiner-marketers. The attempt toraise prices will be initiated by one of these players ratherthan an independent. Within the industry, a price increase isdescribed as a “price restoration.” This term implies thatprices and retail margins are considered too low and thatcorrective action is required to bring margins to levels thatare more acceptable to the industry. The following factors areconsidered before attempting to undertake a price increase:
27 The Conference Board of Canada

• Price differentials—The differential between theaverage pump price and the rack price. The margin ofthis difference enables the operator to make a profit.
• Customer perceptions—If a major were viewed asalways leading price increases in a market, customersmay conclude that prices are higher at these locations.This could result in a long-term loss of business andcustomer loyalty.
• The response of competitors—An increase that isnot matched by the competition will ultimately lead toa price rollback. Competitors may decide to leave theirprices unchanged depending on the cost of their in-ground inventory. If, for instance, a dealer at an outlethas on hand a large inventory purchased at a veryattractive rack price, the dealer could decide to notmatch the price initiated by the major in the hope of gaining market share. A successful price increase,therefore, depends on a thorough knowledge of thebehaviour and likely reaction of competitors in thelocal market. The process is by nature very judgemental.
The independents do not lead a price restoration sincethey are generally price followers. Even some of the largerretailers in the country avoid initiating price increasesbecause this would be at odds with their policy objectivesor the way that they want to be perceived by the public.For instance, Ultramar’s ValuePlus policy of matching thelowest pump price in the defined zone ensures that theiroutlets never initiate a price increase.
If retail margins are considered low in a market, theattempt to restore them to higher levels generally occursonce a week, although market conditions may sometimes
dictate that two weekly restorations may be justified. The timing of an increase is also critical. The majors orregionals will generally attempt to restore the price in alocal market around noontime, usually in the early partor middle of the week when average sales are lowest.They will then wait to see how their competitors react.By 3:30 p.m., a decision must be made as to the successor failure of the increase. If the restoration is not work-ing, the price must be reduced quickly to ensure that theposted price is not higher than that of the competitionbefore the rush hour starts at 5:00 p.m.
What Happens During a Price War?
While consumers are concerned about many of the char-acteristics of retail gasoline pricing, one that they do notobject to is the price wars that occur in different parts of the country from time to time. Price wars are a directresult of the intense competition that exists in the localarea and the habit of posting prices on signs at eachretail outlet. Wars develop when competitors continue to undercut each other and force the retail margin to besqueezed to the point where the reduced price is some-times insufficient to cover operating costs. Major, regionalor independent outlets can initiate price wars.
Price wars generally end when retail margins decline tothe point where it is no longer economically viable forthe majority of the competitors in the local market. Anoperator finally makes the difficult decision to be thefirst to raise prices and then hopes that the competitionfollows suit. Usually, competitors will match the increaseas long as it leads back to a retail margin that is in line
28 The Conference Board of Canada
Exhibit 10Price Restorations
Every week or two Canadians see gasoline prices change suddenly in their cities. These price increases are known in the industry as “price restorations” and they occur when retail margins fall below the levels that are felt necessary to provide a reasonable rate of return for service station operators.
The Canadian retail market is highly competitive and dealers are concerned about losing market share when their posted pump prices are higher than those of their competitors.
In order to minimize the risk of losing market share, a retailer will attempt to increase prices during a day of the week with low sales volumes, generally in earlymid-week following the morning rush hour. The dealer will be authorized to raise his/her price and then monitor the competitors’ reactions. If all competitors followthe price increase at their own stations, the increase will remain in place. If some dealers refuse to raise prices or raise prices by a lower amount, the price increasewill be abandoned or adjusted generally before the evening rush hour.
Price restorations are almost always led by majors or regional refiners.

with the cost of doing business. Consumers frequentlyview the uniform increase in retail prices that occurs atthe end of a price war as evidence of collusion. It isunlikely that this is the case since the uniform priceincrease generally reflects the fact that the participantsinvolved in the price war must restore their margins orrisk going out of business.
Sometimes attempts to regain a desired margin do notwork and a protracted price war can continue for a rela-tively long period of time. This was the situation inVancouver, which has experienced a price war since 1998.Up to the end of 1999, prices in this city were lower thanthey were in the mid-1990s and much lower than in mostother Canadian markets. The price war was a direct resultof increased competition from two new market entrants—an American regional refiner who operated within easyrange of the lower mainland market, and a big box opera-tor. Both reduced prices significantly in order to gainmarket share. Competitors were forced to match the lowerprices in order to retain their customer base. The lengthof the price war forced some independents to leave themarket and forced those remaining to exist on negativemargins or restorations that have rarely brought themargin to 2 c.p.l. All retail participants in the lowermainland market likely have incurred financial losses.Refiner-marketers probably have had to subsidize thelosses of their dealerships during this period.
An earlier series of price wars was undertaken in westernCanada in the early 1990s. Major oil companies saw theirmarket share eroded by independents all through the1980s as majors had not responded to independents’ lowerprices. Faced with large retail losses due to lost marketshare, the majors aggressively fought to win back theircustomers by undercutting the independents’ prices.
While price wars benefit motorists in the city affected bythe disruption, consumers in other cities may pay the price.Anecdotal evidence was given that oil companies couldincrease prices in cities or regions with less competition tomake up for the loss of revenue in the city affected by theprice war. It is impossible, however, to prove this claim.
Price wars are likely to continue to be an ongoing charac-teristic of the gasoline industry. In fact, the proliferation
of convenience stores and other ancillary sources ofincome at retail outlets implies that the number andduration of price wars could actually increase. Revenuefrom a convenience store, for instance, means that opera-tors can squeeze retail margins on gasoline even lower inthe midst of a price war and still remain in business.
Empirical Analysis of Retail Prices
Some of the special characteristics of retail gasolinepricing were confirmed by the empirical analysis that wasconducted on 11 cities across the country (see Appendix B).The most important component of the pump price is, notsurprisingly, the wholesale price of gasoline in a particu-lar city. However, an increase of one cent per litre in thewholesale price does not automatically lead to an identi-cal increase in the retail price of gasoline. Local marketconditions have an important impact.
The empirical analysis indicated that for any particularmarket over a given period of time, a market outcomemargin exists that becomes the basis for pricing in thatmarket. This market outcome margin is not an absolutefigure—it simply reflects local competitive conditions atthat time. If, for instance, a dealer is operating with amargin that is below that of the market outcome, a one-cent increase in wholesale prices could result in a retailprice increase greater than one cent. In this situation,the dealer attempts to restore a margin that enables amore reasonable rate of return. Conversely, the wholesaleprice would not be completely reflected in the retail priceif the dealer were operating with a margin above that ofthe market outcome.
Retail prices and margins differ from city to city acrossthe country in large part because of different averagesales volumes per outlet and taxes. Since most operatingcosts for a gasoline station are fixed, a dealer in a citywith a high average throughput does not require as higha margin as a dealer in a city with relatively low averageper outlet sales. In the latter case, the operator requiresa higher margin to compensate for the fact that theoutlet is selling a far lower volume.
The other factor that leads to different prices in differentparts of the country is population density per outlet. In a
29 The Conference Board of Canada

city with a higher population density, consumers arelikely to make more trips to outlets to purchase not onlygasoline but other ancillary goods and services comparedwith cities with lower population densities. Consequently,cities with higher population densities per outlet shouldhave lower retail margins and prices.
Not surprisingly, average income was not an importantfactor in explaining retail prices. This suggests thatgasoline is a product that consumers purchase irrespec-tive of income, in accordance with their requirements. In addition, the absolute number of retail outlets doesnot appear to affect pump prices if there is a minimumnumber of competitors in the market. In cities whereonly a few companies dominate the market, prices are not necessarily higher compared with cities that have many companies, including majors, regionals and
independents selling gasoline. This suggests that theretail gasoline market is one where a single player or new entrant can have a significant influence even if themarket is highly concentrated. This was certainly thesituation in Vancouver, where the dominant player in themarket was forced to significantly reduce prices because arelatively small player entered the market and attemptedto gain market share by starting a price war.
Stakeholder Concerns
Volatility
While consumers clearly benefit from the lower pumpprices that result from a price war, they become annoyedand frustrated with the frequency and size of gasolineprice changes. It is not unusual in some local markets to
30 The Conference Board of Canada
Exhibit 11Market Outcome Margin
The market outcome margin is an analytical tool developed by The Conference Board of Canada. It helps us to understand why retail prices change and the variationin the magnitude of those changes. The market outcome margin reflects the local market conditions that gasoline retailers take into account when adjusting theirprice to a change in their cost of gasoline. This tool helps to explain why gasoline price increases are greater than the change in costs when retail margins are low,and lower when retail margins are high. The opposite is true for cost decreases.
The market outcome margin is NOT a result of collusion, but reflects the local street level competitive conditions in a certain market. The retail margin in a specificmarket tends to revolve around the market outcome margin. This margin is not always a sustainable equilibrium because it may reflect the occurrence of a price war.For example, a price war took place in Vancouver in 1999, during which the market outcome margin was approximately minus two cents per litre (-2.0 c.p.l.). Thismeans that service stations were selling their gasoline below their actual cost. This is clearly not a situation in which retailers can remain in business.
The Conference Board of Canada calculated the market outcome margin by fitting a trend line through the observed margins in each city. Where structural breaks inthe observed margins occur, a second trend is calculated.
The market outcome margin for Ottawa is shown in the chart. Starting in the early 1990s, the market outcome margin declined from approximately 10 c.p.l. to 4 c.p.l. Since 1996, it appears to be constant at about 4 c.p.l., although volatility remains around the market outcome margin. This volatility reflects the localcompetitive environment, as businesses try to capture market share from price-sensitive motorists.
According to our market outcome margin, if the actual margin is more than 4 c.p.l., a one-cent increase in costs would result in an increase at the pump of lessthan one cent due to street-level competition. If the competitive market in Ottawa were operating below 4 c.p.l., then the increase at the pump would be greater thanone cent as retailers try to re-establish the market outcome margin.
Jan.-91 Jul.-91 Jan.-92 Jul.-92 Jan.-93 Jul.-93 Jan.-94 Jul.-94 Jan.-95 Jul.-95 Jan.-96 Jul.-96 Jan.-97 Jul.-97 Jan.-98 Jul.-98 Jan.-99 Jul.-99 Jan.-00 Jul.-000
2
4
6
8
10
12
14 Actual Target
Std. deviation=1.19 Std. deviation=1.05

see prices drop by 5–6 c.p.l. only to shoot up by thesame amount on the following day. Chart 13 illustratesthis phenomenon during the Vancouver price war, inwhich retail prices moved up and down by as much as 10 c.p.l. from day to day.
The habit of posting prices on signs outside each outletpromotes volatility. Competitors must react rapidly toprice reductions in order to retain their customer baseand market share. While volatility has always been acharacteristic of the gasoline market, it has intensifiedthroughout the 1990s, although for eight of the citiesstudied there was less volatility in the late part of the1990s than in the earlier part. Some of the factorsexplaining the increase in price volatility include:• Crude oil price volatility—In the past year, world
crude oil markets have been far more volatile due toOPEC’s decision to cut back on production. Volatility incrude prices naturally affects the retail market, giventhat crude comprises over 40 per cent of the pumpprice of gasoline.
• Technology—Before the widespread use of computers,a company-owned outlet had to call the head office toget a price change approved by a manager. Withoutcomputers, this process could take a considerableamount of time in order to make the necessary calcu-lations and approve the price change. In the 1990s,technological advancement enabled an operator toquickly obtain approval to implement a price change.As a result, it is possible for operators to initiate a
number of price changes in a single day depending onlocal market conditions. This naturally increases volatility.
• Compensation by sales volume—Increased volatility on weekends is sometimes the result of the relationshipsthat some oil companies have with their operators. Someretailers are compensated according to the volume ofgasoline sold at their outlets either through commissionarrangements or through guaranteed margins. On week-ends, when the head office of smaller companies may beclosed and operators do not have to seek approval for aprice change, there is an incentive to start a price war.In this situation, it would be difficult to determine whoactually starts the war. Therefore, the operator has anincentive to “cheat” by lowering the price withoutapproval from the head office since there is little chanceof being caught, and the payoff in terms of higherthroughput and more revenue could be significant.
Volatility will continue to be an important characteristicof retail gasoline pricing. Price volatility does not seemto be the result of collusion on the part of industry. It is an indication of a high degree of competition at thestreet level. As such, it reflects the unique environmentwithin which the industry operates. Price volatility couldbe eliminated if other provinces were to follow the leadof Prince Edward Island and regulate the price of gaso-line. However, the evidence does not indicate that con-sumers are better served by having a regulated market.Ex-tax retail prices in Prince Edward Island are not lowerand for some extended periods of time have even been
31 The Conference Board of Canada
Chart 13Daily Retail Prices for Vancouver (Ex-tax)(cents per litre)
Sources: IRGMA.
1/1/982/6/98
3/14/984/19/98
5/25/986/30/98
8/5/989/10/98
10/16/98
11/21/98
12/27/982/1/99
3/9/994/14/99
5/20/996/25/99
7/31/999/5/99
10/11/99
11/16/99
12/22/990
5
10
15
20
25
30
35

higher than in other parts of the country and theCanadian average (see Chart 14).
Cross-Subsidization
Some of the independents believe that they are at a competi-tive disadvantage vis-à-vis the major and regional refiner-marketers because the majors could use the upstream andrefining portion of their operations to cross-subsidize theirretail businesses. The contention is that present economicconditions enable the majors to earn large profits in theirupstream business with world crude oil prices above the Can. $44 (U.S. $30) a barrel level. This provides them withinternal funds to finance station upgrades. More importantly,independents contend that the majors then have the availablerevenue from the upstream business to squeeze margins at theretail level, increase the throughputs of their own stations andput independent operators at a serious disadvantage.
The majors contend that cross-subsidization does notoccur in their business since the three portions of theirbusiness—exploration and production, refining and retail-ing—are all required to earn a positive rate of return andare given return targets in line with investor expectations.They also point out that most of the refineries purchasemuch of their crude oil at world prices from other Canadianor international sources. They argue that revenue does not flow from one part of the business to another duringperiods when a part of the overall business is in trouble.They also point out that in 1998 crude prices fell toalmost Can. $14 (U.S. $10) a barrel and that the upstreampart of the business did not perform up to expectations.Given the manner in which majors provide their financialreporting, it is impossible to confirm whether charges ofcross-subsidization have merit.
The empirical analysis (see Appendix B) did not findsignificant evidence of cross-subsidization betweenupstream and retail margins or refining and retail mar-gins. The results were consistent with cross-subsidization,but they were statistically insignificant or of a low orderof magnitude. However, aggregate data could sometimesmask activities taking place at the local market level.Independent operators contend that during a price war,majors simply reduce the wholesale price temporarily toenable their dealers to earn a positive margin. Some of
the majors and regional refiners do provide price supportfor dealers involved in a protracted price war, althoughthey contend that this is a relatively rare occurrence.
There is no doubt that using a price support mechanismwould provide branded dealers with an advantage overmany of the independents. Independents must purchaseproduct from the terminal at posted rack prices or withminimal discounts and are, therefore, not in a position toprovide financial relief for any of their dealers who areinvolved in a protracted price war. The price paid bydealers associated with refiner-marketers is less clear, asgasoline is often on consignment from the refiner or isdirectly owned by the refiner up to the point of sale andis thus not associated with a transparent rack price.
32 The Conference Board of Canada
Chart 14Charlottetown and Average Canadian Retail Price (Ex-tax)(cents per litre)
Source: M.J. Ervin.
Jan.-9
1Jan
.-92
Jan.-9
3Jan
.-94
Jan.-9
5Jan
.-96
Jan.-9
7Jan
.-98
Jan.-9
9Jan
.-00
05
101520253035404550
Charlottetown Canada
Exhibit 12Do Prices Increase Before Long Weekends?
The empirical work revealed that gasoline prices do not necessarily increaseprior to long weekends in the summer, as many Canadians perceive (seeAppendix B). While it is true that prices do sometimes shoot up before longweekends, they are just as likely to increase prior to any other weekendthroughout the year. The fact is that dealers attempt to increase prices in themiddle of the week in order to earn a higher margin. If the restoration doesnot succeed, prices tend to drift down on Friday and the weekend. Thiscould happen in any season, not just the summer. However, it is more likelyto happen in the summer because demand is higher and inventories arelower compared with the winter months. Increases before long weekendsmay more likely be accepted by competitors in anticipation of the higherholiday demand, but this cannot be proven empirically.
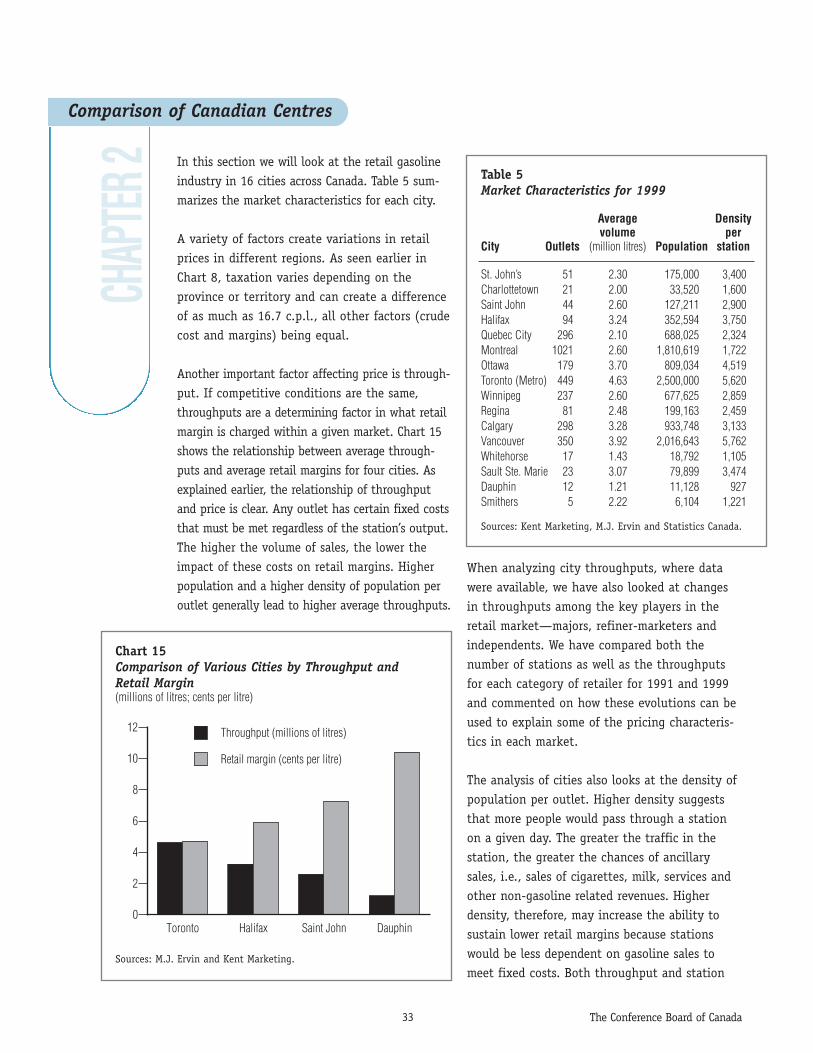
33 The Conference Board of Canada
In this section we will look at the retail gasolineindustry in 16 cities across Canada. Table 5 sum-marizes the market characteristics for each city.
A variety of factors create variations in retailprices in different regions. As seen earlier inChart 8, taxation varies depending on theprovince or territory and can create a differenceof as much as 16.7 c.p.l., all other factors (crudecost and margins) being equal.
Another important factor affecting price is through-put. If competitive conditions are the same,throughputs are a determining factor in what retailmargin is charged within a given market. Chart 15shows the relationship between average through-puts and average retail margins for four cities. Asexplained earlier, the relationship of throughputand price is clear. Any outlet has certain fixed coststhat must be met regardless of the station’s output.The higher the volume of sales, the lower theimpact of these costs on retail margins. Higherpopulation and a higher density of population peroutlet generally lead to higher average throughputs.
When analyzing city throughputs, where datawere available, we have also looked at changesin throughputs among the key players in theretail market—majors, refiner-marketers andindependents. We have compared both thenumber of stations as well as the throughputsfor each category of retailer for 1991 and 1999and commented on how these evolutions can beused to explain some of the pricing characteris-tics in each market.
The analysis of cities also looks at the density ofpopulation per outlet. Higher density suggeststhat more people would pass through a stationon a given day. The greater the traffic in thestation, the greater the chances of ancillarysales, i.e., sales of cigarettes, milk, services andother non-gasoline related revenues. Higherdensity, therefore, may increase the ability tosustain lower retail margins because stationswould be less dependent on gasoline sales tomeet fixed costs. Both throughput and station
Comparison of Canadian CentresCH
APTE
R 2
Chart 15Comparison of Various Cities by Throughput andRetail Margin(millions of litres; cents per litre)
Sources: M.J. Ervin and Kent Marketing.
Toronto Halifax Saint John Dauphin0
2
4
6
8
10
12 Throughput (millions of litres)
Retail margin (cents per litre)
Table 5Market Characteristics for 1999
Average Densityvolume per
City Outlets (million litres) Population station
St. John’s 51 2.30 175,000 3,400Charlottetown 21 2.00 33,520 1,600Saint John 44 2.60 127,211 2,900Halifax 94 3.24 352,594 3,750Quebec City 296 2.10 688,025 2,324Montreal 1021 2.60 1,810,619 1,722Ottawa 179 3.70 809,034 4,519Toronto (Metro) 449 4.63 2,500,000 5,620Winnipeg 237 2.60 677,625 2,859Regina 81 2.48 199,163 2,459Calgary 298 3.28 933,748 3,133Vancouver 350 3.92 2,016,643 5,762Whitehorse 17 1.43 18,792 1,105Sault Ste. Marie 23 3.07 79,899 3,474Dauphin 12 1.21 11,128 927Smithers 5 2.22 6,104 1,221
Sources: Kent Marketing, M.J. Ervin and Statistics Canada.

density have been shown to be statistically significant ininfluencing retail margins in our empirical analysis (seeAppendix B).
The competitive conditions in each market accentuate thedifferences between cities. Quebec City, for example, haslow throughputs as well as low margins. These may beaffected by a number of factors, such as the aggressivepricing activities of independents, regional competitivepolicies such as low price guarantees, zone pricing poli-cies and the competitive history of the markets (e.g.,sustained price wars). The availability of import optionsand proximity of competing markets may also bring aboutdifferences.
Chart 16 shows the volumes and margins for several citieswhere competitive conditions are a predominant factor indetermining retail margins.
St. John’s, Newfoundland
St. John’s is the largest centre in Newfoundland andLabrador, with a population of 175,000 (1999 estimate).In 1999, it had 56 service stations, five of which closedduring the year, for a density of about one station per3,400 people. This compares with 70 stations in 1991, a reduction of 27 per cent. Newfoundland, including
Labrador, represents one of the smallest markets inCanada. In terms of gasoline sales, it makes up just 2 per cent of the national market.
Of the 51 remaining stations, 20 are majors (down from23 in 1991) and 26 are regional refiners (down from 37).While there are only five independent outlets (down from10), they account for an important 19 per cent of gaso-line sales by volume.
In 1999, the average sales volume per station for St. John’s was 2.3 million litres per year, well below the Canadian average of 3.2 million and about 6 per cent lower than the Atlantic average of 2.41 million. This compares with a 1.8 million-litre average in 1991, an increase of 28 per cent. The average throughput for majors was just under 2.4 million litres (up from 2.1 million in 1991); for regional refiners it was 1.8 million (up from 1.6 million) and for independents it was almost 4.7 million litres(compared with 1.5 million in 1991). This is explained bythe big box nature of three of the independent outletsand their high average throughput. The regional refiners’share of the market decreased from 48.5 per cent in 1991to 41.7 per cent in 1999.
The majority of gasoline in St. John’s comes from the Irving Refinery at Saint John, New Brunswick, the Imperial Refinery at Dartmouth, Nova Scotia, or from imported European product. Product is shipped to St. John’s by bulk carriers and stored in terminals or bulk plants before being transported to the retailer by tankwagons. The North Atlantic refinery at Come By Chance limits its production to its own brandedstations (none of which were located in St. John’s in1999) and to exports of reformulated gasoline (RFG) to U.S. markets.
The wholesale price of gasoline in St. John’s has a highcorrelation to the New York harbour price and is notprimarily influenced by the supply and demand character-istics of the St. John’s wholesale market.
St. John’s has some of the highest retail gasoline pricesin Canada, which is partly due to a higher tax compo-nent. Taxes in St. John’s represented over 43 per cent of
34 The Conference Board of Canada
Chart 16Comparison of Various Cities by Throughput andRetail Margin(millions of litres; cents per litre)
Sources: M.J. Ervin and Kent Marketing.
Toronto Ottawa Quebec City Winnipeg0
1
2
3
4
5
6
7
8 Throughput (millions of litres)
Retail margin (cents per litre)

the pump price (38 c.p.l.) in November 2000. For thefour-week average to November 14, 2000, the ex-tax pricein St. John’s was 5.3 c.p.l. higher than the Canadianaverage and higher than prices in Saint John, NewBrunswick, Charlottetown and Halifax. Higher prices inSt. John’s reflect the low volumes per outlet, the city’srelative isolation from other competitive markets as wellas high transportation costs.
Retail margins in St. John’s are above average. While theydecreased at the beginning of the 1990s as a result ofindustry rationalization and increased efficiency, theyhave averaged just over 6.0 c.p.l. for the period from
January 1993 to January 2000. St. John’s has experiencedseveral periods of low margins, particularly in mid-1996and mid-1999, but generally does not benefit from pricewars or aggressive pricing policies. Margins have hoveredabove the Canadian average. Again, this is consistentwith low throughputs.
Charlottetown, Prince Edward Island
Charlottetown has an estimated population of 33,520(1999 estimate). In 1999, it had 22 service stations, oneof which closed during the year, for a density of aboutone station per 1,600 people. This represents a reductionin the number of stations of 19 per cent since 1988, when26 outlets existed. This reduction took place entirelyamong stations owned by major refiner-marketers.
Of the 21 remaining stations, 9 are majors and 12 are regionals. There are no independent outlets in Charlottetown.
The average throughput for Charlottetown was 2.0 millionlitres per year for 1999, well below the Canadian average of3.2 million and the Atlantic region’s average of 2.41 mil-lion. In 1991, the average sales volume was 1.7 millionlitres. This low throughput reflects the low density ofpopulation per outlet. Compared to other Canadian centres,Charlottetown may be over-served with retail outlets. In1999 the average throughput for majors was approximately3.0 million litres (up from 1.8 million litres in 1991) andthe regional refiners’ was 1.4 million litres (down from 1.6 million and consistent with the lack of rationaliza-tion). Majors, through their rationalization and increasedthroughputs, have increased their market share (by vol-ume) from 47.4 per cent in 1991 to 60.4 per cent in 1999.
Charlottetown has traditionally received its gasoline bymarine tanker—usually from Halifax, but also from SaintJohn, Quebec City or Montreal.
Taxes in Prince Edward Island are somewhat lower than inother regions of the Maritimes. In November 2000, taxesconstituted 28 c.p.l. or 37 per cent of the average retailprice of 76.4 cents for a litre of gasoline. Nevertheless,prices in Charlottetown generally track higher than thenational average.
35 The Conference Board of Canada
Chart 17Retail Price for St. John’s (Ex-tax)(cents per litre)
Source: M.J. Ervin and Kent Marketing.
Jan.-9
1Jan
.-92
Jan.-9
3Jan
.-94
Jan.-9
5Jan
.-96
Jan.-9
7Jan
.-98
Jan.-9
9Jan
.-00
20253035404550
St. John's Canadian average
Chart 18Retail Margin for St. John’s(cents per litre)
Source: M.J. Ervin.
Jan.-9
1Jan
.-92
Jan.-9
3Jan
.-94
Jan.-9
5Jan
.-96
Jan.-9
7Jan
.-98
Jan.-9
9Jan
.-00
-4-202468
101214
St. John's Canadian average

Prince Edward Island is currently the only jurisdiction inCanada in which gasoline prices are actively regulated. ThePublic Utilities Commission supervises all wholesalers andretailers with respect to the pricing of automotive and homeheating oil. The Commission exercises its power to regulatethe timing and frequency of price changes and determinesthe minimum and maximum mark-up between the wholesaleprice to the retailer and the retail price to the consumer.Applicants for price increases bear the burden of showingthat a proposed price is fair and reasonable.
Although some competition remains in the P.E.I. market—for a minimum and maximum retail price can still be set—it appears that regulating gasoline prices has not resultedin lower prices for P.E.I. consumers. However, as crude oiland gasoline prices have increased rapidly since January1999, P.E.I. increases have lagged behind those of otherAtlantic provinces. Prince Edward Island has not benefitedfrom price wars, which have resulted in periods of lowprices in other provinces. At the same time, the low levelsof throughput would not justify low margins (and as aresult, low prices). Regulation has probably protected theviability of several Charlottetown outlets, but it has alsokept prices higher and has not encouraged efficiencythrough rationalization. Nevertheless, P.E.I. motoristsprobably believe that they have greater control over gaso-line prices and are protected against arbitrary increases.
While wholesale prices are available for Charlottetown,they are fixed by regulation. Marginal analysis therefore
has not been carried out, as it would not provide insightinto market conditions.
Saint John, New Brunswick
Saint John has a population of 127,211 (1999 estimate).In 1999, it had 47 service stations, three of which closedduring the year, for a density of about one station per2,900 people. This compares to 68 stations in 1990, areduction of over 35 per cent.
Of the 44 remaining stations, 13 are major or are affili-ated with their private brands (down from 21 in 1991) and 18 (down from 36) are regional refiners. There are 13 independent outlets (up from 9), which account forabout 23.8 per cent of gasoline sales by volume, one ofthe highest volumes for independents in Canada. Irving,the regional refiner based in Saint John, controls almost40 per cent of the market, the highest concentration foran individual brand within the centres being studied.
The average throughput for Saint John is 2.6 millionlitres per year in 1999, below the Canadian average of 3.2 million. This compares with a 1999 average for SaintJohn of 1.7 million litres. It should be noted that in1999, the average throughput for majors was 2.8 millionlitres (up from 1.7 million); for regional refiners it was2.6 million (up from 1.6 million) and for independents it was 2.1 million litres (up from 1.9 million).
36 The Conference Board of Canada
Chart 19Retail Price for Charlottetown (Ex-tax)(cents per litre)
Source: M.J. Ervin.
Jan.-9
1Jan
.-92
Jan.-9
3Jan
.-94
Jan.-9
5Jan
.-96
Jan.-9
7Jan
.-98
Jan.-9
9Jan
.-00
20253035404550
Charlottetown Canadian average
Chart 20Retail Price for Saint John (Ex-tax)(cents per litre)
Source: M.J. Ervin.
Jan.-9
1Jan
.-92
Jan.-9
3Jan
.-94
Jan.-9
5Jan
.-96
Jan.-9
7Jan
.-98
Jan.-9
9Jan
.-00
20253035404550
Saint John Canadian average
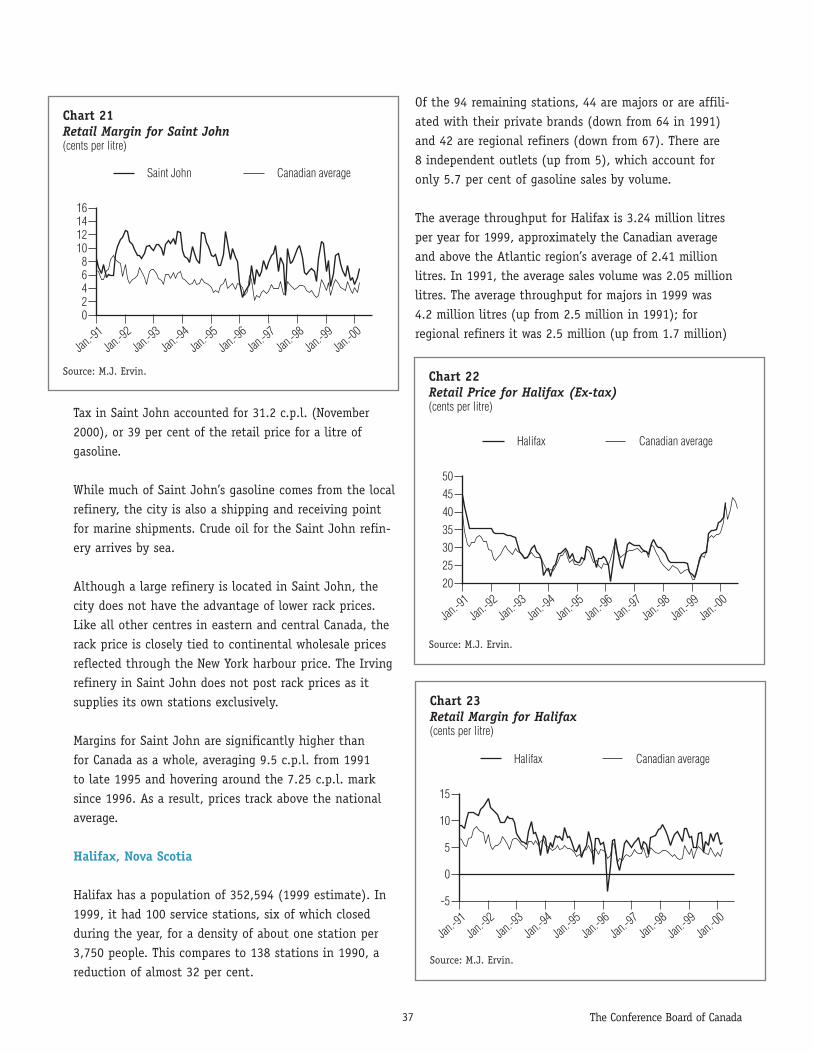
Tax in Saint John accounted for 31.2 c.p.l. (November2000), or 39 per cent of the retail price for a litre ofgasoline.
While much of Saint John’s gasoline comes from the localrefinery, the city is also a shipping and receiving pointfor marine shipments. Crude oil for the Saint John refin-ery arrives by sea.
Although a large refinery is located in Saint John, thecity does not have the advantage of lower rack prices.Like all other centres in eastern and central Canada, therack price is closely tied to continental wholesale pricesreflected through the New York harbour price. The Irvingrefinery in Saint John does not post rack prices as itsupplies its own stations exclusively.
Margins for Saint John are significantly higher than for Canada as a whole, averaging 9.5 c.p.l. from 1991 to late 1995 and hovering around the 7.25 c.p.l. marksince 1996. As a result, prices track above the nationalaverage.
Halifax, Nova Scotia
Halifax has a population of 352,594 (1999 estimate). In1999, it had 100 service stations, six of which closedduring the year, for a density of about one station per3,750 people. This compares to 138 stations in 1990, areduction of almost 32 per cent.
Of the 94 remaining stations, 44 are majors or are affili-ated with their private brands (down from 64 in 1991) and 42 are regional refiners (down from 67). There are 8 independent outlets (up from 5), which account foronly 5.7 per cent of gasoline sales by volume.
The average throughput for Halifax is 3.24 million litresper year for 1999, approximately the Canadian averageand above the Atlantic region’s average of 2.41 millionlitres. In 1991, the average sales volume was 2.05 millionlitres. The average throughput for majors in 1999 was 4.2 million litres (up from 2.5 million in 1991); forregional refiners it was 2.5 million (up from 1.7 million)
37 The Conference Board of Canada
Chart 21Retail Margin for Saint John(cents per litre)
Source: M.J. Ervin.
Jan.-9
1Jan
.-92
Jan.-9
3Jan
.-94
Jan.-9
5Jan
.-96
Jan.-9
7Jan
.-98
Jan.-9
9Jan
.-00
02468
10121416
Saint John Canadian average
Chart 22Retail Price for Halifax (Ex-tax)(cents per litre)
Source: M.J. Ervin.
Jan.-9
1Jan
.-92
Jan.-9
3Jan
.-94
Jan.-9
5Jan
.-96
Jan.-9
7Jan
.-98
Jan.-9
9Jan
.-00
20253035404550
Halifax Canadian average
Chart 23Retail Margin for Halifax(cents per litre)
Source: M.J. Ervin.
Jan.-9
1Jan
.-92
Jan.-9
3Jan
.-94
Jan.-9
5Jan
.-96
Jan.-9
7Jan
.-98
Jan.-9
9Jan
.-00
-5
0
5
10
15
Halifax Canadian average

and for independents it was 2.3 million litres (up from 1.5 million). Majors increased their average throughput by 68 per cent between 1991 and 1999,compared to 47 per cent for regional refiners and 53 per cent for independents.
Halifax obtains its gasoline from the local refinery. It also has a marine port, which gives the city the viableoption of importing gasoline from either the U.S. EastCoast or Europe.
As of November 2000, taxes made up 34.2 c.p.l., or nearly42 per cent of the pump price of a litre of regular unleadedgasoline.
Prices in Halifax were regulated until mid-1991. Sincethat time, prices have closely followed the nationalaverage, with the exception of a price war in 1996, whenprices fell below wholesale costs. Wholesale rack prices inHalifax are usually most closely tied to Boston prices,which in turn closely track those of New York harbour.
Margins in Halifax are above the Canadian average, but inline for a city with its throughput. Its margins are amongthe lowest in the Maritimes—the average margin between1995 and 2000 was approximately 5.9 c.p.l. The relativelylarge throughputs of the major integrated gasoline com-panies may be a cause of these lower margins, for themajors are likely to be the price leaders, particularlygiven the relatively small role of the independents andtheir small average volumes (55 per cent of that of themajors). The high throughputs would be the direct resultof the significant rationalization that has been going onin the market since 1990. Throughput for majors in theMaritimes jumped over 68 per cent from 1991 to 1999. Itappears that the consumer in Halifax has benefited fromthe implicit increased efficiencies gained through therationalization of the majors.
Quebec City, Quebec
Quebec City has a population of 688,025 (1999 estimate).In 1999, it had 303 service stations, seven of whichclosed during the year, for a density of about one stationper 2,324 people. This represents a decrease of 23 percent since 1992, when there were 385 outlets.
Of the 296 remaining stations, 103 are majors or areaffiliated with their private brands (down from 188 in1991) and 92 are regional refiners or are affiliated withtheir private brands (down from 104). There are 101independent outlets (down from 106), which account forjust under 23 per cent of gasoline sales by volume.
The average throughput for Quebec is 2.1 million litresper year, well below the Canadian average of 3.2 million.In 1991, the Quebec throughput was 1.4 million litres. It should be noted that the average throughput formajors was 2.6 million litres (up from 1.4 million in
38 The Conference Board of Canada
Chart 24Retail Price for Quebec City (Ex-tax)(cents per litre)
Source: M.J. Ervin.
Jan.-9
1Jan
.-92
Jan.-9
3Jan
.-94
Jan.-9
5Jan
.-96
Jan.-9
7Jan
.-98
Jan.-9
9Jan
.-00
1520253035404550
Quebec City Canadian average
Chart 25Retail Margin for Quebec City(cents per litre)
Source: M.J. Ervin.
Jan.-9
1Jan
.-92
Jan.-9
3Jan
.-94
Jan.-9
5Jan
.-96
Jan.-9
7Jan
.-98
Jan.-9
9Jan
.-00
0
3
6
9
12
15
Quebec City Canadian average

1991); for regional refiners and those affiliated withtheir brands it was 2.3 million (up from 1.5 million), and for independents it was 1.4 million litres (up from 1.2 million). Excluding big box operators, theaverage throughput for independents would be only 1.1 million litres.
As of November 2000, taxes on average accounted for35.2 c.p.l., or over 46 per cent of the average retail price of gasoline.
Quebec City has a regional refinery in close proximity,which is the source of gasoline for many of the majorsand independents. As a marine port, Quebec also hasaccess to imported product.
Independents play an important role in the Quebecmarket, although their per station throughput (excludingbig box operators) is just over 43 per cent of the volumessold in a major refiner-marketer’s typical station.Quebec’s throughputs are relatively low and one wouldexpect ex-tax prices in Quebec City to be somewhathigher than the Canadian average. Its prices, however,closely track the national average, although Quebec hasbenefited from price wars during several periods in thelast 10 years. During the summer of 2000, Quebec City’sprices were significantly lower than Montreal’s prices, asconsumers benefited from yet another price war andmargins fell to approximately 2 c.p.l.
Due to the Ultramar ValuePlus program of matching thelowest price regardless of the level of service offered,Quebec tends to be a “one price” market, with independ-ents, majors and regionals all showing similar prices.
Average margins in Quebec have been approximately 4.6 c.p.l. since 1995, although these margins can dropdramatically during a price war.
Montreal, Quebec
The City of Montreal has a population of 1,810,619 (1999estimate). In 1999, it had 1,071 service stations, 50 ofwhich closed during the year, for a density of about onestation per 1,722 people. This compares to 1,419 outletsin 1991, a reduction of 32 per cent.
Of the 1,021 remaining stations, 420 are majors or areaffiliated with their private brands (down from 701 in1991) and 274 are regional refiners or are affiliated withtheir private brands (down from 327). There are 327independent outlets (up from 142), which account for15.3 per cent of gasoline sales by volume. Independentstook over many of the outlets closed by the majors andregional-refiners.
The average throughput for Montreal is 2.6 millionlitres per year for 1999, which is 19 per cent below
the Canadian average of 3.2 million. In 1991, the average throughput was 1.7 million litres. The average
39 The Conference Board of Canada
Chart 26Retail Price for Montreal (Ex-tax)(cents per litre)
Source: M.J. Ervin.
Jan.-9
1Jan
.-92
Jan.-9
3Jan
.-94
Jan.-9
5Jan
.-96
Jan.-9
7Jan
.-98
Jan.-9
9Jan
.-00
1520253035404550
Montreal Canadian average
Chart 27Retail Margin for Montreal(cents per litre)
Source: M.J. Ervin.
Jan.-9
1Jan
.-92
Jan.-9
3Jan
.-94
Jan.-9
5Jan
.-96
Jan.-9
7Jan
.-98
Jan.-9
9Jan
.-00
-30369
1215
Montreal Candian average

throughput for majors was 3.6 million litres (up from 2.0 million in 1991); for regional refiners and thoseaffiliated with their brands it was 2.6 million (up from1.5), and for independents it was 1.23 million litres(down from 1.3 million). Excluding big box operators,the average throughput for independents is slightly lessthan one million litres per outlet annually for 1999.
Montreal has a local refining capacity and is relatively close to wholesale supply sources in the United States. It also has the marine capacity to receive shipments ofinternational product. The wholesale market in Montrealis therefore highly competitive. Montreal has manyindependent outlets, although their market share is lessimportant than their number. They make up 32 per centof the outlets, but account for only 15.3 per cent ofgasoline sales.
Montreal pump prices contain the highest tax componentof any of the major centres. In November 2000, taxesmade up 37.2 c.p.l. or approximately 46 per cent of thepump price. Ex-tax prices, however, track the nationalaverage very closely.
Despite the number of station closures since 1990, thedensity of population per station is extremely low inMontreal compared to other Canadian cities with popula-tions over one million. Montreal’s density per station isless than a third of that of Toronto or Vancouver. This is reflected in Montreal’s comparatively much smalleraverage throughputs and higher prices.
The Montreal market has been volatile, closely matchingwholesale prices. At the same time, Montreal has hadfewer and less intensive incidents of price wars. However,on average Montreal has had only slightly higher marginsthan the norm for Canada as a whole at about 4.16 c.p.l.for the period since 1994.
Ottawa, Ontario
Ottawa has a population of 809,034 (1999 estimate). In1999, it had 184 service stations, five of which closedduring the year, for a density of about one station per4,519 people. This represents a reduction of almost 27 per cent since 1991, when there were 244 stations.
Of the 179 remaining stations, 82 are major (down from 126 in 1991) and 21 are regional refiners (downfrom 27). There are 76 independent outlets (down from 91), which account for 26.2 per cent of gasolinesales by volume. Counted among these independents is Pioneer Petroleums, which accounts for 6.5 per cent of the market. Although 50 per cent of Pioneer has been acquired by Sunoco, a regional refiner,Pioneer’s behaviour and pricing policies are more in line with those of an independent retailer. ExcludingPioneer, independents account for 19.7 per cent of theOttawa market.
40 The Conference Board of Canada
Chart 28Retail Price for Ottawa (Ex-tax)(cents per litre)
Source: M.J. Ervin.
Jan.-9
1Jan
.-92
Jan.-9
3Jan
.-94
Jan.-9
5Jan
.-96
Jan.-9
7Jan
.-98
Jan.-9
9Jan
.-00
1520253035404550
Ottawa Canadian average
Chart 29Retail Margin for Ottawa(cents per litre)
Source: M.J. Ervin.
Jan.-9
1Jan
.-92
Jan.-9
3Jan
.-94
Jan.-9
5Jan
.-96
Jan.-9
7Jan
.-98
Jan.-9
9Jan
.-00
02468
1012
Ottawa Canadian average

The average per outlet sales volume for Ottawa is 3.7 millionlitres per year for 1999. In 1991, the average was 2.1 mil-lion. The average throughput for majors was 5.1 millionlitres (it more than doubled from 2.5 million in 1991),regional refiners 3.8 million (up from 1.7) and independents2.27 million litres (up from 1.7). Excluding big box operatorsand Pioneer, the average throughput for independents wouldonly be 1.64 million litres (1.4 million in 1991).
Tax makes up 29.6 c.p.l. (November 2000), whichaccounts for 40 per cent of the average retail price of a litre of regular gasoline.
Gasoline refined by the majors generally comes intoOttawa by pipeline from Montreal. Supply conditions aretherefore similar to those of that city. Independentlyimported product does not have access to the pipeline—it must be trucked in from Montreal or other points.
Retail margins in Ottawa are low relative to other centresof the same size. The market went through its rationali-zation period in the early 1990s, and since 1996 marginshave averaged around 3.5 c.p.l. This is likely accountedfor by the relatively high throughputs, particularly of themajors, as well as the presence of a large number ofindependents. The presence of strong independents hasprobably inspired a series of price wars, which has occa-sionally resulted in Ottawa prices and margins droppingbelow the national average.
Toronto, Ontario
Metro Toronto has a population of 2.5 million (1999 esti-mate), while 4,680,250 people live in the Greater TorontoArea. Toronto is by far the largest market in Canada. In1999, Metro Toronto had 461 service stations, 12 of whichclosed during the year, thereby creating a density of aboutone station per 5,620 people, well above any other city inCanada. Since 1991, the number of stations has dropped byalmost 34 per cent, for 695 stations operated in that year.The reduction in the number of the major refiner-marketers’stations was even more pronounced. Between 1991 and1999, the majors reduced their outlets in Toronto from 475to 263, a drop of almost 45 per cent. The reduced numberof service stations caused by the rationalizations of the1980s and 1990s is particularly apparent in Toronto because
of its high density. Of the 449 remaining stations inToronto, 263 are majors or are affiliated with their privatebrands and 48 are regional refiners (down from 67 in 1991).There are 138 independent outlets (down from 153), whichaccount for 17.2 per cent of gasoline sales by volume (21.5 per cent in 1991). If Pioneer were omitted from thegroup, the independents’ share would fall to 15.6 per cent.
The average sales volume per station for Toronto is 4.63million litres per year, which is 45 per cent above theCanadian average of 3.2 million. In 1991, the averagethroughput for Toronto was 2.9 million litres. The averagethroughput for majors and their private brands in 1999 was
41 The Conference Board of Canada
Chart 30Retail Price for Toronto (Ex-tax)(cents per litre)
Source: M.J. Ervin.
Jan.-9
1Jan
.-92
Jan.-9
3Jan
.-94
Jan.-9
5Jan
.-96
Jan.-9
7Jan
.-98
Jan.-9
9Jan
.-00
20
25
30
35
40
45
Toronto Canadian average
Chart 31Retail Margin for Toronto(cents per litre)
Source: M.J. Ervin.
Jan.-9
1Jan
.-92
Jan.-9
3Jan
.-94
Jan.-9
5Jan
.-96
Jan.-9
7Jan
.-98
Jan.-9
9Jan
.-00
0
2
4
6
8
10
Toronto Canadian average

5.72 million litres (up from 2.9 million in 1991); for regionalrefiners it was 4.99 million litres (up from 3.0 million) andfor independents it was 2.52 million litres (down from 2.8).Excluding big box operators and Pioneer, the average salesvolume for independents in 1999 was 1.93 million litres(down from 2.3 million in 1991).
Taxes make up 29.5 c.p.l. of the average price of a litre ofgasoline in Toronto (November 2000), or 40 per cent.
Refining takes place near Toronto—in fact, there is evena refinery in the Greater Toronto Area. The city is on theproduct pipeline from Sarnia and is close to U.S. whole-sale markets. Thus, the import option is a key factor inthe Toronto market, and wholesale rack prices closelyreflect this potential competition.
Due to its high throughputs, Toronto is a much sought-aftergasoline market. This has resulted in extended price warsand fierce competition within the market. Independents inparticular have been hard-hit by this competition: theyoften do not have the financial resources that would allowthem to sustain selling at the low retail margins that weretypically found in Toronto during the 1994–98 period.During this period, margins averaged around 2.2 c.p.l.
In spite of the price war, Toronto is one of the few multi-priced Canadian markets. Differentials between majorsand independents are relatively small (usually no morethan 0.3 c.p.l.), but they continue to exist.
Margins have risen significantly in Toronto over the pastfew months, possibly as a result of retailer fatigue overlow margins and less aggressive price behaviour by inde-pendents. Since the end of 1998, average margins haverecovered to over 5 c.p.l. How long Toronto will sustainrelatively high margins is an issue for speculation.
Winnipeg, Manitoba
Winnipeg has a population of 677,625 (1999 estimate). In 1999, it had 243 service stations, six of which closedduring the year, for a density of about one station per2,859 people. The number of outlets has dropped byapproximately 22 per cent since 1991, when there were312 outlets.
Of the 237 remaining stations, 122 are majors or areaffiliated with their private brands (down from 165 in1991) and 65 are regional refiners or are affiliated withtheir private brands (up from 35 in 1991). There are 50 independent outlets (down from 112 in 1991), whichaccount for 19.4 per cent of gasoline sales by volume(down from 33.1 per cent in 1991).
The average sales volume per outlet for Winnipeg for 1999 is 2.6 million litres per year, or 19 per centbelow the Canadian average of 3.2 million. In 1991, theaverage was 1.9 million litres. The average throughput for majors and their brands was 2.73 million litres
42 The Conference Board of Canada
Chart 32Retail Price for Winnipeg (Ex-tax)(cents per litre)
Source: M.J. Ervin.
Jan.-9
1Jan
.-92
Jan.-9
3Jan
.-94
Jan.-9
5Jan
.-96
Jan.-9
7Jan
.-98
Jan.-9
9Jan
.-00
15202530354045
Winnipeg Canadian average
Chart 33Retail Margin for Winnipeg(cents per litre)
Source: M.J. Ervin.
Jan.-9
1Jan
.-92
Jan.-9
3Jan
.-94
Jan.-9
5Jan
.-96
Jan.-9
7Jan
.-98
Jan.-9
9Jan
.-00
02468
1012
Winnipeg Canadian average

(up from 2.1 million in 1991); for regional refiners andtheir brands it was 2.4 million (up from 1.6 million in1991) and for independents it was 2.43 million litres (up from 1.8 million in 1991). Excluding big box operators, the average throughput for independents is 2.07 million litres per outlet annually for 1999. While independent sales volumes in Winnipeg are below those of the majors, they nevertheless represent a significantly higher proportion of those of the majorsthan in other Canadian centres.
In November, tax made up 26.1 c.p.l. or 37 per cent ofthe Winnipeg pump price.
Winnipeg has no refining capacity in its immediate area,but is serviced by the product pipeline from Edmonton.Some import options exist, but they are limited.
Pricing in Winnipeg is relatively stable, although price wars benefited consumers in the early 1990s. Independentshad gained significant market share from the majors duringthe 1980s. During the early 1990s, the major integratedcompanies took aggressive steps to gain it back, resulting in price wars.
The large presence of independents in Winnipeg does notseem to have lowered retail margins. Since 1994, marginshave tended to be significantly higher in Winnipeg thanthe Canadian average at over 7 c.p.l. A possible explana-tion may be the relatively low throughputs, particularlyamong majors. In August 2000, Winnipeg again experi-enced a price war, with margins of barely 0.5 c.p.l. bringing about some of the lowest prices among all themajor Canadian cities.
Like many prairie cities, Winnipeg has evolved into a one-price city, with no differential granted between independ-ents and majors or between full- and self-service.
Regina, Saskatchewan
Regina has a population of 199,163 (1999 estimate). In1999, it had 84 service stations, three of which closedduring the year, for a density of about one station per2,459 people. In 1991 there were 106—the number hasdropped by nearly 24 per cent.
Of the 81 remaining stations, 48 are majors or are affili-ated with their private brands (down from 59 in 1991)and 22 are regional refiners or are affiliated with theirprivate brands (the same number as in 1991). There are 11 independent outlets (down from 25), which account for at least 6 per cent of gasoline sales by volume (threeoutlets did not report volumes).
The average sales volume per outlet for Regina is 2.48 million litres per year for 1999, below the Canadianaverage of 3.2 million and slightly below the Prairies’average of 2.85 million. The average sales volume in 1991
43 The Conference Board of Canada
Chart 34Retail Price for Regina (Ex-tax)(cents per litre)
Source: M.J. Ervin.
Jan.-9
1Jan
.-92
Jan.-9
3Jan
.-94
Jan.-9
5Jan
.-96
Jan.-9
7Jan
.-98
Jan.-9
9Jan
.-00
15202530354045
Regina Canadian average
Chart 35Retail Margin for Regina(cents per litre)
Source: M.J. Ervin.
Jan.-9
1Jan
.-92
Jan.-9
3Jan
.-94
Jan.-9
5Jan
.-96
Jan.-9
7Jan
.-98
Jan.-9
9Jan
.-00
-10
-5
0
5
10
15
Regina Canadian average
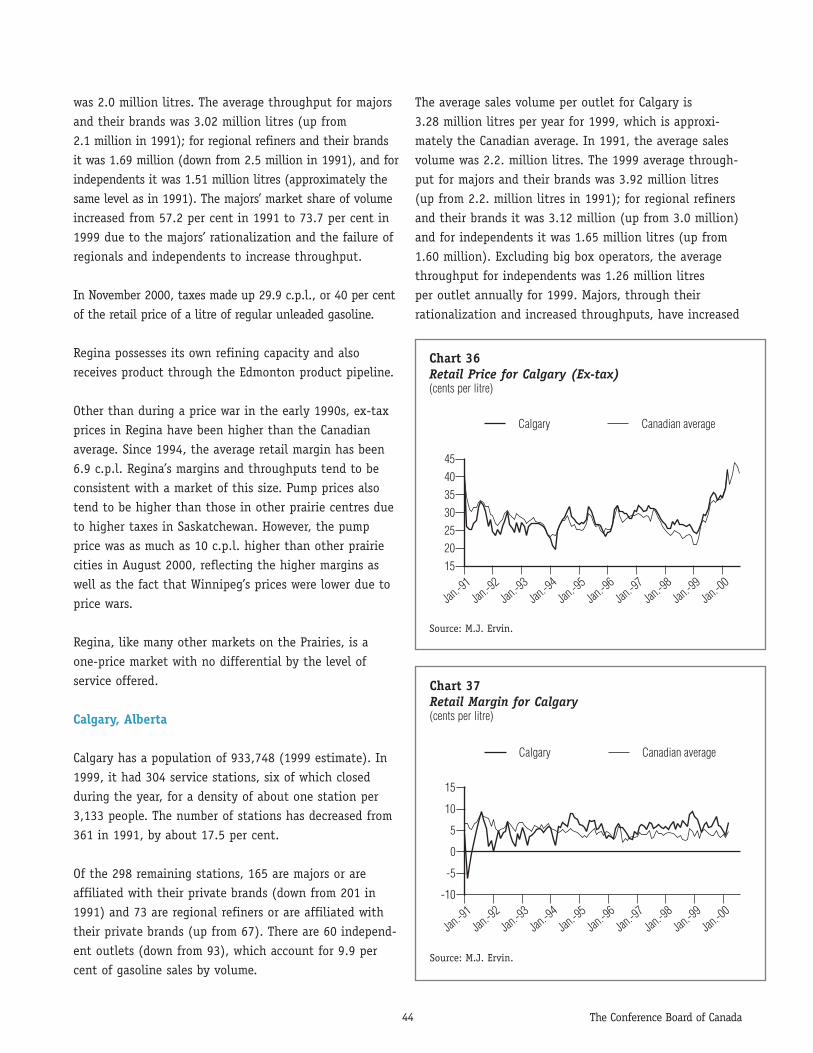
was 2.0 million litres. The average throughput for majorsand their brands was 3.02 million litres (up from 2.1 million in 1991); for regional refiners and their brandsit was 1.69 million (down from 2.5 million in 1991), and forindependents it was 1.51 million litres (approximately thesame level as in 1991). The majors’ market share of volumeincreased from 57.2 per cent in 1991 to 73.7 per cent in1999 due to the majors’ rationalization and the failure ofregionals and independents to increase throughput.
In November 2000, taxes made up 29.9 c.p.l., or 40 per centof the retail price of a litre of regular unleaded gasoline.
Regina possesses its own refining capacity and alsoreceives product through the Edmonton product pipeline.
Other than during a price war in the early 1990s, ex-taxprices in Regina have been higher than the Canadianaverage. Since 1994, the average retail margin has been6.9 c.p.l. Regina’s margins and throughputs tend to beconsistent with a market of this size. Pump prices alsotend to be higher than those in other prairie centres dueto higher taxes in Saskatchewan. However, the pumpprice was as much as 10 c.p.l. higher than other prairiecities in August 2000, reflecting the higher margins aswell as the fact that Winnipeg’s prices were lower due toprice wars.
Regina, like many other markets on the Prairies, is a one-price market with no differential by the level ofservice offered.
Calgary, Alberta
Calgary has a population of 933,748 (1999 estimate). In1999, it had 304 service stations, six of which closedduring the year, for a density of about one station per3,133 people. The number of stations has decreased from361 in 1991, by about 17.5 per cent.
Of the 298 remaining stations, 165 are majors or areaffiliated with their private brands (down from 201 in1991) and 73 are regional refiners or are affiliated withtheir private brands (up from 67). There are 60 independ-ent outlets (down from 93), which account for 9.9 percent of gasoline sales by volume.
The average sales volume per outlet for Calgary is 3.28 million litres per year for 1999, which is approxi-mately the Canadian average. In 1991, the average salesvolume was 2.2. million litres. The 1999 average through-put for majors and their brands was 3.92 million litres(up from 2.2. million litres in 1991); for regional refinersand their brands it was 3.12 million (up from 3.0 million)and for independents it was 1.65 million litres (up from1.60 million). Excluding big box operators, the averagethroughput for independents was 1.26 million litres per outlet annually for 1999. Majors, through theirrationalization and increased throughputs, have increased
44 The Conference Board of Canada
Chart 36Retail Price for Calgary (Ex-tax)(cents per litre)
Source: M.J. Ervin.
Jan.-9
1Jan
.-92
Jan.-9
3Jan
.-94
Jan.-9
5Jan
.-96
Jan.-9
7Jan
.-98
Jan.-9
9Jan
.-00
15202530354045
Calgary Canadian average
Chart 37Retail Margin for Calgary(cents per litre)
Source: M.J. Ervin.
Jan.-9
1Jan
.-92
Jan.-9
3Jan
.-94
Jan.-9
5Jan
.-96
Jan.-9
7Jan
.-98
Jan.-9
9Jan
.-00
-10
-5
0
5
10
15
Calgary Canadian average

their market share (by volume) from 55.6 per cent in1991 to 66.6 per cent in 1999.
Calgary prices are traditionally among the lowest inCanada. This is in part because gasoline taxes in Albertaare the lowest among the 10 provinces. In November2000, taxes made up just 23.4 c.p.l., or just under 34 percent of the pump price. Ex-tax prices, however, are veryclose to the Canadian average.
After the market adjusted following the price wars of theearly 1990s, margins in Calgary stabilized at an averageof 6 c.p.l., slightly above the Canadian average. Like theother prairie markets, Calgary prices show little or nodifferential between branded and unbranded stations or between full-service and self-service stations.
Vancouver, British Columbia
Vancouver has a population of 2,016,643 (1999 estimate).In 1999, it had 394 service stations, 44 of which closedduring the year, for a density of about one station per5,762 people. In comparison, there were 483 stations in1995, so the number has dropped by 28 per cent. Thenumber of stations continues to decline in Vancouver,particularly as a result of a severe price war that occurredin 1998–99.
Of the 350 remaining stations, 175 are owned by majorsor are affiliated with their private brands (down from 286 in 1991) and 154 are regional refiners or are affiliat-ed with their private brands (up from 115). There are 21 independent outlets, which account for at least 1.9 per cent of gasoline sales by volume. This representsa sharp reduction from 1991, when 96 independents wereoperating. The market share figure is probably higher, asfive big box operators have not reported their volumes.
The average sales volume per outlet for Vancouver is 3.92 million litres per year for 1999, above both theCanadian and B.C. averages. In 1991, the average salesvolume was 2.4 million litres. The average throughput formajors and their private brands was 4.02 million litres (upfrom 2.4 million in 1991); for regional refiners and theirbrands it was 4.16 million litres (up from 2.8 million), andfor independents it was 1.28 million litres (down from 1.65
million). The dominant player in the market is Chevron, aregional refiner, which has approximately one-third of themarket share and an average throughput at its outlets thatis more than 50 per cent higher than the Vancouver average.
In August 2000, taxes made up 40 per cent of theVancouver pump price, or 29.9 c.p.l.
From 1993 to 1998, Vancouver stations earned an averageretail margin of over 6 c.p.l. Consumers in Vancouver bene-fited from an extended price war in 1998–99, during whichprices frequently dived well below cost. The average marginduring this period was minus 2.1 c.p.l. The war was initiatedby the two new entrants into the market—an American
45 The Conference Board of Canada
Chart 38Retail Price for Vancouver (Ex-tax)(cents per litre)
Source: M.J. Ervin.
Jan.-9
1Jan
.-92
Jan.-9
3Jan
.-94
Jan.-9
5Jan
.-96
Jan.-9
7Jan
.-98
Jan.-9
9Jan
.-00
1015202530354045
Vancouver Canadian average
Chart 39Retail Margin for Vancouver(cents per litre)
Source: M.J. Ervin.
Jan.-9
1Jan
.-92
Jan.-9
3Jan
.-94
Jan.-9
5Jan
.-96
Jan.-9
7Jan
.-98
Jan.-9
9Jan
.-00
-10
-5
0
5
10
15
Vancouver Canadian average

regional refiner with a refining capacity just across theborder from Vancouver and a big box operator. (Details of the price war are explored in an earlier section of thepaper.) The price war was probably responsible for theclosure of several stations and the withdrawal of someindependent operators from the Vancouver market.
Vancouver prices have started to recover. Prices are fallingmore in line with the Canadian average and retail marginsare returning to positive levels. However, retail margins arestill smaller than those in other centres in British Columbia.But this is consistent with the larger throughputs found inVancouver, particularly among the dominant players. Priceincreases have also become more frequent in Vancouver.
Smaller Centres
Part of the mandate of the study was to look at citiesthat have not been studied in earlier reports and thatrepresent Canada’s northern component as well as itsrural regions. To this end, four additional cities wereexamined—Whitehorse, Yukon; Sault Ste. Marie, Ontario;Dauphin, Manitoba; and Smithers, British Columbia.
The study of these centres is limited by the amount of dataand the relatively short time-series available. To facilitateanalysis, the three rural centres are compared to the closestof the larger urban centres considered in this study.All four centres experience higher prices and largermargins than the bigger centres to the south. This isconsistent with their low volumes and high freight costs.
Whitehorse, Yukon
Whitehorse has a population of 18,792 (1999 estimate)and is the largest city in the Yukon. Government is themajor economic activity in Whitehorse—it occupiesnearly a quarter of the labour force. In 1999, Whitehorsehad 19 service stations, two of which closed during theyear, thereby creating a density of about one station per1,105 people.
Of the 17 remaining stations, 10 are major and 5 areregional refiners or their private brands. There are twoindependent outlets, which account for 6.8 per cent ofgasoline sales by volume.
Yukon has the lowest gasoline taxes of any jurisdiction in Canada.
As noted, the analysis of the Whitehorse market is limitedby the shortage of data as well as the relatively brieftime-period over which it is available. Average sales vol-umes per outlet for Whitehorse are estimates, as volumesare available only for the last 181 days of 1999. Theestimated average throughput is 1.43 million litres peryear. The average throughput for majors is 1.7 millionlitres; for regional refiners and their private brands it is1.01 million, and for independents it is 0.93 million litres.
46 The Conference Board of Canada
Chart 40Retail Price for Whitehorse (Ex-tax)(cents per litre)
Source: M.J. Ervin.
Jun.-98Aug.-9
8Oct.-
98Dec.
-98Feb.-9
9Apr.-9
9Jun.-9
9Aug.-9
9Oct.-
99Dec.
-99Feb.-0
015202530354045505560
Whitehorse Canadian average
Chart 41Retail Margin for Whitehorse(cents per litre)
Source: M.J. Ervin.
Jun.-98Aug.-9
8Oct.-
98Dec.
-98Feb.-9
9Apr.-9
9Jun.-9
9Aug.-9
9Oct.-
99Dec.
-99Feb.-0
005
101520253035
Whitehorse Canadian average

There are four routes for bringing gasoline to Whitehorse.Most of Whitehorse’s gasoline is shipped from Vancouverto Skagway, Alaska, and then trucked down. Smallerquantities of gasoline come from Fairbanks, Alaska, byroad, via sea to Haines, and are then trucked up theAlaska Highway. Despite the low taxes, ex-tax prices inWhitehorse are among the highest in Canada. This iscaused by average retail margins that are six times theCanadian average. Average retail margins (calculated onVancouver rack prices) for the July 1998 to March 2000period were 24.8 c.p.l. This is due to the relative isola-tion of Whitehorse and its distance from alternativesources of supply, high freight costs and very lowthroughputs, as well as to its limited number of stations.
Freight costs are approximately 10.0 c.p.l., almost 10 timesthose in a southern city. In addition, the low averagethroughputs also indicate that ancillary revenues, such asconvenience store sales, are limited. Operators would thereforebe more dependent on gasoline sales to meet their fixed costs.
The situation in Whitehorse is typical of that of othernorthern communities. They, too, suffer from high prices.Stations in Whitehorse and other territorial communitiesrequire exceedingly high margins in order to survive andabsorb their high transportation costs relative to theirlow sales volumes.
Sault Ste. Marie, Ontario
Sault Ste. Marie has a population of 79,899 (1999 esti-mate). In 1999, it had 23 service stations, for a densityof about one station per 3,474 people.
Of the 23 stations, 14 are majors or are affiliated withtheir private brands and 3 are regional refiners. There aresix independent outlets, which account for 18.9 per centof gasoline sales by volume.
Average throughput for Sault Ste. Marie was 3.07 millionlitres per year in 1999. The average throughput formajors and their private brands was 3.78 million litres;for regional refiners it was 1.47 million, and for inde-pendents it was 2.22 million litres. However, if big boxoperators are removed from the independents, theiraverage throughput falls to 1.28 million litres per year.
Toronto is the source of most of Sault Ste. Marie’s gas-oline. Sault Ste. Marie’s prices closely track those ofToronto, albeit at a higher level. This is likely due toadditional freight costs and lower average sales volumes.These factors probably are also responsible for the highretail margin in Sault Ste. Marie. In the 1998–2000period, retail margins hovered around the 7.7 c.p.l. level.While this is a higher margin than those of most majorcities, it is consistent with a city of Sault Ste. Marie’s sizeand sales volumes as well as its additional freight costs.Margins are lower than those of the smaller centres thatwere also examined.
47 The Conference Board of Canada
Chart 42Retail Price for Sault Ste. Marie (Ex-tax)(cents per litre)
Source: M.J. Ervin.
Jun.-98Aug.-9
8Oct.-
98Dec.
-98Feb.-9
9Apr.-9
9Jun.-9
9Aug.-9
9Oct.-
99Dec.
-99Feb.-0
01520253035404550
Sault Ste. Marie
Toronto
Canadian average
Chart 43Retail Margin for Sault Ste. Marie(cents per litre)
Source: M.J. Ervin.
Jun.-98Aug.-9
8Oct.-
98Dec.
-98Feb.-9
9Apr.-9
9Jun.-9
9Aug.-9
9Oct.-
99Dec.
-99Feb.-0
00
3
6
9
12
15
Sault Ste. Marie
Toronto
Canadian average

For a centre of Sault Ste. Marie’s size and populationdensity per station, average sales volumes seem slightlylower than expected. This is probably because of SaultSte. Marie’s proximity to the U.S. border and the retailcompetition offered by that market.
Dauphin, Manitoba
Dauphin has a population of approximately 11,128. It is thelargest city in the northwest region of Manitoba and has amixed manufacturing base. It is roughly equidistant fromWinnipeg and Regina (325 km). In 1999, it had 12 servicestations, for a density of about one station per 927 people.
Of the 12 stations, 8 are major and 3 are regional refinersor are affiliated with their private brands. There is oneindependent outlet, which opened in the fourth quarterof 1999. As a result, there are not yet data on its vol-umes or market share.
The estimated average throughput for Dauphin was 1.21 million litres per year for 1999. The averagethroughput for majors was 1.13 million litres, and forregional refiners and their brands it was 1.43 million litres.
Dauphin’s gasoline is trucked in from Winnipeg.
Dauphin has a large number of stations for such a smallpopulation, and this is reflected in its very low averagethroughput. Like many other rural communities, it islikely that Dauphin’s outlets participate in other retailactivities and that gasoline represents only a part of theirrevenues. Otherwise, it would be hard to justify theexistence of so many stations.
Dauphin benefited in the early 1990s from the price wars that dominated the gasoline markets in the west, asmajors tried to recoup their market share throughout theregion. Margins quickly climbed until 1993. They havevaried from that point to the present with an average of10.4 c.p.l. Like most small centres, these margins reflectlow volumes and high freight costs. As might be expect-ed, Dauphin’s prices track higher than, but in tandemwith, those of Winnipeg.
Smithers, British Columbia
Smithers has a population of 6,104 (1999 estimate). It islocated 1,150 km from Vancouver, 353 km from PrinceRupert and 371 km from Prince George. Its economy isbased on resource industries, dairy farming, regionalgovernment and tourism.
In 1999, it had five service stations, for a density ofabout one station per 1,221 people.
Of the five stations, three are majors and two are regionalrefiners or are affiliated with their private brands. Thereare no independent outlets.
48 The Conference Board of Canada
Chart 44Retail Price for Dauphin (Ex-tax)(cents per litre)
Source: Kent Marketing and M.J. Ervin.
1991:Q1
1992:Q1
1993:Q1
1994:Q1
1995:Q1
1996:Q1
1997:Q1
1998:Q1
1999:Q120
25
30
35
40
Dauphin Winnipeg Canadian average
Chart 45Retail Margin for Dauphin(cents per litre)
Source: Kent Marketing and M.J. Ervin.
1991:Q1
1992:Q1
1993:Q1
1994:Q1
1995:Q1
1996:Q1
1997:Q1
1998:Q1
1999:Q10
3
6
9
12
15
Dauphin Winnipeg Canadian average

The estimated average throughput for Smithers was 2.22 million litres per year in 1999. The average through-put for majors was 2.35 million litres, and for regionalrefiners and their brands it was 2.03 million litres.
Most of Smithers’ gasoline is trucked in from PrinceGeorge or shipped from Vancouver to Prince Rupert andtrucked into Smithers.
As might be expected for a relatively isolated region with high freight costs, Smithers’ retail margin is higherthan those of urban centres further south. Based onVancouver rack prices, Smithers shows an average retailmargin of over 10 c.p.l. for the period 1994–99. It didshow a decrease of margin in 1999, which may be anindirect result of the price war in Vancouver and thelower mainland.
49 The Conference Board of Canada
Chart 46Retail Price for Smithers (Ex-tax)(cents per litre)
Source: Kent Marketing and M.J. Ervin.
1994:Q1
1995:Q1
1996:Q1
1997:Q1
1998:Q1
1999:Q110152025303540
Smithers Vancouver Canadian average
Chart 47Retail Margin for Smithers(cents per litre)
Source: Kent Marketing and M.J. Ervin.
1994:Q1
1995:Q1
1996:Q1
1997:Q1
1998:Q1
1999:Q1-5
0
5
10
15
20
Smithers Vancouver Canadian average

50 The Conference Board of Canada
This paper presents an up-to-date profile of the Canadian gasoline industry and attempts toaddress some of the preoccupations of industrystakeholders and the perceptions of Canadianmotorists.
The gasoline industry in Canada follows economicrules of supply and demand over which it haslittle control. The price of gasoline’s majorinput, crude oil, is determined outside Canada’sborders. In addition, even the wholesale price of gasoline in Canada is as much determined by American conditions as it is by cost, supplyor demand within our borders.
Rapid increases in retail prices in the 1999–2000period have been due to a near tripling in theworld price of crude oil, as well as daily volatilityfor both crude prices and futures. As a result,Canadians have seen the highest nominal pumpprices ever.
Pump prices vary from one city to the next.However, when taxes are removed from the retail price, we see a commodity that has similarprices across Canada, differentiated predomi-nantly by local competitive conditions, averagesales volumes and freight costs.
The gasoline industry in Canada has a limitednumber of key players, who, through theirvertical integration and sheer size, are oftenexpected by the public to have excessive influ-ence in the marketplace. At the same time, wesee the vulnerability of these Goliaths to inde-pendent Davids and new market entrants, who,with aggressive pricing policies, precipitate pricewars that have implications across the entireindustry and throughout the country.
It is important to remember that crude oil andtaxes make up about 84 per cent of the averageprice of a litre of regular unleaded gasoline. This
leaves only 16 per cent to cover refining, mar-keting costs and the retailer’s operational andfixed costs. This implies that on average in mid-November 2000, the downstream gasolineindustry (refining, marketing and retailing) hasinfluence over just 11.9 cents on a 75.9 centlitre of gasoline. Retailers have even less influ-ence—they can affect approximately only 4.5 cents on the pump price of gasoline.
We shall now summarize the issues that havebeen raised during our meetings with the stake-holders and reflect on what we have foundconcerning these questions.
Canadian Perceptions
Consumers
What Consumers Want
Consumers want the lowest possible price consis-tent with readily available supply when fillingup their automobiles. They do not want to pullout of the station with the feeling that someonehas “ripped them off.” Consumers also wantassurance that they are not being gouged by theoil companies simply because they are buyinggasoline on weekends or in a different part ofthe country (i.e., rural communities). They wantto ensure that the oil companies are not takingadvantage of high world oil prices to makeexcessive profits on their retail operations.
Consumer Perceptions
Most consumers view the volatility in gasolineprices and the uniform lowering or raising ofprices as signs of collusion. When prices sudden-ly increase by 6–7 c.p.l. in one day, drop just asquickly the next day and then shoot up againlater in the week, they feel that oil companiesare taking advantage of them and making huge
ConclusionsCH
APTE
R 3

profits at their expense. If gasoline prices sometimesincrease before a long weekend, consumers believe thatthe system that determines gasoline prices is riggedagainst them.
Our Findings
The reality in this case is quite different from the percep-tions of the typical consumer. Consumers across thecountry are well served by the current market systemthat determines gasoline prices. By “well served” wemean that Canadian prices are among the lowest possible,given input costs, and that gasoline is readily available at the gasoline pump.
The decline of retail margins throughout the 1990s (seeChart 4) is proof that consumers are benefiting fromimproved efficiencies in the industry. The volatility ingasoline prices reflects the unstable market for crude oil and is also a direct result of the fiercely competitivenature of the business at the street level. The unique way that gasoline prices are posted on large signs outsideeach retail outlet across the country contributes to thevolatility. During a price war, dealers must match thelowest price offered in their area or risk losing a largeportion of their business. When a dealer finally decidesthat he is unable to continue to sell his product at a lossand makes up his mind to increase the price, other com-petitors often (but not always) follow suit in order toearn a more reasonable margin and pay the bills. Thisuniform increase in prices may look like collusion andgouging, but it is actually the result of retail dealersattempting to run their operations, achieve a fair returnon their effort and investment and stay in business.
The difference in prices between rural and urban commu-nities, which in some instances is viewed as being out of line even after transportation costs have been takeninto account, demonstrates the importance of salesvolumes in determining retail prices. In rural communi-ties, the average throughput at each outlet is generallyfar lower than that of urban communities. Lowerthroughputs imply that a dealer must make a highermargin in order to cover fixed costs. In Toronto, it maybe possible to make a profit at a busy downtown locationwith a margin of only 1–2 c.p.l. and sufficiently high
volumes. A retailer in a rural community may need 10 c.p.l. just to survive.
Sometimes retail prices differ between communities inways that are not immediately obvious. For instance,prices could, for a period of time, be lower in a city thatis much further away from a terminal compared to anothercity with terminal facilities and a similar population.While this may confuse consumers, it is likely that this is brought about by the varying local market conditionsthat exist in each city in Canada and that can pushgasoline prices in directions that diverge from the normover a short period of time. All it takes is one dealer whois determined to increase market share at the expense of competitors to upset the balance and bring about asituation where retail prices diverge from the norm andbear little resemblance to factors like transportation costsor rack prices.
In response to complaints from politicians and consumergroups, some provinces have enacted legislation to con-trol gasoline prices. While price regulation eliminates thevolatility that consumers dislike, the evidence suggeststhat it does not lead to lower prices. Prince Edward Islandregulates gasoline prices, yet, as was discussed earlier, itsex-tax retail prices are generally among the highest inthe country. Nevertheless, regulation provides consumerswith a feeling of control over prices and the belief thatincreases are justified and not arbitrary.
Oil companies are profitable, but are their profits out ofline for an industry where investments are in the billionsof dollars and where upstream activities such as exploration
51 The Conference Board of Canada
Table 6Return on Capital Employed for the Downstream Sector(per cent)
Year Petro-Canada Shell Imperial Oil
1993 7.1 1.7 9.01994 8.1 5.6 8.51995 9.0 9.4 7.81996 6.8 4.3 6.41997 11.1 14.7 12.41998 8.5 15.7 11.31999 5.2 8.2 2.2
Source: Published Annual Reports.

carry tremendous risks? Table 6 shows the rate of returnon capital employed for the majors’ downstream opera-tions (refining and retailing). Although profits for 2000are expected to be high due to higher refining margins,with the exception of 1997–98, returns have been relatively modest (below 10 per cent). While nominalamounts may appear high because of the large amountsof capital involved, returns should more properly beconsidered as a percentage of capital employed.
There is no empirical proof that gasoline prices increasebefore long weekends. While it is true that prices dosometimes shoot up before long weekends, they are justas likely to increase prior to any other weekend through-out the year. The fact is that dealers attempt to increaseprices in the middle of the week, if the prices have beeneroded earlier due to street-level competition, in order toearn a higher margin. If the restoration does not succeed,prices tend to drift down on Friday and on the weekend.This could happen in any season. However, it is morelikely to happen in the summer because demand is higherand inventories are lower than in the winter months.Increases before long weekends may be more likely to be accepted by competitors in anticipation of the higherholiday demand, but this cannot be proven statistically.
Major Integrated Oil Companies and Regional Refiners
What the Majors and Regionals Want
The majors and regional refiner-marketers want to earn a reasonable rate of return for their shareholders. Theywant to ensure that each part of their business—upstream, refinery and retail—operates at a profit. Theyalso would like to be viewed by the Canadian public asbeing good corporate citizens who contribute to theircommunities.
Majors’ and Regionals’ Perceptions
The gasoline majors and regional refiners believe thatthey are providing consumers with a very competitivelypriced product, given the increases and volatility in worldcrude prices. They point to the fact that the ex-tax priceof gasoline in Canada and the United States is verysimilar, even though the majors in Canada must operate
in a market that is much smaller than the U.S. market.Canadians enjoy some of the lowest gasoline prices in theworld (see Table 7) despite the fact that Canada has alarger geographic area with a smaller population base and higher costs compared with other countries.
The intense competition that has provided consumerswith these relatively low prices has led to unsatisfactorydownstream earnings by the integrated refiners, with arate of return of less than 10 per cent.
The majors and regional refiners believe that biggest threatto their future market share comes from the potentialincrease in the number of big box stores that sell gasoline.They are also concerned about an ever-growing list ofenvironmental regulations that will force them to investmillions of dollars to revamp their refineries and stations.These costs may not be easily recoverable at the pump andfurther rationalization and change may have to occur.
Despite their belief that they are providing consumerswith a competitive product in a marketplace in which it is becoming more and more difficult to compete, themajor oil companies and regional refiners feel that theyare viewed by the general public and independents asbeing the “bad guy.” When retail gasoline prices increase,they are accused of gouging the public, even though themajor component of the price increase is rising crudeprices. In 2000, 84 per cent of the retail pump price ismade up of crude oil plus taxes. The majors are accusedof trying to put the independents out of business whenprices decline. When prices are stable, they are accused of
52 The Conference Board of Canada
Table 7World Gasoline Prices in June 2000(Can. cents per litre)
Country Retail Price Ex-tax Retail Price
Canada 74.0 43.6United States 64.0 48.9Italy 155.1 56.1France 158.8 48.7United Kingdom 183.9 51.1Spain 118.0 49.5Germany 152.7 52.7Japan 147.0 65.4
Source: M.J. Ervin.

collusion. Yet, no past study carried out by any level ofgovernment has uncovered evidence of illegal or anti-competitive behaviour within the gasoline industry.
The majors believe that they are being penalized by publicperception. Few consumers understand the pricing ofgasoline. Most of them generally view gasoline purchasesas an annoying chore that brings little or no gratification.
Our Findings
Major oil companies do co-operate to promote theircommon interests. They swap gasoline at the refinerylevel, invest in pipelines and carry out joint public rela-tions efforts through industry associations. Nevertheless,the industry takes great care with proprietary informa-tion and pricing policies to avoid the appearance andaccusation of collusion. The joint practices of the indus-try make good business sense and do not violate any lawsor regulations.
Retail prices often change in step. We believe this reflectshighly competitive street-level competition and protec-tion of market share rather than a conspiracy amongcompanies. Similarly, the setting of rack prices takes intoaccount the same factors for all refiners, and it is naturalthat prices should rise and fall in tandem. All players in the gasoline industry are motivated by self-interest,and often these interests coincide among participants.Gouging, collusion or predatory pricing would not servethe long-term self-interest of the participants.
Independents
What the Independents Want
The independents want to compete and earn a reasonablerate of return in a market that is fair and where everyparticipant in the industry plays by the same set of rules.
Perception
Many (but not all) of the independents consulted for thepurpose of this study believe that the majors have anunfair advantage in the marketplace that stems fromtheir ownership of refineries as well as their size. This
advantage makes it very difficult for independents tocompete and, for some, to remain in business. At thewholesale level, it is difficult for some independents tosecure a reliable supply of product at a competitive price.The majors’ practice of setting rack prices at a competi-tive level with imports denies them a price advantagethat would be possible if rack prices were based on refin-ery costs. Problems in obtaining cheaper imported supplyfrom the United States are aggravated by the lack ofaccess to a pipeline and new environmental laws concern-ing benzene levels in gasoline, as well as future Canadianstandards for sulphur content that will be out of linewith the U.S. timetable for such regulations. Indepen-dents believe that the limited number of refiners inCanada leads to oligopolistic pricing practices and thatCanadian refiners do not actively compete for the busi-ness of independents.
At the retail level, many of the independents claim thatthe majors cross-subsidize their retail operations to putincreasing pressure on their outlets. Currently, with worldcrude oil prices above Can. $44 (U.S. $30) a barrel, themajors are experiencing an unusually high rate of returnfrom the upstream part of their business. It is allegedthat they use some of these earnings to subsidize theirretail operations by lowering the wholesale price to theirbranded dealers. This enables the branded dealers tocharge a lower retail price, and the independents areforced to follow suit.
Since the independents do not have upstream revenue tosupport their operations, lower retail prices have forcedsome of them to close stations or consider leaving thebusiness. Similarly, they believe that the branded dealers ofthe major and regional-refiners are subsidized. They thinkthat the branded dealers receive gasoline at prices signifi-cantly lower than those available to independents throughlower wholesale prices that are intended to guaranteemargins during price wars or in areas of zone pricing.
Some of the independents contend that the long-termgoal of the majors is to subsidize their retail operationsto the point where the squeezed margins will eventuallyforce all independents out of business. Once this has beenaccomplished, the majors will be in a position to increasemargins back to the levels that existed in the 1980s,
53 The Conference Board of Canada

given that there will be far fewer competitors with whichto contend. The independents feel that the threat posedby the big box stores is greatly exaggerated by themajors. They believe that the difficulty in obtainingmunicipal zoning for gasoline outlets (which can some-times take two years) combined with the poor marginsthat currently exist in the industry make it unlikely thatthe trend towards superstores selling gasoline will spreadquickly throughout Canada.
Our Findings
The reality for most independents is that imported supplyfrom the United States will become increasingly difficultto secure once the new environmental laws take hold.While the Canadian refining industry is highly concen-trated, it must, by necessity, remain competitive withU.S. refineries. Rack prices that are competitive with U.S.markets work to the disadvantage of the independents interms of imports, but do provide them with lower-costdomestic supply than might otherwise be the case.Regardless, the setting of rack prices based on U.S.wholesale markets makes sound economic sense to themajors, given the huge investment that refineries require.As a result, Canadian motorists pay a lower retail pricefor gasoline.
It is our judgement that cross-subsidization exists tosome extent between the different activities undertakenin the gasoline industry. However, the inter-financing of activities is neither illegal nor unusual as a businesspractice across the Canadian economy. Moreover, ourempirical work could not find conclusive evidence ofeither the extent or magnitude of cross-subsidization,given the data that are available. The lack of informationabout the actual prices paid by most retail dealers fortheir supply makes it impossible to draw any definitiveconclusions on this issue.
The majors’ argument that each portion of their business(upstream, refinery and retail) must make a suitable rateof return on capital appears to be realistic. However,there is no doubt that during a price war the majorssupport their dealers by temporarily providing them witha lower wholesale price. This gives their dealers a signifi-cant advantage because independent competitors are not
in a bargaining position to receive a large enough rackprice discount to sustain an extended price war. Thedegree to which this practice persists in the industry is asource of contention: the majors claim that it is done onan infrequent basis, while the independents contend thatit is widespread. The lack of transparency in the actualsupply cost for stations affiliated with major and regionalrefiner-marketers makes it impossible to reach a conclu-sion on the extent of the practice.
Independents are also at a disadvantage in that theirmargins are based on rack price. Major and regionalrefiner-owned stations use an internal acquisition price,which hides what their real margin might be.
Major and regional refiners have an advantage over inde-pendents in terms of tax collection. Independents mustpay the excise taxes (federal and provincial) on gasolineimmediately upon delivery of the wholesale product. On the other hand, branded dealers pay the excise taxesonly after the product is sold at the retail level. Thisgives the branded dealers a cash flow advantage over the independents.
The potential entry of mass merchandisers into themarket is another source of contention. This segment of the industry grew throughout the 1990s, yet it isdifficult to predict what will happen in this decade. The majors and some independents contend that the sale of gasoline at mass merchandisers will continue togrow because it is a relatively inexpensive business toenter once the store has been constructed. Also, becauseof the large throughput that can be attained at thesesites, it is possible to make a suitable rate of return witha relatively low margin (2–3 c.p.l.). Issuing coupons tocustomers from the retail outlet to be used at servicestations, or vice versa, is an attractive option for themass merchandisers.
Some independents argue that low margins in the indus-try and zoning laws will stall growth in this segment ofthe industry, and this argument has some merit. However,some independents are minimizing the threat posed bymass merchandisers. Simply because the rate of return on the gasoline portion of the business is lower than thereturn for non-gasoline products does not imply that the
54 The Conference Board of Canada

decision to invest in a new gasoline outlet makes noeconomic sense. A merchant may decide to open a servicestation, even though the margins are low, because theadditional traffic that it creates could lead to increasedBig box sales in other parts of the operation. Big boxoperators may also gain an advantage in the market byintroducing cutting-edge technology that will allow themadditional efficiencies. Based on the experiences of othercountries, the big box store phenomenon probably willcontinue to expand in Canada.
Independents cannot escape the reality that the rational-ization and cost cutting that took place in the 1990s willcontinue in the present decade. To survive, they will haveto become more efficient largely through increasedthroughput. In the 1990s, the major oil companies tookthe lessons of the independents about ancillary sales andservices as well as lower prices and expanded upon them.If the traditional independents wish to survive in the21st century, they will have to continue to look for waysto innovate in order to remain competitive.
55 The Conference Board of Canada

56 The Conference Board of Canada
Sources of Data
Kent Marketing, through Industry Canada, sup-plied the Conference Board with data dealing withthroughputs, the number of outlets and classifica-tion of the outlets (i.e., major, regional andindependent) at the city level. The Kent dataincluded gasoline volumes from the independentsas well as from the majors and regional refiners.The primary source of retail price data was M.J. Ervin. Data on wholesale prices came fromBloomberg, one of several available sources.Statistics Canada provided the demographic data.
Price Consistency
The Kent Marketing data dealing with throughputswere collected on a bimonthly basis for the largercities analyzed in this study. However, for some ofthe smaller centres, the data were collected on aquarterly basis. The M.J. Ervin price retail data forsmall centres were also collected quarterly. As aresult, regression analysis was not conducted onthe smaller cities, as quarterly data does notcapture the frequency of changes in retail pricesthat is required for a meaningful analysis.
Price Volatility
The retail gasoline industry is characterized bytremendous price volatility. It is not unusual forretail outlets to change their prices two or threetimes a day, especially in the middle of a price war.The industry is also characterized by price increasesthat tend to take place in some cities on the sameday of the week and in other cities on a differentday. For this reason, some of the stakeholdersrecommended that we use daily data in the empiri-cal analysis. However, there is an important trade-off involved, in that daily data in this industry areso volatile that it is virtually impossible to drawmeaningful conclusions from regression analysis,which is designed to explain price changes. The use
of monthly data was the optimal choice in order toconduct the wholesale and retail regressions. Weare confident that the empirical analysis of themonthly data enabled us to arrive at meaningfulconclusions that were in line with what actuallyhappens in the industry on a day-to-day basis.
Margins
Looking at changes over time in the retail marginsis a powerful way to analyze the retail gasolineindustry. The retail margin is the differencebetween the ex-tax price of gasoline charged atthe pump and the rack price. In this study, theresults revealed that retail margins declined inmost cities in the early part of the 1990s andthen levelled off in the mid and latter part of thedecade. The retail margins in this study areunderstated by an amount that is impossible toquantify. This is because of the industry’s wide-spread practice of offering discounts on the rackprice or else using internal market acquisitionprices for consignment or supplier-owned gaso-line. For the purposes of running regressions, theunderstated retail margins do not pose a signifi-cant problem, given that the discount price is afunction of the posted rack price. Consequently,variations in the data should balance out.
Independents
The definition of an independent is acontentious issue in the industry. The KentMarketing data that were used in this studyclassified any operator in the industry that didnot have a refining ability as an independent.All other companies were classified as eitherregional or major companies, depending on thetype of refining operations that they owned. For instance, Irving is classified as a regionaloperation because its refining capacity resides inonly one part of the country. Petro-Canada andImperial Oil, on the other hand, are classified as
Data CharacteristicsAP
PEND
IX A

majors because they own refineries in different parts of thecountry. IRGMA claims that the classification employed byKent distorts the data because it fails to take into accountsome of the unique relationships in the industry.
Pioneer, for instance, is classified as an independent opera-tor because it does not have a refining capability. However,Sunoco owns 50 per cent of this company. IRGMA arguesthat even though Pioneer does not have a refinery, itsrelationship with Sunoco enables it to have a secure accessto supply and preferential discounts that are not availableto other independents. The fact that Kent classifies Pioneeras an independent is erroneous, according to IRGMA, andthe data on the market share of independents are distortedbecause Pioneer is included in this category. If Pioneerwere not included as an independent, IRGMA contends thatthe overall picture of the changes in the market share ofindependents over the past decade would be more accurate.
During the stakeholder dialogues, the Conference Boardalso heard arguments in favour of classifying Pioneer as an
independent. Representatives from Pioneer and Sunocoindicated that the 50 per cent ownership did not providePioneer with any special status in terms of price discounts.It was also noted that the aggressive pricing policies ofPioneer were more in line with how independent dealersoperated, rather than integrated refiner-marketers.
In this study, Pioneer is considered to be an independentmainly because of its aggressive pricing policies. However,because of its unique relationship with Sunoco, the datadealing with market share for the independents in thecities where Pioneer is a player both includes and excludesPioneer volumes.
Kent also classifies the mass merchandisers as independents,as they do not have refining capabilities. However, theirhuge throughputs, a result of their traffic, places them in adifferent segment of the market compared with most inde-pendents. As a result, in the city analysis, data for theaverage throughputs of independents are provided both withand without the volume sales of the mass merchandisers.
57 The Conference Board of Canada

58 The Conference Board of Canada
This study of the gasoline industry in Canadarepresents the culmination of more than sixmonths of intensive research undertaken by TheConference Board of Canada. During the initialphase that started in April 2000, the Board helddiscussions with many stakeholders in theindustry from every region of the country. Themeetings included those with major and regionalrefiner-marketers and both large and smallindependent operators. Associations that repre-sent consumers, independents and refiner-marketers were also contacted, as were individ-ual station owners, employees and interestedCanadian consumers.
As a result of these pre-research consultations,seven specific research questions were identi-fied:1. What is the relationship between wholesale
prices and crude oil price changes?2. What is the relationship between Canadian
and U.S. rack prices?3. What is the relationship between retail and
wholesale gasoline prices?4. Do retail prices change asymmetrically with
wholesale price increases?5. How do average sales volumes affect retail
gasoline margins?6. Do gasoline prices go up before long weekends? 7. Is there cross-subsidization between the
upstream and refining sectors and the retailoperations of integrated refiner-marketers?
Wholesale Regressions
Question 1: What is the relationship betweenwholesale prices and crude oil price changes?
Relationship between U.S. Wholesale Prices andCrude Oil
Before examining the factors that have animpact on Canadian wholesale prices for
gasoline, it was important to establish a rela-tionship between U.S. wholesale and crude oilprices. As will be seen below, Canadian whole-sale prices are heavily influenced by U.S. whole-sale prices, which, in turn, are directly tied tocrude oil price swings.
∆WtNY = β1(∆WTIt),
Where:∆WNY is the change in U.S. wholesale prices inNew York over a one-month period, and
∆WTI is the change in the West TexasIntermediate price of crude oil over a one-month period.
A positive relationship between wholesale andcrude oil was to be anticipated, given the factthat crude oil is the primary input into theproduction of gasoline. The equation was esti-mated using Ordinary Least Squares (OLS) with monthly data for the period of February 1993 to April 1999.
Results
The results are shown in Table 8. The t-statisticsare in parentheses below the estimated coefficient.
The results show that the wholesale price ofgasoline has a significant correlation to crudeoil prices. The R2 of 0.463 is high for a first
Detailed Methodology and Statistical ResultsAP
PEND
IX B
Table 8Results of the Wholesale Regression
Variable Estimated coefficient
Crude Oil (∆WTI) 1.124(7.982)
Adjusted R2 0.463Durbin-Watson 2.365
Source: The Conference Board of Canada.

difference equation. The coefficient of 1.124 suggeststhat a one cent per litre increase (decrease) in the priceof crude oil (one barrel of crude oil equals 159 litres)causes an increase (decrease) of slightly more than onecent per litre in the price of U.S. wholesale gasoline.
Canadian Wholesale Prices
Question 2: What is the relationship between Canadianand U.S. rack prices?
During the stakeholder dialogues, it was pointed out thatwholesale prices in Canada are closely related to U.S.wholesale prices because of the trade in gasoline acrossthe Canada–United States border. In order to test for thisrelationship, the following equation was developed:
∆Wt = β1(∆WtNY) + β2(∆WNY
t–1),
Where:∆W is the change in the Canadian wholesale price over a one-month period, and
∆WNY is the change in the American price over a one-month period.
All prices are in Canadian dollars.
The wholesale price in New York City was chosen becauseprices in other wholesale markets in the United States areclosely aligned to it. These estimations were done by OLSon a city-by-city basis using monthly data for the timeperiod covering March 1993 to April 1999. A lag on theNew York wholesale price was included to account for thepossibility that U.S. wholesale prices in the past monthmay have an influence on current Canadian wholesaleprices. It would be expected that the signs of the twocoefficients should be positive since higher (lower)wholesale prices in the United States should result inhigher (lower) wholesale prices in Canada.
It could be argued that crude oil prices should be includ-ed in the equation as an independent variable as opposedto U.S. wholesale prices. Canada is a price taker in inter-national markets and, consequently, crude prices shouldhave just as much of an influence on Canadian wholesale
prices as they do on U.S. wholesale prices. However, itwas felt that U.S. wholesale prices were a better indicatorsince, over time, they account for gains in efficiency inthe U.S. refinery industry that would not necessarily becaptured with the crude oil price.
Results
The results of the regression are shown in Table 9 (the t-statistics are in parentheses).
The results indicate that the U.S. wholesale price, bothpresent and lagged one month, are significant in explainingthe movement in Canadian wholesale prices for all 11 cities.The sum of the coefficients is close to one for most of thecities, with the exception of Calgary, Regina and Winnipeg.This implies that a one cent per litre increase (decrease) inwholesale prices in the United States results over a one-month period in a one cent per litre increase (decrease) inCanadian wholesale prices. The fact that the coefficients forthe three cities in the Prairies did not add up to one couldbe explained by the greater difficulty in obtaining importedwholesale gasoline from the United States compared withthe situation in eastern Canada and Vancouver.
The close relationship between Canadian and U.S. whole-sale prices is not surprising. The majors in Canada closelymonitor U.S. wholesale prices and must set their prices toremain competitive with imported gasoline. If Canadianwholesale prices were not competitive with U.S. prices,imported product would flood the Canadian market andhurt the refinery business in Canada.
Retail Regressions
Question 3: What is the relationship between retailand wholesale gasoline prices?
The ex-tax retail price in Canada should be heavily influ-enced by changes in wholesale prices. The retail margin isthe other factor that should influence retail prices. If adealer is operating with a low margin, possibly because ofa price war, the change in the retail price in reaction to achange in the wholesale price may differ compared withthe adjustment that would occur if the retail margin wereat a higher level.
59 The Conference Board of Canada

This equation was used to test this assumption:
∆Rt = β1(∆Wt) + β2(∆Wt-1) + β3(∆Wt–2) + β4[(Rt–1–Wt–1)–(R–W)*],
Where:∆R is the change in the retail price over a one-monthperiod,
∆W is the change in the wholesale price over a one-month period, and
[(R–W)–(R–W)*] is the error-correction term.
It was expected that the sign on the present and laggedwholesale price would be positive, indicating that higherwholesale prices are associated with higher retail prices.The error-correction term is the difference between theone-period lag of the retail margin and what is referredto as a market outcome margin. The market outcome
margin can be thought of as a margin, determined bylocal competitive conditions, that exists and that doesnot provide an incentive for dealers to either enter orexit the industry. It is a retail margin that, in a sense, isacceptable to the current players in a market providing a“fair or decent” rate of return for their efforts and invest-ment. For most of the cities, margins declined in theearly part of the decade and then levelled off. Averagemargins were calculated over periods where the marginsgenerally moved in the same direction (i.e., increasing,decreasing or remaining level). These were then referredto as the market outcome margin.
The purpose of the market outcome margin is to capturethe effect that retailers consider the existing marketoutcome margin and take this into account when adjust-ing retail prices in response to a change in wholesaleprices. For example, if the wholesale price increases by acent and the current retail margin is above the market
60 The Conference Board of Canada
Table 9Results of the Canadian Wholesale Regressions
Estimated Coefficients
City Period t Period t–1 Sum Adjusted R2
Calgary 0.465 0.317 0.782 0.666(10.196) (6.811)
Halifax 0.808 0.256 1.064 0.850(19.539) (6.136)
Montreal 0.810 0.103 0.913 0.838(19.375) (2.409)
Ottawa 0.829 0.137 0.966 0.839(19.320) (3.126)
Quebec City 0.828 0.099 0.927 0.831(18.886) (2.203)
Regina 0.466 0.316 0.782 0.67010.294) (6.837)
Saint John 0.803 0.237 1.040 0.844(19.273) (5.579)
St. John’s 0.809 0.285 1.094 0.844(18.804) (6.488)
Toronto 0.871 0.203 1.074 0.859(20.707) (4.717)
Vancouver 0.500 0.497 0.997 0.485(6.060) (5.902)
Winnipeg 0.470 0.317 0.787 0.681(10.563) (6.986)
Source: The Conference Board of Canada.

outcome margin, then the dealer may adjust the retail priceby less than a cent, given that the retail margin is at ahigh level. Conversely, the dealer might increase the retailprice by more than a cent if the retail margin is below themarket outcome margin. Consequently, the expected sign of the error-correction term should be negative.
The estimations are done using OLS on a city-by-city basiswith monthly data from January 1991 to March 2000.
Market Outcome Margins
The market outcome margins used in the estimations are shown on a city-by-city basis in the following charts.Also included in the charts are the standard errors for the actual margin for each of the periods under consider-ation. These standard errors are a measure of volatility. It is clear that in eight cities, there was less volatility inthe latter part of the 1990s than in the earlier part.
61 The Conference Board of Canada
Chart 48Retail Market Outcome Margin for Calgary(cents per litre)
Sources: M.J. Ervin and The Conference Board of Canada.
Jan.-91 Jul.-91 Jan.-92 Jul.-92 Jan.-93 Jul.-93 Jan.-94 Jul.-94 Jan.-95 Jul.-95 Jan.-96 Jul.-96 Jan.-97 Jul.-97 Jan.-98 Jul.-98 Jan.-99 Jul.-99 Jan.-00-8-6-4-202468
101214 Actual Target
Std. deviation=2.84
Std. deviation=1.41
Chart 49Retail Market Outcome Margin for Halifax(cents per litre)
Sources: M.J. Ervin and The Conference Board of Canada.
Jan.-91 Jul.-91 Jan.-92 Jul.-92 Jan.-93 Jul.-93 Jan.-94 Jul.-94 Jan.-95 Jul.-95 Jan.-96 Jul.-96 Jan.-97 Jul.-97 Jan.-98 Jul.-98 Jan.-99 Jul.-99 Jan.-00 Jul.-00-4-202468
10121416
Actual Target
Std. deviation=1.77
Std. deviation=2.10
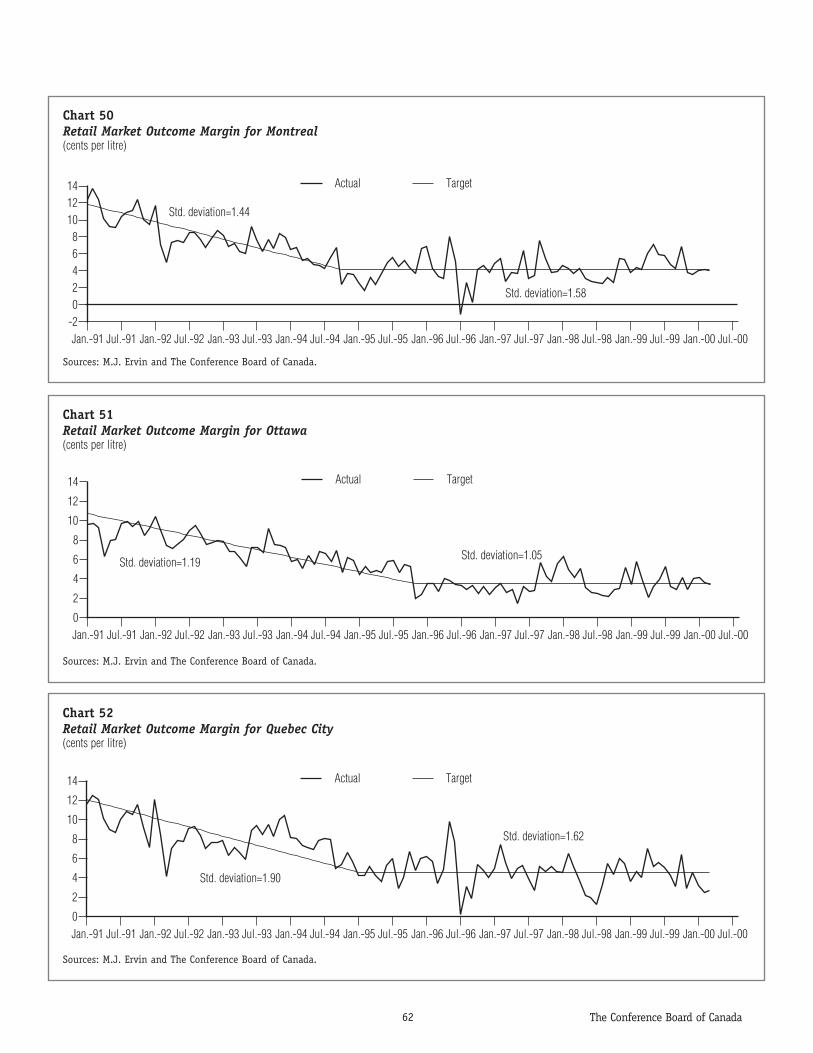
62 The Conference Board of Canada
Chart 50Retail Market Outcome Margin for Montreal(cents per litre)
Sources: M.J. Ervin and The Conference Board of Canada.
Jan.-91 Jul.-91 Jan.-92 Jul.-92 Jan.-93 Jul.-93 Jan.-94 Jul.-94 Jan.-95 Jul.-95 Jan.-96 Jul.-96 Jan.-97 Jul.-97 Jan.-98 Jul.-98 Jan.-99 Jul.-99 Jan.-00 Jul.-00-202468
101214 Actual Target
Std. deviation=1.44
Std. deviation=1.58
Chart 51Retail Market Outcome Margin for Ottawa(cents per litre)
Sources: M.J. Ervin and The Conference Board of Canada.
Jan.-91 Jul.-91 Jan.-92 Jul.-92 Jan.-93 Jul.-93 Jan.-94 Jul.-94 Jan.-95 Jul.-95 Jan.-96 Jul.-96 Jan.-97 Jul.-97 Jan.-98 Jul.-98 Jan.-99 Jul.-99 Jan.-00 Jul.-000
2
4
6
8
10
12
14 Actual Target
Std. deviation=1.19 Std. deviation=1.05
Chart 52Retail Market Outcome Margin for Quebec City(cents per litre)
Sources: M.J. Ervin and The Conference Board of Canada.
Jan.-91 Jul.-91 Jan.-92 Jul.-92 Jan.-93 Jul.-93 Jan.-94 Jul.-94 Jan.-95 Jul.-95 Jan.-96 Jul.-96 Jan.-97 Jul.-97 Jan.-98 Jul.-98 Jan.-99 Jul.-99 Jan.-00 Jul.-000
2
4
6
8
10
12
14 Actual Target
Std. deviation=1.90
Std. deviation=1.62
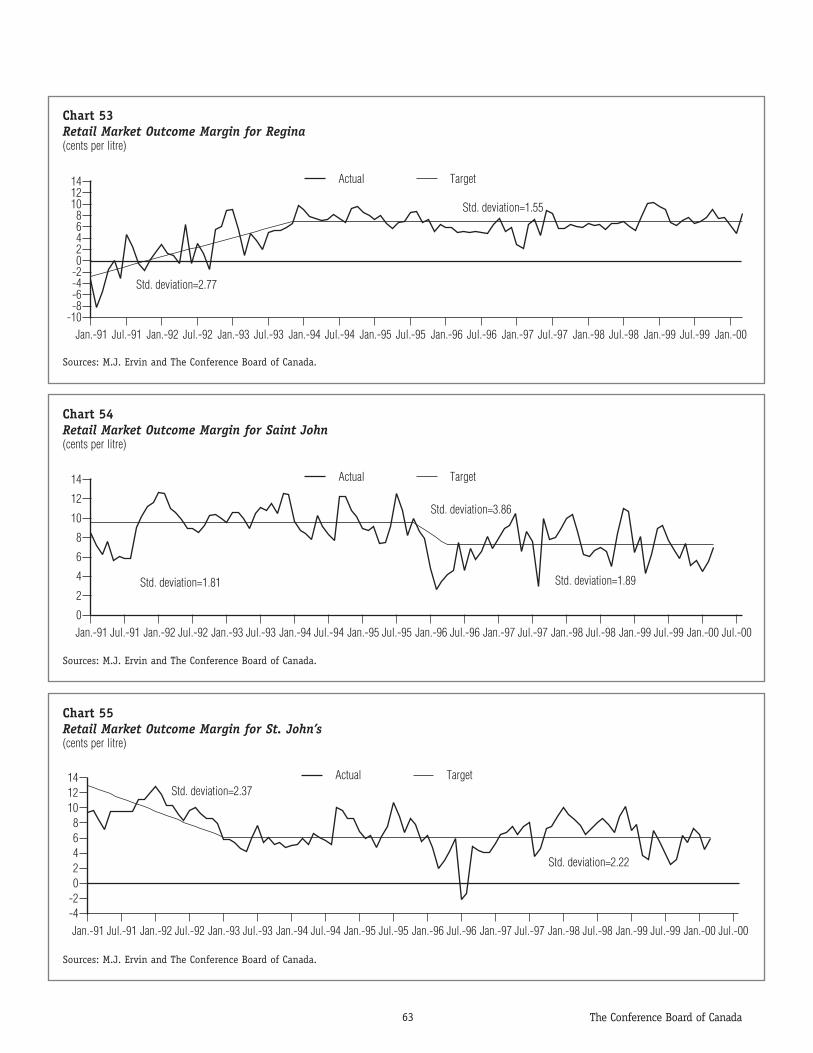
63 The Conference Board of Canada
Chart 53Retail Market Outcome Margin for Regina(cents per litre)
Sources: M.J. Ervin and The Conference Board of Canada.
Jan.-91 Jul.-91 Jan.-92 Jul.-92 Jan.-93 Jul.-93 Jan.-94 Jul.-94 Jan.-95 Jul.-95 Jan.-96 Jul.-96 Jan.-97 Jul.-97 Jan.-98 Jul.-98 Jan.-99 Jul.-99 Jan.-00-10-8-6-4-202468
101214 Actual Target
Std. deviation=2.77
Std. deviation=1.55
Chart 54Retail Market Outcome Margin for Saint John(cents per litre)
Sources: M.J. Ervin and The Conference Board of Canada.
Jan.-91 Jul.-91 Jan.-92 Jul.-92 Jan.-93 Jul.-93 Jan.-94 Jul.-94 Jan.-95 Jul.-95 Jan.-96 Jul.-96 Jan.-97 Jul.-97 Jan.-98 Jul.-98 Jan.-99 Jul.-99 Jan.-00 Jul.-000
2
4
6
8
10
12
14 Actual Target
Std. deviation=1.81 Std. deviation=1.89
Std. deviation=3.86
Chart 55Retail Market Outcome Margin for St. John’s(cents per litre)
Sources: M.J. Ervin and The Conference Board of Canada.
Jan.-91 Jul.-91 Jan.-92 Jul.-92 Jan.-93 Jul.-93 Jan.-94 Jul.-94 Jan.-95 Jul.-95 Jan.-96 Jul.-96 Jan.-97 Jul.-97 Jan.-98 Jul.-98 Jan.-99 Jul.-99 Jan.-00 Jul.-00-4-202468
101214 Actual Target
Std. deviation=2.37
Std. deviation=2.22
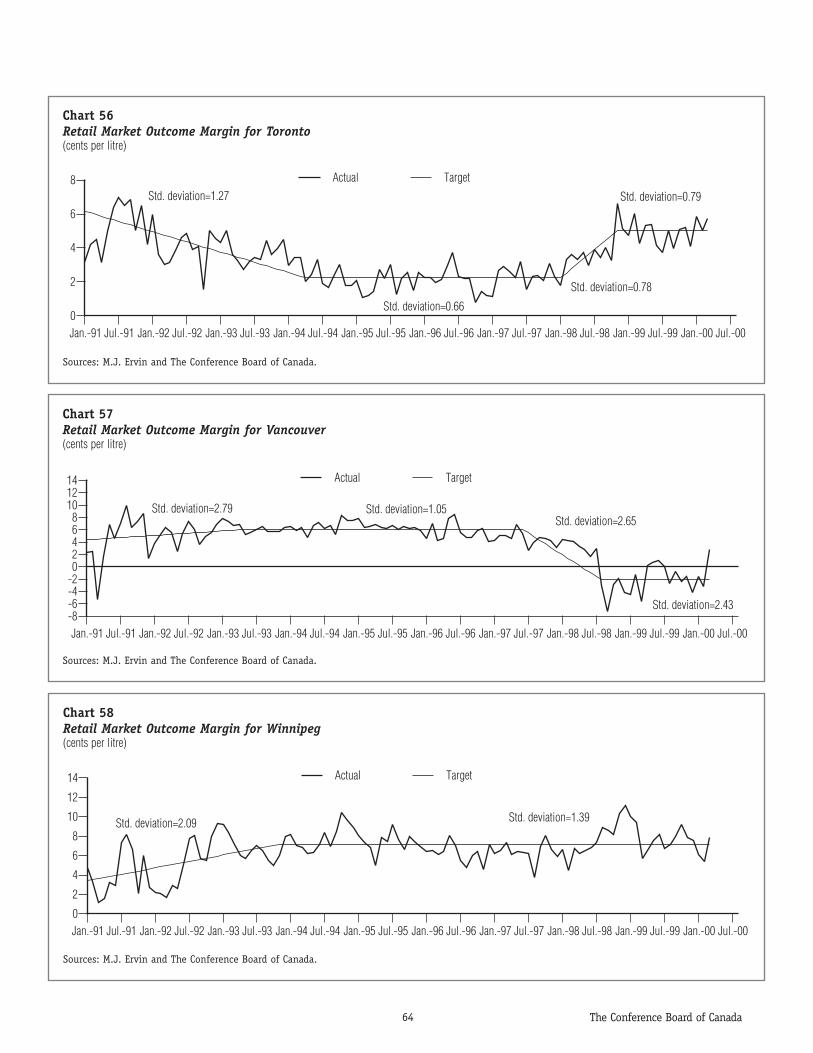
64 The Conference Board of Canada
Chart 56Retail Market Outcome Margin for Toronto(cents per litre)
Sources: M.J. Ervin and The Conference Board of Canada.
Jan.-91 Jul.-91 Jan.-92 Jul.-92 Jan.-93 Jul.-93 Jan.-94 Jul.-94 Jan.-95 Jul.-95 Jan.-96 Jul.-96 Jan.-97 Jul.-97 Jan.-98 Jul.-98 Jan.-99 Jul.-99 Jan.-00 Jul.-000
2
4
6
8 Actual TargetStd. deviation=1.27 Std. deviation=0.79
Std. deviation=0.66
Std. deviation=0.78
Chart 57Retail Market Outcome Margin for Vancouver(cents per litre)
Sources: M.J. Ervin and The Conference Board of Canada.
Jan.-91 Jul.-91 Jan.-92 Jul.-92 Jan.-93 Jul.-93 Jan.-94 Jul.-94 Jan.-95 Jul.-95 Jan.-96 Jul.-96 Jan.-97 Jul.-97 Jan.-98 Jul.-98 Jan.-99 Jul.-99 Jan.-00 Jul.-00-8-6-4-202468
101214 Actual Target
Std. deviation=2.79Std. deviation=2.65
Std. deviation=1.05
Std. deviation=2.43
Chart 58Retail Market Outcome Margin for Winnipeg(cents per litre)
Sources: M.J. Ervin and The Conference Board of Canada.
Jan.-91 Jul.-91 Jan.-92 Jul.-92 Jan.-93 Jul.-93 Jan.-94 Jul.-94 Jan.-95 Jul.-95 Jan.-96 Jul.-96 Jan.-97 Jul.-97 Jan.-98 Jul.-98 Jan.-99 Jul.-99 Jan.-00 Jul.-000
2
4
6
8
10
12
14 Actual Target
Std. deviation=2.09 Std. deviation=1.39

Results
The results of the retail regressions reveal that presentand lagged wholesale prices as well as the error-correctionterm are significant in explaining changes in retail pricesfor the 11 cities. All of the coefficients, including theerror-correction term, have the expected sign. The t-statistics are shown in parentheses.
The passthrough rate for most of the cities is very closeto one. This means that a one cent per litre increase(decrease) in the price of wholesale gasoline leads to aone cent per litre increase (decrease) in the retail priceover the adjustment period. The only exceptions are citieslocated in the Atlantic provinces and Regina, where the
passthrough rates are below 0.90. The adjustment periodis different from city to city. The adjustment is immediatein Calgary, Vancouver and Regina, while it takes approxi-mately a month to adjust in Montreal, Ottawa, QuebecCity, Saint John, Toronto and Winnipeg. Halifax and St.John’s are the only cities that take two months to adjust.
To summarize, a variation in the retail price of gasoline isgenerally explained by the variation in the wholesale price ifdealers in a particular city are operating close to the marketoutcome margin. However, if the margin is above that of themarket outcome, the increase in wholesale prices is not reflectedentirely in the retail price. Conversely, if the margin is belowthat of the market outcome, the increase in retail prices maybe higher than the original change in the wholesale price.
65 The Conference Board of Canada
Table 10Results of the Retail Regressions
Estimated Coefficients
City Period t Period t–1 Period t–2 Sum Market Outcome Margin Adjusted R2
Calgary 0.947 — — 0.947 –0.447 0.457(8.064) (–5.625)
Halifax 0.463 0.278 0.144 0.885 –0.372 0.479(5.561) (3.026) (1.718) (–5.173)
Montreal 0.626 0.410 — 1.036 –0.520 0.647(8.534) (5.086) (–6.302)
Ottawa 0.753 0.213 — 0.996 –0.428 0.703(13.973) (3.798) (–5.439)
Quebec City 0.652 0.269 — 0.921 –0.497 0.525(7.400) (2.927) (–5.938)
Regina 0.835 — — 0.835 –0.624 0.433(6.399) (–6.975)
Saint John 0.406 0.453 — 0.859 –0.254 0.528(5.498) (5.335) (–3.755)
St. John’s 0.362 0.328 0.123 0.813 –0.248 0.452(4.700) (3.859) (1.599) (–4.226)
Toronto 0.865 0.088 — 0.953 –0.675 0.797(18.293) (1.806) (–7.867)
Vancouver 1.096 — — 1.096 –0.664 0.569(1.056) (–7.339)
Winnipeg 0.570 0.368 — 0.938 –0.364(5.359) (3.575) (–4.874) 0.501
Source: The Conference Board of Canada.

Price Asymmetry
Question 4: Do retail prices change asymmetricallywith wholesale price increases?
Price asymmetry in retail gasoline pricing refers to the phenomenon of retail prices responding more strongly to increases in crude oil prices than to decreases. It can be a result of market power or otherreasons, such as inventory management or consumerresponse to changing prices. The model estimated to test for asymmetry was:
∆Rt = β1(∆Wt) + β2(∆Wt x D1),
Where:∆R is the first difference in the retail price, the change in the retail price over a one-month period,
∆W is the first difference in the wholesale price, thechange in the wholesale price over a one-month period, and
D1 is the dummy variable to account for an increase inthe price of wholesale gasoline. It is equal to one if thevariation is positive and to zero if it is not.
The equation regresses the variation in the retail price ona variation of the wholesale price. A dummy variableequal to one is used when wholesale prices increase, anda value of zero is applied when wholesale prices decrease.If asymmetry is present, then the coefficient for thedummy variable should be significant. The estimationsuse OLS on a city-by-city basis with data for the periodfrom January 1991 to March 2000.
Results
The results are shown in Table 11, with the t-statistic in parentheses.
None of the coefficients for the dummy variable aresignificant. The hypothesis of an asymmetric responsepattern is rejected. Retailers appear to have adjustedtheir prices in the same manner for both increases anddecreases in crude oil prices in the 1990s.
Margin Analysis
Question 5: How do average sales volumes affect retailgasoline margins?
The objective of the margin analysis is to explain whycertain cities in Canada have lower margins than others.The factors that should have an impact on retail marginsinclude the previous month’s margin, average throughput,population density by station and average income. Themargin in the previous month obviously has an influenceon the current time period, while average throughput isimportant because a dealer can stay in business with alower margin if the throughput is higher. Populationdensity by station should be significant, since a higherdensity should be associated with more trips to theoutlet. Income could also be an important indicator ofretail margins.
Equations were tested using these variables for all of thecities. It turned out that the average income was not
66 The Conference Board of Canada
Table 11Results of the Asymmetry Regressions
Estimated City coefficient Coefficient Adjusted R2
Calgary 0.946 -0.072 0.297(5.202) (-0.271)
Halifax 0.479 0.117 0.213(3.377) (0.594)
Montreal 0.646 0.117 0.307(4.462) (0.580)
Ottawa 0.736 0.044 0.554(7.644) (0.335)
Quebec City 0.723 -0.049 0.281(4.722) (-0.233)
Regina 0.747 0.075 0.179(3.489) (0.237)
Saint John 0.418 0.149 0.198(3.081) (0.789)
St. John’s 0.426 0.073 0.188(3.242) (0.402)
Toronto 0.824 0.138 0.668(9.575) (1.148)
Vancouver 0.850 0.322 0.363(4.279) (1.219)
Winnipeg 0.771 0.069 0.349(5.415) (0.331)
Source: The Conference Board of Canada.

significant, and to discover this, the following equationwas used:
MRi,t = α + β1MRi,t–1 + β2AVGTi,t + β3DENSi,t,
Where:α is the constant,
MR is the retail margin,
AVGT is the average throughput by station, and
DENS is the population density by station.
The sign and the lagged retail margin should be positive,while the sign on average throughput should be negative.Higher retail margins should be associated with lowerthroughputs. The sign on the average density variableshould also be negative since higher density per stationshould be associated with more consumers using theoutlet to buy ancillary goods. As a result, the dealer in acity with higher density can survive with a lower margin.In other words, density is a proxy for the presence ofother-than-gasoline services and revenues.
The estimation was done by OLS with monthly pooled dataso that random events that may be specific to a certaincity or time period are averaged out. Furthermore, theestimation was done with and without the density variableto ensure that it was not capturing the same effects asvolumes per station. The coefficient on throughput did not change when density was included or excluded so weconclude it is capturing something other than volumes.
Results
Table 12 contains the results obtained from the regres-sion. Once again, the t-statistics are in parentheses below the coefficient.
The coefficients are all significant and have the expectedsigns. Average throughput per station and populationdensity are important factors in explaining the variationin margins from city to city. The fact that the averageincome was insignificant suggests that gasoline is acommodity that people consume, regardless of income.
Long Weekends
Question 6: Do gasoline prices rise before long weekends?
One of the consumers’ biggest complaints is their perceptionthat prices soar immediately before long weekends. Thegeneral public suspects that the industry is taking advantageof consumers by increasing prices at a time when car travel is at its highest. To test for this phenomenon, regressions onweekly data were carried out for a number of different cities.
The equation used to test for price increases before longweekends was:
Ri,t = β1Wi,t + β2Dt,
Where:R is the retail price,
W is the wholesale price, and
D is a dummy variable to account for the long weekends.
The regressions were run using weekly data in order toaccount for the time period prior to long weekends. Avalue of one was assigned to the dummy variable in theweek immediately before the long weekend in May,August, September and October. If retail prices increasebefore long weekends, the dummy variable should be
67 The Conference Board of Canada
Table 12Results of the Margin Analysis
Estimated coefficient Variable
Constant (α) 2.335(8.606)
Retail Margin (MR(–1)) 0.770(41.555)
Average Throughput (AVGT) –3.99E(–6)(–2.549)
Density by Station (DENS) –1.14E(–4)(–1.705)
Adjusted R2 0.668Durbin-Watson 2.163
Source: The Conference Board of Canada.

significant and have a positive sign. Six cities werechosen for the survey: Vancouver, Calgary, Winnipeg,Toronto, Ottawa and Saint John, and the selected timeperiod was the first week in 1997 to the end of May2000. The data for these cities were pooled.
Results
As shown in Table 13, wholesale prices were a significantfactor in explaining weekly retail price movements.However, the dummy variable for long weekends was notsignificant and it had a negative sign. The equation includeda factor to correct for autocorrelation. The t-statistics are in parentheses below the estimated coefficients.
Do the results imply that consumers are mistaken in believingthat gasoline prices increase prior to long weekends? Theanswer is no. The results reveal that prices are just as likelyto go up before any weekend, including long weekends. Thisis in line with the view that dealers attempt many pricerestorations throughout the course of a year and that theyare more likely to take place in the summer months whendemand for gasoline is highest and inventories are low.
Cross-Subsidization
Question 7: Is there cross-subsidization between the upstream and refining sectors and the retail operations of integrated refiner-marketers?
Some of the independent retailers consulted during thestakeholder dialogues claimed that the majors used profits
from the upstream or refinery portion of their business tosubsidize prices at the retail level at their branded stations.They alleged that world crude oil prices hovering aboveCan. $44 (U.S. $30) a barrel make it possible for the majorsto divert revenue from other parts of the business to theirretail operations and squeeze margins in order to placeadditional competitive pressures on independent retailers.
To test for cross-subsidization, two sets of regressionswere run for 11 Canadian cities. The first equation was:
MRi,t = α + β1MRi, t-1 + β2MWi,t,
Where:α is the constant,
MR is the retail margin, and
MW is the wholesale margin.
The second equation estimated was:
MRi,t = α + β1MRi,t–1 + β2CRUDEi,t,
Where:α is the constant,
MR is the retail margin, and
CRUDE is the price of crude oil.
The first equation regressed the retail margin on the whole-sale margin and the retail margin lagged by one month. Thelatter was included to improve the explanatory power of theoverall equation. If cross-subsidization occurred, there shouldbe a negative relationship between wholesale and retailmargins. This would indicate that the majors use revenuefrom high wholesale margins to squeeze retail margins.
If the majors divert revenue from upstream operations to the retail sector, there should be a negative relation-ship between crude oil and the retail margins. The signon crude should then be negative. This is tested in the second equation. Once again, a lagged dependentvariable was used to improve the explanatory power ofthe overall equation.
68 The Conference Board of Canada
Table 13Results of the Long Weekend Analysis
Variable Estimated coefficient
Wholesale (W) 0.841(25.634)
Dummy (D) –0.140(–0.749)
AR(1) 0.677(28.972)
Adjusted R2 0.888Durbin-Watson 2.432
Source: The Conference Board of Canada.

Results
The results of the regressions are shown in the followingtables (the t-statistics are in parentheses below thecoefficients).
In the first equation, while the sign of the coefficientwas negative, it was not significant, indicating thatcross-subsidization cannot be proven to occur in theselected cities.
In the second equation, the sign on crude was bothnegative and significant, indicating that cross-subsidiza-tion occurs. However, the size of the coefficient indicatesthat the cross-subsidization is minuscule. The coefficientof 0.004 implies that a one cent per litre increase in crudeprices leads to a 0.004-cent decrease in retail margins.
Price Volatility
Chart 59 shows the average crude oil, rack and retailgasoline prices in Canada from January 1991 to August2000. The data are monthly averages for the three series.The standard deviations are calculated and shown in thechart. The standard deviation for crude oil is smaller thanfor retail and rack prices, demonstrating that crude oil isthe least volatile of the three. Retail price shows thelargest standard deviation, and thus is the most volatile.
This result as to be expected as retail price is subject to shocks at the crude and rack levels, as well as at thestreet level. However, the standard deviations for retailprices and rack prices are very similar, which indicatesthat variation in rack prices is behind the variation inretail prices.
69 The Conference Board of Canada
Table 14Results of the Cross-Subsidization Analysis(First Equation)
Variable Estimated coefficient
Constant (α) 1.288(6.811)
Wholesale margin (MW) –0.020(–0.923)
Retail margin (MR(–1)) 0.800(47.654)
Adjusted R2 0.648Durbin-Watson 2.176
Source: The Conference Board of Canada.
Table 15Results of the Cross-Subsidization Analysis(Second Equation)
Variable Estimated coefficient
Constant (α) 1.8526.064
Crude oil (CRUDE) –0.004–2.477
Retail margin (MR(–1)) 0.79446.787
Adjusted R2 0.650Durbin-Watson 2.166
Source: The Conference Board of Canada.
Chart 59Average Price of Crude Oil, Rack and Retail (Ex-tax) Gasoline(cents per litre)
Sources: M.J. Ervin.
Jan.-91 Jul.-91 Jan.-92 Jul.-92 Jan.-93 Jul.-93 Jan.-94 Jul.-94 Jan.-95 Jul.-95 Jan.-96 Jul.-96 Jan.-97 Jul.-97 Jan.-98 Jul.-98 Jan.-99 Jul.-99 Jan.-00 Jul.-0005
101520253035404550 Crude oil Rack Retail price (ex-tax)
Crude oil std. deviation=3.79
Rack std. deviation=4.38Retail price std. deviation=4.41

70 The Conference Board of Canada
Many important studies have been carried out onthe Canadian petroleum industry and on specificissues related to gasoline pricing in Canada andabroad. We have used these studies as a back-ground to the current report and have examinedtheir findings and methodological approach inorder to build on their work. Summaries of thesestudies are found in this appendix.
The appendix is divided into four sections:Canadian Studies, American Studies, AsymmetryStudies and Studies on Below-Cost SalesLegislation.
Canadian Studies
Canadian Retail Petroleum Markets StudyM.J. Ervin (1998)
The study by Ervin gives a comprehensiveoverview of the downstream petroleum industryin Canada. The study also includes an analysis of19 markets across Canada. These market studiescompare different regions and key indicators.
Ervin starts by developing a Pump Price/MarginModel to illustrate the relationships between theprice components for a litre of gasoline. For 1996,the average price was 56.8 cents. The componentswere the price of crude oil (19.1 c.p.l.), therefiner margin (5.3 c.p.l.), the freight cost (0.3 c.p.l.), the retail margin (3.5 c.p.l.) and taxes(28.6 c.p.l.). The retail margin of 3.5 c.p.l. mustcover outlet costs, dealer income, supplier costand profitability at the retail level. Using thismodel, Ervin shows that price competition occursat three levels: crude oil, rack and retail. Theprices for these products are determined in acompetitive marketplace, and the margins reflectsupply and demand factors.
Ervin then looks at the structure of the petro-leum industry. In 1995, approximately 16,000
outlets were operating across the country,compared to 22,000 in 1989. Over half of thesestations operated as lessees or independents,meaning that the price was determined at theretail level. Over the years, ancillary revenues,such as convenience stores and car washes,became an important factor because they gaveretailers another source of revenue. Due to thisnew revenue, it was possible for retailers tolower their margins and offer a cheaper product.
The author then examines the historical trendsin gasoline prices. He observes, from 1986 to1995, that the ex-tax pump price declined by 4 c.p.l. while the “tax-included” price increased.From 1991 to 1996, the average tax content rose5 c.p.l. across the country. Since 1991, refinersand retailers have lowered their margins becauseof competition. This decline is a result of, or hasresulted in, improved refinery efficiency, therationalization of retail outlets and an emphasison ancillary revenues.
In Ervin’s analysis of the 19 markets represent-ing different regions across Canada, he foundthe presence of competition in all the markets.He explained the difference in the pump pricebetween larger and smaller centres as the resultof throughput. Larger centres have higherthroughput per outlet, resulting in lower retailmargins compared to smaller centres. An analy-sis of ancillary sales is also included in themarket studies. Ervin finds that, on average in1995, urban outlets experienced a net losswithout ancillary revenues, and that the sale of gasoline alone did not cover operating costs.
With his findings, Ervin concludes that competi-tion exists in the Canadian retail gasoline sector.He observes that the retail and refiner marginshave experienced a downward trend over timeand that lower margins are due to higherthroughput. He also notes that margins are
Review of LiteratureAP
PEND
IX C

small and that taxes are a significant factor in the priceof gasoline. Finally, fluctuations in the pump price can bea reflection of competition in the marketplace.
Retail Gasoline Market Shares: An Analysis of theExperience of Integrated Companies and Independents overthe Decade in Selected Canadian CitiesLoretta Mahoney (1999)
The study by Mahoney analyzes the market share trendsof vertically integrated and non-integrated companies inthe retail gasoline industry. The study covers a 10-yearperiod from 1988 to 1998 and includes 12 Canadiancities: St. John’s, Halifax, Saint John, Charlottetown,Quebec City, Montreal, Ottawa, Toronto, Winnipeg,Regina, Calgary and Vancouver. The study looks at thenumber of outlets, throughputs and market shares by thedifferent types of retailers and also includes an analysisof the retail margin for the same time period.
Mahoney finds that all markets have different character-istics and that there is no uniform trend over the years.Both vertically integrated and non-integrated companiessuffered many reversals over the decade. For example,independents’ market shares varied considerably, rangingfrom nil in Halifax in 1988 to a high of 37 per cent forWinnipeg in 1992. All cities in the study, with the excep-tion of Montreal, Toronto and Ottawa, have seen improve-ment in the market share of independent retailers.
In the early 1990s, the vertically integrated companiesrationalized their service stations, with the four easterncities experiencing the biggest impact as a result. Sincethen, the integrated companies have outperformed(measured by average throughput) the independentretailers, especially in the eastern cities.
The net change in the number of service stations occurs when people rebuild a service station, open a new one, rebrand an existing one or close a station.During their rationalization period, the integrated companies divested themselves of their poorest outlets,many of which were acquired by independents.Rebranding was also a significant activity. Only 4 per cent of changes in the number of service stationsoccurred because of rebuilding.
In the study, Mahoney also looks at the retail margin.The author observes that Quebec City, Montreal andOttawa have suffered the biggest compression of themargin over the decade. For the western markets, marginshave been relatively stable over the 10-year period, whilein Vancouver, a price war that broke out in 1998 basicallyled to a margin of nil.
Wholesale and Retail Competition in the CanadianPetroleum Industry: An Econometric AnalysisAnindya Sen (1999)
In his study, Sen tests whether the presence of independ-ents is associated with lower retail gasoline prices. Hisanalysis is done over a seven-year period (1991 to 1998)and covers 12 Canadian cities (St. John’s, Halifax, SaintJohn, Charlottetown, Montreal, Quebec City, Ottawa,Toronto, Winnipeg, Regina, Calgary and Vancouver). Senpools the data to average out any random event that maybe specific to a particular city or year.
In his analysis, Sen explains two relationships: the rela-tionship between the retail price and the rack price, andthe one between the rack price and the price of crude oil.The first model consists of a regression of the retail priceon the rack price, average throughput per station, aver-age income, population density, concentration indexes forthe different types of retailers, and city and seasonaleffects. The equation is given by:
Ri,t = Ci + β1Wi,t + β2AVGTi,t + β3INCi,t + β4PDENSi,t + β5HERFMi,t
+ β6HERFRi,t + β7HERFIi,t,
where R is the retail price, W is the rack price, AVGT isthe average throughput per station, INC is the averageincome, PDENS is the population density, HERF is theHerfindahl index for the different types of retailers (M: major, R: regional and I: independent) and C is theconstant, which is specific to the city (representing cityfactors). Dummy variables are included in the equation tocapture seasonal effects.
The second model consists of a regression of the rackprice on the price of crude oil, the number of whole-salers, the number of refineries, city factors and seasonalfactors. The equation is given by:
71 The Conference Board of Canada
Wi,t = Ci + β1COi,t + β2COi,t–1 + β3COi,t–2 + β4NWHOLi,t + β5NREFi,t,
where W is the rack price, CO is the price of crude oil,NWHOL is the number of wholesalers, NREF is the numberof refineries and C is the constant, which is specific to the city (representing city factors). Again, dummyvariables are included to model the seasonal factors.
With his analysis, Sen finds a positive correlationbetween the market concentration indexes and the retailprice of gasoline. From this result, he concludes thatindependents do not have a significant impact on retailprices. Also, he finds a positive correlation between therack price and the retail price, but the coefficient is lessthan one. This result suggests that a price increase inwholesale gasoline is not completely passed on to con-sumers. Sen also concludes that the average throughputper station has a negative impact on the retail price.Finally, from his second model, Sen links crude oil pricesto rack prices and observes that a one cent per litreincrease is completely passed on to the wholesale price.
Evaluation of the Six Residents’ Allegation of Price-Fixingin the Canadian Petroleum IndustryDr. George Lermer (1996)
The Lermer study is a response to the allegation, made bysix residents, of price fixing in the gasoline industry inApril 1996. After analyzing in detail the relationshipbetween retail and wholesale prices and crude oil pricesand also refiner-marketer profitability, Lermer cannotconfirm the presence of anti-competitive behaviour.
Lermer analyzes three major refiner-marketers’ segmenteddownstream financial accounts. From this, he concludesthat the increased profit levels were realized by reducingoperating costs and expanding heating oil sales over theprevious winter. The upward spike in retail gasolineprices—as well as in margins—during April 1996 waspresent in almost all Canadian urban centres, but isconsistent with previous years.
The six residents who made the complaint also describedthe presence of an asymmetric response to the price ofretail gasoline from a variation in crude oil cost. Lermertests this hypothesis by first applying a symmetric model
to link the retail and wholesale prices to that of crudeoil. He finds that the retail and wholesale prices respondvery quickly to the price of crude oil in larger centressuch as Toronto, Montreal and Vancouver. For smallercommunities, such as Regina, Charlottetown, Saint John,St. John’s and Halifax, the response takes more time. Theauthor then tests an asymmetric response model and findsmodest asymmetry, but the implication of the change isnegligible. Lermer observes that the Canadian wholesaleprice very closely tracks that of the United States andconcludes that refiners in Canada do not have significantinfluence on rack prices. Also, the decline of the retailmargin over time demonstrates that there is no presenceor undue influence of market power at the retail level.
The first model estimated by the author consists of aregression of the retail price on the one-period lag, theprice of crude oil and a time trend. The regression equa-tion is given by:
REGEXCITYt = C + β1REGEXCITYt–1 + β2EDCPARWEDSt + β3TRENDt,
where REGEXCITY is the ex-tax pump price of regulargasoline for a particular city, EDCPARWEDS is the price ofcrude oil on Wednesdays in Edmonton, TREND is a timetrend and C is the constant. The estimation is done on a weekly basis for the following cities: Vancouver,Edmonton, Calgary, Regina, Winnipeg, Toronto, Ottawa,Montreal, Quebec City, Saint John, Charlottetown, Halifaxand St. John’s.
The second model consists of a regression of the rackprice on the one-period lag, the price of crude oil and atime trend. The equation is given by:
RACKCITYt = C + β1RACKCITYt–1 + β2EDCPARt + β3TRENDt,
where RACKCITY is the rack price for the particular city,EDCPAR is the price of crude oil in Edmonton, TREND is a time trend and C is the constant. The estimations aredone on the same cities as the first model.
From these regressions, Lermer observes a downwardtrend in the retail and wholesale price of gasoline andnotes the importance to consumers. Since there is notrend in the price of crude oil, this means that the
72 The Conference Board of Canada

refiner-marketer margin has been declining over time.The decline in margins has been occurring since 1987 inurban markets and has forced the rationalization ofrefinery operations and the downsizing of service sta-tions. Competing U.S. supply sources, service stationover-capacity and excess refinery capacity has inducedthe rationalization. The downward trend in the retailmargin was examined for Vancouver, Edmonton, Calgary,Winnipeg, Toronto, Ottawa, Montreal, Quebec City, SaintJohn, Charlottetown, Halifax and St. John’s. Regina is theonly exception.
Lermer concludes that Canadian wholesale gasoline pricesclosely track U.S. wholesale prices. He also finds thatretail gasoline margins over the wholesale price are lowbecause of refinery and service station over-capacity.Another conclusion is that the downward trend in theretail margin confirms that the gasoline industry is intransition. The industry will continue to rationalize thenumber of service stations until they reach a stablemarket equilibrium. When this equilibrium is reached, the downward trend will disappear.
Analysis and Opinion on Retail Gas InquiryKen Hendricks (1996)
Hendricks’ study is also a response to the six residents’allegation that the integrated oil companies were fixingprices. The goal of the study is to look into three issues:• Measuring the response pattern and adjustment time
for a variation in crude oil prices to be passed throughto the wholesale and retail price of gasoline.
• Determining whether the response patterns are thesame for an increase in crude oil prices as they are for a decrease.
• Comparing response patterns for different Canadian cities.
To look at these three issues, Hendricks uses two types ofmodel: a model with a symmetric response pattern andone with the possibility of an asymmetric response pat-tern. Both models are based on the Borenstein, Cameronand Gilbert (1997) Error-Correction Model (cited below).The first model is:
∆Rt = ∑i=0
m
βi∆Ct–i + ∑i=1
m
θi∆Rt–i + γ (εt–s),
where ∆R is the first difference in the retail price, ∆C isthe first difference in the price of crude oil and εt–s is theerror-correction term. The estimation was done usingweekly data from April 2, 1991, to June 25, 1996. Thecities included in the study are Calgary, Halifax,Montreal, Regina, Toronto and Vancouver.
Hendricks finds that an unanticipated change in theprice of crude oil is completely passed through to theretail price in every city except Regina. The adjustmentperiod varies between cities. For Montreal and Toronto,it takes approximately five to seven weeks for a varia-
tion in the price of crude oil to be passed through to the retail price. The other cities take longer for theadjustment.
The second model tests for asymmetry. The approach isthe same as Borenstein, Cameron and Gilbert (1997). Themodel estimated is:
∆Rt = ∑i=0
m
(βi+ ∆C +
t–i + βi-∆C -
t–i) + ∑i=1
m
(θ +i ∆R +
t–i + θi- ∆R -
t–i) + γ (εt–s),
where ∆R is the first difference in the price of retail, ∆C is the first difference of cost and εt–s is the error-correction term. If the coefficients β+ and β- are equal,then the adjustment pattern is symmetric. If the coeffi-cients β+ and β- are not equal, then the adjustmentpattern is asymmetric. The author finds that responsepatterns are the same for an increase in crude oil pricesas they are for a decrease. The possible exception isVancouver, where the passthrough rate seems faster foran increase than for a decrease.
American Studies
Assessment of Summer 1997 Motor Gasoline Price IncreaseEnergy Information Administration (1998)
In the spring of 1997, retail gasoline prices increased as they usually do at the beginning of the driving season. But 1997 differed from the previous years. For example, at the same time the previous year, there was a sharp increase in the retail price, mainly due to an increase in the price of crude oil. After a year, crude oil prices fell and brought down the retailprice along with them.
73 The Conference Board of Canada

In August 1997, the price of retail gasoline rose by sevencents or more a gallon. There were many reasons behindthe increase, notably an unexpected rise in demand inJuly. Refinery problems in the United States and abroadin late July and August restrained supply, and inventoriesplummeted to their lowest point since 1981. Because ofthe increase in supply and demand problems, the NewYork harbour spot price increased 20 c.p.l. in Augustcompared to July. Retail prices soon followed and did not start to drop until Labour Day, which represents the end of the driving season.
In the report, the authors look at the supply and demandforces behind the 1997 summer increase in gasoline prices.They also analyze gasoline markets on the West Coast, produc-tion capacity within the United States, gasoline imports, therelationships between prices at different levels of the gasolineindustry and the behaviour of the futures markets.
Price Changes in the Gasoline Market: Are MidwesternGasoline Prices Downward Sticky?Energy Information Administration (EIA)(1999)
The authors look at what is sometimes referred to as“downward sticky prices.” Using weekly data fromOctober 1992 through June 1998, their report looks atprice asymmetry in the Midwest of the United States.
Using EIA data, the authors show that retail gasolineprices appear asymmetric. Their examination of priceasymmetry considers the speed and degree of adjustmentof the retail gasoline price to a variation in the prices ofwholesale gasoline and crude oil, and the wholesale priceto the crude oil price. The report discusses two types ofasymmetry: amount asymmetry and pattern asymmetry.Amount asymmetry is the magnitude of change in theretail price occurring from a variation in wholesale orcrude oil prices. Pattern asymmetry treats the rate ofadjustment occurring from a variation in cost.
The authors show that wholesale and retail prices in theMidwest have a symmetric response to a variation incrude oil. They also found that retail gasoline pricesoften rise faster than they fall when a variation in thewholesale price occurs. They conclude that pattern asym-metry is present, but that amount asymmetry is not. The
reason is that the pass-through seems to be completewhether it is for an increase or a decrease in the whole-sale price. They mention that the pattern asymmetrymight be only a statistical artifact because retail pricescontinue to rise even after a decline in the wholesaleprice of gasoline.
Asymmetry Studies
The section reviews the literature that looks at asymmet-ric response in price to variation in costs. There is anEnglish study by Bacon (1991) and a German one byKirchgässner and Kübler (1992). Karrenbrock (1991);Duffy-Deno (1996); Borenstein, Cameron and Gilbert(1997); and Godby, Lintner, Stengos and Wandschneider(2000) look at the United States. The study by Hendricks(cited previously) also deals with asymmetry.
Rockets and Feathers: The Asymmetric Speed of Adjustmentof U.K. Retail Gasoline Prices to Cost ChangeBacon (1991)
Bacon studied the retail gasoline market for London,England. The wholesale market located in Rotterdam wassupplying the retailers. The study uses biweekly datafrom June 15, 1982, to January 19, 1990. To test for anasymmetric response pattern, Bacon uses the followingQuadratic Partial Adjustment Model:
Rt = Rt–1 + β(a + b(t) + Ct–1 – Rt–1) + α(a + b(t) + Ct–1 – Rt–1)2,
where R is the price of retail gasoline, C the price ofcrude oil and t is a time trend. If the coefficient a isequal to zero, then the response pattern for the retailprice is symmetric. If the coefficient is above zero, theretail price adjusts more quickly to an increase in cost. Ifthe coefficient is below zero, the retail price adjusts morequickly to a decrease in cost. Bacon finds that the coeffi-cient a is above zero, thus concluding that an asymmetricresponse pattern exists in London, England.
Symmetric or Asymmetric Price Adjustments in the OilMarket: An Empirical Analysis of the Relations BetweenInternational and Domestic Prices in the Federal Republicof Germany, 1972–89Kirchgässner and Kübler (1992)
74 The Conference Board of Canada

Kirchgässner and Kübler test for asymmetry using anerror-correction model. They analyze the relationshipbetween retail and wholesale prices for Germany. Theyuse monthly data and test for two sub-periods: the 1970sand the 1980s. They find that the retail price respondsfaster to a decrease in the price of wholesale rather thanan increase for the 1970s. They also find a symmetricadjustment pattern for the 1980s.
The Behavior of Retail Gasoline Prices: Symmetric or Not?Karrenbrock (1991)
Karrenbrock looks at the U.S. market for the 1980s. Hetests for price asymmetry between the retail and whole-sale levels using monthly data. The model he uses issimilar to that used by Borenstein, Cameron and Gilbert,except that he does not include an error-correction term.Karrenbrock concludes that an asymmetric adjustmentpattern exists between the price of retail and wholesalegasoline. The retail price responds faster to an increase inthe wholesale price than to a decrease.
Retail Price Asymmetries in Local Gasoline MarketsDuffy-Deno (1996)
Duffy-Deno studied the retail gasoline market for SaltLake City from 1989 to 1993. Using a model similar tothat used by Karrenbrock, he tests for the presence ofasymmetry with weekly data. He finds that retail pricesrespond faster to an increase in the price of wholesalethan to a decrease.
Do Gasoline Prices Respond Asymmetrically to Crude OilPrice Changes?Borenstein, Cameron and Gilbert (1997)
Borenstein, Cameron and Gilbert test for price asymmetryat three different levels: between retail and crude, retailand wholesale, and wholesale and crude. Their studyconsists of monthly data ranging from 1986 to 1992 forthe eastern United States. For their estimation, they usean Error-Correction Model:
∆Rt = ∑i=0
n
(β +i ∆C +
t–i + βi-∆Ct–i
-) + ∑i=1
n
(γi+ ∆R +
t–i + γi- ∆R -
t–i)
+ θ1(Rt–1 + ϕ0 – ϕ1Ct–1),
where ∆R is the first difference in the price, ∆C is the firstdifference of cost and (R – ϕ0 – ϕ1C) is the error-correctionterm. If the coefficients β+ and β- are equal, then theadjustment pattern is symmetric. If the coefficients β+
and β- are not equal, then the adjustment pattern isasymmetric. The authors find the presence of asymmetryat all three levels, with the relationship between whole-sale and crude oil being the most important.
Testing for Asymmetric Pricing in the Canadian RetailGasoline MarketGodby, Lintner, Stengos and Wandschneider (2000)
Godby, Lintner, Stengos and Wandschneider consider adifferent approach to testing for an asymmetric responsepattern. Using weekly data, they test for asymmetrybetween retail prices and crude oil prices for the periodfrom 1990 to 1996. They estimate a threshold model. Thelevel of the threshold can be estimated instead of imposingit equal to zero. The following equations are estimated:
∆Rt,i = α0 + α1Zt–1,i + ∑k=0
n
(βk ∆Ct–k,i),qi <φ
∆Rt,i = α0 + α1Zt–1,i + ∑k=0
n
(βk ∆Ct–k,i),qi ≥φ,
where i indicates the city, t the time and Z is an error-correction term. Several variables for the threshold wereused. An example is qi = ∆C and φ might not be equal tozero, which is imposed by the other studies. If the esti-mated coefficients are equal in both equations, then theadjustment pattern is symmetric, otherwise it is asym-metric. The authors did not find the presence of anasymmetric response pattern.
Studies on Below-Cost Sales Legislation
Predatory Pricing and State Below-Cost Sales Statutes inthe United States: An AnalysisTerry Calvani (1999)
Calvani analyses the U.S. treatment of predatory pricing,including below-cost sales laws, with particular attentionto gasoline markets. Calvani concludes that consumerspay higher prices in markets with gasoline below-cost
75 The Conference Board of Canada

sales laws. The author also shows that independentretailers are not better off.
The Impact of Sales-Below-Cost Laws on the U.S. RetailGasoline MarketRonald N. Johnson (1999)
Johnson’s study examines whether Sales-Below-Cost lawshave significantly altered the number and structure of
retail gasoline outlets in states that have adopted theselaws. Johnson’s empirical analysis indicates that neithergeneral nor motor-fuel Sales-Below-Cost laws have had a large and significant impact on the number orcomposition of the retail gasoline outlets. His results also show that divorcement and bans on self-service have not stemmed the decline in, nor composition of,retail outlets.
76 The Conference Board of Canada

77 The Conference Board of Canada
Organizations
5th Wheel Truck Stops—John Dunstill
Alimentation Couche-Tard Inc.—Stéphane Maher, Directeur des opérations pétrolières
Association Québécoise des Indépendants du Pétrole (AQUIP)—René Blouin, Président-directeurgénéral; Sonia Marcotte, Directrice des Affaires économiques et juridiques
Canadian Automobile Association (National)—Elly Meister, V.P., Public Affairs andCommunications
Canadian Automobile Association (Quebec)—Claire Roy, Director, Public Affairs
Canadian Consumers Association—Dr. Peter Dyne, Michel Bourassa
Canadian Federation of Independent Business (Atlantic Canada)—Peter O’Brien, responsible forAtlantic Canada
Canadian Federation of Independent Business (Quebec)—Sylvie Ratté, Pierre Cléroux
Canadian Petroleum Products Institute (CPPI)—Alain Perez, William Simpkins, Bob Clapp, RonHarper, Jack Belletrutti
Canadian Tire Corporation Ltd.—Eymbert Vaandering, Vice-President, Petroleum
CANGO Inc.—David Armstrong, President
Chevron—Bob Innes
Consumer Group for Fair Gasoline Prices—Dennis O’Keefe
Domo Gasoline Corporation Ltd.—Bruce Chwantacky
Federated Co-op Fuels Ltd.—Al Robinson, Senior Vice-President, Corporate Affairs
Gra-Ham Energy—Rick Hammond
Husky—Chulk Sardow
Imperial Oil—Jim Hughes, Manager, Corporate Planning Dept., Energy Analysis; Margaret Kelsch,Marketing Services Manager, Automotive Division
Independent Retail Gasoline Marketers Association of Canada (IRGMA)—Manju Sekri, ExecutiveV.P., Michael Budd, Donald Green
Irving Oil Limited—Kyle Logan
MacEwen Petroleum Inc.—Allan MacEwen, President
Mr. Gas—André Gagnon, Director
NORCAN—Gary Garson
Nova Scotia Retail Gasoline Dealers Association—Graham Conrad
Ontario Fuel Dealers Association—Randy Turner, President
List of Stakeholders ConsultedAP
PEND
IX D

Options Consommateurs—Yannick Vennes
Parkland Industries—Jack Donald, President and CEO; Jim Jones, Vice President, Marketing, Fas Gas Oil Ltd.; BradleyWilliams, Manager, Race Track Fuels Ltd.; John Schroeder, Vice President, Finance
PEI Petroleum Marketers Association—Mike Hennessey, President; Howard Bowie
Petro-Canada—Steven Keith, Manager, Pricing Relations; Tom Lawson, National Pricing Manager; Donna Hildebrant,Manager, Communications Downstream; Michel Roy, Manager, Engineering Services, Montreal Refinery
Pétroles Crevier Inc.—Pierre Crevier, Président
Pétroles Therrien Inc.—Serge Therrien, Directeur général
Pioneer Petroleum—Tim Hogarth, Jack Theriault
Robbins Fuels—Colin Robbins, President
Shell Canada—Paul Lapensée, Vice-President, Quebec and Atlantic Markets
Sunoco—Kathy Crooks, Director, Fuel Sales
Ultramar—Louis Forget
United Petroleum Products—Chuck Husel, President
Wilson’s Fuel—Dave Collins
Individuals
Glenn Bradbury, Legislative Assistance to Dan McTeague
Dan McTeague, M.P., Pickering–Ajax–Uxbridge
Barry Bower, Ministry of Energy, Science and Technology, The Government of Ontario
Spencer Knipping, Ministry of Energy, Science and Technology, The Government of Ontario
Barry Lynch, National Energy Board
Jean-Thomas Bernard, Professor, Laval University
Joseph Doucet, Professor, Laval University
Mondher BenHassine, Senior Analyst, Oil Transportation, Energy Resources Branch, Natural Resources Canada
Doug Rollins, Former service station owner
Giorgio Grappolini, Refinery Specialist, Industry Canada
The research team also appreciates the input of numerous service station operators and employees as well as Canadianconsumers who spoke of their experiences with the gasoline industry.
The input of all of the above was instrumental in completing this report.
78 The Conference Board of Canada


255 Smyth Road, Ottawa, ON, K1H 8M7 Canada • Tel. (613) 526-3280 Fax (613) 526-4857Internet http://www.conferenceboard.ca