chemicals. - diabetesdiabetes.diabetesjournals.org/content/suppl/2014/11/23/db14-0979... ·...
TRANSCRIPT
SUPPLEMENTARY DATA
©2014 American Diabetes Association. Published online at http://diabetes.diabetesjournals.org/lookup/suppl/doi:10.2337/db14-0979/-/DC1
Chemicals. Antibodies were from Santa Cruz Biotechnology (Santa Cruz, CA, USA), Sigma Aldrich (St. Louis, MO, USA), Cell Signaling (Boston, MA, USA) and Cayman Chemical (Ann Arbor, MI, USA). Reagents were from Roche Diagnostics (Mannheim, Germany) or Sigma Chemical Co. DFU (5,5-dimethyl-3(3-fluorophenyl)-4-(4-methylsulfonyl) phenyl-2(5H)-furanone) was from Merck (Rahway, NJ). Human Regular Insulin (Actrapid) was from Novo Nordisk Pharma S.A (Madrid, Spain). Reagents for electrophoresis were obtained from Bio-Rad (Hercules, CA, USA). Tissue culture dishes were from Falcon (Becton Dickinson Labware, Franklin Lakes, NJ, USA). Tissue culture media were from Gibco (InvitrogenTM, Grand Island, NY, USA). Cell culture. The human liver cell line CCL-13 (Chang liver, CHL), an immortalized non-tumour cell line derived from normal liver, was purchased from the American Type Culture Collection (Manassas, VA). Cells were grown on Falcon tissue culture dishes in DMEM supplemented with 10% fetal bovine serum (FBS) and antibiotics (50 g each of penicillin, streptomycin and gentamicin per ml) at 37ºC in a humidified air 5% CO2 enriched atmosphere. Primary culture of adult hepatocytes. Hepatocytes were isolated from non-fasting male Wt and hCOX-2-Tg mice by perfusion with collagenase (1). Cells were plated in 6-cm dishes and cultured in William’s E medium supplemented with 20 ng/ml EGF, 100 U/ml penicillin, 100 µg/ml streptomycin and 10% FBS for 48 h. Cells were serum starved for 4 h and further stimulated with 1 or 10 nM insulin for 15 min. Brown adipocyte isolation and culture. Brown fat precursor cells were isolated from the interscapular brown adipose tissue (BAT) of 20 day-old wild-type mice, as described (2). The process involved successive collagenase digestion, separation of mature adipocytes by flotation and subsequent filtration through 25 μm silk filters, obtaining precursor cells by centrifugation. The precursor cells obtained from a pool of 10 mice were cultured in Dulbecco's modified Eagle's medium (DMEM) supplemented with 3.5 nM insulin, 10 mM Hepes, 50 IU penicillin/ml, 50 μg streptomycin/ml, 25 μM sodium ascorbate and 10% newborn calf serum (NCS) at 37°C in an atmosphere of 5% CO2 in air with 95% humidity. Once 80% confluence was reached, cells were stimulated with 1 M PGE2, 1 µM noradrenaline (NA) for 24 h and UCP-1 expression was analyzed by Western blot. Characterization of COX-2 vectors. pPyCAGIP was kindly provided by Dr. I. Chambers (University of Edinburgh, Edinburgh, Scotland). Human COX-2 ORF was amplified by PCR from human full-length COX-2 cDNA cloned into pcDNA1/Amp, a gift from Dr S Prescott (Huntsman Cancer Institute, Salk lake City, UT, USA). The PCR product was cloned into the XhoI-NotI restriction site of pPyCAGIP vector. The orientation and integrity of the constructs were determined by sequencing. Generation of stable hCOX2 cells. Immortalized cell lines were obtained from Wt (NCL-V) and hCOX-2-Tg (NCL-C) liver by infection with Large T antigen from SV40 virus. To do this, primary hepatocytes from neonates (3-5 days old) (NCL cells) were obtained from Wt and hCOX-2-Tg liver, submitted to collagenase dispersion and cultured as described previously (1). Primary hepatocytes were infected with polybrene-supplemented virus for 48 h and maintained in culture medium for 72 h, before selection with puromycin for 3 weeks. Then, immortalized cell lines were generated and further cultured for 15 days with arginine-free medium

SUPPLEMENTARY DATA
©2014 American Diabetes Association. Published online at http://diabetes.diabetesjournals.org/lookup/suppl/doi:10.2337/db14-0979/-/DC1
supplemented with 10% FBS to avoid growth of non-parenchymal cells. The cells thus generated had hepatocyte phenotype as demonstrated by the expression of albumin, carbamoyl phosphate synthase and cytokeratine 18 (3). For plasmid transfections, CHL cells at 70% confluence were exposed for 6-16 h to Lipofectamine reagent containing pPyCAGIP-hCOX-2 or control vector pPyCAGIP. At the end of this period, the transfection media was replaced with fresh medium containing 10% FBS, and on the second day after transfection the cells were treated with medium supplemented with 3 μg/ml puromycin. Single colonies of resistant cells were detectable after 15 days and were selected and subcultured for 30 days. Subsequent cultures of selected cells were grown in the presence of puromycin. Cells stably transfected with hCOX-2 or empty vectors were termed CHL-C and CHL-V, respectively. Different clones were tested with similar COX-2 expression. Palmitate-induced insulin resistance in hepatocytes. CHL and NCL cells were seeded in a 6-well plate (3x10⁵ cells/well) at 70% confluence. After 24 h, the cells were cultured in 2% FBS and 1% BSA for 4 h, and subsequently treated with palmitate (600 µM) for 16 h. After 4 h of serum-starving, 1 or 10 nM insulin was added for 15 min and then cells were collected to analyze insulin signaling. Fatty acid measurements. To identify and measure the mobile fatty acid ex vivo, 1H spectra were performed on Bruker Avance 11.7 Tesla Spectrometer (Bruker BioSpin, Karlsruhe, Germany) equipped with a 4 mm triple channel 1H/13C/31P HR-MAS (High Resolution Magic Angle Spinning) resonance probe. Samples (15 mg) were introduced into 50 µl zirconia rotor with 50 µl D2O and spun at 5000 Hz at 4ªC. All spectra were analyzed using the MestRecnova software (Mestrelab Research S.L.) and the assignments were in agreement with the literature. The profile of saturated fatty acids spectra was analyzed according to the mobility of each chemical group. Six signals resonating at 0.90 [terminal methyls], 1.30 [methylenes] 1.58 [β-methylenes], 2.05 [mono-allylic methylenes] and 2.30 [α-methylenes] ppm indicate the presence of saturated fatty acids chains (4). This assay was realized at the Service of Imaging and Spectroscopy by high-field magnetic resonance (http://www.siermac.es). Determination of metabolites, cytokines and hormones. PGE2 was determined in liver tissue by specific immunoassay (Arbor Assays, Ann Arbor, MI, USA). Blood glucose levels were measured with an Accu-Check Glucometer (Roche). Transaminases ALT and AST were assayed spectrophotometrically in plasma with specific kits from BioSystem (BioSystems SA., Barcelona, Spain). Triglycerides, cholesterol and non-esterified free fatty acids (NEFAs) were determined in plasma and liver by enzymatic methods with specific kits from BioSystems and Wako (Wako Chemicals GmbH, Neuss, Germany). Cytokines mRNA levels were measured in liver by q-PCR. Plasma insulin, leptin and adiponectin levels were determined by ELISA kits (Millipore, Billerica, MA, USA) following manual instructions. Protein levels were determined with Bradford reagent (Bio-Rad). RNA isolation. Total RNA of liver, eWAT, iWAT and BAT was extracted by using TRIzol reagent (Invitrogen, Carlsbad, CA). Total RNA (1µg) was reverse transcribed using a Transcriptor First Strand cDNA Synthesis Kit following manufacturer’s indications (Roche).

SUPPLEMENTARY DATA
©2014 American Diabetes Association. Published online at http://diabetes.diabetesjournals.org/lookup/suppl/doi:10.2337/db14-0979/-/DC1
Quantitative real-time PCR analysis. qPCR was performed with a MyiQ Real-Time PCR System (Bio-Rad) sequence detector using the SsoFast EvaGreen Polymerase method (Bio-Rad) and d(N)6 random hexamer with the following primers:
Gene Name Sequence Acaca FP: 5' -TGGAGCTAAACCAGCACTCCCGA- 3' RP: 5' -GCTGGATCTCATGTGAAAGGCCAA- 3' Acox1 FP: 5' -TCGAAGCCAGCGTTACGAG- 3' RP: 5' -GGTCTGCGATGCCAAATTCC- 3' Cd36 FP: 5' -AGATGACGTGGCAAAGAACAG- 3' RP: 5' -CCTTGGCTAGATAACGAACTCTG- 3' Cpt1a FP: 5' -TCAATCGGACCCTAGACACC- 3' RP: 5' -CTTTCGACCCGAGAAGACCT- 3' Fasn FP: 5' -TCGGCGGGTCTATGCCACGA- 3' RP: 5' -GTCACCCACCTTGGTGCCCG- 3' Il1b FP: 5' -AGAAGCTGTGGCAGCTACCTG- 3' RP: 5' -GGAAAAGAAGGTGCTCATGTCC- 3' Il6 FP: 5' -GAGGATACCACTCCCAACAGACC- 3' RP: 5' -AAGTGCATCATCGTTGTTCATACA- 3' Lipc FP: 5' -CCCTGGCATACCAGCACTAC- 3' RP: 5' -CTCCGAGAAAACTTCGCAGATT- 3' Lipe FP: 5' -CCAGCCTGAGGGCTTACTG- 3' RP: 5' -CTCCATTGACTGTGACATCTCG- 3' Pnpla2 FP: 5' -CAACGCCACTCACATCTACGG- 3' RP: 5' -GGACACCTCAATAATGTTGGCAC- 3'Ppara FP: 5' -AGAGCCCCATCTGTCCTCTC- 3' RP: 5' -ACTGGTAGTCTGCAAAACCAAA- 3' Pparg FP: 5' -TCGCTGATGCACTGCCTATG- 3' RP: 5' - GAGAGGTCCACAGAGCTGATT - 3 Ppargc1a FP: 5' -AAGTGTGGAACTCTCTGGAACTG- 3' RP: 5' -GGGTTATCTTGGTTGGCTTTATG- 3' Scd1 FP: 5' -TTCTTGCGATACACTCTGGTGC- 3' RP: 5' -CGGGATTGAATGTTCTTGTCGT- 3' Tnfa FP: 5' -CATCTTCTCAAAATTCGAGTGACAA- 3' RP: 5' -TGGGAGTAGACAAGGTACAACCC- 3' Ucp1 FP: 5' -TTCAGGGAGAGAAACACCTGC- 3' RP: 5' -TTCACGACCTCTGTAGGCTG- 3' Dio2 FP: 5' -GCTTACGGGGTAGCCTTTGA- 3' RP: 5' -CCAGCCAACTTCGGACTTCT- 3' Prdm16 FP: 5' -GGCCCAGCACTTGGAATTTG- 3' RP: 5' -GGCAATGCAGAGTAGAGGCA- 3' Adiponectin FP: 5' -GTTCCCAATGTACCCATTCGC- 3' RP: 5' -TGTTGCAGTAGAACTTGCCAG- 3'
SUPPLEMENTARY DATA
©2014 American Diabetes Association. Published online at http://diabetes.diabetesjournals.org/lookup/suppl/doi:10.2337/db14-0979/-/DC1
Leptin FP: 5' -GAGACCCCTGTGTCGGTTC- 3' RP: 5' -CTGCGTGTGTGAAATGTCATTG- 3' Resistin FP: 5' -ACAAGACTTCAACTCCCTGTTTC- 3' RP: 5' -TTTCTTCACGAATGTCCCACG- 3' hcox2 FP: 5' -CGCAGTACAGAAAGTATCACAGGC- 3' RP: 5' -GCGTTTGCGGTACTCATTAAAA- 3' mPtges FP: 5' -GCCTTTCTGCTCTGCAGCACACT- 3' RP: 5' -TCGGGGTTGGCAAAAGCCTTC- 3' Bcl2 FP: 5' -GGAGGCTGGGATGCCTTTGT- 3' RP: 5' -ACTTGTGGCCCAGGTATGC- 3' CyclinD1 FP: 5' - GCGTGCAGAAGGAGATTGTGCCA- 3' RP: 5' - GCACTTCTGCTCCTCACAGACCTCC- 3'
Specific primers were purchased from Invitrogen. PCR thermocycling parameters were 95°C for 30 s, 40 cycles of 95°C for 5 s, and 60°C for 10 s. Each sample was run in triplicate and was normalized to 36b4 RNA. The replicates were then averaged, and fold induction was determined in a ∆∆Ct based fold-change calculations. Histochemistry analysis. Samples of liver and adipose tissue were fixed in 4% buffered formalin for paraffin preparation. Paraffin-embedded liver tissue and eWAT were used for H&E (5). Western blot analysis. Extracts from tissue samples (50-100mg) or cells (2-3x10⁶) were obtained as previously described (6). For Western blot analysis, whole-cell extracts were boiled for 5 minutes in Laemmli sample buffer, and equal amounts of protein (20-30 g) were separated by 10-15% SDS-polyacrylamide electrophoresis gel (SDS-PAGE). The relative amounts of each protein were determined with the following polyclonal or monoclonal antibodies:
Antibody Manufacturer Cat No. β-actin Santa Cruz Biotechnology A5441 p-Akt (Ser473) Cell Signaling Technology 4060 Akt Cell Signaling Technology 9272 p-AMPK (Thr 172) Cell Signaling Technology 2535S AMPK Cell Signaling Technology 2532S COX-2 Cayman Chemical 160107 p-IR (Tyr1158/1162/1163) Merck Millipore 07-841 IR Santa Cruz Biotechnology 3020 PTP1B Merck Millipore 07-088 UCP-1 Abcam ab10983
After incubation with the corresponding anti-rabbit or anti-mouse horseradish peroxidase conjugated secondary antibody, blots were developed by the ECL protocol (Amersham). Target protein band densities were normalized with -actin. The blots were revealed, and different exposition times were performed for each blot with a charged coupling device camera in a luminescent image analyzer (Gel-

SUPPLEMENTARY DATA
©2014 American Diabetes Association. Published online at http://diabetes.diabetesjournals.org/lookup/suppl/doi:10.2337/db14-0979/-/DC1
Doc, Bio-Rad) to ensure the linearity of the band intensities. Densitometric analysis was expressed in arbitrary units. 1- Martin-Sanz P. Br. J. Pharmacol. 125:1313, 1998 2- Garcia B. Biochim Biophys Acta. 1821:1309-15, 2012. 3- Valverde AM. Diabetes 52:2239, 2003 4- Righi V. Oncol. Rep. 22:1493, 2009 5- Llorente-Izquierdo C. Am J Pathol 178: 1361-73, 2011 6- Casado M. Hepatology 45:631, 2007.

SUPPLEMENTARY DATA
©2014 American Diabetes Association. Published online at http://diabetes.diabetesjournals.org/lookup/suppl/doi:10.2337/db14-0979/-/DC1
Supplementary Figure 1. hCOX-2-Tg mice exhibit an increased insulin sensitivity and glucose tolerance. Human COX-2 protein was only detected in hCOX-2-Tg mice and, consistently, intrahepatic PGE2 levels were threefold higher compared with Wt mice. (A) Representative Western blot showing human COX-2 expression in liver homogenates from Wt and hCOX-2-Tg animals using -actin as load control. (B) Intra-hepatic PGE2 levels were determined by ELISA in liver homogenates of Wt and hCOX-2-Tg mice. Values are the means ± S.E. of four animals per condition. (C) Body weight curve of Wt and hCOX-2-Tg mice fed a RCD expressed as % to basal weight. Data are expressed as means ± S.E. (n=5 per group). (D) Insulin Tolerance Test (ITT) after 6 h fasting and (E) Glucose Tolerance Test (GTT) after 16 h fasting of RCD-fed animals (n=8 per genotype). Graph represents Area Under the Curve (AUC) during glucose tolerance test. *p<0.05 vs. Wt.
SUPPLEMENTARY DATA
©2014 American Diabetes Association. Published online at http://diabetes.diabetesjournals.org/lookup/suppl/doi:10.2337/db14-0979/-/DC1
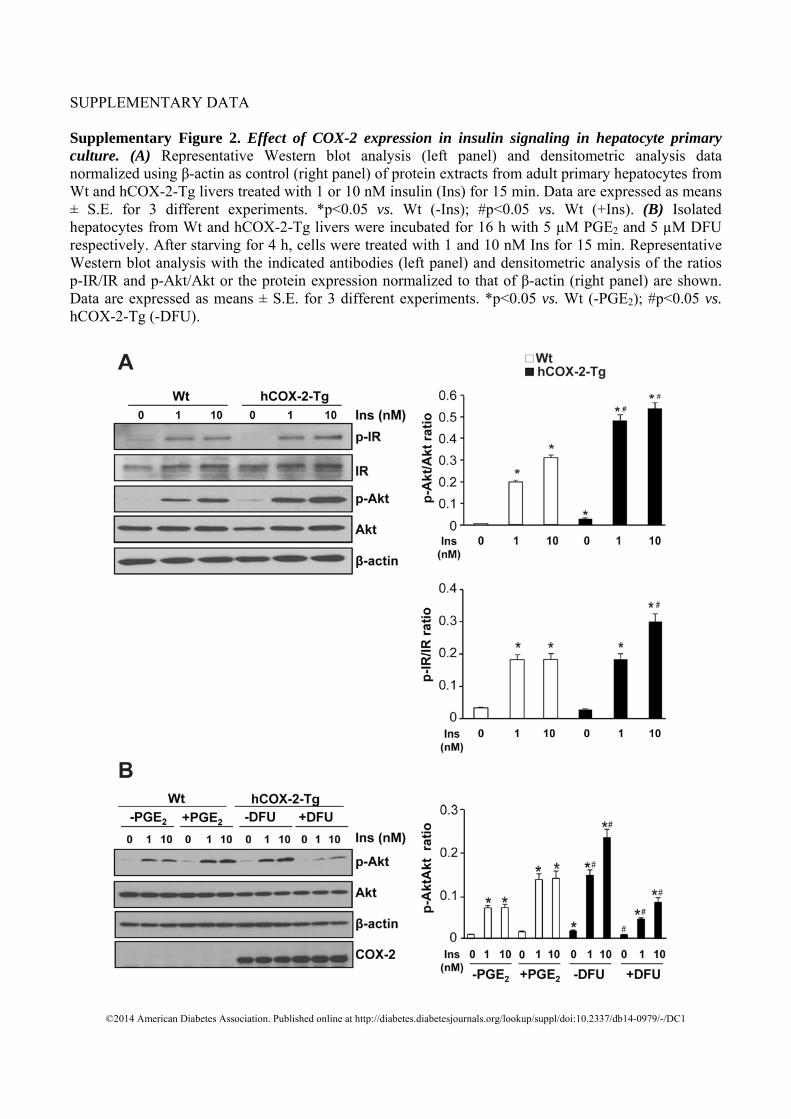
Supplementary Figure 2. Effect of COX-2 expression in insulin signaling in hepatocyte primary culture. (A) Representative Western blot analysis (left panel) and densitometric analysis data normalized using β-actin as control (right panel) of protein extracts from adult primary hepatocytes from Wt and hCOX-2-Tg livers treated with 1 or 10 nM insulin (Ins) for 15 min. Data are expressed as means ± S.E. for 3 different experiments. *p<0.05 vs. Wt (-Ins); #p<0.05 vs. Wt (+Ins). (B) Isolated hepatocytes from Wt and hCOX-2-Tg livers were incubated for 16 h with 5 µM PGE2 and 5 µM DFU respectively. After starving for 4 h, cells were treated with 1 and 10 nM Ins for 15 min. Representative Western blot analysis with the indicated antibodies (left panel) and densitometric analysis of the ratios p-IR/IR and p-Akt/Akt or the protein expression normalized to that of β-actin (right panel) are shown. Data are expressed as means ± S.E. for 3 different experiments. *p<0.05 vs. Wt (-PGE2); #p<0.05 vs. hCOX-2-Tg (-DFU).
SUPPLEMENTARY DATA
©2014 American Diabetes Association. Published online at http://diabetes.diabetesjournals.org/lookup/suppl/doi:10.2337/db14-0979/-/DC1
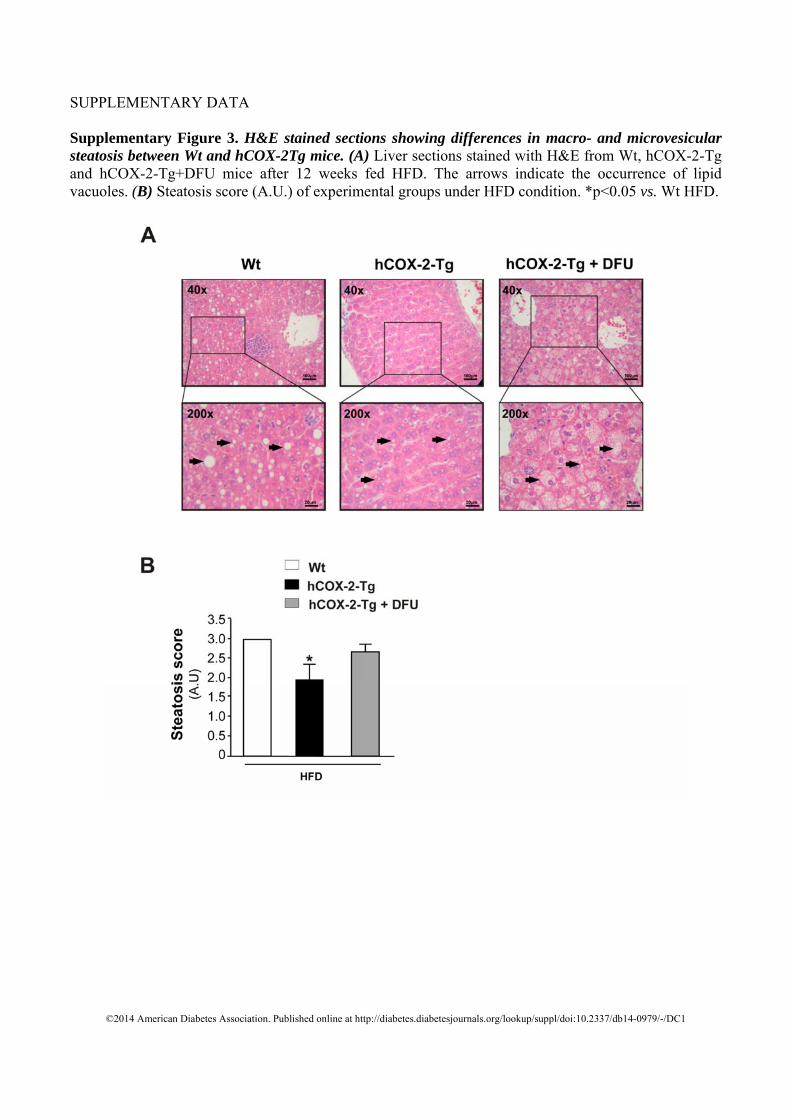
Supplementary Figure 3. H&E stained sections showing differences in macro- and microvesicular steatosis between Wt and hCOX-2Tg mice. (A) Liver sections stained with H&E from Wt, hCOX-2-Tg and hCOX-2-Tg+DFU mice after 12 weeks fed HFD. The arrows indicate the occurrence of lipid vacuoles. (B) Steatosis score (A.U.) of experimental groups under HFD condition. *p<0.05 vs. Wt HFD.

SUPPLEMENTARY DATA
©2014 American Diabetes Association. Published online at http://diabetes.diabetesjournals.org/lookup/suppl/doi:10.2337/db14-0979/-/DC1
Supplementary Figure 4. Plasma levels of transaminases in Wt and hCOX-2Tg mice. ALT and AST activities were analyzed spectrophotometrically. Data are expressed as means ± S.E. for 4 mice of each experimental group. *p<0.05 vs. Wt RCD; #p<0.05 vs. Wt HFD.

SUPPLEMENTARY DATA
©2014 American Diabetes Association. Published online at http://diabetes.diabetesjournals.org/lookup/suppl/doi:10.2337/db14-0979/-/DC1
Supplementary Figure 5. Analysis of saturated fatty acids in Wt, hCOX-2-Tg and hCOX-2-Tg+DFU mice. (A) HR-MAS MRS were performed to identify and quantify saturated fatty acids (B) The profile of saturated fatty acids spectra was analyzed. Data are expressed as means ± S.E. for 4-6 mice of each experimental group. *p<0.05 vs. Wt HFD, #p<0.05 vs. hCOX-2-Tg HFD.

SUPPLEMENTARY DATA
©2014 American Diabetes Association. Published online at http://diabetes.diabetesjournals.org/lookup/suppl/doi:10.2337/db14-0979/-/DC1
Supplementary Figure 6. Enhanced metabolism in hCOX-2-Tg mice. Registers of daily oxygen (O2) consumption (A), carbon dioxide (CO2) elimination (B), respiratory exchange ratio (RER) (C), activity (D) and energy expenditure (E) of HFD-fed Wt, hCOX-2-Tg and hCOX-2-Tg+DFU mice. Data were collected during a 48 h period in a 12/12 light-dark cycle.

SUPPLEMENTARY DATA
©2014 American Diabetes Association. Published online at http://diabetes.diabetesjournals.org/lookup/suppl/doi:10.2337/db14-0979/-/DC1
Supplementary Figure 7. Human and murine liver cells expressing COX-2 are protected against palmitate-mediated insulin resistance. Representative Western blot analysis with indicated antibodies in homogenates from CHL-V and CHL-C (A) and in NCL-V and NCL-C cells (B) incubated with 600 µM palmitate for 16 h followed by the treatment with vehicle (-Ins) or with 10 nM insulin (+Ins) for 15 min. (C) p-Akt/Akt ratio after densitometric analysis of western blot data normalized using β-actin as control. Data are expressed as means ± S.E. for at least 3 independent experiments. *p<0.05 vs. CHL-V or NCL-V (-Ins); #p<0.05 vs. CHL-C or NCL-C (-Ins).