title: running title: novel insulin sensitivity loci -...
TRANSCRIPT

Title: Genome-wide association study of the modified Stumvoll Insulin Sensitivity Index
identifies BCL2 and FAM19A2 as novel insulin sensitivity loci
Running title: Novel insulin sensitivity loci
Authors and affiliations
Geoffrey A. Walford 1, 2, 3*
, Stefan Gustafsson4*
, Denis Rybin 5*
, Alena Stančáková6, Han Chen
7,
8, Ching-Ti Liu
7, Jaeyoung Hong
7, Richard A. Jensen
9, 10, Ken Rice
11, Andrew P. Morris
12, 13,
Reedik Mägi14
, Anke Tönjes15
, Inga Prokopenko13, 16, 17
, Marcus E. Kleber18
, Graciela Delgado18
,
Günther Silbernagel19
, Anne U. Jackson20
, Emil V. Appel21
, Niels Grarup21
, Joshua P. Lewis22, 23
,
May E. Montasser22, 23
, Claes Landenvall24, 25
, Harald Staiger26, 27, 28
, Jian’an Luan29
, Timothy M.
Frayling30
, Michael N. Weedon30
, Weijia Xie30
, Sonsoles Morcillo31, 32
, María Teresa Martínez-
Larrad33
, Mary L. Biggs9, 11
, Yii-Der Ida Chen34
, Arturo Corbaton-Anchuelo33
, Kristine Færch35
,
Juan Miguel Zumaquero36, 37
, Mark O. Goodarzi38
, Jorge Kizer39, 40
, Heikki A. Koistinen41, 42, 43
,
Aaron Leong3, 44
, Lars Lind4, Cecilia Lindgren
13, 45, Fausto Machicao
27, 28, Alisa K. Manning
2, 3,
45, Gracia María Martín-Núñez
46, Gemma Rojo-Martínez
32, 36, 47, Jerome I. Rotter
34, David S.
Siscovick9, 10, 48, 49
, Joseph M. Zmuda50
, Zhongyang Zhang51, 52
, Manuel Serrano-Rios33
, Ulf
Smith53
, Federico Soriguer32, 36, 47
, Torben Hansen21
, Torben J. Jørgensen54, 55, 56
, Allan
Linnenberg56, 57, 58
, Oluf Pedersen21
, Mark Walker59
, Claudia Langenberg29
, Robert A. Scott29
,
Nicholas J. Wareham29
, Andreas Fritsche26, 27, 28
, Hans-Ulrich Häring26, 27, 28
, Norbert Stefan26, 27,
28, Leif Groop
24, 60, Jeff R. O’Connell
22, 23, Michael Boehnke
20, Richard N. Bergman
61, Francis S.
Collins62
, Karen L. Mohlke63
, Jaakko Tuomilehto64, 65, 66, 67
, Winfried März18, 68, 69
, Peter
Page 2 of 104Diabetes
Diabetes Publish Ahead of Print, published online July 14, 2016
Kovacs70
, Michael Stumvoll15
, Bruce M. Psaty9, 10, 71, 72, 73
, Johanna Kuusisto74
, Markku
Laakso74
, James B. Meigs3, 44, 45
, Josée Dupuis7, 75
, Erik Ingelsson76, 77^
, Jose C. Florez1, 2, 3^
* denotes co-first authors
^ denotes co-senior authors
1 Diabetes Research Center (Diabetes Unit), Massachusetts General Hospital, Boston, MA, USA
2 Center for Human Genetic Research, Massachusetts General Hospital, Boston, MA, USA
3 Department of Medicine, Harvard Medical School, Boston, MA, USA
4 Department of Medical Sciences, Uppsala University, Uppsala, Sweden
5 Data Coordinating Center, Boston University School of Public Health, Boston, Massachusetts, USA
6 University of Eastern Finland and Kuopio University Hospital, 70210 Kuopio, Finland
7 Department of Biostatistics, Boston University School of Public Health, Boston, Massachusetts, USA
8 Department of Biostatistics, Harvard T.H. Chan School of Public Health, Boston, MA, USA
9 Cardiovascular Health Research Unit, University of Washington, Seattle, Washington, USA
10 Department of Medicine, University of Washington, Seattle, Washington, USA
11 Department of Biostatistics, University of Washington, Seattle, Washington, USA
12 Department of Biostatistics, University of Liverpool, Liverpool, UK
13 Wellcome Trust Centre for Human Genetics, University of Oxford, Oxford, UK
14 Estonian Genome Center, University of Tartu, Riia 23B, Tartu 51010, Estonia
15 Department of Medicine; University of Leipzig, Liebigstrasse 18, 04103 Leipzig, Germany
16 Department of Genomics of Common Disease, Imperial College London, London, W12 0NN, UK
17 Oxford Centre for Diabetes, Endocrinology and Metabolism, University of Oxford, Oxford, UK
18 Vth Department of Medicine, Medical Faculty Mannheim, Heidelberg University, Germany
19 Division of Angiology, Swiss Cardiovascular Center, Inselspital, University of Bern, Bern, Switzerland
20 Department of Biostatistics and Center for Statistical Genetics, University of Michigan, Ann Arbor, MI
48109, USA
21 The Novo Nordisk Foundation Center for Basic Metabolic Research, Faculty of Health and Medical
Sciences, University of Copenhagen, Copenhagen, Denmark
Page 3 of 104 Diabetes

22 Division of Endocrinology, Diabetes, and Nutrition, University of Maryland School of Medicine,
Baltimore, MD, USA
23 Program for Personalized and Genomic Medicine, University of Maryland School of Medicine,
Baltimore, MD, USA
24 Department of Clinical Sciences, Diabetes and Endocrinology, Lund University Diabetes Centre,
Malmö, Sweden.
25 Department of Immunology, Genetics and Pathology, Science for Life Laboratory, Uppsala University,
Uppsala, Sweden.
26 Department of Internal Medicine, Division of Endocrinology, Diabetology, Angiology, Nephrology and
Clinical Chemistry, University Hospital Tübingen, Tübingen, Germany
27 German Center For Diabetes Research (DZD), Tübingen, Germany
28 Institute for Diabetes Research and Metabolic Diseases of the Helmholtz Center Munich at the
University of Tübingen, Tübingen, Germany
29 MRC Epidemiology Unit, University of Cambridge School of Clinical Medicine, Cambridge CB2 0QQ,
UK.
30 University of Exeter Medical School, Exeter, UK
31 CIBER Pathophysiology of Obesity and Nutrition, Spain
32 Department of Endocrinology and Nutrition, Hospital Regional Universitario de Málaga
33 Spanish Biomedical Research Centre in Diabetes and Associated Metabolic Disorders (CIBERDEM),
Instituto de Investigación Sanitaria del Hospital Clínico San Carlos (IdISSC), Madrid, Spain.
34 Institute for Translational Genomics and Population Sciences, Departments of Pediatrics and Medicine,
LABioMed at Harbor-UCLA Medical Center, Torrance, California, USA
35 Steno Diabetes Center, DK-2820 Gentofte, Denmark
36 Instituto de Investigación Biomédica de Málaga (IBIMA), Málaga, Spain
37 Sequencing and Genotyping Platform, Hospital Carlos Haya de Málaga, Spain
38 Division of Endocrinology, Diabetes and Metabolism, Cedars-Sinai Medical Center, Los Angeles, CA,
USA
39 Department of Epidemiology and Population Health, Albert Einstein College of Medicine, Bronx, NY,
USA
40 Department of Medicine, Albert Einstein College of Medicine and Montefiore Medical Center, Bronx,
NY, USA
41 Department of Heath, National Institute for Health and Welfare, PO Box 30, FI-00271, Helsinki,
Finland
42 Minerva Foundation Institute for Medical Research, Biomedicum 2U, Tukholmankatu 8, Helsinki, FI-
00290, Finland
Page 4 of 104Diabetes

43 University of Helsinki and Helsinki University Central Hospital: Department of Medicine and
Abdominal Center: Endocrinology, P.O.Box 340, Haartmaninkatu 4, Helsinki, FI-00029, Finland
44 Division of General Internal Medicine, Massachusetts General Hospital, Boston, MA, USA
45 Broad Institute of the Massachusetts Institute of Technology and Harvard University, Cambridge,
United States
46 Department of Endocrinology and Nutrition, Hospitales Regional Universitario y Virgen de la Victoria
de Málaga, Spain
47 CIBER de Diabetes y Enfermedades Metabólicas Asociadas (CIBERDEM), Spain.
48 Department of Epidemiology, University of Washington, Seattle, Washington, USA
49 The New York Academy of Medicine, New York, NY 10029
50 Department of Epidemiology, Graduate School of Public Health, University of Pittsburgh, PA, USA
51 Department of Genetics and Genomic Sciences, Icahn School of Medicine at Mount Sinai, New York,
NY 10029, USA
52 Icahn Institute for Genomics and Multiscale Biology, Icahn School of Medicine at Mount Sinai, New
York, NY 10029, USA
53 The Lundberg Laboratory for Diabetes Research, Department of Molecular and Clinical Medicine,
Sahlgrenska Academy at the University of Gothenburg, SE-41345 Gothenburg, Sweden
54 Department of Public Health, Faculty of Health and Medical Science, University of Copenhagen,
Denmark
55 Faculty of Medicine, Aalborg University, Denmark
56 Research Center for Prevention and Health, the Capital Region of Denmark, Copenhagen, Denmark
57 Department of Clinical Experimental Research, Rigshospitalet, Glostrup, Denmark
58 Department of Clinical Medicine, Faculty of Health and Medical Science, University of Copenhagen,
Denmark
59 Institute of Cellular Medicine, Newcastle University, Newcastle upon Tyne, UK.
60 Finnish Institute for Molecular Medicine, University of Helsinki, Helsinki, Finland.
61 Diabetes and Obesity Research Institute, Cedars-Sinai Medical Center, Los Angeles, California, USA
62 Medical Genomics and Metabolic Genetics Branch, National Human Genome Research Institute, NIH,
Bethesda, MD 20892, USA
63 Department of Genetics, University of North Carolina, Chapel Hill, NC 27599 USA
64 Chronic Disease Prevention Unit, National Institute for Health and Welfare, 00271 Helsinki, Finland
65 Centre for Vascular Prevention, Danube-University Krems, 3500 Krems, Austria
66 Diabetes Research Group, King Abdulaziz University, 21589 Jeddah, Saudi Arabia
Page 5 of 104 Diabetes

67 Dasman Diabetes Institute, Dasman, Kuwait
68 Clinical Institute of Medical and Chemical Laboratory Diagnostics, Medical University of Graz, Graz,
Austria
69 Synlab Academy, Synlab Services GmbH, Mannheim and Augsburg, Germany
70 Integrated Research and Treatment (IFB) Center AdiposityDiseases, University of Leipzig,
Liebigstrasse 19-21, 04103 Leipzig, Germany
71 Epidemiology and Health Services, University of Washington, Seattle, Washington, USA
72 Group Health Research Institute, Seattle, Washington, USA
73 Group Heath Cooperation, Seattle, Washington, USA
74 Department of Medicine, University of Eastern Finland and Kuopio University Hospital, 70210 Kuopio,
Finland
75 National Heart, Lung, and Blood Institute's Framingham Heart Study, Framingham, Massachusetts,
USA.
76 Department of Medical Sciences, Molecular Epidemiology and Science for Life Laboratory, Uppsala
University, Uppsala, Sweden
77 Department of Medicine, Division of Cardiovascular Medicine, Stanford University School of
Medicine, Stanford, CA, USA
Corresponding author:
Geoffrey A. Walford
Diabetes Clinical and Research Center (Diabetes Unit)
Massachusetts General Hospital
Simches Research Building
185 Cambridge Street
Boston, MA 02114
TEL: 617-643-4986
Page 6 of 104Diabetes

Abstract
Genome-wide association studies (GWAS) have found few common variants that influence
fasting measures of insulin sensitivity. We hypothesized that a GWAS of an integrated
assessment of fasting and dynamic measures of insulin sensitivity would detect novel common
variants. We performed GWAS of the modified Stumvoll Insulin Sensitivity Index (ISI) within
the Meta-Analyses of Glucose and Insulin-related traits Consortium. Discovery was performed in
16,753 individuals, and replication was attempted for the 23 most significant novel loci in 13,354
independent individuals. Association with ISI was tested in models adjusted for age, sex, body
mass index (BMI) and in a model (“Model 3”) analyzing the combined influence of the genotype
effect adjusted for BMI and the interaction effect between the genotype and BMI on ISI. In
Model 3, three variants reached genome-wide significance: rs13422522 (NYAP2, P=8.87 ×10⁻¹¹
),
rs12454712 (BCL2, P=2.7×10⁻⁸
) and rs10506418 (FAM19A2, P=1.9×10⁻⁸
). The association at
NYAP2 was eliminated by conditioning on the known IRS1 insulin sensitivity locus; the BCL2
and FAM19A2 associations were independent of known cardio-metabolic loci. In conclusion, we
identified two novel loci and replicated known variants associated with insulin sensitivity.
Further studies are needed to clarify the causal variant and function at the BCL2 and FAM19A2
loci.
Page 8 of 104Diabetes

Genome-wide association studies (GWAS) have identified common genetic variants that
influence risk of type 2 diabetes (1), a disease marked by reduction in beta-cell function and
insulin sensitivity (2). While both beta-cell function and insulin sensitivity traits are partly
heritable, GWAS have demonstrated relatively few single nucleotide variants (SNPs) associated
with insulin sensitivity (3).
Traits used to estimate insulin sensitivity from fasting measurements in prior large GWAS,
including fasting insulin and the homeostatic model assessment of insulin resistance (HOMA-
IR), demonstrate approximately half the heritability of traits that incorporate both fasting and
dynamic assessment of insulin sensitivity following a glucose load (4). Moreover, there is only
modest genetic correlation between HOMA-IR and measures of insulin sensitivity by
euglycemic clamp, which is considered the gold standard measure of peripheral insulin
sensitivity (5,6). Thus, an alternative approach to discover new common genetic variants
associated with insulin sensitivity is to perform GWAS using a dynamic measure of whole-body
insulin sensitivity. As an example, a recent GWAS identified a novel insulin sensitivity locus at
NAT2 using euglycemic clamp and insulin suppression test techniques in 2,764 subjects with
replication in another 2,860 individuals (7). However, these direct, whole-body measures of
insulin sensitivity are time- and resource-intensive interventions, which limits the feasible
sample size of such experiments. Derived indices from an oral glucose tolerance test (OGTT)
that integrate fasting and dynamic measures of insulin sensitivity reasonably approximate
euglycemic clamp measures and can be applied in existing large cohorts with glycemic traits,
potentially increasing the statistical power to detect novel variant associations.
Page 9 of 104 Diabetes

We tested the hypothesis that a well-powered GWAS would detect common genetic variants for
the modified Stumvoll Insulin Sensitivity Index (ISI). Insulin sensitivity assessed by the
euglycemic hyperinsulinemic clamp (M/I) has a stronger correlation with the ISI than with
HOMA-IR (r=0.79 vs. r=0.59, respectively) (8). In addition, the ISI is well correlated (r=0.69)
with M/I even when calculated using only fasting insulin values and glucose and insulin values
at 120 minutes after a 75-gram oral glucose load (9); this modified version is widely available in
existing cohorts providing a larger sample size for association analyses than the sample size that
would be available if indices requiring additional time points were used. We further
hypothesized that a subset of these common genetic variants would influence the ISI
independently or through their effect on body mass index (BMI). Thus, we tested the association
of the modified ISI in statistical models without adjustment for BMI, with adjustment for BMI,
and in a validated model (10,11) analyzing the combined influence of the genotype effect
adjusted for BMI and the interaction effect between the genotype and BMI on ISI.
Page 10 of 104Diabetes

Research Design and Methods
Cohort Descriptions
The cohorts participating in the Meta-Analyses of Glucose and Insulin-related traits Consortium
(MAGIC) contributed a total of 30,107 individuals to the analyses. Detailed information on the
study cohorts and methods is provided in Supplemental Table 1. All participants were of white
European ancestry from the United States or Europe and were free of diabetes. All studies were
approved by local research ethic committees, and all participants gave informed consent.
Modified Stumvoll Insulin Sensitivity Index (ISI)
Missing trait data were not imputed, and outliers were not excluded from analyses. The ISI was
calculated as previously described (9) according to the following formula:
0.156-(0.0000459*insulin2hrs[pmol/L])-(0.000321*insulinfasting [pmol/L))- (0.0054* glucose2hrs [mmol/L])
Discovery Effort: Genome-Wide Association Studies
Cohorts that were able to contribute genome-wide genotyping results during the course of the
project were included in the discovery effort. These were: FHS, Sorbs, FUSION, CHS, LURIC,
ULSAM, and METSIM. For the discovery GWAS, all samples with call-rates < 95% were
excluded, and SNPs departing from Hardy-Weinberg Equilibrium (at P < 10-6
), genotype-rate <
95%, or minor allele frequency (MAF) < 1% were excluded. Poorly imputed SNPs were
excluded if R2 < 0.3 or proper-info was < 0.4.
Each SNP was tested for association with ISI in three different additive genetic models: Model 1
was adjusted for age and sex; Model 2 was adjusted for age, sex, and BMI; and Model 3 analyzes
Page 11 of 104 Diabetes

the combined influence of the genotype effect adjusted for BMI and the interaction effect
between the genotype and BMI on ISI (10,11). The associations in Model 3 result from a test
with two degrees of freedom. When no interaction is present, the additional degree of freedom
results in a modest loss of statistical power. However, when interaction is present, statistical
power of the model is greater (11). To adjust for differences in insulin measurement between
cohorts, effect estimates were normalized to the standard deviation (SD) of the ISI in each cohort
(Supplemental Table 1). A robust estimate of the standard error was calculated in the
interaction analysis using ProbAbel, QUICKtest or Generalized Estimating Equations (GEE)
using the R geepack package. An inverse variance meta-analysis using METAL was performed
on the beta/SD from each cohort.
Following meta-analysis, SNPs with total sample size less than 8,500 (~1/2 of the maximum
sample size), or with heterogeneity P-values ≤ 10-6
(a value chosen to take into account multiple
hypothesis testing but below the level of strict Bonferroni correction) in the meta-analysis of the
discovery cohorts were removed. Genomic correction of cohort-specific association statistics
(i.e., correction for each individual study) was performed. In total, up to 2.4 million SNPs were
meta-analyzed for association with ISI in the discovery effort.
Selection of SNPs for Replication
Candidate SNPs for replication were identified by their association P-value ≤ 10-7
in one or more
of the analysis models. For gene loci with multiple replication candidates, the SNP with the
lowest P-value and any other SNP in low linkage disequilibrium (LD, r2
<0.5) with the index
SNP in Europeans were retained. Using these filters, 23 unique candidate SNPs from 23 loci
Page 12 of 104Diabetes

were identified for replication. The SNP Annotation and Proxy Search (SNAP) site was used to
find up to three proxies in high LD (r2 > 0.8) in Europeans for each candidate SNP.
Replication Effort
Cohorts that did not contribute to the discovery effort but were able to contribute association
results during the course of the project were included in the replication effort. These were:
EUGENE2, Amish, RISC, Tuebingen, Inter99, Segovia, Pizarra, Botnia, 1936 Birth Cohort, and
Ely Study. Genotype data were obtained using in silico data from pre-existing GWAS or de novo
genotyping. In replication cohorts, SNPs with minor allele count (MAC) < 20 were excluded.
Additional details of the replication cohort effort are provided in Supplemental Table 1.
Combined meta-analysis
We required the absence of heterogeneity in the combined analysis of discovery and replication
cohorts (P > 10-6
) as well as nominal significance (P < 0.05) in the replication effort and
genome-wide significance (P < 5×10⁻⁸
) in the combined meta-analysis for statistical evidence of
association between a novel SNP and the ISI. To assess the effect of removing lower frequency
SNPs in Model 3, a sensitivity analysis was performed using the MAC < 20 filter on a cohort-
wise basis in both the discovery and replication cohorts.
Assessment for association of known insulin sensitivity loci with ISI
The associations of published insulin sensitivity loci were tested for association with the ISI in
the discovery cohorts. Loci associated with fasting insulin without (12) and with adjustment for
BMI (3,12), with fasting insulin using the approach in Model 3 (10), and with direct measures of
Page 13 of 104 Diabetes
insulin sensitivity were included in these analyses (7). The published results for associations with
fasting insulin with or without BMI adjustment (N ≈ 50,000-100,000) (3,12) or exploiting
potential BMI by gene interaction (Model 3, N ≈ 80,000) (10) used the same statistical approach
as in the current study but were derived in a sample size approximately 3-6 times larger than that
of the current study discovery cohort (N ≈16,000). The sample sizes of the published fasting
insulin analyses were much greater as only fasting insulin and BMI were required phenotypes for
cohort participation. To perform analyses of association with fasting insulin and ISI in a
comparable sample, we also examined the subset of discovery cohorts that contributed to the
current assessment of ISI and prior assessments of fasting insulin: FHS, Sorbs, FUSION, and
CHS. In Model 2 and Model 3, only data from FHS, Sorbs, and FUSION were analyzed as
participant level BMI data were not available in CHS. A binomial sign test was used to
determine whether the expected direction of effect for these published loci with ISI occurred
more often than by chance.
Conditional analyses and assessment for association of top findings with direct measures of
insulin sensitivity
Findings that reached genome-wide significance were assessed for association with direct
measures of insulin sensitivity in the GENEtics of Insulin Sensitivity (GENESIS) consortium
(7). Direct measures of insulin sensitivity were inverse normal transformed M value in cohorts
with euglycemic insulin clamp assessments and inverse normal transformation of the steady state
plasma glucose from cohorts with insulin suppression test. These two traits are highly correlated
(r= -0.85, P<0.001) (13), and tests of association with the direct measure of insulin sensitivity
showed no evidence of heterogeneity (P-value for heterogeneity =0.34 for the BCL2 variant and
Page 14 of 104Diabetes

P- value for heterogeneity =0.66 for the FAM19A2 variant). Therefore, we did not perform
separate tests of association in the smaller subsets of data with either the M value or insulin
suppression test phenotype. Statistical models were adjusted for age, gender, and BMI.
The top findings of the ISI analyses were also assessed in a MAGIC association analysis from
Manning and colleagues (10) with fasting insulin using the approach in Model 3. These ISI
variants were only available in the discovery cohort from Manning and colleagues (N=38,649 for
rs12454712 and N=45,290 for rs10506418). To perform association analyses with fasting insulin
and ISI in a comparable sample, we also performed association analyses with fasting insulin and
ISI in a subset of the discovery cohort: FHS, Sorbs, and FUSION.
Approximate conditional analyses were performed to understand whether known loci contributed
to the associations of novel findings with the ISI (14). These analyses were based on the
summary level statistics from the meta-analysis and the estimated LD using individual-level
genotype data from the Framingham Heart Study discovery cohort. The software implementation
for this approach does not incorporate the interaction term from Model 3, and therefore
conditional analyses were not performed in Model 3.
Page 15 of 104 Diabetes

Results
The demographic characteristics of the participants included in the discovery and replication
efforts are presented in Table 1. In total, the discovery, replication, and combined meta-analyses
included up to 16, 753; 13,354; and 30,107 participants, respectively.
Using a variance component approach implemented in the software SOLAR (15), the heritability
of the ISI (H2r ± SE) in related Framingham Heart Study participants (n=2,833) was very similar
without or with adjustment for BMI (34.6 ± 6.8%, P= 2.8 ×10⁻⁸
and 33.4 ± 6.8%, P= 1.0 ×10⁻⁶
respectively). Within the ULSAM discovery cohort, the Spearman correlation between the ISI
and M value from the euglycemic hyperinsulinemic was 0.71, (Figure 1) consistent with reports
from the literature (9); the Spearman correlation between ISI and fasting insulin was -0.49
(Figure 1).
When tested in the full discovery cohort, 12 of 13 loci previously associated with fasting insulin
in the literature (12) (P=0.002 for binomial sign test) and 13 of 15 loci previously associated
with fasting insulin after adjustment for BMI in the literature (3,12) (P=0.004 for binomial sign
test) showed the expected direction of effect with the ISI in the discovery cohorts (Supplemental
Table 2). When these associations were examined in a subset of the current study discovery
cohort (Supplemental Table 2), statistical significance was reduced but effects at each loci
remained in the expected direction (10 of 13 loci for ISI vs. fasting insulin without BMI
adjustment, P=0.03 for binomial sign test and 11 of 15 loci for ISI vs. fasting insulin with BMI
adjustment, P=0.04 for binomial sign test). Using a variant in LD with rs1208 (rs7815686, r2 =
Page 16 of 104Diabetes

0.67), we also found the expected direction of effect with ISI in the discovery cohorts (n=16,753)
at the NAT2 locus (Model 1, β= -0.029, P=9×10⁻³
) (7).
The QQ plots for Models 1, 2, and 3 are shown in Supplemental Figure 1, 2, and 3,
respectively. Measures of genomic control were consistent with low inflation (Model 1 λGC=
1.015; Model 2 λGC= 1.006; Model 3 λGC= 1.079). While genomic control was used to correct
for each individual study, no additional corrections were applied to the meta-analysis results. The
results of the discovery and replication results, separately, for Model 1 (with age- and sex-
adjustment), Model 2 (with age-, sex-, and BMI- adjustment), and Model 3 (with age-, sex-, and
BMI- adjustment and analyzing the combined influence of the genotype effect adjusted for BMI
and the interaction effect between the genotype and BMI on ISI) are shown in Supplemental
Table 3. Four SNPs selected from the discovery effort reached nominal significance (P <0.05) in
the replication analyses: rs13422522 (NYAP2) in Models 1, 2, and 3; rs12454712 (BCL2) in
Models 2 and 3; rs10506418 (FAM19A2) in Model 3; rs6013915 (PFDN4) in Model 3. Although
the association with rs4548846 (CDH13) reached nominal significance in the replication effort
for Model 3, the association was in the opposite direction of effect as in the discovery analyses;
consequently, the association of this variant also had high heterogeneity combined meta-analysis.
We compared the beta coefficients for the 22 SNPs identified in the discovery effort (rs4548846,
CDH13 was excluded given high heterogeneity) with fasting insulin and ISI in a subset of the
discovery cohort. Pearson correlations between the beta for fasting insulin and the beta for ISI
were -0.494 in Model 1, -0.797 in Model 2, and -0.461 (for SNP effect) and -0482 (for
interaction) in Model 3.
Page 17 of 104 Diabetes

The results of the combined discovery and replication cohort meta-analyses in each of the three
models are shown in Table 2 and in Supplemental Table 3. No association reached genome-
wide significance in Model 1. In Model 2, rs13422522 (NYAP2, P=1.8 ×10⁻¹¹
) and rs12454712
(BCL2, P=1.9×10⁻⁸
) achieved genome-wide significance. In Model 3, rs13422522 (NYAP2,
P=8.9×10⁻¹¹
), rs12454712 (BCL2, P=2.7×10⁻⁸
), and rs10506418 (FAM19A2, P=1.9×10⁻⁸
)
reached genome-wide significance. In Model 3, rs6027072 (ARHGAP40, P=4.4×10⁻⁹
) also
reached genome-wide significance but had not achieved nominal significance in the replication
cohort, and rs6013915 (PFND4) had high heterogeneity in the combined meta-analysis of
discovery and replication cohorts (heterogeneity P = 6.03×10⁻⁷
); therefore associations with these
SNPs were not included as trustworthy findings.
Hence, rs13422522 (NYAP2), rs12454712 (BCL2) and rs10506418 (FAM19A2) were the three
SNPs that reached our a priori requirements for claiming statistical evidence. The association at
rs13422522 (NYAP2) was in LD (r2 = 0.7) with previously reported results at the known insulin
sensitivity signal rs2943641 (IRS1) (10), and the association with the ISI in Model 2 was greatly
reduced by conditioning on the published SNP in the discovery cohort (beta = -0.066 ± 0.01, P=
4.29 × 10⁻⁸
to beta = -0.025 ± 0.01, P=0.01). Thus, this SNP was considered a reflection of the
known IRS1 signal and not an independent signal. The associations for rs12454712 (BCL2) and
rs10506418 (FAM19A2) with the ISI were consistent across the discovery and replication cohorts
(Supplemental Figure 4 and Supplemental Figure 5, respectively). When stratifying by BMI,
the effect of the minor (A) allele at rs10506418 (FAM19A2) on insulin sensitivity was negative
at lower BMI and became positive and stronger with increasing BMI (Figure 2), and the effect
Page 18 of 104Diabetes

of the major (T) allele at rs12454712 (BCL2) on ISI was more negative with increasing BMI
(Figure 3).
The genomic inflation of Models 1 and 2 was low and slightly higher in Model 3. Because the
same individuals were used in each model, inflation in Model 3 was unlikely to arise from
population stratification. We performed an additional sensitivity analysis that applied the MAC <
20 filter on a cohort-wise basis to both discovery and replication cohorts (Supplemental Table
4), which tended to reduce the statistical significance of associations with high heterogeneity and
slightly reduced the statistical significance of the association at the FAM19A2 locus in Model 3
without markedly reducing the magnitude of effect or affecting heterogeneity (beta = -0.62 ±
0.13, P-value = 1.9 ×10⁻⁸
, P-value for heterogeneity= 0.11 to beta = -0.58 ± 0.13, P-value =8.0
×10-7
, P-value for heterogeneity= 0.07). The sample size for the FAM19A2 locus association in
Model 3 was 462 individuals fewer when the MAC filter was applied in the discovery cohorts
versus when the MAF filter was applied, and the resulting loss in power was likely responsible
for the slight reduction in statistical significance.
Conditioning the results at either variant with known signals at least 1 Mb away did not attenuate
the association with the ISI in the discovery cohorts of Model 2 (full description in
Supplemental Table 5). The rs10506418 (FAM19A2) variant was not associated with fasting
insulin using Model 3 in a separate GWAS result (10) or with direct measures of insulin
sensitivity in GENESIS. The major (T) allele of rs12454712 (BCL2), which was associated with
lower insulin sensitivity in this study, was also associated with a trend toward higher fasting
insulin in a separate GWAS result using Model 3 (SNP effect -0.006 ± 0.003, interaction effect
Page 19 of 104 Diabetes

0.001 ± 0.001, P= 5.9×10⁻⁵
, N=38,649) (10). Similar trends were observed when the variant was
tested for association with ISI and fasting insulin in the same discovery cohort subset
(Supplemental Table 5).
Page 20 of 104Diabetes

Discussion
In a study of over 30,000 participants, we found novel, independent, genome-wide significant
associations for the ISI at rs12454712 (BCL2) and rs10506418 (FAM19A2). Strengths of the
current study’s design include a large sample size, well-phenotyped individuals, high-quality
genomic data, and use of traditional and contemporary statistical models to account for the
influence of BMI on insulin sensitivity. In addition, our approach targeted a phenotype not
previously examined in GWAS: the modified Stumvoll Insulin Sensitivity Index. By
incorporating glucose and insulin measures before and after a glucose load, this phenotype
captures information that fasting assessments such as HOMA-IR or insulin, alone would not.
Indeed, the correlation between ISI and M-value is higher than that between M-value and fasting
insulin (16), which has been used in prior genetic studies of insulin sensitivity (10,12). At the
same time, the use of measures obtained at only two time points (fasting and 120 minutes) during
an OGTT permitted assembly of a large sample size required for adequate statistical power.
Several findings serve as positive controls for our results and demonstrate that the ISI is a robust measure
of fasting and whole-body insulin sensitivity. First, we observe strong correlation of ISI with direct
measures of insulin sensitivity. Second, we show that the ISI can detect genetic influences on measures of
fasting insulin sensitivity (3,10,12), generally ascribed to hepatic physiology, as well as on measures of
whole-body insulin sensitivity, which also incorporates contributions from muscle and adipose tissue.
Integrated measures of insulin sensitivity may have clinical relevance as reduction in peripheral
insulin sensitivity may be an early contributor to type 2 diabetes development (17-19).
Consistent with prior genetic explorations of insulin sensitivity (10), the association of variants at
the BCL2 and FAM19A2 loci became stronger and genome-wide significant after accounting for
Page 21 of 104 Diabetes

the effect of BMI on ISI. Notably, the ISI can be calculated with or without BMI in the formula,
and the correlation of the ISI with M/I is greater when BMI is included (r=0.69 vs. r=0.79) (8,9).
We note that the effect of these loci on insulin sensitivity is modest, consistent with published
findings on other common genetic variants for glycemic traits, such as glucose (12) and fasting
insulin (3,10,12). Yet, the findings of the current work are meaningful as they provide a more
complete understanding of the contribution of common genetic variation to insulin sensitivity.
Existing literature bolsters our finding of BCL2 as a novel candidate insulin sensitivity locus.
The major (T) allele at rs12454712, which was associated with lower insulin sensitivity in our
analysis, has been previously associated with type 2 diabetes in a multi-ethnic GWAS (OR =
1.09, 95% confidence interval (CI), 1.05–1.11, P = 2.1 × 10⁻⁸
) (20) in analyses adjusted for BMI.
Further, this same variant has recently been associated with higher BMI-adjusted waist-hip ratio
in women (beta= 0.035, P= 1.1×10⁻⁹
, N= 96,182), but not men (beta= 0.007, P=0.25, N=73,576)
(22). All these findings suggest the metabolically deleterious effects of the BCL2 locus become
more evident after adjustment for BMI. Last, we find that the statistical association of
rs12454712 (BCL2) is stronger with the ISI than with fasting insulin (10). Notably, the published
fasting insulin results were performed in a study much larger than in the current work. The
ability of the ISI to detect a genome-wide significant finding in a smaller sample suggests the
BCL2 locus may have a greater influence on insulin sensitivity when fasting and post-prandial
phenotypes are assessed together.
The mechanism by which BCL2 influences insulin sensitivity remains unclear. The BCL2 family
of proteins regulate apoptosis through control of mitochondrial permeability (23). Mouse models
Page 22 of 104Diabetes
suggest that inhibiting bcl2 improves glucose tolerance through effects on the pancreatic beta
cells (24). Conversely, pharmacological inhibition of the protein BCL2 causes hyperglycemia
among a subset of patients with chronic lymphocytic leukemia (25), but the mechanism of this
observation is unknown. In contrast, there is little direct published literature to support the role of
FAM19A2 in insulin sensitivity. We found that the association of the minor (A) allele at the
FAM19A2 locus with reduced insulin sensitivity was detected at BMI < 30 kg/m2. This may
suggest the variant is more deleterious among individuals with lower levels of adiposity. While
BCL2 and FAM19A2 are the closest genes to rs12454712 and rs10506418, respectively, we have
not excluded other genes in the region (Supplemental Figure 6 and 7). Additional in silico
findings at the BCL2 and FAM19A2 variants are provided in Supplemental Table 5.
We recognize limitations to our study. First, analyses were performed exclusively in white
individuals of European ancestry. Exploring these loci in other racial and ethnic groups is
needed. Second, we used an estimate of whole-body insulin sensitivity derived from post-glucose
load measures of glucose and insulin, rather than direct measures of insulin sensitivity. The wide
availability of the ISI provided increased statistical power of the association analyses relative to
that of other indices which are better correlated with euglycemic measures of insulin sensitivity,
such as the Matsuda index (26). Assessment of our novel findings in the GENESIS consortium
suggests that the ISI may be capturing different information on insulin sensitivity than that
provided by the insulin clamp or the insulin suppression test, or that the power in the GENESIS
analyses was limited to detect this association. Third, conditional analyses could not be
performed in Model 3, which would have been the best method of assessing the dependence of
the signals at BCL2 and FAM19A2. However, the LD for each variant with other known glucose
Page 23 of 104 Diabetes
and insulin loci in the region was low, and the nominally significant associations of the BCL2
and FAM19A2 variants with ISI were stable after conditioning in Model 2, suggesting that
analyses in Model 3 would have probably confirmed secondary loci. Fourth, given our desire for
early dissemination of these results, no experimental attempts at determining the causal gene and
mechanisms of action in our novel candidate insulin sensitivity loci were performed here.
In conclusion, we identified two novel candidate insulin sensitivity loci through a GWAS of the
modified Stumvoll Insulin Sensitivity Index. Our results demonstrate that ISI is a robust measure
of fasting and whole-body measures of insulin sensitivity and suggest that genetic variation in
the FAM19A2 and BCL2 loci influence insulin sensitivity. While further functional work is
needed to clarify the causal genes and mechanisms of action of these loci, our work as well as
prior literature provides support for the role of genes in these loci having an effect on human
glycemic metabolism.
Page 24 of 104Diabetes

Acknowledgements
We thank all the participants of each cohort for their cooperation and contribution to this study.
For FHS, this research was conducted in part using data and resources from the Framingham
Heart Study of the National Heart Lung and Blood Institute of the National Institutes of Health
and Boston University School of Medicine; the analyses reflect intellectual input and resource
development from the Framingham Heart Study investigators participating in the SNP Health
Association Resource (SHARe) project. For CHS, a full list of principal CHS investigators and
institutions can be found at CHS-NHLBI.org. For ULSAM, we thank the SNP&SEQ
Technology Platform in Uppsala (www.genotyping.se) for excellent genotyping; computations
were performed on resources provided by SNIC through Uppsala Multidisciplinary Center for
Advanced Computational Science (UPPMAX) under Project b2011036. For Sorbs, we would
like to thank Knut Krohn (Microarray Core Facility, University of Leipzig, Institute of
Pharmacology) for the genotyping support and Joachim Thiery (Institute of Laboratory
Medicine, Clinical Chemistry and Molecular Diagnostics, University of Leipzig) for clinical
chemistry services. For LURIC, we thank the LURIC study team either temporarily or
permanently involved in patient recruitment and sample and data handling; furthermore, we
thank the laboratory staff at the Ludwigshafen General Hospital, and the Universities of
Freiburg, Ulm, and Graz. For Amish Studies, we gratefully thank our Amish community and
research volunteers for their long-standing partnership in research, and acknowledge the
dedication of our Amish liaisons, field workers and the Amish Research Clinic staff, without
which these studies would not have been possible. For the Ely Study, we are grateful to the staff
of St. Mary's Street Surgery, Ely and the study team.
Page 25 of 104 Diabetes
Author contributions. The study was conceived by GAW (Massachusetts General Hospital,
MGH) and JCF (MGH and Framingham Heart Study, FHS). The manuscript was written by
GAW (MGH), SG (The Uppsala Longitudinal Study of Adult Men, ULSAM), and DR (FHS)
under the guidance of JD (FHS), EI (ULSAM), and JCF (MGH, FHS) and finalized based on
detailed comments from other authors. Figures were constructed by SG (ULSAM) and DR
(FHS). Meta-analysis of data from all cohorts was performed by SG (ULSAM) and DR (FHS).
In silico analyses for follow-up studies were performed by SG (ULSAM), AL (FHS), AM
(FHS), DR (FHS), XW (Genetics of Insulin Sensitivity, GENESIS), and ZZ (GENESIS).
Genotyping within cohorts was performed by ML (Metabolic Syndrome in Men, METSIM); HC,
JD, JH, CTL, and DR (Framingham Heart Study, FHS); MLLB, YDC, MOG and JIR
(Cardiovascular Health Study, CHS); LL, CML, and APM (The Uppsala Longitudinal Study of
Adult Men, ULSAM); NG (Inter99 and Birth Cohort 1936); JPL (Amish Studies , Amish); FM
and HS (Tuebingen Family Study for type 2 diabetes, Tuebingen); CL, JL, RAS, and NJW (Ely
Study); JMGZ (Pizarra); ACA, MTML, and MSR (Segovia). Phenotyping within cohorts was
performed by AS (METSIM; European Network on Functional Genomics of Type 2 Diabetes
EUGENE2); JD (FHS); EI (ULSAM); PK and MS (Sorbs); GD, MEK, and GS (Ludwigshafen
Risk and Cardiovascular Heath, LURIC); RB, HK, and JT (FUSION); TH, TJ, AL, and OP
(Inter99 and Birth Cohort 1936); AF and NS (Tuebingen); CL, RAS, and NJW (Ely Study); and
ACA (Segovia). Data analysis was performed within cohorts by AUJ (Finland-United States
Investigation of NIDDM, FUSION; METSIM); DR, HC, JH, and CTL (FHS); RAJ and KR
(CHS); SG and APM (ULSAM); RM, IP, PS, and AT (Sorbs); EVA and NG (Inter99 and Birth
Cohort 1936); JPL, MEM, and JRO (Amish); CL (Botnia Study); HS (Tuebingen); JL (Ely
Study); TMF, MNW, MW, and WX (Relationship between Insulin Sensitivity and
Page 26 of 104Diabetes

Cardiovascular Risk Study, RISC); SM (Pizarra); MTML (Segovia). The cohort principal
investigators were JH and ML (METSIM); BMP (CHS); EI (ULSAM); PK and MS (Sorbs);
WM (LURIC); MB, RNB, FSC, KLM, and JT (FUSION); TH, TJ, AL, and OP (Inter99 and
Birth Cohort 1936); JRO (Amish Studies); LG (Botnia Study); AF, HUH, and NS (Tuebingen);
CL, RAS, and NJW (Ely Study); FS (Pizarra); MSR (Segovia); US (EUGENE2).
Conflicts of Interest Statement. WM (LURIC) is employed with synlab Services GmbH and
holds shares of synlab Holding GmbH. He has received grants from Siemens Diagnostics,
Aegerion Pharmaceuticals, AMGEN, Astrazeneca, Danone, Sanofi/Genzyme, Pfizer, BASF, and
Abbott Diagnostics. BMP (CHS) serves in the data safety and monitoring board of a clinical trial
funded by the manufacturer (Zoll LifeCor) and the Yale Open Data Access Project Steering
Committee funded by Johnson and Johnson. GS (LURIC) is member of an advisory board of
AMGEN (Thousand Oaks, CA, USA). MEK (LURIC) has received lecture fees from
AstraZeneca. No conflict of interest is reported by the other authors: GAW (MGH), SG
(ULSAM), DR (FHS), AS (METSIM, EUGENE2), HC (FHS), CTL (FHS), JH (FHS), RAJ
(CHS), KR (CHS), APM (ULSAM), RM (Sorbs), AT (Sorbs), IP (Sorbs), GD (LURIC), AUJ
(FUSION, METSIM), EVA (Inter99, Birth Cohort 1936), NG (Inter99, Birth Cohort 1936), JPL
(Amish), MEM (Amish), CL (Botnia), HS (Tuebingen), JL (Ely), TMF (RISC), MNW (RISC),
WX (RISC), SM (Pizarra), MTML (Segovia), MLB (CHS), YDIC (CHS), ACA (Segovia), KF
(Inter99), JMGZ (Pizarra), MOG (CHS), JK (CHS), HAK (FUSION), AL (ULSAM), LL
(ULSAM), CML (ULSAM), FM (Tuebingen), AKM (FHS), GMMN (Pizarra), GRM (Pizarra),
JIR (CHS), DSS (CHS), JMZ (CHS), ZZ (CHS), MSR (Segovia), US (EUGENE2), FS (Pizarra),
TH (Inter99, Birth Cohort 1936), TJJ (Inter99, Birth Cohort 1936), AL (Inter99, Birth Cohort
Page 27 of 104 Diabetes
1936), OP (Inter99, Birth Cohort 1936), MW (RISC), CL (Ely), RAS (Ely), NJW (Ely), AF
(Tuebingen), HUH (Tuebingen), NS (Tuebingen), LG (Botnia), JRO (Amish), MB (FUSION),
RNB (FUSION), FSC (FUSION), KLM (FUSION), JT (FUSION), PK (Sorbs), MS (Sorbs), JK
(METSIM), ML (METSIM), JBM (FHS), JD (FHS), EI (ULSAM), JCF (MGH, FHS).
Guarantor Statement. Dr. Geoffrey Walford is the guarantor of this work and, as such, had full
access to the data in the study and takes responsibility for the integrity of the data and the
accuracy of the data analysis.
Funding Sources. This work was supported by DK099249 (GAW). Grant support was provided
to cohorts. For METSIM, the study was funded by the Academy of Finland (grants no. 77299
and 124243). For Sorbs, the work was supported by grants from the German Research Council
(DFG - SFB 1052 “Obesity mechanisms”; A01, C01, B03 and SPP 1629 TO 718/2-1), from the
German Diabetes Association and from the DHFD (Diabetes Hilfs- und Forschungsfonds
Deutschland); this work was further supported by the Federal Ministry of Education and
Research (BMBF), Germany, FKZ: 01EO1501, AD2-060E to P.K.), and by Boehringer
Ingelheim Foundation. For FHS, the study was supported by National Heart, Lung and Blood
Institute's contract numbers number N02‐HL‐6‐4278 (supporting its contract with Affymetrix,
Inc for genotyping services), N01‐HC‐25195 and HHSN268201500001I) and National Institute
for Diabetes and Digestive and Kidney Diseases (NIDDK): R01 DK078616 to JD, U01-
DK085526 to HC and JD, 2R01 DK078616 to JM, and K24 DK080140 to JM; a portion of this
research utilized the Linux Cluster for Genetic Analysis (LinGA‐II) funded by the Robert
Page 28 of 104Diabetes

Dawson Evans Endowment of the Department of Medicine at Boston University School of
Medicine and Boston Medical Center; AKM was supported by American Diabetes Association
grant #7-12-MN-02. For CHS, research was supported by contracts HHSN268201200036C,
HHSN268200800007C, N01HC55222, N01HC85079, N01HC85080, N01HC85081,
N01HC85082, N01HC85083, N01HC85086, and grant U01HL080295, HL105756, and
HL120393 from the National Heart, Lung, and Blood Institute (NHLBI), with additional
contribution from the National Institute of Neurological Disorders and Stroke (NINDS);
additional support was provided by R01AG023629 from the National Institute on Aging (NIA);
the content is solely the responsibility of the authors and does not necessarily represent the
official views of the National Institutes of Health. For ULSAM, the project was supported by
Knut and Alice Wallenberg Foundation (Wallenberg Academy Fellow), European Research
Council (ERC Starting Grant), Swedish Diabetes Foundation (grant no. 2013-024), Swedish
Research Council (grant no. 2012-1397), and Swedish Heart-Lung Foundation (20120197);
APM is a Wellcome Trust Senior Fellow in Basic Biomedical Science (grant number
WT098017). For LURIC, the study was supported by the 7th Framework Program (AtheroRemo,
grant agreement number 201668 and RiskyCAD, grant agreement number 305739) of the EU
and by the INTERREG-IV-Oberrhein-Program (Project A28, Genetic mechanisms of
cardiovascular diseases) with support from the European Regional Development Fund (ERDF)
and the Wissenschaftsoffensive TMO; MEK and WM are supported by the German Federal
Ministry of Education and Research as part of the Competence Cluster of Nutrition and
Cardiovascular Health (nutriCARD). For Inter99, the study was financially supported by
research grants from the Danish Research Council, the Danish Centre for Health Technology
Assessment, Novo Nordisk Inc., Research Foundation of Copenhagen County, Ministry of
Page 29 of 104 Diabetes

Internal Affairs and Health, the Danish Heart Foundation, the Danish Pharmaceutical
Association, the Augustinus Foundation, the Ib Henriksen Foundation, the Becket Foundation,
and the Danish Diabetes Association. For FUSION, the study was supported by DK093757,
DK072193, DK062370, and ZIA-HG000024; HAK has received funding from Academy of
Finland (support for clinical research careers, grant number 258753). For Amish Studies, work
on this study was supported by NIH awards K23GM102678 to JPL and HL084756 to JRO. For
Botnia, the study has been financially supported by grants from the Sigrid Juselius Foundation,
Folkhälsan Research Foundation, Nordic Center of Excellence in Disease Genetics, an EU grant
(EXGENESIS, GA FP6 2004-005272), Signe and Ane Gyllenberg Foundation, Swedish Cultural
Foundation in Finland, Finnish Diabetes Research Foundation, Foundation for Life and Health in
Finland, Finnish Medical Society, Paavo Nurmi Foundation, Helsinki University Central
Hospital Research Foundation, Perklén Foundation, Ollqvist Foundation, Närpes Health Care
Foundation and Ahokas Foundation; the DGI study was further supported by a Linné grant
(2006-237) from the Swedish Research Council; the study has also been supported by the
Ministry of Education in Finland, Municipal Heath Care Center and Hospital in Jakobstad and
Health Care Centers in Vasa, Närpes and Korsholm. For Tuebingen, the study was supported in
part by a grant from the German Federal Ministry of Education and Research to the German
Center for Diabetes Research (DZD e.V.). For the Ely Study, JAL, CL, RAS and NJW
acknowledge support from the Medical Research Council (MC_UU_12015/1); the Ely Study
was funded by the MRC (MC_U106179471) and Diabetes UK; genotyping in the Ely and
Fenland studies was supported in part by an MRC-GlaxoSmithKline pilot programme grant
(G0701863). For Birth Cohort 1936 and Inter99, work was support by the Novo Nordisk
Foundation Center for Basic Metabolic Research, an independent Research Center at the
Page 30 of 104Diabetes
University of Copenhagen partially funded by an unrestricted donation from the Novo Nordisk
Foundation (www.metabol.ku.dk). For Pizarra, work on this study was support by ISCIII
PI11/00880 and ISCIII PS09/02117. For Segovia, this work was supported by grants FEDER
2FD 1997/2309 from the Fondo Europeo para el Desarrollo Regional, Red de Centros RCMN
(C03/08), FIS 03/1618, from Instituto de Salud Carlos III-RETIC RD06/0015/0012, Madrid,
Spain, CIBER in Diabetes and Associated Metabolic Disorders (ISCIII, Ministerio de Ciencia e
Innovación) and Madrid Autonomous Community (MOIR S2010/BMD-2423), and from
Educational Grants from Eli Lilly Lab, Spain, Bayer Pharmaceutical Co., Spain and
Fundación Mutua Madrileña 2008, Spain.
Page 31 of 104 Diabetes

References
1. Morris AP, Voight BF, Teslovich TM, Ferreira T, Segre AV, Steinthorsdottir V,
Strawbridge RJ, Khan H, Grallert H, Mahajan A, Prokopenko I, Kang HM, Dina C, Esko
T, Fraser RM, Kanoni S, Kumar A, Lagou V, Langenberg C, Luan J, Lindgren CM,
Muller-Nurasyid M, Pechlivanis S, Rayner NW, Scott LJ, Wiltshire S, Yengo L,
Kinnunen L, Rossin EJ, Raychaudhuri S, Johnson AD, Dimas AS, Loos RJ, Vedantam S,
Chen H, Florez JC, Fox C, Liu CT, Rybin D, Couper DJ, Kao WH, Li M, Cornelis MC,
Kraft P, Sun Q, van Dam RM, Stringham HM, Chines PS, Fischer K, Fontanillas P,
Holmen OL, Hunt SE, Jackson AU, Kong A, Lawrence R, Meyer J, Perry JR, Platou CG,
Potter S, Rehnberg E, Robertson N, Sivapalaratnam S, Stancakova A, Stirrups K,
Thorleifsson G, Tikkanen E, Wood AR, Almgren P, Atalay M, Benediktsson R,
Bonnycastle LL, Burtt N, Carey J, Charpentier G, Crenshaw AT, Doney AS, Dorkhan M,
Edkins S, Emilsson V, Eury E, Forsen T, Gertow K, Gigante B, Grant GB, Groves CJ,
Guiducci C, Herder C, Hreidarsson AB, Hui J, James A, Jonsson A, Rathmann W, Klopp
N, Kravic J, Krjutskov K, Langford C, Leander K, Lindholm E, Lobbens S, Mannisto S,
Mirza G, Muhleisen TW, Musk B, Parkin M, Rallidis L, Saramies J, Sennblad B, Shah S,
Sigurethsson G, Silveira A, Steinbach G, Thorand B, Trakalo J, Veglia F, Wennauer R,
Winckler W, Zabaneh D, Campbell H, van Duijn C, Uitterlinden AG, Hofman A,
Sijbrands E, Abecasis GR, Owen KR, Zeggini E, Trip MD, Forouhi NG, Syvanen AC,
Eriksson JG, Peltonen L, Nothen MM, Balkau B, Palmer CN, Lyssenko V, Tuomi T,
Isomaa B, Hunter DJ, Qi L, Wellcome Trust Case Control C, Meta-Analyses of G,
Insulin-related traits Consortium I, Genetic Investigation of ATC, Asian Genetic
Epidemiology Network-Type 2 Diabetes C, South Asian Type 2 Diabetes C, Shuldiner
AR, Roden M, Barroso I, Wilsgaard T, Beilby J, Hovingh K, Price JF, Wilson JF,
Rauramaa R, Lakka TA, Lind L, Dedoussis G, Njolstad I, Pedersen NL, Khaw KT,
Wareham NJ, Keinanen-Kiukaanniemi SM, Saaristo TE, Korpi-Hyovalti E, Saltevo J,
Laakso M, Kuusisto J, Metspalu A, Collins FS, Mohlke KL, Bergman RN, Tuomilehto J,
Boehm BO, Gieger C, Hveem K, Cauchi S, Froguel P, Baldassarre D, Tremoli E,
Humphries SE, Saleheen D, Danesh J, Ingelsson E, Ripatti S, Salomaa V, Erbel R, Jockel
KH, Moebus S, Peters A, Illig T, de Faire U, Hamsten A, Morris AD, Donnelly PJ,
Frayling TM, Hattersley AT, Boerwinkle E, Melander O, Kathiresan S, Nilsson PM,
Deloukas P, Thorsteinsdottir U, Groop LC, Stefansson K, Hu F, Pankow JS, Dupuis J,
Meigs JB, Altshuler D, Boehnke M, McCarthy MI, Replication DIG, Meta-analysis C.
Large-scale association analysis provides insights into the genetic architecture and
pathophysiology of type 2 diabetes. Nat Genet 2012; 44:981-990
2. Kahn SE. The relative contributions of insulin resistance and beta-cell dysfunction to the
pathophysiology of Type 2 diabetes. Diabetologia 2003; 46:3-19
3. Dimas AS, Lagou V, Barker A, Knowles JW, Magi R, Hivert MF, Benazzo A, Rybin D,
Jackson AU, Stringham HM, Song C, Fischer-Rosinsky A, Boesgaard TW, Grarup N,
Abbasi FA, Assimes TL, Hao K, Yang X, Lecoeur C, Barroso I, Bonnycastle LL,
Bottcher Y, Bumpstead S, Chines PS, Erdos MR, Graessler J, Kovacs P, Morken MA,
Narisu N, Payne F, Stancakova A, Swift AJ, Tonjes A, Bornstein SR, Cauchi S, Froguel
P, Meyre D, Schwarz PE, Haring HU, Smith U, Boehnke M, Bergman RN, Collins FS,
Mohlke KL, Tuomilehto J, Quertemous T, Lind L, Hansen T, Pedersen O, Walker M,
Pfeiffer AF, Spranger J, Stumvoll M, Meigs JB, Wareham NJ, Kuusisto J, Laakso M,
Page 32 of 104Diabetes

Langenberg C, Dupuis J, Watanabe RM, Florez JC, Ingelsson E, McCarthy MI,
Prokopenko I, Investigators M. Impact of type 2 diabetes susceptibility variants on
quantitative glycemic traits reveals mechanistic heterogeneity. Diabetes 2014; 63:2158-
2171
4. Bergman RN, Zaccaro DJ, Watanabe RM, Haffner SM, Saad MF, Norris JM,
Wagenknecht LE, Hokanson JE, Rotter JI, Rich SS. Minimal model-based insulin
sensitivity has greater heritability and a different genetic basis than homeostasis model
assessment or fasting insulin. Diabetes 2003; 52:2168-2174
5. Rasmussen-Torvik LJ, Pankow JS, Jacobs DR, Steffen LM, Moran AM, Steinberger J,
Sinaiko AR. Heritability and genetic correlations of insulin sensitivity measured by the
euglycaemic clamp. Diabet Med 2007; 24:1286-1289
6. Ingelsson E, Langenberg C, Hivert MF, Prokopenko I, Lyssenko V, Dupuis J, Magi R,
Sharp S, Jackson AU, Assimes TL, Shrader P, Knowles JW, Zethelius B, Abbasi FA,
Bergman RN, Bergmann A, Berne C, Boehnke M, Bonnycastle LL, Bornstein SR,
Buchanan TA, Bumpstead SJ, Bottcher Y, Chines P, Collins FS, Cooper CC, Dennison
EM, Erdos MR, Ferrannini E, Fox CS, Graessler J, Hao K, Isomaa B, Jameson KA,
Kovacs P, Kuusisto J, Laakso M, Ladenvall C, Mohlke KL, Morken MA, Narisu N,
Nathan DM, Pascoe L, Payne F, Petrie JR, Sayer AA, Schwarz PE, Scott LJ, Stringham
HM, Stumvoll M, Swift AJ, Syvanen AC, Tuomi T, Tuomilehto J, Tonjes A, Valle TT,
Williams GH, Lind L, Barroso I, Quertermous T, Walker M, Wareham NJ, Meigs JB,
McCarthy MI, Groop L, Watanabe RM, Florez JC. Detailed physiologic characterization
reveals diverse mechanisms for novel genetic Loci regulating glucose and insulin
metabolism in humans. Diabetes 59:1266-1275
7. Knowles JW, Xie W, Zhang Z, Chennemsetty I, Assimes TL, Paananen J, Hansson O,
Pankow J, Goodarzi MO, Carcamo-Orive I, Morris AP, Chen YD, Makinen VP, Ganna
A, Mahajan A, Guo X, Abbasi F, Greenawalt DM, Lum P, Molony C, Lind L, Lindgren
C, Raffel LJ, Tsao PS, Consortium R, Study E, Consortium G, Study SA, Schadt EE,
Rotter JI, Sinaiko A, Reaven G, Yang X, Hsiung CA, Groop L, Cordell HJ, Laakso M,
Hao K, Ingelsson E, Frayling TM, Weedon MN, Walker M, Quertermous T.
Identification and validation of N-acetyltransferase 2 as an insulin sensitivity gene. J Clin
Invest 2015; 125:1739-1751
8. Stumvoll M, Mitrakou A, Pimenta W, Jenssen T, Yki-Jarvinen H, Van Haeften T, Renn
W, Gerich J. Use of the oral glucose tolerance test to assess insulin release and insulin
sensitivity. Diabetes Care 2000; 23:295-301
9. Stumvoll M, Van Haeften T, Fritsche A, Gerich J. Oral glucose tolerance test indexes for
insulin sensitivity and secretion based on various availabilities of sampling times.
Diabetes Care 2001; 24:796-797
10. Manning AK, Hivert M-F, Scott RA, Grimsby JL, Bouatia-Naji N, Chen H, Rybin D, Liu
C-T, Bielak LF, Prokopenko I, Amin N, Barnes D, Cadby G, Hottenga J-J, Ingelsson E,
Jackson AU, Johnson T, Kanoni S, Ladenvall C, Lagou V, Lahti J, Lecoeur C, Liu Y,
Martinez-Larrad MT, Montasser ME, Navarro P, Perry JRB, Rasmussen-Torvik LJ, Salo
P, Sattar N, Shungin D, Strawbridge RJ, Tanaka T, van Duijn CM, An P, de Andrade M,
Andrews JS, Aspelund T, Atalay M, Aulchenko Y, Balkau B, Bandinelli S, Beckmann
JS, Beilby JP, Bellis C, Bergman RN, Blangero J, Boban M, Boehnke M, Boerwinkle E,
Bonnycastle LL, Boomsma DI, Borecki IB, Bottcher Y, Bouchard C, Brunner E, Budimir
D, Campbell H, Carlson O, Chines PS, Clarke R, Collins FS, Corbaton-Anchuelo A,
Page 33 of 104 Diabetes

Couper D, de Faire U, Dedoussis GV, Deloukas P, Dimitriou M, Egan JM, Eiriksdottir G,
Erdos MR, Eriksson JG, Eury E, Ferrucci L, Ford I, Forouhi NG, Fox CS, Franzosi MG,
Franks PW, Frayling TM, Froguel P, Galan P, de Geus E, Gigante B, Glazer NL, Goel A,
Groop L, Gudnason V, Hallmans G, Hamsten A, Hansson O, Harris TB, Hayward C,
Heath S, Hercberg S, Hicks AA, Hingorani A, Hofman A, Hui J, Hung J, Jarvelin M-R,
Jhun MA, Johnson PCD, Jukema JW, Jula A, Kao WH, Kaprio J, Kardia SLR, Keinanen-
Kiukaanniemi S, Kivimaki M, Kolcic I, Kovacs P, Kumari M, Kuusisto J, Kyvik KO,
Laakso M, Lakka T, Lannfelt L, Lathrop GM, Launer LJ, Leander K, Li G, Lind L,
Lindstrom J, Lobbens S, Loos RJF, Luan Ja, Lyssenko V, Magi R, Magnusson PKE,
Marmot M, Meneton P, Mohlke KL, Mooser V, Morken MA, Miljkovic I, Narisu N,
O'Connell J, Ong KK, Oostra BA, Palmer LJ, Palotie A, Pankow JS, Peden JF, Pedersen
NL, Pehlic M, Peltonen L, Penninx B, Pericic M, Perola M, Perusse L, Peyser PA,
Polasek O, Pramstaller PP, Province MA, Raikkonen K, Rauramaa R, Rehnberg E, Rice
K, Rotter JI, Rudan I, Ruokonen A, Saaristo T, Sabater-Lleal M, Salomaa V, Savage DB,
Saxena R, Schwarz P, Seedorf U, Sennblad B, Serrano-Rios M, Shuldiner AR, Sijbrands
EJG, Siscovick DS, Smit JH, Small KS, Smith NL, Smith AV, Stancakova A, Stirrups K,
Stumvoll M, Sun YV, Swift AJ, Tonjes A, Tuomilehto J, Trompet S, Uitterlinden AG,
Uusitupa M, Vikstrom M, Vitart V, Vohl M-C, Voight BF, Vollenweider P, Waeber G,
Waterworth DM, Watkins H, Wheeler E, Widen E, Wild SH, Willems SM, Willemsen G,
Wilson JF, Witteman JCM, Wright AF, Yaghootkar H, Zelenika D, Zemunik T, Zgaga L,
Wareham NJ, McCarthy MI, Barroso I, Watanabe RM, Florez JC, Dupuis J, Meigs JB,
Langenberg C. A genome-wide approach accounting for body mass index identifies
genetic variants influencing fasting glycemic traits and insulin resistance. Nat Genet
2012; 44:659-669
11. Manning AK, LaValley M, Liu CT, Rice K, An P, Liu Y, Miljkovic I, Rasmussen-Torvik
L, Harris TB, Province MA, Borecki IB, Florez JC, Meigs JB, Cupples LA, Dupuis J.
Meta-analysis of gene-environment interaction: joint estimation of SNP and SNP x
environment regression coefficients. Genet Epidemiol 2011; 35:11-18
12. Scott RA, Lagou V, Welch RP, Wheeler E, Montasser ME, Luan J, Magi R, Strawbridge
RJ, Rehnberg E, Gustafsson S, Kanoni S, Rasmussen-Torvik LJ, Yengo L, Lecoeur C,
Shungin D, Sanna S, Sidore C, Johnson PC, Jukema JW, Johnson T, Mahajan A, Verweij
N, Thorleifsson G, Hottenga JJ, Shah S, Smith AV, Sennblad B, Gieger C, Salo P, Perola
M, Timpson NJ, Evans DM, Pourcain BS, Wu Y, Andrews JS, Hui J, Bielak LF, Zhao
W, Horikoshi M, Navarro P, Isaacs A, O'Connell JR, Stirrups K, Vitart V, Hayward C,
Esko T, Mihailov E, Fraser RM, Fall T, Voight BF, Raychaudhuri S, Chen H, Lindgren
CM, Morris AP, Rayner NW, Robertson N, Rybin D, Liu CT, Beckmann JS, Willems
SM, Chines PS, Jackson AU, Kang HM, Stringham HM, Song K, Tanaka T, Peden JF,
Goel A, Hicks AA, An P, Muller-Nurasyid M, Franco-Cereceda A, Folkersen L, Marullo
L, Jansen H, Oldehinkel AJ, Bruinenberg M, Pankow JS, North KE, Forouhi NG, Loos
RJ, Edkins S, Varga TV, Hallmans G, Oksa H, Antonella M, Nagaraja R, Trompet S,
Ford I, Bakker SJ, Kong A, Kumari M, Gigante B, Herder C, Munroe PB, Caulfield M,
Antti J, Mangino M, Small K, Miljkovic I, Liu Y, Atalay M, Kiess W, James AL,
Rivadeneira F, Uitterlinden AG, Palmer CN, Doney AS, Willemsen G, Smit JH,
Campbell S, Polasek O, Bonnycastle LL, Hercberg S, Dimitriou M, Bolton JL, Fowkes
GR, Kovacs P, Lindstrom J, Zemunik T, Bandinelli S, Wild SH, Basart HV, Rathmann
W, Grallert H, Replication DIG, Meta-analysis C, Maerz W, Kleber ME, Boehm BO,
Page 34 of 104Diabetes

Peters A, Pramstaller PP, Province MA, Borecki IB, Hastie ND, Rudan I, Campbell H,
Watkins H, Farrall M, Stumvoll M, Ferrucci L, Waterworth DM, Bergman RN, Collins
FS, Tuomilehto J, Watanabe RM, de Geus EJ, Penninx BW, Hofman A, Oostra BA,
Psaty BM, Vollenweider P, Wilson JF, Wright AF, Hovingh GK, Metspalu A, Uusitupa
M, Magnusson PK, Kyvik KO, Kaprio J, Price JF, Dedoussis GV, Deloukas P, Meneton
P, Lind L, Boehnke M, Shuldiner AR, van Duijn CM, Morris AD, Toenjes A, Peyser PA,
Beilby JP, Korner A, Kuusisto J, Laakso M, Bornstein SR, Schwarz PE, Lakka TA,
Rauramaa R, Adair LS, Smith GD, Spector TD, Illig T, de Faire U, Hamsten A,
Gudnason V, Kivimaki M, Hingorani A, Keinanen-Kiukaanniemi SM, Saaristo TE,
Boomsma DI, Stefansson K, van der Harst P, Dupuis J, Pedersen NL, Sattar N, Harris
TB, Cucca F, Ripatti S, Salomaa V, Mohlke KL, Balkau B, Froguel P, Pouta A, Jarvelin
MR, Wareham NJ, Bouatia-Naji N, McCarthy MI, Franks PW, Meigs JB, Teslovich TM,
Florez JC, Langenberg C, Ingelsson E, Prokopenko I, Barroso I. Large-scale association
analyses identify new loci influencing glycemic traits and provide insight into the
underlying biological pathways. Nat Genet 2012; 44:991-1005
13. Knowles JW, Assimes TL, Tsao PS, Natali A, Mari A, Quertermous T, Reaven GM,
Abbasi F. Measurement of insulin-mediated glucose uptake: direct comparison of the
modified insulin suppression test and the euglycemic, hyperinsulinemic clamp.
Metabolism 2013; 62:548-553
14. Yang J, Ferreira T, Morris AP, Medland SE, Genetic Investigation of ATC, Replication
DIG, Meta-analysis C, Madden PA, Heath AC, Martin NG, Montgomery GW, Weedon
MN, Loos RJ, Frayling TM, McCarthy MI, Hirschhorn JN, Goddard ME, Visscher PM.
Conditional and joint multiple-SNP analysis of GWAS summary statistics identifies
additional variants influencing complex traits. Nat Genet 2012; 44:369-375, S361-363
15. Almasy L, Blangero J. Multipoint quantitative-trait linkage analysis in general pedigrees.
Am J Hum Genet 1998; 62:1198-1211
16. Otten J, Ahren B, Olsson T. Surrogate measures of insulin sensitivity vs the
hyperinsulinaemic-euglycaemic clamp: a meta-analysis. Diabetologia 2014; 57:1781-
1788
17. Kashyap SR, Belfort R, Berria R, Suraamornkul S, Pratipranawatr T, Finlayson J,
Barrentine A, Bajaj M, Mandarino L, DeFronzo R, Cusi K. Discordant effects of a
chronic physiological increase in plasma FFA on insulin signaling in healthy subjects
with or without a family history of type 2 diabetes. Am J Physiol Endocrinol Metab 2004;
287:E537-546
18. Perseghin G, Ghosh S, Gerow K, Shulman GI. Metabolic defects in lean nondiabetic
offspring of NIDDM parents: a cross-sectional study. Diabetes 1997; 46:1001-1009
19. Vaag A, Henriksen JE, Beck-Nielsen H. Decreased insulin activation of glycogen
synthase in skeletal muscles in young nonobese Caucasian first-degree relatives of
patients with non-insulin-dependent diabetes mellitus. J Clin Invest 1992; 89:782-788
20. Saxena R, Elbers CC, Guo Y, Peter I, Gaunt TR, Mega JL, Lanktree MB, Tare A,
Castillo BA, Li YR, Johnson T, Bruinenberg M, Gilbert-Diamond D, Rajagopalan R,
Voight BF, Balasubramanyam A, Barnard J, Bauer F, Baumert J, Bhangale T, Bohm BO,
Braund PS, Burton PR, Chandrupatla HR, Clarke R, Cooper-DeHoff RM, Crook ED,
Davey-Smith G, Day IN, de Boer A, de Groot MC, Drenos F, Ferguson J, Fox CS,
Furlong CE, Gibson Q, Gieger C, Gilhuijs-Pederson LA, Glessner JT, Goel A, Gong Y,
Grant SF, Grobbee DE, Hastie C, Humphries SE, Kim CE, Kivimaki M, Kleber M,
Page 35 of 104 Diabetes

Meisinger C, Kumari M, Langaee TY, Lawlor DA, Li M, Lobmeyer MT, Maitland-van
der Zee AH, Meijs MF, Molony CM, Morrow DA, Murugesan G, Musani SK, Nelson
CP, Newhouse SJ, O'Connell JR, Padmanabhan S, Palmen J, Patel SR, Pepine CJ,
Pettinger M, Price TS, Rafelt S, Ranchalis J, Rasheed A, Rosenthal E, Ruczinski I, Shah
S, Shen H, Silbernagel G, Smith EN, Spijkerman AW, Stanton A, Steffes MW, Thorand
B, Trip M, van der Harst P, van der AD, van Iperen EP, van Setten J, van Vliet-
Ostaptchouk JV, Verweij N, Wolffenbuttel BH, Young T, Zafarmand MH, Zmuda JM,
Look ARG, consortium D, Boehnke M, Altshuler D, McCarthy M, Kao WH, Pankow JS,
Cappola TP, Sever P, Poulter N, Caulfield M, Dominiczak A, Shields DC, Bhatt DL,
Zhang L, Curtis SP, Danesh J, Casas JP, van der Schouw YT, Onland-Moret NC,
Doevendans PA, Dorn GW, 2nd, Farrall M, FitzGerald GA, Hamsten A, Hegele R,
Hingorani AD, Hofker MH, Huggins GS, Illig T, Jarvik GP, Johnson JA, Klungel OH,
Knowler WC, Koenig W, Marz W, Meigs JB, Melander O, Munroe PB, Mitchell BD,
Bielinski SJ, Rader DJ, Reilly MP, Rich SS, Rotter JI, Saleheen D, Samani NJ, Schadt
EE, Shuldiner AR, Silverstein R, Kottke-Marchant K, Talmud PJ, Watkins H, Asselbergs
FW, de Bakker PI, McCaffery J, Wijmenga C, Sabatine MS, Wilson JG, Reiner A,
Bowden DW, Hakonarson H, Siscovick DS, Keating BJ. Large-scale gene-centric meta-
analysis across 39 studies identifies type 2 diabetes loci. Am J Hum Genet 2012; 90:410-
425
21. Voight BF, Scott LJ, Steinthorsdottir V, Morris AP, Dina C, Welch RP, Zeggini E, Huth
C, Aulchenko YS, Thorleifsson G, McCulloch LJ, Ferreira T, Grallert H, Amin N, Wu G,
Willer CJ, Raychaudhuri S, McCarroll SA, Langenberg C, Hofmann OM, Dupuis J, Qi L,
Segre AV, van Hoek M, Navarro P, Ardlie K, Balkau B, Benediktsson R, Bennett AJ,
Blagieva R, Boerwinkle E, Bonnycastle LL, Bengtsson Bostrom K, Bravenboer B,
Bumpstead S, Burtt NP, Charpentier G, Chines PS, Cornelis M, Couper DJ, Crawford G,
Doney AS, Elliott KS, Elliott AL, Erdos MR, Fox CS, Franklin CS, Ganser M, Gieger C,
Grarup N, Green T, Griffin S, Groves CJ, Guiducci C, Hadjadj S, Hassanali N, Herder C,
Isomaa B, Jackson AU, Johnson PR, Jorgensen T, Kao WH, Klopp N, Kong A, Kraft P,
Kuusisto J, Lauritzen T, Li M, Lieverse A, Lindgren CM, Lyssenko V, Marre M,
Meitinger T, Midthjell K, Morken MA, Narisu N, Nilsson P, Owen KR, Payne F, Perry
JR, Petersen AK, Platou C, Proenca C, Prokopenko I, Rathmann W, Rayner NW,
Robertson NR, Rocheleau G, Roden M, Sampson MJ, Saxena R, Shields BM, Shrader P,
Sigurdsson G, Sparso T, Strassburger K, Stringham HM, Sun Q, Swift AJ, Thorand B,
Tichet J, Tuomi T, van Dam RM, van Haeften TW, van Herpt T, van Vliet-Ostaptchouk
JV, Walters GB, Weedon MN, Wijmenga C, Witteman J, Bergman RN, Cauchi S,
Collins FS, Gloyn AL, Gyllensten U, Hansen T, Hide WA, Hitman GA, Hofman A,
Hunter DJ, Hveem K, Laakso M, Mohlke KL, Morris AD, Palmer CN, Pramstaller PP,
Rudan I, Sijbrands E, Stein LD, Tuomilehto J, Uitterlinden A, Walker M, Wareham NJ,
Watanabe RM, Abecasis GR, Boehm BO, Campbell H, Daly MJ, Hattersley AT, Hu FB,
Meigs JB, Pankow JS, Pedersen O, Wichmann HE, Barroso I, Florez JC, Frayling TM,
Groop L, Sladek R, Thorsteinsdottir U, Wilson JF, Illig T, Froguel P, van Duijn CM,
Stefansson K, Altshuler D, Boehnke M, McCarthy MI, investigators M, Consortium G.
Twelve type 2 diabetes susceptibility loci identified through large-scale association
analysis. Nat Genet 2010; 42:579-589
22. Shungin D, Winkler TW, Croteau-Chonka DC, Ferreira T, Locke AE, Magi R,
Strawbridge RJ, Pers TH, Fischer K, Justice AE, Workalemahu T, Wu JM, Buchkovich
Page 36 of 104Diabetes

ML, Heard-Costa NL, Roman TS, Drong AW, Song C, Gustafsson S, Day FR, Esko T,
Fall T, Kutalik Z, Luan J, Randall JC, Scherag A, Vedantam S, Wood AR, Chen J,
Fehrmann R, Karjalainen J, Kahali B, Liu CT, Schmidt EM, Absher D, Amin N,
Anderson D, Beekman M, Bragg-Gresham JL, Buyske S, Demirkan A, Ehret GB, Feitosa
MF, Goel A, Jackson AU, Johnson T, Kleber ME, Kristiansson K, Mangino M, Mateo
Leach I, Medina-Gomez C, Palmer CD, Pasko D, Pechlivanis S, Peters MJ, Prokopenko
I, Stancakova A, Ju Sung Y, Tanaka T, Teumer A, Van Vliet-Ostaptchouk JV, Yengo L,
Zhang W, Albrecht E, Arnlov J, Arscott GM, Bandinelli S, Barrett A, Bellis C, Bennett
AJ, Berne C, Bluher M, Bohringer S, Bonnet F, Bottcher Y, Bruinenberg M, Carba DB,
Caspersen IH, Clarke R, Daw EW, Deelen J, Deelman E, Delgado G, Doney AS, Eklund
N, Erdos MR, Estrada K, Eury E, Friedrich N, Garcia ME, Giedraitis V, Gigante B, Go
AS, Golay A, Grallert H, Grammer TB, Grassler J, Grewal J, Groves CJ, Haller T,
Hallmans G, Hartman CA, Hassinen M, Hayward C, Heikkila K, Herzig KH, Helmer Q,
Hillege HL, Holmen O, Hunt SC, Isaacs A, Ittermann T, James AL, Johansson I,
Juliusdottir T, Kalafati IP, Kinnunen L, Koenig W, Kooner IK, Kratzer W, Lamina C,
Leander K, Lee NR, Lichtner P, Lind L, Lindstrom J, Lobbens S, Lorentzon M, Mach F,
Magnusson PK, Mahajan A, McArdle WL, Menni C, Merger S, Mihailov E, Milani L,
Mills R, Moayyeri A, Monda KL, Mooijaart SP, Muhleisen TW, Mulas A, Muller G,
Muller-Nurasyid M, Nagaraja R, Nalls MA, Narisu N, Glorioso N, Nolte IM, Olden M,
Rayner NW, Renstrom F, Ried JS, Robertson NR, Rose LM, Sanna S, Scharnagl H,
Scholtens S, Sennblad B, Seufferlein T, Sitlani CM, Vernon Smith A, Stirrups K,
Stringham HM, Sundstrom J, Swertz MA, Swift AJ, Syvanen AC, Tayo BO, Thorand B,
Thorleifsson G, Tomaschitz A, Troffa C, van Oort FV, Verweij N, Vonk JM, Waite LL,
Wennauer R, Wilsgaard T, Wojczynski MK, Wong A, Zhang Q, Hua Zhao J, Brennan
EP, Choi M, Eriksson P, Folkersen L, Franco-Cereceda A, Gharavi AG, Hedman AK,
Hivert MF, Huang J, Kanoni S, Karpe F, Keildson S, Kiryluk K, Liang L, Lifton RP, Ma
B, McKnight AJ, McPherson R, Metspalu A, Min JL, Moffatt MF, Montgomery GW,
Murabito JM, Nicholson G, Nyholt DR, Olsson C, Perry JR, Reinmaa E, Salem RM,
Sandholm N, Schadt EE, Scott RA, Stolk L, Vallejo EE, Westra HJ, Zondervan KT,
Consortium AD, Consortium CAD, Consortium CK, Consortium G, Consortium G, Glgc,
Icbp, International Endogene C, LifeLines Cohort S, Investigators M, Mu TC,
Consortium P, ReproGen C, Amouyel P, Arveiler D, Bakker SJ, Beilby J, Bergman RN,
Blangero J, Brown MJ, Burnier M, Campbell H, Chakravarti A, Chines PS, Claudi-
Boehm S, Collins FS, Crawford DC, Danesh J, de Faire U, de Geus EJ, Dorr M, Erbel R,
Eriksson JG, Farrall M, Ferrannini E, Ferrieres J, Forouhi NG, Forrester T, Franco OH,
Gansevoort RT, Gieger C, Gudnason V, Haiman CA, Harris TB, Hattersley AT,
Heliovaara M, Hicks AA, Hingorani AD, Hoffmann W, Hofman A, Homuth G,
Humphries SE, Hypponen E, Illig T, Jarvelin MR, Johansen B, Jousilahti P, Jula AM,
Kaprio J, Kee F, Keinanen-Kiukaanniemi SM, Kooner JS, Kooperberg C, Kovacs P,
Kraja AT, Kumari M, Kuulasmaa K, Kuusisto J, Lakka TA, Langenberg C, Le Marchand
L, Lehtimaki T, Lyssenko V, Mannisto S, Marette A, Matise TC, McKenzie CA,
McKnight B, Musk AW, Mohlenkamp S, Morris AD, Nelis M, Ohlsson C, Oldehinkel
AJ, Ong KK, Palmer LJ, Penninx BW, Peters A, Pramstaller PP, Raitakari OT, Rankinen
T, Rao DC, Rice TK, Ridker PM, Ritchie MD, Rudan I, Salomaa V, Samani NJ,
Saramies J, Sarzynski MA, Schwarz PE, Shuldiner AR, Staessen JA, Steinthorsdottir V,
Stolk RP, Strauch K, Tonjes A, Tremblay A, Tremoli E, Vohl MC, Volker U,
Page 37 of 104 Diabetes
Vollenweider P, Wilson JF, Witteman JC, Adair LS, Bochud M, Boehm BO, Bornstein
SR, Bouchard C, Cauchi S, Caulfield MJ, Chambers JC, Chasman DI, Cooper RS,
Dedoussis G, Ferrucci L, Froguel P, Grabe HJ, Hamsten A, Hui J, Hveem K, Jockel KH,
Kivimaki M, Kuh D, Laakso M, Liu Y, Marz W, Munroe PB, Njolstad I, Oostra BA,
Palmer CN, Pedersen NL, Perola M, Perusse L, Peters U, Power C, Quertermous T,
Rauramaa R, Rivadeneira F, Saaristo TE, Saleheen D, Sinisalo J, Slagboom PE, Snieder
H, Spector TD, Thorsteinsdottir U, Stumvoll M, Tuomilehto J, Uitterlinden AG, Uusitupa
M, van der Harst P, Veronesi G, Walker M, Wareham NJ, Watkins H, Wichmann HE,
Abecasis GR, Assimes TL, Berndt SI, Boehnke M, Borecki IB, Deloukas P, Franke L,
Frayling TM, Groop LC, Hunter DJ, Kaplan RC, O'Connell JR, Qi L, Schlessinger D,
Strachan DP, Stefansson K, van Duijn CM, Willer CJ, Visscher PM, Yang J, Hirschhorn
JN, Zillikens MC, McCarthy MI, Speliotes EK, North KE, Fox CS, Barroso I, Franks
PW, Ingelsson E, Heid IM, Loos RJ, Cupples LA, Morris AP, Lindgren CM, Mohlke KL.
New genetic loci link adipose and insulin biology to body fat distribution. Nature 2015;
518:187-196
23. Brenner D, Mak TW. Mitochondrial cell death effectors. Curr Opin Cell Biol 2009;
21:871-877
24. Luciani DS, White SA, Widenmaier SB, Saran VV, Taghizadeh F, Hu X, Allard MF,
Johnson JD. Bcl-2 and Bcl-xL suppress glucose signaling in pancreatic beta-cells.
Diabetes 2013; 62:170-182
25. Roberts AW, Davids MS, Pagel JM, Kahl BS, Puvvada SD, Gerecitano JF, Kipps TJ,
Anderson MA, Brown JR, Gressick L, Wong S, Dunbar M, Zhu M, Desai MB, Cerri E,
Heitner Enschede S, Humerickhouse RA, Wierda WG, Seymour JF. Targeting BCL2
with Venetoclax in Relapsed Chronic Lymphocytic Leukemia. N Engl J Med 2016;
374:311-322
26. Stancakova A, Javorsky M, Kuulasmaa T, Haffner SM, Kuusisto J, Laakso M. Changes
in insulin sensitivity and insulin release in relation to glycemia and glucose tolerance in
6,414 Finnish men. Diabetes 2009; 58:1212-1221
Page 38 of 104Diabetes

Table 1. Cohort and Participant Demographics
Cohort N Female
(%)
Age
(years)
BMI
(kg/m2)
Fasting
Glucose
(mmol/l )
Fasting
Insulin
(pmol/l )
Stumvoll ISI
(µmol*pmol/kg*min*l)
Discovery
FHS 2602 54 54.0 ± 9.9 26.8 ± 4.5 5.2 ± 0.5 28.6 ± 9.9 0.111 ± 0.012
Sorbs 802 60 46.3 ± 15.9 26.5 ± 6.4 5.5 ± 1.2 40.7 ± 26.5 0.105 ± 0.023
FUSION 462 63 66.5 ± 6.7 27.6 ± 4.2 5.1 ± 0.5 68.5 ± 36.0 0.087 ± 0.023
CHS 2761 62 72.3 ± 5.3 26.0 ± 4.3 5.5 ± 0.5 93.3 ± 47.8 0.059 ± 0.038
LURIC 962 24 61.9 ± 27.1 27.1 ± 3.8 5.5 ± 0.6 61.6 ± 49.9 0.065 ± 0.038
ULSAM 962 0 71.0 ± 0.6 26.0 ± 3.2 5.4 ± 0.6 73.0 ± 40.1 0.074 ± 0.031
METSIM 7388 0 57.0 ± 6.96 26.8 ± 3.8 5.7 ± 0.5 49.8 ± 35.3 0.093 ±0.030
Replication
EUGENE2 885 56 39.4 ± 9.2 26.5 ± 4.8 5.1 ± 0.5 49.0 ± 34.9 0.091 ± 0.028
Page 39 of 104 Diabetes

Amish Studies 334 61 45 ± 12.7 27.4 ± 4.7 4.9 ± 0.5 63.4 ± 26.0 0.09 ± 0.02
RISC 921 56 44 ± 8.37 25.5 ± 4.0 5.1 ± 0.6 34.4 ± 18.7 0.106 ± 0.018
Tuebingen 2470 65 40.2 ± 13.2 30.9 ± 9.6 5.2 ± 0.6 83.4 ± 72.2 0.070 ± 0.049
Inter99 5318 51 45.9 ± 7.9 26.1 ± 4.4 5.5 ± 0.5 41.1 ± 26.3 0.101 ± 0.021
Segovia 420 53 52.1 ± 11.4 26.7 ± 3.8 4.5 ± 0.6 71.2 ± 39.7 0.087 ± 0.025
Pizarra 640 66 43.6 ± 13.0 27.8 ± 4.9 5.4 ± 0.7 46.6 ± 34.2 0.101 ± 0.023
Botnia Study 1235 52 58.3 ± 10.2 27.1 ± 3.9 5.4 ± 0.5 44.7 ± 28.7 0.099 ± 0.020
1936 Birth Cohort 576 54 60.5 ± 0.5 26.5 ± 4.0 5.2 ± 0.5 42.5 ± 23.7 0.098 ± 0.022
Ely Study 1442 54 61.1 ± 9.2 27.3 ± 4.8 5.00 ± 0.56 57.1 ± 35.7 0.088 ± 0.031
Continuous results are shown as mean ± standard deviation. FHS: Framingham Heart Study; FUSION: Finland-United States
Investigation of NIDDM; CHS: Cardiovascular Health Study; LURIC: Ludwigshafen Risk and Cardiovascular Heath; ULSAM: The
Uppsala Longitudinal Study of Adult Men; METSIM: Metabolic Syndrome in Men; EUGENE2: European Network on Functional
Genomics of Type 2 Diabetes; RISC: Relationship between Insulin Sensitivity and Cardiovascular Risk Study; Tuebingen: Tuebingen
Family study for type 2 Diabetes; ISI: insulin sensitivity index. Additional information for each cohort can be found in Supplemental
Table 1.
Page 40 of 104Diabetes
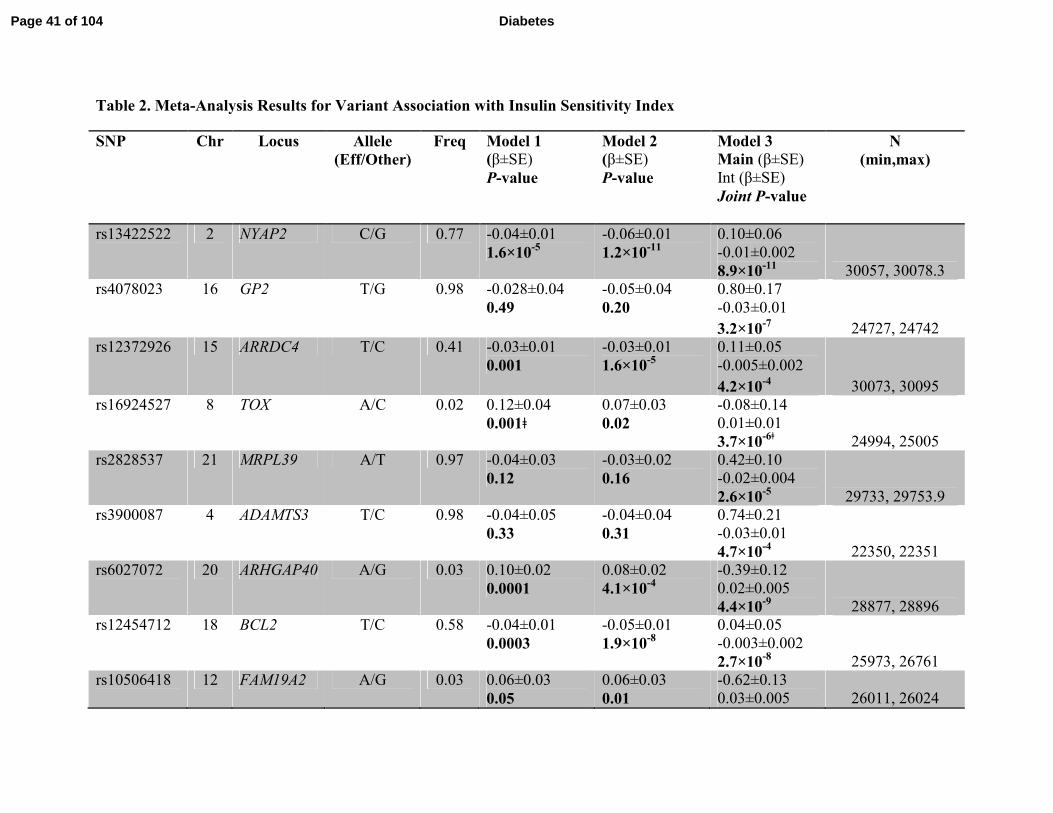
Table 2. Meta-Analysis Results for Variant Association with Insulin Sensitivity Index
SNP Chr Locus Allele
(Eff/Other)
Freq Model 1
(β±SE)
P-value
Model 2
(β±SE)
P-value
Model 3
Main (β±SE)
Int (β±SE)
Joint P-value
N
(min,max)
rs13422522 2 NYAP2 C/G 0.77 -0.04±0.01
1.6×10⁻⁵
-0.06±0.01
1.2×10⁻¹¹
0.10±0.06
-0.01±0.002
8.9×10⁻¹¹
30057, 30078.3
rs4078023 16 GP2 T/G 0.98 -0.028±0.04
0.49
-0.05±0.04
0.20
0.80±0.17
-0.03±0.01
3.2×10⁻⁷
24727, 24742
rs12372926 15 ARRDC4 T/C 0.41 -0.03±0.01
0.001
-0.03±0.01
1.6×10⁻⁵
0.11±0.05
-0.005±0.002
4.2×10⁻⁴
30073, 30095
rs16924527 8 TOX A/C 0.02 0.12±0.04
0.001ǂ
0.07±0.03
0.02
-0.08±0.14
0.01±0.01
3.7×10⁻⁶ǂ
24994, 25005
rs2828537 21 MRPL39 A/T 0.97 -0.04±0.03
0.12
-0.03±0.02
0.16
0.42±0.10
-0.02±0.004
2.6×10⁻⁵
29733, 29753.9
rs3900087 4 ADAMTS3 T/C 0.98 -0.04±0.05
0.33
-0.04±0.04
0.31
0.74±0.21
-0.03±0.01
4.7×10⁻⁴
22350, 22351
rs6027072 20 ARHGAP40 A/G 0.03 0.10±0.02
0.0001
0.08±0.02
4.1×10⁻⁴
-0.39±0.12
0.02±0.005
4.4×10⁻⁹
28877, 28896
rs12454712 18 BCL2 T/C 0.58 -0.04±0.01
0.0003
-0.05±0.01
1.9×10⁻⁸
0.04±0.05
-0.003±0.002
2.7×10⁻⁸
25973, 26761
rs10506418 12 FAM19A2 A/G 0.03 0.06±0.03
0.05
0.06±0.03
0.01
-0.62±0.13
0.03±0.005 26011, 26024
Page 41 of 104 Diabetes

1.9×10⁻⁸
rs1857095 1 ELTD1 T/C 0.98 -0.01±0.03
0.84
-0.02±0.03
0.37
0.08±0.12
-0.0003±0.005
7.9×10⁻⁹ǂ
26596, 26608.9
rs11594101 10 NRG3 A/G 0.98 0.02±0.04
0.57
-0.002±0.03
0.94
0.62±0.14
-0.02±0.005
9.5×10⁻⁵
27885, 27904
rs12583553 13 FGF9 A/T 0.97 -0.04±0.03
0.19
-0.05±0.03
0.04
0.55±0.12
-0.02±0.005
3.6×10⁻⁹ǂ
29195, 29215
rs4548846 16 CDH13 T/C 0.02 0.02±0.04
0.72
-0.002±0.04
0.96
0.59±0.18
-0.03±0.01
1.1×10⁻⁵ǂ
18401, 18405.99
rs12522198 5 FAM134B A/G 0.02 -0.03±0.04
0.48
0.01±0.04
0.84
0.79±0.19
-0.03±0.01
1.6×10⁻⁴ǂ
19798, 20589
rs10483182 22 ISX A/G 0.01 0.06±0.04
0.17
0.03±0.04
0.39
-1.16±0.18
0.05±0.01
7.8×10⁻¹²ǂ
20399, 20409
rs10520638 15 AGBL1 T/C 0.01 0.004±0.05
0.93
-0.01±0.04
0.77
0.89±0.19
-0.04±0.01
1.2×10⁻⁷ǂ
12369, 12383
rs6013915 20 PFDN4 A/G 0.03 0.05±0.03
0.14
0.06±0.03
0.05
-0.84±0.19
0.04±0.01
1.5×10⁻⁹ǂ
23111, 23121.9
rs9658121 6 PPARD A/G 0.02 -0.01±0.04
0.80
0.02±0.04
0.63
-0.40±0.15
0.02±0.01
7.3×10⁻⁴ǂ
16973, 16985
rs10508754 10 KIAA1462 A/G 0.08 -0.03±0.02
0.08
-0.05±0.02
0.01
0.14±0.09
-0.01±0.004
0.07 25146, 25150
rs11627967 14 NPAS3 T/G 0.016 -0.02±0.05
0.69
-0.03±0.04
0.44
-0.94±0.21
0.04±0.01 17593, 17595.98
Page 42 of 104Diabetes

1.6×10⁻⁷ǂ
rs10495667 2 VSNL1 A/G 0.04 0.02±0.02
0.32
0.01±0.02
0.69
-0.51±0.12
0.02±0.005
3.8×10⁻⁵
27332, 27345.9
rs13059110 3 TXNDC6 T/G 0.13 -0.05±0.02
0.0001
-0.04±0.01
2.3×10⁻⁴
0.03±0.07
-0.002±0.003
0.01 26420, 26425
rs11790816 9 SH3GL2 T/C 0.02 0.01±0.03
0.63
0.02±0.03
0.45
-0.37±0.14
0.02±0.01
0.001ǂ 21814, 21833.92
Model 1 is adjusted for age and sex; Model 2 is adjusted for age, sex, and BMI; Model 3 assesses the combined influence of the
SNP effect adjusted for BMI and the interaction effect between the genotype and BMI on ISI. For Model 1 and Model 2, the
effect (β), standard error (SE), and P-values for the SNP are shown. For Model 3, the β and standard error (SE) are provided
for the SNP and the interaction; P-value is provided for the joint influence of the SNP and interaction effect. Effect sizes are
presented as standard deviation per effect allele. SNP: single nucleotide polymorphism; Chr: chromosome, Eff: effect allele;
Freq: frequency of the effect allele); ǂP-value for heterogeneity in the combined analysis of discovery and replication cohorts
P≤10-6
.
Page 43 of 104 Diabetes

Figure Legends
Figure 1. A) Correlation of ISI with M-value from insulin clamp and B) fasting insulin in
ULSAM. Insulin sensitivity was measured within the ULSAM discovery cohort (n=1025) using
the euglycemic hyperinsulinemic clamp (M-value), the modified Stumvoll ISI, and fasting
insulin. The ULSAM cohort contains only men and individuals with known diabetes were
excluded from these analyses. For the comparison of the M-value with ISI, the Pearson
correlation was 0.69 and the Spearman correlation was 0.71, which are consistent with prior
published reports. For the comparison of the ISI with fasting insulin, the Pearson correlation was
-0.45 and the Spearman correlation was -0.49.
Figure 2. The effect of rs10506418 (FAM19A2) on insulin sensitivity by BMI category. The
effect of the minor allele (A) at rs10506418 (FAM19A2) on the ISI is shown by body mass index
(BMI) category. At low BMI (<20kg/m2), the effect is negative. At each category of increasing
BMI above 20 kg/m2, the effect is positive and stronger.
Figure 3. The effect of rs10506418 (BCL2) on insulin sensitivity by BMI category. The effect
of the major allele (T) at rs10506418 (BCL2) on the ISI is shown by body mass index (BMI)
category. At each category of increasing BMI, the effect is negative and stronger.
Page 44 of 104Diabetes

Figure 1A.
177x177mm (200 x 200 DPI)
Page 45 of 104 Diabetes

Figure 1B.
177x177mm (200 x 200 DPI)
Page 46 of 104Diabetes
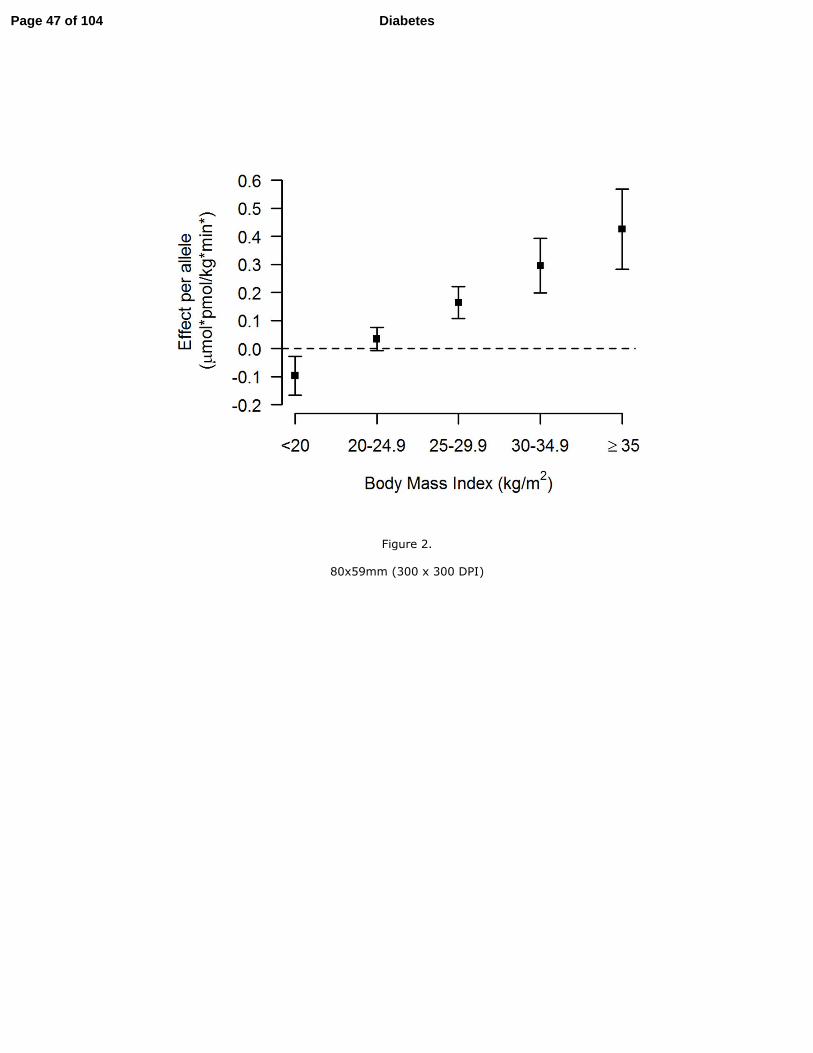
Figure 2.
80x59mm (300 x 300 DPI)
Page 47 of 104 Diabetes

Figure 3.
80x59mm (300 x 300 DPI)
Page 48 of 104Diabetes

Supplemental Table 1: Detailed cohort information
COHORT FHS Sorbs FUSION CHS LURIC
Discovery or Replication Effort Discovery Discovery Discovery Discovery
Ethnicity WhiteSorbs (Slavonic
origin)European descent White White
Country USA Germany Finland USA Germany
Collection Type Population-based Population-based Case-control Population-based Case-control
GLUCOSE MEASUREMENTS
Glucose Sample Fasting plasma
75g OGTT
(fasting, 30 min,
120 min), serum
Fasting plasma Fasting plasma Fasting plasma
Glucose Collection method Venipuncture
Overnight fast,
spinning within 1
hour after
collection, then
immediate quick-
freeze on dry ice
before transport,
further storage in
-80°C freezer
Overnight fast
and plasma
collected in
EDTA tubes
Venipuncture Venipuncture
Page 49 of 104 Diabetes

Glucose Assay Hexokinase
Hexokinase
method
(Automated
analyser
Modular, Roche
Diagnostics,
Mannheim,
Germany)
Glucose oxidase
method (Yellow
Springs
instruments,
Yellow Springs,
OH and
autoanalyser) and
hexokinase
method
Kodak Ektachem
700 analyzer
with reagents
(Eastman Kodak,
Rochester, NY)
Hexokinase
INSULIN MEASUREMENTS
Insulin SampleFasting and 120
min plasma
75g OGTT
(fasting, 30 min,
120 min), serum
Fasting plasma fasting and 120
min plasma
Fasting, 60 min
and 120 min
plasma
Insulin Collection method Venipuncture
Overnight fast,
spinning within 1
hour after
collection, then
immediate quick-
freeze on dry ice
before transport,
further storage in
-80°C freezer
Overnight fast
and plasma
collected in
EDTA tubes
Venipuncture Venipuncture
Insulin AssayDPC Coat-a-
Count Total IRI
AutoDELFIA
Insulin assay
(PerkinElmer
Life and
Analytical
Sciences, Turku,
Finland)
RIA with dextran
charcoal
separation
competitive
radioimmunoass
y (Diagnostic
Products Corp.,
Malver, PA)
AIA pack IRI /
AIA1200
Insulin Assay sensitivity > 8 pmol/L 3.0 pmol / L
CV=11% low
conc, 13% high
conc
5 - 400 mIU/L
SAMPLES
Page 50 of 104Diabetes

EXCLUSIONSType 1 diabetes,
type 2 diabetes
Known diabetes,
FG ≥ 7 mmol/l,
120min glucose
≥ 11.1 mmol/l
Diabetes
ascertained by
OGTT, medical
record review or
GAD Ab
positivity;
diabetes
medication,
missing
phenotype or
covariate
Use of diabetes
medications or
fasting glucose
>= 7mmols
History of
diabetes, OGTT,
fasting glucose >
7mmol
Samples with STUMVOLL
phenotype (uniform analysis): N
all (%males/%females)
2602
(45.77%/54.23%
)
802
(40.3%/59.7%)462 (37% / 63%)
2761 (38.2 /
61.8)
962
(76.3%/23.7%)
STUMVOLL [Mean (sd)], units0.0865288
(0.02316)0.037981
Age [Mean (sd) males / Mean (sd)
females], years
53.94
(9.90)/54.06
(9.82)
47.6(16.7)/48.1(1
6.1)
69.05(5.36) /
65.10 (6.96)
72.9 (5.6) / 71.9
(5.1)
61.24 (9.90) /
64.03 (9.80)
BMI [Mean (sd) males / Mean (sd)
females], kg/m2
27.79
(3.86)/26.05
(4.90)
27.1(3.95)/26.7(5
.51)
27.24 (4.12) /
27.84 (4.23)
26.1 (3.4) / 26.0
(4.8)
27.21 (3.57) /
26.77 (4.51)
Fasting PLASMA glucose [Mean
(sd) males / Mean (sd) females],
mmol/l
5.3542
(0.4639)/5.1228
(0.5027)
5.46(1.10)/5.59(1
.20)
5.12 (0.49) / 5.02
(0.44)
5.6 (0.5) / 5.5
(0.5)
5.50 (0.58) / 5.34
(0.56)
Original units for fasting glucose mg/dl mmol/l mg/dl mg/dl mg/dl
Conversion factor for glucose to
mmol/l1/18.01 - 0.05551 18-Jan 18-Jan
Fasting insulin [Mean (sd) males /
Mean (sd) females], pmol/l
30.186
(10.925)/27.230
(8.739)
40.51(24.89)/41.
01(28.02)
66.57 (33.82) /
69.62 (37.25)
94.7 (45.8) / 92.5
(49.0)
62.61 (52.41) /
57.68 (40.73)
Original units for fasting insulin pmol/l pmol/l mU/l mIU/L IU/ml
Conversion factor for insulin to
pmol/l1 Not applicable 6 6.945 6
GENOTYPING
Page 51 of 104 Diabetes

Genotyping platform & SNP panelAffymetrix 500K
and MIPS 50K
500K Affymetrix
GeneChip (250K
Sty and 250K
Nsp arrays,
Affymetrix, Inc)
and Affymetrix
Genome-Wide
Human SNP
Array 6.0
Illumina
HumanHap300
Illumina
HumanCNV370-
Duo BeadChip
Affymetrix 6.0
Genotyping centre Affymetrix
Microarray Core
Facility of the
Interdisciplinary
Centre for
Clinical
Research,
University of
Leipzig,
Germany and
ATLAS Biolabs
GmbH, Berlin,
Germany
Center for
Inherited Disease
Research
General Clinical
Research
Center's
Phenotyping/Gen
otyping
Laboratory at
Cedars-Sinai
LURIC Study
nonprofit LLC,
c/o Synlab MVZ
Heidelberg,
Wasserturmstrass
e 71, D-69214
Eppelheim
Genotyping calling algorithm BRLMM
BRLMM
algorithm
(Affymetrix, Inc)
for 500K and
Birdseed
Algorithm for
Genome-Wide
Human SNP
Array 6.0
Beadstudio
Illumina
BeadStudio
software
Birdseed v2
SAMPLE QC
Call rate [filter detail] 97% > 94% >97.5% >95% >95%
Heterozygosity [filter detail / N
individuals excluded]
5 SD from mean
(< 25.758% or >
29.958%) / 10
None None None None
Ethnic outliers excluded None Ethnic outliers None
African
American
excluded
None
Page 52 of 104Diabetes

Other exclusions None
duplicates;
gender
mismatch;
known diabetes,
FG ≥ 7 mmol/l,
120min glucose
≥ 11 mmol/l
None
1908 persons
were excluded
from genotyping
if they had
prevalent
cardiovascular
disease. Other
samples were
excluded for sex
mismatch and
discordance with
prior genotyping.
duplicates, sex
ambiguity
Individuals for analysis 2602 802 462
3291 available
(2761 with
phenotype and
no DM)
962
SNP QC (prior to imputation)
MAF [filter detail / N SNPs
excluded]> 1% / 68,953 1% >1% none > 1%
HWE > 10-6 > 10-6 > 10-6 P > 10-5 > 10-6
Call rate ≥95% 95% ≥ 90% <97% ≥95%
Other None None
NMI or duplicate
pair
discrepancies <=
3
<=2 duplicate
errors or
Mendelian
inconsistencies
(for reference
CEPH trios),
heterozygote
frequency = 0,
SNP not found in
HapMap.
None
SNP number in QC'd dataset 378163 378513 306791 306655 750437
IMPUTATION STATS
Imputation software MACH
IMPUTE to
HapMap2
reference panel
MACH 1 to
HapMap release
21 CEU (phase
I+II) reference
panel
BIMBAM v0.99
with reference to
HapMap CEU
using release 22,
build 36
MACH with
reference to
HapMap CEU
Panel 2
Imputation quality metrics r2hat ≥ 0.3 Proper-info > 0.4 r2hat>0.3
observed/expecte
d variance ratio <
0.01
r2>0.3 and
prob>0.9
Page 53 of 104 Diabetes

Other SNP QC filters applied? MAF ≥ 1%MAF>1%,
HWE<10-4MAF ≥ 1%
dosage variance
<0.01
DATA ANALYSIS
Number of SNPs in analysis N
imputed2436797 2531712 2476731 2257780 1800000
Adjustmentssex, age, agesq,
PC1-8sex,age,bmi sex, age
age, sex, study
sitesex, age, age2
Analysis method
Linear mixed
effect models,
generalized
estimating
equations
(interaction)
linear regression Linear regression linear regression linear regression
Software for analysisLMEKIN, GEE
(R package)
SNPTEST/QUIC
KTESTProbABEL R
PLINK,
QUICKTEST
REFERENCES
Reference cohort PMID:21559053 16 PMID: 1669507
Reference GWAS PMID:19729412 PMID: 20031568
Page 54 of 104Diabetes

Website
http://www.ncbi.
nlm.nih.gov/proj
ects/gap/cgi-
bin/study.cgi?stu
dy_id=phs00000
7.v2.p1
- http://fusion.sph.
umich.edu
http://www.
chs-
nhlbi.org/
Page 55 of 104 Diabetes

ULSAM METSIM EUGENE2Amish
StudiesRISC Tuebingen Inter99
Discovery Discovery Replication Replication Replication Replication Replication
Northern
European (white,
Caucasian)
European
descentWhite Europeans
European
descentWhite Europeans White Europeans Europeans
Sweden Finland
Finland, Sweden,
Denmark,
Germany
USA
Austria,
Denmark,
Finland, France,
Germany,
Greece, The
Netherlands,
Ireland, Italy,
Sweden, Spain,
Switzerland,
United Kingdom,
Serbia,
Montenegro
Germany Denmark
Population-based Population-based Population-based Family-based Population-based
At-risk
population
(family history,
glucose
intolerance,
overweight, prior
gestational
diabetes)
Population-based
Fasting plasma Fasting plasma Fasting plasma
Fasting fresh
venous plasma
with sodium
floride and
potassium
oxolate
Serum, 0, 30, 60,
90, 120 min
OGTT
Plasma, 0, 30,
60, 90, 120 min
OGTT
Plasma; 0, 30,
120 min OGTT
Venipuncture Venipuncture Venipuncture
Fasting venous
blood collected
into sodium
floride tubes,
plasma frozen
and stored at -
80oC and thawed
immediately
before glucose
measurement.
Venipuncture Venipuncture Venipuncture
Page 56 of 104Diabetes

Glucose
dehydrogenase
method (Gluc-
DH, Merck,
Darmstadt,
Germany)
Enzymatic
photometric test,
Glucose
hexokinase.
Glucose oxidase
method (Glucose
& Lactate
Analyzer 2300
Stat Plus, Yellow
Springs
Instrument Co.,
Inc, Ohio)
YSI glucose
analyzer, Yellow
Springs, OH
Glucose oxidase
method (Cobas
Integra, Roche)
YSI 2300 STAT
Plus Glucose
Analyzer
(glucose oxidase
method, Yellow
Springs
Instruments,
OH/USA)
Glucose oxidase
method
Fasting plasma,
120 min plasmaFasting plasma
Serum, 0, 30, 60,
90, 120 min
Fasting venous
plasma with
heparin
Serum, 0, 30, 60,
90, 120 min
OGTT
Serum, 0, 30, 60,
90, 120 min
OGTT
Serum; 0, 30,
120 min OGTT
Venipuncture Venipuncture Venipuncture
Fasting venous
blood collected
into sodium
heparin tubes,
centrifuged at
4oC within 1
hour, plasma
frozen and stored
at -80oC and
thawed
immediately
before insulin
measurement.
Venipuncture Venipuncture Venipuncture
Immunoreactive
insulin:
Enzymatic-
immunological
assay (Enzymun,
Boehringer
Mannheim)
Immunoassay,
luminometric
measurement
Microparticle
enzyme
immunoassay
(Abbott
Laboratories,
Tokyo, Japan)
Millipore 125
Iodine Human
Insulin RA kit
Insulin,
proinsulin and C-
peptide were
measured by a
two-sited, time-
resolved
fluoroimmunoass
ay (AutoDELFIA
Insulin kit,
Wallac Oy,
Turku, Finland)
using
monoclonal
antibodies
Insulin
immunochemilu
minometric assay
(Advia Centaur
XP, Siemens,
Germany)
AutoDELFIA
insulin kit
3.0 pmol / L 2-200 mU / L 3 pmol/l
Page 57 of 104 Diabetes

Use of diabetes
medication,
fasting plasma
glucose >= 7
mmol/L
Diabetes
ascertained by
OGTT, medical
record review or
GAD Ab
positivity;
diabetes
medication,
missing
phenotype or
covariate
Diabetes
ascertained by
OGTT, medical
record review
Diabetes (either
self-reported or
registered as
using anti-
diabetic drugs),
FG >= 7 mmol/l,
Lipid disorders
or diabetes, lipid
medications,
pregnancy
Diabetes
ascertained by
OGTT, medical
record review or
GAD Ab
positivity;
diabetes
medication
Self-reported
diabetes, treated
with anti-
diabetic drugs or
diabetes at
OGTT
962 (100%
males)
7388 (100% /
0%)
885 (44.3%,
55.7%)334 (39%.61%)
921
(44.1%,55.9%)
2470 (35.1% /
64.9%)5318 (49/51)
0.074 (0.031)0.0928042
(0.0295312)
0.0914756
(0.0275914)0.09 ± 0.02 0.106 (0.018) 0.070 (0.049) 0.101 (0.021)
71.0 (0.6) / NA 57.04(6.96) / NA39.06 (9.27) /
39.72 (9.11)
45.3 (13.6)/ 44.8
(12.1)
43.31 (8.56)/
44.46 (8.19)
41.5 (14.4) / 39.6
(12.6)
46.1 (7.8)/45.6
(7.8)
26.0 (3.2) / NA26.84 (3.81) /
NA
27.00 (4.37) /
26.07 (5.08)
26.3 (3.5) / 28
(5.2)
26.36
(3.54)/24.78
(4.22)
30.2 (9.0) / 31.4
(9.9)
26.6 (3.9)/25.6
(4.8)
5.38 (0.56) /NA 5.71 (0.48) /NA5.29 (0.52) / 4.98
(0.44)5 (0.4) / 4.9 (0.5)
5.20 (0.52) / 4.92
(0.56)
5.24 (0.55) / 5.12
(0.55)
5.61 (0.49)/5.3
(0.49)
mmol/L mmol/l mmol/l mg/dl mmol/l mmol/l mmol/L
No None 0.0555 NA None NA
72.97 (40.10) /
NA
49.76 (35.29) /
NA
51.95 (37.87) /
46.70 (32.22)
60.9 (22.9) / 64.9
(27.7)
36.80 (19.96)/
32.5 (17.42)
82.3 (76.2) / 83.9
(69.9)
43.1 (27.8)/39.1
(24.7)
mU/L mU/l pmol/l microU/ml pmol/l pmol/l pmol/L
6 6 Not applicable 6 Not applicable Not applicable Not applicable
Page 58 of 104Diabetes

Illumina
Omni2.5+Metab
ochip
Illumina
HumanOmniExp
ress-12v1
Infinium
HumanHap 550
k version 3 chips
illumina
OmniChip 2.5M,
Affy 500K,
Affy6.0,
Metabochip
Applied
Biosystems
Sequenom
MassArray
KASP
Genotyping
SNP&SEQ
Technology
Platform,
Uppsala
Center for
Inherited Disease
Research
The Finnish
Genome Centre,
Helsinki, Finland
Univ of
Maryland
Division of
Endocrinology
Kbioscience
Central
Laboratory of the
University
Hospital
Tuebingen
LGC Genomics
GenomeStudio
2010.3
GenomeStudio
version 2011.1
Sequenom
MassARRAY
Typer (version 3)
GeneCall,
BRLLM
ABI Prism 7000
sequence
detection system
iPLEX software KlusterCaller
≥ 95% >98% / 0 99.90% >95% >90% >95% NA
> 3 s.d. None None None None None NA
MDS analysis
performed
non-Finnish,
PCA outliers,
gender
discordance
None None None None None
Page 59 of 104 Diabetes

Related
individuals,
missing
phenotype values
unexpected
duplicates,
contamination >
3%, missing
phenotype,
diabetics
None mendelian errors None None None
962 7388 885 2872 921 2470 5318
≥1% none None >1% >5%/0
MAF of
replicated SNPs
>0.45% / 0
NA
> 10-6 > 10-6 >0.004 0.000001 0.000001/0 >9.4*10-8 0.001/0
≥99%
(MAF<5%) or
≥95%
(MAF≥5%)
95% >95% >95% >95% >95% 95%/0
Nonetriallelicmap_sco
re<30 / 5314None None None None None
1587454 681789 12 1944974 13 23 20
IMPUTE2
MACH to 1000
Genomes phase
1 integrated
variant release
(v3) reference
panel
Not applicable
IMPUTE v2
using 1000
Genomes Phase
3 reference
panel
MACH2QTL
using 1000
Genomes
reference panel
Not applicable Not applicable
info>0.4 r2hat>0.3 Not applicableNo filtering done
post-imputationNot applicable Not applicable Not applicable
Page 60 of 104Diabetes

MAF≥1% MAF ≥ 1% Not applicableNo filtering done
post-imputation
MAF >= 1%
r2_hat >= 0.3
3178687 9097160 12 (genotyped) 22
24 (13
genotyped, 11
imputed)
23 (none
imputed)20
Age, PC1, PC2Age, agesq, 3
PCs
Age, sex, center,
familyAge, age2, sex
Age, sex, centre,
the first two
principal
components
Age and sex age, sex
Linear regression Linear regressionMixed linear
modelMixed model Linear regression Linear regression
Linear mixed
effect models,
generalized
estimating
equations
(interaction)
SNPTEST
v2.4.1/ Quicktest
v0.95
ProbABEL SPSS v.17 MMAP STATA 10.1 JMP 10.0.0 R
PMID: 16030278
PMID: 19223598
Laakso M. et al.; Diabetologia 2008;51:502-11 18440328,
18805900
Jørgensen, T. et
al. A
randomized non-
pharmacological
intervention
study for
prevention of
ischaemic heart
disease: Baseline
results Inter99
(1). Eur J
Cardiovasc Prev
Rehab 10, 377-
386 (2003)
NA
Böhm A. et al.;
PLoS One
2012;7(3):e3403
5
Not applicable Not applicable
Page 61 of 104 Diabetes

http://www2.pub
care.uu.se/ULSA
M/
http://medschool.
umaryland.edu/e
ndocrinology/am
ish.asp
www.inter99.dk
Page 62 of 104Diabetes
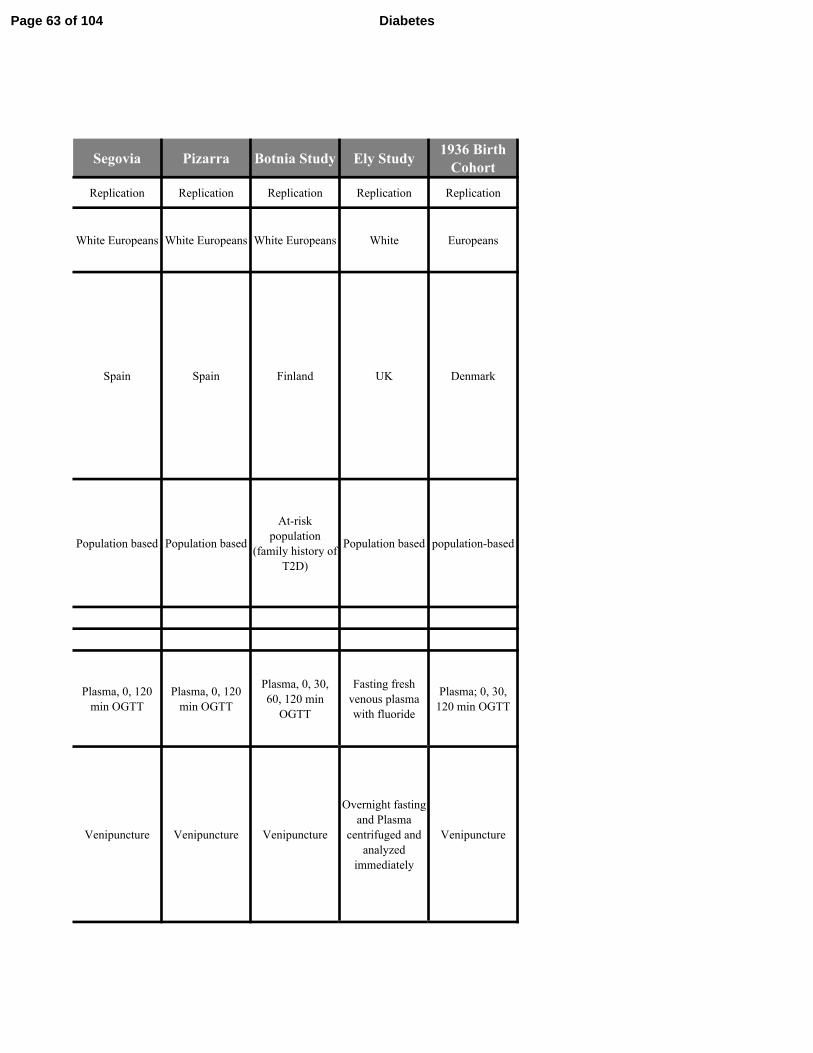
Segovia Pizarra Botnia Study Ely Study1936 Birth
Cohort
Replication Replication Replication Replication Replication
White Europeans White Europeans White Europeans White Europeans
Spain Spain Finland UK Denmark
Population based Population based
At-risk
population
(family history of
T2D)
Population based population-based
Plasma, 0, 120
min OGTT
Plasma, 0, 120
min OGTT
Plasma, 0, 30,
60, 120 min
OGTT
Fasting fresh
venous plasma
with fluoride
Plasma; 0, 30,
120 min OGTT
Venipuncture Venipuncture Venipuncture
Overnight fasting
and Plasma
centrifuged and
analyzed
immediately
Venipuncture
Page 63 of 104 Diabetes
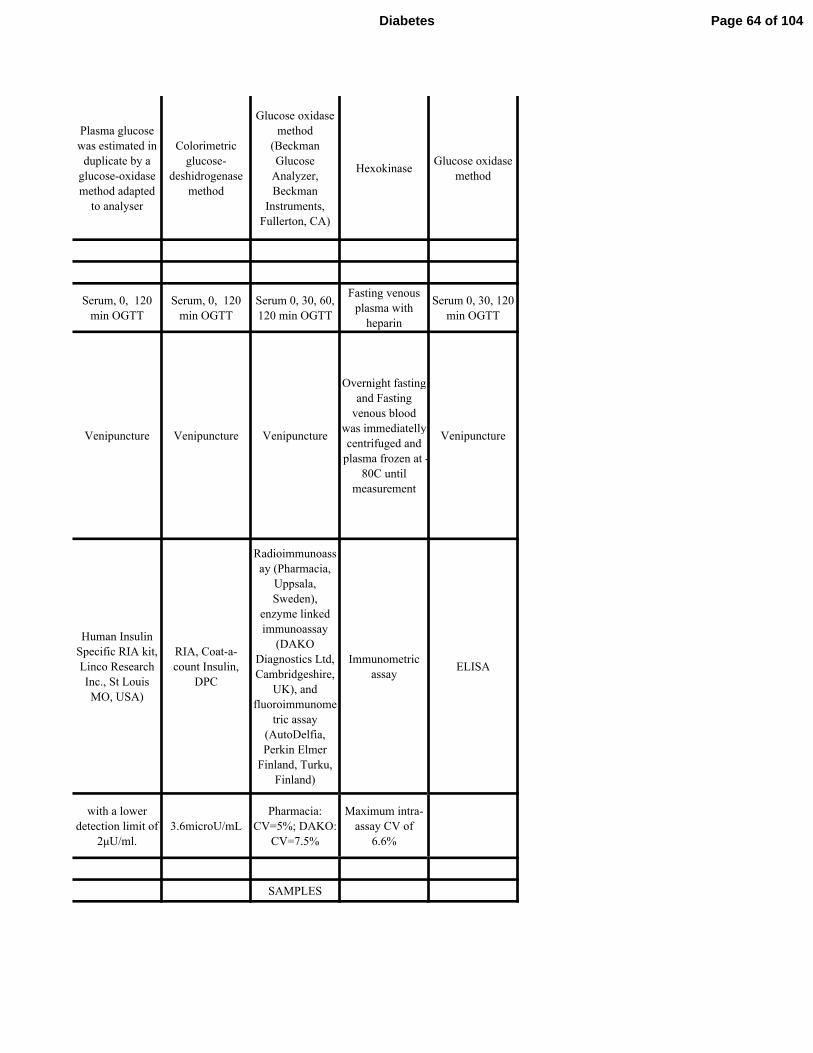
Plasma glucose
was estimated in
duplicate by a
glucose-oxidase
method adapted
to analyser
Colorimetric
glucose-
deshidrogenase
method
Glucose oxidase
method
(Beckman
Glucose
Analyzer,
Beckman
Instruments,
Fullerton, CA)
HexokinaseGlucose oxidase
method
Serum, 0, 120
min OGTT
Serum, 0, 120
min OGTT
Serum 0, 30, 60,
120 min OGTT
Fasting venous
plasma with
heparin
Serum 0, 30, 120
min OGTT
Venipuncture Venipuncture Venipuncture
Overnight fasting
and Fasting
venous blood
was immediatelly
centrifuged and
plasma frozen at -
80C until
measurement
Venipuncture
Human Insulin
Specific RIA kit,
Linco Research
Inc., St Louis
MO, USA)
RIA, Coat-a-
count Insulin,
DPC
Radioimmunoass
ay (Pharmacia,
Uppsala,
Sweden),
enzyme linked
immunoassay
(DAKO
Diagnostics Ltd,
Cambridgeshire,
UK), and
fluoroimmunome
tric assay
(AutoDelfia,
Perkin Elmer
Finland, Turku,
Finland)
Immunometric
assayELISA
with a lower
detection limit of
2µU/ml.
3.6microU/mL
Pharmacia:
CV=5%; DAKO:
CV=7.5%
Maximum intra-
assay CV of
6.6%
SAMPLES
Page 64 of 104Diabetes
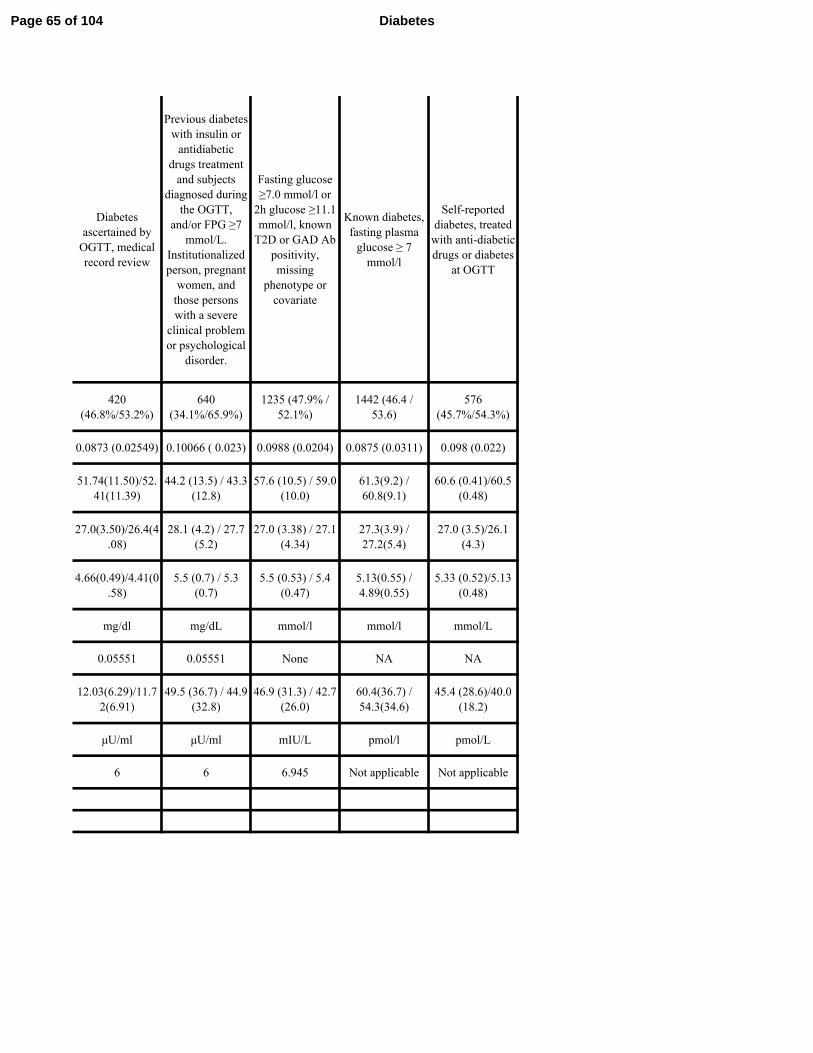
Diabetes
ascertained by
OGTT, medical
record review
Previous diabetes
with insulin or
antidiabetic
drugs treatment
and subjects
diagnosed during
the OGTT,
and/or FPG ≥7
mmol/L.
Institutionalized
person, pregnant
women, and
those persons
with a severe
clinical problem
or psychological
disorder.
Fasting glucose
≥7.0 mmol/l or
2h glucose ≥11.1
mmol/l, known
T2D or GAD Ab
positivity,
missing
phenotype or
covariate
Known diabetes,
fasting plasma
glucose ≥ 7
mmol/l
Self-reported
diabetes, treated
with anti-diabetic
drugs or diabetes
at OGTT
420
(46.8%/53.2%)
640
(34.1%/65.9%)
1235 (47.9% /
52.1%)
1442 (46.4 /
53.6)
576
(45.7%/54.3%)
0.0873 (0.02549) 0.10066 ( 0.023) 0.0988 (0.0204) 0.0875 (0.0311) 0.098 (0.022)
51.74(11.50)/52.
41(11.39)
44.2 (13.5) / 43.3
(12.8)
57.6 (10.5) / 59.0
(10.0)
61.3(9.2) /
60.8(9.1)
60.6 (0.41)/60.5
(0.48)
27.0(3.50)/26.4(4
.08)
28.1 (4.2) / 27.7
(5.2)
27.0 (3.38) / 27.1
(4.34)
27.3(3.9) /
27.2(5.4)
27.0 (3.5)/26.1
(4.3)
4.66(0.49)/4.41(0
.58)
5.5 (0.7) / 5.3
(0.7)
5.5 (0.53) / 5.4
(0.47)
5.13(0.55) /
4.89(0.55)
5.33 (0.52)/5.13
(0.48)
mg/dl mg/dL mmol/l mmol/l mmol/L
0.05551 0.05551 None NA NA
12.03(6.29)/11.7
2(6.91)
49.5 (36.7) / 44.9
(32.8)
46.9 (31.3) / 42.7
(26.0)
60.4(36.7) /
54.3(34.6)
45.4 (28.6)/40.0
(18.2)
µU/ml µU/ml mIU/L pmol/l pmol/L
6 6 6.945 Not applicable Not applicable
Page 65 of 104 Diabetes

Sequenom
MassArray
TaqMan® Open
Array®
Genotyping
System (Applied
Biosystems)
Affymetrix
500K, some also
Illumina
HumanOmni2.5-
4v1_B
Sequenom
Illumina
CoreExome/Illu
mina HiScan
CEGEN
Sequencing and
Genotyping
Platform.
Hospital Carlos
Haya
Broad Institute MRC-Epid
The Novo
Nordisk
Foundation
Center for Basic
Metabolic
Research,
University of
Copenhagen
iPLEX software
TaqMan
Genotyper
Software
BRLMM for
500K and
Illumina
GenomeStudio
v2010.3
Illumina
GenCall
>95% >90% 95% >95% 95%
None None None None
Rare alleles
(MAF<0.05): -
0.4<F<0.4,
common alleles
(MAF>0.05): -
0.03<F<0.03 (16
excluded)
None None None None None
Page 66 of 104Diabetes

None None
Genetic
fingerprint,
gender check
None None
420 640
1068 with Affy
500K, 1235
when
complemented
with Omni2.5
1616 656
>1%/0 >1%/0 Monomorphic None No filter
>10-2
/ 0 >10-2
/ 0 >10-6 None > 10-6
>95% >90%
95%
(Affymetrix) /
98% (Illumina)
>98% 95%
None None None None None
21 19 9 23 528515
IMPUTATION
STATS
Not applicable Not applicable
IMPUTE2 using
1000 Genomes
Phase 3 reference
panel
Not applicable
IMPUTE2 using
1000 Genomes
reference panel
Not applicable Not applicable INFO > 0.4 Not applicableinputeExtract.IN
FO
Page 67 of 104 Diabetes
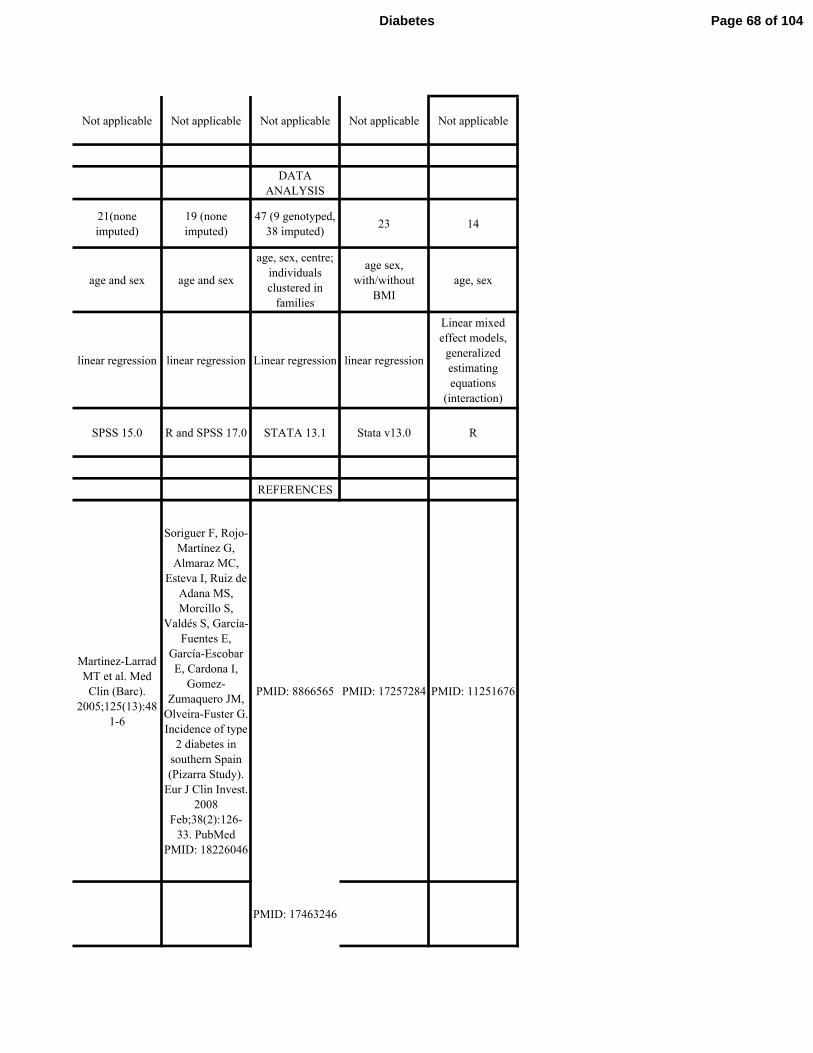
Not applicable Not applicable Not applicable Not applicable Not applicable
DATA
ANALYSIS
21(none
imputed)
19 (none
imputed)
47 (9 genotyped,
38 imputed)23 14
age and sex age and sex
age, sex, centre;
individuals
clustered in
families
age sex,
with/without
BMI
age, sex
linear regression linear regression Linear regression linear regression
Linear mixed
effect models,
generalized
estimating
equations
(interaction)
SPSS 15.0 R and SPSS 17.0 STATA 13.1 Stata v13.0 R
REFERENCES
Martinez-Larrad
MT et al. Med
Clin (Barc).
2005;125(13):48
1-6
Soriguer F, Rojo-
Martínez G,
Almaraz MC,
Esteva I, Ruiz de
Adana MS,
Morcillo S,
Valdés S, García-
Fuentes E,
García-Escobar
E, Cardona I,
Gomez-
Zumaquero JM,
Olveira-Fuster G.
Incidence of type
2 diabetes in
southern Spain
(Pizarra Study).
Eur J Clin Invest.
2008
Feb;38(2):126-
33. PubMed
PMID: 18226046
PMID: 8866565 PMID: 17257284 PMID: 11251676
PMID: 17463246
Page 68 of 104Diabetes

http://www.botni
a-study.org,
https://www.broa
dinstitute.org/dia
betes
http://www.mrc-
epid.cam.ac.uk/re
search/studies/el
y/
Page 69 of 104 Diabetes

Supplemental Table 2. Association of known fasting insulin loci with fasting insulin and ISI in discovery cohorts
SNP Locus Eff Allele Effect SE P -value N
rs1421085 FTO C 0.02 0.003 1.9 × 10⁻¹⁵
104062
rs983309 PPP1R3B T 0.03 0.004 3.8 × 10⁻¹⁴
103030
rs9884482 TET2 C 0.02 0.002 1.4 × 10⁻¹¹
108420
rs7903146 TCF7L2 C 0.02 0.003 6.1 × 10⁻¹¹
103037
rs10195252 GRB14 T 0.02 0.003 4.9 × 10⁻¹⁰
99126
rs1167800 HIP1 A 0.02 0.003 2.6 × 10⁻⁹
91416
rs2820436 LYPLAL1 C 0.02 0.003 4.4 × 10⁻⁹
104044
rs2745353 RSPO3 T 0.01 0.002 5.5 × 10⁻⁹
104075
rs731839 PEPD G 0.02 0.003 1.7 × 10⁻⁸
104636
rs4865796 ARL15 A 0.02 0.003 2.1 × 10⁻⁸
100001
rs2972143 IRS1 G 0.01 0.003 3.2 × 10⁻⁸
99566
rs1530559 YSK4 A 0.02 0.003 3.4 × 10⁻⁸
107281
rs2943645 IRS1 T 0.02 0.002 2.3 × 10⁻¹⁹
99023
SNP Locus Eff Allele Effect SE P -value N
rs10195252 GRB14 T 0.02 0.002 1.3 × 10⁻¹⁶
98997
rs2126259 PPP1R3B T 0.02 0.003 3.3 × 10⁻¹³
99021
rs4865796 ARL15 A 0.02 0.002 2.2 × 10⁻¹²
98314
rs17036328 PPARG T 0.02 0.003 3.6 × 10⁻¹²
98984
rs731839 PEPD G 0.02 0.002 5.1 × 10⁻¹²
103252
rs974801 TET2 G 0.01 0.002 3.3 × 10⁻¹¹
103489
rs459193 ANKRD55-MAP3K1 G 0.02 0.002 1.1 × 10⁻¹⁰
103378
rs6822892 PDGFC A 0.01 0.002 2.6 × 10⁻¹⁰
103432
rs4846565 LYPLAL1 G 0.01 0.002 1.8 × 10⁻⁹
99014
rs3822072 FAM13A A 0.01 0.002 1.8 × 10⁻⁸
99977
rs6912327 UHRF1BP1 T 0.02 0.003 2.3 × 10⁻⁸
80010
rs13081389 PPARG A 0.03 0.01 1.6 × 10⁻⁶
52379
rs7578326 IRS1 A 0.02 0.003 2.7 × 10⁻¹¹
52379
rs780094 GCKR C 0.02 0.003 3.4 x 10⁻¹²
52379
Published Reports for FI (without BMI
adjustment)
Published Reports for FI (with BMI adjustment)
Page 70 of 104Diabetes

rs972283 KLF14 G 0.01 0.003 4.4 × 10⁻⁶
52379
SNP Effect SNP SE P -value N
Int Effect Int SE
-0.06 0.02 4.3 × 10⁻²⁰
83116
0.003 0.001
0.02 0.02 2.5 × 10⁻¹⁴
82318
-0.001 0.001
-0.03 0.03 1.7 × 10⁻¹⁰
82905
0.00 0.001
0.004 0.02 5.3 × 10⁻⁹
82075
-0.020 0.003
-0.02 0.02 3.7 × 10⁻⁸
82572
0.01 0.003
0.01 0.02 2.0 × 10⁻⁸
81598
2.00×10⁻⁴
0.001
SNP Locus Eff Allele
C
rs7607980 COBLL1- GRB14 T
rs2943634 IRS1 C
Published Reports for FI (Model 3)
Association of known fasting insulin (FI) variants were tested for association with fasting insulin and the modified insulin sensitivity index (ISI) in different cohorts and in models without adjustment for body mass index (BMI), with adjustment for BMI, and in Model 3
(test of the combined influence of the genotype effect adjusted for BMI and the interaction effect between the genotype and BMI). Associations of known FI variants with fasting insulin are reported from published literature (Nat Genet 2012; 44:991-1005 [without BMI
adjustment], Nat Genet 2012; 44:991-1005 and Diabetes 2014; 63:2158-2171 [with BMI adjustment], and Nat Genet 2012; 44:659-669 [Model 3]) and in the full discovery cohort of the current work (ISI Full Cohort). To compare the association of known FI variants in a
comparable cohort, associations with FI and ISI were performed in a subset of the full discovery cohort (FHS, Sorbs, FUSION, and, for analyses without BMI adjustment, CHS). Effect sizes are presented as standard deviation per effect allele. SNP: single nucleotide
polymorphism; Int: interaction; SE: standard error.
rs4646949 UHRF1BP1 T
rs2785980 LYPLAL1 T
rs4841132 PPP1R3B A
rs4691380 PDGFC
Page 71 of 104 Diabetes

Supplemental Table 2. Association of known fasting insulin loci with fasting insulin and ISI in discovery cohorts
Effect SE P -value N Effect SE P -value
-0.02 0.11 0.12 16753 0.02 0.01 0.02
0.01 0.02 0.55 16753 0.02 0.01 0.04
-0.004 0.01 0.75 16752 0.003 0.01 0.61
-0.02 0.01 0.23 16753 0.01 0.01 0.24
-0.01 0.02 0.49 16752 0.01 0.01 0.07
-0.03 0.02 0.004 16752 0.03 0.01 0.003
-0.03 0.01 0.02 16753 0.02 0.01 0.02
-0.01 0.01 0.22 16753 0.004 0.01 0.51
-0.01 0.02 0.37 13991 0.01 0.01 0.14
-0.04 0.01 0.003 16753 0.01 0.01 0.37
-0.04 0.01 2.00×10⁻⁴
16753 0.01 0.01 0.09
-0.01 0.01 0.30 16753 0.02 0.01 0.02
-0.04 0.01 2.00×10⁻⁴
16753 0.01 0.01 0.11
Effect SE P -value N Effect SE P -value
-0.03 0.01 0.01 16734 0.02 0.01 0.01
0.03 0.02 0.02 16735 0.01 0.01 0.24
-0.04 0.01 1.00×10⁻⁴
16735 0.01 0.01 0.08
-0.07 0.01 1.00×10⁻⁶
16725 0.03 0.01 0.003
-0.02 0.01 0.09 13980 0.02 0.01 0.01
-0.01 0.01 0.23 16735 -0.003 0.01 0.65
-0.04 0.01 3.00×10⁻⁴
16734 0.03 0.01 5.92×10⁻⁵
-0.04 0.01 7.00×10⁻⁵
16735 0.02 0.01 0.002
-0.003 0.01 0.79 16735 0.02 0.01 0.002
-0.003 0.01 0.81 16735 0.004 0.01 0.49
-0.02 0.01 0.08 16734 0.02 0.01 0.01
-0.08 0.02 3.00×10⁻⁵
16735 0.04 0.01 0.00
-0.06 0.01 6.80×10⁻⁹
16735 0.02 0.01 0.00
0.00 0.01 0.70 16725 0.02 0.01 0.00
ISI Full Discovery Cohort (without BMI adjustment)FI in FHS, Sorbs, FUSION, CHS (without BMI
adjustment)
ISI Full Discovery Cohort (with BMI adjustment) FI in FHS, Sorbs, FUSION (with BMI adjustment)
Page 72 of 104Diabetes

-0.02 0.01 0.07 16735 0.01 0.01 0.18
SNP Effect SNP SE P -value N SNP Effect SNP SE P -value
Int Effect Int SE Int Effect Int SE
-0.002 0.12 0.002 16685 -0.12 0.05 6.18×10⁻⁵
-0.002 0.004 0.01 0.002
0.08 0.08 5.15×10⁻⁹
16729 -0.02 0.03 1.91×10⁻⁴
-0.078 0.005 0.002 0.001
0.06 0.12 0.13 16735 -0.13 0.06 0.03
0.118 -0.001 0.01 0.002
0.08 0.08 0.001 16735 -0.01 0.04 0.002
-0.078 0.004 0.001 0.001
0.04 0.08 0.25 16726 -0.05 0.04 6.15×10⁻⁵
0.084 -0.002 0.003 0.001
0.01 0.08 0.99 16735 0.03 0.03 0.01
0.081 0.000 -3.72×10⁻⁴
0.001
ISI Full Discovery Cohort (Model 3) FI in FHS, Sorbs, FUSION (Model 3)
Association of known fasting insulin (FI) variants were tested for association with fasting insulin and the modified insulin sensitivity index (ISI) in different cohorts and in models without adjustment for body mass index (BMI), with adjustment for BMI, and in Model 3
(test of the combined influence of the genotype effect adjusted for BMI and the interaction effect between the genotype and BMI). Associations of known FI variants with fasting insulin are reported from published literature (Nat Genet 2012; 44:991-1005 [without BMI
adjustment], Nat Genet 2012; 44:991-1005 and Diabetes 2014; 63:2158-2171 [with BMI adjustment], and Nat Genet 2012; 44:659-669 [Model 3]) and in the full discovery cohort of the current work (ISI Full Cohort). To compare the association of known FI variants in a
comparable cohort, associations with FI and ISI were performed in a subset of the full discovery cohort (FHS, Sorbs, FUSION, and, for analyses without BMI adjustment, CHS). Effect sizes are presented as standard deviation per effect allele. SNP: single nucleotide
Page 73 of 104 Diabetes

N Effect SE P -value N
8991 -0.02 0.02 0.32 6627
9584 0.01 0.03 0.65 6627
9223 -0.04 0.02 0.04 6525
9584 0.01 0.02 0.45 6627
9584 -0.01 0.02 0.50 6627
8810 -0.04 0.02 0.05 5825
9312 -0.01 0.02 0.44 6627
9220 0.02 0.02 0.25 6627
9239 -0.01 0.02 0.61 6627
9290 -0.03 0.02 0.08 6627
9584 -0.03 0.02 0.05 6627
8906 -0.01 0.02 0.68 6627
9584 -0.04 0.02 0.04 6627
N Effect SE P -value N
7851 -0.02 0.02 0.47 3858
7851 0.02 0.03 0.55 3858
7851 -0.05 0.02 0.04 3858
7807 -0.09 0.03 0.005 3848
7851 -0.03 0.02 0.23 3858
7851 -0.03 0.02 0.17 3858
7851 -0.06 0.02 0.02 3858
7851 -0.06 0.02 0.01 3858
7850 -0.02 0.02 0.27 3858
7851 0.02 0.02 0.23 3858
7851 -0.03 0.03 0.19 3858
7851 -0.10 0.04 0.02 3858
7851 -0.03 0.02 0.20 3858
7836 0.01 0.02 0.59 3848
FI in FHS, Sorbs, FUSION, CHS (without BMI ISI in FHS, Sorbs, FUSION, CHS (without BMI
adjustment)
FI in FHS, Sorbs, FUSION (with BMI adjustment)ISI in FHS, Sorbs, FUSION (with BMI
adjustment)
Page 74 of 104Diabetes

7851 -0.06 0.02 0.004 3858
N SNP Effect SNP SE P -value N
Int Effect Int SE
10589 0.04 0.15 0.01 6561
-0.004 0.01
10650 0.15 0.11 0.04 6605
-0.01 0.004
10673 0.26 0.18 0.07 6611
-0.01 0.01
10673 0.07 0.10 0.01 6611
-0.005 0.004
10645 0.06 0.11 0.07 6602
-0.004 0.004
10673 0.03 0.11 0.87 6611
-0.002 0.004
FI in FHS, Sorbs, FUSION (Model 3) ISI in FHS, Sorbs, FUSION (Model 3)
Association of known fasting insulin (FI) variants were tested for association with fasting insulin and the modified insulin sensitivity index (ISI) in different cohorts and in models without adjustment for body mass index (BMI), with adjustment for BMI, and in Model 3
(test of the combined influence of the genotype effect adjusted for BMI and the interaction effect between the genotype and BMI). Associations of known FI variants with fasting insulin are reported from published literature (Nat Genet 2012; 44:991-1005 [without BMI
adjustment], Nat Genet 2012; 44:991-1005 and Diabetes 2014; 63:2158-2171 [with BMI adjustment], and Nat Genet 2012; 44:659-669 [Model 3]) and in the full discovery cohort of the current work (ISI Full Cohort). To compare the association of known FI variants in a
comparable cohort, associations with FI and ISI were performed in a subset of the full discovery cohort (FHS, Sorbs, FUSION, and, for analyses without BMI adjustment, CHS). Effect sizes are presented as standard deviation per effect allele. SNP: single nucleotide
Page 75 of 104 Diabetes
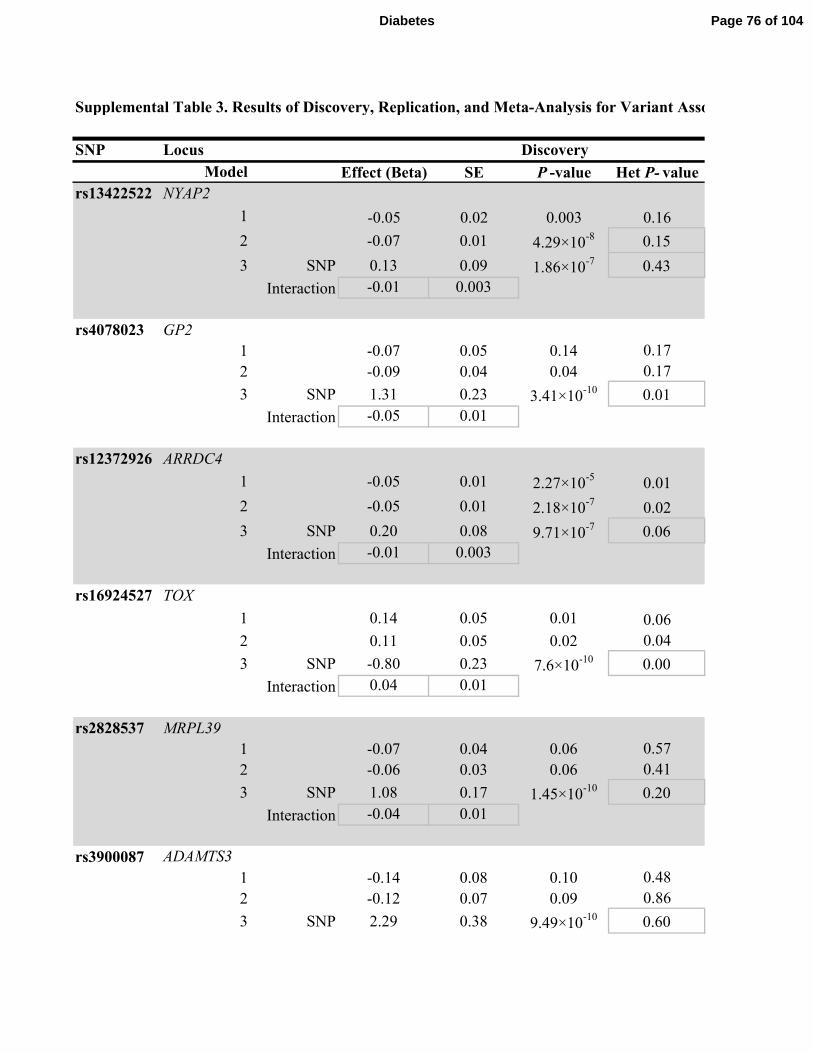
Supplemental Table 3. Results of Discovery, Replication, and Meta-Analysis for Variant Association with Insulin Sensitivity Index
SNP Locus Discovery
Effect (Beta) SE P -value Het P- value
rs13422522 NYAP2
1 -0.05 0.02 0.003 0.16
2 -0.07 0.01 4.29×10⁻⁸ 0.15
3 SNP 0.13 0.09 1.86×10⁻⁷ 0.43
Interaction -0.01 0.003
rs4078023 GP2
1 -0.07 0.05 0.14 0.17
2 -0.09 0.04 0.04 0.17
3 SNP 1.31 0.23 3.41×10⁻¹⁰ 0.01
Interaction -0.05 0.01
rs12372926 ARRDC4
1 -0.05 0.01 2.27×10⁻⁵
0.01
2 -0.05 0.01 2.18×10⁻⁷
0.02
3 SNP 0.20 0.08 9.71×10⁻⁷ 0.06
Interaction -0.01 0.003
rs16924527 TOX
1 0.14 0.05 0.01 0.06
2 0.11 0.05 0.02 0.04
3 SNP -0.80 0.23 7.6×10⁻¹⁰ 0.00
Interaction 0.04 0.01
rs2828537 MRPL39
1 -0.07 0.04 0.06 0.57
2 -0.06 0.03 0.06 0.41
3 SNP 1.08 0.17 1.45×10⁻¹⁰ 0.20
Interaction -0.04 0.01
rs3900087
1 -0.14 0.08 0.10 0.48
2 -0.12 0.07 0.09 0.86
3 SNP 2.29 0.38 9.49×10⁻¹⁰ 0.60
Model
ADAMTS3
Page 76 of 104Diabetes

Interaction -0.09 0.01
rs6027072 ARHGAP40
1 0.14 0.03 3.73×10⁻⁵
0.95
2 0.12 0.03 4.3×10⁻⁵
0.97
3 SNP -0.48 0.18 5.7×10⁻⁹ 0.37
Interaction 0.02 0.01
rs12454712 BCL2
1 -0.05 0.01 0.0004 0.73
2 -0.07 0.01 1.39×10⁻⁷
0.69
3 SNP 0.12 0.10 5.39×10⁻⁷ 0.95
Interaction -0.01 0.004
rs10506418 FAM19A2
1 0.11 0.04 0.01 0.16
2 0.14 0.04 0.001 0.19
3 SNP -0.80 0.25 2.09×10⁻⁸ 0.11
Interaction 0.04 0.01
rs1857095 ELTD1
1 0.02 0.05 0.69 0.48
2 0.01 0.04 0.91 0.20
3 SNP 0.88 0.25 5.4×10⁻¹⁶ 0.06
Interaction -0.03 0.01
rs11594101 NRG3
1 0.04 0.05 0.41 0.61
2 0.00 0.04 0.98 0.71
3 SNP 1.61 0.25 8.38×10⁻¹⁰ 0.09
Interaction -0.06 0.01
rs12583553 FGF9
1 -0.05 0.04 0.18 0.04
2 -0.06 0.03 0.08 0.10
3 SNP 1.02 0.19 1.41×10⁻¹⁰ 4.39×10
-5
Interaction -0.04 0.01
rs4548846 CDH13
Page 77 of 104 Diabetes

1 0.04 0.06 0.46 0.07
2 0.04 0.05 0.46 0.22
3 SNP 1.56 0.28 1.53×10⁻⁹ 3.90×10
-15
Interaction -0.06 0.01
rs12522198 FAM134B
1 -0.04 0.05 0.38 0.56
2 -0.04 0.04 0.37 0.61
3 SNP 1.80 0.28 1.18×10⁻¹⁰ 6.13×10
-6
Interaction -0.07 0.01
rs10483182 ISX
1 0.06 0.05 0.27 0.23
2 0.01 0.05 0.78 0.31
3 SNP -1.98 0.26 7.32×10⁻¹⁵ 1.4×10
-5
Interaction 0.08 0.01
rs10520638 AGBL1
1 -0.001 0.08 0.99 0.03
2 -0.004 0.07 0.95 0.03
3 SNP 2.01 0.33 8.27×10⁻¹⁴ 1.96×10
-6
Interaction -0.08 0.01
rs6013915 PFDN4
1 0.05 0.05 0.35 0.06
2 0.07 0.04 0.13 0.15
3 SNP -0.96 0.27 6.32×10⁻⁸ 2.6×10
-5
Interaction 0.04 0.01
rs9658121 PPARD
1 0.09 0.07 0.25 0.003
2 0.13 0.07 0.06 0.003
3 SNP -0.49 0.33 1.54×10⁻⁷ 3.06×10
-6
Interaction 0.03 0.01
rs10508754 KIAA1462
1 -0.14 0.03 1.07×10⁻⁵
0.30
2 -0.15 0.03 2.55×10⁻⁷
0.10
3 SNP 0.19 0.22 2.64×10⁻⁵ 0.14
Page 78 of 104Diabetes

Interaction -0.01 0.01
rs11627967 NPAS3
1 -0.04 0.06 0.53 0.10
2 -0.04 0.05 0.46 0.08
3 SNP -1.46 0.28 1.01×10⁻⁹ 1.42×10
-13
Interaction 0.06 0.01
rs10495667 VSNL1
1 0.09 0.04 0.01 0.50
2 0.09 0.03 0.01 0.71
3 SNP -0.90 0.18 3.83×10⁻⁹ 0.12
Interaction 0.04 0.01
rs13059110 TXNDC6
1 -0.10 0.02 1.6×10⁻⁶
0.18
2 -0.09 0.02 3.69×10⁻⁷
0.12
3 SNP 0.20 0.14 8.84×10⁻⁵ 0.08
Interaction -0.01 0.01
rs11790816 SH3GL2
1 0.03 0.06 0.59 0.06
2 0.03 0.05 0.52 0.15
3 SNP -1.38 0.26 3.56×10⁻⁹ 2.06×10
-4
Interaction 0.06 0.01
Model 1 is adjusted for age and sex; Model 2 is adjusted for age, sex, and BMI; Model 3 assesses the combined influence of the SNP effect adjusted for BMI and the interaction effect between the genotype and BMI on ISI. For Model 1 and Model 2,
the effect, SE, and P -values for the SNP are shown. For Model 3, the effect (beta) and SE are provided for the SNP and the interaction;
deviation per effect allele. SNP: single nucleotide polymorphism; Het P -value: heterogeneity P -value for the model.
Page 79 of 104 Diabetes

Supplemental Table 3. Results of Discovery, Replication, and Meta-Analysis for Variant Association with Insulin Sensitivity Index
Replication
N Effect (Beta) SE P -value Het P- value N Effect (Beta)
16752.3 -0.05 0.02 0.00 0.19 13326 -0.04
16735 -0.05 0.01 5.53×10⁻⁵
0.51 13322 -0.06
16735 0.07 0.07 3.00×10⁻⁴
0.29 13322 0.10
0.00 0.003 -0.01
13185 0.07 0.07 0.36 0.45 11557 -0.03
13171 0.04 0.06 0.51 0.06 11556 -0.05
13171 0.11 0.25 0.79 0.13 11556 0.80
-0.003 0.01 -0.03
16753 -0.0004 0.01 0.98 0.27 13342 -0.03
16735 -0.01 0.01 0.54 0.07 13338 -0.03
16735 0.07 0.06 0.57 0.05 13338 0.11
-0.002 0.002 -0.005
13523 0.10 0.05 0.05 1.48×10⁻⁷
11482 0.12
13514 0.04 0.04 0.40 0.30 11480 0.07
13514 0.38 0.17 0.05 8.07×10⁻⁶
11480 -0.08
-0.01 0.01 0.01
16752.9 -0.01 0.04 0.74 0.05 13001 -0.04
16735 -0.004 0.03 0.90 0.29 12998 -0.03
16735 0.02 0.13 0.92 0.30 12998 0.42
-0.001 0.005 -0.02
10784 -0.003 0.05 0.96 0.46 11567 -0.04
10784 -0.01 0.05 0.91 0.42 11566 -0.04
10784 -0.02 0.25 0.79 0.03 11566 0.74
Page 80 of 104Diabetes

-8.87×10⁻⁵
0.01 -0.03
16753 0.04 0.04 0.28 0.21 12143 0.10
16735 0.02 0.03 0.53 0.09 12142 0.08
16735 -0.30 0.16 0.07 0.08 12142 -0.39
0.01 0.01 0.02
13190 -0.02 0.01 0.11 0.62 12783 -0.04
13982 -0.03 0.01 0.01 0.26 12779 -0.05
13982 0.02 0.07 0.01 0.06 12779 0.04
-0.002 0.003 -0.003
13992 0.01 0.04 0.74 0.83 12032 0.06
13982 0.01 0.04 0.73 0.61 12029 0.06
13982 -0.51 0.15 0.004 0.26 12029 -0.62
0.02 0.01 0.03
13991.9 -0.02 0.04 0.57 0.03 12617 -0.01
13982 -0.04 0.03 0.23 0.08 12614 -0.02
13982 -0.17 0.14 0.04 0.01 12614 0.08
0.004 0.01 -2.82×10⁻⁴
16753 -0.01 0.05 0.91 0.91 11151 0.02
16735 -0.01 0.05 0.90 0.80 11150 0.00
16735 0.08 0.18 0.83 0.92 11150 0.62
-0.004 0.01 -0.02
16753 -0.02 0.04 0.69 0.81 12462 -0.04
16735 -0.04 0.04 0.31 0.74 12460 -0.05
16735 0.19 0.16 0.16 0.07 12460 0.55
-0.01 0.01 -0.02
Page 81 of 104 Diabetes

8811.99 -0.03 0.08 0.75 0.31 9594 0.02
8810 -0.07 0.07 0.29 0.63 9591 -0.002
8810 -0.43 0.29 0.05 0.19 9591 0.59
0.01 0.01 -0.03
13190 0.01 0.08 0.93 0.70 6608 -0.03
13982 0.11 0.06 0.09 0.51 6607 0.01
13982 -0.41 0.28 0.14 3.37×10⁻¹⁵
6607 0.79
0.02 0.01 -0.03
13992 0.06 0.08 0.43 0.76 6417 0.06
13982 0.07 0.06 0.29 0.75 6417 0.03
13982 -0.27 0.26 0.21 0.87 6417 -1.16
0.01 0.01 0.05
7601 0.12 0.09 0.17 0.77 4782 0.004
7587 0.05 0.07 0.47 0.35 4782 -0.01
7587 0.38 0.26 0.22 0.10 4782 0.89
-0.01 0.01 -0.04
13991.9 0.05 0.05 0.25 3.30×10⁻⁴
9130 0.05
13982 0.05 0.04 0.23 0.01 9129 0.06
13982 -0.56 0.29 0.04 0.004 9129 -0.84
0.02 0.01 0.04
6142 -0.05 0.05 0.27 0.97 10843 -0.01
6132 -0.03 0.04 0.51 0.98 10841 0.02
6132 -0.33 0.16 0.10 0.93 10841 -0.40
0.01 0.01 0.02
12363 0.03 0.02 0.26 0.83 12787 -0.03
12363 0.01 0.02 0.72 0.72 12783 -0.05
12363 0.17 0.10 0.17 0.55 12783 0.14
Page 82 of 104Diabetes

-0.01 0.004 -0.01
8811.98 0.02 0.09 0.79 0.60 8784 -0.02
8810 -0.02 0.07 0.79 0.57 8783 -0.03
8810 -0.10 0.32 0.95 0.38 8783 -0.94
0.003 0.01 0.04
13991.9 -0.01 0.03 0.73 0.74 13354 0.02
13982 -0.03 0.03 0.34 0.97 13350 0.01
13982 -0.13 0.17 0.51 0.21 13350 -0.51
0.004 0.01 0.02
13984 -0.01 0.02 0.52 0.13 12441 -0.05
13982 -0.01 0.02 0.77 0.65 12438 -0.04
13982 -0.04 0.09 0.79 0.06 12438 0.03
0.001 0.003 -0.002
9364.92 -0.01 0.04 0.84 0.39 12469 0.01
9347 0.01 0.04 0.89 0.90 12467 0.02
9347 0.13 0.17 0.45 0.42 12467 -0.37
-0.004 0.01 0.02
Model 1 is adjusted for age and sex; Model 2 is adjusted for age, sex, and BMI; Model 3 assesses the combined influence of the SNP effect adjusted for BMI and the interaction effect between the genotype and BMI on ISI. For Model 1 and Model 2,
-values for the SNP are shown. For Model 3, the effect (beta) and SE are provided for the SNP and the interaction; P -value is provided for the joint influence of the SNP and interaction effect. Effect sizes are presented as standard
-value for the model.
Page 83 of 104 Diabetes

Combined Meta-Analysis
SE P -value Het P- value N
0.01 1.64×10⁻⁵
0.14 30078.3
0.01 1.20×10⁻¹¹
0.26 30057
0.06 8.87×10⁻¹¹
0.29 30057
0.002
0.04 0.49 0.18 24742
0.04 0.20 0.03 24727
0.17 3.17×10⁻⁷
4.23×10⁻⁵
24727
0.01
0.01 0.001 0.002 30095
0.01 1.16×10⁻⁵
4.35×10⁻⁴
30073
0.05 4.20×10⁻⁴
0.001 30073
0.002
0.04 0.001 2.57×10⁻⁷
25005
0.03 0.02 0.05 24994
0.14 3.72×10⁻⁶
2.29×10⁻¹⁵
24994
0.01
0.03 0.12 0.12 29753.9
0.02 0.16 0.28 29733
0.10 2.60×10⁻⁵
3.19×10⁻⁴
29733
0.004
0.05 0.33 0.42 22351
0.04 0.31 0.52 22350
0.21 4.66×10⁻⁴
1.75×10⁻⁵
22350
Page 84 of 104Diabetes

0.01
0.02 9.43×10⁻⁵
0.41 28896
0.02 4.05×10⁻⁴
0.18 28877
0.12 4.36×10⁻⁹
0.02 28877
0.005
0.01 2.80×10⁻⁴
0.64 25973
0.01 1.87×10⁻⁸
0.21 26761
0.05 2.67×10⁻⁸
0.19 26761
0.002
0.03 0.05 0.30 26024
0.03 0.01 0.10 26011
0.13 1.92×10⁻⁸
0.01 26011
0.005
0.03 0.84 0.08 26608.9
0.03 0.37 0.08 26596
0.12 7.91×10⁻⁹
7.83×10⁻¹⁰
26596
0.005
0.04 0.57 0.87 27904
0.03 0.94 0.90 27885
0.14 9.46×10⁻⁵
0.001 27885
0.01
0.03 0.19 0.22 29215
0.03 0.04 0.35 29195
0.12 3.60×10⁻⁹
6.92×10⁻⁸
29195
0.005
Page 85 of 104 Diabetes

0.04 0.72 0.35 18405.99
0.04 0.96 0.65 18401
0.18 1.12×10⁻⁵
1.21×10⁻¹⁶
18401
0.01
0.04 0.48 0.79 19798
0.04 0.84 0.38 20589
0.19 1.57×10⁻⁴
8.00×10⁻²⁷
20589
0.01
0.04 0.17 0.53 20409
0.04 0.39 0.57 20399
0.18 7.82×10⁻¹²
1.18×10⁻⁷
20399
0.01
0.05 0.93 0.09 12383
0.04 0.77 0.08 12369
0.19 1.21×10⁻⁷
6.78×10⁻¹³
12369
0.01
0.03 0.14 4.64×10⁻⁴
23121.9
0.03 0.05 0.01 23111
0.19 1.52×10⁻⁹
6.03×10⁻⁷
23111
0.01
0.04 0.80 0.02 16985
0.04 0.63 0.02 16973
0.15 0.001 1.65×10⁻⁸
16973
0.01
0.02 0.08 0.01 25150
0.02 0.01 0.001 25146
0.09 0.07 0.004 25146
Page 86 of 104Diabetes

0.004
0.05 0.69 0.31 17595.98
0.04 0.44 0.29 17593
0.21 1.55×10⁻⁷
3.90×10⁻¹⁵
17593
0.01
0.02 0.32 0.37 27345.9
0.02 0.69 0.32 27332
0.12 3.76×10⁻⁵
1.58×10⁻⁴
27332
0.010
0.01 1.10×10⁻⁴
0.01 26425
0.01 2.26×10⁻⁴
0.01 26420
0.07 0.01 0.002 26420
0.003
0.03 0.63 0.15 21833.92
0.03 0.45 0.63 21814
0.14 0.001 2.72×10⁻⁷
21814
0.01
Model 1 is adjusted for age and sex; Model 2 is adjusted for age, sex, and BMI; Model 3 assesses the combined influence of the SNP effect adjusted for BMI and the interaction effect between the genotype and BMI on ISI. For Model 1 and Model 2,
-value is provided for the joint influence of the SNP and interaction effect. Effect sizes are presented as standard
Page 87 of 104 Diabetes
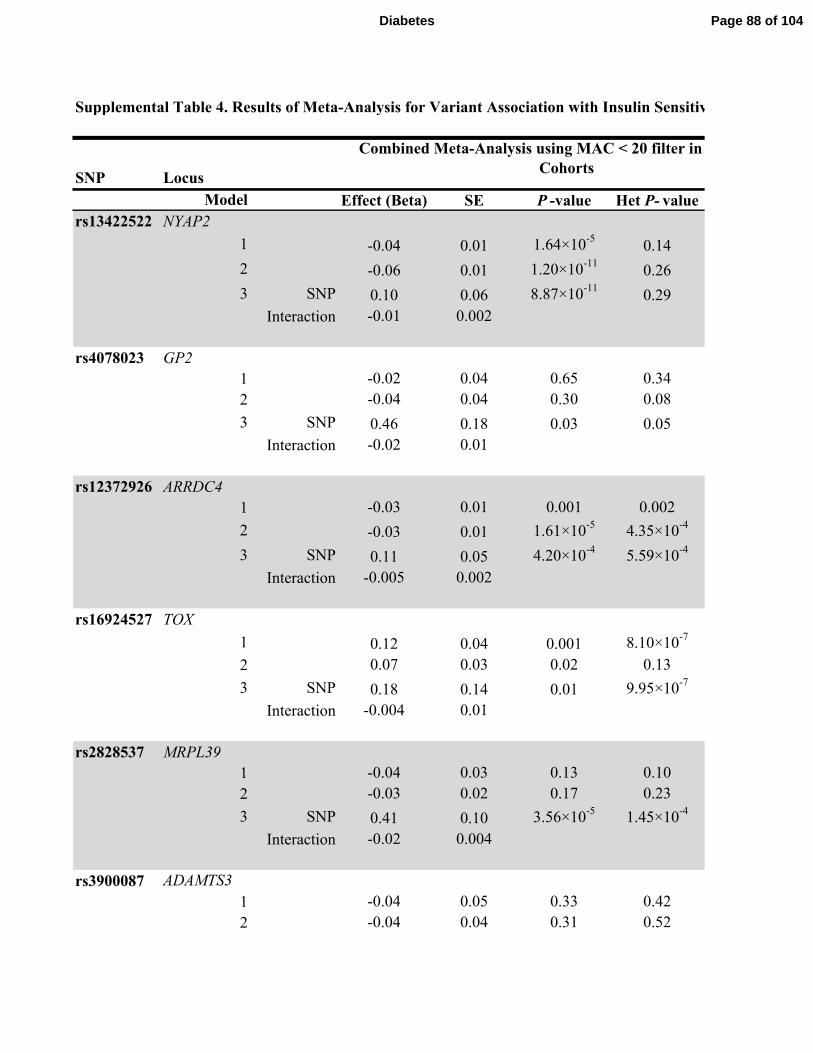
Supplemental Table 4. Results of Meta-Analysis for Variant Association with Insulin Sensitivity Index Using Minor Allele Count Filter
SNP Locus
Effect (Beta) SE P -value Het P- value
rs13422522 NYAP2
1 -0.04 0.01 1.64×10⁻⁵
0.14
2 -0.06 0.01 1.20×10⁻¹¹
0.26
3 SNP 0.10 0.06 8.87×10⁻¹¹
0.29
Interaction -0.01 0.002
rs4078023 GP2
1 -0.02 0.04 0.65 0.34
2 -0.04 0.04 0.30 0.08
3 SNP 0.46 0.18 0.03 0.05
Interaction -0.02 0.01
rs12372926 ARRDC4
1 -0.03 0.01 0.001 0.002
2 -0.03 0.01 1.61×10⁻⁵
4.35×10⁻⁴
3 SNP 0.11 0.05 4.20×10⁻⁴
5.59×10⁻⁴
Interaction -0.005 0.002
rs16924527 TOX
1 0.12 0.04 0.001 8.10×10⁻⁷
2 0.07 0.03 0.02 0.13
3 SNP 0.18 0.14 0.01 9.95×10⁻⁷
Interaction -0.004 0.01
rs2828537 MRPL39
1 -0.04 0.03 0.13 0.10
2 -0.03 0.02 0.17 0.23
3 SNP 0.41 0.10 3.56×10⁻⁵
1.45×10⁻⁴
Interaction -0.02 0.004
rs3900087
1 -0.04 0.05 0.33 0.42
2 -0.04 0.04 0.31 0.52
Model
ADAMTS3
Combined Meta-Analysis using MAC < 20 filter in Discovery
Cohorts
Page 88 of 104Diabetes

3 SNP 0.74 0.21 4.66×10⁻⁴
1.75×10⁻⁵
Interaction -0.03 0.01
rs6027072 ARHGAP40
1 0.10 0.02 9.43×10⁻⁵
0.41
2 0.08 0.02 4.05×10⁻⁴
0.18
3 SNP -0.39 0.12 4.36×10⁻⁹
0.02
Interaction 0.02 0.005
rs12454712 BCL2
1 -0.04 0.01 2.80×10⁻⁴
0.64
2 -0.05 0.01 1.87×10⁻⁸
0.21
3 SNP 0.04 0.05 2.67×10⁻⁸
0.19
Interaction -0.003 0.002
rs10506418 FAM19A2
1 0.05 0.03 0.09 0.54
2 0.06 0.03 0.02 0.20
3 SNP -0.58 0.13 7.96×10⁻⁷
0.07
Interaction 0.02 0.005
rs1857095 ELTD1
1 -0.01 0.03 0.84 0.06
2 -0.02 0.03 0.36 0.05
3 SNP 0.09 0.12 0.09 0.001
Interaction -0.01 0.005
rs11594101 NRG3
1 0.02 0.04 0.57 0.87
2 -0.002 0.03 0.94 0.90
3 SNP 0.62 0.14 9.46×10⁻⁵
0.001
Interaction -0.02 0.01
rs12583553 FGF9
1 -0.04 0.03 0.17 0.69
2 -0.05 0.03 0.04 0.76
3 SNP 0.21 0.13 0.01 0.18
Interaction -0.01 0.01
Page 89 of 104 Diabetes

rs4548846 CDH13
1 0.02 0.04 0.63 0.49
2 0.002 0.04 0.96 0.75
3 SNP -0.45 0.21 0.08 0.20
Interaction 0.02 0.01
rs12522198 FAM134B
1 -0.03 0.04 0.52 0.74
2 0.01 0.04 0.80 0.32
3 SNP 0.79 0.19 1.66×10⁻⁴
9.26×10⁻²⁸
Interaction -0.03 0.01
rs10483182 ISX
1 0.06 0.04 0.16 0.46
2 0.03 0.04 0.39 0.47
3 SNP -0.41 0.21 0.07 0.44
Interaction 0.02 0.01
rs10520638 AGBL1
1 0.01 0.05 0.78 0.13
2 -0.01 0.04 0.88 0.08
3 SNP 0.15 0.21 0.76 0.03
Interaction -0.01 0.01
rs6013915 PFDN4
1 0.05 0.03 0.18 0.001
2 0.05 0.03 0.07 0.02
3 SNP -0.26 0.22 0.03 0.02
Interaction 0.01 0.01
rs9658121 PPARD
1 -0.01 0.04 0.80 0.02
2 0.02 0.04 0.63 0.02
3 SNP -0.40 0.15 0.001 1.65×10⁻⁸
Interaction 0.02 0.01
rs10508754 KIAA1462
1 -0.03 0.02 0.08 0.01
2 -0.05 0.02 0.01 0.001
3 SNP 0.14 0.09 0.07 0.004
Page 90 of 104Diabetes

Interaction -0.01 0.004
rs11627967 NPAS3
1 -0.03 0.05 0.54 0.70
2 -0.04 0.04 0.33 0.76
3 SNP 0.30 0.26 0.52 0.28
Interaction -0.01 0.01
rs10495667 VSNL1
1 0.02 0.02 0.32 0.37
2 0.01 0.02 0.69 0.32
3 SNP -0.51 0.12 3.76×10⁻⁵
1.58×10⁻⁴
Interaction 0.02 0.005
rs13059110 TXNDC6
1 -0.05 0.01 1.10×10⁻⁴
0.01
2 -0.04 0.01 2.26×10⁻⁴
0.01
3 SNP 0.03 0.07 0.01 0.002
Interaction -0.002 0.003
rs11790816 SH3GL2
1 0.01 0.03 0.80 0.33
2 0.02 0.03 0.58 0.84
3 SNP -0.06 0.15 0.44 0.21
Interaction 0.003 0.01
In a sensitivity analysis, the combined meta-analyses were repeating removing all SNPs with a minor allele count (MAC) < 20 in the discovery and replication cohorts. As compared
to when a minor allele frequency (MAF) < 1% was applied to the discovery cohorts and MAC < 20 was applied to replication cohorts in the combined meta-analysis (as shown in
Table 2 and Supplemental Table 3 and repeated here for comparison), application of the MAC filter to both the discovery and replication cohorts in the combined meta-analysis
reduced the heterogeneity of some results in the Model 3 and for the results of the PFDN4 locus association in Model 1. The application of this MAC filter tended to reduce the
statistical significance of associations with high heterogeneity. It also slightly reduced the statistical significance of the association at the
markedly reducing the magnitude of effect or affecting heterogeneity. The sample size for the FAM19A2
filter was applied in the discovery cohorts versus when the MAF filter was applied. Model 1 is adjusted for age and sex; Model 2 is adjusted for age, sex, and BMI; Model 3 assesses
the combined influence of the SNP effect adjusted for BMI and the interaction effect between the genotype and BMI on ISI. For Model 1 and Model 2, the effect, SE, and P-values
for the SNP are shown. For Model 3, the effect (beta) and SE are provided for the SNP and the interaction; P-value is provided for the joint influence of the SNP and interaction
effect. Effect sizes are presented as standard deviation per effect allele. SNP: single nucleotide polymorphism; Het P-value: heterogeneity P-value for the model.
Page 91 of 104 Diabetes

Supplemental Table 4. Results of Meta-Analysis for Variant Association with Insulin Sensitivity Index Using Minor Allele Count Filter
N Effect (Beta) SE P -value Het P- value N
30078.3 -0.04 0.01 1.64×10⁻⁵
0.14 30078.3
30056.3 -0.06 0.01 1.20×10⁻¹¹
0.26 30057
30056.3 0.10 0.06 8.87×10⁻¹¹
0.29 30057
-0.01 0.002
21844 -0.03 0.04 0.49 0.18 24742
21829 -0.05 0.04 0.20 0.03 24727
21829 0.80 0.17 3.17×10⁻⁷
4.23×10⁻⁵
24727
-0.03 0.01
30095 -0.03 0.01 0.001 0.002 30095
30073 -0.03 0.01 1.16×10⁻⁵
4.35×10⁻⁴
30073
30073 0.11 0.05 4.20×10⁻⁴
0.001 30073
-0.005 0.002
25005 0.12 0.04 0.001 2.57×10⁻⁷
25005
24993 0.07 0.03 0.02 0.05 24994
24993 -0.08 0.14 3.72×10⁻⁶
2.29×10⁻¹⁵
24994
0.01 0.01
29291.9 -0.04 0.03 0.12 0.12 29753.9
29270.9 -0.03 0.02 0.16 0.28 29733
29270.9 0.42 0.10 2.60×10⁻⁵
3.19×10⁻⁴
29733
-0.02 0.004
21557 -0.04 0.05 0.33 0.42 22351
22350 -0.04 0.04 0.31 0.52 22350
Combined Meta-Analysis using MAC < 20 filter in Discovery Combined Meta-Analysis using MAF <1% filter in Discovery
Cohorts (repeated from Table 2 and Supplemental Table 3)
Page 92 of 104Diabetes
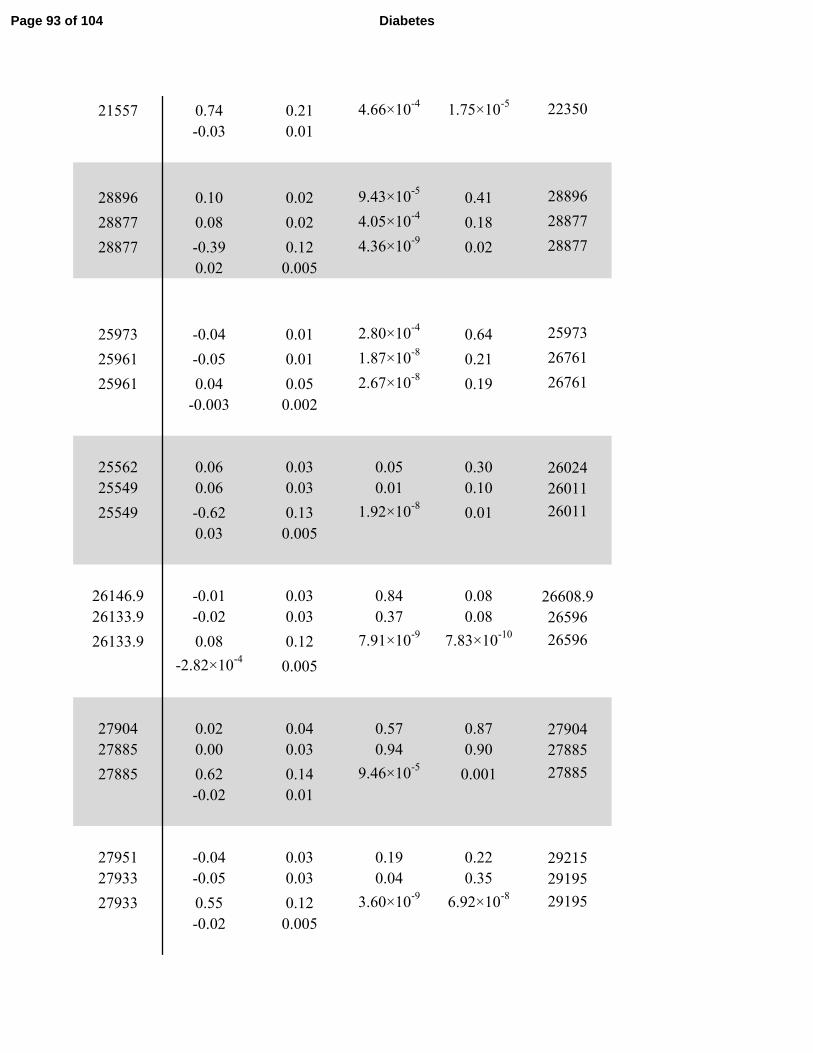
21557 0.74 0.21 4.66×10⁻⁴
1.75×10⁻⁵
22350
-0.03 0.01
28896 0.10 0.02 9.43×10⁻⁵
0.41 28896
28877 0.08 0.02 4.05×10⁻⁴
0.18 28877
28877 -0.39 0.12 4.36×10⁻⁹
0.02 28877
0.02 0.005
25973 -0.04 0.01 2.80×10⁻⁴
0.64 25973
25961 -0.05 0.01 1.87×10⁻⁸
0.21 26761
25961 0.04 0.05 2.67×10⁻⁸
0.19 26761
-0.003 0.002
25562 0.06 0.03 0.05 0.30 26024
25549 0.06 0.03 0.01 0.10 26011
25549 -0.62 0.13 1.92×10⁻⁸
0.01 26011
0.03 0.005
26146.9 -0.01 0.03 0.84 0.08 26608.9
26133.9 -0.02 0.03 0.37 0.08 26596
26133.9 0.08 0.12 7.91×10⁻⁹
7.83×10⁻¹⁰
26596
-2.82×10⁻⁴
0.005
27904 0.02 0.04 0.57 0.87 27904
27885 0.00 0.03 0.94 0.90 27885
27885 0.62 0.14 9.46×10⁻⁵
0.001 27885
-0.02 0.01
27951 -0.04 0.03 0.19 0.22 29215
27933 -0.05 0.03 0.04 0.35 29195
27933 0.55 0.12 3.60×10⁻⁹
6.92×10⁻⁸
29195
-0.02 0.005
Page 93 of 104 Diabetes

23124 0.02 0.04 0.72 0.35 18405.99
23111 -0.002 0.04 0.96 0.65 18401
23111 0.59 0.18 1.12×10⁻⁵
1.21×10⁻¹⁶
18401
-0.03 0.01
19336 -0.03 0.04 0.48 0.79 19798
20127 0.01 0.04 0.84 0.38 20589
19336 0.79 0.19 1.57×10⁻⁴
8.00×10⁻²⁷
20589
-0.03 0.01
19947 0.06 0.04 0.17 0.53 20409
19937 0.03 0.04 0.39 0.57 20399
19937 -1.16 0.18 7.82×10⁻¹²
1.18×10⁻⁷
20399
0.05 0.01
19309 0.004 0.05 0.93 0.09 12383
19295 -0.01 0.04 0.77 0.08 12369
19295 0.89 0.19 1.21×10⁻⁷
6.78×10⁻¹³
12369
-0.04 0.01
22659.9 0.05 0.03 0.14 4.64×10⁻⁴
23121.9
22648.9 0.06 0.03 0.05 0.01 23111
22648.9 -0.84 0.19 1.52×10⁻⁹
6.03×10⁻⁷
23111
0.04 0.01
16985 -0.01 0.04 0.80 0.02 16985
16973 0.02 0.04 0.63 0.02 16973
16973 -0.40 0.15 0.001 1.65×10⁻⁸
16973
0.02 0.01
24359 -0.03 0.02 0.08 0.01 25150
24345 -0.05 0.02 0.01 0.001 25146
24345 0.14 0.09 0.07 0.004 25146
Page 94 of 104Diabetes

-0.01 0.004
17134 -0.02 0.05 0.69 0.31 17595.98
17131 -0.03 0.04 0.44 0.29 17593
17131 -0.94 0.21 1.55×10⁻⁷
3.90×10⁻¹⁵
17593
0.04 0.01
30106.9 0.02 0.02 0.32 0.37 27345.9
30084.9 0.01 0.02 0.69 0.32 27332
30084.9 -0.51 0.12 3.76×10⁻⁵
1.58×10⁻⁴
27332
0.02 0.010
26425 -0.05 0.01 1.10×10⁻⁴
0.01 26425
26412 -0.04 0.01 2.26×10⁻⁴
0.01 26420
26412 0.03 0.07 0.01 0.002 26420
-0.002 0.003
28759.9 0.01 0.03 0.63 0.15 21833.92
28739.9 0.02 0.03 0.45 0.63 21814
28739.9 -0.37 0.14 0.001 2.72×10⁻⁷
21814
0.02 0.01
In a sensitivity analysis, the combined meta-analyses were repeating removing all SNPs with a minor allele count (MAC) < 20 in the discovery and replication cohorts. As compared
to when a minor allele frequency (MAF) < 1% was applied to the discovery cohorts and MAC < 20 was applied to replication cohorts in the combined meta-analysis (as shown in
Table 2 and Supplemental Table 3 and repeated here for comparison), application of the MAC filter to both the discovery and replication cohorts in the combined meta-analysis
locus association in Model 1. The application of this MAC filter tended to reduce the
statistical significance of associations with high heterogeneity. It also slightly reduced the statistical significance of the association at the FAM19A2 locus in Model 3 without
FAM19A2 locus association in Model 3 was 462 individuals fewer when the MAC
filter was applied in the discovery cohorts versus when the MAF filter was applied. Model 1 is adjusted for age and sex; Model 2 is adjusted for age, sex, and BMI; Model 3 assesses
the combined influence of the SNP effect adjusted for BMI and the interaction effect between the genotype and BMI on ISI. For Model 1 and Model 2, the effect, SE, and P-values
for the SNP are shown. For Model 3, the effect (beta) and SE are provided for the SNP and the interaction; P-value is provided for the joint influence of the SNP and interaction
effect. Effect sizes are presented as standard deviation per effect allele. SNP: single nucleotide polymorphism; Het P-value: heterogeneity P-value for the model.
Page 95 of 104 Diabetes

Supplemental Table 6. In silico findings for rs12454712 (BCL2 ) and rs10506418 (FAM19A2 )
rs12454712 (BCL2 )Conditioning results at rs12454712 (BCL2 ) on the signal from the obesity locus rs663129 (MC4R ),
located 3 Mb away (LD r2 < 0.0001), did not attenuate the association with the ISI in the discovery
cohorts of Model 2 (beta = -0.067 ± 0.01, P = 1.4 × 10⁻⁷ to beta = -0.067 ± 0.01, P =1.6 × 10⁻⁷), and no
other genome-wide significant findings for glycemic traits are present on chromosome 18.
The major (T) allele of rs12454712 (BCL2 ) was also associated with a trend toward reduced insulin
sensitivity as measured by M value from direct measures of insulin sensitivity in the GENESIS
consortium (beta = -0.0275 ± 0.03, P=0.41, N=2,764). When the variant at BCL2 was tested in the
same subset of discovery cohorts (FHS, Sorbs, FUSION), the associations with fasting insulin and ISI
were not significant (for fasting insulin SNP effect = -0.11 ± 0.07, interaction effect 0.004 ± 0.003,
P=0.25, N=7,819 and for ISI SNP effect = -0.03 ± 0.22, interaction effect -0.001 ± 0.01, P=0.24,
factor binding (RegulomeDB score 2b = TF binding + any motif + DNAse footprint + DNAse peak).
Using the UCSC Genome Browser, binding motifs to several transcription factors are evident (MYC,
phosphatase that mediates dephosphorylation of AKT1, AKT2, and AKT3, which has a role in
regulation of apopotosis and insulin signaling (www.Uniprot.org). Thus, this locus may play a role in
rs10506418 (FAM19A2 )Conditioning the result at rs10506418 (FAM19A2 , chromosome 12) on signals from known glucose
and insulin loci within 100 Mb did not attenuate the association with the ISI in the discovery cohorts of
Model 2 (beta = 0.139 ± 0.04, P= 4.50 × 10⁻⁴ (unconditioned) to beta = 0.139 ± 0.04, P = 4.57 × 10⁻⁴
when conditioned on rs35767 (IGF1, LD r2 = 0.0005), to beta = 0.139 ± 0.04, P= 4.54 × 10⁻⁴ when
When rs10506418 was tested in the same subset of discovery cohorts (FHS, Sorbs, FUSION), the
associations with fasting insulin and ISI were not significant (for fasting insulin SNP effect = 0.33 ±
0.13, interaction effect -0.01 ± 0.13, P =0.06, N=7,851 and for ISI SNP effect = -0.17 ± 0.48,
interaction effect -0.01 ± 0.01, P =0.85, N=3,396). However, for the fasting insulin and ISI analyses,
acting as regulators of immune and nervous cells primarily in the brain.
Multiple SNPs within 1 Mb (e.g ., rs17125631) are associated at nominal significance with type 2
diabetes and fasting insulin, although these are not in LD with our finding at rs10506418. The genomic
region containing FAM19A2 also contains USP15, a hydrolase that removes ubiquitin from target
proteins and regulates several pathways, including TGF-beta receptor signaling and NF-kappa-B
Page 96 of 104Diabetes

rs12454712
BMI (kg/m2)
Full CohortFHS, Sorbs,
FUSIONManning et al
FHS, Sorbs,
FUSION
< 20 -0.02 -0.05 0.01 -0.03
20-24.9 -0.04 -0.06 0.02 0.00
25-29.9 -0.06 -0.06 0.02 0.02
30-34.9 -0.07 -0.07 0.03 0.04
≥35 -0.09 -0.08 0.03 0.06
The association of the T allele rs12454712 (BCL2 ) and the A allele rs10506418 (FAM19A2
(BMI). The effect (beta) is derived from the Model 3 analyses in the full cohort of the current study for ISI (the same data in Figure 2 and Figure 3) and from a published
dataset for fasting insulin (Nat Genet 2012; 44:659-669). To compare the effects in the same cohorts, the Model 3 associations for ISI and fasting insulin were performed in
the same subset of discovery cohorts (FHS, Sorbs, FUSION). Effect sizes are presented as standard deviation per effect allele at each strata of BMI. Model 3: test of the
combined influence of the SNP effect adjusted for BMI and the interaction effect between the genotype and BMI on ISI.
Supplemental Table 3: Association for rs12454712 (BCL2 ) and rs10506418 (FAM19A2 ) with ISI and fasting insulin at different strata of body mass index
ISI Fasting Insulin
Page 97 of 104 Diabetes

rs10506418
Full Cohort FHS, Sorbs, FUSION Manning et al FHS, Sorbs, FUSION
-0.10 -0.02 0.01 0.10
0.03 0.02 0.00 0.04
0.16 0.06 -0.01 -0.01
0.30 0.09 -0.03 -0.06
0.43 0.13 -0.04 -0.11
FAM19A2 ) with ISI and fasting insulin is shown at different strata of body mass index
(BMI). The effect (beta) is derived from the Model 3 analyses in the full cohort of the current study for ISI (the same data in Figure 2 and Figure 3) and from a published
dataset for fasting insulin (Nat Genet 2012; 44:659-669). To compare the effects in the same cohorts, the Model 3 associations for ISI and fasting insulin were performed in
the same subset of discovery cohorts (FHS, Sorbs, FUSION). Effect sizes are presented as standard deviation per effect allele at each strata of BMI. Model 3: test of the
combined influence of the SNP effect adjusted for BMI and the interaction effect between the genotype and BMI on ISI.
) with ISI and fasting insulin at different strata of body mass index
ISI Fasting Insulin
Page 98 of 104Diabetes
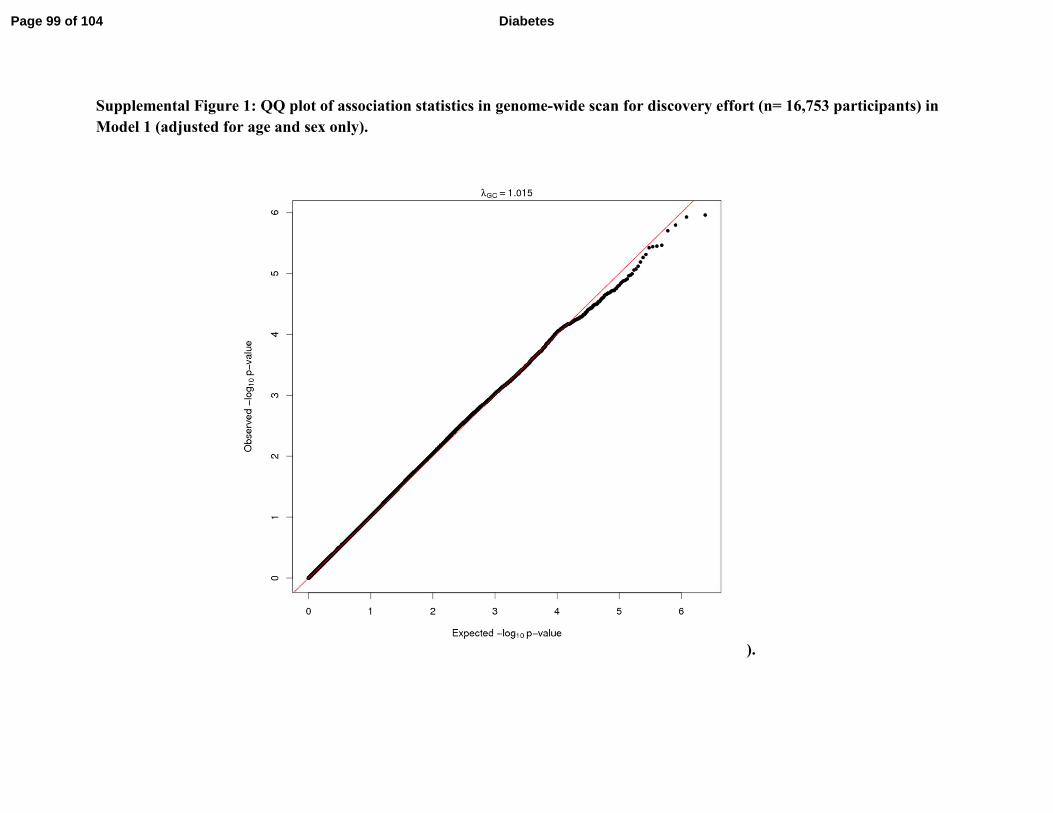
Supplemental Figure 1: QQ plot of association statistics in genome-wide scan for discovery effort (n= 16,753 participants) in
Model 1 (adjusted for age and sex only).
).
Page 99 of 104 Diabetes

Supplemental Figure 2: QQ plot of association statistics in genome-wide scan for discovery effort (n= 16,735 participants) in
Model 2 (adjusted for age, sex, and body mass index).
Page 100 of 104Diabetes

Supplemental Figure 3: QQ plot of association statistics in genome-wide scan for discovery effort (n= 16,735) participants in
Model 3 (adjusted for age and sex and analyzing combined influence of the SNP effect adjusted for body mass index [BMI]
and the interaction effect between genotype and BMI on ISI).
Page 101 of 104 Diabetes

Supplemental Figure 4: Forrest Plot for association of rs12454712 (BCL2) with the ISI in Model 1 and Model 2 of the
discovery and replication cohorts.
Page 102 of 104Diabetes

Supplemental Figure 5: Forrest Plot for association of rs10506418 (FAM19A2) with the ISI in Model 1 and Model 2 of the
discovery and replication cohorts
Page 103 of 104 Diabetes

Supplemental Figure 6: Locus Zoom plot for associations at rs12454712 (BCL2)
The LocusZoom plot (1) is shown for rs12454712 (BCL2) and other SNPs within 1MB for association with ISI in
Model 3 (adjusted for age, sex, and BMI and tested the interaction between genotype and BMI) in the discovery
cohorts. GWAS catalog traits are presented at the bottom and those traits with a genome-wide significant association
(P<5×10⁻⁸) are marked with *. The green horizontal line indicates P=5×10
-8 and the blue horizontal line indicates
P=1×10⁻⁷. Pruim RJ, Welch RP, Sanna S, Teslovich TM, Chines PS, Gliedt TP, Boehnke M, Abecasis GR, Willer
CJ. LocusZoom: regional visualization of genome-wide association scan results. Bioinformatics 2010; 26:2336-2337
Page 104 of 104Diabetes
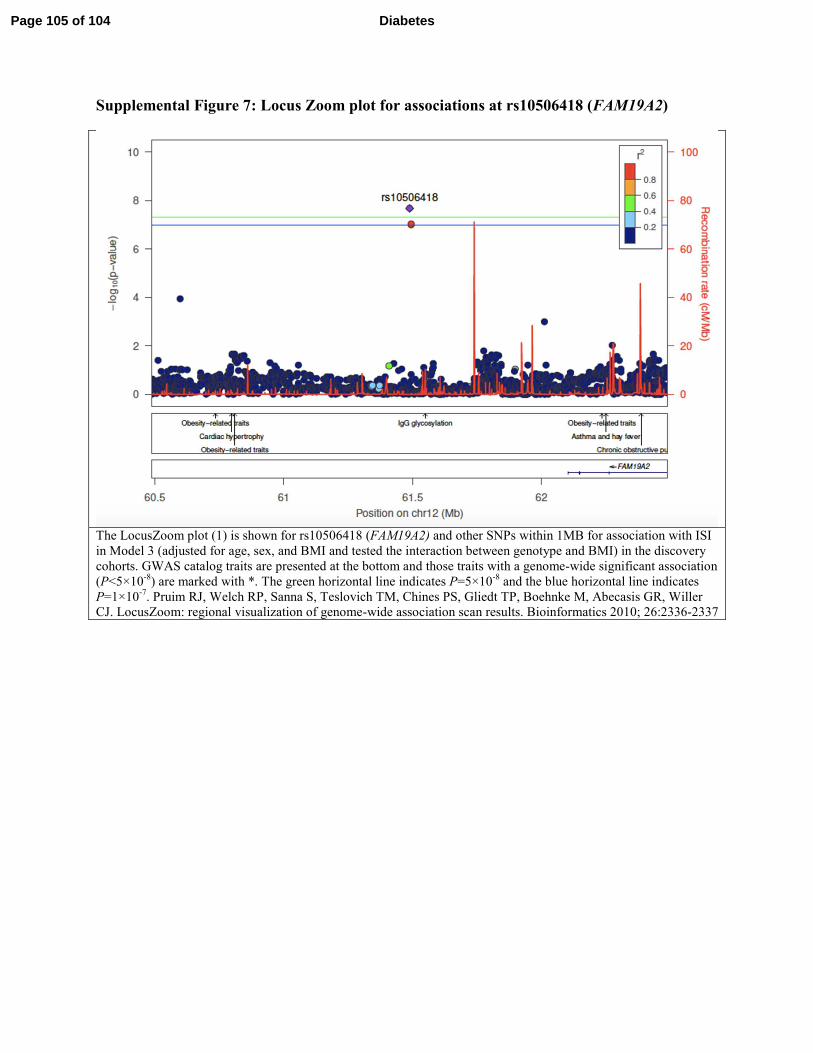
Supplemental Figure 7: Locus Zoom plot for associations at rs10506418 (FAM19A2)
The LocusZoom plot (1) is shown for rs10506418 (FAM19A2) and other SNPs within 1MB for association with ISI
in Model 3 (adjusted for age, sex, and BMI and tested the interaction between genotype and BMI) in the discovery
cohorts. GWAS catalog traits are presented at the bottom and those traits with a genome-wide significant association
(P<5×10⁻⁸) are marked with *. The green horizontal line indicates P=5×10
-8 and the blue horizontal line indicates
P=1×10⁻⁷. Pruim RJ, Welch RP, Sanna S, Teslovich TM, Chines PS, Gliedt TP, Boehnke M, Abecasis GR, Willer
CJ. LocusZoom: regional visualization of genome-wide association scan results. Bioinformatics 2010; 26:2336-2337
Page 105 of 104 Diabetes