charlotte county - tif update technical
TRANSCRIPT


Charlotte County
Transportation Impact Fee Study
TECHNICAL REPORT
Prepared for:
Charlotte County Community Development Department
18500 Murdock Circle, Unit B‐200 Port Charlotte, FL 33948
ph (941) 764‐4116
September 26, 2013
Tindale‐Oliver & Associates, Inc. 1000 Ashley Drive, Suite 400
Tampa, FL 33602 ph (813) 224‐8862, fax (813) 226‐2106

Tampa Office ‐ Headquarters1000 N. Ashley Drive, Suite 400
Tampa, FL 33602 | (813) 224‐8862
Tampa Orlando Bartow Ft. Lauderdale Baltimore www.tindaleoliver.com
September 26, 2013
Mr. Gary Grossman
Charlotte County Assistant Transportation Engineer
18500 Murdock Circle, Unit B‐200
Port Charlotte, FL 33948
Re: Charlotte County Transportation Impact Fee Update Study
Dear Mr. Grossman:
Enclosed is the Technical Report of the Charlotte County Transportation Impact Fee Update
Study. If you have any questions or comments concerning this report, please do not hesitate to
contact me or Nilgün Kamp.
It has been our pleasure to have worked with the County staff on this important project.
Sincerely,
Steven A. Tindale, P.E., AICP
President

Charlotte County | Transportation Impact Fee Study
Tindale‐Oliver & Associates, Inc. Charlotte County September 2013 i Transportation Impact Fee Study
Charlotte County
Transportation Impact Fee Study
Table of Contents
INTRODUCTION ........................................................................................................... 1
DEMAND COMPONENT ................................................................................................ 3
Travel Demand ........................................................................................................ 3
Interstate & Toll Facility Discount Factor ............................................................... 4
COST COMPONENT ...................................................................................................... 5
County Roadway Costs............................................................................................ 5
State Roadway Costs ............................................................................................... 7
Summary of Costs (Blended Cost Analysis) ............................................................ 9
Capacity Added per Lane Mile ................................................................................ 9
Cost per Vehicle‐Mile of Capacity Added ............................................................... 10
CREDIT COMPONENT ................................................................................................... 11
Gasoline Tax Equivalent Credit ............................................................................... 11
Present Worth Variables ......................................................................................... 13
Fuel Efficiency ......................................................................................................... 13
Effective Days per Year ........................................................................................... 14
CALCULATED TRANSPORTATION IMPACT FEE SCHEDULE ............................................. 15
Transportation Impact Fee Calculation .................................................................. 17
Transportation Impact Fee Comparison ................................................................. 18
TRANSPORTATION IMPACT FEE BENEFIT DISTRICTS ..................................................... 20
District Boundaries .................................................................................................. 20
Benefit Districts Recommendations ....................................................................... 21 APPENDICES
Appendix A: Demand Component Calculations
Appendix B: Cost Component Calculations
Appendix C: Credit Component Calculations
Appendix D: Calculated Transportation Impact Fee Schedule

Charlotte County | Transportation Impact Fee Study
Tindale‐Oliver & Associates, Inc. Charlotte County September 2013 1 Transportation Impact Fee Study
Introduction Charlotte County’s Transportation Impact Fee Ordinance was most recently updated in
2009 to assist the County in providing adequate transportation facilities for expected
growth. Since 2009, annual indexing adjustments have been applied to the fee rates each
year, which resulted in approximately 15 percent decrease. Charlotte County has retained
Tindale‐Oliver & Associates, Inc. (TOA) to prepare an update study to reflect changes to the
cost, credit, and demand components since 2009. In addition, this report will transition
Charlotte County’s transportation impact fee program to a single county‐wide fee rate,
eliminating the existing fee variation by geographical area. It should be noted that figures
calculated in this study represent the technically defensible level of impact fees that the
County could charge; however, the Board of County Commissioners may choose to discount
the fees as a policy decision.
Following this introduction, this report provides the results of the fee analysis and consists
of the following sections:
Demand Component
Cost Component
Credit Component
Calculated Transportation Impact Fee Schedule
Transportation Impact Fee Schedule Comparison
The methodology used for the transportation impact fee study follows a consumption‐
based impact fee approach, in which new development is charged based upon the
proportion of vehicle‐miles of travel (VMT) that each unit of new development is expected
to consume of a lane mile of roadway network.
Included in this document is the necessary support material used in the calculation of the
transportation impact fee. The general equation used to compute the impact fee for a
given land use is:
[Demand x Cost] – Credit = Fee
The demand for travel placed on the transportation system is expressed in units of VMT
(daily vehicle‐trip generation rate times the trip length times the percent new trips [of total

Charlotte County | Transportation Impact Fee Study
Tindale‐Oliver & Associates, Inc. Charlotte County September 2013 2 Transportation Impact Fee Study
trips]) for each land use contained in the impact fee schedule. The trip generation is
expressed in average daily rates since new development consumes trips on a daily basis.
The cost of building new capacity typically is expressed in units of dollars per vehicle mile or
lane mile of roadway capacity. The credit is an estimate of the future non‐impact fee
revenues generated by new development that are allocated to transportation capacity
expansion construction projects. Thus, the impact fee is an “up front” payment for a
portion of the cost of building a lane mile of capacity directly related to the amount of
capacity consumed by each unit of land use contained in the impact fee schedule that is not
paid for by future tax revenues generated by new development.
It should be noted that the information used to develop the impact fee schedule was based
on the most recent, reliable, and localized data available. The following input variables
used in the fee equation:
Demand Variables:
Trip generation rate
Trip length
Percent new trips
Interstate and toll facility discount factor
Cost Variables:
Cost per lane mile
Capacity added per lane mile
Credit Variables:
Equivalent gas tax credit (pennies)
Present worth
Fuel efficiency
Effective days per year
A review of impact fee variables and corresponding recommendations are presented in the
following subsections.

Charlotte County | Transportation Impact Fee Study
Tindale‐Oliver & Associates, Inc. Charlotte County September 2013 3 Transportation Impact Fee Study
Demand Component
Travel Demand
The amount of transportation system consumed by a unit of new land development is
calculated using the following variables and is measured in terms of the vehicle miles of
new travel a unit of development consumes on the existing road system.
Number of daily trips generated;
Average length of those trips; and
Proportion of travel that is new travel, rather than travel that is already traveling on
the road system and is captured by new development.
As part of this update, the trip characteristics variables were obtained primarily from three
sources: (1) local studies conducted in Charlotte County, (2) similar studies previously
conducted throughout Florida by TOA (Florida Studies Database), and (3) the Institute of
Transportation Engineers’ (ITE) Trip Generation report (9th edition).
The Florida Studies Database (including Charlotte County studies) is included in Appendix A.
This database was used to determine VMT, which is developed from trip length, percent
new trips, and trip rate for most land uses in the fee schedule. The data in the trip
characteristics database is based on actual land use studies and was collected throughout
Florida using machine traffic counts and site specific land use origin‐destination surveys.
This data represents a more localized and accurate measure of trip characteristics than the
information previously used in the County’s adopted transportation impact fee calculation.
In addition, trip generation data from the ITE 9th Edition Trip Generation report was used. In
instances where trip generation was available from the ITE Trip Generation report and the

Charlotte County | Transportation Impact Fee Study
Tindale‐Oliver & Associates, Inc. Charlotte County September 2013 4 Transportation Impact Fee Study
Florida Studies Database, a blended average calculation was used to increase the sample
size.
Interstate and Toll Facility Discount Factor
This variable is used to recognize that improvements to Interstate highways are funded by
the State using earmarked and Federal funds, while toll facility improvements are funded
with toll revenues. Typically, impact fee revenues are not used to pay for these
improvements, and the portion of new development’s travel occurring on the interstate/toll
facility system usually is eliminated from the total travel for each land use.
To calculate the interstate and toll (I/T) facility discount factor, the loaded highway network
file was generated for the Sarasota‐Manatee‐Charlotte (SMC) regional travel demand
model. A select link analysis was run for all traffic analysis zones located within Charlotte
County in order to differentiate trips with an origin and/or destination within the county
versus trips with no origin or destination within the county. It should be noted that
discount factor excludes external‐to‐external trips, which represent traffic that goes
through Charlotte County, but does not necessarily stop in the county. This traffic is
excluded from the calculations since it does not come from a development within the
county.
Currently, the only interstate facility in Charlotte County is I‐75 and the only toll facility is
the Gasparilla Island Swing Bridge. The limited access vehicle miles of travel (Limited Access
VMT) for trips with an origin and/or destination within Charlotte County was calculated for
the identified limited access facilities. The total Charlotte County VMT was calculated for all
trips with an origin and/or destination within Charlotte County for all roads, including
limited access roads, located within Charlotte County.
The I/T discount factor of 15.6 percent was determined by dividing the total Limited Access
VMT by the Total Charlotte County VMT. By applying this factor to the total Charlotte
County VMT, the impact fee calculated using this reduced VMT is only charging for travel on
roadways which are likely to be funded by impact fee revenues. Appendix A, Table A‐1
provides further detail on this calculation.

Charlotte County | Transportation Impact Fee Study
Tindale‐Oliver & Associates, Inc. Charlotte County September 2013 5 Transportation Impact Fee Study
Cost Component The cost of providing roadway system capacity has decreased in recent years. Construction
costs increased significantly in Florida between 2005 and 2007 due to additional
construction demand caused by hurricanes, the housing market growth, and other factors.
Appreciation in land values also resulted in higher right‐of‐way (ROW) costs during the same
period. In early 2008, costs started to stabilize, and in recent years, communities have
experienced a decrease in construction costs, returning to levels seen before 2005. Cost
information from Charlotte County, other Florida Counties, and the Florida Department of
Transportation (FDOT) was reviewed to develop a unit cost for all phases involved in the
construction of one lane mile of roadway capacity. The following subsections summarize
the methodology and findings of the total unit cost analysis for county and state roads.
Appendix B provides the data and other support information utilized in these analyses.
County Roadway Costs
This section examines the right‐of‐way (ROW), construction, and other cost components
associated with county roads with respect to transportation capacity improvements in
Charlotte County. For this purpose, recent bid data for ongoing projects provided by the
County and recent construction bid data from county roadway projects throughout Florida
were used to identify and provide supporting cost data for county improvements. The cost
for each roadway capacity project was separated into four phases: design,
construction/engineering inspection (CEI), ROW and construction.
Design and CEI
Design costs for county roads were estimated at 10 percent construction phase costs based
on a review of cost estimates for local improvements in the County’s 5‐year capital
improvement program, data collected from other Florida jurisdictions, and discussions with
County staff. Additional detail is included in Appendix B, Table B‐1.

Charlotte County | Transportation Impact Fee Study
Tindale‐Oliver & Associates, Inc. Charlotte County September 2013 6 Transportation Impact Fee Study
CEI costs for county roads were estimated at 10 percent of construction phase costs based
on a review of recently completed and ongoing local improvements, cost data collected
from other Florida jurisdictions, and discussions with County staff. Additional detail is
included in Appendix B, Table B‐5.
Right‐of‐Way
The ROW cost reflects the total cost of the acquisitions along a corridor that were necessary
to have sufficient cross‐section width to widen an existing road or, in the case of new
construction, to build a new road. A review of recent ROW cost data for Charlotte County
identified three improvements (including projects along Toledo Blade, Piper Road and Burnt
Store Road) totaling approximately $11.8 million. Using the construction costs for these
improvements, a ROW factor of construction was calculated at approximately 47 percent.
Based on this review, for purposes of this study, ROW acquisition costs will be estimated at
47 percent of the construction costs in Charlotte County. As seen in Table 1, this amount is
equal to approximately $1.03 million per lane mile. The use of the 47 percent ROW factor is
slightly higher than other ROW ratios seen in recent impact fee studies throughout Florida,
which average approximately 40 percent for county roads.
Construction
The construction cost for county roads (urban/suburban section design) was based on local
projects, costs for projects in other communities in Florida, and discussions with County
staff. A review of recent construction cost data for Charlotte County identified
approximately 11 lane miles of suburban design roadway improvements (including projects
along Toledo Blade, Piper Road, and Burnt Store Road) averaging $2.22 million per lane
mile. To increase the sample size of projects, recent bids from multiple communities
throughout the state were also reviewed. This review included approximately 231 lane
miles of urban design roadway improvements from 12 counties and calculated an average
cost of $2.18 million per lane mile. Appendix B, Table B‐3 provides a detailed description of
the projects analyzed.
Based on this review, a county roadway construction cost of $2.20 million was used in the
transportation impact fee calculation. This construction cost is applicable to urban and
suburban designed roads, which were found to have similar lane mile costs. Table 1
presents the weighted average roadway cost for county roadways which was used in the
transportation impact fee calculation.

Charlotte County | Transportation Impact Fee Study
Tindale‐Oliver & Associates, Inc. Charlotte County September 2013 7 Transportation Impact Fee Study
Table 1 Estimated Total Cost per Lane Mile
for County Roads
(1) Design is estimated at 10% of the construction
cost per lane mile (see Appendix B, Table B‐1) (2) ROW is estimated at 47% of the construction
cost per lane mile (see Appendix B, Table B‐2) (3) Source: Appendix B, Table B‐3 (4) CEI is estimated at 10% of the construction
cost per lane mile (see Appendix B, Table B‐5)
State Roadway Costs
This section examines the ROW, construction, and other cost components associated with
state roads with respect to transportation capacity improvements in Charlotte County. For
this purpose, recent bid data from state roadway projects throughout Florida and the
FDOT’s Long Range Estimates (LRE) were used to identify and provide supporting cost data
for state improvements. The cost for each roadway capacity project was separated into
four phases: design, CEI, ROW and construction.
Design and CEI
Design and CEI costs for state roads were each estimated at 10 percent of construction
phase costs, based on a review of recent transportation impact fee studies throughout
Florida, the Florida Long Range Estimates (LRE) for state roads, and discussions with staff.
Right‐of‐Way
Given the limited data on ROW costs for state roads in Charlotte County and based on our
experience in other jurisdictions, the ROW cost ratio calculated for County roads was also
applied to state roads. Using this ROW‐to‐construction ratio of 47 percent, as shown in
Table 2, this amount is equal to approximately $1.13 million per lane mile. The use of the
Cost PhaseCost Per Lane
Mile
Design(1)
$220,000
Right‐of‐Way(2)
$1,034,000
Construction(3)
$2,200,000
CEI(4)
$220,000
Total Cost $3,674,000

Charlotte County | Transportation Impact Fee Study
Tindale‐Oliver & Associates, Inc. Charlotte County September 2013 8 Transportation Impact Fee Study
47 percent ROW factor is in‐line with other ROW ratios seen in recent impact fee studies
throughout Florida, which average approximately 44 percent for state roads.
Construction
Given the limited data on construction costs for state roads in Charlotte County, the
construction cost (urban section design) was based on recently bid projects in other
communities in Florida. This review included approximately 290 lane miles or roadway
improvements from 26 counties and calculated an average cost of $2.43 million per lane
mile. Appendix B, Table B‐4 provides a detailed description of the projects analyzed.
Based on this review, a state roadway construction cost of $2.40 million per lane mile was
used in the transportation fee calculation. Table 2 presents the weighted average roadway
cost for state roadways which was used in the transportation impact fee calculation.
Table 2 Estimated Total Cost per Lane Mile
for State Roads
(1) Design is estimated at 10% of the
construction cost per lane mile (2) ROW is estimated at 47% of the construction
cost per lane mile (3) Source: Appendix B, Table B‐4 (4) CEI is estimated at 10% of the construction
cost per lane mile
Cost PhaseCost Per Lane
Mile
Design(1)
$240,000
Right‐of‐Way(2)
$1,128,000
Construction(3)
$2,400,000
CEI(4)
$240,000
Total Cost $4,008,000

Charlotte County | Transportation Impact Fee Study
Tindale‐Oliver & Associates, Inc. Charlotte County September 2013 9 Transportation Impact Fee Study
Summary of Costs (Blended Cost Analysis)
The weighted average cost per lane mile for county and state roads is presented in Table 3.
The resulting weighted average cost of approximately $3.77 million per lane mile was
utilized as the roadway cost input in the calculation of the transportation impact fee
schedule. The weighted average cost per lane mile includes county and state roads and is
based on weighting the lane miles of roadway improvements in the Long Range
Transportation Plan (LRTP).
Table 3 Estimated Cost per Lane Mile
for County and State Roadway Projects in Charlotte County
(1) Source: Table 1 (2) Source: Table 2 (3) Lane mile distribution (Item 4) multiplied by the design, ROW, construction, and
CEI phase costs by jurisdiction to develop a weighted average cost per lane mile (4) Source: Appendix B, Table B‐6
Capacity Added per Lane Mile
An additional component of the transportation impact fee equation is the capacity added
per lane mile (also known as the maximum service volume added per mile) of roadway
constructed. To calculate the vehicle miles of capacity (VMC) per lane mile of constructed
future roadway, an analysis of the 2035 projects (see Appendix B, Table B‐6) was conducted
to reflect the mix of county and state road improvements that will be built in the future. As
shown in Table 4, based on these projections, the resulting average capacity added per lane
mile calculated is 10,508.
Cost Type County Roads(1)
State Roads(2)
County and
State Roads(3)
Design $220,000 $240,000 $225,800
Right‐of‐Way $1,034,000 $1,128,000 $1,061,260
Construction $2,200,000 $2,400,000 $2,258,000
CEI $220,000 $240,000 $225,800
Total $3,674,000 $4,008,000 $3,770,860
Lane Mile Distribution(4)
71% 29% 100%

Charlotte County | Transportation Impact Fee Study
Tindale‐Oliver & Associates, Inc. Charlotte County September 2013 10 Transportation Impact Fee Study
Table 4 Weighted Average Vehicle‐Miles of Capacity per Lane Mile
(1) Source: Appendix B, Table B‐6 (2) Source: Appendix B, Table B‐6 (3) Vehicle miles of capacity added (Item 2) divided by lane miles added (Item 1) (4) Total vehicle miles of capacity added for county and state roads (Item 2) divided by the
total lane miles added (Item 1)
Cost per Vehicle‐Mile of Capacity Added
The impact fee cost per unit of development is assessed based on the cost per vehicle‐mile
of capacity. As shown in Tables 3 and 4, the cost and capacity for county roads have been
calculated based on typical roadway improvements. As shown in Table 5, the cost per VMC
for travel within Charlotte County is approximately $359. This average cost per VMC figure
is used in the impact fee calculation to determine the total impact cost per unit of
development based on the vehicle‐miles of travel consumed. For each vehicle‐mile of travel
that is added to the road system, approximately $359 of roadway capacity is consumed.
Table 5 Weighted Average Cost per Vehicle‐Mile of Capacity Added
(1) Source: Table 3 (2) Source: Table 4 (3) Cost per lane mile (Item 1) divided by average capacity added per lane mile (Item 2)
It is important to note that capacity projects include not only new construction and lane
additions, but also associated intersection improvements, traffic signalization, and other
amenities and technology improvements.
SourceLane Mile
Added(1)
Vehicle Miles of
Capacity Added(2)
VMC Added per
Lane Mile(3)
County Roads 166.10 1,667,885 10,041
State Roads 66.80 779,414 11,668
Total 232.90 2,447,299
Weighted Average VMC Added per Lane Mile(4)
10,508
SourceCost per Lane
Mile(1)
Average VMC
Added per Lane
Mile(2)
Cost per VMC(3)
County Roads $3,674,000 10,041 $365.90
State Roads $4,008,000 11,668 $343.50
Weighted Average $3,770,860 10,508 $358.86

Charlotte County | Transportation Impact Fee Study
Tindale‐Oliver & Associates, Inc. Charlotte County September 2013 11 Transportation Impact Fee Study
Credit Component Gasoline Tax Equivalent Credit
The present value of the portion of non‐impact fee revenues (converted to equivalent gasoline
taxes) generated by a new development over a 25‐year period that is projected to be expended
on capacity expansion projects is credited against the cost of the system consumed by travel
associated with new development.
County
A review of the County’s historical roadway financing program (FY 2008‐2012) and the FY 2013‐
2017 Capital Improvement Plan (CIP) shows that all roadway projects are being funded by a
combination of fuel and sales tax revenues, grants, developer funds, municipal funds, and
transportation impact fee revenues. Currently, capacity‐adding projects in the county are
primarily funded with impact fees, fuel tax, and sales tax revenues. However, the sales tax will
expire at the end of 2014 and County staff has indicated that the re‐adoption of the sales tax is
not guaranteed. Over the past 4 years and programmed in the next 2 years, approximately 90%
of the sales tax revenues will be used toward transportation capacity projects. Even if the sales
tax is re‐adopted in 2015, the portion dedicated to transportation is likely to decline from its
current level.
Therefore, two credit scenarios were developed for use in the transportation impact fee
calculation. Scenario 1 assumes that Charlotte County transportation will not receive any future
sales tax revenues, while Scenario 2 assumes that the sales tax is re‐adopted, but that a reduced
amount of the revenues will be allocated to transportation (approximately 50 percent of the
current allocation level). As shown in Table 6, a total gas tax equivalent county revenue credit of
10.7 pennies was given for gas tax equivalent expenditures on roadway capacity expansion
projects using Scenario 1 and 15.8 pennies were given for Scenario 2.

Charlotte County | Transportation Impact Fee Study
Tindale‐Oliver & Associates, Inc. Charlotte County September 2013 12 Transportation Impact Fee Study
In addition, Charlotte County is currently using gas tax revenues to retire debt on capacity
improvements along Burnt Store Road. As shown in Table 6, a total gas tax equivalent revenue
credit of one (1) penny was given for county debt service expenditures.
State
State expenditures on state roads were reviewed, and a credit for the capacity expansion portion
attributable to state projects was estimated (excluding interstate expenditures). The equivalent
number of pennies allocated to fund state projects was determined from projects spanning a 15‐
year period (2004‐2018). This period represents past expenditures (from 2004 to 2013) from the
FDOT Work Program and the projected expenditures (from 2014 to 2018) from the current
Transportation Improvement Program (TIP). A list of capacity‐adding roadway projects was
developed, including lane additions, new road construction, intersection improvements,
interchanges, traffic signal projects, and other capacity‐addition projects. This review
(summarized in Appendix C, Table C‐4) indicates that FDOT spending generates an equivalent gas
tax credit of 6.1 pennies of gas tax revenue annually. The use of a 15‐year period for purposes of
developing a state credit for roadway capacity‐adding projects results in a reasonably stable
credit for Charlotte County, since it accounts for the volatility in FDOT spending in the county
over short time periods. It should be noted, 6.1 pennies is on the low end of state spending
observed in other counties. This is primarily because expenditures on interstate improvements
were not included in the impact fee credit since cost associated with these improvements is also
excluded. In the past 15 years, FDOT has provided over $100 million in funding for interstate
improvements, which represents a major portion of state expenditures in the County.
In summary, under Scenario 1, Charlotte County contributes approximately 11.7 pennies toward
roadway capacity expansion projects, while the State spends an average of 6.1 pennies for
roadway projects in Charlotte County for a total of 17.8 pennies of credit. Under Scenario 2,
Charlotte County contributes approximately 16.8 pennies toward roadway capacity expansion,
while the State spends an average of 6.1 pennies. Therefore, using Scenario 2, 22.9 pennies are
included in the impact fee calculation to recognize the future capital revenue that is expected to
be generated by new development from all non‐impact fee revenues, as shown in Table 6.

Charlotte County | Transportation Impact Fee Study
Tindale‐Oliver & Associates, Inc. Charlotte County September 2013 13 Transportation Impact Fee Study
Table 6 Equivalent Pennies of Gas Tax Revenue
(1) Source: Appendix C, Table C‐2 (2) Source: Appendix C, Table C‐3 (3) Source: Appendix C, Table C‐4
Present Worth Variables
Facility Life
The roadway facility life used in the impact fee analysis is 25 years, which represents the
reasonable life of a roadway.
Interest Rate
This is the discount rate at which gasoline tax revenues might be bonded. It is used to compute
the present value of the gasoline taxes generated by new development. The discount rate of 4.0
percent was used in the transportation impact fee calculation based on the information obtained
from Charlotte County.
Fuel Efficiency
The fuel efficiency (i.e., the average miles traveled per gallon of fuel consumed) of the fleet of
motor vehicles was estimated using the quantity of gasoline consumed by travel associated with
a particular land use.
Appendix C, Table C‐9 documents the calculation of fuel efficiency value based on the following
equation, where “VMT” is vehicle miles of travel and “MPG” is fuel efficiency in terms of miles
per gallon.
TypeRoadwayTypeVehicle
TypeVehicleTypeRoadway MPG
VMTVMTEfficiencyFuel
Scenario 1 Scenario 2
County Revenues(1)
$0.107 $0.158
County Debt Service(2)
$0.010 $0.010
State Revenues(3)
$0.061 $0.061
Total $0.178 $0.229
Equivalent Pennies per GallonCredit

Charlotte County | Transportation Impact Fee Study
Tindale‐Oliver & Associates, Inc. Charlotte County September 2013 14 Transportation Impact Fee Study
The methodology uses non‐interstate VMT and average fuel efficiency data for passenger
vehicles (i.e., passenger cars and other 2‐axle, 4‐tire vehicles, such as vans, pickups, and
SUVs) and large trucks (i.e., single‐unit, 2‐axle, 6‐tire or more trucks and combination
trucks) to calculate the total gallons of fuel used by each of these vehicle types.
The combined total VMT for the vehicle types is then divided by the combined total gallons
of fuel consumed to calculate, in effect, a “weighted” fuel efficiency value that reflects the
existing fleet mix of traffic on non‐interstate roadways. The VMT and average fuel
efficiency data were obtained from the most recent Federal Highway Administration’s
Highway Statistics 2011. Based on the calculation completed in Appendix C, Table C‐9, the
fuel efficiency rate to be used in the updated impact fee equation is 18.19 miles per gallon.
Effective Days per Year
An effective 365 days per year of operation was assumed for all land uses in the proposed fee.
However, this will not be the case for all land uses since some uses operate only on weekdays
(e.g., office buildings) and/or only seasonally (e.g., schools). The use of 365 days per year,
therefore, provides a conservative estimate, ensuring that gasoline taxes are adequately credited
against the fee.

Charlotte County | Transportation Impact Fee Study
Tindale‐Oliver & Associates, Inc. Charlotte County September 2013 15 Transportation Impact Fee Study
Calculated Transportation Impact Fee Schedule The impact fee calculations for each land use are included in Appendix D, which includes the
major land use categories and the impact fees for the individual land uses contained in each
of the major categories. For each land use, Appendix D illustrates the following:
Demand component variables (trip rate, trip length, and percent of new trips);
Total impact fee cost;
Annual gas tax credit;
Present value of the gas tax credit;
Net transportation impact fee;
Current Charlotte County impact fee; and
Percent difference between the calculated impact fee and the current impact fee.
It should be noted that the net impact fee illustrated in Appendix D is not necessarily a
recommended fee, but instead represents the technically defensible impact fee per unit of
land use that could be charged in Charlotte County.
For clarification purposes, the calculation of an impact fee for one land use category is
presented. In the following example, the net impact fee is calculated for the single‐family
residential detached land use category (ITE LUC 210) using information from the impact fee
schedules included in Appendix D. For each land use category, the following equations are
utilized to calculate the net impact fee:
Net Impact Fee = Total Impact Cost – Gas Tax Credit

Charlotte County | Transportation Impact Fee Study
Tindale‐Oliver & Associates, Inc. Charlotte County September 2013 16 Transportation Impact Fee Study
Where:
Total Impact Cost = ([Trip Rate × Assessable Trip Length × % New Trips] / 2) × (1 –
Interstate/Toll Facility Disc. Factor) × (Cost per Vehicle‐Mile of Capacity)
Gas Tax Credit = Present Value (Annual Gas Tax), given 4.0% interest rate & 25‐year
facility life
Annual Gas Tax = ([Trip Rate × Total Trip Length × % New Trips] / 2) × (Effective Days per
Year × $/Gallon to Capital) / Fuel Efficiency
Each of the inputs has been discussed previously in this document; however, for purposes
of this example, brief definitions for each input are provided in the following paragraphs,
along with the actual inputs used in the calculation of the fee for the single‐family detached
residential land use category:
Trip Rate = the average daily trip generation rate, in vehicle‐trips/day (7.81).
Assessable Trip Length = the actual average trip length for the category, in vehicle‐miles
(6.62).
Total Trip Length = the assessable trip length plus an adjustment factor of half a mile,
which is added to the trip length to account for the fact that gas taxes are collected for
travel on all roads including local roads (6.62 + 0.50 = 7.12).
% New Trips = adjustment factor to account for trips that are already on the roadway
(100%).
Divide by 2 = the total daily miles of travel generated by a particular category (i.e.,
rate*length*% new trips) is divided by two to prevent the double‐counting of travel
generated between two land use codes since every trip has an origin and a destination.
Interstate/Toll Facility Discount Factor = discount factor to account for the travel
demand occurring on interstate highways and/or toll facilities (15.6%).
Cost per Lane Mile = unit cost to construct one lane mile of roadway, in $/lane‐mile
($3,770,860).
Average Capacity Added per Lane Mile = represents the average daily traffic on one
travel lane at capacity for one lane mile of roadway, in vehicles/lane‐mile/day (10,508).
Cost per Vehicle‐Mile of Capacity = unit of vehicle‐miles of capacity consumed per unit
of development. Cost per lane mile divided by average capacity added per lane mile
($3,770,860 / 10,508 = $358.86).

Charlotte County | Transportation Impact Fee Study
Tindale‐Oliver & Associates, Inc. Charlotte County September 2013 17 Transportation Impact Fee Study
Present Value = calculation of the present value of a uniform series of cash flows, gas tax
payments in this case, given an interest rate, “i,” and a number of periods, “n;” for 4.0%
interest and a 25‐year facility life, the uniform series present worth factor is 15.6221.
Effective Days per Year = 365 days.
$/Gallon to Capital (Scenario 1) = the amount of gas tax revenue per gallon of fuel that is
used for capital improvements, in $/gallon ($0.178).
$/Gallon to Capital (Scenario 2) = the amount of gas tax revenue per gallon of fuel that is
used for capital improvements, in $/gallon ($0.229).
Fuel Efficiency = average fuel efficiency of vehicles, in vehicle‐miles/gallon (18.19).
Transportation Impact Fee Calculation
Using these inputs, a net impact fee can be calculated for the single‐family residential
detached land use category as follows:
Scenario 1:
Total Impact Cost = ([7.81 * 6.62 * 1.0] /2) * (1 ‐ 0.156) * ($358.86) = $7,830
Annual Gas Tax = ([7.81 * 7.12 * 1.0] /2) * 365 * ($0.178 /18.19) = $99
Gas Tax Credit = $99 * 15.6221 = $1,547
Net Impact Fee = $7,830 ‐ $1,547 = $6,283
Scenario 2:
Total Impact Cost = ([7.81 * 6.62 * 1.0] /2) * (1 ‐ 0.156) * ($358.86) = $7,830
Annual Gas Tax = ([7.81 * 7.12 * 1.0] /2) * 365 * ($0.229 /18.19) = $128
Gas Tax Credit = $128 * 15.6221 = $2,000
Net Impact Fee = $7,830 ‐ $2,000 = $5,830
The complete fee schedules by land use are included in Appendix D, Tables D‐1 and D‐2.

Charlotte County | Transportation Impact Fee Study
Tindale‐Oliver & Associates, Inc. Charlotte County September 2013 18 Transportation Impact Fee Study
Transportation Impact Fee Comparison
As part of the work effort in developing the Charlotte County transportation impact fee
program, a comparison of calculated fees to transportation impact fee schedules adopted in
other jurisdictions was completed. Table 7 presents Charlotte County’s calculated impact
fee and a comparison to transportation impact fees in the surrounding and other
jurisdictions in Florida.
It should be noted that the differences in fee levels for a given land use can be caused by
several factors, including the year of the technical study, adoption percentage, study
methodology including variations in costs, credits and travel demand, land use categories
included in the fee schedule, etc.

Charlotte County | Transportation Impact Fee Study
Tindale‐Oliver & Associates, Inc. Charlotte County September 2013 19 Transportation Impact Fee Study
Table 7 Transportation Impact Fee Comparison
(1) Represents the portion of the maximum fee for each respective county that is currently charged (excluding fees under moratorium, which are noted below). Fees may have been lowered through indexing or policy discounts (2) Du = dwelling unit (3) Source: Appendix D, Table D‐1 (4) Source: Appendix D, Table D‐2 (5) Source: Charlotte County Community Development Department. This represents 100% of the maximum allowed fee. Due to indexing, the rate has decreased since adoption in 2009 (6) Source: Polk County Building & Construction Department. Transportation impact fee moratorium in effect through 1/31/2014 (7) Source: Pasco County Multi‐Modal Mobility Fee Study, adopted July 2011. Fee shown is for the Urban District (8) Source: Collier County Impact Fee Administration Department. Impact fee update study is currently underway. (9) Source: Lake County Growth Management Department, Development Processing Division. Transportation impact fee moratorium in effect through 1/1/2014 (10) Source: Lee County Community Development Department. Recent 80% reduction is in effect through 1/1/2014 (11) Source: Martin County Growth Management Department (12) Source: Indian River County Planning Division (13) Source: Marion County Planning Department. Transportation impact fee moratorium in effect through 12/13/2013 (14) Source: Manatee County Financial Management Department, Impact Fee Administration (15) Source: Sarasota County Planning & Development Services (16) Source: Brevard County Planning & Development Department. Transportation impact fee moratorium in effect through March 2014
Land Use Unit(2)
Charlotte
County
(Calculated ‐
Scenario 1)(3)
Charlotte
County
(Calculated ‐
Scenario 2)(4)
Charlotte
County
(Existing ‐
Urban)(5)
Charlotte
County
(Existing ‐
Rural 1)(5)
Charlotte
County
(Existing ‐
Rural 2)(5)
Polk
County(6)
Pasco
County(7)
Collier
County(8)
Lake
County(9)
Lee
County(10)
Martin
County(11)
Indian River
County(12)
Marion
County(13)
Manatee
County(14)
Sarasota
County(15)
Brevard
County(16)
Date of Last Update 2013 2013 2009 2009 2009 2008 2011 2010 2013 2011 2012 2009 2005 2011 2007 2001
Assessed Portion of Calculated(1)
100% 100% 84% 84% 84% 100% 100% 94% 13% 20% 100% 100% 100% 100% 50% 100%
Residential:
Single Family Detached (2,000 sq ft) du $6,283 $5,830 $1,845 $9,509 $8,779 $4,985 $8,570 $5,753 $500 $1,354 $2,815 $4,483 $6,099 $3,981 $2,887 $4,353
Non‐Residential:
Light Industrial 1,000 sf $3,986 $3,704 $1,190 $7,033 $6,489 $675 $1,000 $4,333 $278 $934 $1,857 $2,404 $2,121 $776 $1,416 n/a
Office (50,000 sq ft) 1,000 sf $7,515 $6,968 $619 $3,736 $3,448 $5,310 $1,174 $9,291 $485 $1,082 $2,198 $3,798 $2,027 $1,823 $3,004 $5,058
Retail (125,000 sq ft) 1,000 sf $10,084 $9,256 $2,303 $13,953 $12,896 $6,754 $7,051 $10,247 $569 $1,602 $5,183 $3,163 $1,565 $7,152 $5,659 $5,270
Bank w/Drive‐In 1,000 sf $21,260 $19,526 $4,554 $27,612 $25,501 $14,377 $14,384 $21,954 $569 $3,472 $6,841 $13,020 $7,376 $7,152 $6,091 $23,331
Fast Food w/Drive‐Thru 1,000 sf $70,920 $64,890 $3,789 $22,930 $21,183 $65,096 $46,712 $74,793 $569 $6,470 $15,693 $34,781 $15,963 $7,152 $13,621 $35,791

Charlotte County | Transportation Impact Fee Study
Tindale‐Oliver & Associates, Inc. Charlotte County September 2013 20 Transportation Impact Fee Study
Transportation Impact Fee Benefit Districts As part of the update of the transportation impact fee program, the existing impact fee
benefit districts (zones), illustrated in Map 1, were reviewed. To charge impact fees, the
County must meet one of the dual rational nexus tests of proof of benefit to fee‐paying
developments by ensuring that funds collected are spent on eligible capital improvement
projects. Establishing benefit districts enhances this proof, showing a close connection to
the fee‐payer and their resulting benefit, by restricting revenues to specific areas of the
County where the fee is collected. Benefit district boundaries are typically influenced by
geographic (i.e., lakes and rivers) or man‐made boundaries/barriers (i.e., roads, highways,
municipal limits) which in some way restrict traffic.
District Boundaries
Currently, Charlotte County has three transportation impact fee benefit districts (West, Mid,
and South) and an interdistrict fund. Revenues collected in each district are placed into
separate funds and can only be used to fund improvements within the corresponding
benefit district. For example, transportation impact fee revenues collected in the West
District are placed into an individual account and are only eligible to fund roadway capacity
improvements within the West District. This restriction, however, does not apply to the
interdistrict fund. Based on County policy, a portion of all impact fee collections are placed
into a separate interdistrict roadway funding account. The funds are available for
interdistrict roadways or roadways that would serve to enhance interdistrict transportation,
such as the Edgewater Corridor, Veterans Blvd, US 41, and SR 776. These interdistrict funds
may be expended in any of the three primary impact fee districts and on any bridge and the
approaches thereto. Also, any water‐oriented recreational facility located on a river may be
treated as benefiting from both sides of such river and may be funded from development
on either side of the river or both1.
1 Charlotte County Code of Ordinances, Section 3‐3.5‐9 (b)(2)

Charlotte County | Transportation Impact Fee Study
Tindale‐Oliver & Associates, Inc. Charlotte County September 2013 21 Transportation Impact Fee Study
Benefits Districts Recommendations
In regard to the geographic boundaries of the districts, no changes are recommended to the
existing districts. As shown in Table 8, all three benefit districts are generating significant
revenues, which in turn are generating a relatively equal amount of interdistrict revenues.
Additionally, the three benefit districts have clear geographic boundaries in the Myakka
River and the Peace River. Given the physical separation, of these districts, it is clear that
they are set up to, and assist in, the proof of benefit. Finally, discussions with County staff
indicated that there have been no issues with the geographic boundaries as they are
currently defined.
Table 8 Transportation Impact Fee Revenues by Benefit District
Source: Charlotte County Community Development Department
Year West Mid South Interdistrict Total Note
FY 1998 $840,536 $333,180 $402,600 $457,850 $2,034,166 ‐
FY 1999 $680,130 $385,560 $239,590 $400,530 $1,705,810 ‐
FY 2000 $562,300 $775,580 $410,490 $517,550 $2,265,920 ‐
FY 2001 $792,600 $838,380 $613,010 $673,770 $2,917,760 ‐
FY 2002 $847,360 $828,520 $445,470 $650,680 $2,772,030 ‐
FY 2003 $954,100 $1,189,940 $434,110 $782,690 $3,360,840 ‐
FY 2004 $1,347,050 $1,277,980 $514,880 $957,680 $4,097,590 ‐
FY 2005 $1,164,680 $1,782,510 $614,370 $962,050 $4,523,610 ‐
FY 2006 $1,995,520 $3,639,730 $2,064,000 $2,298,580 $9,997,830 ‐
FY 2007 $2,331,710 $2,760,500 $1,589,530 $1,995,890 $8,677,630 ‐
FY 2008 $1,643,190 $1,542,640 $2,065,460 $1,568,600 $6,819,890 ‐
FY 2009 $425,720 $509,070 $241,390 $351,350 $1,527,530 ‐
FY 2010 $425,720 $509,070 $298,000 $351,350 $1,584,140 Estimate
FY 2011 $425,720 $509,070 $298,000 $351,350 $1,584,140 Budget
% of Total 26.8% 31.3% 19.0% 22.9% ‐ ‐

Charlotte County | Transportation Impact Fee Study
Tindale‐Oliver & Associates, Inc. Charlotte County September 2013 22 Transportation Impact Fee Study
Map 1 – Charlotte County Transportation Impact Fee Benefit Districts

Charlotte County | Transportation Impact Fee Study
Appendix A Demand Component Calculations

Charlotte County | Transportation Impact Fee Study
Tindale‐Oliver & Associates, Inc. Charlotte County September 2013 A‐1 Transportation Impact Fee Study
Demand Component
This appendix presents the detailed calculations for the demand component of the
transportation impact fee update.
Interstate and Toll Facility Discount Factor
Table A‐1 presents the interstate and toll facility discount factor used in the calculation of
the transportation impact fee. As previously discussed in the body of the report, interstate
and toll facilities are excluded from the impact fee calculation due to the fact that impact
fees are not typically spent on interstate/toll roads, and instead, these roads are built with
large and lumpy State and Federal investment. This variable is based on data from the SMC
regional travel demand model, specifically the 2035 projected vehicle miles of travel,
accounting for roadway improvements included in the 2035 Long Range Transportation
Plan. It should be noted that discount factor excludes external‐to‐external trips, which
represent traffic that goes through Charlotte County, but does not necessarily stop in the
county. This traffic is excluded from the calculations since it does not come from a
development within the county. The I/T discount factor is used to reduce the VMT that the
impact fee charges for each land use.
Table A‐1 Interstate/Toll Facility Discount Factor
Source: SMC Regional Travel Demand Model
Florida Studies Trip Characteristics Database
The Florida Studies Trip Characteristics Database includes over 200 studies on 40 different
residential and non‐residential land uses collected over the last 20 years. Data from these
studies include trip generation, trip length, and percent new trips for each land use. This
information has been used in the development of impact fees and the creation of land use plan
RoadwayVMT
(2035)% VMT
I‐75/Gasparilla Island Bridge 1,002,236 15.6%
Other Roads 5,420,456 84.4%
Total (All Roads) 6,422,692 100.0%
Total (Interstate/Toll Roads) 1,002,236 15.6%
Charlotte County | Transportation Impact Fee Study
Tindale‐Oliver & Associates, Inc. Charlotte County September 2013 A‐2 Transportation Impact Fee Study
category trip characteristics for communities throughout Florida and the U.S. In addition, local
studies conducted in Charlotte County are incorporated in the calculation of trip generation rate.
TOA estimates trip generation rates for all land uses in a transportation impact fee schedule
using data from studies in the Florida Studies Database and the Institute of Transportation
Engineers’ (ITE) Trip Generation reference report (9th edition). In instances, when both ITE Trip
Generation reference report (9th edition) and Florida Studies trip generation rate (TGR) data are
available for a particular land use, the data is typically blended together to increase the sample
size and provide a more valid estimate of the average number of trips generated per unit of
development. If no Florida Studies data is available, only TGR data from the ITE reference report
is used in the fee calculation.
The trip generation rate for each respective land use is calculated using machine counts that
record daily traffic into and out of the site studied. The traffic count hoses are set at entrances to
residential subdivisions for the residential land uses and at all access points for non‐residential
land uses.
The trip length information is obtained through origin‐destination surveys that ask respondents
where they came from prior to arriving at the site and where they intended to go after leaving
the site. The results of these surveys were used to estimate average trip length by land use.
The percent new trip variable is based on assigning each trip collected through the origin‐
destination survey process a trip type (primary, secondary, diverted, and captured). The percent
new trip variable is then calculated as 1 minus the percentage of trips that are captured. TOA
has published an article entitled, Measuring Travel Characteristics for Transportation Impact
Fees, ITE Journal, April 1991 on the data collecting methodology for trip characteristics studies.

Charlotte County | Transportation Impact Fee Study
Tindale‐Oliver & Associates, Inc. Charlotte County September 2013 A‐3 Transportation Impact Fee Study
Mini‐Warehouse (ITE LUC 151)
Orange Co, FL 107.0 ‐ ‐ ‐ 1.45 ‐ ‐ ‐ ‐ Orange County
Orange Co, FL 89.6 ‐ ‐ ‐ 1.23 ‐ ‐ ‐ ‐ Orange County
Orange Co, FL 84.7 ‐ ‐ ‐ 1.39 ‐ ‐ ‐ ‐ Orange County
Orange Co, FL 93.0 ‐ ‐ ‐ 1.51 ‐ ‐ ‐ ‐ Orange County
Orange Co, FL 77.0 ‐ ‐ ‐ 2.18 ‐ ‐ ‐ ‐ Orange County
Total Size 451.3 5 Average Trip Length: n/a
ITE 784.0 14 Weighted Average Trip Length: n/a
Blended total 1,235.3 Weighted Percent New Trip Average: ‐
Weighted Average Trip Generation Rate: 1.53
ITE Average Trip Generation Rate: 2.50
Blend of FL Studies and ITE Average Trip Generation Rate: 2.15
Trip Gen Rate Time Period Trip LengthPercent New
TripsVMT SourceLocation Size (1,000 sf) Date
Total #
Interviews
# Trip Length
Interviews
Single‐Family Detached Housing (ITE LUC 210)
Gwinnett Co, GA ‐ 12/13‐18/92 ‐ ‐ 5.80 ‐ 5.40 N/A 31.32 Street Smarts
Gwinnett Co, GA ‐ 12/13‐18/92 ‐ ‐ 5.40 ‐ 6.10 N/A 32.94 Street Smarts
Sarasota Co, FL 76 Jun‐93 70 70 10.03 ‐ 6.00 N/A 60.18 Sarasota County
Sarasota Co, FL 79 Jun‐93 86 86 9.77 ‐ 4.40 N/A 42.99 Sarasota County
Sarasota Co, FL 135 Jun‐93 75 75 8.05 ‐ 5.90 N/A 47.50 Sarasota County
Sarasota Co, FL 152 Jun‐93 63 63 8.55 ‐ 7.30 N/A 62.42 Sarasota County
Sarasota Co, FL 193 Jun‐93 123 123 6.85 ‐ 4.60 N/A 31.51 Sarasota County
Sarasota Co, FL 97 Jun‐93 33 33 13.20 ‐ 3.00 N/A 39.60 Sarasota County
Sarasota Co, FL 282 Jun‐93 146 146 6.61 ‐ 8.40 N/A 55.52 Sarasota County
Sarasota Co, FL 393 Jun‐93 207 207 7.76 ‐ 5.40 N/A 41.90 Sarasota County
Hernando Co, FL 76 May‐96 148 148 10.01 9a‐6p 4.85 N/A 48.55 Tindale‐Oliver & Associates
Hernando Co, FL 128 May‐96 205 205 8.17 9a‐6p 6.03 N/A 49.27 Tindale‐Oliver & Associates
Hernando Co, FL 232 May‐96 182 182 7.24 9a‐6p 5.04 N/A 36.49 Tindale‐Oliver & Associates
Hernando Co, FL 301 May‐96 264 264 8.93 9a‐6p 3.28 N/A 29.29 Tindale‐Oliver & Associates
Charlotte Co, FL 135 Oct‐97 230 ‐ 5.30 9a‐5p 7.90 N/A 41.87 Tindale‐Oliver & Associates
Charlotte Co, FL 142 Oct‐97 245 ‐ 5.20 9a‐5p 4.10 N/A 21.32 Tindale‐Oliver & Associates
Charlotte Co, FL 150 Oct‐97 160 ‐ 5.00 9a‐5p 10.80 N/A 54.00 Tindale‐Oliver & Associates
Charlotte Co, FL 215 Oct‐97 158 ‐ 7.60 9a‐5p 4.60 N/A 34.96 Tindale‐Oliver & Associates
Charlotte Co, FL 257 Oct‐97 225 ‐ 7.60 9a‐5p 7.40 N/A 56.24 Tindale‐Oliver & Associates
Charlotte Co, FL 345 Oct‐97 161 ‐ 7.00 9a‐5p 6.60 N/A 46.20 Tindale‐Oliver & Associates
Charlotte Co, FL 368 Oct‐97 152 ‐ 6.60 9a‐5p 5.70 N/A 37.62 Tindale‐Oliver & Associates
Charlotte Co, FL 383 Oct‐97 516 ‐ 8.40 9a‐5p 5.00 N/A 42.00 Tindale‐Oliver & Associates
Charlotte Co, FL 441 Oct‐97 195 ‐ 8.20 9a‐5p 4.70 N/A 38.54 Tindale‐Oliver & Associates
Charlotte Co, FL 1,169 Oct‐97 348 ‐ 6.10 9a‐5p 8.00 N/A 48.80 Tindale‐Oliver & Associates
Collier Co, FL 90 Dec‐99 91 ‐ 12.80 8a‐6p 11.40 N/A 145.92 Tindale‐Oliver & Associates
Collier Co, FL 400 Dec‐99 389 ‐ 7.80 8a‐6p 6.40 N/A 49.92 Tindale‐Oliver & Associates
Lake Co, FL 49 Apr‐02 170 ‐ 6.70 7a‐6p 10.20 N/A 68.34 Tindale‐Oliver & Associates
Lake Co, FL 52 Apr‐02 212 ‐ 10.00 7a‐6p 7.60 N/A 76.00 Tindale‐Oliver & Associates
Lake Co, FL 126 Apr‐02 217 ‐ 8.50 7a‐6p 8.30 N/A 70.55 Tindale‐Oliver & Associates
Pasco Co, FL 55 Apr‐02 133 ‐ 6.80 8a‐6p 8.12 N/A 55.22 Tindale‐Oliver & Associates
Pasco Co, FL 60 Apr‐02 106 ‐ 7.73 8a‐6p 8.75 N/A 67.64 Tindale‐Oliver & Associates
Pasco Co, FL 70 Apr‐02 188 ‐ 7.80 8a‐6p 6.03 N/A 47.03 Tindale‐Oliver & Associates
Pasco Co, FL 74 Apr‐02 188 ‐ 8.18 8a‐6p 5.95 N/A 48.67 Tindale‐Oliver & Associates
Pasco Co, FL 189 Apr‐02 261 ‐ 7.46 8a‐6p 8.99 N/A 67.07 Tindale‐Oliver & Associates
Marion Co, FL 102 Apr‐02 167 ‐ 8.02 7a‐6p 5.10 N/A 40.90 Kimley‐Horn & Associates
Marion Co, FL 105 Apr‐02 169 ‐ 7.23 7a‐6p 7.22 N/A 52.20 Kimley‐Horn & Associates
Marion Co, FL 124 Apr‐02 170 ‐ 6.04 7a‐6p 7.29 N/A 44.03 Kimley‐Horn & Associates
Marion Co, FL 132 Apr‐02 171 ‐ 7.87 7a‐6p 7.00 N/A 55.09 Kimley‐Horn & Associates
Marion Co, FL 133 Apr‐02 209 ‐ 8.04 7a‐6p 4.92 N/A 39.56 Kimley‐Horn & Associates
Citrus Co, FL 111 Oct‐03 273 ‐ 8.66 7a‐6p 7.70 N/A 66.68 Tindale‐Oliver & Associates
Citrus Co, FL 231 Oct‐03 155 ‐ 5.71 7a‐6p 4.82 N/A 27.52 Tindale‐Oliver & Associates
Citrus Co, FL 306 Oct‐03 146 ‐ 8.40 7a‐6p 3.94 N/A 33.10 Tindale‐Oliver & Associates
Citrus Co, FL 364 Oct‐03 345 ‐ 7.20 7a‐6p 9.14 N/A 65.81 Tindale‐Oliver & Associates
Citrus Co, FL 374 Oct‐03 248 ‐ 12.30 7a‐6p 6.88 N/A 84.62 Tindale‐Oliver & Associates
Lake Co, FL 42 Dec‐06 122 ‐ 11.26 ‐ 5.56 N/A 62.61 Tindale‐Oliver & Associates
Lake Co, FL 51 Dec‐06 346 ‐ 18.22 ‐ 9.46 N/A 172.36 Tindale‐Oliver & Associates
Lake Co, FL 59 Dec‐06 144 ‐ 12.07 ‐ 10.79 N/A 130.24 Tindale‐Oliver & Associates
Lake Co, FL 90 Dec‐06 194 ‐ 9.12 ‐ 5.78 N/A 52.71 Tindale‐Oliver & Associates
Lake Co, FL 239 Dec‐06 385 ‐ 7.58 ‐ 8.93 N/A 67.69 Tindale‐Oliver & Associates
Hernando Co, FL 232 Apr‐07 516 ‐ 8.02 7a‐6p 8.16 N/A 65.44 Tindale‐Oliver & Associates
Hernando Co, FL 95 Apr‐07 256 ‐ 8.08 7a‐6p 5.88 N/A 47.51 Tindale‐Oliver & Associates
Hernando Co, FL 90 Apr‐07 338 ‐ 7.13 7a‐6p 5.86 N/A 41.78 Tindale‐Oliver & Associates
Hernando Co, FL 58 Apr‐07 153 ‐ 6.16 7a‐6p 8.39 N/A 51.68 Tindale‐Oliver & Associates
Collier Co, FL 74 Mar‐08 503 ‐ 12.81 7a‐6p 3.05 N/A 39.07 Tindale‐Oliver & Associates
Collier Co, FL 97 Mar‐08 512 ‐ 8.78 7a‐6p 11.29 N/A 99.13 Tindale‐Oliver & Associates
Collier Co, FL 315 Mar‐08 1,347 ‐ 6.97 7a‐6p 6.55 N/A 45.65 Tindale‐Oliver & Associates
Collier Co, FL 42 Mar‐08 314 ‐ 9.55 7a‐6p 10.98 N/A 104.86 Tindale‐Oliver & Associates
Total Size 10,380 55 13,130 Average Trip Length: 6.79
Weighted Average Trip Length: 6.62
Note: Georgia studies are not included in summary statistics. Weighted Average Trip Generation Rate: 7.81
Percent New
TripsDate
Total #
Interviews
# Trip Length
InterviewsTrip Gen Rate Time Period Trip LengthLocation Size / Units VMT Source

Charlotte County | Transportation Impact Fee Study
Tindale‐Oliver & Associates, Inc. Charlotte County September 2013 A‐4 Transportation Impact Fee Study
Multi‐Family/Apartment and Residential Condo/Townhouse (ITE LUC 220/230)
Sarasota Co, FL 212 Jun‐93 42 42 5.78 ‐ 5.20 N/A 30.06 Sarasota County
Sarasota Co, FL 243 Jun‐93 36 36 5.84 ‐ ‐ N/A ‐ Sarasota County
Marion Co, FL 214 Apr‐02 175 175 6.84 ‐ 4.61 N/A 31.53 Kimley‐Horn & Associates
Marion Co, FL 240 Apr‐02 174 174 6.96 ‐ 3.43 N/A 23.87 Kimley‐Horn & Associates
Marion Co, FL 288 Apr‐02 175 175 5.66 ‐ 5.55 N/A 31.41 Kimley‐Horn & Associates
Marion Co, FL 480 Apr‐02 175 175 5.73 ‐ 6.88 N/A 39.42 Kimley‐Horn & Associates
Marion Co, FL 500 Apr‐02 170 170 5.46 ‐ 5.94 N/A 32.43 Kimley‐Horn & Associates
Lake Co, FL 250 Dec‐06 135 135 6.71 ‐ 5.33 N/A 35.76 Tindale‐Oliver & Associates
Lake Co, FL 157 Dec‐06 265 265 13.97 ‐ 2.62 N/A 36.60 Tindale‐Oliver & Associates
Lake Co, FL 169 Dec‐06 212 ‐ 8.09 ‐ 6.00 N/A 48.54 Tindale‐Oliver & Associates
Lake Co, FL 226 Dec‐06 301 ‐ 6.74 ‐ 2.17 N/A 14.63 Tindale‐Oliver & Associates
Hernando Co, FL 312 Apr‐07 456 ‐ 4.09 ‐ 5.95 N/A 24.34 Tindale‐Oliver & Associates
Hernando Co, FL 176 Apr‐07 332 ‐ 5.38 ‐ 5.24 N/A 28.19 Tindale‐Oliver & Associates
Hernando Co, FL 31 May‐96 31 31 6.12 9a‐6p 4.98 N/A 30.48 Tindale‐Oliver & Associates
Hernando Co, FL 128 May‐96 128 128 6.47 9a‐6p 5.18 N/A 33.51 Tindale‐Oliver & Associates
Pasco Co, FL 229 Apr‐02 198 198 4.77 9a‐6p ‐ N/A ‐ Tindale‐Oliver & Associates
Pasco Co, FL 248 Apr‐02 353 353 4.24 9a‐6p 3.53 N/A 14.97 Tindale‐Oliver & Associates
Total Size 4,103 Average Trip Length: 4.84
Total Size (TL) 3,631 Weighted Average Trip Length: 5.10
LUC 220: Multi‐Family
Total Size 3,467 13 Weighted Average Trip Generation Rate: 6.31
ITE 18,480 88 ITE Average Trip Generation Rate: 6.65
Blended total 21,947 Blend of FL Studies and ITE Average Trip Generation Rate: 6.60
LUC 230: Condo/Townhouse
Total Size 636 4 Weighted Average Trip Generation Rate: 4.97
ITE 10,024 56 ITE Average Trip Generation Rate: 5.81
Blended total 10,660 Blend of FL Studies and ITE Average Trip Generation Rate: 5.76
VMT Source
LUC 230 Studies are highlighted
Location Size / Units DateTotal #
Interviews
# Trip Length
InterviewsTrip Gen Rate Time Period Trip Length
Percent New
Trips
Mobile Home Park (ITE LUC 240)
Marion Co, FL 67 Jul‐91 22 22 5.40 48hrs. 2.29 N/A 12.37 Tindale‐Oliver & Associates
Marion Co, FL 82 Jul‐91 58 58 10.80 24hr. 3.72 N/A 40.18 Tindale‐Oliver & Associates
Marion Co, FL 137 Jul‐91 22 22 3.10 24hr. 4.88 N/A 15.13 Tindale‐Oliver & Associates
Marion Co, FL 188 Apr‐02 147 ‐ 3.51 24hr. 5.48 N/A 19.23 Kimley‐Horn & Associates
Marion Co, FL 227 Apr‐02 173 ‐ 2.76 24hr. 8.80 N/A 24.29 Kimley‐Horn & Associates
Sarasota Co, FL 235 Jun‐93 100 100 3.51 ‐ 5.10 N/A 17.90 Sarasota County
Marion Co, FL 297 Apr‐02 175 ‐ 4.78 24hr. 4.76 N/A 22.75 Kimley‐Horn & Associates
Sarasota Co, FL 996 Jun‐93 181 181 4.19 ‐ 4.40 N/A 18.44 Sarasota County
Hernando Co, FL 1,892 May‐96 425 425 4.13 9a‐6p 4.13 N/A 17.06 Tindale‐Oliver & Associates
Total Size 4,121 9 1,303 Average Trip Length: 4.84
Weighted Average Trip Length: 4.60
Weighted Average Trip Generation Rate: 4.17
Trip Gen Rate Time Period Trip LengthPercent New
TripsVMT SourceLocation Size / Units Date
Total #
Interviews
# Trip Length
Interviews
Congregate Care Facility ( ITE LUC 253)
Pinellas Park, FL 72 Aug‐89 25 19 3.50 9am‐5pm 2.20 79.0 7.70 Tindale‐Oliver & Associates
Palm Harbor, FL 200 Oct‐89 58 40 ‐ 9am‐5pm 3.40 69.0 ‐ Tindale‐Oliver & Associates
Total Size 272 2 83 Average Trip Length: 2.80
ITE 388 2 Weighted Average Trip Length: 3.08
Blended total 660 Weighted Percent New Trip Average: 71.6
460 Weighted Average Trip Generation Rate: 3.50
ITE Average Trip Generation Rate: 2.02
Blend of FL Studies and ITE Average Trip Generation Rate: 2.25
Percent New
TripsDate
Total #
Interviews
# Trip Length
InterviewsTrip Gen Rate Time Period Trip LengthLocation Size / Units VMT Source

Charlotte County | Transportation Impact Fee Study
Tindale‐Oliver & Associates, Inc. Charlotte County September 2013 A‐5 Transportation Impact Fee Study
Hotel (ITE LUC 310)
Pinellas Co, FL 174 Aug‐89 134 106 12.50 7‐11a/3‐7p 6.30 79.0 62.21 Tindale‐Oliver & Associates
Pinellas Co, FL 114 Oct‐89 30 14 7.30 12‐7p 6.20 47.0 21.27 Tindale‐Oliver & Associates
Orange Co, FL 70 ‐ ‐ ‐ 1.85 ‐ ‐ ‐ ‐ Orange County
Orange Co, FL 211 ‐ ‐ ‐ 2.23 ‐ ‐ ‐ ‐ Orange County
Orange Co, FL 112 ‐ ‐ ‐ 2.78 ‐ ‐ ‐ ‐ Orange County
Orange Co, FL 1,495 ‐ ‐ ‐ 3.50 ‐ ‐ ‐ ‐ Orange County
Orange Co, FL 123 ‐ ‐ ‐ 3.70 ‐ ‐ ‐ ‐ Orange County
Orange Co, FL 130 ‐ ‐ ‐ 4.29 ‐ ‐ ‐ ‐ Orange County
Orange Co, FL 1,499 ‐ ‐ ‐ 4.69 ‐ ‐ ‐ ‐ Orange County
Orange Co, FL 190 ‐ ‐ ‐ 4.71 ‐ ‐ ‐ ‐ Orange County
Orange Co, FL 123 ‐ ‐ ‐ 4.81 ‐ ‐ ‐ ‐ Orange County
Orange Co, FL 105 ‐ ‐ ‐ 5.25 ‐ ‐ ‐ ‐ Orange County
Orange Co, FL 120 ‐ ‐ ‐ 5.27 ‐ ‐ ‐ ‐ Orange County
Orange Co, FL 1,584 ‐ ‐ ‐ 5.88 ‐ ‐ ‐ ‐ Orange County
Orange Co, FL 128 ‐ ‐ ‐ 6.10 ‐ ‐ ‐ ‐ Orange County
Orange Co, FL 174 ‐ ‐ ‐ 7.03 ‐ ‐ ‐ ‐ Orange County
Orange Co, FL 144 ‐ ‐ ‐ 7.32 ‐ ‐ ‐ ‐ Orange County
Orange Co, FL 98 ‐ ‐ ‐ 7.32 ‐ ‐ ‐ ‐ Orange County
Orange Co, FL 106 ‐ ‐ ‐ 7.34 ‐ ‐ ‐ ‐ Orange County
Orange Co, FL 100 ‐ ‐ ‐ 7.37 ‐ ‐ ‐ ‐ Orange County
Orange Co, FL 144 ‐ ‐ ‐ 7.66 ‐ ‐ ‐ ‐ Orange County
Total Size 6,944 21 164 Average Trip Length: 6.25
ITE 4,760 10 Weighted Average Trip Length: 6.26
Blended total 11,704 Weighted Percent New Trip Average: 66.3
Weighted Average Trip Generation Rate: 5.12
ITE Average Trip Generation Rate: 8.17
Blend of FL Studies and ITE Average Trip Generation Rate: 6.36
Percent New
TripsDate
Total #
Interviews
# Trip Length
InterviewsTrip Gen Rate Time Period Trip LengthLocation Size (Rooms) VMT Source
Motel (ITE LUC 320)
Pinellas Co, FL 48 Oct‐89 46 24 ‐ 10a‐2p 2.80 65.0 ‐ Tindale‐Oliver & Associates
Pinellas Co, FL 54 Oct‐89 32 22 ‐ 12p‐7p 3.80 69.0 ‐ Tindale‐Oliver & Associates
Pinellas Co, FL 120 Oct‐89 26 22 ‐ 2p‐7p 5.20 84.6 ‐ Tindale‐Oliver & Associates
Total Size 222 3 104 Average Trip Length: 3.93
ITE 2,160 10 Weighted Average Trip Length: 4.34
Weighted Percent New Trip Average: 76.6
ITE Average Trip Generation Rate: 5.63
Trip Gen Rate Time Period Trip LengthPercent New
TripsVMT SourceLocation Size (Rooms) Date
Total #
Interviews
# Trip Length
Interviews
Movie Theater with Matinee (ITE LUC 444)
Pinellas Co, FL 8 Oct‐89 151 116 113.10 2p‐8p 2.70 77.0 235.13 Tindale‐Oliver & Associates
Pinellas Co, FL 12 Sep‐89 122 116 63.40 2p‐8p 1.90 95.0 114.44 Tindale‐Oliver & Associates
Total Size 20 273 Average Trip Length: 2.30
ITE 10 estimated Weighted Average Trip Length: 2.22
30 Weighted Percent New Trip Average: 87.8
Weighted Average Trip Generation Rate: 83.28
ITE Average Trip Generation Rate (6th): 153.33
Blend of FL Studies and ITE Average Trip Generation Rate: 106.63
Trip Gen Rate Time Period Trip LengthPercent New
TripsVMT SourceLocation Size (Screens) Date
Total #
Interviews
# Trip Length
Interviews
Health Club (ITE LUC 492)
Tampa, FL ‐ Mar‐86 33 31 ‐ ‐ 7.90 94.0 ‐ Kimley‐Horn & Associates
Total Size 33 Average Trip Length: n/a
ITE 15 1 Percent New Trip Average: 94.0
ITE Average Trip Generation Rate: 32.93
Percent New
TripsDate
Total #
Interviews
# Trip Length
InterviewsTrip Gen Rate Time Period Trip LengthLocation Size (1,000 sf) VMT Source
Day Care Center (ITE LUC 565)
Pinellas Co, FL 5.6 Aug‐89 94 66 66.99 7a‐6p 1.90 70.0 89.10 Tindale‐Oliver & Associates
Pinellas Co, FL 10.0 Sep‐89 179 134 66.99 7a‐6p 2.10 75.0 105.51 Tindale‐Oliver & Associates
Tampa, FL ‐ Mar‐86 28 25 ‐ ‐ 2.60 89.0 ‐ Kimley‐Horn & Associates
Total Size 15.6 2 301 Average Trip Length: 2.20
ITE 35.0 7 Weighted Average Trip Length: 2.03
Blended total 50.6 Weighted Percent New Trip Average: 73.2
Weighted Average Trip Generation Rate: 66.99
ITE Average Trip Generation Rate: 74.06
Blend of FL Studies and ITE Average Trip Generation Rate: 71.88
Trip Gen Rate Time Period Trip LengthPercent New
TripsVMT SourceLocation Size (1,000 sf) Date
Total #
Interviews
# Trip Length
Interviews

Charlotte County | Transportation Impact Fee Study
Tindale‐Oliver & Associates, Inc. Charlotte County September 2013 A‐6 Transportation Impact Fee Study
Nursing Home (ITE LUC 620)
Lakeland, FL 120 Mar‐90 74 66 2.86 11a‐4p 2.59 89.0 6.59 Tindale‐Oliver & Associates
Total Size 120 1 74 Average Trip Length: 2.59
ITE 714 6 Weighted Average Trip Length: 2.59
Blended total 834 Weighted Percent New Trip Average: 89.0
Weighted Average Trip Generation Rate: 2.86
ITE Average Trip Generation Rate: 2.74
Blend of FL Studies and ITE Average Trip Generation Rate: 2.76
Trip Gen Rate Time Period Trip LengthPercent New
TripsVMT SourceLocation Size (Beds) Date
Total #
Interviews
# Trip Length
Interviews
General Office Building (ITE LUC 710)
Sarasota Co, FL 14.3 Jun‐93 14 14 46.85 ‐ 11.30 ‐ 529.41 Sarasota County
Gwinnett Co, GA 98.0 Dec‐92 ‐ ‐ 4.30 ‐ 5.40 ‐ ‐ Street Smarts
Gwinnett Co, GA 180.0 Dec‐92 ‐ ‐ 3.60 ‐ 5.90 ‐ ‐ Street Smarts
Pinellas Co, FL 187.0 Oct‐89 431 388 18.49 7a‐5p 6.30 90.0 104.84 Tindale‐Oliver & Associates
St. Petersburg, FL 262.8 Sep‐89 291 274 ‐ 7a‐5p 3.40 94.0 ‐ Tindale‐Oliver & Associates
Total Size 742.1 5 736 Average Trip Length: 6.46
ITE 15,522.0 78 Weighted Average Trip Length: 5.15
Weighted Percent New Trip Average: 92.3
Trip Gen Rate Time Period Trip LengthPercent New
TripsVMT SourceLocation Size (1,000 sf) Date
Total #
Interviews
# Trip Length
Interviews
IN OUT IN OUT IN OUT IN OUT IN OUT IN OUT TOTAL
Site 1 2.100 35 35 22 22 13 13 70 70 23.33 23.33 11.11 11.11 22.22
Site 2 3.000 40 40 52 52 53 53 145 145 48.33 48.33 16.11 16.11 32.22
Site 3 2.000 28 28 19 21 24 26 71 75 23.67 25.00 11.84 12.50 24.34
Site 4 1.000 30 30 52 52 57 57 139 139 46.33 46.33 46.33 46.33 92.66
Site 5 3.024 31 32 43 43 24 24 98 99 32.67 33.00 10.80 10.91 21.71
Site 6 1.860 22 24 19 17 11 11 52 52 17.33 17.33 9.32 9.32 18.64
Average 17.59 17.71 35.30
Average (excluding Site 4) 11.84 11.99 23.83
AVERAGE AVERAGE (per 1,000 sf)
Medical‐Dental Office Building (ITE LUC 720): 10,000 sf or Less
Site Size (1,000 sf)Tues., Jan 11 Wedn., Jan 12 Thur., Jan 13 TOTAL
Medical‐Dental Office Building (ITE LUC 720)
Charlotte Co, FL 11.0 Oct‐97 ‐ 186 49.50 9a‐5p 4.60 92.1 209.67 Tindale‐Oliver & Associates
Charlotte Co, FL 28.0 Oct‐97 ‐ 186 31.00 9a‐5p 3.60 81.6 91.04 Tindale‐Oliver & Associates
Charlotte Co, FL 30.4 Oct‐97 ‐ 324 39.80 9a‐5p 3.30 83.5 109.68 Tindale‐Oliver & Associates
Total Size 69.4 11 0 Average Trip Length: 3.83
ITE 450.0 10 Weighted Average Trip Length: 3.63
Blended total 519.4 Weighted Percent New Trip Average: 84.1
Average Trip Generation Rate: 37.79
ITE Average Trip Generation Rate: 36.13
Blend of FL Studies and ITE Average Trip Generation Rate: 36.35
Time Period Trip LengthPercent New
TripsVMT SourceLocation Size (1,000 sf) Date
Total #
Interviews
# Trip Length
InterviewsTrip Gen Rate

Charlotte County | Transportation Impact Fee Study
Tindale‐Oliver & Associates, Inc. Charlotte County September 2013 A‐7 Transportation Impact Fee Study
Figure A‐1 Shopping Center (LUC 820) – Florida Curve Trip Length Regression
Source: Regression analysis based on FL Studies data for LUC 820
Shopping Center (ITE LUC 820)
Tampa, FL ‐ Mar‐86 527 348 ‐ ‐ ‐ 66.0 ‐ Kimley‐Horn & Associates
Tampa, FL ‐ Mar‐86 170 ‐ ‐ ‐ 1.70 ‐ ‐ Kimley‐Horn & Associates
Tampa, FL ‐ Mar‐86 354 269 ‐ ‐ ‐ 76.0 ‐ Kimley‐Horn & Associates
Tampa, FL ‐ Mar‐86 144 ‐ ‐ ‐ 2.50 ‐ ‐ Kimley‐Horn & Associates
St. Petersburg, FL 1,192.0 Aug‐89 384 298 ‐ 11a‐7p 3.60 78.0 ‐ Tindale‐Oliver & Associates
St. Petersburg, FL 132.3 Sep‐89 400 368 77.00 10a‐7p 1.80 92.0 127.51 Tindale‐Oliver & Associates
Largo, FL 425.0 Aug‐89 160 120 26.73 10a‐6p 2.30 75.0 46.11 Tindale‐Oliver & Associates
Dunedin, FL 80.5 Sep‐89 276 210 81.48 9a‐5p 1.40 76.0 86.69 Tindale‐Oliver & Associates
Pinellas Park, FL 696.0 Sep‐89 485 388 ‐ 9a‐6p 3.20 80.0 ‐ Tindale‐Oliver & Associates
Seminole, FL 425.0 Oct‐89 674 586 ‐ ‐ ‐ 87.0 ‐ Tindale‐Oliver & Associates
Hillsborough Co, FL 134.0 Jul‐91 ‐ ‐ ‐ ‐ 1.30 74.0 ‐ Tindale‐Oliver & Associates
Hillsborough Co, FL 151.0 Jul‐91 ‐ ‐ ‐ ‐ 1.30 73.0 ‐ Tindale‐Oliver & Associates
Collier Co, FL ‐ Aug‐91 68 64 ‐ ‐ 3.33 94.1 ‐ Tindale‐Oliver & Associates
Collier Co, FL ‐ Aug‐91 208 154 ‐ ‐ 2.64 74.0 ‐ Tindale‐Oliver & Associates
Sarasota/Bradenton, FL 109.0 Sep‐92 300 185 ‐ 12a‐6p ‐ 61.6 ‐ King Engineering Associates, Inc.
Ocala, FL 133.4 Sep‐92 300 192 ‐ 12a‐6p ‐ 64.0 ‐ King Engineering Associates, Inc.
Gwinnett Co, GA 99.1 Dec‐92 ‐ ‐ 46.00 ‐ 3.20 70.0 103.04 Street Smarts
Gwinnett Co, GA 314.7 Dec‐92 ‐ ‐ 27.00 ‐ 8.50 84.0 192.78 Street Smarts
Sarasota Co, FL 110.0 Jun‐93 58 58 122.14 ‐ 3.20 ‐ ‐ Sarasota County
Sarasota Co, FL 146.1 Jun‐93 65 65 51.53 ‐ 2.80 ‐ ‐ Sarasota County
Sarasota Co, FL 157.5 Jun‐93 57 57 79.79 ‐ 3.40 ‐ ‐ Sarasota County
Sarasota Co, FL 191.0 Jun‐93 62 62 66.79 ‐ 5.90 ‐ ‐ Sarasota County
Hernando Co, FL 107.8 May‐96 608 331 77.60 9a‐6p 4.68 54.5 197.85 Tindale‐Oliver & Associates
Charlotte Co, FL 88.0 Oct‐97 ‐ ‐ 73.50 9a‐5p 1.80 57.1 75.56 Tindale‐Oliver & Associates
Charlotte Co, FL 191.9 Oct‐97 ‐ ‐ 72.00 9a‐5p 2.40 50.9 87.97 Tindale‐Oliver & Associates
Charlotte Co, FL 51.3 Oct‐97 ‐ ‐ 43.00 9a‐5p 2.70 51.8 60.08 Tindale‐Oliver & Associates
Lake Co, FL 67.8 Apr‐01 246 177 102.60 ‐ 3.40 71.2 248.37 Tindale‐Oliver & Associates
Lake Co, FL 72.3 Apr‐01 444 376 65.30 ‐ 4.50 59.0 173.37 Tindale‐Oliver & Associates
Pasco Co, FL 65.6 Apr‐02 222 ‐ 145.64 9a‐5p 1.46 46.9 99.62 Tindale‐Oliver & Associates
Pasco Co, FL 75.8 Apr‐02 134 ‐ 38.23 9a‐5p 2.36 58.2 52.52 Tindale‐Oliver & Associates
Citrus Co, FL 185.0 Oct‐03 ‐ 784 55.84 8a‐6p 2.40 88.1 118.05 Tindale‐Oliver & Associates
Citrus Co, FL 91.3 Nov‐03 ‐ 390 54.50 8a‐6p 1.60 88.0 76.77 Tindale‐Oliver & Associates
Bozeman, MT 104.3 Dec‐06 359 359 46.96 ‐ 3.35 49.0 77.08 Tindale‐Oliver & Associates
Bozeman, MT 159.9 Dec‐06 502 502 56.49 ‐ 1.56 54.0 47.59 Tindale‐Oliver & Associates
Bozeman, MT 35.9 Dec‐06 329 329 69.30 ‐ 1.39 74.0 71.28 Tindale‐Oliver & Associates
Total Size 5,757.5 7,536 Average Trip Length: n/a
Weighted Average Trip Length: n/a
Trip Gen Rate Time Period Trip LengthPercent New
TripsVMT SourceLocation Size (1,000 sf) Date
Total #
Interviews
# Trip Length
Interviews
0.00
0.50
1.00
1.50
2.00
2.50
3.00
3.50
4.00
0 200 400 600 800 1000 1200 1400 1600
Trip Length (Miles)
Square Footage

Charlotte County | Transportation Impact Fee Study
Tindale‐Oliver & Associates, Inc. Charlotte County September 2013 A‐8 Transportation Impact Fee Study
Figure A‐2 Shopping Center (LUC 820) – Florida Curve Percent New Trips Regression
Source: Regression analysis based on FL Studies data for LUC 820
0%
10%
20%
30%
40%
50%
60%
70%
80%
90%
0 200 400 600 800 1000 1200 1400 1600
Percent New Trips
Square Footage
New Car Sales (ITE LUC 841)
St.Petersburg, FL 43.0 Oct‐89 152 120 ‐ 9a‐5p 4.70 79.0 ‐ Tindale‐Oliver & Associates
Clearwater, FL 43.0 Oct‐89 136 106 29.40 9a‐5p 4.50 78.0 103.19 Tindale‐Oliver & Associates
Orange Co, FL 116.7 ‐ ‐ ‐ 22.18 ‐ ‐ ‐ ‐ Orange County
Orange Co, FL 99.8 ‐ ‐ ‐ 13.45 ‐ ‐ ‐ ‐ Orange County
Orange Co, FL 39.1 ‐ ‐ ‐ 10.48 ‐ ‐ ‐ ‐ Orange County
Orange Co, FL 66.3 ‐ ‐ ‐ 28.50 ‐ ‐ ‐ ‐ Orange County
Orange Co, FL 46.7 ‐ ‐ ‐ 40.34 ‐ ‐ ‐ ‐ Orange County
Orange Co, FL 34.4 ‐ ‐ ‐ 23.45 ‐ ‐ ‐ ‐ Orange County
Orange Co, FL 13.8 ‐ ‐ ‐ 35.75 ‐ ‐ ‐ ‐ Orange County
Total Size 502.7 9 288 Average Trip Length: 4.60
ITE 570.0 15 Weighted Average Trip Length: 4.60
Blended total 1,072.7 Weighted Percent New Trip Average: 78.5
Weighted Average Trip Generation Rate: 23.22
ITE Average Trip Generation Rate: 32.30
Blend of FL Studies and ITE Average Trip Generation Rate: 27.12
Trip Gen Rate Time Period Trip LengthPercent New
TripsVMT SourceLocation Size (1,000 sf) Date
Total #
Interviews
# Trip Length
Interviews
Supermarket (ITE LUC 850)
Palm Harbor, FL 62.0 Aug‐89 163 62 106.26 9a‐4p 2.08 56.0 123.77 Tindale‐Oliver & Associates
Total Size 62.0 1 163 Average Trip Length: 2.08
ITE 156.0 4 Weighted Average Trip Length: 2.08
Blended total 218.0 Weighted Percent New Trip Average: 56.0
Weighted Average Trip Generation Rate: 106.26
ITE Average Trip Generation Rate: 102.24
Blend of FL Studies and ITE Average Trip Generation Rate: 103.38
Percent New
TripsDate
Total #
Interviews
# Trip Length
InterviewsTrip Gen Rate Time Period Trip LengthLocation Size (1,000 sf) VMT Source

Charlotte County | Transportation Impact Fee Study
Tindale‐Oliver & Associates, Inc. Charlotte County September 2013 A‐9 Transportation Impact Fee Study
Convenience Market ‐ 24hrs. (ITE LUC 851)
Tampa, FL ‐ Mar‐86 80 ‐ ‐ ‐ 1.10 ‐ ‐ Kimley‐Horn & Associates
Largo, FL 2.5 8/15,25/89 171 116 634.80 ‐ 1.20 68.0 518.00 Tindale‐Oliver & Associates
Clearwater, FL 2.5 Aug‐89 237 64 690.80 ‐ 1.60 27.0 298.43 Tindale‐Oliver & Associates
Clearwater, FL 2.1 Nov‐89 143 50 635.24 24hr. 1.60 35.0 355.73 Tindale‐Oliver & Associates
Marion Co, FL 2.5 Jun‐91 94 43 787.20 48hrs. 1.52 46.2 552.80 Tindale‐Oliver & Associates
Marion Co, FL 2.5 Jun‐91 74 20 714.00 48hrs. 0.75 27.0 144.59 Tindale‐Oliver & Associates
Collier Co, FL ‐ Aug‐91 146 36 ‐ ‐ 2.53 24.7 ‐ Tindale‐Oliver & Associates
Collier Co, FL ‐ Aug‐91 148 38 ‐ ‐ 1.08 25.7 ‐ Tindale‐Oliver & Associates
Gwinnett Co, GA 2.9 12/13‐18/92 ‐ ‐ ‐ ‐ 2.30 48.0 ‐ Street Smarts
Gwinnett Co, GA 3.2 12/13‐18/92 ‐ ‐ ‐ ‐ ‐ 37.0 ‐ Street Smarts
Total Size 18.2 7 1,093 Average Trip Length: 1.52
ITE 16.0 8 Weighted Average Trip Length: 1.52
Blended total 34.2 Weighted Percent New Trip Average: 41.3
28.1 Weighted Average Trip Generation Rate: 694.30
ITE Average Trip Generation Rate: 737.99
Blend of FL Studies and ITE Average Trip Generation Rate: 719.18
Location Size (1,000 sf) DateTotal #
Interviews
# Trip Length
InterviewsTrip Gen Rate Time Period Trip Length
Percent New
TripsVMT Source
Service Station w/Convenience Market (ITE LUC 853)
Tampa, FL ‐ Mar‐86 72 ‐ ‐ ‐ 2.00 ‐ ‐ Kimley‐Horn & Associates
Marion Co, FL 1.1 Jun‐91 77 20 544.80 24hr. 0.89 26.0 126.07 Tindale‐Oliver & Associates
Marion Co, FL 2.1 Jun‐91 66 24 997.60 24hr. 1.67 36.4 606.42 Tindale‐Oliver & Associates
Marion Co, FL 4.4 Jun‐91 85 25 486.70 48hrs. 1.06 29.4 151.68 Tindale‐Oliver & Associates
Collier Co, FL ‐ Aug‐91 96 38 ‐ ‐ 1.19 39.6 ‐ Tindale‐Oliver & Associates
Collier Co, FL ‐ Aug‐91 78 16 ‐ ‐ 1.06 20.5 ‐ Tindale‐Oliver & Associates
Tampa, FL 2.3 10/13‐15/92 239 74 ‐ 24hr. 1.06 31.1 ‐ Tindale‐Oliver & Associates
Ellenton, FL 3.3 10/20‐22/92 124 44 ‐ 24hr. 0.96 35.3 ‐ Tindale‐Oliver & Associates
Tampa, FL 3.8 11/10‐12/92 142 23 ‐ 24hr. 3.13 16.4 ‐ Tindale‐Oliver & Associates
Marion Co, FL 2.5 Apr‐02 87 ‐ 719.79 24hr. 1.62 32.8 322.19 Kimley‐Horn & Associates
Marion Co, FL 2.5 Apr‐02 23 ‐ 610.46 24hr. 1.77 11.7 126.61 Kimley‐Horn & Associates
Marion Co, FL 3.0 Apr‐02 59 ‐ 606.02 24hr. 0.83 32.6 195.00 Kimley‐Horn & Associates
Total Size 25.1 9 1,148 Average Trip Length: 1.44
ITE 30.0 10 Weighted Average Trip Length: 1.51
Blended Total 55.1 Weighted Percent New Trip Average: 27.7
45.6 15.6 Average Trip Generation Rate: 639.68
ITE Average Trip Generation Rate: 845.60
Blend of FL Studies and ITE Average Trip Generation Rate: 775.14
Location Size (1,000 sf) DateTotal #
Interviews
# Trip Length
Interviews
Percent New
TripsTrip Gen Rate Time Period Trip Length VMT Source
Pharmacy/Drugstore w/Drive‐Thru (ITE LUC 880 & 881)
Pasco Co, FL 11.1 Apr‐02 138 38 88.97 ‐ 2.05 27.5 50.23 Tindale‐Oliver & Associates
Pasco Co, FL 12.0 Apr‐02 212 90 122.16 ‐ 2.04 42.5 105.79 Tindale‐Oliver & Associates
Pasco Co, FL 15.1 Apr‐02 1192 54 97.96 ‐ 2.13 28.1 58.69 Tindale‐Oliver & Associates
Total Size 38.2 3 1,542 Average Trip Length: 2.07
ITE 196.0 16 Weighted Average Trip Length: 2.08
Blended total 234.2 Weighted Percent New Trip Average: 32.5
Average Trip Generation Rate: 103.03
ITE Average Trip Generation Rate (LUC 880 / 881): 90.06 / 96.91
Blend of FL Studies and ITE Average Trip Generation Rate: 95.96
Percent New
TripsDate
Total #
Interviews
# Trip Length
InterviewsTrip Gen Rate Time Period Trip LengthLocation Size (1,000 sf) VMT Source
Furniture Store (ITE LUC 890)
Largo, FL 15.0 7/28‐30/92 64 34 ‐ ‐ 4.63 52.5 ‐ Tindale‐Oliver & Associates
Tampa, FL 16.9 Jul‐92 68 39 ‐ ‐ 7.38 55.7 ‐ Tindale‐Oliver & Associates
Total Size 31.9 2 132 Average Trip Length: 6.01
ITE 897.0 13 Weighted Average Trip Length: 6.09
Weighted Percent New Trip Average: 54.2
Average Trip Generation Rate: ‐
ITE Average Trip Generation Rate: 5.06
Trip LengthPercent New
TripsVMT Source
Total #
InterviewsTime Period
# Trip Length
InterviewsTrip Gen RateLocation Size (1,000 sf) Date

Charlotte County | Transportation Impact Fee Study
Tindale‐Oliver & Associates, Inc. Charlotte County September 2013 A‐10 Transportation Impact Fee Study
Drive‐In Bank (ITE LUC 912)
Tampa, FL ‐ Mar‐86 77 ‐ ‐ ‐ 2.40 ‐ ‐ Kimley‐Horn & Associates
Tampa, FL ‐ Mar‐86 211 ‐ ‐ ‐ ‐ 54.0 ‐ Kimley‐Horn & Associates
Clearwater, FL 0.4 Aug‐89 113 52 ‐ 9a‐6p 5.20 46.0 ‐ Tindale‐Oliver & Associates
Largo, FL 2.0 Sep‐89 129 94 ‐ ‐ 1.60 73.0 ‐ Tindale‐Oliver & Associates
Seminole, FL 4.5 Oct‐89 ‐ ‐ ‐ ‐ ‐ ‐ ‐ Tindale‐Oliver & Associates
Marion Co, FL 2.3 Jun‐91 69 29 ‐ 24hr. 1.33 42.0 ‐ Tindale‐Oliver & Associates
Marion Co, FL 3.1 Jun‐91 47 32 ‐ 24hr. 1.75 68.1 ‐ Tindale‐Oliver & Associates
Marion Co, FL 2.5 Jul‐91 57 26 ‐ 48hrs. 2.70 45.6 ‐ Tindale‐Oliver & Associates
Collier Co, FL ‐ Aug‐91 162 96 ‐ 24hr. 0.88 59.3 ‐ Tindale‐Oliver & Associates
Collier Co, FL ‐ Aug‐91 116 54 ‐ ‐ 1.58 46.6 ‐ Tindale‐Oliver & Associates
Collier Co, FL ‐ Aug‐91 142 68 ‐ ‐ 2.08 47.9 ‐ Tindale‐Oliver & Associates
Hernando Co, FL 5.4 May‐96 164 41 ‐ 9a‐6p 2.77 24.7 ‐ Tindale‐Oliver & Associates
Marion Co, FL 2.4 Apr‐02 70 ‐ ‐ 24hr. 3.55 54.6 ‐ Kimley‐Horn & Associates
Marion Co, FL 2.7 May‐02 50 ‐ 246.66 24hr. 2.66 40.5 265.44 Kimley‐Horn & Associates
Total Size 25.2 9 1,407 Average Trip Length: 2.38
ITE 21.0 7 Weighted Average Trip Length: 2.46
Blended total 46.2 Weighted Percent New Trip Average: 46.2
23.7 Weighted Average Trip Generation Rate: 246.66
ITE Average Trip Generation Rate: 148.15
Blend of FL Studies and ITE Average Trip Generation Rate: 159.34
Trip Gen Rate Time Period Trip LengthPercent New
TripsVMT SourceLocation Size (1,000 sf) Date
Total #
Interviews
# Trip Length
Interviews
Quality Restaurant (ITE LUC 931)
Tampa, FL ‐ Mar‐86 76 62 ‐ ‐ 2.10 82.0 ‐ Kimley‐Horn & Associates
St. Petersburg, FL 7.5 Oct‐89 177 154 ‐ 11a‐2p/4‐8p 3.50 87.0 ‐ Tindale‐Oliver & Associates
Clearwater, FL 8.0 Oct‐89 60 40 110.63 10a‐2p/5‐9p 2.80 67.0 207.54 Tindale‐Oliver & Associates
Total Size 15.5 2 313 Average Trip Length: 2.80
ITE 135.0 15 Weighted Average Trip Length: 3.14
Blended total 150.5 Weighted Percent New Trip Average: 76.7
143.0 Weighted Average Trip Generation Rate: 110.63
ITE Average Trip Generation Rate: 89.95
Blend of FL Studies and ITE Average Trip Generation Rate: 91.10
Percent New
TripsDate
Total #
Interviews
# Trip Length
InterviewsTrip Gen Rate Time Period Trip LengthLocation Size (1,000 sf) VMT Source
High‐Turnover Restaurant (ITE LUC 932)
Hernando Co, FL 6.2 May‐96 242 175 187.51 9a‐6p 2.76 72.5 375.00 Tindale‐Oliver & Associates
Hernando Co, FL 8.2 May‐96 154 93 102.71 9a‐6p 4.15 60.2 256.43 Tindale‐Oliver & Associates
St. Petersburg, FL 5.0 Oct‐89 74 68 132.60 1130‐7p 2.00 92.0 243.98 Tindale‐Oliver & Associates
Kenneth City, FL 5.2 Oct‐89 236 176 127.88 4p‐730p 2.30 75.0 220.59 Tindale‐Oliver & Associates
Pasco Co, FL 5.2 Apr‐02 114 88 82.47 9a‐6p 3.72 77.2 236.81 Tindale‐Oliver & Associates
Pasco Co, FL 5.8 Apr‐02 182 102 116.97 9a‐6p 3.49 56.0 228.77 Tindale‐Oliver & Associates
Orange Co, FL 8.9 ‐ ‐ ‐ 52.69 ‐ ‐ ‐ ‐ Orange County
Orange Co, FL 11.3 ‐ ‐ ‐ 62.12 ‐ ‐ ‐ ‐ Orange County
Orange Co, FL 6.7 ‐ ‐ ‐ 82.58 ‐ ‐ ‐ ‐ Orange County
Orange Co, FL 11.4 ‐ ‐ ‐ 91.67 ‐ ‐ ‐ ‐ Orange County
Orange Co, FL 11.3 ‐ ‐ ‐ 95.33 ‐ ‐ ‐ ‐ Orange County
Orange Co, FL 7.2 ‐ ‐ ‐ 98.06 ‐ ‐ ‐ ‐ Orange County
Orange Co, FL 5.5 ‐ ‐ ‐ 100.18 ‐ ‐ ‐ ‐ Orange County
Orange Co, FL 9.7 ‐ ‐ ‐ 105.84 ‐ ‐ ‐ ‐ Orange County
Orange Co, FL 4.6 ‐ ‐ ‐ 129.23 ‐ ‐ ‐ ‐ Orange County
Orange Co, FL 7.0 ‐ ‐ ‐ 126.40 ‐ ‐ ‐ ‐ Orange County
Orange Co, FL 9.7 ‐ ‐ ‐ 132.32 ‐ ‐ ‐ ‐ Orange County
Orange Co, FL 5.0 ‐ ‐ ‐ 135.68 ‐ ‐ ‐ ‐ Orange County
Orange Co, FL 5.6 ‐ ‐ ‐ 145.59 ‐ ‐ ‐ ‐ Orange County
Orange Co, FL 7.4 ‐ ‐ ‐ 147.44 ‐ ‐ ‐ ‐ Orange County
Orange Co, FL 5.9 ‐ ‐ ‐ 147.74 ‐ ‐ ‐ ‐ Orange County
Total Size 152.8 21 1,102 Average Trip Length: 3.07
ITE 98.0 14 Weighted Average Trip Length: 3.17
Blended total 250.8 Weighted Percent New Trip Average: 70.8
Weighted Average Trip Generation Rate: 109.84
ITE Average Trip Generation Rate: 127.15
Blend of FL Studies and ITE Average Trip Generation Rate: 116.60
Trip Gen Rate Time Period Trip LengthPercent New
TripsVMT SourceLocation Size (1,000 sf) Date
Total #
Interviews
# Trip Length
Interviews

Charlotte County | Transportation Impact Fee Study
Tindale‐Oliver & Associates, Inc. Charlotte County September 2013 A‐11 Transportation Impact Fee Study
Fast Food Restaurant w/Drive Thru (ITE LUC 934)
Tampa, FL ‐ Mar‐86 61 ‐ ‐ ‐ 2.70 ‐ ‐ Kimley‐Horn & Associates
Tampa, FL ‐ Mar‐86 306 ‐ ‐ ‐ ‐ 65.0 ‐ Kimley‐Horn & Associates
Pinellas Co, FL 2.20 Aug‐89 81 48 502.80 11a‐2p 1.70 59.0 504.31 Tindale‐Oliver & Associates
Pinellas Co, FL 4.30 Oct‐89 456 260 660.40 1 day 2.30 57.0 865.78 Tindale‐Oliver & Associates
Tarpon Springs, FL ‐ Oct‐89 233 114 ‐ 7a‐7p 3.60 49.0 ‐ Tindale‐Oliver & Associates
Marion Co, FL 1.60 Jun‐91 60 32 962.50 48hrs. 0.91 53.3 466.84 Tindale‐Oliver & Associates
Marion Co, FL 4.00 Jun‐91 75 46 625.00 48hrs. 1.54 61.3 590.01 Tindale‐Oliver & Associates
Collier Co, FL ‐ Aug‐91 66 44 ‐ ‐ 1.91 66.7 ‐ Tindale‐Oliver & Associates
Collier Co, FL ‐ Aug‐91 118 40 ‐ ‐ 1.17 33.9 ‐ Tindale‐Oliver & Associates
Hernando Co, FL 5.43 May‐96 136 82 311.83 9a‐6p 1.68 60.2 315.27 Tindale‐Oliver & Associates
Hernando Co, FL 3.13 May‐96 168 82 547.34 9a‐6p 1.59 48.8 425.04 Tindale‐Oliver & Associates
Lake Co, FL 2.20 Apr‐01 376 252 934.30 ‐ 2.50 74.6 1742.47 Tindale‐Oliver & Associates
Lake Co, FL 3.20 Apr‐01 171 182 654.90 ‐ 4.10 47.8 ‐ Tindale‐Oliver & Associates
Lake Co, FL 3.80 Apr‐01 188 137 353.70 ‐ 3.30 70.8 826.38 Tindale‐Oliver & Associates
Pasco Co, FL 2.66 Apr‐02 100 46 283.12 9a‐6p 5.10 46.0 ‐ Tindale‐Oliver & Associates
Pasco Co, FL 2.96 Apr‐02 486 164 515.32 9a‐6p 2.72 33.7 472.92 Tindale‐Oliver & Associates
Pasco Co, FL 4.42 Apr‐02 168 120 759.24 9a‐6p 1.89 71.4 1024.99 Tindale‐Oliver & Associates
Orange Co, FL 8.93 ‐ ‐ ‐ 377.00 ‐ ‐ ‐ ‐ Orange County
Total Size 48.8 13 4,463 Average Trip Length: 2.42
ITE 63.0 21 Weighted Average Trip Length: 2.05
Blended total 111.8 Weighted Percent New Trip Average: 57.9
34.0 Weighted Average Trip Generation Rate: 530.19
ITE Average Trip Generation Rate: 496.12
Blend of FL Studies and ITE Average Trip Generation Rate: 511.00
Total #
Interviews
# Trip Length
InterviewsTrip Gen Rate Time Period Trip Length
Percent New
TripsVMT SourceLocation Size (1,000 sf) Date
Service Station with and w/o Car Wash (ITE LUC 944 & 946)
Largo, FL 0.6 Nov‐89 70 14 ‐ 8am‐5pm 1.90 23.0 ‐ Tindale‐Oliver & Associates
Collier County, FL ‐ Aug‐91 168 40 ‐ ‐ 1.01 23.8 ‐ Tindale‐Oliver & Associates
Total Size 0.6 1 238 Average Trip Length: 1.46
ITE LUC 944 (vfp) 48.0 6 Weighted Average Trip Length: 1.90
ITE LUC 946 (vfp) 120.0 10 Weighted Percent New Trip Average: 23.0
ITE Average Trip Generation Rate ‐ per fuel position (LUC 944): 168.56
ITE Average Trip Generation Rate ‐ per fuel position (LUC 946): 152.84
Blended ITE Average Trip Generation Rate ‐ per fuel position: 157.33
Location Size (1,000 sf) DateTotal #
Interviews
# Trip Length
InterviewsTrip Gen Rate Time Period Trip Length
Percent New
TripsVMT Source
Self‐Service Car Wash (ITE LUC 947)
Largo, FL 10 Nov‐89 111 84 ‐ 8am‐5pm 2.00 76.0 ‐ Tindale‐Oliver & Associates
Clearwater, FL ‐ Nov‐89 177 108 ‐ 10am‐5pm 1.30 61.0 ‐ Tindale‐Oliver & Associates
Collier, FL 11 Dec‐09 304 ‐ 30.24 ‐ 2.50 57.0 ‐ Tindale‐Oliver & Associates
Collier, FL 8 Jan‐09 186 ‐ 22.75 ‐ 1.96 72.0 ‐ Tindale‐Oliver & Associates
Total Size 29 3 778 Average Trip Length: 1.94
Total Size (TGR) 19 2 Weighted Average Trip Length: 2.18
ITE 5 1 Weighted Percent New Trip Average: 67.7
Blended total 24 Weighted Average Trip Generation Rate: 27.09
ITE Average Trip Generation Rate: 108.00
Blend of FL Studies and ITE Average Trip Generation Rate: 43.94
Location Size (Bays) VMT SourcePercent New
TripsDate
Total #
Interviews
# Trip Length
InterviewsTrip Gen Rate Time Period Trip Length
Gasoline/Fast Food/Convenience Store (ITE LUC ‐ )
Volusia Co, FL ‐ ‐ ‐ ‐ 918.00 ‐ 2.40 33.0 727.06 Tindale‐Oliver & Associates
Collier Co, FL 2.4 Nov‐99 ‐ 128 1399.58 8a‐6p 4.10 13.3 763.19 Tindale‐Oliver & Associates
Indian River Co, FL 2.5 Mar‐98 132 52 748.30 8a‐6p 3.70 19.7 545.44 Tindale‐Oliver & Associates
Indian River Co, FL 3.0 Mar‐98 107 84 563.10 8a‐6p 2.00 39.3 442.60 Tindale‐Oliver & Associates
Indian River Co, FL 3.1 Mar‐98 132 110 1396.00 8a‐6p 1.80 41.7 1,047.84 Tindale‐Oliver & Associates
Collier Co, FL 3.3 Nov‐99 ‐ 144 862.56 8a‐6p 2.20 39.6 751.46 Tindale‐Oliver & Associates
Total Size 14.3 5 371 Average Trip Length: 2.70
Weighted Average Trip Length: 2.65
Weighted Percent New Trip Average: 32.1
Weighted Average Trip Generation Rate: 984.59
VMT SourceLocation Size (1,000 sf) DateTotal #
Interviews
# Trip Length
InterviewsTrip Gen Rate Time Period Trip Length
Percent New
Trips

Charlotte County | Transportation Impact Fee Study
Appendix B Cost Component Calculations

Charlotte County | Transportation Impact Fee Study
Tindale‐Oliver & Associates, Inc. Charlotte County September 2013 B‐1 Transportation Impact Fee Study
Cost Component
This appendix presents the detailed calculations for the cost component of the
transportation impact fee update. Backup data and assumptions are provided for all cost
variables (for county and state roads), including:
Design
Right‐of‐Way
Construction
Construction Engineering/Inspection
Roadway Capacity
Design
County Roadways
The design cost factor for county roads was estimated as a percentage of the construction
cost per lane mile. This factor was determined through a review of the design‐to‐
construction cost ratios for future roadway improvements in Charlotte County and from
previously completed impact fee studies throughout Florida. For local county roadways, the
design factors ranged from 7% to 14%, with a weighted average of 10%. The statewide
review also produced a similar range of factors (6% to 14%) and the same average ratio
(10%). For purposes of this update study, the design cost for county roads was calculated at
10% of the construction cost per lane mile (see Table B‐1 for additional information).
State Roadways
For state roads, the FDOT Long Range Estimates calculates design at 15 percent of
construction costs. Based on the LRE, discussions with staff, and a review of recent
transportation impact fee studies completed throughout Florida, a design factor of 10
percent of construction costs was used to calculate the design cost for state roads.

Charlotte County | Transportation Impact Fee Study
Tindale‐Oliver & Associates, Inc. Charlotte County September 2013 B‐2 Transportation Impact Fee Study
Table B‐1 Design Cost Factor – County Roads
Source: Charlotte County Community Development Department
County District Description From To Status Feature Design CostConstruction
Cost
Design /
Construction
Charlotte 1 Burnt Store Rd, Ph. II Notre Dame Zemel Rd Estimate Lane Addition $3,500,000 $26,500,000 13.2%
Charlotte 1 Burnt Store Rd, Ph. III Zemel Rd Lee Co. Line Estimate Lane Addition $1,312,647 $18,217,729 7.2%
Charlotte 1 Edgewater Corridor, Ph. II Harbor Midway Blvd Estimate Lane Addition $2,205,647 $15,000,000 14.7%
Charlotte 1 Midway Blvd Birchcrest Kings Hwy Estimate Lane Addition $1,458,044 $15,000,000 9.7%
Charlotte 1 CR 771 (Gasparilla Rd) SR 776 Rotunda Blvd E Estimate Lane Addition $1,799,232 $26,410,419 6.8%
Charlotte 1 CR 775 (Placida Rd), Ph. I Rotunda Blvd W Cape Haze Dr Estimate Lane Addition $2,683,696 $26,000,000 10.3%
Total $12,959,266 $127,128,148 10.0%

Charlotte County | Transportation Impact Fee Study
Tindale‐Oliver & Associates, Inc. Charlotte County September 2013 B‐3 Transportation Impact Fee Study
Right‐of‐Way
The ROW cost reflects the total cost of the acquisitions along a corridor that was necessary
to have sufficient cross‐section width to widen an existing road or, in the case of new
construction, build a new road.
County Roadways
To determine a ROW acquisition cost per lane mile for county roads, TOA conducted a
review of recently completed ROW acquisitions and current ROW estimates along capacity
expansion projects in Charlotte County and also reviewed ROW estimates from recent
transportation impact fee studies from other counties in Florida. For impact fee calculation
purposes, the ROW cost for county roads was estimated as a percentage of the construction
cost per lane mile. This factor was determined through a review of the ROW‐to‐
construction cost ratios for county road unit costs in recently completed/ongoing capacity
expansion improvements and completed impact fee studies throughout Florida. For local
projects, the ROW factors ranged from 8% to 63%, with a weighted average of 47%. This
figure is comparable to the average of 40% used in recent transportation impact fee reports
throughout Florida. For purposes of this update study, the ROW cost for county roads was
calculated at 47% of the construction cost per lane mile (see Table B‐2 for additional
information).
State Roadways
Based on discussions with staff, the ROW cost per lane mile determined for county roads
reflects the same costs expected for state roads.

Charlotte County | Transportation Impact Fee Study
Tindale‐Oliver & Associates, Inc. Charlotte County September 2013 B‐4 Transportation Impact Fee Study
Table B‐2 Right‐of‐Way Cost Factor – County Roads
Source: Charlotte County Community Development Department
County District Description From To Bid Year Status FeatureSection
DesignRight‐of‐Way
Construction
Cost
Right‐of‐Way /
Construction
Charlotte 1 Toledo Blade Corridor North Port US 41 2008 Completed 2 to 4 Suburban $267,110 $3,174,852 8.4%
Charlotte 1 Piper Rd Henry St Jones Loop Ph. I
Charlotte 1 Piper Rd South Henry St Jones Loop Ph. II
Charlotte 1 Burnt Store Ph. I US 41 Notre Dame 2011 Ongoing 2 to 4 Suburban $8,529,014 $13,512,394 63.1%
Total $11,807,116 $25,315,049 47.0%
$3,010,992 $8,627,8032010 Ongoing 2 to 4 Suburban 34.9%

Charlotte County | Transportation Impact Fee Study
Tindale‐Oliver & Associates, Inc. Charlotte County September 2013 B‐5 Transportation Impact Fee Study
Construction
County Roadways
A review of construction cost data for recent local county roadway capacity expansion
projects identified three improvements. These three improvements (along Toledo Blade,
Piper Road and Burnt Store Road) had a weighted average construction cost of
approximately $2.22 million per lane mile. In addition to looking at local data, a review of
recently bid projects located throughout the state of Florida was conducted. From this
review, a total of 46 projects from 12 different counties were identified with an estimated
weighted average cost of $2.17 million per lane mile. When combined with the three local
improvements, the weighted average cost per lane mile is approximately $2.18 million per
lane mile (see Table B‐3). Based on this data, a construction cost of $2.20 million per lane
mile for county roadways was used to calculate the transportation impact fee for Charlotte
County.
State Roadways
As shown in Table B‐4, a statewide review of construction cost data for recent state
roadway capacity expansion projects identified 51 improvements dating back to 2008. Of
these 51 improvements, 16 projects were located in District 1. To increase the sample size,
the District 1 improvements were combined with an additional 35 projects from throughout
the state to determine the roadway cost per lane mile for state roads. Based on this
analysis, a weighted average cost of approximately $2.4 million per lane mile was used in
the transportation impact fee calculation.

Charlotte County | Transportation Impact Fee Study
Tindale‐Oliver & Associates, Inc. Charlotte County September 2013 B‐6 Transportation Impact Fee Study
Table B‐3 Construction Cost – County Roads
Source: Charlotte County Community Development Department and roadway bids from recent impact fee studies throughout Florida as well as recent bids from the TOA Cost Database, with information having been provided by each respective County
County District Description From To Year Status Feature Design LengthLanes
Added
Lane Miles
Added
Construction
Cost
Construction Cost
per Lane Mile
Collier 1 Santa Barbara Blvd Ext. Rattlesnake Hammock Rd Davis Blvd 2008 Bid 0 to 6 Urban 2.00 6 12.00 $12,035,894 $1,002,991
Polk 1 Silver Connector Rd E.F. Griffin Rd US 98 2008 Bid 0 to 2 Urban 0.33 2 0.66 $1,560,483 $2,364,368
Polk 1 County Line Rd Ewell Ave Pipkin Rd 2008 Bid 2 to 4 Urban 1.20 2 2.40 $3,993,892 $1,664,122
Volusia 5 Debary Ave Deltona Blvd Providence Blvd 2008 Bid 2 to 4 Urban 1.84 2 3.68 $7,405,914 $2,012,477
Volusia 5 S. Williamson Blvd (Ph. II) S. of Sabal Creek Blvd N. of Moody Bridge 2008 Bid 2 to 4 Urban 1.91 2 3.82 $11,109,225 $2,908,174
Lake 5 CR 466 (Segment A) US 301 CR 319 2008 Bid 2 to 4 Urban 1.00 2 2.00 $4,062,660 $2,031,330
Hillsborough 7 40th St River Pines Apts Humphrey St 2008 Bid 2 to 4 Urban 0.95 2 1.90 $5,154,862 $2,713,085
Hillsborough 7 Race Track Rd (Ph. I) Douglas Rd Linebaugh Ave 2008 Bid 2 to 6 Urban 1.01 4 4.04 $10,099,911 $2,499,978
Osceola 5 John Young Pkwy Carroll Orange Co. Line 2008 Bid 4 to 6 Urban 0.85 2 1.70 $3,230,000 $1,900,000
Orange 5 CR 535 (Segments C and E) Ficquette Rd Butler Ridge Dr 2008 Bid 2 to 4 Urban 1.10 2 2.20 $3,693,616 $1,678,916
Orange 5 Clarcona‐Ocoee Rd Ocoee Apopka Rd SR 417 2008 Bid 2 to 4 Urban 0.40 2 0.80 $2,803,484 $3,504,355
Orange 5 Destination Pkwy International Dr Tradeshow Blvd 2008 Bid 2 to 4 Urban 0.71 2 1.42 $3,017,443 $2,124,960
Lee 1 Gladiolus Dr (Ph. I) A&W Bulb Rd Winkler Rd 2008 Bid 2 to 4/6 Urban 1.94 2/4 5.44 $13,971,509 $2,568,292
Lee 1 Gladiolus Dr (Ph. II) Pine Ridge Rd A&W Bulb Rd 2008 Bid 2 to 4 Urban 1.02 2 2.04 $6,748,642 $3,308,158
Charlotte 1 Toledo Blade Corridor North Port US 41 2008 Bid 2 to 4 Suburban 1.20 2 2.40 $3,174,852 $1,322,855
Orange 5 Clarcona‐Ocoee Rd Hiawassee Rd Clark 2009 Bid 2 to 4 Urban 2.50 2 5.00 $10,182,738 $2,036,548
Orange 5 Woodbury Rd S. of SR 50 Challenger Pkwy 2009 Bid 2 to 4 Urban 0.65 2 1.30 $4,088,942 $3,145,340
Orange 5 Sand Lake Rd President's Dr FL Mall 2009 Bid 2 to 4 Urban 1.00 2 2.00 $6,020,755 $3,010,378
Orange 5 Taft‐Vineland Road Extension Central Florida Pkwy John Young Pkwy 2009 Bid 2 to 4 Urban 0.70 2 1.40 $4,462,535 $3,187,525
Osceola 5 Narcoossee Rd US 192 Orange Co. Line 2009 Bid 2 to 4 Urban 7.40 2 14.80 $47,360,000 $3,200,000
Osceola 5 Osceola Pkwy (Ph. I) FL Turnpike Buenaventura Blvd 2009 Bid 4 to 6 Urban 1.57 2 3.14 $5,966,000 $1,900,000
Osceola 5 Poinciana Blvd (Ph. II) Crescent Lakes US 17/92 2009 Bid 2 to 4 Urban 2.50 2 5.00 $16,000,000 $3,200,000
Osceola 5 Old Lake Wilson Rd (Ph. I) Livingston Rd Sinclair Rd 2009 Bid 2 to 4 Urban 2.30 2 4.60 $14,720,000 $3,200,000
Hillsborough 7 Bruce B. Downs Palm Springs Blvd Pebble Beach Blvd 2009 Bid 4 to 8 Urban 7.20 4 28.80 $40,575,305 $1,408,865
Hillsborough 7 Race Track Rd (Ph. IV) Douglas Rd Hillsborough Ave 2009 Bid 2 to 6 Urban 0.56 4 2.24 $4,397,412 $1,963,130
Sarasota 1 Fruitville Rd (Ph. I) Tatum Rd Debrecen Rd 2009 Bid 2 to 4 Urban 0.72 2 1.44 $4,355,796 $3,024,858
Sarasota 1 Fruitville Rd (Ph. II) Coburn Rd Tatum Rd 2009 Bid 2 to 4 Urban 1.26 2 2.52 $8,557,904 $3,395,994
Lee 1 Colonial Blvd (CR 884) I‐75 SR 82 2009 Bid 4 to 6 Urban 2.70 2 5.40 $14,576,393 $2,699,332
Collier 1 Oil Well Rd (Segment 2) Immokalee Rd Everglades Blvd 2009 Bid 2 to 4/6 Urban 5.05 2/4 10.92 $16,759,586 $1,534,761
Collier 1 Oil Well Rd (Segment 4) Oil Well Grade Rd W. of Camp Keais Rd 2009 Bid 2 to 6 Urban 4.72 4 18.88 $17,919,244 $949,113
Orange 5 Alafaya Tr Avalon Park Blvd Mark Twain Blvd 2010 Bid 2 to 4 Urban 3.83 2 7.66 $18,918,599 $2,469,791
Hillsborough 7 Boyette Rd (Ph. III) McMullen Rd Bell Shoals Rd 2010 Bid 2 to 4 Urban 2.60 2 5.20 $23,184,354 $4,458,530
Broward 4 Bailey Rd NW 64th Ave / SW 81st Ave SR 7 (US 441) 2010 Bid 2 to 4 Urban 2.00 2 4.00 $6,330,297 $1,582,574
Lee 1 Six Mile Cypress Pkwy Daniels Pkwy S. of Winkler Rd Ext. 2010 Bid 2 to 4 Urban 3.09 2 6.18 $6,711,242 $1,085,961
Charlotte 1 Piper Rd Henry St Jones Loop Rd 2010 Bid 2 to 4 Suburban 2.10 2 4.20 $8,627,803 $2,054,239
Sarasota 1 North Cattlemen Rd Richardson Rd Desoto Rd 2011 Bid 2 to 4 Urban 2.55 2 5.10 $12,153,584 $2,383,056
Lee 1 Daniels Pkwy Chamberlin Pkwy Gateway Blvd 2011 Bid 4 to 6 Urban 2.05 2 4.10 $2,906,553 $708,915
Orange 5 Rouse Rd SR 50 Corporate Blvd 2011 Bid 2 to 4 Urban 2.60 2 5.20 $29,380,249 $5,650,048
Orange 5 CR 535 Seg. A Magnolia Park Ct SR 429 2011 Bid 2 to 4 Urban 1.37 2 2.74 $8,390,570 $3,062,252
Osceola 5 Goodman Rd Tri‐County Sand Mine Rd 2011 Bid 0 to 2 Urban 3.53 2 7.06 $7,060,000 $1,000,000
Pinellas 1 Bryan Dairy Rd Starkey Rd (CR 1) 72nd St 2011 Bid 4 to 6 Urban 1.47 2 2.94 $10,327,383 $3,512,715
Palm Beach 4 SR 806 (Atlantic Ave) W. of Lyons Rd Starkey Rd 2011 Bid 2 to 4 Urban 0.80 2 1.60 $5,307,643 $3,317,277
Palm Beach 4 Seminole Pratt Whitney Rd SR 80 N. of Sycamore Dr 2011 Bid 2 to 4 Urban 4.30 2 8.60 $9,733,669 $1,131,822
Charlotte 1 Burnt Store Rd (Ph. I) US 41 Notre Dame Blvd 2011 Bid 2 to 4 Urban 2.40 2 4.80 $13,512,394 $2,815,082
Palm Beach 4 Seminole Pratt Whitney Rd M Canal S. of Orange Blvd 2012 Bid 2 to 4 Urban 1.30 2 2.60 $3,646,523 $1,402,509
Polk 1 Kathleen Rd (CR35A) (Ph. II) Galloway Rd Duff Rd 2012 Bid 2 to 4 Urban 3.00 2 6.00 $16,784,760 $2,797,460
Polk 1 Bartow Northern Connector (Ph. I) US 98 US 17/92 2012 Bid 0 to 4 Urban 2.00 2 4.00 $11,110,205 $2,777,551
Volusia 5 Tymber Creek Rd SR 40 Peruvian Ln 2012 Bid 2 to 4 Urban 0.75 2 1.50 $5,276,057 $3,517,371
Collier 1 Collier Blvd (CR 951) Golden Gate Blvd Green Blvd 2013 Bid 4 to 6 Urban 2.74 2 5.48 $21,392,039 $3,903,657
Total 242.90 $528,758,922 $2,176,858
Charlotte Only 11.40 $25,315,049 $2,220,618
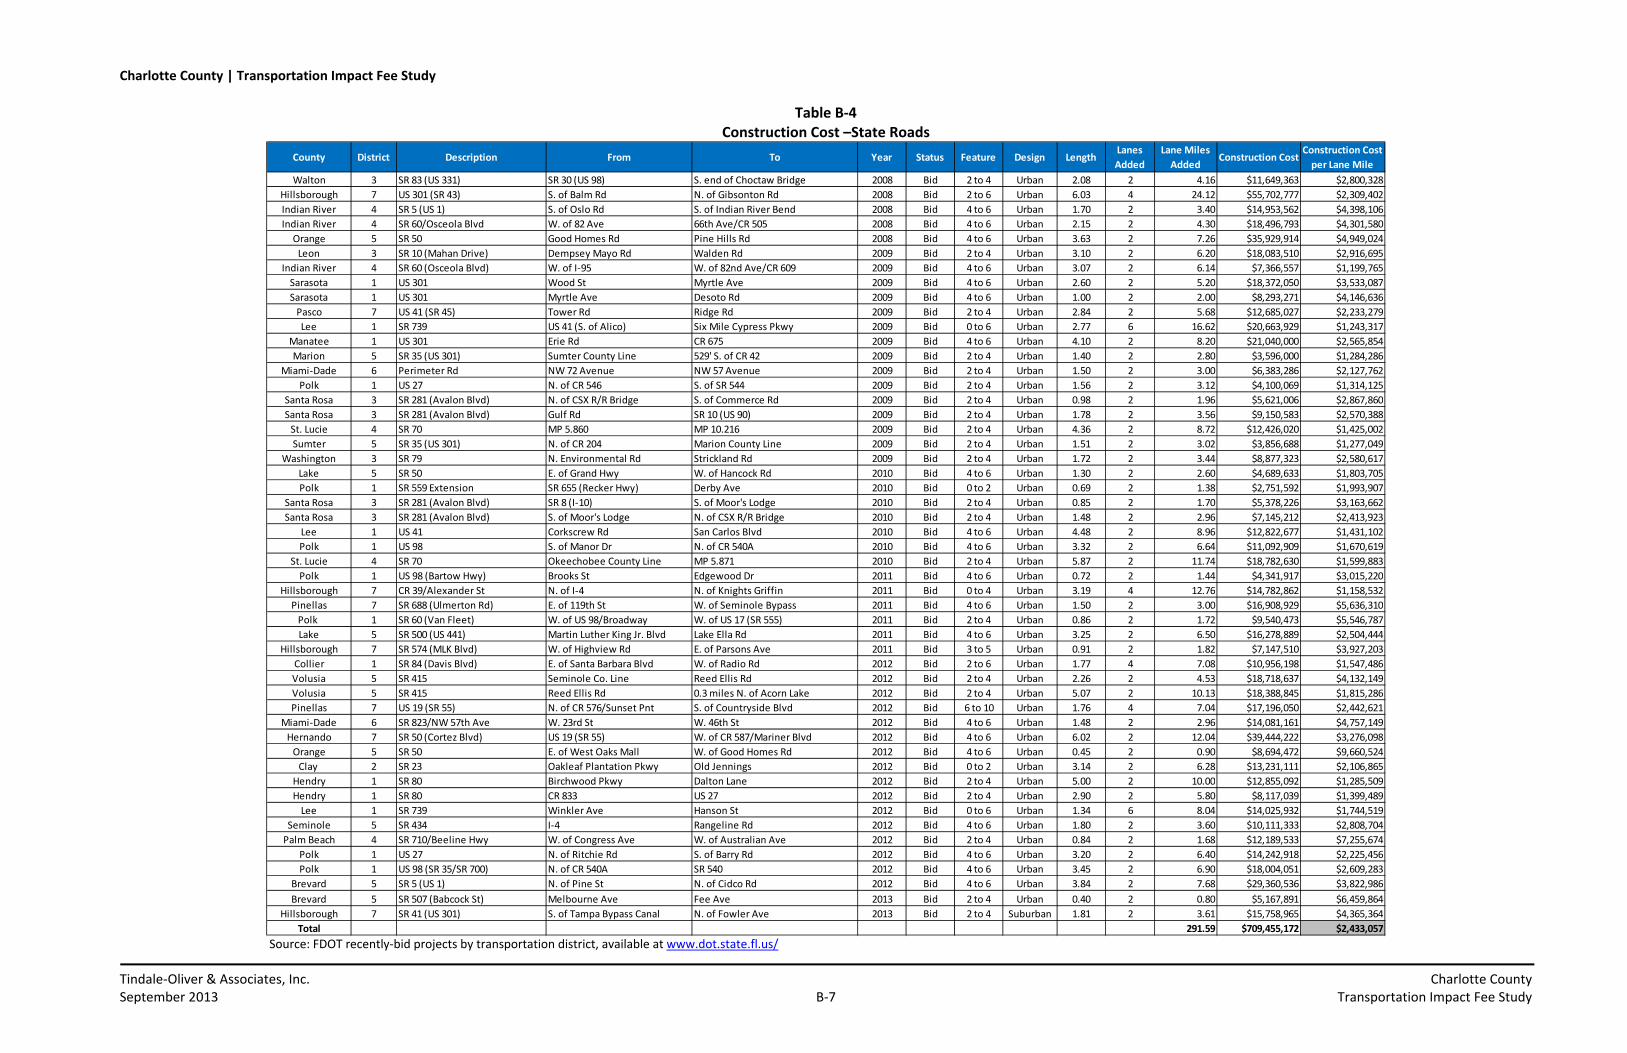
Charlotte County | Transportation Impact Fee Study
Tindale‐Oliver & Associates, Inc. Charlotte County September 2013 B‐7 Transportation Impact Fee Study
Table B‐4 Construction Cost –State Roads
Source: FDOT recently‐bid projects by transportation district, available at www.dot.state.fl.us/
Walton 3 SR 83 (US 331) SR 30 (US 98) S. end of Choctaw Bridge 2008 Bid 2 to 4 Urban 2.08 2 4.16 $11,649,363 $2,800,328
Hillsborough 7 US 301 (SR 43) S. of Balm Rd N. of Gibsonton Rd 2008 Bid 2 to 6 Urban 6.03 4 24.12 $55,702,777 $2,309,402
Indian River 4 SR 5 (US 1) S. of Oslo Rd S. of Indian River Bend 2008 Bid 4 to 6 Urban 1.70 2 3.40 $14,953,562 $4,398,106
Indian River 4 SR 60/Osceola Blvd W. of 82 Ave 66th Ave/CR 505 2008 Bid 4 to 6 Urban 2.15 2 4.30 $18,496,793 $4,301,580
Orange 5 SR 50 Good Homes Rd Pine Hills Rd 2008 Bid 4 to 6 Urban 3.63 2 7.26 $35,929,914 $4,949,024
Leon 3 SR 10 (Mahan Drive) Dempsey Mayo Rd Walden Rd 2009 Bid 2 to 4 Urban 3.10 2 6.20 $18,083,510 $2,916,695
Indian River 4 SR 60 (Osceola Blvd) W. of I‐95 W. of 82nd Ave/CR 609 2009 Bid 4 to 6 Urban 3.07 2 6.14 $7,366,557 $1,199,765
Sarasota 1 US 301 Wood St Myrtle Ave 2009 Bid 4 to 6 Urban 2.60 2 5.20 $18,372,050 $3,533,087
Sarasota 1 US 301 Myrtle Ave Desoto Rd 2009 Bid 4 to 6 Urban 1.00 2 2.00 $8,293,271 $4,146,636
Pasco 7 US 41 (SR 45) Tower Rd Ridge Rd 2009 Bid 2 to 4 Urban 2.84 2 5.68 $12,685,027 $2,233,279
Lee 1 SR 739 US 41 (S. of Alico) Six Mile Cypress Pkwy 2009 Bid 0 to 6 Urban 2.77 6 16.62 $20,663,929 $1,243,317
Manatee 1 US 301 Erie Rd CR 675 2009 Bid 4 to 6 Urban 4.10 2 8.20 $21,040,000 $2,565,854
Marion 5 SR 35 (US 301) Sumter County Line 529' S. of CR 42 2009 Bid 2 to 4 Urban 1.40 2 2.80 $3,596,000 $1,284,286
Miami‐Dade 6 Perimeter Rd NW 72 Avenue NW 57 Avenue 2009 Bid 2 to 4 Urban 1.50 2 3.00 $6,383,286 $2,127,762
Polk 1 US 27 N. of CR 546 S. of SR 544 2009 Bid 2 to 4 Urban 1.56 2 3.12 $4,100,069 $1,314,125
Santa Rosa 3 SR 281 (Avalon Blvd) N. of CSX R/R Bridge S. of Commerce Rd 2009 Bid 2 to 4 Urban 0.98 2 1.96 $5,621,006 $2,867,860
Santa Rosa 3 SR 281 (Avalon Blvd) Gulf Rd SR 10 (US 90) 2009 Bid 2 to 4 Urban 1.78 2 3.56 $9,150,583 $2,570,388
St. Lucie 4 SR 70 MP 5.860 MP 10.216 2009 Bid 2 to 4 Urban 4.36 2 8.72 $12,426,020 $1,425,002
Sumter 5 SR 35 (US 301) N. of CR 204 Marion County Line 2009 Bid 2 to 4 Urban 1.51 2 3.02 $3,856,688 $1,277,049
Washington 3 SR 79 N. Environmental Rd Strickland Rd 2009 Bid 2 to 4 Urban 1.72 2 3.44 $8,877,323 $2,580,617
Lake 5 SR 50 E. of Grand Hwy W. of Hancock Rd 2010 Bid 4 to 6 Urban 1.30 2 2.60 $4,689,633 $1,803,705
Polk 1 SR 559 Extension SR 655 (Recker Hwy) Derby Ave 2010 Bid 0 to 2 Urban 0.69 2 1.38 $2,751,592 $1,993,907
Santa Rosa 3 SR 281 (Avalon Blvd) SR 8 (I‐10) S. of Moor's Lodge 2010 Bid 2 to 4 Urban 0.85 2 1.70 $5,378,226 $3,163,662
Santa Rosa 3 SR 281 (Avalon Blvd) S. of Moor's Lodge N. of CSX R/R Bridge 2010 Bid 2 to 4 Urban 1.48 2 2.96 $7,145,212 $2,413,923
Lee 1 US 41 Corkscrew Rd San Carlos Blvd 2010 Bid 4 to 6 Urban 4.48 2 8.96 $12,822,677 $1,431,102
Polk 1 US 98 S. of Manor Dr N. of CR 540A 2010 Bid 4 to 6 Urban 3.32 2 6.64 $11,092,909 $1,670,619
St. Lucie 4 SR 70 Okeechobee County Line MP 5.871 2010 Bid 2 to 4 Urban 5.87 2 11.74 $18,782,630 $1,599,883
Polk 1 US 98 (Bartow Hwy) Brooks St Edgewood Dr 2011 Bid 4 to 6 Urban 0.72 2 1.44 $4,341,917 $3,015,220
Hillsborough 7 CR 39/Alexander St N. of I‐4 N. of Knights Griffin 2011 Bid 0 to 4 Urban 3.19 4 12.76 $14,782,862 $1,158,532
Pinellas 7 SR 688 (Ulmerton Rd) E. of 119th St W. of Seminole Bypass 2011 Bid 4 to 6 Urban 1.50 2 3.00 $16,908,929 $5,636,310
Polk 1 SR 60 (Van Fleet) W. of US 98/Broadway W. of US 17 (SR 555) 2011 Bid 2 to 4 Urban 0.86 2 1.72 $9,540,473 $5,546,787
Lake 5 SR 500 (US 441) Martin Luther King Jr. Blvd Lake Ella Rd 2011 Bid 4 to 6 Urban 3.25 2 6.50 $16,278,889 $2,504,444
Hillsborough 7 SR 574 (MLK Blvd) W. of Highview Rd E. of Parsons Ave 2011 Bid 3 to 5 Urban 0.91 2 1.82 $7,147,510 $3,927,203
Collier 1 SR 84 (Davis Blvd) E. of Santa Barbara Blvd W. of Radio Rd 2012 Bid 2 to 6 Urban 1.77 4 7.08 $10,956,198 $1,547,486
Volusia 5 SR 415 Seminole Co. Line Reed Ellis Rd 2012 Bid 2 to 4 Urban 2.26 2 4.53 $18,718,637 $4,132,149
Volusia 5 SR 415 Reed Ellis Rd 0.3 miles N. of Acorn Lake 2012 Bid 2 to 4 Urban 5.07 2 10.13 $18,388,845 $1,815,286
Pinellas 7 US 19 (SR 55) N. of CR 576/Sunset Pnt S. of Countryside Blvd 2012 Bid 6 to 10 Urban 1.76 4 7.04 $17,196,050 $2,442,621
Miami‐Dade 6 SR 823/NW 57th Ave W. 23rd St W. 46th St 2012 Bid 4 to 6 Urban 1.48 2 2.96 $14,081,161 $4,757,149
Hernando 7 SR 50 (Cortez Blvd) US 19 (SR 55) W. of CR 587/Mariner Blvd 2012 Bid 4 to 6 Urban 6.02 2 12.04 $39,444,222 $3,276,098
Orange 5 SR 50 E. of West Oaks Mall W. of Good Homes Rd 2012 Bid 4 to 6 Urban 0.45 2 0.90 $8,694,472 $9,660,524
Clay 2 SR 23 Oakleaf Plantation Pkwy Old Jennings 2012 Bid 0 to 2 Urban 3.14 2 6.28 $13,231,111 $2,106,865
Hendry 1 SR 80 Birchwood Pkwy Dalton Lane 2012 Bid 2 to 4 Urban 5.00 2 10.00 $12,855,092 $1,285,509
Hendry 1 SR 80 CR 833 US 27 2012 Bid 2 to 4 Urban 2.90 2 5.80 $8,117,039 $1,399,489
Lee 1 SR 739 Winkler Ave Hanson St 2012 Bid 0 to 6 Urban 1.34 6 8.04 $14,025,932 $1,744,519
Seminole 5 SR 434 I‐4 Rangeline Rd 2012 Bid 4 to 6 Urban 1.80 2 3.60 $10,111,333 $2,808,704
Palm Beach 4 SR 710/Beeline Hwy W. of Congress Ave W. of Australian Ave 2012 Bid 2 to 4 Urban 0.84 2 1.68 $12,189,533 $7,255,674
Polk 1 US 27 N. of Ritchie Rd S. of Barry Rd 2012 Bid 4 to 6 Urban 3.20 2 6.40 $14,242,918 $2,225,456
Polk 1 US 98 (SR 35/SR 700) N. of CR 540A SR 540 2012 Bid 4 to 6 Urban 3.45 2 6.90 $18,004,051 $2,609,283
Brevard 5 SR 5 (US 1) N. of Pine St N. of Cidco Rd 2012 Bid 4 to 6 Urban 3.84 2 7.68 $29,360,536 $3,822,986
Brevard 5 SR 507 (Babcock St) Melbourne Ave Fee Ave 2013 Bid 2 to 4 Urban 0.40 2 0.80 $5,167,891 $6,459,864
Hillsborough 7 SR 41 (US 301) S. of Tampa Bypass Canal N. of Fowler Ave 2013 Bid 2 to 4 Suburban 1.81 2 3.61 $15,758,965 $4,365,364
Total 291.59 $709,455,172 $2,433,057
Construction Cost
per Lane MileCounty District Description From To Year Status Feature Design Length
Lanes
Added
Lane Miles
AddedConstruction Cost

Charlotte County | Transportation Impact Fee Study
Tindale‐Oliver & Associates, Inc. Charlotte County September 2013 B‐8 Transportation Impact Fee Study
Construction Engineering/Inspection
County Roadways
The CEI cost factor for county roads was estimated as a percentage of the construction cost
per lane mile. This factor was determined through a review of the CEI‐to‐construction cost
ratios for recent roadway improvements in Charlotte County and from previously
completed impact fee studies throughout Florida. For local county roadways, the CEI
factors ranged from 2% to 20%, with a weighted average of 15%. The statewide review
produced a tighter range of factors (6% to 14%) and a lower average ratio (10%). Based on
discussions with staff, the local projects had some atypical attributes that increased CEI
costs and future projects would likely have lower costs. For purposes of this update study,
the CEI cost for county roads was calculated at 10% of the construction cost per lane mile
(see Table B‐5 for additional information).
State Roadways
For state roads, the FDOT Long Range Estimates calculates CEI at 15 percent of construction
costs. Based on the LRE, discussions with staff, and a review of data from other Florida
jurisdictions, CEI costs for state roads was calculated at 10 percent of construction costs.

Charlotte County | Transportation Impact Fee Study
Tindale‐Oliver & Associates, Inc. Charlotte County September 2013 B‐9 Transportation Impact Fee Study
Table B‐5 CEI Cost Factor – County Roads
Source: Charlotte County Community Development Department
County District Description From To Bid Year Status FeatureSection
DesignCEI Cost
Construction
Cost
CEI /
Construction
Charlotte 1 Toledo Blade Corridor North Port US 41 2008 Completed 2 to 4 Suburban $52,365 $3,174,852 1.6%
Charlotte 1 Piper Rd Henry St Jones Loop Ph. I
Charlotte 1 Piper Rd South Henry St Jones Loop Ph. II
Charlotte 1 Burnt Store Ph. I US 41 Notre Dame 2011 Ongoing 2 to 4 Urban $2,716,959 $13,512,394 20.1%
Total $3,787,307 $25,315,049 15.0%
Used in Impact Fee Calculation: 10.0%
$1,017,983 $8,627,803 11.8%2010 Ongoing 2 to 4 Suburban
Charlotte County | Transportation Impact Fee Study
Tindale‐Oliver & Associates, Inc. Charlotte County September 2013 B‐10 Transportation Impact Fee Study
Roadway Capacity
As shown in Table B‐6, the average capacity per lane mile was based on the projects in the
2035 Long Range Transportation Plan. This listing of projects reflects the mix of
improvements that will yield the vehicle miles of capacity (VMC) that will be built in
Charlotte County. Based on these planned improvements, the weighted average capacity
per lane mile is 10,508.
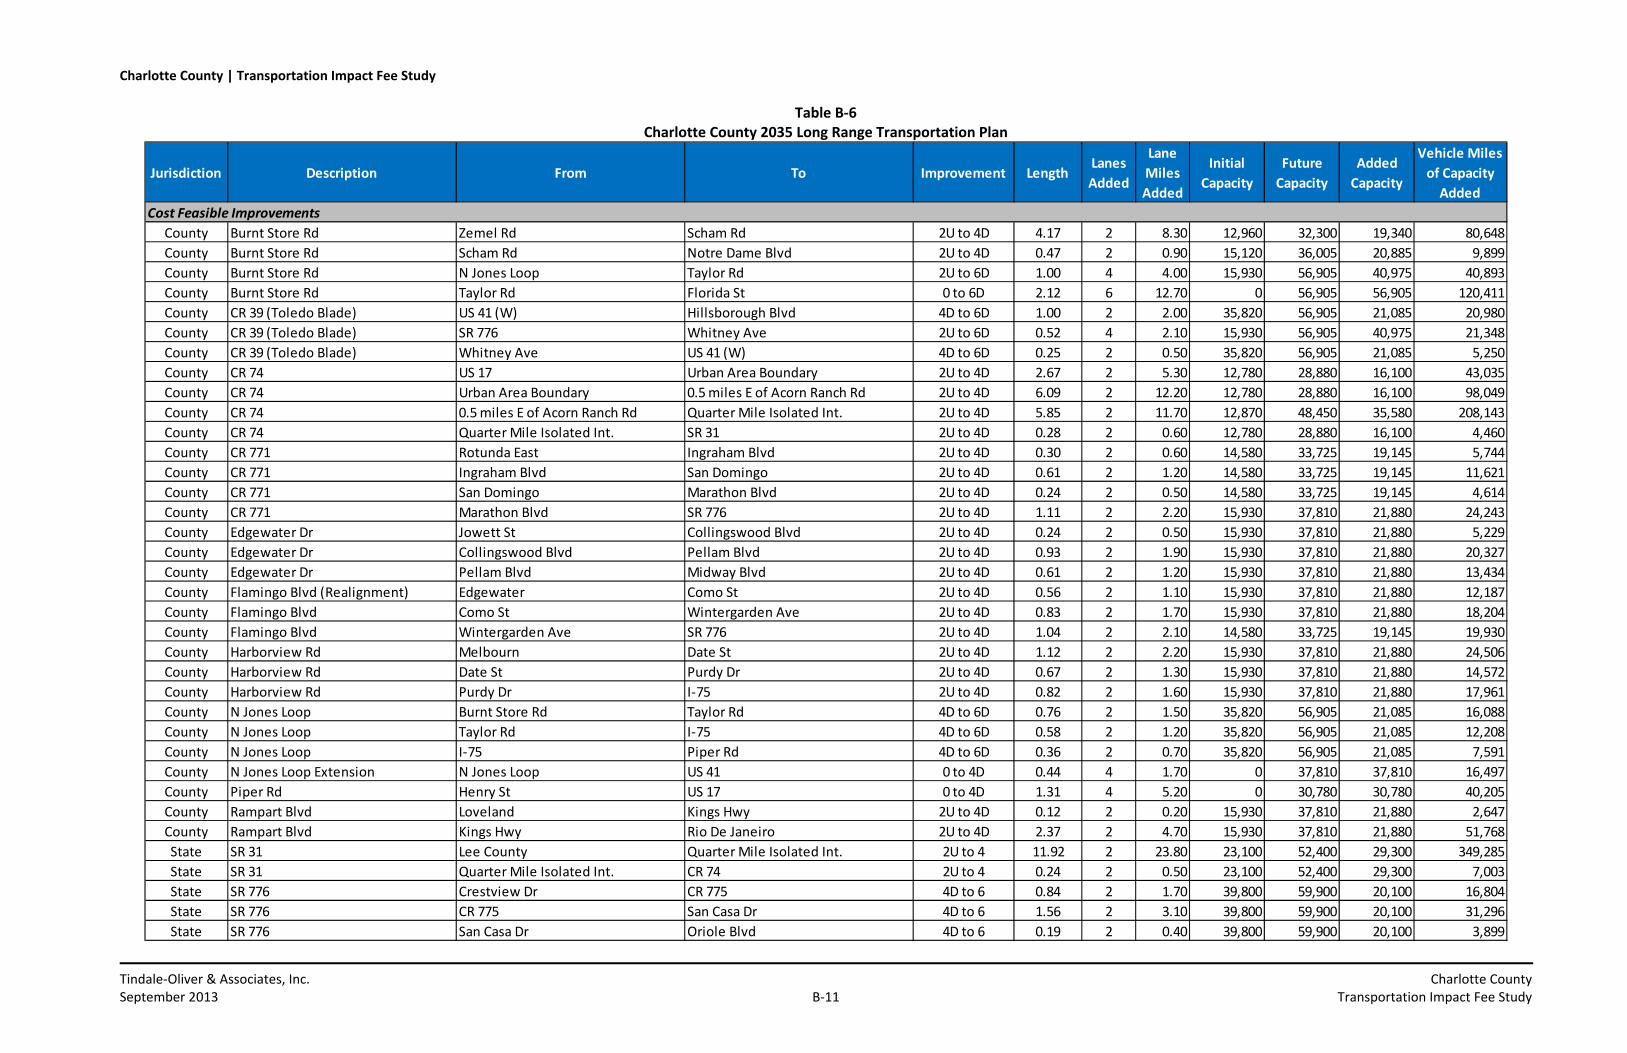
Charlotte County | Transportation Impact Fee Study
Tindale‐Oliver & Associates, Inc. Charlotte County September 2013 B‐11 Transportation Impact Fee Study
Table B‐6 Charlotte County 2035 Long Range Transportation Plan
Jurisdiction Description From To Improvement LengthLanes
Added
Lane
Miles
Added
Initial
Capacity
Future
Capacity
Added
Capacity
Vehicle Miles
of Capacity
Added
Cost Feasible Improvements
County Burnt Store Rd Zemel Rd Scham Rd 2U to 4D 4.17 2 8.30 12,960 32,300 19,340 80,648
County Burnt Store Rd Scham Rd Notre Dame Blvd 2U to 4D 0.47 2 0.90 15,120 36,005 20,885 9,899
County Burnt Store Rd N Jones Loop Taylor Rd 2U to 6D 1.00 4 4.00 15,930 56,905 40,975 40,893
County Burnt Store Rd Taylor Rd Florida St 0 to 6D 2.12 6 12.70 0 56,905 56,905 120,411
County CR 39 (Toledo Blade) US 41 (W) Hillsborough Blvd 4D to 6D 1.00 2 2.00 35,820 56,905 21,085 20,980
County CR 39 (Toledo Blade) SR 776 Whitney Ave 2U to 6D 0.52 4 2.10 15,930 56,905 40,975 21,348
County CR 39 (Toledo Blade) Whitney Ave US 41 (W) 4D to 6D 0.25 2 0.50 35,820 56,905 21,085 5,250
County CR 74 US 17 Urban Area Boundary 2U to 4D 2.67 2 5.30 12,780 28,880 16,100 43,035
County CR 74 Urban Area Boundary 0.5 miles E of Acorn Ranch Rd 2U to 4D 6.09 2 12.20 12,780 28,880 16,100 98,049
County CR 74 0.5 miles E of Acorn Ranch Rd Quarter Mile Isolated Int. 2U to 4D 5.85 2 11.70 12,870 48,450 35,580 208,143
County CR 74 Quarter Mile Isolated Int. SR 31 2U to 4D 0.28 2 0.60 12,780 28,880 16,100 4,460
County CR 771 Rotunda East Ingraham Blvd 2U to 4D 0.30 2 0.60 14,580 33,725 19,145 5,744
County CR 771 Ingraham Blvd San Domingo 2U to 4D 0.61 2 1.20 14,580 33,725 19,145 11,621
County CR 771 San Domingo Marathon Blvd 2U to 4D 0.24 2 0.50 14,580 33,725 19,145 4,614
County CR 771 Marathon Blvd SR 776 2U to 4D 1.11 2 2.20 15,930 37,810 21,880 24,243
County Edgewater Dr Jowett St Collingswood Blvd 2U to 4D 0.24 2 0.50 15,930 37,810 21,880 5,229
County Edgewater Dr Collingswood Blvd Pellam Blvd 2U to 4D 0.93 2 1.90 15,930 37,810 21,880 20,327
County Edgewater Dr Pellam Blvd Midway Blvd 2U to 4D 0.61 2 1.20 15,930 37,810 21,880 13,434
County Flamingo Blvd (Realignment) Edgewater Como St 2U to 4D 0.56 2 1.10 15,930 37,810 21,880 12,187
County Flamingo Blvd Como St Wintergarden Ave 2U to 4D 0.83 2 1.70 15,930 37,810 21,880 18,204
County Flamingo Blvd Wintergarden Ave SR 776 2U to 4D 1.04 2 2.10 14,580 33,725 19,145 19,930
County Harborview Rd Melbourn Date St 2U to 4D 1.12 2 2.20 15,930 37,810 21,880 24,506
County Harborview Rd Date St Purdy Dr 2U to 4D 0.67 2 1.30 15,930 37,810 21,880 14,572
County Harborview Rd Purdy Dr I‐75 2U to 4D 0.82 2 1.60 15,930 37,810 21,880 17,961
County N Jones Loop Burnt Store Rd Taylor Rd 4D to 6D 0.76 2 1.50 35,820 56,905 21,085 16,088
County N Jones Loop Taylor Rd I‐75 4D to 6D 0.58 2 1.20 35,820 56,905 21,085 12,208
County N Jones Loop I‐75 Piper Rd 4D to 6D 0.36 2 0.70 35,820 56,905 21,085 7,591
County N Jones Loop Extension N Jones Loop US 41 0 to 4D 0.44 4 1.70 0 37,810 37,810 16,497
County Piper Rd Henry St US 17 0 to 4D 1.31 4 5.20 0 30,780 30,780 40,205
County Rampart Blvd Loveland Kings Hwy 2U to 4D 0.12 2 0.20 15,930 37,810 21,880 2,647
County Rampart Blvd Kings Hwy Rio De Janeiro 2U to 4D 2.37 2 4.70 15,930 37,810 21,880 51,768
State SR 31 Lee County Quarter Mile Isolated Int. 2U to 4 11.92 2 23.80 23,100 52,400 29,300 349,285
State SR 31 Quarter Mile Isolated Int. CR 74 2U to 4 0.24 2 0.50 23,100 52,400 29,300 7,003
State SR 776 Crestview Dr CR 775 4D to 6 0.84 2 1.70 39,800 59,900 20,100 16,804
State SR 776 CR 775 San Casa Dr 4D to 6 1.56 2 3.10 39,800 59,900 20,100 31,296
State SR 776 San Casa Dr Oriole Blvd 4D to 6 0.19 2 0.40 39,800 59,900 20,100 3,899

Charlotte County | Transportation Impact Fee Study
Tindale‐Oliver & Associates, Inc. Charlotte County September 2013 B‐12 Transportation Impact Fee Study
Table B‐6 (continued) Charlotte County 2035 Long Range Transportation Plan
Jurisdiction Description From To Improvement LengthLanes
Added
Lane
Miles
Added
Initial
Capacity
Future
Capacity
Added
Capacity
Vehicle Miles
of Capacity
Added
Cost Feasible Improvements
State SR 776 Oriole Blvd Winchester Blvd 4D to 6 0.30 2 0.60 39,800 59,900 20,100 6,090
State SR 776 Winchester Blvd Wilmington Blvd 4D to 6 0.18 2 0.40 39,800 59,900 20,100 3,698
State SR 776 Wilmington Blvd Spinnaker Blvd 4D to 6 0.84 2 1.70 39,800 59,900 20,100 16,784
State SR 776 Spinnaker Blvd Sunnybrook Blvd 4D to 6 1.02 2 2.00 39,800 59,900 20,100 20,442
State SR 776 US 41 Murdock Cir E 4D to 6 0.31 2 0.60 39,800 62,895 23,095 7,252
County Tucker's Grade US 41 I‐75 4D to 6D 1.07 2 2.10 35,820 56,905 21,085 22,477
State US 17 Copley Ave Regent Rd 4D to 6D 0.31 2 0.60 14,500 24,465 9,965 3,079
State US 17 Regent Rd Golf Course Blvd 4D to 6D 0.48 2 1.00 14,500 24,465 9,965 4,783
State US 17 Golf Course Blvd CR 74 4D to 6D 0.19 2 0.40 14,500 24,465 9,965 1,923
State US 41 Notre Dame Blvd Taylor Rd 4D to 6 1.31 2 2.60 39,800 59,900 20,100 26,231
State US 41 Taylor Rd Burnt Store Rd 4D to 6D 1.59 2 3.20 39,800 59,900 20,100 31,979
County Veterans Blvd Murdock Cir E Toledo Blade 4D to 6D 0.49 2 1.00 35,820 56,905 21,085 10,311
County Veterans Blvd Toledo Blade Atwater St 4D to 6D 1.38 2 2.80 35,820 56,905 21,085 29,034
County Veterans Blvd Atwater St Yorkshire St 4D to 6D 0.66 2 1.30 35,820 56,905 21,085 13,874
County Veterans Blvd Yorkshire St Hillsborough Ave 4D to 6D 0.97 2 1.90 35,820 56,905 21,085 20,389
Unfunded Needs Improvements
County Biscayne Dr Extension Biscayne Blvd Flamingo Blvd 0 to 4D 1.93 4 7.70 0 33,725 33,725 65,089
County Flamingo Blvd SR 776 New Road 2U to 4D 0.47 2 0.90 14,580 33,725 19,145 8,998
County Green Gulf Blvd Zemel Rd Las Lomas 0 to 2U 2.05 2 4.10 0 9,940 9,940 20,387
County Green Gulf Blvd Las Lomas Tucker's Grade 0 to 2U 1.97 2 3.90 0 9,940 9,940 19,532
County Gulfstream Extension Coach Rd CR 771 0 to 4D 1.08 4 4.30 0 37,810 37,810 40,759
County Gulfstream Extension San Casa Rd Forkland St 0 to 4D 1.26 4 5.00 0 37,810 37,810 47,527
County Hillsborough Blvd Prineville St Atwater St 2U to 4D 1.63 2 3.30 15,930 37,810 21,880 35,752
County Hillsborough Blvd Atwater St Veterans Hwy 2U to 4D 1.51 2 3.00 15,930 37,810 21,880 33,017
State US 41 Taylor Rd Burnt Store Rd 6D to 8D 1.59 2 3.20 59,900 84,105 24,205 38,510
State I‐75 Frontage Rd Harborview Rampart Blvd 0 to 2U 0.55 2 1.10 0 11,840 11,840 6,465
County Liddy St Veterans Blvd Ruskin Blvd 0 to 4D 0.73 4 2.90 0 37,810 37,810 27,715
County S Jones Loop Loop Connector Piper Rd 2U to 4D 4.12 2 8.20 15,930 37,810 21,880 90,036
County N Toledo Blade Extension CR 939 (Toldeo Blade) Collingswood Blvd 0 to 4D 0.47 4 1.90 0 37,810 37,810 17,695
County N Toledo Blade Extension Collingswood Blvd Prineville St 0 to 4D 1.00 4 4.00 0 37,810 37,810 37,848
County N Toledo Blade Extension Prineville St Liddy St 0 to 4D 0.29 4 1.10 0 37,810 37,810 10,814
State SR 776 CR 771 Gillot Blvd 4D to 6D 1.08 2 2.20 39,800 59,900 20,100 21,668
State SR 776 Gillot Blvd Sturkie Ave 4D to 6D 1.25 2 2.50 39,800 59,900 20,100 25,165
State SR 776 Sturkie Ave Cornelius Blvd 4D to 6D 2.27 2 4.50 39,800 59,900 20,100 45,567
State SR 776 Cornelius Blvd Biscayne Blvd 4D to 6D 0.56 2 1.10 39,800 59,900 20,100 11,316
State SR 776 Biscayne Blvd Flamingo Blvd 4D to 6D 1.25 2 2.50 39,800 59,900 20,100 25,025

Charlotte County | Transportation Impact Fee Study
Tindale‐Oliver & Associates, Inc. Charlotte County September 2013 B‐13 Transportation Impact Fee Study
Table B‐6 (continued) Charlotte County 2035 Long Range Transportation Plan
Source: Charlotte County 2035 Long Range Transportation Plan
Note: Letter references (i.e., “a”) are used to assist with footnotes and sourcing
Jurisdiction Description From To Improvement LengthLanes
Added
Lane
Miles
Added
Initial
Capacity
Future
Capacity
Added
Capacity
Vehicle Miles
of Capacity
Added
Unfunded Needs Improvements
State SR 776 Flamingo Blvd Como St 4D to 6D 0.48 2 1.00 39,800 59,900 20,100 9,628
State SR 776 Como St Toldeo Blade 4D to 6D 0.15 2 0.30 39,800 59,900 20,100 2,975
State SR 776 Toldeo Blade Collingswood Blvd 4D to 6D 0.43 2 0.90 39,800 59,900 20,100 8,703
State SR 776 Collingswood Blvd Murdock Cir W 4D to 6D 0.22 2 0.40 39,800 59,900 20,100 4,442
State SR 776 Murdock Cir W US 41 4D to 6D 0.46 2 0.90 39,800 59,900 20,100 9,326
County Tucker's Grade Burnt Store Rd Green Gulf Blvd 0 to 6D 1.25 6 7.50 0 56,905 56,905 71,131
County Tucker's Grade Green Gulf Blvd US 41 0 to 6D 0.93 6 5.60 0 56,905 56,905 52,808
State US 17 Southbound US 41 Southbound Taylor St 2U to 2D 0.09 1 0.10 10,620 11,151 531 49
State US 17 Southbound Taylor St US 41 Northbound 2U to 2D 0.09 1 0.10 10,620 11,151 531 49
State US 41 Urban Area Boundary Tucker's Grade 4D to 6D 1.46 2 2.90 39,800 62,895 23,095 33,719
State US 41 Tucker's Grade Notre Dame Blvd 4D to 6D 0.27 2 0.50 39,800 62,895 23,095 6,259
Total (All Roads): 232.90 2,447,299
County Roads: 166.10 71% (a) 1,667,885
State Roads: 66.80 29% (b) 779,414
VMC Added per Lane Mile: 10,508

Charlotte County | Transportation Impact Fee Study
Appendix C Credit Component Calculations

Charlotte County | Transportation Impact Fee Study
Tindale‐Oliver & Associates, Inc. Charlotte County September 2013 C‐1 Transportation Impact Fee Study
Credit Component
This appendix presents the detailed calculations for the credit component. Currently, in
addition to the capital support that ultimately results from State fuel tax revenues,
Charlotte County also receives financial benefit from several other funding sources. Of
these, County fuel taxes that are collected in Charlotte County are listed below, along with a
few pertinent characteristics of each.
1. Constitutional Fuel Tax (2¢/gallon)
Tax applies to every net gallon of motor and diesel fuel sold within a county.
Collected in accordance with Article XII, Section 9 (c) of the Florida Constitution.
The State allocated 80 percent of this tax to Counties after first withholding amounts
pledged for debt service on bonds issued pursuant to provisions of the State
Constitution for road and bridge purposes.
The 20 percent surplus can be used to support the road construction program within
the county.
Counties are not required to share the proceeds of this tax with their municipalities.
2. County Fuel Tax (1¢/gallon)
Tax applies to every net gallon of motor and diesel fuel sold within a county.
Primary purpose of these funds is to help reduce a County’s reliance on ad valorem
taxes.
Proceeds are to be used for transportation‐related expenses, including the reduction
of bond indebtedness incurred for transportation purposes. Authorized uses include
acquisition of rights‐of‐way; the construction, reconstruction, operation,
maintenance, and repair of transportation facilities, roads, bridges, bicycle paths,
and pedestrian pathways; or the reduction of bond indebtedness incurred for
transportation purposes.
Counties are not required to share the proceeds of this tax with their municipalities.
3. Ninth‐Cent Fuel Tax (1¢/gallon)
Tax on every net gallon of motor fuel sold within a county.
Proceeds may be used to fund transportation expenditures.
To accommodate statewide equalization, this tax is automatically levied on diesel
fuel in every county, regardless of whether a county is levying the tax on motor fuel
at all.

Charlotte County | Transportation Impact Fee Study
Tindale‐Oliver & Associates, Inc. Charlotte County September 2013 C‐2 Transportation Impact Fee Study
Counties are not required to share the proceeds of this tax with their municipalities.
Charlotte County has adopted this 1 cent fuel tax
4. 1st Local Option Tax (up to 6¢/gallon)
Tax applies to every net gallon of motor and diesel fuel sold within a county.
Proceeds may be used to fund transportation expenditures.
To accommodate statewide equalization, all six cents are automatically levied on
diesel fuel in every county, regardless of whether a County is levying the tax on
motor fuel at all or at the maximum rate.
Proceeds are distributed to a county and its municipalities according to a mutually
agreed upon distribution ratio, or by using a formula contained in the Florida
Statutes.
Charlotte County has adopted all 6 cents of this fuel tax
5. 2nd Local Option Tax (up to 5¢/gallon)
Tax applies to every net gallon of motor and diesel fuel sold within a county.
Proceeds may be used to fund transportation expenditures needed to meet
requirements of the capital improvements element of an adopted Local Government
Comprehensive Plan.
Proceeds are distributed to a county and its municipalities according to a mutually
agreed upon distribution scheme, or by using a formula contained in the Florida
Statutes.
Charlotte County has adopted all 5 cents of this fuel tax
Each year, the Florida Legislature’s Office of Economic and Demographic Research (EDR)
produces the Local Government Financial Information Handbook, which details the
estimated local government revenues for the upcoming fiscal year. Included in this
document are the estimated distributions of the various fuel tax revenues for each county
in the state. The 2012‐13 data represent projected fuel tax distributions to Charlotte
County for the upcoming fiscal year. In the table, the fuel tax revenue data are used to
calculate the value per penny (per gallon of fuel) that should be used to estimate the
“equivalent pennies” of other revenue sources. Table C‐1 shows the distribution per penny
for each of the fuel levies, and then the calculation of the weighted average for the value of
a penny of fuel tax. The weighting procedure takes into account the differing amount of
revenues generated for the various types of gas tax revenues. The weighted average figure
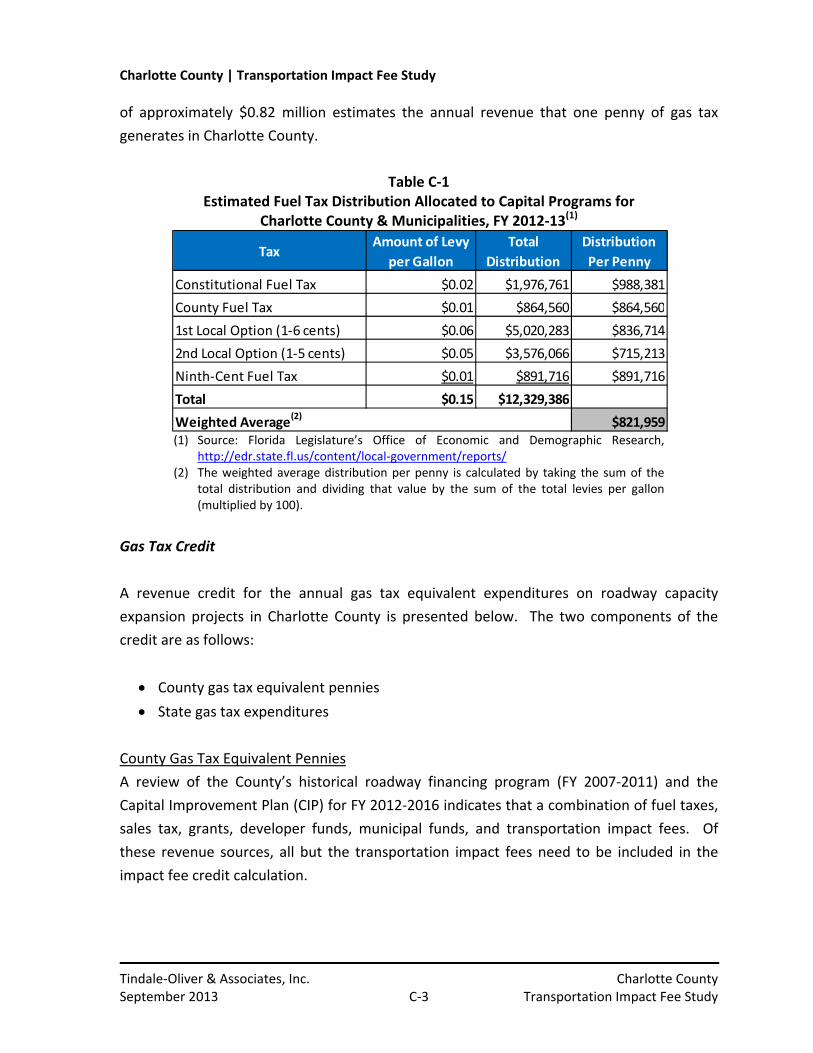
Charlotte County | Transportation Impact Fee Study
Tindale‐Oliver & Associates, Inc. Charlotte County September 2013 C‐3 Transportation Impact Fee Study
of approximately $0.82 million estimates the annual revenue that one penny of gas tax
generates in Charlotte County.
Table C‐1
Estimated Fuel Tax Distribution Allocated to Capital Programs for Charlotte County & Municipalities, FY 2012‐13(1)
(1) Source: Florida Legislature’s Office of Economic and Demographic Research,
http://edr.state.fl.us/content/local‐government/reports/ (2) The weighted average distribution per penny is calculated by taking the sum of the
total distribution and dividing that value by the sum of the total levies per gallon (multiplied by 100).
Gas Tax Credit
A revenue credit for the annual gas tax equivalent expenditures on roadway capacity
expansion projects in Charlotte County is presented below. The two components of the
credit are as follows:
County gas tax equivalent pennies
State gas tax expenditures
County Gas Tax Equivalent Pennies
A review of the County’s historical roadway financing program (FY 2007‐2011) and the
Capital Improvement Plan (CIP) for FY 2012‐2016 indicates that a combination of fuel taxes,
sales tax, grants, developer funds, municipal funds, and transportation impact fees. Of
these revenue sources, all but the transportation impact fees need to be included in the
impact fee credit calculation.
TaxAmount of Levy
per Gallon
Total
Distribution
Distribution
Per Penny
Constitutional Fuel Tax $0.02 $1,976,761 $988,381
County Fuel Tax $0.01 $864,560 $864,560
1st Local Option (1‐6 cents) $0.06 $5,020,283 $836,714
2nd Local Option (1‐5 cents) $0.05 $3,576,066 $715,213
Ninth‐Cent Fuel Tax $0.01 $891,716 $891,716
Total $0.15 $12,329,386
$821,959Weighted Average(2)

Charlotte County | Transportation Impact Fee Study
Tindale‐Oliver & Associates, Inc. Charlotte County September 2013 C‐4 Transportation Impact Fee Study
Currently, impact fees, fuel taxes, and sales tax are the primary funding sources for
capacity‐expansion projects. Historically, approximately 90 percent of the sales tax
revenues have been dedicated to roadway capacity expansion. Due to the uncertainty
surrounding the re‐adoption of the 1.0% local option sales tax and a probable decline in
revenues available for transportation, two sales tax credit scenarios were developed for the
transportation impact fee update:
Scenario 1 – assumes that Charlotte County will not receive sales tax revenue for
future transportation capacity expansion
Scenario 2 – assumes that Charlotte County will re‐adopt the 1.0% local option sales
tax, but that the revenues available to transportation will be significantly reduced.
Based on discussions with staff, it is estimated that the dedication to transportation
would be reduced by 50 percent from the current level of dedication (90 percent),
which is approximately 45 percent of all potential sales tax revenues. Based on the
Local Government Financial Information Handbook, a 1.0% sales tax generates
approximately $18.4 million annually in Charlotte County. Applying the Scenario 2
assumptions, it is estimated that approximately $8.3 million of sales tax revenue
would be available for transportation capacity‐expansion improvements.
Table C‐2 includes that detailed calculations of the County gas tax equivalent pennies for
both County credit scenarios in Charlotte County.
Table C‐2 County Gas Tax Equivalent Pennies
(1) Source: Table C‐6 (2) Source: Table C‐5 (3) Cost of projects for Scenario 1 (Item 3)divided by number of years divided by revenue from 1 penny (Item
6) divided by 100 (4) Source: Local Government Financial Information Handbook; 45% of estimated local discretionary sales
surtax (1.0%) distributions for a 5‐yr time period (5) Total for Scenario 1 plus the estimated sales tax revenues for transportation (Item 4)
SourceCost of
Projects
Number of
Years
Revenue from
1 Penny(6)
Equivalent
Pennies(7)
Projected CIP Expenditures (2013‐2017)(1)
$70,293,000 5 $821,959 $0.171
Historical County Expenditures (2008‐2012)(2)
$17,698,749 5 $821,959 $0.043
Total (Scenario 1, no sales tax)(3)
$87,991,749 10 $821,959 $0.107
Estimated Sales Tax for Transp. (2013‐2017)(4)
$41,500,000 5 $821,959 $0.101
Total (Scenario 2, reduced sales tax)(5)
$129,491,749 10 $821,959 $0.158

Charlotte County | Transportation Impact Fee Study
Tindale‐Oliver & Associates, Inc. Charlotte County September 2013 C‐5 Transportation Impact Fee Study
(6) Source: Table C‐1 (7) Cost of projects for Scenario 2 (Item 5) divided by number of years divided by revenue from 1 penny (Item
6) divided by 100
Additionally, the County is currently using gas tax revenues to retire debt on the Burnt Store
Rd, Ph. I Bond that was used to fund capacity expansion improvements. As shown in Table
C‐3, a credit of 0.01 pennies is given for outstanding debt service in Charlotte County.
Table C‐3 County Gas Tax Equivalent Pennies for Debt Service
(1) Source: Table C‐7 (2) Source: Table C‐1 (3) Present value of total payment remaining (Item 1) divided by number of years divided by revenue from 1
penny (Item 2) divided by 100
State Gas Tax Expenditures
In the calculation of the equivalent pennies of gas tax from the State, expenditures on
roadway capacity expansion spanning a 15‐year period (from FY 2004 to FY 2018) were
reviewed. For calculation purposes, the 15‐year period was broken into three increments;
two historical (FY 2004‐2008 and FY 2009‐2013) and one future (FY 2014‐2018).
Information on historical projects’ funding and the future year estimates was obtained from
the FDOT Work Programs and the County’s FY 2014‐2018 Transportation Improvement
Program (TIP). The use of a 15‐year period, for purposes of developing a State credit for
roadway capacity expansion projects, results in a stable credit, as it accounts for the
volatility in FDOT spending in the county over short periods of time. It should be noted,
that expenditures on interstate improvements were not included in the impact fee credit.
In the past 15 years, FDOT has provided over $100 million in funding for interstate
improvements, which represents a major portion of state expenditures in the County.
The total cost of the capacity‐adding projects for the five‐year “historical” periods and
projected in the five‐year Transportation Improvement Program are as follows:
FY 2004‐2008 work plan equates to 3.9 pennies
FY 2009‐2013 work plan equates to 5.5 pennies
SourceTotal Payment
Remaining
Number of
Years
Revenue from
1 Penny(3)
Equivalent
Pennies(4)
Burnt Store Rd, Ph. I(1)
$11,881,646 14 $821,959 $0.010
Total $11,881,646 $821,959 $0.010

Charlotte County | Transportation Impact Fee Study
Tindale‐Oliver & Associates, Inc. Charlotte County September 2013 C‐6 Transportation Impact Fee Study
FY 2014‐2018 work plan equates to 9.1 pennies
The combined weighted average over the 15‐year period of state expenditure for capacity‐
adding roadway projects results in a total of 6.1 equivalent pennies. Table C‐4 documents
this calculation. The specific projects that were used in the equivalent penny calculations
are summarized in Table C‐8.
Table C‐4 Equivalent Penny Calculation for State Portion
(1) Source: Table C‐8, total cost of expansion projects (2) Source: Table C‐8, total cost of expansion projects (3) Source: Table C‐8, total cost of expansion projects (4) Source: Table C‐1 (5) Cost of projects divided by number of years divided by revenue from 1 penny (Item 4) divided by 100
SourceCost of
Projects
Number of
Years
Revenue from
1 Penny(4)
Equivalent
Pennies(5)
Projected TIP (FY 2014‐2018)(1)
$37,534,626 5 $821,959 $0.091
Historical Work Program (FY 2009‐2013)(2)
$22,425,509 5 $821,959 $0.055
Historical Work Program (FY 2004‐2008)(3)
$15,852,118 5 $821,959 $0.039
Total $75,812,253 15 $821,959 $0.061

Charlotte County | Transportation Impact Fee Study
Tindale‐Oliver & Associates, Inc. Charlotte County September 2013 C‐7 Transportation Impact Fee Study
Table C‐5 Historical Capital Improvement Plan Expenditures for Charlotte County, FY 2008‐2012
Source: Charlotte County Development Department
Proj # Description On/From/To FY 2008 FY 2009 FY 2010 FY 2011 FY 2012 Total
c419002 Add Lanes & Reconstruct Edgewater Corridor Ph. II from Harbor to Midway $0 $24,630 $54,970 $0 $564,920 $644,520
c419005 Add Lanes & Reconstruct Midway Ph. I from Elkcam to Birchcrest $33,090 $1,000 $0 $134,860 $73,830 $242,780
c411112 Add Lanes & Reconstruct Midway Ph. II from Birchcrest to Kings Hwy $0 $0 $0 $0 $4,750 $4,750
c410915 Add Lanes & Reconstruct Burnt Store Rd Ph. III from Zemel Rd to Lee Co. Line $0 $0 $1,050 $2,540 $33,220 $36,810
c410521 Add Lanes & Reconstruct CR 775 (Placida Rd) Ph. I from Rotunda Blvd W to Cape Haze Dr $0 $12,390 $0 ‐$31,390 ‐$105,710 ‐$124,710
c410502 Add Lanes & Reconstruct CR 771 (Gasparilla Rd) from SR 776 to Rotunda Blvd E $0 $0 $0 $0 $13,830 $13,830
c419001 New Road Construction Edgewater Corridor Ph. I from SR 776 to Collingswood Blvd $43,129 $6,456 $981 $22,593 $22,132 $95,291
c410501 Add Lanes & Reconstruct Kings Hwy from Sandhill to Desoto Co. Line $445,260 $71,480 $369,420 $227,600 $51,190 $1,164,950
c410742 Add Lanes & Reconstruct Rampart Blvd from I‐75 to Kings Hwy $0 $0 $220 $0 $25,810 $26,030
c419905 Add Lanes & Reconstruct Toledo Blade Corridor Ph. II from North Port to US 41 $0 $0 $400,640 $2,250 $0 $402,890
c410744 Intersection Improvement US 41/Murdock Circle $0 $4,550 $0 $0 $0 $4,550
c410806 Intersection Improvement Veterans/Peachland/KH $0 $1,370 $9,470 $29,200 $5,080 $45,120
c419901 Add Lanes & Reconstruct Burnt Store Rd Ph. I from US 41 to Notre Dame $0 $2,683,430 $1,975,740 ‐$4,900,600 $7,753,880 $7,512,450
g411201 New Road Construction Cheney Bros Access Roadway $0 $0 $0 $0 $156,570 $156,570
c410201 Add Lanes & Reconstruct Carmalita/Education $4,933,650 $1,941,260 $92,750 $0 $0 $6,967,660
c411110 New Road Construction Piper Rd / North $0 $0 $0 $0 $6,220 $6,220
c410508 Intersection Improvement US 41/Pompano/Shreve $34,280 $9,780 $201,440 $0 $0 $245,500
c411011 Intersection Improvement Zemel Rd/Burnt Store Rd $0 $0 $710 $3,420 $6,610 $10,740
c419201 Add Lanes & Reconstruct CR 775 from SR 776 to San Casa $0 $0 $0 $0 $0 $0
c419302 New Road Construction Winchester Corridor Ph. III (South) $74,600 $445,663 $61,468 ‐$521,035 $182,102 $242,798
Total $5,564,009 $5,202,009 $3,168,859 ‐$5,030,562 $8,794,434 $17,698,749

Charlotte County | Transportation Impact Fee Study
Tindale‐Oliver & Associates, Inc. Charlotte County September 2013 C‐8 Transportation Impact Fee Study
Table C‐6 Programmed Capital Improvement Plan Expenditures for Charlotte County, FY 2008‐2012
Source: FY 2013 Adopted Capital Improvements Program
Proj # Description On/From/To FY 2013 FY 2014 FY 2015 FY 2016 FY 2017 Total
c419001 New Road Construction Edgewater Corridor Ph. I from SR 776 to Collingswood Blvd $1,375,000 $0 $0 $0 $0 $1,375,000
c419002 Add Lanes & Reconstruct Edgewater Corridor Ph. II from Harbor to Midway $722,000 $0 $0 $0 $0 $722,000
c410501 Add Lanes & Reconstruct Kings Hwy from I‐75 to Desoto Co. Line $4,406,000 $0 $0 $0 $0 $4,406,000
c411112 Add Lanes & Reconstruct Midway Blvd from Birchcrest to Kings Hwy $5,323,000 $0 $0 $0 $0 $5,323,000
c410742 Add Lanes & Reconstruct Rampart Blvd from Rio de Janeiro Blvd to Kings Hwy $2,315,000 $0 $0 $0 $0 $2,315,000
c410914 PE for Future Capacity Sandhill Blvd from Kings Hwy to Capricorn $110,000 $0 $0 $0 $0 $110,000
c419901 Add Lanes & Reconstruct Burnt Store Rd Ph. I from US 41 to Notre Dame $2,955,000 $147,000 $136,000 $124,000 $120,000 $3,482,000
c411111 Add Lanes & Reconstruct Burnt Store Rd Ph. II from Notre Dame to Zemel Rd $16,524,000 $0 $0 $0 $0 $16,524,000
c410915 Add Lanes & Reconstruct Burnt Store Rd Ph. III from Zemel Rd to Lee Co. Line $3,716,000 $0 $0 $0 $0 $3,716,000
g411201 New Road Construction Cheney Bros Access Roadway $846,000 $0 $0 $0 $0 $846,000
c410202 Add Lanes & Reconstruct Piper Rd S from Jones Loop Rd to Henry St $185,000 $0 $0 $0 $0 $185,000
c411011 Intersection Improvements Zemel Rd @ Burnt Store Rd $465,000 $0 $0 $3,230,000 $4,680,000 $8,375,000
c410502 Add Lanes & Reconstruct CR 771 (Gasparilla Rd) from SR 776 to Rotunda Blvd E $79,000 $10,421,000 $121,000 $91,000 $61,000 $10,773,000
c410521 Add Lanes & Reconstruct CR 775 (Placida Rd) Ph. I from Rotunda Blvd W to Cape Haze Dr $87,000 $0 $0 $0 $0 $87,000
c419302 New Road Construction Winchester Corridor S Ph. III from SR 776 to CR 775 (Placida Rd) $12,054,000 $0 $0 $0 $0 $12,054,000
Total $51,162,000 $10,568,000 $257,000 $3,445,000 $4,861,000 $70,293,000

Charlotte County | Transportation Impact Fee Study
Tindale‐Oliver & Associates, Inc. Charlotte County September 2013 C‐9 Transportation Impact Fee Study
Table C‐7 County Debt Service – Burnt Store Rd, Ph. I
Source: Charlotte County Development Department
Year Principal InterestTotal Debt
Service
2013 $1,083,200 $105,329 $1,188,529
2014 $748,200 $147,142 $895,342
2015 $748,200 $135,859 $884,059
2016 $748,200 $124,407 $872,607
2017 $748,200 $112,783 $860,983
2018 $748,200 $100,985 $849,185
2019 $748,200 $89,010 $837,210
2020 $748,200 $76,855 $825,055
2021 $748,200 $64,518 $812,718
2022 $748,200 $51,996 $800,196
2023 $748,200 $39,286 $787,486
2024 $748,200 $26,385 $774,585
2025 $748,200 $13,291 $761,491
2026 $725,200 $7,000 $732,200
Total $10,786,800 $1,094,846 $11,881,646
Payments Remaining 14
Annual Average Payment $848,689

Charlotte County | Transportation Impact Fee Study
Tindale‐Oliver & Associates, Inc. Charlotte County September 2013 C‐10 Transportation Impact Fee Study
Table C‐8 FY 2004 – FY 2018 Charlotte County FDOT Work Program & Transportation Improvement Program – Capacity‐Expansion Projects
Source: FDOT Gaming Reports for Charlotte County and the FY 2014‐2018 Transportation Improvement Program
Proj. # Description On/From/To FY 2004 FY 2005 FY 2006 FY 2007 FY 2008 FY 2009 FY 2010 FY 2011 FY 2012 FY 2013 FY 2014 FY 2015 FY 2016 FY 2017 FY 2018 Total
193791‐1 Add Lanes & Reconstruct US 17 from N of CR 74 to CR 764 S $71,592 $0 $0 $67 $0 $0 $0 $0 $0 $0 $0 $0 $0 $0 $0 $71,659
193798‐1 Add Lanes & Reconstruct US 17 from CR 764 S to CR 764 N $0 $0 $0 $550,465 $0 $0 $0 $0 $0 $0 $0 $0 $0 $0 $0 $550,465
193813‐1 Add Lanes & Reconstruct SR 776 from E of Sunnybrook Blvd to W or CR 771 $205 $94,915 $0 $0 $0 $0 $0 $0 $0 $0 $0 $0 $0 $0 $0 $95,120
193814‐1 Add Lanes & Reconstruct US 17 (SR 35) from CR 764 S to Desoto Co. Line $282,633 $203,066 $138,114 $1,397 $0 $0 $0 $0 $0 $0 $0 $0 $0 $0 $0 $625,210
193821‐1 Traffic Control Devices/System Charlotte Countywide Computer System $518,129 $8,136 $135,158 $28,947 $0 $0 $0 $0 $0 $0 $0 $0 $0 $0 $0 $690,370
193824‐1 Traffic Control Devices/System Charlotte County Computer System $408,359 $5,325,552 $1,019,736 $338,506 $474,321 $126,783 $0 $0 $0 $0 $0 $0 $0 $0 $0 $7,693,257
193833‐1 Traffic Ops Improvement Charlotte MPO Identified Operational Improvements Funding $0 $0 $0 $0 $0 $0 $0 $0 $0 $0 $0 $0 $0 $0 $814,989 $814,989
403895‐1 Add Turn Lane(s) US 41 (SR 45) at Olean Blvd $0 $0 $0 $0 $0 $0 $0 $0 $0 $118,335 $0 $0 $0 $0 $0 $118,335
405114‐1 PD&E/Emo Study Aqui Esta from Coronado Dr to US 41 $13,959 $1,022 $0 $0 $0 $0 $0 $0 $0 $0 $0 $0 $0 $0 $0 $14,981
405114‐2 Add Lanes & Reconstruct Aqui Esta Dr from Magdalena Dr to US 41 $0 $962,500 $0 $0 $1,864 $0 $0 $0 $0 $0 $0 $0 $0 $0 $0 $964,364
412642‐1 Preliminary Engineering Aqui Esta Dr from Bal Harbor Blvd to Magdalena Dr $0 $0 $456,750 $0 $0 $0 $0 $0 $0 $0 $0 $0 $0 $0 $0 $456,750
412665‐1 Traffic Signals Traffic Signals Charlotte County Reimbursement $33,179 $45,567 $46,936 $48,347 $49,800 $52,530 $55,799 $59,104 $60,885 $62,710 $74,000 $76,000 $79,000 $81,000 $82,500 $907,357
413625‐1 Traffic Signals Punta Gorda Traffic Signals Reimbursement $15,990 $21,960 $22,620 $23,300 $24,000 $23,484 $19,943 $20,539 $21,157 $21,792 $24,500 $25,000 $26,000 $27,000 $26,500 $343,785
413774‐1 Intersection (Major) Airport Rd/Taylor Rd Intersection $0 $0 $342,899 $0 $0 $0 $0 $0 $0 $0 $0 $0 $0 $0 $0 $342,899
414522‐1 PD&E/EMO Study US 41 from N of Peace River Br to SR 776 $0 $0 $0 $0 $0 $0 $113 $151 $0 $0 $0 $0 $0 $0 $0 $264
414522‐2 Intersection Improvement US 41 (SR 45) at CR 776 (Harborview Rd) $0 $0 $0 $0 $0 $0 $0 $938 $13,365 $39,757 $758,080 $0 $501,381 $0 $0 $1,313,521
416086‐1 Add Left Turn Lane(s) US 41 at Midway Blvd $0 $0 $0 $0 $0 $46,451 $143,713 $1,477 $0 $0 $0 $0 $0 $0 $0 $191,641
416087‐1 Traffic Ops Improvement SR 776 at San Casa Dr $0 $0 $0 $0 $0 $0 $35,876 $203,503 $14,960 $29,788 $0 $0 $0 $0 $0 $284,127
416088‐1 Add Left Turn Lane(s) Murdock Circle at US 41 $0 $0 $0 $0 $0 $38,803 $194,426 $350 $0 $0 $0 $0 $0 $0 $0 $233,579
417067‐1 Traffic Signals US 17 at Disston Ave $0 $21,650 $0 $0 $0 $0 $0 $0 $0 $0 $0 $0 $0 $0 $0 $21,650
417551‐1 Add Right Turn Lane(s) Murdock Circle at Veterans Blvd $0 $0 $0 $0 $0 $0 $249,857 $41,418 $152 $0 $0 $0 $0 $0 $0 $291,427
420979‐1 Add Lanes & Reconstruct CR 765 (Burnt Store) from Notre Dame Rd to N of US 41 $0 $0 $2,000,000 $2,000,000 $0 $0 $0 $0 $0 $0 $0 $0 $0 $0 $0 $4,000,000
420982‐1 New Road Construction Winchester Blvd from CR 775 to SR 776 $0 $0 $0 $0 $0 $0 $0 $0 $0 $6,015,309 $0 $0 $0 $0 $0 $6,015,309
420994‐1 Misc Construction SR 776 at CR 771 (Gasparilla Rd) $0 $0 $0 $0 $120,477 $35,872 $0 $0 $0 $0 $0 $0 $0 $0 $0 $156,349
422710‐1 PD&E/EMO Study US 41 from Enterprise Dr to Sumter Blvd $0 $0 $0 $0 $0 $0 $36,858 $825,394 $0 $0 $0 $0 $0 $0 $0 $862,252
422710‐2 Add Lanes & Rehabilitate Pvmt US 41 (SR 45) from Enterprise Dr to Sarasota Co. Line $0 $0 $0 $0 $0 $0 $0 $3,719,373 $341,669 $1,662,501 $600,000 $25,628,167 $0 $0 $0 $31,951,710
425157‐1 Traffic Signals SR 776 (El Jobean Rd) at Flamingo Blvd $0 $0 $0 $0 $0 $200,000 $0 $0 $0 $0 $0 $0 $0 $0 $0 $200,000
425609‐1 Intersection Improvement SR 776 at Oriole Blvd $0 $0 $0 $0 $0 $0 $100,048 $380 $0 $0 $0 $0 $0 $0 $0 $100,428
425787‐1 Add Right Turn Lane(s) SR 776 at Gulfstream Blvd $0 $0 $0 $0 $0 $0 $0 $994 $79,207 $439,903 $0 $0 $0 $0 $0 $520,104
426724‐1 Intersection Improvement SR 776 (McCall Rd) at Coliseum Blvd $0 $0 $0 $0 $0 $0 $526,885 $50,578 $0 $0 $0 $0 $0 $0 $0 $577,463
427181‐1 PD&E/EMO Study CR 765 (Burnt Store) at Zemel Rd $0 $0 $0 $0 $0 $0 $445,926 $27,374 $22,957 $10,105 $0 $0 $0 $0 $0 $506,362
429776‐1 Intersection Improvement US 41/SR 45 at Cochran Blvd $0 $0 $0 $0 $0 $0 $0 $774,381 $62,301 $30,000 $0 $0 $0 $0 $0 $866,682
429777‐1 Intersection Improvement US 41/SR 45 at Harbor Blvd $0 $0 $0 $0 $0 $0 $0 $753,609 $9,883 $2,126 $0 $0 $0 $0 $0 $765,618
429810‐1 Add Lanes & Rehabilitate Pvmt CR 765 (Burnt Store) from Lee Co. Line to Zemel Rd $0 $0 $0 $0 $0 $0 $0 $0 $0 $3,182,008 $0 $0 $0 $0 $0 $3,182,008
429959‐1 Add Turn Lane(s) US 41 (SR 45) at Tarpon Blvd $0 $0 $0 $0 $0 $0 $0 $0 $114,275 $15,886 $0 $0 $1,331,684 $0 $0 $1,461,845
430012‐1 PD&E/EMO Study SR 776 (McCall Rd) from CR 775 (Placida Rd) to Spinnaker Blvd $0 $0 $0 $0 $0 $0 $0 $0 $1,008,054 $22,327 $0 $0 $0 $0 $0 $1,030,381
430012‐2 PE for Future Capacity SR 776 (McCall Rd) from CR 775 (Placida Rd) to San Casa Dr $0 $0 $0 $0 $0 $0 $0 $0 $0 $0 $0 $0 $0 $1,650,000 $0 $1,650,000
430012‐3 PE for Future Capacity SR 776 (McCall Rd) from San Casa Dr to Spinnaker Blvd $0 $0 $0 $0 $0 $0 $0 $0 $0 $0 $0 $0 $0 $1,614,690 $0 $1,614,690
430120‐1 Add Turn Lane(s) US 41 (SR 45) at Kings Hwy ‐ Parmely St $0 $0 $0 $0 $0 $0 $0 $0 $120,121 $12,509 $0 $0 $1,123,297 $0 $0 $1,255,927
430895‐1 Add Turn Lane(s) US 41 (SR 45) at Olean Blvd $0 $0 $0 $0 $0 $0 $0 $0 $0 $0 $0 $0 $1,044,723 $0 $0 $1,044,723
430938‐1 Intersection Improvement SR 776 (McCall Rd) at CR 771 $0 $0 $0 $0 $0 $0 $0 $0 $78,537 $0 $500,000 $0 $0 $0 $0 $578,537
431218‐1 Intersection Improvement US 41 (SR 45) at Conway Blvd $0 $0 $0 $0 $0 $0 $0 $0 $0 $0 $0 $0 $0 $128,374 $896,833 $1,025,207
431219‐1 Intersection Improvement US 41 (SR 45) at Hancock Ave $0 $0 $0 $0 $0 $0 $0 $0 $0 $0 $0 $0 $0 $220,908 $0 $220,908
431336‐1 Traffic Signal Update Signal Timing Analysis and Implementation $0 $0 $0 $0 $0 $0 $0 $0 $0 $0 $200,000 $0 $0 $0 $0 $200,000
Total $1,344,046 $6,684,368 $4,162,213 $2,991,029 $670,462 $523,923 $1,809,444 $6,479,563 $1,947,523 $11,665,056 $2,156,580 $25,729,167 $4,106,085 $3,721,972 $1,820,822 $75,812,253

Charlotte County | Transportation Impact Fee Study
Tindale‐Oliver & Associates, Inc. Charlotte County September 2013 C‐11 Transportation Impact Fee Study
Table C‐9 Average Motor Vehicle Fuel Efficiency – Excluding Interstate Travel
Source: See Table C‐10
21.4 6.3 @ 21.4 mpg @ 6.3 mpg
Other Arterial Rural 322,037,000,000 46,267,000,000 368,304,000,000 87% 13%
Other Rural 319,465,000,000 32,818,000,000 352,283,000,000 91% 9%
Other Urban 1,397,059,000,000 83,069,000,000 1,480,128,000,000 94% 6%
Total 2,038,561,000,000 162,154,000,000 2,200,715,000,000 93% 7%
Gallons @ 21.4 mpg Gallons @ 6.3 mpg 2,200,715 miles (millions)
Other Arterial Rural 15,048,457,944 7,343,968,254 22,392,426,198 120,999 gallons (millions)
Other Rural 14,928,271,028 5,209,206,349 20,137,477,377 18.19 mpg
Other Urban 65,283,130,841 13,185,555,556 78,468,686,397
Total 95,259,859,813 25,738,730,159 120,998,589,972
Source: U.S. Department of Transportation, Federal Highway Administration, Highway Statistics 2011 , Section V, Table VM‐1
Annual Vehicle Distance Traveled in Miles and Related Data ‐ 2011 by Highway Category and Vehicle Type
http://www.fhwa.dot.gov/policyinformation/statistics.cfm
Fuel Consumed Total Mileage and Fuel
Travel
Vehicle Miles of Travel (VMT) @ Percent VMT

Charlotte County | Transportation Impact Fee Study
Tindale‐Oliver & Associates, Inc. Charlotte County September 2013 C‐12 Transportation Impact Fee Study
Table C‐10 Annual Vehicle Distance Traveled in Miles and Related Data (2011) ‐ By Highway Category and Vehicle Type1/
Published March 2013 TABLE VM‐1
ALL LIGHT
VEHICLES(2)
SINGLE‐UNIT 2‐AXLE
6‐TIRE OR MORE
AND COMBINATION
TRUCKS
Motor‐Vehicle Travel:
(mill ions of vehicle‐miles)
2011 Interstate Rural 140,603 1,243 1,670 42,961 9,495 47,616 183,564 57,111 243,587
2011 Other Arterial Rural 232,385 2,814 1,981 89,651 16,945 29,321 322,037 46,267 373,099
2011 Other Rural 226,037 3,016 2,052 93,427 18,090 14,729 319,465 32,818 357,351
2011 All Rural 599,026 7,073 5,703 226,040 44,530 91,666 825,065 136,196 974,038
2011 Interstate Urban 341,865 2,134 2,112 82,652 14,126 33,815 424,517 47,942 476,704
2011 Other Urban 1,102,519 9,293 5,967 294,541 44,859 38,210 1,397,059 83,069 1,495,389
2011 All Urban 1,444,384 11,427 8,079 377,193 58,985 72,026 1,821,576 131,011 1,972,094
2011 Total Rural and Urban(5)
2,043,409 18,500 13,783 603,232 103,515 163,692 2,646,641 267,207 2,946,131
2011 Number of motor vehicles 192,513,278 8,330,210 666,064 41,328,144 7,819,055 2,451,638 233,841,422 10,270,693 253,108,389
registered(2)
2011 Average miles traveled 10,614 2,221 20,693 14,596 13,239 66,768 11,318 26,016 11,640
per vehicle
2011 Person‐miles of travel(4)
2,839,083 19,927 292,192 805,888 103,515 163,692 3,644,971 267,207 4,224,297
(mill ions)
2011 Fuel consumed 88,536,602 425,410 1,932,823 35,325,791 14,183,270 28,193,355 123,862,392 42,376,625 168,597,250
(thousand gallons)
2011 Average fuel consumption per 460 51 2,902 855 1,814 11,500 530 4,126 666
vehicle (gallons)
2011 Average miles traveled per 23.1 43.5 7.1 17.1 7.3 5.9 21.4 6.3 17.5
gallon of fuel consumed
(6) The change in the number of buses i s primari ly due to the decl ine of reported publ ic operated school buses .
(3) Single‐Unit ‐ s ingle frame trucks that have 2‐Axles and at least 6 ti res or a gross vehicle weight rating exceeding 10,000 lbs .
(4) Vehicle occupancy i s estimated by the FHWA from the 2009 National Household Travel Survey (NHTS); For s ingle unit truck and heavy trucks , 1 motor vehicle mile travel led = 1 person‐mile traveled.
(5) VMT data are based on the la test HPMS data avai lable; i t may not match previous publ ished resul ts .
SINGLE‐UNIT
TRUCKS(3)
COMBINATION
TRUCKS
SUBTOTALS
ALL MOTOR
VEHICLES
( ) y g p g y g y ( ) , p ( ), g ( ,
MV‐9, and MV‐10), other data such as the R.L. Polk vehicle data, and a host of model ing techniques. FOr 2011, changes in a couple of States ' truck VMT substantia l ly impacted national truck VMT
trends . Upon further review with the States involved, FHWA s ti l l cons iders these changes as materia l fact. However, FHWA wil l conduct further analys is when the 2012 data are reported by the
States in 2013.
(2) Light Duty Vehicles Short WB ‐ passenger cars , l i ght trucks , vans and sport uti l i ty vehicles with a wheelbase (WM) equal to or less than 121 inches . Light Duty Vehicles Long WB ‐ la rge passenger
cars , vans , pickup trucks , and sport/uti l i ty vehicles with wheelbases (WB) larger than 121 inches . Al l Light Duty Vehicles ‐ passenger cars , l ight trucks , vans and sport uti l i ty vehicles regardless of
YEAR ITEM
LIGHT DUTY
VEHICLES
SHORT WB(2)
MOTOR‐
CYCLESBUSES
(6)
LIGHT DUTY
VEHICLES
LONG WB(2)

Charlotte County | Transportation Impact Fee Study
Appendix D Calculated Transportation Impact Fee Schedule

Charlotte County | Transportation Impact Fee Study
Tindale‐Oliver & Associates, Inc. Charlotte County September 2013 D‐1 Transportation Impact Fee Study
Table D‐1 Calculated Transportation Impact Fee Schedule (Scenario 1 – No Sales Tax Revenues Available)
Gasoline Tax Unit Construction Cost: $3,770,860 Interstate/Toll Facility Adjustment Factor: 15.6%
$$ per gallon to capital: $0.178 Capacity per lane mile: 10,508 Cost per VMC: $358.86
Facility life (years): 25 County Revenues: $0.117 Fuel Efficiency: 18.19 mpg
Interest rate: 4.0% State Revenues: $0.061 Effectivedays per year: 365
ITE
LUCLand Use Unit Trip Rate Trip Rate Source
Assessable
Trip Length
Total Trip
LengthTrip Length Source % New Trips
% New Trips
SourceNet VMT(1)
Total Impact
Cost
Annual
Gas Tax
Gas Tax
Credit
Net Impact
Fee
RESIDENTIAL:
210 Single Family (Detached) du 7.81
FL Studies (NHTS,
AHS, Census) 6.62 7.12 FL Studies 100% N/A 21.82 $7,830 $99 $1,547 $6,283
220 Multi‐Family (Apartment) du 6.60
Blend ITE 9th & FL
Studies 5.10 5.60
FL Studies
(LUC 220/230) 100% N/A 14.20 $5,097 $66 $1,031 $4,066
230 Condo/Townhouse (Attached Housing Unit) du 5.76
Blend ITE 9th & FL
Studies 5.10 5.60
FL Studies
(LUC 220/230) 100% N/A 12.40 $4,449 $58 $906 $3,543
240 Mobile Home Park du 4.17 Florida Studies 4.60 5.10 FL Studies 100% N/A 8.09 $2,905 $38 $594 $2,311
253 Congregate Care Facility du 2.25
Blend ITE 9th & FL
Studies 3.08 3.58 FL Studies 72% FL Studies 2.11 $756 $10 $156 $600
LODGING:
310 Hotel room 6.36
Blend ITE 9th & FL
Studies 6.26 6.76 FL Studies 66% FL Studies 11.09 $3,979 $51 $797 $3,182
320 Motel room 5.63 ITE 9th Edition 4.34 4.84 FL Studies 77% FL Studies 7.94 $2,849 $37 $578 $2,271
RECREATION:
416 RV Park(2) site 1.62 ITE 9th Edition 4.60 5.10 Same as LUC 240 100% FL Schedules 3.14 $1,129 $15 $234 $895
420 Marina boat berth 2.96 ITE 9th Edition 6.62 7.12 Same as LUC 210 90% FL Schedules 7.44 $2,671 $34 $531 $2,140
430 Golf Course hole 35.74 ITE 9th Edition 6.62 7.12 Same as LUC 210 90% FL Schedules 89.86 $32,247 $409 $6,389 $25,858
444 Movie Theater w/Matinee 1,000 sf 106.63
Blend ITE 6th & FL
Studies 2.22 2.72 FL Studies 88% FL Studies 87.91 $31,546 $456 $7,124 $24,422
492 Health/Fitness Club 1,000 sf 32.93 ITE 9th Edition 5.15 5.65 Same as LUC 710 94% FL Studies 67.27 $24,141 $312 $4,874 $19,267
INSTITUTIONS:
520 Elementary School (Private) student 1.29 ITE 9th Edition 4.30 4.80 FL Schedules 80% FL Schedules 1.87 $672 $9 $141 $531
522 Middle School (Private) student 1.62 ITE 9th Edition 4.30 4.80 FL Schedules 90% FL Schedules 2.65 $949 $12 $187 $762
530 High School (Private) student 1.71 ITE 9th Edition 4.30 4.80 FL Schedules 90% FL Schedules 2.79 $1,002 $13 $203 $799
540
University/Junior College (7,500 or fewer students)
(Private) student 2.00
ITE Regression
Analysis 6.62 7.12 Same as LUC 210 90% FL Schedules 5.03 $1,805 $23 $359 $1,446
550
University/Junior College (more than 7,500
students) (Private) student 1.50
ITE Regression
Analysis 6.62 7.12 Same as LUC 210 90% FL Schedules 3.77 $1,353 $17 $266 $1,087

Charlotte County | Transportation Impact Fee Study
Tindale‐Oliver & Associates, Inc. Charlotte County September 2013 D‐2 Transportation Impact Fee Study
Table D‐1 (continued) Calculated Transportation Impact Fee Schedule (Scenario 1 ‐‐ No Sales Tax Revenues Available)
ITE
LUCLand Use Unit Trip Rate Trip Rate Source
Assessable
Trip Length
Total Trip
LengthTrip Length Source % New Trips
% New Trips
SourceNet VMT(1)
Total Impact
Cost
Annual
Gas Tax
Gas Tax
Credit
Net Impact
Fee
INSTITUTIONS:
560 Church 1,000 sf 9.11 ITE 9th Edition 3.90 4.40 FL Schedules 90% FL Schedules 13.49 $4,842 $64 $1,000 $3,842
565 Day Care 1,000 sf 71.88
Blend ITE 9th & FL
Studies 2.03 2.53 FL Studies 73% FL Studies 44.95 $16,131 $237 $3,702 $12,429
610 Hospital 1,000 sf 13.22 ITE 9th Edition 6.62 7.12 Same as LUC 210 77% FL Schedules 28.44 $10,205 $129 $2,015 $8,190
620 Nursing Home 1,000 sf 7.60 ITE 9th Edition 2.59 3.09 FL Studies 89% FL Studies 7.39 $2,653 $37 $578 $2,075
OFFICE:
General Office 100,000 sf or less(3) 1,000 sf 13.13 ITE 9th equation 5.15 5.65 FL Studies 92% FL Studies 26.25 $9,421 $122 $1,906 $7,515
General Office 100,001‐200,000 sf(3) 1,000 sf 11.12 ITE 9th equation 5.15 5.65 FL Studies 92% FL Studies 22.23 $7,979 $103 $1,609 $6,370
General Office 200,001‐400,000 sf(3) 1,000 sf 9.41 ITE 9th equation 5.15 5.65 FL Studies 92% FL Studies 18.81 $6,752 $87 $1,359 $5,393
General Office greater than 400,000 sf(3) 1,000 sf 8.54 ITE 9th equation 5.15 5.65 FL Studies 92% FL Studies 17.08 $6,128 $79 $1,234 $4,894
Medical Office/Clinic 10,000 sf or less 1,000 sf 23.83 FL Studies 3.63 4.13 Local Studies 84% Local Studies 30.66 $11,004 $148 $2,312 $8,692
Medical Office/Clinic greater than 10,000 sf 1,000 sf 36.35
Blend ITE 9th & Local
Studies 3.63 4.13 Local Studies 84% Local Studies 46.77 $16,785 $225 $3,515 $13,270
RETAIL:
Retail 100,000 sfgla or less(3) 1,000 sfgla 67.91 ITE 9th equation 2.29 2.79 FL Curve 62% FL Curve 40.69 $14,601 $210 $3,281 $11,320
Retail 100,001‐200,000 sfgla(3) 1,000 sfgla 53.28 ITE 9th equation 2.40 2.90 FL Curve 67% FL Curve 36.15 $12,974 $185 $2,890 $10,084
Retail 200,001‐400,000 sfgla(3) 1,000 sfgla 41.80 ITE 9th equation 2.64 3.14 FL Curve 73% FL Curve 34.00 $12,199 $171 $2,671 $9,528
Retail greater than 400,000 sfgla(3) 1,000 sfgla 36.27 ITE 9th equation 2.87 3.37 FL Curve 76% FL Curve 33.39 $11,981 $166 $2,593 $9,388
841 New/Used Auto Sales 1,000 sf 27.12
Blend ITE 9th & FL
Studies 4.60 5.10 FL Studies 79% FL Studies 41.59 $14,925 $195 $3,046 $11,879
849 Tire Superstore service bay 30.55 ITE 9th Edition 4.60 5.10 Same as LUC 841 79% Same as LUC 841 46.85 $16,812 $220 $3,437 $13,375
850 Supermarket 1,000 sf 103.38
Blend ITE 9th & FL
Studies 2.08 2.58 FL Studies 56% FL Studies 50.82 $18,236 $267 $4,171 $14,065
851 Convenience Market (24 hour) 1,000 sf 719.18
Blend ITE 9th & FL
Studies 1.52 2.02 FL Studies 41% FL Studies 189.14 $67,873 $1,064 $16,622 $51,251
853 Convenience Market w/Gas Pumps 1,000 sf 775.14
Blend ITE 9th & FL
Studies 1.51 2.01 FL Studies 28% FL Studies 138.30 $49,630 $779 $12,170 $37,460
862 Home Improvement Superstore 1,000 sf 30.74 ITE 9th Edition 2.40 2.90
Same as LUC 820
(100‐200k) 67%
Same as LUC 820
(100‐200k) 20.86 $7,486 $107 $1,672 $5,814
710
720
820

Charlotte County | Transportation Impact Fee Study
Tindale‐Oliver & Associates, Inc. Charlotte County September 2013 D‐3 Transportation Impact Fee Study
Table D‐1 (continued) Calculated Transportation Impact Fee Schedule (Scenario 1 ‐‐ No Sales Tax Revenues Available)
(1) Net VMT is calculated as ((Trip Generation Rate* Trip Length* % New Trips)*(1‐Interstate/Toll Facility Adjustment Factor)/2). This reflects the unit of vehicle miles of capacity consumed per unit of development and is multiplied by the cost per vehicle (2) The ITE 9th Edition trip generation rate was adjusted to reflect an average occupancy rate of 60 percent based on data provided by the Florida Association of Parks and Campgrounds (3) The trip generation rate recommended for the office and shopping center land uses use the end‐point regression value
ITE
LUCLand Use Unit Trip Rate Trip Rate Source
Assessable
Trip Length
Total Trip
LengthTrip Length Source % New Trips
% New Trips
SourceNet VMT(1)
Total Impact
Cost
Annual
Gas Tax
Gas Tax
Credit
Net Impact
Fee
RETAIL:
880/
881 Pharmacy/Drug Store with or w/o Drive‐Thru 1,000 sf 95.96
Blend ITE 9th & FL
Studies 2.08 2.58 FL Studies 32% FL Studies 26.95 $9,672 $141 $2,203 $7,469
890 Furniture Store 1,000 sf 5.06 ITE 9th Edition 4.05 4.55 FL Studies 78% FL Studies 6.75 $2,421 $32 $500 $1,921
911 Bank/Savings Walk‐In 1,000 sf 121.30 ITE 9th Edition 2.46 2.96 Same as LUC 912 46% Same as LUC 912 57.93 $20,787 $295 $4,609 $16,178
912 Bank/Savings Drive‐In 1,000 sf 159.34
Blend ITE 9th & FL
Studies 2.46 2.96 FL Studies 46% FL Studies 76.09 $27,306 $387 $6,046 $21,260
931 Quality Restaurant 1,000 sf 91.10
Blend ITE 9th & FL
Studies 3.14 3.64 FL Studies 77% FL Studies 92.95 $33,356 $456 $7,124 $26,232
932 High‐Turnover Restaurant 1,000 sf 117.00
Blend ITE 9th & FL
Studies 3.17 3.67 FL Studies 71% FL Studies 111.13 $39,878 $544 $8,498 $31,380
934 Fast Food Rest. w/Drive‐Thru 1,000 sf 511.00
Blend ITE 9th & FL
Studies 2.05 2.55 FL Studies 58% FL Studies 256.40 $92,010 $1,350 $21,090 $70,920
940 Bread/Donut/Bagel Shop w/Drive‐Thru 1,000 sf 189.90 ITE 9th Edition 2.29 2.79
Same as LUC 820
(100k or less) 62%
Same as LUC 820
(100k or less) 113.78 $40,831 $587 $9,170 $31,661
944/
946 Gasoline/Service Station with or w/o Car Wash fuel pos. 157.33
ITE 9th Edition
(944 & 946 Blend) 1.90 2.40 FL Studies 23% FL Studies 29.01 $10,412 $155 $2,421 $7,991
947 Self‐Service Car Wash service bay 43.94
Blend ITE 9th & FL
Studies 2.18 2.68 FL Studies 68% FL Studies 27.49 $9,864 $143 $2,234 $7,630
n/a Convenience/Gasoline/Fast Food 1,000 sf 984.59 FL Studies 2.65 3.15 FL Studies 32% FL Studies 352.34 $126,440 $1,772 $27,682 $98,758
INDUSTRIAL:
110 General Light Industrial 1,000 sf 6.97 ITE 9th Edition 5.15 5.65 Same as LUC 710 92% Same as LUC 710 13.94 $5,001 $65 $1,015 $3,986
120 General Heavy Industrial 1,000 sf 1.50 ITE 9th Edition 5.15 5.65 Same as LUC 710 92% Same as LUC 710 3.00 $1,076 $14 $219 $857
140 Manufacturing 1,000 sf 3.82 ITE 9th Edition 5.15 5.65 Same as LUC 710 92% Same as LUC 710 7.64 $2,741 $35 $547 $2,194
150 Warehousing 1,000 sf 3.56 ITE 9th Edition 5.15 5.65 Same as LUC 710 92% Same as LUC 710 7.12 $2,554 $33 $516 $2,038
151 Mini‐Warehouse 1,000 sf 2.15
Blend ITE 9th & FL
Studies 3.10 3.60 FL Schedules 92% Same as LUC 710 2.59 $929 $13 $203 $726

Charlotte County | Transportation Impact Fee Study
Tindale‐Oliver & Associates, Inc. Charlotte County September 2013 D‐4 Transportation Impact Fee Study
Table D‐2 Calculated Transportation Impact Fee Schedule (Scenario 2 – With Sales Tax Revenues)
Gasoline Tax Unit Construction Cost: $3,770,860 Interstate/Toll Facility Adjustment Factor: 15.6%
$$ per gallon to capital: $0.229 Capacity per lane mile: 10,508 Cost per VMC: $358.86
Facility life (years): 25 County Revenues: $0.168 Fuel Efficiency: 18.19 mpg
Interest rate: 4.0% State Revenues: $0.061 Effectivedays per year: 365
ITE
LUCLand Use Unit Trip Rate Trip Rate Source
Assessable
Trip Length
Total Trip
LengthTrip Length Source % New Trips
% New Trips
SourceNet VMT(1)
Total Impact
Cost
Annual
Gas Tax
Gas Tax
Credit
Net Impact
Fee
RESIDENTIAL:
210 Single Family (Detached) du 7.81
FL Studies (NHTS,
AHS, Census) 6.62 7.12 FL Studies 100% N/A 21.82 $7,830 $128 $2,000 $5,830
220 Multi‐Family (Apartment) du 6.60
Blend ITE 9th & FL
Studies 5.10 5.60
FL Studies
(LUC 220/230) 100% N/A 14.20 $5,097 $85 $1,328 $3,769
230 Condo/Townhouse (Attached Housing Unit) du 5.76
Blend ITE 9th & FL
Studies 5.10 5.60
FL Studies
(LUC 220/230) 100% N/A 12.40 $4,449 $74 $1,156 $3,293
240 Mobile Home Park du 4.17 Florida Studies 4.60 5.10 FL Studies 100% N/A 8.09 $2,905 $49 $765 $2,140
253 Congregate Care Facility du 2.25
Blend ITE 9th & FL
Studies 3.08 3.58 FL Studies 72% FL Studies 2.11 $756 $13 $203 $553
LODGING:
310 Hotel room 6.36
Blend ITE 9th & FL
Studies 6.26 6.76 FL Studies 66% FL Studies 11.09 $3,979 $65 $1,015 $2,964
320 Motel room 5.63 ITE 9th Edition 4.34 4.84 FL Studies 77% FL Studies 7.94 $2,849 $48 $750 $2,099
RECREATION:
416 RV Park(2) site 1.62 ITE 9th Edition 4.60 5.10 Same as LUC 240 100% FL Schedules 3.14 $1,129 $19 $297 $832
420 Marina boat berth 2.96 ITE 9th Edition 6.62 7.12 Same as LUC 210 90% FL Schedules 7.44 $2,671 $44 $687 $1,984
430 Golf Course hole 35.74 ITE 9th Edition 6.62 7.12 Same as LUC 210 90% FL Schedules 89.86 $32,247 $526 $8,217 $24,030
444 Movie Theater w/Matinee 1,000 sf 106.63
Blend ITE 6th & FL
Studies 2.22 2.72 FL Studies 88% FL Studies 87.91 $31,546 $586 $9,155 $22,391
492 Health/Fitness Club 1,000 sf 32.93 ITE 9th Edition 5.15 5.65 Same as LUC 710 94% FL Studies 67.27 $24,141 $402 $6,280 $17,861
INSTITUTIONS:
520 Elementary School (Private) student 1.29 ITE 9th Edition 4.30 4.80 FL Schedules 80% FL Schedules 1.87 $672 $11 $172 $500
522 Middle School (Private) student 1.62 ITE 9th Edition 4.30 4.80 FL Schedules 90% FL Schedules 2.65 $949 $16 $250 $699
530 High School (Private) student 1.71 ITE 9th Edition 4.30 4.80 FL Schedules 90% FL Schedules 2.79 $1,002 $17 $266 $736
540
University/Junior College (7,500 or fewer students)
(Private) student 2.00
ITE Regression
Analysis 6.62 7.12 Same as LUC 210 90% FL Schedules 5.03 $1,805 $29 $453 $1,352
550
University/Junior College (more than 7,500
students) (Private) student 1.50
ITE Regression
Analysis 6.62 7.12 Same as LUC 210 90% FL Schedules 3.77 $1,353 $22 $344 $1,009

Charlotte County | Transportation Impact Fee Study
Tindale‐Oliver & Associates, Inc. Charlotte County September 2013 D‐5 Transportation Impact Fee Study
Table D‐2 (continued) Calculated Transportation Impact Fee Schedule (Scenario 2 – With Sales Tax Revenues)
ITE
LUCLand Use Unit Trip Rate Trip Rate Source
Assessable
Trip Length
Total Trip
LengthTrip Length Source % New Trips
% New Trips
SourceNet VMT(1)
Total Impact
Cost
Annual
Gas Tax
Gas Tax
Credit
Net Impact
Fee
INSTITUTIONS:
560 Church 1,000 sf 9.11 ITE 9th Edition 3.90 4.40 FL Schedules 90% FL Schedules 13.49 $4,842 $83 $1,297 $3,545
565 Day Care 1,000 sf 71.88
Blend ITE 9th & FL
Studies 2.03 2.53 FL Studies 73% FL Studies 44.95 $16,131 $305 $4,765 $11,366
610 Hospital 1,000 sf 13.22 ITE 9th Edition 6.62 7.12 Same as LUC 210 77% FL Schedules 28.44 $10,205 $167 $2,609 $7,596
620 Nursing Home 1,000 sf 7.60 ITE 9th Edition 2.59 3.09 FL Studies 89% FL Studies 7.39 $2,653 $48 $750 $1,903
OFFICE:
General Office 100,000 sf or less(3) 1,000 sf 13.13 ITE 9th equation 5.15 5.65 FL Studies 92% FL Studies 26.25 $9,421 $157 $2,453 $6,968
General Office 100,001‐200,000 sf(3) 1,000 sf 11.12 ITE 9th equation 5.15 5.65 FL Studies 92% FL Studies 22.23 $7,979 $133 $2,078 $5,901
General Office 200,001‐400,000 sf(3) 1,000 sf 9.41 ITE 9th equation 5.15 5.65 FL Studies 92% FL Studies 18.81 $6,752 $112 $1,750 $5,002
General Office greater than 400,000 sf(3) 1,000 sf 8.54 ITE 9th equation 5.15 5.65 FL Studies 92% FL Studies 17.08 $6,128 $102 $1,593 $4,535
Medical Office/Clinic 10,000 sf or less 1,000 sf 23.83 FL Studies 3.63 4.13 Local Studies 84% Local Studies 30.66 $11,004 $190 $2,968 $8,036
Medical Office/Clinic greater than 10,000 sf 1,000 sf 36.35
Blend ITE 9th & Local
Studies 3.63 4.13 Local Studies 84% Local Studies 46.77 $16,785 $290 $4,530 $12,255
RETAIL:
Retail 100,000 sfgla or less(3) 1,000 sfgla 67.91 ITE 9th equation 2.29 2.79 FL Curve 62% FL Curve 40.69 $14,601 $270 $4,218 $10,383
Retail 100,001‐200,000 sfgla(3) 1,000 sfgla 53.28 ITE 9th equation 2.40 2.90 FL Curve 67% FL Curve 36.15 $12,974 $238 $3,718 $9,256
Retail 200,001‐400,000 sfgla(3) 1,000 sfgla 41.80 ITE 9th equation 2.64 3.14 FL Curve 73% FL Curve 34.00 $12,199 $220 $3,437 $8,762
Retail greater than 400,000 sfgla(3) 1,000 sfgla 36.27 ITE 9th equation 2.87 3.37 FL Curve 76% FL Curve 33.39 $11,981 $213 $3,328 $8,653
841 New/Used Auto Sales 1,000 sf 27.12
Blend ITE 9th & FL
Studies 4.60 5.10 FL Studies 79% FL Studies 41.59 $14,925 $251 $3,921 $11,004
849 Tire Superstore service bay 30.55 ITE 9th Edition 4.60 5.10 Same as LUC 841 79% Same as LUC 841 46.85 $16,812 $283 $4,421 $12,391
850 Supermarket 1,000 sf 103.38
Blend ITE 9th & FL
Studies 2.08 2.58 FL Studies 56% FL Studies 50.82 $18,236 $343 $5,358 $12,878
851 Convenience Market (24 hour) 1,000 sf 719.18
Blend ITE 9th & FL
Studies 1.52 2.02 FL Studies 41% FL Studies 189.14 $67,873 $1,368 $21,371 $46,502
853 Convenience Market w/Gas Pumps 1,000 sf 775.14
Blend ITE 9th & FL
Studies 1.51 2.01 FL Studies 28% FL Studies 138.30 $49,630 $1,002 $15,653 $33,977
862 Home Improvement Superstore 1,000 sf 30.74 ITE 9th Edition 2.40 2.90
Same as LUC 820
(100‐200k) 67%
Same as LUC 820
(100‐200k) 20.86 $7,486 $137 $2,140 $5,346
710
720
820

Charlotte County | Transportation Impact Fee Study
Tindale‐Oliver & Associates, Inc. Charlotte County September 2013 D‐6 Transportation Impact Fee Study
Table D‐2 (continued) Calculated Transportation Impact Fee Schedule (Scenario 2 – With Sales Tax Revenues)
(1) Net VMT is calculated as ((Trip Generation Rate* Trip Length* % New Trips)*(1‐Interstate/Toll Facility Adjustment Factor)/2). This reflects the unit of vehicle miles of capacity consumed per unit of development and is multiplied by the cost per vehicle (2) The ITE 9th Edition trip generation rate was adjusted to reflect an average occupancy rate of 60 percent based on data provided by the Florida Association of Parks and Campgrounds (3) The trip generation rate recommended for the office and shopping center land uses use the end‐point regression value
ITE
LUCLand Use Unit Trip Rate Trip Rate Source
Assessable
Trip Length
Total Trip
LengthTrip Length Source % New Trips
% New Trips
SourceNet VMT(1)
Total Impact
Cost
Annual
Gas Tax
Gas Tax
Credit
Net Impact
Fee
Current
Impact Fee
%
Change
RETAIL:
880/
881 Pharmacy/Drug Store with or w/o Drive‐Thru 1,000 sf 95.96
Blend ITE 9th & FL
Studies 2.08 2.58 FL Studies 32% FL Studies 26.95 $9,672 $182 $2,843 $6,829 $1,345 408%
890 Furniture Store 1,000 sf 5.06 ITE 9th Edition 4.05 4.55 FL Studies 78% FL Studies 6.75 $2,421 $41 $641 $1,780 ‐ ‐
911 Bank/Savings Walk‐In 1,000 sf 121.30 ITE 9th Edition 2.46 2.96 Same as LUC 912 46% Same as LUC 912 57.93 $20,787 $379 $5,921 $14,866 $4,554 226%
912 Bank/Savings Drive‐In 1,000 sf 159.34
Blend ITE 9th & FL
Studies 2.46 2.96 FL Studies 46% FL Studies 76.09 $27,306 $498 $7,780 $19,526 $2,993 552%
931 Quality Restaurant 1,000 sf 91.10
Blend ITE 9th & FL
Studies 3.14 3.64 FL Studies 77% FL Studies 92.95 $33,356 $587 $9,170 $24,186 $3,295 634%
932 High‐Turnover Restaurant 1,000 sf 117.00
Blend ITE 9th & FL
Studies 3.17 3.67 FL Studies 71% FL Studies 111.13 $39,878 $700 $10,935 $28,943 $5,822 397%
934 Fast Food Rest. w/Drive‐Thru 1,000 sf 511.00
Blend ITE 9th & FL
Studies 2.05 2.55 FL Studies 58% FL Studies 256.40 $92,010 $1,736 $27,120 $64,890 $3,789 1613%
940 Bread/Donut/Bagel Shop w/Drive‐Thru 1,000 sf 189.90 ITE 9th Edition 2.29 2.79
Same as LUC 820
(100k or less) 62%
Same as LUC 820
(100k or less) 113.78 $40,831 $755 $11,795 $29,036 $2,152 1249%
944/
946 Gasoline/Service Station with or w/o Car Wash fuel pos. 157.33
ITE 9th Edition
(944 & 946 Blend) 1.90 2.40 FL Studies 23% FL Studies 29.01 $10,412 $200 $3,124 $7,288 $774 842%
947 Self‐Service Car Wash service bay 43.94
Blend ITE 9th & FL
Studies 2.18 2.68 FL Studies 68% FL Studies 27.49 $9,864 $184 $2,874 $6,990 ‐ ‐
n/a Convenience/Gasoline/Fast Food 1,000 sf 984.59 FL Studies 2.65 3.15 FL Studies 32% FL Studies 352.34 $126,440 $2,280 $35,618 $90,822 ‐ ‐
INDUSTRIAL:
110 General Light Industrial 1,000 sf 6.97 ITE 9th Edition 5.15 5.65 Same as LUC 710 92% Same as LUC 710 13.94 $5,001 $83 $1,297 $3,704 $1,190 211%
120 General Heavy Industrial 1,000 sf 1.50 ITE 9th Edition 5.15 5.65 Same as LUC 710 92% Same as LUC 710 3.00 $1,076 $18 $281 $795 ‐ ‐
140 Manufacturing 1,000 sf 3.82 ITE 9th Edition 5.15 5.65 Same as LUC 710 92% Same as LUC 710 7.64 $2,741 $46 $719 $2,022 ‐ ‐
150 Warehousing 1,000 sf 3.56 ITE 9th Edition 5.15 5.65 Same as LUC 710 92% Same as LUC 710 7.12 $2,554 $43 $672 $1,882 $847 122%
151 Mini‐Warehouse 1,000 sf 2.15
Blend ITE 9th & FL
Studies 3.10 3.60 FL Schedules 92% Same as LUC 710 2.59 $929 $16 $250 $679 $364 87%

Charlotte County | Transportation Impact Fee Study
Tindale‐Oliver & Associates, Inc. Charlotte County September 2013 D‐7 Transportation Impact Fee Study
Table D‐3 Calculated Rate vs. Adopted Rate (Scenario 1 ‐‐ No Sales Tax Revenues Available )
*The current impact fee rate for drive‐in bank is charged “per lane”
ITE LUC Land Use Unit
Net Impact
Fee
(Scenario 1)
Current
Impact Fee
(Urban)
Current
Impact Fee
(Rural 1)
Current
Impact Fee
(Rural 2)
% Change
(Sc. 1 to
Urban)
% Change
(Sc. 1 to
Rural 1)
% Change
(Sc. 1 to
Rural 2)
RESIDENTIAL:
210 Single Family (Detached) du $6,283 $1,845 $9,509 $8,779 241% ‐34% ‐28%
220 Multi‐Family (Apartment) du $4,066 $1,296 $6,671 $6,166 214% ‐39% ‐34%
230 Condo/Townhouse (Attached Housing Unit) du $3,543 $1,130 $5,824 $5,370 214% ‐39% ‐34%
240 Mobile Home Park du $2,311 $961 $4,958 $4,574 140% ‐53% ‐49%
253 Congregate Care Facility du $600 ‐ ‐ ‐ n/a n/a n/a
LODGING:
310 Hotel room $3,182 $1,284 $7,793 $7,193 148% ‐59% ‐56%
320 Motel room $2,271 $1,284 $7,793 $7,193 77% ‐71% ‐68%
RECREATION:
416 RV Park(2) site $895 ‐ ‐ ‐ n/a n/a n/a
420 Marina boat berth $2,140 ‐ ‐ ‐ n/a n/a n/a
430 Golf Course hole $25,858 ‐ ‐ ‐ n/a n/a n/a
444 Movie Theater w/Matinee 1,000 sf $24,422 $2,182 $13,215 $12,205 1019% 85% 100%
492 Health/Fitness Club 1,000 sf $19,267 ‐ ‐ ‐ n/a n/a n/a
INSTITUTIONS:
520 Elementary School (Private) student $531 ‐ ‐ ‐ n/a n/a n/a
522 Middle School (Private) student $762 ‐ ‐ ‐ n/a n/a n/a
530 High School (Private) student $799 ‐ ‐ ‐ n/a n/a n/a
540 Univ./Jr. College (7,500 or fewer students) (Private) student $1,446 ‐ ‐ ‐ n/a n/a n/a
550 Univ./Jr. College (more than 7,500 students) (Private) student $1,087 ‐ ‐ ‐ n/a n/a n/a
560 Church 1,000 sf $3,842 $547 $3,323 $3,066 602% 16% 25%
565 Day Care 1,000 sf $12,429 $936 $5,666 $5,230 1228% 119% 138%
610 Hospital 1,000 sf $8,190 $1,227 $7,442 $6,874 567% 10% 19%
620 Nursing Home 1,000 sf $2,075 $426 $2,587 $2,390 387% ‐20% ‐13%
OFFICE:
General Office 100,000 sf or less 1,000 sf $7,515 $619 $3,736 $3,448 1114% 101% 118%
General Office 100,001‐200,000 sf 1,000 sf $6,370 $661 $3,995 $3,688 864% 59% 73%
General Office 200,001‐400,000 sf 1,000 sf $5,393 $843 $5,100 $4,716 540% 6% 14%
General Office greater than 400,000 sf 1,000 sf $4,894 $997 $6,040 $5,578 391% ‐19% ‐12%
Medical Office/Clinic 10,000 sf or less 1,000 sf $8,692 $1,892 $11,475 $10,598 359% ‐24% ‐18%
Medical Office/Clinic greater than 10,000 sf 1,000 sf $13,270 $1,892 $11,475 $10,598 601% 16% 25%
RETAIL:
Retail 100,000 sfgla or less 1,000 sfgla $11,320 $1,159 $7,004 $6,471 877% 62% 75%
Retail 100,001‐200,000 sfgla 1,000 sfgla $10,084 $2,303 $13,953 $12,896 338% ‐28% ‐22%
Retail 200,001‐400,000 sfgla 1,000 sfgla $9,528 $2,952 $17,878 $16,515 223% ‐47% ‐42%
Retail greater than 400,000 sfgla 1,000 sfgla $9,388 $3,653 $22,133 $20,441 157% ‐58% ‐54%
841 New/Used Auto Sales 1,000 sf $11,879 $3,815 $23,115 $21,350 211% ‐49% ‐44%
849 Tire Superstore service bay $13,375 ‐ ‐ ‐ n/a n/a n/a
850 Supermarket 1,000 sf $14,065 ‐ ‐ ‐ n/a n/a n/a
851 Convenience Market (24 hour) 1,000 sf $51,251 $3,379 $20,464 $18,906 1417% 150% 171%
853 Convenience Market w/Gas Pumps 1,000 sf $37,460 $3,379 $20,464 $18,906 1009% 83% 98%
862 Home Improvement Superstore 1,000 sf $5,814 ‐ ‐ ‐ n/a n/a n/a
880/881 Pharmacy/Drug Store with or w/o Drive‐Thru 1,000 sf $7,469 $1,345 $8,149 $7,527 455% ‐8% ‐1%
890 Furniture Store 1,000 sf $1,921 ‐ ‐ ‐ n/a n/a n/a
911 Bank/Savings Walk‐In 1,000 sf $16,178 $4,554 $27,612 $25,501 255% ‐41% ‐37%
912 Bank/Savings Drive‐In* 1,000 sf $21,260 $2,993 $18,140 $16,751 610% 17% 27%
931 Quality Restaurant 1,000 sf $26,232 $3,295 $19,955 $18,433 696% 31% 42%
932 High‐Turnover Restaurant 1,000 sf $31,380 $5,822 $35,260 $32,573 439% ‐11% ‐4%
934 Fast Food Rest. w/Drive‐Thru 1,000 sf $70,920 $3,789 $22,930 $21,183 1772% 209% 235%
940 Bread/Donut/Bagel Shop w/Drive‐Thru 1,000 sf $31,661 $2,152 $13,016 $12,023 1371% 143% 163%
944/946 Gasoline/Service Station with or w/o Car Wash fuel pos. $7,991 $774 $4,675 $4,319 932% 71% 85%
947 Self‐Service Car Wash service bay $7,630 ‐ ‐ ‐ n/a n/a n/a
n/a Convenience/Gasoline/Fast Food 1,000 sf $98,758 ‐ ‐ ‐ n/a n/a n/a
INDUSTRIAL:
110 General Light Industrial 1,000 sf $3,986 $1,190 $7,033 $6,489 235% ‐43% ‐39%
120 General Heavy Industrial 1,000 sf $857 ‐ ‐ ‐ n/a n/a n/a
140 Manufacturing 1,000 sf $2,194 ‐ ‐ ‐ n/a n/a n/a
150 Warehousing 1,000 sf $2,038 $847 $4,992 $4,615 141% ‐59% ‐56%
151 Mini‐Warehouse 1,000 sf $726 $364 $1,861 $1,720 99% ‐61% ‐58%
710
720
820

Charlotte County | Transportation Impact Fee Study
Tindale‐Oliver & Associates, Inc. Charlotte County September 2013 D‐8 Transportation Impact Fee Study
Table D‐4 Calculated Rate vs. Adopted Rate (Scenario 2 – With Sales Tax Revenues)
*The current impact fee rate for drive‐in bank is charged “per lane”
ITE LUC Land Use Unit
Net Impact
Fee
(Scenario 2)
Current
Impact Fee
(Urban)
Current
Impact Fee
(Rural 1)
Current
Impact Fee
(Rural 2)
% Change
(Sc. 2 to
Urban)
% Change
(Sc. 2 to
Rural 1)
% Change
(Sc. 2 to
Rural 2)
RESIDENTIAL:
210 Single Family (Detached) du $5,830 $1,845 $9,509 $8,779 216% ‐39% ‐34%
220 Multi‐Family (Apartment) du $3,769 $1,296 $6,671 $6,166 191% ‐44% ‐39%
230 Condo/Townhouse (Attached Housing Unit) du $3,293 $1,130 $5,824 $5,370 191% ‐43% ‐39%
240 Mobile Home Park du $2,140 $961 $4,958 $4,574 123% ‐57% ‐53%
253 Congregate Care Facility du $553 ‐ ‐ ‐ n/a n/a n/a
LODGING:
310 Hotel room $2,964 $1,284 $7,793 $7,193 131% ‐62% ‐59%
320 Motel room $2,099 $1,284 $7,793 $7,193 63% ‐73% ‐71%
RECREATION:
416 RV Park(2) site $832 ‐ ‐ ‐ n/a n/a n/a
420 Marina boat berth $1,984 ‐ ‐ ‐ n/a n/a n/a
430 Golf Course hole $24,030 ‐ ‐ ‐ n/a n/a n/a
444 Movie Theater w/Matinee 1,000 sf $22,391 $2,182 $13,215 $12,205 926% 69% 83%
492 Health/Fitness Club 1,000 sf $17,861 ‐ ‐ ‐ n/a n/a n/a
INSTITUTIONS:
520 Elementary School (Private) student $500 ‐ ‐ ‐ n/a n/a n/a
522 Middle School (Private) student $699 ‐ ‐ ‐ n/a n/a n/a
530 High School (Private) student $736 ‐ ‐ ‐ n/a n/a n/a
540 Univ./Jr. College (7,500 or fewer students) (Private) student $1,352 ‐ ‐ ‐ n/a n/a n/a
550 Univ./Jr. College (more than 7,500 students) (Private) student $1,009 ‐ ‐ ‐ n/a n/a n/a
560 Church 1,000 sf $3,545 $547 $3,323 $3,066 548% 7% 16%
565 Day Care 1,000 sf $11,366 $936 $5,666 $5,230 1114% 101% 117%
610 Hospital 1,000 sf $7,596 $1,227 $7,442 $6,874 519% 2% 11%
620 Nursing Home 1,000 sf $1,903 $426 $2,587 $2,390 347% ‐26% ‐20%
OFFICE:
General Office 100,000 sf or less 1,000 sf $6,968 $619 $3,736 $3,448 1026% 87% 102%
General Office 100,001‐200,000 sf 1,000 sf $5,901 $661 $3,995 $3,688 793% 48% 60%
General Office 200,001‐400,000 sf 1,000 sf $5,002 $843 $5,100 $4,716 493% ‐2% 6%
General Office greater than 400,000 sf 1,000 sf $4,535 $997 $6,040 $5,578 355% ‐25% ‐19%
Medical Office/Clinic 10,000 sf or less 1,000 sf $8,036 $1,892 $11,475 $10,598 325% ‐30% ‐24%
Medical Office/Clinic greater than 10,000 sf 1,000 sf $12,255 $1,892 $11,475 $10,598 548% 7% 16%
RETAIL:
Retail 100,000 sfgla or less 1,000 sfgla $10,383 $1,159 $7,004 $6,471 796% 48% 60%
Retail 100,001‐200,000 sfgla 1,000 sfgla $9,256 $2,303 $13,953 $12,896 302% ‐34% ‐28%
Retail 200,001‐400,000 sfgla 1,000 sfgla $8,762 $2,952 $17,878 $16,515 197% ‐51% ‐47%
Retail greater than 400,000 sfgla 1,000 sfgla $8,653 $3,653 $22,133 $20,441 137% ‐61% ‐58%
841 New/Used Auto Sales 1,000 sf $11,004 $3,815 $23,115 $21,350 188% ‐52% ‐48%
849 Tire Superstore service bay $12,391 ‐ ‐ ‐ n/a n/a n/a
850 Supermarket 1,000 sf $12,878 ‐ ‐ ‐ n/a n/a n/a
851 Convenience Market (24 hour) 1,000 sf $46,502 $3,379 $20,464 $18,906 1276% 127% 146%
853 Convenience Market w/Gas Pumps 1,000 sf $33,977 $3,379 $20,464 $18,906 906% 66% 80%
862 Home Improvement Superstore 1,000 sf $5,346 ‐ ‐ ‐ n/a n/a n/a
880/881 Pharmacy/Drug Store with or w/o Drive‐Thru 1,000 sf $6,829 $1,345 $8,149 $7,527 408% ‐16% ‐9%
890 Furniture Store 1,000 sf $1,780 ‐ ‐ ‐ n/a n/a n/a
911 Bank/Savings Walk‐In 1,000 sf $14,866 $4,554 $27,612 $25,501 226% ‐46% ‐42%
912 Bank/Savings Drive‐In* 1,000 sf $19,526 $2,993 $18,140 $16,751 552% 8% 17%
931 Quality Restaurant 1,000 sf $24,186 $3,295 $19,955 $18,433 634% 21% 31%
932 High‐Turnover Restaurant 1,000 sf $28,943 $5,822 $35,260 $32,573 397% ‐18% ‐11%
934 Fast Food Rest. w/Drive‐Thru 1,000 sf $64,890 $3,789 $22,930 $21,183 1613% 183% 206%
940 Bread/Donut/Bagel Shop w/Drive‐Thru 1,000 sf $29,036 $2,152 $13,016 $12,023 1249% 123% 142%
944/946 Gasoline/Service Station with or w/o Car Wash fuel pos. $7,288 $774 $4,675 $4,319 842% 56% 69%
947 Self‐Service Car Wash service bay $6,990 ‐ ‐ ‐ n/a n/a n/a
n/a Convenience/Gasoline/Fast Food 1,000 sf $90,822 ‐ ‐ ‐ n/a n/a n/a
INDUSTRIAL:
110 General Light Industrial 1,000 sf $3,704 $1,190 $7,033 $6,489 211% ‐47% ‐43%
120 General Heavy Industrial 1,000 sf $795 ‐ ‐ ‐ n/a n/a n/a
140 Manufacturing 1,000 sf $2,022 ‐ ‐ ‐ n/a n/a n/a
150 Warehousing 1,000 sf $1,882 $847 $4,992 $4,615 122% ‐62% ‐59%
151 Mini‐Warehouse 1,000 sf $679 $364 $1,861 $1,720 87% ‐64% ‐61%
710
720
820