charitable giving and tax policy: a historical and
TRANSCRIPT

Charitable giving and tax policy:a historical and comparative perspective
Conference Volume
CEPR conference
May 2012
Paris School of Economics
Editors
Gabrielle Fack and Camille Landais
Organized by CEPR / CEPREMAP
Sponsored by CEPREMAP

Acknowledgements
This volume gathers contributions presented at a conference on Altruism and Charita-
ble Giving jointly organized in May 2012 by the Center for Economic Research and its
Applications (CEPREMAP), and the Public Policy group of the Centre for Economic
Policy Research (CEPR). The conference was hosted by Paris School of Economics and
sponsored by Cepremap. The motivation of the conference was to provide a forum for
high-quality work in all areas related to the economics of altruism and charitable giving.
The editors would like to thank the authors of the individual chapters, for their con-
tributions and collaborative approach towards developing the papers. They would also
like to thank Thomas Piketty and Emmanuel Saez, co-organizers of the event, and Daniel
Cohen, director of CEPREMAP. We also thank all the participants to the conference for
their helpful comments and suggestions. We are also very grateful to those who have been
involved in the organisation of the event, in particular Catherine Bluchetin and Patricia
Guezo at CEPREMAP, Nadine Clarke at CEPR and Sylvain Riffe-Stern at PSE. The
views expressed in this volume are those of the authors and do not necessarily represent
the views of CEPREMAP, CEPR or PSE, or of the authors’ affiliated organisations.
i

Contents
Acknowledgements i
1 Introduction
Gabrielle Fack & Camille Landais 1
1.1 A rich history of tax policies . . . . . . . . . . . . . . . . . . . . . . . . . . 2
1.2 What can we learn from tax data? . . . . . . . . . . . . . . . . . . . . . . 8
1.3 Behavioral responses to tax policies . . . . . . . . . . . . . . . . . . . . . . 13
1.4 Welfare and policy implications . . . . . . . . . . . . . . . . . . . . . . . . 14
1.5 Organization of the volume . . . . . . . . . . . . . . . . . . . . . . . . . . 17
2 Charitable giving and economics
Anthony B. Atkinson 21
2.1 Introduction . . . . . . . . . . . . . . . . . . . . . . . . . . . . . . . . . . . 21
2.2 The motives for giving . . . . . . . . . . . . . . . . . . . . . . . . . . . . . 23
2.3 Lifetime giving and charitable bequests . . . . . . . . . . . . . . . . . . . . 26
2.4 The welfare economics of giving . . . . . . . . . . . . . . . . . . . . . . . . 29
3 Charitable Giving and Tax Policy in the U.S.
Charles T. Clotfelter 34
3.1 American Exceptionalism, the Social Contract, and Charitable Giving . . . 35
3.2 The Basics of the US Income Tax Policy . . . . . . . . . . . . . . . . . . . 40
3.3 The Outsized Role of the Rich . . . . . . . . . . . . . . . . . . . . . . . . . 44
3.4 Ongoing Issues in U.S. Tax Policy and Charitable Giving . . . . . . . . . . 49
3.5 Conclusion . . . . . . . . . . . . . . . . . . . . . . . . . . . . . . . . . . . . 51
4 Philanthropy, Tax Policy and Tax Cheating: A Long Run Perspective
on US data
Gabrielle Fack & Camille Landais 63
ii

4.1 Introduction . . . . . . . . . . . . . . . . . . . . . . . . . . . . . . . . . . . 63
4.2 The long run of charitable contributions by the very wealthy . . . . . . . . 66
4.2.1 Elasticity of reported contributions: long-term perspective . . . . . 66
4.3 Charitable giving policy in the presence of tax cheating . . . . . . . . . . . 72
4.3.1 A model of optimal subsidy in the presence of tax cheating . . . . . 72
4.3.2 A natural experiment on tax enforcement . . . . . . . . . . . . . . . 81
5 Charitable donations and tax relief in the UK
Kimberley Scharf & Sarah Smith 120
5.1 Introduction . . . . . . . . . . . . . . . . . . . . . . . . . . . . . . . . . . . 120
5.2 Tax relief on giving . . . . . . . . . . . . . . . . . . . . . . . . . . . . . . . 122
5.3 Framework for considering the effects of match and rebate . . . . . . . . . 125
5.4 Survey evidence on match and rebate . . . . . . . . . . . . . . . . . . . . . 129
5.5 Results . . . . . . . . . . . . . . . . . . . . . . . . . . . . . . . . . . . . . . 133
5.6 Heterogeneity of responses across donors . . . . . . . . . . . . . . . . . . . 135
5.7 Conclusions and policy implications . . . . . . . . . . . . . . . . . . . . . . 138
1 Introduction
Gabrielle Fack & Camille Landais
Even though the level of private philanthropy seems to differ widely across countries, there
is still little robust quantitative evidence regarding the differentials in private charitable
giving across countries and more importantly very little consensus on why these differen-
tials may exist. Moreover, in the past couple of decades, these differentials in the level of
private contributions to charitable organisations have become a central matter of public
policy. Because private charitable contributions finance many socially valuable activities
(education, arts,...), many governments have tried to boost private philanthropy through
various active policy interventions, and this temptation of relying on private contribu-
tions to finance the provision of public goods has increased substantially in recent years
as fiscal constraints have become tighter. Despite this renewed interest, there is still very
little practical and relevant policy guidance that policymakers can find in the economics
literature. By providing an original comparative and historical analysis of tax policies
towards private philanthropy across different countries, the essays gathered in this con-
ference volume aim at shedding new light on the determinants of private philanthropy,
and ultimately, wish to provide interesting practical insights for improving tax policies
towards charitable giving.
In this introduction, we would like to emphasize the interest of focusing on tax policies
to study charitable behaviors. Indeed, the advantages of looking at philanthropy through
the lens of tax policies are manyfold. First, the long history of tax policies towards
charitable giving and private philanthropy is extremely rich and informative about the
respective importance of the state and private entities in the provision of public goods.
Large and persistent differences in the way private giving is subsidized across countries
are also key to understand the role of the charitable sector in these countries. The other
great advantage of studying tax policies is the availability of tax data. The existence of
1

Introduction
these special tax treatments for charitable giving has led tax administrations to collect
unique information on philanthropic behaviors in the long run in most countries. This
information has been regularly published with other exhaustive statistics on income distri-
bution and income composition. These tax statistics therefore provide us with interesting
comparative historical information on the level of contributions in the long run. Another
great advantage of studying tax policies is that it represents a great lab to look into the
mechanics of charitable behaviors. The tremendous amount of variations in all dimen-
sions of tax policies (subsidy rate, subsidy mechanism, enforcement policies, direct public
provision of public goods, etc...) across countries and over time, but also within country
and time across seemingly identical individuals, provides us with many opportunities to
identify important behavioural parameters, and test competing models of charitable be-
haviors. Finally, studying tax policies towards philanthropy is interesting because of its
direct practical relevance for policymaking. In most countries, tighter fiscal constraints
have put into question the functioning of tax policies towards private charitable giving,
but there seems to be little consensus as to how to improve these policies. In fact, the
route that goes from positive to normative analysis is far from obvious when it comes to
private philanthropy, but the essays gathered in this volume all aim at making this route
a little easier.
We present in the remainder of this introduction all these insightful aspects of the study
of tax policies towards private giving. By doing so, we aim at providing an overview of the
common themes and a summary of the main findings of all the chapters of the volume.
We also take advantage of this introduction to present some original results from our
own research project, where we gathered historical tax data on charitable contributions
in France, the United States, the United Kingdom, Canada, and Denmark.
1.1 A rich history of tax policies
The comparative history of tax incentives towards private philanthropy reveals important
differences in the way the role and mission of the charitable sector have been perceived by
the general public as well as by the State. It also offers a striking picture of the various
policy tools used over the years and across countries by governments in order to support
and/or control private philanthropy. Actual tax systems bear the vivid memory of this
2
Introduction
long history. We focus primarily on income tax incentives, since almost everywhere they
represent the main tool used by governments to subsidize contributions, but also mention
other tax incentives when and where they exist.
Today, countries still differ significantly with respect to the nature, the rates and
ceiling of their tax incentives for charitable donations. The US system for instance is a
deduction from taxable income which is by essence regressive, and the ceiling is very high
(50% of income). The French system to the contrary is a non-refundable tax credit, with
a very high subsidy rate (66%) and relatively high ceiling. Countries such as the UK
have also introduced more sophisticated schemes such as Gift Aid or payroll giving (see
chapter 5). Countries, and this is an important theme of this volume, also widely differ
in the level of controls and enforcement of their charitable tax incentives: registration of
eligible charities, requirements to qualify as an eligible charity, filing requirements. Tax
enforcement of private contributions is for instance still considerably laxer in the United
States than in many other countries, such as France, that switched to a system very close
to third-party reporting of contributions.
We summarize here the main aspects of this comparative history of tax incentives,
country by country. We focus on countries for which we have collected panel data: we
compare first the legislation of the US and Canada, where tax incentives for charitable
giving were created around WWI. We also talk about the more recent French system, for
which we collected data since the 1970s. Lastly, we evoke briefly current tax incentives
in Danemark.
United States
Tax incentives for charitable giving have existed in the U.S. federal income tax system
since 1917, after a first attempt to enact a deduction for gifts to “religious, charitable,
scientific, or educational” institutions in 1913 had proved unsuccessful. In practice, the
War Revenue Act of 1917 provides a deduction for:
Contributions or gifts actually made within the year to corporations or asso-
ciations organized and operated exclusively for religious, charitable, scientific,
or educational purposes, or to societies for the prevention of cruelty to chil-
dren or animals, no part of the net income of which inures to the benefit of
3
Introduction
any private stockholder or individual, to an amount not in excess of fifteen per
centum (15%) of the taxpayer’s taxable net income as computed without the
benefit of the benefit of the deduction of such contributions.
From then on, the scope and importance of the deduction from taxable income of
charitable donations have increased steadily in the US tax code, under the pressure of
the charitable sector and lobbying of some powerful foundations. But as the deduction
for charitable giving grew in importance, so did concerns about potential abuses and at-
tempts to curb such abuses. In 1924 for instance, the ceiling of the deduction (at 15% of
taxable income) was lifted for very large private contributors, under the condition that
in the taxable year and in each of the 10 preceding exercises the amount of charitable
contributions (plus, for years 1928 and after, the amount of income taxes paid) exceeded
90% of the net income in each such years. But as the practice of claiming deductions for
donations made in the past expanded, a tighter control was introduced in 1938 so that
contributions were effectively only deductible if paid during taxable year.
Interestingly, as the isolationist movement grew bigger in the US at the end of the
1930s, so did the concern that the charitable deduction might be subsidising private con-
tributions to European causes, and from 1938 on, it was enacted that contributions would
be deductible only if paid to or for the use of a domestic organization. In 1954, the 15%
ceiling was also increased up to 30% for specific gifts to churches and hospitals.
As marginal tax rates reached historical peaks in the late 1940s and 1950s creating
a major incentive to donate to charitable causes, reported charitable contributions of
the top .01% of U.S. taxpayers experienced a tremendous surge. The number of new
private foundations also increased significantly during this period. Indeed, foundations
experienced very lax control before 1969, and apart from their tax-exempt status, the
rules regulating their functioning were nearly nonexistent. Moreover, the audit rates of
foundations by the IRS were very low.1 Therefore, family charitable trusts and private
foundations constituted a highly practical vehicle for tax sheltering. Soon, a large num-
ber of abuses were reported in a series of reports commissioned by different committees
appointed by the U.S. Congress or by the U.S. Department of the Treasury. The Cox
Committee Report (1952), the Reece Report (1954), the U.S. Treasury Department report
(1965), and the Peterson Report (1970) all provide numerous detailed accounts of frauds
1Cf. Peterson [1970].
4

Introduction
and abuses. Because of growing public concerns, in 1969, the U.S. Congress passed a
tax reform act, TRA69, to better regulate the use of private foundations by high-income
taxpayers. The provisions of the new tax law included: the prohibition of “self dealing”,
defined as activities that benefit foundation managers, officers, substantial contributors,
and other foundation insiders; stricter tax rules on unrelated business income (UBI); the
establishment of a minimum payout rate as a percentage of investment assets; and the
creation of an excise tax on the investment income of private foundations, with an orig-
inal rate of 4%. Further, while the income ceiling of deductions for public charitable
foundations was increased from 30% to 50%, it stayed at 20% for private non-operating
foundations, with no possibility for carryover.
Since then, many particular rules and tax reform acts (creation of the alternative min-
imum tax, rules pertaining to gifts of appreciated stocks, etc) have affected the subsidies
of different types of charitable contributions. TRA1986 for instance, by substantially re-
ducing the effective marginal tax rates paid by top income taxpayers, has greatly reduced
tax incentives towards charitable contributions. The other important change to be noted
is the 2005 reform of filing requirements of charitable contributions, which tightened the
record-keeping requirements for cash and non-cash contributions. However, despite this
reform, tax enforcement of private contributions is still considerably lax in the United
States compared with all other countries that switched to a system very close to third-
party reporting of contributions. In the US, cash contributions under 250$ are essentially
not monitored.
Overall, the architecture of the income tax deduction has stayed almost unchanged for
the past 30 to 40 years. In recent years, the regressivity of the subsidy rate (top income
taxpayers facing a higher subsidy because of the progressivity of the income tax schedule)
has been criticised, and several proposals have talked about capping the subsidy rate for
top income taxpayers or creating a tax credit in lieu of the deduction from taxable income.
But all these proposals have stalled after the intensive lobbying of the non-profit sector.
Canada
The history of tax incentives for charitable donations in Canada offers an interesting
point of comparison with the US (Watson [1985]). An income tax deduction first appeared
5
Introduction
with the Income War Tax Act in 1917, as Parliament provided unlimited income tax de-
ductions for amounts paid by taxpayers during the year to the Patriotic and Canadian
Red Cross Funds, and other patriotic and war funds approved by the Minister. Interest-
ingly, early on, Parliamentarians gave a lot of attention to the possibility that fraudulent
unregulated charitable entrepreneurs might take advantage of the deduction and the War
Charities Act, which was passed in 1917 both regulated and licensed approved charities.
After the war was over, government quickly withdrew (1920) tax incentives that had
encouraged donations to wartime charities, even though several attempts were made to
revive the tax deduction following the US example.
Eventually, with the outbreak of the Great Depression, a tax deduction of up to 10% of
taxable income was reinstated in 1930 and it was specified that only receipted donations
would be acceptable for tax deduction. In 1939, charity once again became a priority
and the War Charities Act was re-enacted and later replaced by the Income Tax Act (in
1948). Again, tight controls were put in place to curb potential abuses. First, it was
noted that there was no master list of charitable organizations available. Each income
tax district kept its own. Therefore, from 1948 on, it was enacted that charities wishing
to issue receipts for income tax purposes would be required to apply for recognition as
charitable organizations on a prescribed form. Also, to prevent wealthy citizens from set-
ting up charitable foundations from which they themselves expected to benefit, in 1950
the government introduced legislation defining a charitable foundation and requiring such
foundations to disburse 90 per cent of their annual incomes to charity. As discussed below,
our data show that these tighter controls had important effects on the levels of charitable
contributions by top income groups in Canada, compared to the US, were such controls
were not put in place until 1969.
Another important change was the introduction of the optional $100 standard deduc-
tion in 1957, which applied to charitable donations, medical expenses, and union fees.
Because of the relatively tight reporting rules on small gifts (compared to the US), the
standard deduction was more appealing than reporting small contributions so that the
level of charitable donations reported in tax files declined among lower income taxpayers
after 1957, as visible in figure 1.2.
Today, tax incentives have changed to a two-tier tax credit system. The first 200
6

Introduction
Canadian Dollars of donations produces a 15% rate credit. Gifts in excess of 200$ pro-
duce a 29% rate credit, with an annual limit on creditable donations of generally 75% of
net income.
France
France offers an interesting example of a country in which the State has historically
tried to limit the development of trusts and foundations. Even though, a deduction from
taxable income for charitable donations to some specific foundations has existed in the
French Tax code since 19542, its application has been extremely restrictive and the ceiling
was originally set at a very low level (.5% of taxable income). The situation changed in
the beginning of the 1970s, when the role of foundations and of the charitable sector began
to be recognised and the government set out to encourage its development. The ceiling of
the deduction from taxable income was increased, foundations and associations that could
qualify for the deduction were no longer restricted and reported contributions started to
increase steadily. Interestingly, reporting requirements were limited: taxpayers were only
required to keep a receipt of their contributions. This situation changed in 1982 with the
requirement to join to a taxpayer’s tax form a receipt for any claimed charitable deduc-
tion,3 which resulted in a substantial drop in reported contributions as shown in figure 1.2.
In 1989, the deduction from taxable income was transformed in a non-refundable tax
credit, and over the years, both the tax credit rate and the ceiling have been susbtantially
increased in an attempt to boost private philanthropy. Today, the ceiling is set at 20% of
taxable income with a possibility to carry-over donations in excess of the ceiling for the
next 5 years. And the tax credit rate is 66%, making it the most generous tax incentive
for private contributions among developed countries. Note that the French tax system
is also unique in not requiring any registration for charitable organizations to become
eligible for the tax deductible donations: any association that can prove to operate for
some “general interest”, broadly defined, can issue receipts for contributions it receives
from individuals.4 Finally, besides the income tax credit for charitable contributions, the
2Loi no54-817 du 14 aout 1954, article 113Loi 81-1160 art 87.4Note, however, that the creation of foundations is tightly monitored by the State. In order to establish
a public utility foundation, the founder must seek authorisation (reconnaissance d’utilite publique) via adecree issued by the French Ministry of the Interior and the board of the foundation must have at leastone representative of the Ministry.
7
Introduction
government has also created a wealth tax credit of 66%. Charitable gifts are also exempt
from the inheritance tax.
Denmark
Denmark is an interesting case. Historically, there is a very strong direct public pro-
vision of public goods in Denmark, in all areas from poverty relief to higher education,
leaving little room for a large non-profit sector to take care of the provision of public goods
in these areas. But in the past 30 years, Denmark has tried to increase the size and scope
of its non-profit sector, using tax incentives as a way to encourage private giving. These
incentives however have been granted in the context of a very modern tax system with
high enforcement level and tight third party reporting of all claims for tax expenditures.
In particular, small contributions below 500 Kroners (≈ 60 euros) are not eligible for the
charitable giving income tax break. There are today two ways of receiving tax relief in
connection with charitable donations to Danish Non-profit organisations:
• Gifts of over DKK 500: Tax reliefs relating to gifts are calculated annually.
Each individual gift must amount to DKK 500 or more in order to be included in
the annual statement. In 2009 the maximum tax-deductable amount for one donor
was fixed at DKK 14.500.
• Deed of Gift The Deed of Gift is an agreement to donate a specified amount for at
least 10 years. The entire amount is tax-deductible. The tax deduction is limited
to a maximum of 15 percent of the donor’s annual personal income.
1.2 What can we learn from tax data?
The existence of this long history of tax incentives has one direct advantage for researchers:
data availability. The existence of tax incentives induced governments to record informa-
tion on reported charitable contributions, that can now be used to analyze the long run
evolution of private philanthropy across countries.
Until now, comparative statistics on charitable behaviours across countries were usu-
ally drawn from survey data. Survey evidence is interesting, but experience proves that
its reliability for international comparisons can be limited, because of such issues as self-
declaration of contributions, small-sample sizes in most surveys, framing in the questions,
8
Introduction
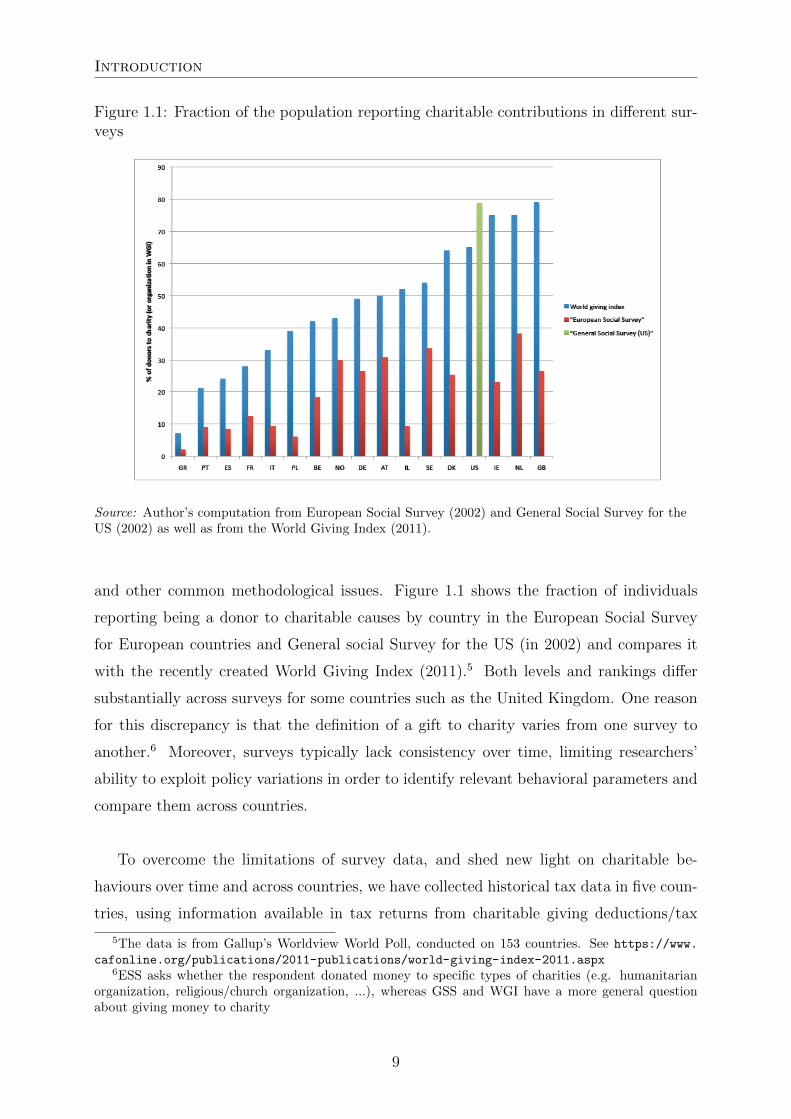
Figure 1.1: Fraction of the population reporting charitable contributions in different sur-veys
Source: Author’s computation from European Social Survey (2002) and General Social Survey for theUS (2002) as well as from the World Giving Index (2011).
and other common methodological issues. Figure 1.1 shows the fraction of individuals
reporting being a donor to charitable causes by country in the European Social Survey
for European countries and General social Survey for the US (in 2002) and compares it
with the recently created World Giving Index (2011).5 Both levels and rankings differ
substantially across surveys for some countries such as the United Kingdom. One reason
for this discrepancy is that the definition of a gift to charity varies from one survey to
another.6 Moreover, surveys typically lack consistency over time, limiting researchers’
ability to exploit policy variations in order to identify relevant behavioral parameters and
compare them across countries.
To overcome the limitations of survey data, and shed new light on charitable be-
haviours over time and across countries, we have collected historical tax data in five coun-
tries, using information available in tax returns from charitable giving deductions/tax
5The data is from Gallup’s Worldview World Poll, conducted on 153 countries. See https://www.
cafonline.org/publications/2011-publications/world-giving-index-2011.aspx6ESS asks whether the respondent donated money to specific types of charities (e.g. humanitarian
organization, religious/church organization, ...), whereas GSS and WGI have a more general questionabout giving money to charity
9

credits. Our data comes from two major types of sources.
First, we used yearly tabulations of income, composition of income and amounts of
deductions/tax credits by income level produced by tax administrations of these five
countries since the creation of the income tax system. This gives us information on total
contributions reported by taxpayers over time. But the fruitful information of these tables
can also serve to extrapolate the level of income, the income composition and the level of
charitable giving for every fractiles of top incomes following methods drafted in Piketty
and Saez [2003] and discussed in Atkinson and Piketty, eds [2007].
The second source of data are microfiles created by tax administration from large (or
even sometimes exhaustive) sample of taxpayers and containing all the information from
individuals’ tax returns. Combining these two types of sources, we have created a unique
dataset on the evolution of charitable giving in Canada, Denmark, France and the United
States. This dataset is the first consistent comparative source on charitable contributions
over the long run across these countries.
There are nevertheless two important limitations of the data that are important to
keep in mind. First, filing and reporting requirements for taxpayers have changed over
time and vary across countries. At the very beginning of the XX-th century for instance,
only a small fraction of the population filed tax returns, so little is known of the income
and charitable donations of individuals who did not file a return. Only since the mid-1940s
did the vast majority of individuals in all five countries systematically file returns. The
reporting requirements for small contributions vary also considerably across countries. In
Denmark for instance, donations under 500 Danish Kroners are not deductible whereas
in the US, individuals can deduct small gifts without joining a receipt to their tax return.
These differences in filing and reporting requirements significantly affect the fraction of
small contributions reported to the tax administration, and therefore have an important
effect on aggregate figures of reported contributions, as shown in figure 1.2. To alleviate
this issue, we focused on top income groups, defined as individuals in the top 10% of tax-
payers with the highest gross income. The advantage of focusing on top income groups is
that filing and reporting rates are always close to 100% for these individuals throughout
the XX-th century, enabling consistent comparisons over time and across countries7.
7Note that some countries enable charitable deduction through the estate tax system as well. Someindividuals may also use corporate income to operate charitable contributions. Our estimates of total

Introduction
Figure 1.2: Reported donations as a fraction of total income for the top10% of taxpayers across countries:
0.5
11.
52
2.5
33.
5D
onat
ions
as
% o
f tot
al in
com
e
1940 1945 1950 1955 1960 1965 1970 1975 1980 1985 1990 1995 2000 2005year
US CanadaFrance Denmark
Sources: authors’ computation from income tax statistics. See text for details.
Figure 1.2, 1.3 and 1.4 summarize the key learnings from tax sources on the long run
evolution of private charitable contributions. First, total reported charitable contributions
as a fraction of total gross income are significantly higher in the US than in all other coun-
tries, and historically, this has always been the case. France and Denmark have aggregate
levels of reported contributions that are around 10 times lower. Canada is an interesting
case: in the 1940s and first half of the 1950s, aggregate levels of reported contributions
in Canada were on par with that of the US, but then declined steadily, and have been
around a third of the US figures since the 1960s. Differences in reporting requirements
and tax enforcement might explain a lot of the evolution of aggregate reported contribu-
tions displayed in figure 1.2. First, the ability to report small contributions differ widely
across countries. Denmark for instance does not allow deduction of contributions below
contributions of top incomes might therefore underestimate total private philanthropy of the very wealthy.However, the tax incentives for charitable donations being almost always higher in the individual incometax system, reported contributions through the individual income tax always dwarf reported contributionsthrough the estate or the corporate income tax.
11

Introduction
500 Kroners. Second, requirements to join the receipts also differ. In France for instance,
joining receipts to one’s tax return was not required before 1983, which explains the huge
drop in charitable contributions between 1982 and 1983. In Canada, the introduction
of a standard deduction and tight controls on small contributions and the operation of
charitable organizations as explained above, explain the decline in aggregate contributions
compared to the US.
When focusing on top income groups, huge differences persist across countries and
over time. In figure 1.3, we plot the evolution of donations as a fraction of total income
(excluding capital gains) for the top 10 to 1%, top 1 to .01% and top .01% of taxpayers
in the US and in Canada. In the mid 1940s, donations of top income groups were almost
similar in both countries, but surged throughout the 1950s in the US, while they declined
in Canada. Today, charitable donations of the top .01% of taxpayers are 2 times higher
in the US than in Canada.
The essays gathered in this volume try to investigate the main sources possibly driving
these huge differentials in giving. An important contribution of our original dataset is to
show that, cultural explanations strict sensu - or more generally, idiosyncratic country-
specific characteristics - even though they may be important in explaining variations
across countries (France vs the US for instance), seem ill-equipped to explain the large
variations over time in Canada or in the US. In this volume, we pay particular attention to
the impact of public policies, and especially tax policies, in explaining these differentials.
We investigate two specific aspects of tax policies: first the generosity of the incentives,
and second the enforcement of these incentives. In figure 1.4, for instance we plot the
evolution of charitable donations by the top .01% of taxpayers in Canada and the US
against the evolution of their effective marginal tax rate (which determines the “price” of
their donations). Interestingly, top effective marginal tax rates were around 20 percentage
points lower in Canada than in the US in the 1950s. Another important feature of tax
policies towards philanthropy that we develop in this volume is enforcement. As noted
earlier, Canada did put in place very early on strict rules concerning the operation of
charitable organisations and their eligibility to the charitable deduction, while rules were
much laxer in the United States.
The chapters in this book investigate more precisely the role of tax incentives on char-
12

Introduction
itable giving, from a normative and a positive perspective.
1.3 Behavioral responses to tax policies
Price elasticities
The positive analysis of the effect of tax incentives focuses on the behavioral responses
to taxation. The most discussed parameter in this literature is the price elasticity of giv-
ing, which measures how taxpayer’s reported charitable contributions change as the “price
of giving” changes due to changes tax incentives: for example, an elasticity of −1 means
that a 1% decline in the tax price leads to a 1% increase in contributions. The respon-
siveness of taxpayers conditions the optimality of such tax incentives and most authors
have focused on the “unit elasticity rule”, which states that tax incentives are efficient if
the price elasticity of giving is equal or larger than one in absolute value. Indeed, in a
simple model where the government’s objective is to maximize charitable contributions,
with an elasticity larger than one in absolute value, the loss of tax revenue generated
by an increase in tax deductions is more than compensated by an increase in charitable
contributions. So far, as discussed in Chapters 3 and 4, the empirical literature trying to
estimate this elasticity has produced mixed results. In Chapter 4, we use our long panel
from the US to provide new estimates of the responsiveness of charitable giving among
the top 10% of taxpayers. The main advantage of our dataset is that it gives us the
opportunity to exploit both large increases and decreases in marginal tax rates for higher
income households over the last century. We do find a long term elasticity lower than one
in absolute value, except for households at the very top of the income distribution, who
appear to be more responsive to tax incentives.
Chapters 4 and 5 however show that despite the importance of the estimation of the
price elasticity of charitable giving in the literature, this single parameter appears to be
insufficient to design optimal tax incentives.
Matching vs rebate
S. Smith and K. Scharf show in chapter 5 that not only the level of the tax incentive
13

Introduction
matters, but also its framing. Behavioral studies provide evidence that individuals re-
spond differently to incentives when they are framed as a match or a rebate. In chapter 5,
S. Smith and K. Scharf hypothesize that some behaviours such as “rational inattention”
might explain this discrepancy and analyze further how this may affect UK tax policy.
The UK tax incentive system, which already has both matching and rebate components,
constitutes an ideal setting to investigate more precisely whether individuals respond dif-
ferently to similar changes in tax incentives when they are framed differently. S. Smith
and K. Scharf indeed show with survey data that individuals tend to be more responsive
to changes in matches, and they discuss how this may impact the optimal tax policy.
Tax cheating
Chapter 4 also points out the limitations of the unit elasticity rule in the presence
of tax cheating. As we already highlighted in our comparison of the existing incentives
among countries, tax enforcement varies a lot across countries. We show in chapter 4 that,
in the presence of tax cheating, the price elasticity of reported contributions is no longer
a sufficient statistic to assess the optimality of tax incentives. In this chapter, we also
unveil the existence of substantial tax evasion carried out through charitable deductions
using a natural experiment on tax enforcement in the US. We finally discuss how optimal
tax policies for charitable contributions can be reassessed in the presence of tax cheating.
1.4 Welfare and policy implications
The essays gathered in this volume also try to inform us about welfare and to improve
our ability to design tax policies. They do so essentially along three dimensions.
First, by asking the question “why do people contribute to public goods?”, which is
the natural starting point of all welfare analysis. Standard analysis has always assumed a
mixture of “warm-glow” and public good motives to explain the important level of char-
itable contributions observed in the data. But as explained by A. Atkinson in chapter 2,
this mixture of motives, although it improves the ability of the model to explain empirical
facts about giving, creates problems when it comes to welfare analysis: when aggregating
people’s preferences, shall the warm glow or other individual motives be incorporated in
14
Introduction
the social welfare function, or is it double-counting, as argued by Diamond [2006]? An-
other complication pointed out in this volume is the presence of “behavioral biases” which
affect the way people’s giving behaviours react to seemingly equivalent subsidy-schemes,
like the rebate vs matching example in the experiment presented by Kim Scharf and Sarah
Smith in chapter 5. These observations show that our understanding of the motivation
behind charitable giving, which should be at the core of the design of optimal tax policies
towards private philanthropy, is still very incomplete.
The second important dimension highlighted in this volume relates to the definition of
what constitutes a public good for the tax administration. As developed by C. Clotfelter
in chapter 3, many contributions eligible for the charitable deduction in the US do indeed
finance goods that are partly public and partly private. This of course creates impor-
tant redistribution issues when it comes to evaluate the welfare impact of the charitable
deduction. And shows how the definition of what constitutes a charitable purpose (and
therefore what types of gifts and of organizations qualify for the charitable deduction) is
even more central to the definition of the optimal tax policy than the level of the incentive
itself.
A final aspect and rather original dimension of this volume is to underline the im-
portance of the level of enforcement of tax policies towards private philanthropy. By
highlighting that a non trivial fraction of reported charitable contributions may be driven
by tax sheltering purposes when enforcement regimes are lax, chapter 4 reminds us that
high price elasticities of giving might be meaningless for welfare analysis when driven by
tax avoidance motives.
15

Figure 1.3: Reported donations as a fraction of total income for top in-come groups in the US and Canada:
A. United States0
.05
.1.1
5.2
.25
Don
atio
ns a
s a
fract
ion
of to
tal i
ncom
e
1915
1920
1925
1930
1935
1940
1945
1950
1955
1960
1965
1970
1975
1980
1985
1990
1995
2000
2005
year
Top 10% to top 1%Top 1% to top .01%Top .01%
B. Canada
0.0
5.1
.15
.2.2
5D
onat
ions
as
a fra
ctio
n of
tota
l inc
ome
1915
1920
1925
1930
1935
1940
1945
1950
1955
1960
1965
1970
1975
1980
1985
1990
1995
2000
2005
year
Top 10% to top 1%Top 1% to top .01%Top .01%
Notes: Both panels show reported donations for top income groups as a fraction of total income excludingcapital gains.Sources: authors’ computation from income tax statistics.

1.5 Organization of the volume
The remainder of the volume is organized as follows.
In the first chapter of this volume, Anthony B. Atkinson offers a general overview of
the deep and intricate relationships between altruism and economics. In his contribution,
A. Atkinson tackles several important questions related to the modeling of charitable giv-
ing that have been overlooked in most empirical and theoretical work. First, he confronts
the usual modeling of charitable giving behavior to a specific case of charitable donation:
giving overseas. He argues that in order to explain this specific type of charitable giving,
one has to depart from the traditional view that charitable gifts are either due altruistic
or warm glow motives. He proposes instead the “identification model” in order to take
into account that individuals may give without expecting a direct benefit from their gift
nor from the services that are provided by the charity, but rather have a concern for the
well-being of others. This poses the normative question on whether and how we should
take into account this “identification” motive in the social welfare function, when deter-
mining the optimal policy. Atkinson also argues that it is important to adopt a lifetime
approach to the analysis of charitable giving. Existing studies have generally focused on
the analysis of charitable behavior over a limited period of time, whereas charitable giving
decisions are taken over the lifetime. A comprehensive analysis should analyze jointly the
motives for giving in the course of a lifetime and at death.
In the following chapter of this volume, Charles Clotfelter offers a thorough portrait
of tax policy towards private charitable giving in the US. The United States, by almost
all standards, stand out as the country with the largest and most active charitable sec-
tor. C. Clotfelter begins by explaining the historical and cultural roots of this american
exceptionalism. He then offers a detailed account of the tax rules pertaining to charita-
ble giving in the US. He then turns to the critical importance of a tiny fraction of very
wealthy individuals in the functioning of the charitable tax deduction, and analyses the
issues this creates for welfare and redistribution. Finally, C. Clotfelter discusses the most
recent proposals regarding tax incentives for charitable giving, and especially, the pros
and cons of capping the subsidy rate for top income taxpayers, as envisaged by the Obama
administration.

Introduction
In chapter 4, we analyse the US tax policy for charitable giving in a more historical
perspective. Using U.S. tabulated tax statistics and micro tax data, we build long-term
series of contributions and marginal tax rates for the top U.S. income groups since 1917
and document a drastic surge in contributions by the very wealthy in the 1945-1969 pe-
riod. We then use those series to obtain robust estimates of the standard price elasticity
of reported charitable contributions. We also show how part of this high sensitivity of re-
ported contributions to marginal tax rates may be due to the very lax enforcement regime
of the charitable deduction before 1969. We use the 1969 tightening of rules for contribu-
tions to private foundations in the United States in a diff-in-diff approach to document
sizeable responses to the tax enforcement regime, implying that the share of tax-sheltering
motive in total reported contributions by the very wealthy may be significant. We also
develop a model of charitable contributions in the presence of “cheating” contributions
and present formulas for the optimality of tax subsidies for contributions to discuss the
policy implications of our empirical findings. In addition to the standard price elasticity
of reported charitable contributions, two new parameters appear in the formulas: the
share of “cheating” contributions in total reported contributions and the price elasticity
of “cheating” contributions. Simple calibrations based on our estimates show that the
issue of tax sheltering through charitable contributions is a first-order consideration for
the design of optimal subsidies.
Finally, in chapter 5, S. Smith and K. Scharf give an interesting analysis of the UK
system of tax incentives for charitable giving. They pay particular attention to how the
framing of the tax incentive affects individual giving behaviors. The UK tax incentive
system has both a matching and a rebate component. S. Smith and K. Scharf use this ideal
setting to investigate more precisely whether individuals respond differently to similar
changes in tax incentives when they are framed differently. They show that individuals
are indeed more responsive to price variations in a matching system than in a rebate
system. This empirical evidence demonstrates that price elasticities are fundamentally
contextual statistics, that depend a lot on the institutional details of the tax system. The
authors then discuss the consequences of their empirical findings for the optimal design
of tax incentives.
18

Introduction
Figure 1.4: Effective marginal tax rates and reported donations as a frac-tion of total income for top .01% of richest taxpayers in the US andCanada:
A. United States
0.2
.4.6
.81
MTR
0.0
5.1
.15
.2.2
5Fr
actio
n of
tota
l inc
ome
1915
1920
1925
1930
1935
1940
1945
1950
1955
1960
1965
1970
1975
1980
1985
1990
1995
2000
2005
year
ContributionsEffective MTR
B. Canada0
.2.4
.6.8
1M
TR
0.0
5.1
.15
.2.2
5Fr
actio
n of
tota
l inc
ome
1915
1920
1925
1930
1935
1940
1945
1950
1955
1960
1965
1970
1975
1980
1985
1990
1995
2000
2005
year
ContributionsEffective MTR
Notes: Both panels show reported donations for top income groups as a fraction of total income excludingcapital gains. Effective marginal tax rates series for Canada come from Saez & Veall (2005), and for theUS come from authors’ historical tax simulator before 1960 and NBER TAXSIM after 1960.Sources: authors’ computation from income tax statistics.
19

Introduction
References
Atkinson, A. B. and Thomas Piketty, eds, Top Incomes over the Twentieth Century: A
Contrast between European and English-Speaking Countries, Oxford University Press,
USA, June 2007.
Diamond, Peter, “Optimal tax treatment of private contributions for public goods with
and without warm glow preferences,” Journal of Public Economics, May 2006, 90 (4–5),
897–919.
Piketty, Thomas and Emmanuel Saez, “Income Inequality in the United States, 1913–
1998,” The Quarterly Journal of Economics, February 2003, 118 (1), 1–41.
Watson, Rod, “Charity and the Canadian Income Tax: An Erratic History,” The Philan-
thropist, March 1985, 5 (1), 3–21.
20
2 Charitable giving and economics
Anthony B. Atkinson
2.1 Introduction
Charitable giving is an important subject. Many governments see enhanced charitable
giving as an alternative to public spending - an alternative that is increasingly attractive
as fiscal constraints become tighter. Charitable giving has also become of considerable in-
terest to economists. The rich and substantial literature over recent decades means that
it now constitutes a significant sub-field of the discipline, recognised in major reviews
such as the Handbook of the economics of giving, altruism and reciprocity (Kolm and
Ythier, 2006). It is however essential that it should not become too divorced from the
mainstream of economics. In this essay, I argue that the study of charitable giving has
important implications for the development of economics - both positive and normative
economics.
In making this argument, I shall take a specific case study that illustrates well a num-
ber of the general issues. The case study is of giving for overseas development. In the
United Kingdom (UK), charitable donations by individuals for overseas development are
substantial. Charities focusing on overseas development and emergency relief received
nearly £1 billion in donations, bequests and other forms of “voluntary income” in 2004-
2005 (Charities Aid Foundation, 2006), which was equal to about a quarter of the figure
for Official Development Assistance (ODA) in that year. Over a quarter of a century
from 1978, giving for development in the UK increased more than six-fold in real terms
(Atkinson et al, 2012, Figure 2). Focusing on this case study allows us to identify a num-
ber of key issues for the economic analysis of charitable giving in general - and, indeed,
for economics more broadly.
21

Charitable giving and economics
The first section of the essay reconsiders the motives for charitable giving within the
framework of utility maximisation. The literature has typically assumed the utility to
take two main alternative forms (see Andreoni, 2006). The first is that utility is derived
from the achieved results of the gift, referred to as the “public good” motive; the second
is that utility is derived directly from the act of giving, which has come to be known as
the “warm-glow” motive. In Section 1, I argue, following Atkinson (2009) that neither
of these formulations is fully appropriate for the explanation of giving to development
charities, and propose a new formulation, the“’identification” approach, that blends the
scale of the warm-glow approach with the results focus of the public goods formulation.
In putting this forward, I am not suggesting that the identification approach is of wider
validity, but rather that the development of micro-economic models needs to consider the
specific application and impose the structure appropriate to the application. It is not
sufficient to write a general utility function; nor is it adequate to take over a function
applied elsewhere. We need to drill down to the essentials of the problem.
Giving for development takes place in the course of the lifetime and at death in the
form of bequests. The modelling of giving has therefore to adopt a lifetime approach,
and to this end the standard model of life-cycle savings has been commonly employed
(see, for example, Watson, 1984). Following the strategy of “drilling down”, we need to
consider the specific features of charitable giving. These are the subject of Section 2. The
first is that many people give nothing at a particular date or leave no charitable bequests.
In contrast to much micro-economic theory, where corner solutions are often ignored,
they should receive particular attention when studying charitable giving, since time may
be of the essence. But we have also to consider the challenges that have been made to
the underlying model, notably from recent advances in behavioural economics and from
experimental evidence (see, for example, the survey of field experiments by DellaVigna,
2009). With a wide range of possible factors affecting intertemporal behaviour, the need
for more structure is even more apparent, and this is illustrated by reference to the dif-
ferent stages involved in the decision to make a charitable bequest.
In the first two sections, I am concerned with the positive theory of charitable giving.
In Section 3, I turn to the normative questions and the challenges for welfare economics.
These are two-fold. First, the existence of individual concern for charitable objects raises
the issue as to how such individual concerns should enter the social welfare function.
22
Charitable giving and economics
Should, as some writers have argued, warm-glow preferences be simply disregarded in
the social evaluation? Secondly, the case study considered here raises the issue of the
global reach of the social welfare function - an issue that transcends charitable giving and
touches all policy that has implications beyond national boundaries. The final section
summarises the conclusions for the economics of charitable giving - and for economics
more generally.
2.2 The motives for giving
If we denote charitable donations by D and consumption by C, then a household may be
represented as maximising U(C,D) subject to a budget constraint, where the constraint
will reflect such considerations as income tax exemptions for donations that influence the
“price” of giving. Much of the literature has been concerned with the impact on the level
of giving of variations in the price. Where utility is assumed to be derived directly from
the act of giving - the “warm-glow” hypothesis - the formulation is complete. All that is
required is the specification of the form of the utility function.
Pure warm-glow models, however, assume that the donor is completely unconcerned
with the use made of the gift and with the effectiveness of charitable activity. This as-
sumption is unappealing in the case of giving for overseas development, where a key role
is played by issues of “effectiveness”. A reason frequently advanced for not giving is that
the money is wasted: it disappears in administrative costs or is lost in corruption. Qual-
itative research in the UK (Atkinson and Eastwood, 2007) indicates the role played by
negative stories about misgovernment in dissuading people from giving for development.
The warm-glow model allows no scope for such considerations.
This objection does not apply to the second formulation - the public goods motive -
where the donor is assumed to be concerned with the achieved results of the gift. Assuming
that the utility function is additively separable in the two components, we can write utility
as U(C) + V(G[D]), where G[D] is the level of the public good. U and V are assumed to be
non-decreasing, concave functions, but these assumptions on their own are not sufficient.
We have to provide more structure. Where charitable contributions support public goods
of a conventional kind, such as a hospice or public radio, the function V represents the
23
Charitable giving and economics
valuation placed on the resulting services. In the case of giving for development, however,
the motive is more one of extended “sympathy”. As was described by Sen in his analysis
of worker co-operatives, “families are not necessarily indifferent to the happiness of other
families... and their notion of “social welfare” takes into account the utility of other
families” (1966, page 363). The utility function may then be written as
U(C) + δrU(G[D]) (2.1)
where δ captures the fact that the degree of sympathy may be incomplete or zero
(0 ≤ δ ≤ 1) and r denotes the number of recipients. The case where δ is between 0 and
1 has been colourfully described by Edgeworth: “between the frozen pole of egoism and
the tropical expanse of utilitarianism [there is] the position of one for whom in a calm
moment his neighbour’s happiness as compared with his own neither counts for nothing,
nor “counts for one” but counts for a fraction” (1881, page 102). In planning its giving,
the household has to take a view about the contribution that its own donation, D, makes
to the outcome. The outcome depends on the contributions of others, including, in the
present case, ODA. As has been widely recognised in the literature, the problem with
the public goods motive is that there is an incentive to free-ride, attenuated only to the
extent that contributors expect that increases in their own giving will stimulate others to
give more (Jones and Posnett, 1993, page 135).
A second feature of giving for development is that, in contrast to the worker co-
operative, the number of recipients is likely to be large. This calls into question the
formulation (1), since, as r becomes large, the maximand is dominated by the second
term. There would be a sum over 1 donor and millions of recipients. More reasonable
would be to assume that the donor is concerned with the average level of well-being of
recipients (removing the variable r in equation (1)). But we have also to allow for the
fact that the number of potential donors is large. Large numbers of donors means that
people are less likely to assume that their own giving will stimulate other donors and
that the individual donors are more likely to free-ride (Atkinson, 2009, page 649). For
these reasons, as Sugden argued many years ago, “the public good theory of philanthropy
is untenable as an explanation of the behaviour of those people who contribute to large
charities” (Sugden, 1982, page 348). In the case of development charities, the public
goods model does not for this reason provide a satisfactory basis for the explanation of
individual giving.
24

Charitable giving and economics
On their own, the two standard models do not apply to the case of giving for develop-
ment, but a combination of the two approaches is more promising. In the “identification
model” (Atkinson, 2009), the donor is assumed to be concerned with the impact on the
living standards of the recipients, but the donor does not regard D as being divided among
millions of potential recipients. Donors are assumed to visualise a small number (m) of re-
cipients aided only by them. Such a visualisation is commonly promoted by development
charities, and some charities have sought indeed to build explicit links between donors
and recipients. Such a utility function may be written as (assuming that the transfer is
equally divided among the m visualised recipients):
U(C) + δm · U(Y0 + (1− l)D/m) (2.2)
where the living standard of the recipients would be Y0 in the absence of assistance
and there is a leakage of a proportion l from the charitable transfer. The condition for a
charitable gift to be made is that
δ(1− l) · U ′(Y0) > p · U ′(C) (2.3)
where p is the price of giving (for example (1 − τ) in the case where donation are tax-
deductible and τ is the marginal tax rate). As discussed further below, the corner condi-
tion is of particular interest since it determines the proportion making a charitable gift.
Where, for instance, people differ in their degree of extended sympathy, δ then the pro-
portion making a gift is 1−F (δ∗), where F is the cumulative distribution of δ and δ∗ is the
value at which (2.3) would be satisfied if > were replaced by an equality. The proportion
falls with the extent of leakage (l), with the level of well-being of the recipients (Y0), and
the price of giving. It rises with the level of income of the donor. Where a transfer is
made, the amount given depends on these factors and also on m. A rise in m means that
donors are extending their range of concern.
The identification model provides in this way a vehicle to analyse the factors influenc-
ing the proportion of the population who make charitable gifts for development and the
amounts given. More generally, the case study illustrates how detailed consideration of a
specific application can lead to a formulation appropriate to that case.
25

Charitable giving and economics
2.3 Lifetime giving and charitable bequests
The model of giving described in the previous section is a static model, but charitable
giving is part of a dynamic lifetime process. Adapting the standard life-cycle model, with
a known lifetime T and no uncertainty, the utility from charitable giving is given by (as
in Watson, 1984)
∫ T
0
e−ρtU(Ct, Dt)dt+ e−ρtΦ[A(T )−B,B] (2.4)
The first term gives the discounted (at rate ρ) utility anticipated from the stream
of consumption, Ct, and charitable donations, Dt, over the lifetime T; the second term
gives the utility produced (in anticipation) by the estate where A(T) of assets are held
at death, of which B is a charitable bequest and the remainder passes to the heirs. Of
particular interest is the timing of donations and the role of corner conditions. A person
may concentrate giving in specific periods or, indeed, postpone all giving until the date
of death. Another person may make lifetime gifts to charity but leave all of the estate
to the heirs. Or people may give continuously, as for example they tithe a proportion of
their income in each period.
The treatment of giving by Watson assumes that the motive is warm-glow. I have,
however, argued that for the specific application to giving for overseas development we
should adopt an outcome-focused approach, such as the identification model. In that
case, we have to consider the implications of timing for the effectiveness of giving. In a
steady-state, with equal numbers in each generation, there may be no difference. Such a
model may, for example, apply to giving for end-of-life care, which could be financed by
donations at any stage of the life-cycle, providing that the pattern is repeated from gen-
eration to generation. The situation with overseas development is quite different in that
it is based on the assumption that the need for development assistance is a temporary - if
long - phase in history. The ambition of development charities is to see their role come to
an end. If that is the case, then contributions are much more valuable earlier than later:
time is of the essence. The rate of return, it is argued, is higher than that which can be
obtained from the savings by the potential donor. Put another way, the cost of achieving
target outcomes is rising over time, as wages rise in the recipient countries. There is
therefore a high return to carrying out labour-intensive development projects now rather
than several decades later.
26
Charitable giving and economics
Such considerations need to be incorporated into the model of charitable giving. We
need however to go further and to consider the challenge that has been raised to the
underlying approach to intertemporal decision-making, a challenge that has been well
summarised by Thaler and Benartzi: “it is rare to find someone who has spent much time
determining the optimal savings rate, given all the uncertainties about future rates of re-
turn, income flows, retirement plans, health, and so forth. Instead, most people attempt
to cope with complexity by adopting simple heuristics, or rules of thumb, to aid decision-
making” (2007, Executive Summary). In a sense, the complexity is now transferred to
the explanation of behaviour. A wide range of considerations is introduced. Following
the classification by Knoll (2010), there are issues concerning - in addition to the use
of heuristics - information, the nature of intertemporal choice, and the decision context.
Informational issues include those concerned with the future opportunity cost of giving
(the future needs of the individual), future income streams, future tax and other policies,
and those concerned with the outcomes from giving for development. Where people ex-
hibit ambiguity aversion, they may decide not to contribute on the grounds that there are
conflicting views about the effectiveness of development assistance, and in the absence
of convincing evidence they may rely on anecdotal reports. The degree of self-control
implied by the maximisation of the lifetime utility function (4) has been questioned, with
alternative models of hyperbolic discounting, of procrastination, or of limited attention.
Donors may rationally restrict the range of information that they consider, as argued in
the case of tax relief for charitable donations in the UK by Scharf and Smith (2010). The
role of social context in influencing giving has been demonstrated in field experiments,
such as that by DellaVigna, List and Malmendier (2012) concerning door-to-door solici-
tation.
These considerations open up new avenues. In deciding which to pursue, it is necessary
to consider the specific case in hand and to impose the structure appropriate to that appli-
cation. In the case of charitable giving for development, there are certain elements in what
I have already discussed. The identification approach may be seen as a specific form of
“framing”, where the visualisation of the problem reduces it to a manageable form. Tithes
are an example of a heuristic, re-inforced by religious or social pressure. We can however
go further, as is illustrated here by the UK study by Atkinson, Backus and Micklewright
(2009) of the multiple stages involved in determining charitable bequests for development.
27
Charitable giving and economics
The determinants of charitable bequests, and particularly the impact of estate tax-
ation, has been the subject of a number of studies, those in the US including Boskin
(1976), Feldstein (1976) and Bakija, Gale and Slemrod (2003). This literature has tended
however to collapse the decision to leave a charitable bequest into a single stage, whereas
it is fruitful to consider separately the different stages in the decision process. Breaking
down the process in this way allows more structure to be placed. The first stage concerns
the decision to leave significant assets at death. The second stage concerns the disposition
of these assets. This depends on the freedom of bequest, which varies considerably across
countries, and even within countries. In the UK, there is broadly freedom of bequest in
England and Wales (although legislation can impede this freedom ex-post and threaten
charitable bequests if the deceased is deemed to have unreasonably failed to make suf-
ficient provision for his or her family, see Hannah and McGregor-Lowndes, 2008). In
contrast, under Scots law a testator is not free to distribute his or her estate in an unre-
stricted manner. In other countries, testamentary freedom is limited where there are legal
systems that embody the Napoleonic code. In France, for example, there is a reserved
portion for children and other heirs, and this cannot be over-ridden by a will. In such
cases, there is less incentive to make a will, but it is surprising that in countries where
there is freedom of bequest a sizeable minority of wealth-holders fail to do so. In the UK
study (Atkinson, Backus and Micklewright, 2009) of some 240,000 estates in 2007-8, there
were 15 per cent who left significant wealth but died intestate. The proportion making a
will rose with wealth but, remarkably, some people died leaving estates of over £1 million
without making a will.
The third stage is that of including, or not including, a charitable bequest. The UK
study found that 16 per cent of testate estates did so. In view of the difference in testa-
mentary freedom between Scotland, one hand, and England and Wales, on the other, it
is interesting to see the difference:
England and Wales Scotland
% testate 84.9 81.7
% of testate leaving charitable bequests 16.8 11.2
Combined effect 14.3 9.2
The differences are not large but are in the direction expected given the greater re-
strictions in Scotland on the disposal of the estate. The UK overall rate of 16 per cent
28

Charitable giving and economics
making charitable bequests, combined with a testacy rate of 85 per cent, and the fact that
significant wealth was left in only some 43 per cent of all deaths, implies that in 6 per cent
of deaths in Britain in 2007-8 the will contained a charitable bequest. There is however
a fourth stage: a testamentary bequest may be conditional. For example, a bequest may
be conditional on there being no surviving spouse, or on the children having reached the
age of majority. In the UK study, absolute (i.e. unconditional) bequests were made in 73
per cent of cases. It should be noted that this hurdle is missed by studies based purely
on estate tax returns. Bequests that are conditional do not appear in these data where
the conditions are not met; and no distinction can be drawn between absolute bequests
and those bequests that were conditional and the conditions were satisfied. Although the
estate data measure correctly the amount of wealth transferred to charities (for estates
above the tax threshold), they may be seen as understating the full extent of the charita-
ble intent of the decedents concerned.
Breaking down the bequest process in this way shows that there are at least four hur-
dles that have to be jumped before a charity finally benefits from a bequest. Considering
these stages separately provides a structure for seeking to understand the determinants,
including the role of public policy, which may operate to differing degrees at different
stages.
2.4 The welfare economics of giving
In considering public policy we have both positive questions as to how policy impacts on
charitable giving and normative questions as to how public policy should be determined.
In the case of giving for overseas development, the latter include the general question of
tax relief for charities and the specific question as to how far ODA should take account of
individual action. The answers to such normative questions depend on the form of social
objectives, which - since the demise of the study of welfare economics - have not been the
subject of sufficient critical attention by economists. The topic of this essay does in fact
raise two important challenges to welfare economics.
The first challenge concerns the treatment of individual motives for charitable giving.
It has been argued that these should be ignored when formulating the social objectives.
29

Charitable giving and economics
In his discussion of warm-glow preferences for giving for public goods, Diamond argues
that “the fact that warm glows improve the description of individual behavior does not
necessarily imply that social welfare should be defined including warm glows” (2006, page
915). The D term in the utility function should be ignored when forming a social welfare
function based on individual well-being. Here I have suggested that giving for develop-
ment should be modelled in terms of outcomes, not warm-glow, but objections can also
be levelled in this case. With the additive formulation (2), the donor’s utility consists
of an element arising from the person’s privately-oriented preferences and an element re-
flecting the person’s concern for others. “Concern” implies that the well-being of others
enters positively or at least non-negatively (δ ≥ 0), If the sign of δ were to be reversed,
most people would agree that such feelings should be disregarded. Envy or jealousy has
no place in the social welfare function. What about the positive feelings that we have
been considering? Should these also be disregarded? The main argument that has been
advanced is that of double-counting. Hammond (1987) argues that, by taking (2) for the
donor, and U(C) for the recipient, the privately-oriented preferences for the recipient are
being given a weight of (1 + δ), whereas the donor has only a weight of 1. Here, however,
the specific context means that we can reject this argument, since the recipients are in a
different country. There would only be double-counting if we were to sum over the entire
world population.
This brings us to the second challenge posed by the case of giving for overseas devel-
opment. Whose well-being should enter the social welfare function? It could be all world
citizens - a cosmopolitan social welfare function, but most governments act as though they
are concerned only with their citizens. The UK Government Green Book on “Appraisal
and evaluation” states explicitly that “generally, proposals should not proceed if, despite
a net benefit overall, there is a net cost to the UK” (HM Treasury 2011, page 21n). At
the same time, it would be hard to justify ODA on this basis, so that the government
appears to be speaking with more than one voice.
Neither cosmopolitanism nor pure nationalism seems to be justified. What intermedi-
ate path can we follow? Suppose that the social welfare function is restricted to citizens,
but takes account of their extended sympathy. In its simplest form, the social welfare
function is then the sum of the individual functions (2), where the well-being of overseas
recipients enters with a weight δ, and the concern of a rich nation is with m times the
30

Charitable giving and economics
number of its own citizens. Alternatively, we could argue directly in terms of the social
welfare function that the counterpart at the level of the nation to the identification ap-
proach is that each donor country takes a proportionate share of responsibility for the
funding of development. Since the total population of Development Assistance Commit-
tee countries is approximately equal to the number of people below the MDG poverty
line, m = 1 would provide a natural starting point. Differing degrees of concern with
world poverty would then be captured by differences in δ.
Conclusions
In this essay, I have described some of the issues that arise in studying charitable giving
for development in the UK. This has been a specific project, but I have argued that there
are lessons more widely for the economics of charitable giving - and indeed for economics.
There are three main conclusions. The first is that we can only make progress by putting
more structure on the model of decision-making. The imposition of structure is particu-
larly important - for the economics of charitable giving and for micro-economics in general
- as we increasingly come to challenge textbook theory. The exploration of the multi-stage
bequest process is an example of an attempt to provide a framework within which dif-
ferent factors can be identified. The second conclusion is that the form adopted has - as
in this example - to be tailored to the specific application. It was the specific features
of giving for development that led to the identification approach; other forms of giving
may be appropriately treated in other ways. Generality is always prized in economics,
but this may come at the cost of limiting what we can say. It would be quite reasonable
for utility-maximisation to remain the cornerstone of consumer demand analysis but for
other models to be applied to long-term inter-temporal decisions. The third conclusion
is that we need to reconsider the underlying welfare economics, and specifically how we
formulate national welfare criteria in a global context. This conclusion too is of wider
applicability and touches all policy design issues that cross national borders.
References
Andreoni, James, “Chapter 18 Philanthropy,” in Serge-Christophe Kolm and Jean Mercier
Ythier, eds., Handbook of the Economics of Giving, Altruism and Reciprocity, Vol.
Volume 2, Elsevier, 2006, pp. 1201–1269.
31

Charitable giving and economics
Atkinson, A. B., P. G. Backus, and J. Micklewright, “Charitable bequests and wealth at
death in Great Britain,” http://eprints.soton.ac.uk/65909/ March 2009.
Atkinson, A.B., “Giving overseas and public policy,” Journal of Public Economics, June
2009, 93 (5–6), 647–653.
Atkinson, Anthony B., Peter G. Backus, John Micklewright, Cathy Pharoah, and Sylke V.
Schnepf, “Charitable giving for overseas development: UK trends over a quarter cen-
tury,” Journal of the Royal Statistical Society: Series A (Statistics in Society), 2012,
175 (1), 167–190.
Atkinson, Richard and Amy Eastwood, “Public Attitudes to Overseas Giving: Does Gov-
ernment Make a Difference?,” http://eprints.soton.ac.uk/48324/ September 2007.
Bakija, Jon M, William G. Gale, and Joel B. Slemrod, “Charitable Bequests and Taxes on
Inheritance and Estates: Aggregate Evidence from Across States and Time,” American
Economic Review, 2003, 93 (2), 366–370.
Barr, Nicholas Adrian and David K. Whynes, Current Issues in the Economics of Welfare,
MacMillan, 1993.
Boskin, Michael J., “Estate taxation and charitable bequests,” Journal of Public Eco-
nomics, January 1976, 5 (1–2), 27–56.
DellaVigna, Stefano, “Psychology and Economics: Evidence from the Field,” Journal of
Economic Literature, 2009, 47 (2), 315–372.
, John A. List, and Ulrike Malmendier, “Testing for Altruism and Social Pressure in
Charitable Giving,” The Quarterly Journal of Economics, February 2012, 127 (1), 1–56.
Diamond, Peter, “Optimal tax treatment of private contributions for public goods with
and without warm glow preferences,” Journal of Public Economics, 2006, 90 (4-5),
897–919.
Edgeworth, Francis Ysidro, Mathematical Psychics: An Essay on the Application of Math-
ematics to the Moral Sciences, C. Kegan Paul & Company, 1881.
Feldstein, Martin, “Charitable bequests, estate taxation, and intergenerational wealth
transfers,” in R E Grieson, ed., Research Papers, sponsored by the Commission on
Private Philanthropy and Public Needs, Lexington Books, Lexington., 1976.
Hammond, Peter J., “altruism,” in Steven N. Durlauf and Lawrence E. Blume, eds., The
New Palgrave Dictionary of Economics, 2 ed., Basingstoke: Nature Publishing Group,
p. 1.
32

Charitable giving and economics
Hannah, Frances M. and Myles McGregor-Lowndes, “From testamentary freedom to tes-
tamentary duty: Finding the balance,” http://eprints.qut.edu.au/15464/ November
2008.
Knoll, Melissa, “The Role of Behavioral Economics and Behavioral Decision Making in
Americans’ Retirement Savings Decisions,” SSRN Scholarly Paper ID 1702815, Social
Science Research Network, Rochester, NY November 2010.
Kolm, Serge-Christophe and Jean Mercier Ythier, Handbook of the Economics of Giving,
Altruism and Reciprocity Volume 2: Applications, Elsevier, September 2006.
M., Jones Andrew and John W. Posnett, “The economics of charity,” in N. Barr and
D. Whynes, eds., Current Issues in the Economics of Welfare, St. Martin’s Press, 1993,
pp. 130–152.
Scharf, Kimberley A. and Sarah Smith, “Rational inattention to subsidies for charitable
contributions,” July 2011.
Sen, Amartya K., “Labour Allocation in a Cooperative Enterprise,” The Review of Eco-
nomic Studies, October 1966, 33 (4), 361.
Sugden, Robert, “On the Economics of Philanthropy,” The Economic Journal, June 1982,
92 (366), 341.
Thaler, Richard H and Shlomo Benartzi, “The Behavioral Economics of Retirement Sav-
ings Behavior,” AARP. Washington DC January, 2007.
Treasury, HM, “Green Book,” April 2013.
Watson, Harry, “A Note on the Effects of Taxation on Charitable Giving Over the Life
Cycle and Beyond,” The Quarterly Journal of Economics, August 1984, 99 (3), 639.
33

3 Charitable Giving and Tax Policy in the
U.S.
Charles T. Clotfelter 1
In several important ways, U.S. tax policy favors charitable giving and nonprofit organiza-
tions. Not only are nonprofit organizations generally exempted from income and property
taxes, but most contributions to them from living donors, corporations, and estates are
also tax-deductible. This favorable tax treatment is one important component of a more
general American approach to the provision of public goods. The nation’s tax policy
toward charitable giving has had three broad effects. First, this tax policy allows many
citizens to gain a sense of participation that they might not otherwise have, by choosing
the causes and organizations that will receive their donations. Institutionally, this sense
of participation is reflected and enhanced by a very prominent nonprofit sector. Second,
this policy has the effect of handing over to wealthy individuals an extraordinary amount
of influence over the allocation of public funds. As a result of these two effects, Ameri-
can tax policy contains an inherent tension between participatory citizenship and elitism.
Third, because it operates through a tax deduction, tax policy toward charitable giving is
vulnerable to inadvertent modification simply as a result of otherwise unrelated tinkering
with the income tax.
The paper begins by providing some broader context for understanding the role of tax
policy toward charitable giving. The second section describes the basic components of
American tax policy, its implications for incentives for donors, and some of the prominent
tax policy issues that arise in connection with the charitable deduction. The third section
1Paper presented at the Centre for Economic Policy Research Public Policy Conference on Altruismand Charitable Giving, May 11-12, 2012, at the Paris School of Economics in Paris (co-sponsored byle Centre Pour la Recherche Economique et Ses Applications). I am grateful to Gerald Auten, JoelFleishman, Kristin Goss, Ralph McCaughan, Edward Skloot, Larry Zelenak, and the editors for helpfulcomments and suggestions and to John Mcginty for research assistance. The views expressed are thoseof the author and do not necessarily represent those of any organization.
34

Giving and Tax Policy in the U.S.
discusses the unusually large role played by wealthy donors by virtue of the charitable
deduction. The fourth section examines the possible effect of tax reform on charitable
giving. The last section offers a brief recapitulation.
3.1 American Exceptionalism, the Social Contract,
and Charitable Giving
Compared to other advanced countries, the United States has developed a distinctive
approach to meeting social needs. It relies less on direct government provision and com-
pulsory taxation and more on voluntary provision. In 2007 government social spending
was 16.2% of GDP in the U.S., compared to 19.2% in the OECD, as shown in Table
3.1. The corresponding ratios in Continental Europe’s largest economies, France and
Germany, were 28.4% and 25.2%, respectively. As has been frequently documented, the
consequences of the comparatively weak American social safety net are higher poverty
rates and greater income inequality, after taxes and transfers. For example, Smeeding
(2006, Table 4) calculates that government spending on social insurance and social as-
sistance reduced the poverty rate in the U.S. by 26%, compared to an average of 61%
in the OECD as a whole.2 Similarly, the United States generally lags behind Europe in
public expenditures for health, education, and culture.3 Alesina, Glaeser and Sacerdote
(2001, pp. 46, 55 and 57) offer several explanations for this difference, including racial
heterogeneity, Protestantism, and an American tendency to ascribe poverty to laziness.
In contrast to its stingy public provision, however, the United States tends to be a
leader when it comes to private provision, expenditures controlled by individuals rather
than the government, some of which is subsidized by the government through tax breaks.
As shown in Table 3.1, the portion of GDP the U.S. devoted to social expenditures not
controlled by government was 10.5% in 2007, well above the OECD average of 2.5%. Part
of this private expenditure comes in the form of tax expenditures, tax revenue that is
sacrificed as a result of exemptions, deductions, or other exclusion from taxation, such as
the exclusion for health premiums, pension contributions, and the deduction for charitable
2See also Neubourg et al. (2007, p. 7) for an analysis with similar findings. Comparisons use povertyrates defined relative to each countrys median income.
3See OECD Factbook 2011, http://www.oecd-ilibrary.org/economics/oecd-factbook 18147364,(3/20/12).
35

Giving and Tax Policy in the U.S.
contributions. As such, these OECD-defined “private” expenditures are actually funded,
in part, by the U.S. government.4 Because tax expenditures for social purposes have an
effect similar to direct government provision, one author (Howard, 1997) has referred to
them as the “hidden welfare state.”
A centerpiece of this shadow welfare state is charitable giving. According to household
surveys, Americans contribute about 1.7% of national income, a far higher percentage than
in other developed countries, as shown in Table 3.2. When combined with contributions
by corporations and charitable bequests from estates, Americans give roughly 2% of their
income to nonprofit organizations, a ratio that has held rather steady for decades.5 Schol-
ars have made a great deal of this tradition of personal generosity, giving it a prominent
place in the larger portrait of America’s distinctive approach in addressing social needs.
Indeed, the American record of giving and volunteering has been celebrated as often as
its weak government safety net has been decried. From this laudatory perspective, the
generosity of spirit revealed by the country’s high rate of charitable giving is inextricably
wedded to the country’s historical reliance on non-governmental organizations to address
social problems and provide collective goods. Political scientist Lester Salamon sees in
this model a tension between “two seemingly contradictory principles” honored by Amer-
icans: individualism and solidarity.6 No history of the American nonprofit sector can be
complete without a quotation taken from the eloquent Frenchman Alexis de Tocqueville,
who was enamored by much of what he encountered in his visit to the United States in
1831. He may be best known for his description of the American tendency to form volun-
tary associations: “In no country in the world has the principle of association been more
successfully used or applied to a greater multitude of objects than in America.”7 This
theme has been embraced by many American historians of the nonprofit sector, and high-
lighting this distinguishing national characteristic often goes hand in hand with noting
4The OECD defines “social expenditures” as follows: “Social expenditure comprises cash benefits,direct in-kind provision of goods and services, and tax breaks with social purposes. Benefits may betargeted at low-income households, the elderly, disabled, sick, unemployed, or young persons. To beconsidered social, programmes have to involve either redistribution of resources across households orcompulsory participation. Social benefits are classified as public when general government (that is central,state, and local governments, including social security funds) controls the relevant financial flows. Allsocial benefits not provided by general government are considered private. Private transfers betweenhouseholds are not considered as social.” For an official run-down of U.S. tax expenditures, see U.S.Office of Management and Budget (2010), chapter 17, “Tax Expenditures.”
5Wing et al. (2008, Figure 3.1, p. 73). For a summary of aggregate giving from these various sourcesover time, see the annual publication Giving USA
6Salamon (2002, p. 10).7Quoted from Democracy in America in Hammack (1998, p. 143).
36

Giving and Tax Policy in the U.S.
with approval the tradition of voluntary giving that supports it. For example, Bremner
writes: “We do not need to exaggerate the extent of our national generosity to recognize
that voluntary benevolence has played a large role and performed important functions in
American society.”8
There is no shortage of evidence to illustrate the significance of the nonprofit sector in
the United States. In no other developed country are there, for example, so many thriving
and prominent nonprofit universities. Of the 15 American universities listed among the
Times of London’s top 20 in the world, 12 are private.9 Nonprofit institutions are sim-
ilarly prominent among the country’s leading medical centers, museums, and symphony
orchestras. Religious organizations, most of them small congregations, are ubiquitous.
Many social services are provided by religious and other nonprofit organizations, and
“community chest” funds provide a significant portion of spending for public needs, as
indicated by the figures given above. Nonprofit organizations employ nearly a tenth of
the American work force.10
One inevitable consequence of this reliance on independent organizations is decen-
tralization of power. Letting a thousand flowers bloom fits nicely, in terms of political
philosophy, with America’s pluralistic principles. According to Prewitt (2006, pp. 39-41),
these principles are aligned with the country’s historical preferences for weak and unob-
trusive government. The significance of all this for the current paper is in the revenue side
of this sector. By leaving such a large share of the funding up to individuals, the system
takes much of the decision-making away from legislatures and hands it over to individual
donors. For a country that historically has revered individual liberty, this devolution of
responsibility is attractive and natural. In allowing a deduction for charitable donations,
American tax law in effect recognizes that donations replace government spending and,
by extension, gives legitimacy to the social value of donors’ preferences. Not only is this
decentralization of decision making consistent with pluralism, but some observers also
see it as a market-like mechanism that makes public provision more efficient, a viewpoint
concisely stated by Yale law professor Stephen Carter:
The charitable deduction also helps resolve an information problem: Govern-
8Bremner (1977, p. 89).9Website for the Times of London, http://www.timeshighereducation.co.uk/world-university-
rankings/2010-2011/top-200.html, (3/17/12).10Wing et al. (2008, Table 1.8, p. 20) estimate that nonprofits employed 9.7% of the U.S. workforce
in 2005.
37
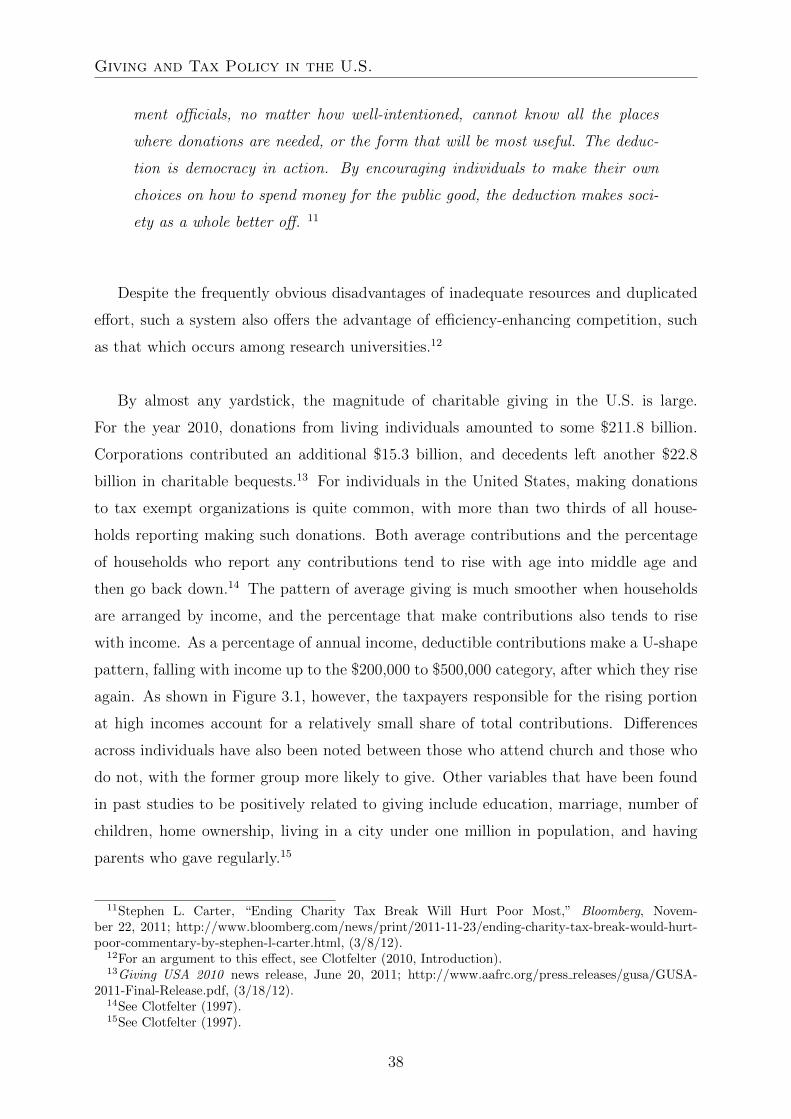
Giving and Tax Policy in the U.S.
ment officials, no matter how well-intentioned, cannot know all the places
where donations are needed, or the form that will be most useful. The deduc-
tion is democracy in action. By encouraging individuals to make their own
choices on how to spend money for the public good, the deduction makes soci-
ety as a whole better off. 11
Despite the frequently obvious disadvantages of inadequate resources and duplicated
effort, such a system also offers the advantage of efficiency-enhancing competition, such
as that which occurs among research universities.12
By almost any yardstick, the magnitude of charitable giving in the U.S. is large.
For the year 2010, donations from living individuals amounted to some $211.8 billion.
Corporations contributed an additional $15.3 billion, and decedents left another $22.8
billion in charitable bequests.13 For individuals in the United States, making donations
to tax exempt organizations is quite common, with more than two thirds of all house-
holds reporting making such donations. Both average contributions and the percentage
of households who report any contributions tend to rise with age into middle age and
then go back down.14 The pattern of average giving is much smoother when households
are arranged by income, and the percentage that make contributions also tends to rise
with income. As a percentage of annual income, deductible contributions make a U-shape
pattern, falling with income up to the $200,000 to $500,000 category, after which they rise
again. As shown in Figure 3.1, however, the taxpayers responsible for the rising portion
at high incomes account for a relatively small share of total contributions. Differences
across individuals have also been noted between those who attend church and those who
do not, with the former group more likely to give. Other variables that have been found
in past studies to be positively related to giving include education, marriage, number of
children, home ownership, living in a city under one million in population, and having
parents who gave regularly.15
11Stephen L. Carter, “Ending Charity Tax Break Will Hurt Poor Most,” Bloomberg, Novem-ber 22, 2011; http://www.bloomberg.com/news/print/2011-11-23/ending-charity-tax-break-would-hurt-poor-commentary-by-stephen-l-carter.html, (3/8/12).
12For an argument to this effect, see Clotfelter (2010, Introduction).13Giving USA 2010 news release, June 20, 2011; http://www.aafrc.org/press releases/gusa/GUSA-
2011-Final-Release.pdf, (3/18/12).14See Clotfelter (1997).15See Clotfelter (1997).
38

Giving and Tax Policy in the U.S.
One fact of great significance for any discussion of U.S. tax policy toward charitable
giving is that donative preferences differ markedly across individuals. That preferences
differ from one person to the next is not surprising, and indeed the efficiency of the tax
deduction that Carter notes above depends crucially on the ability of each individual
taxpayer to direct a portion of the national tax subsidy to the charity of his or her choice.
One taxpayer donates to the local soup kitchen while another chooses to support medical
research. But there is one dimension of systematic variation in the types of organizations
supported that is worthy of special note. On average, the types of organizations favored
by donors differ systematically up and down the income distribution. For individuals of
modest means, religious organizations are far and away the most favored type of donee.
As shown in Table 3.3, contributions to religious organizations (even subtracting the por-
tion that are ultimately used to provide aid to the needy outside of congregations) made
up two thirds of the contributions made by individuals with incomes under $100,000 in
2005. For those in the next highest income class, $100,000 to $200,000, giving to religious
organizations remained the leading category, though its share was only a little more than
half. For the two highest income categories ($200,000 to $1 million and $1 million or
more), religion was eclipsed by education, which turns out to be mainly higher education.
Owing mainly to these preference patterns and the sheer magnitude of donations made
by high-income individuals, donations to educational institutions are almost half as large
as the total giving directed to religious institutions. And the totals given to education,
health, and the arts depend almost exclusively on gifts from the affluent.
In light of America’s heavy reliance on private, as opposed to public, social expendi-
tures, it is natural to wonder how much redistribution is actually accomplished by way
of contributions. As noted at the beginning of this section, the public sector in the U.S.,
through taxes and transfers, brings about considerably less poverty reduction than is
the norm in Europe. That charitable contributions in the U.S. bring about at least some
redistribution to the poor is suggested by the information given in Table 3 on the distribu-
tion of contributions. In addition to the 7.5% devoted to basic needs, certainly a portion
of contributions to health, education, and other organizations would also be considered
redistributive. Still, much of it is not. These patterns of giving by income class have
particular policy relevance because not all contributions receive the same tax treatment,
a subject to which I now turn.
39

Giving and Tax Policy in the U.S.
3.2 The Basics of the US Income Tax Policy
The centerpiece of U.S. tax policy towards charitable giving is the deduction available
in the personal income tax, the corporation income tax, and the estate and gift tax.16
The modern U.S. individual income tax was passed in 1913. The deduction for dona-
tions to nonprofit charitable and educational organizations was added in 1917, a year in
which Congress increased tax rates to finance the war effort, raising the top marginal
tax rate from 15% to 67%. Arguing for the deduction was Senator Henry Hollis of New
Hampshire, who stated, “we impose these very heavy taxes on incomes, [and] that will
be the first place where these very wealthy men will be tempted to economize, namely,
in donations to charity.”17 Very wealthy men, indeed: to qualify for the top tax rate,
a taxpayer needed an income of $35 million in 2011 dollars. Those with incomes of a
mere $1 million were subject only to a 16% marginal rate. Top marginal rates fluctuated
thereafter, falling as low as 24% (in 1929) and rising as high as 94% (1944-1945).18 In
1944, the Congress introduced a standard deduction, after which most taxpayers stopped
itemizing deductions. In 1945 only 17% of taxpayers itemized, a percentage that crept
up over time to a peak of 48% in 1970, after which the minimum standard deduction
amount was increased and, eventually, indexed to inflation.19 Except for a brief period
in the 1980s, nonitemizers received no tax deduction for making charitable donations.20
Finally, the deduction for contributions is limited in any year to no more than half of a
taxpayer’s income, with the excess being carried forward as many as five more years.21
16Contributions are deductible if given to nonprofit organizations described in section 501(c)3, de-fined as “charitable, religious, educational, scientific, literary, fostering national or international am-ateur sports competition, and preventing cruelty to children or animals.” A deduction is not al-lowed for one group of 501(c)3 organizations, namely, those testing for public safety. See IRS,http://www.irs.gov/charities/charitable/article/0,,id=175418,00.html, (3/26/12).
17Congressional Record, September 7, 1917, p. 6728, as quoted in Clotfelter (1985, p. 31), whichmistakenly reports that the top marginal rate in 1917 was 15%.
18Tax Foundation, Federal Individual Income Tax Rates History,http://www.taxfoundation.org/files/fed individual rate history nominal&adjusted-20110909.pdf,(3/8/12).
19Clotfelter (1985, pp. 25-26).20As stipulated in the Economic Recovery Tax Act of 1981, nonitemizers could deduct 25% of the
first $100 (married filing jointly) of donations in 1982 and 1983, 25% of the first $300 in 1984, 50% ofall contributions in 1985, and 100% of all contributions in 1986, after which the provision went away(Ackerman and Auten 2006, p. 510).
21The rules are summarized in IRS, Charitable Contribution Deductions,http://www.irs.gov/charities/charitable/article/0,,id=134331,00.html, (4/26/12). Contributions tomost private foundations and a few other types of charitable organizations are limited to 30% of adjustedgross income and gifts to some organizations are limited to 20%. See IRS, Exempt Organizations SelectCheck, http://www.irs.gov/charities/article/0,,id=252661,00.html, (4/26/12). There has been and willbe a further percentage reduction on all itemized deductions for taxpayers whose AGI exceeds a specificthreshold, with total itemized deductions being reduced by as much as 20% (Ackerman and Auten 2006,
40
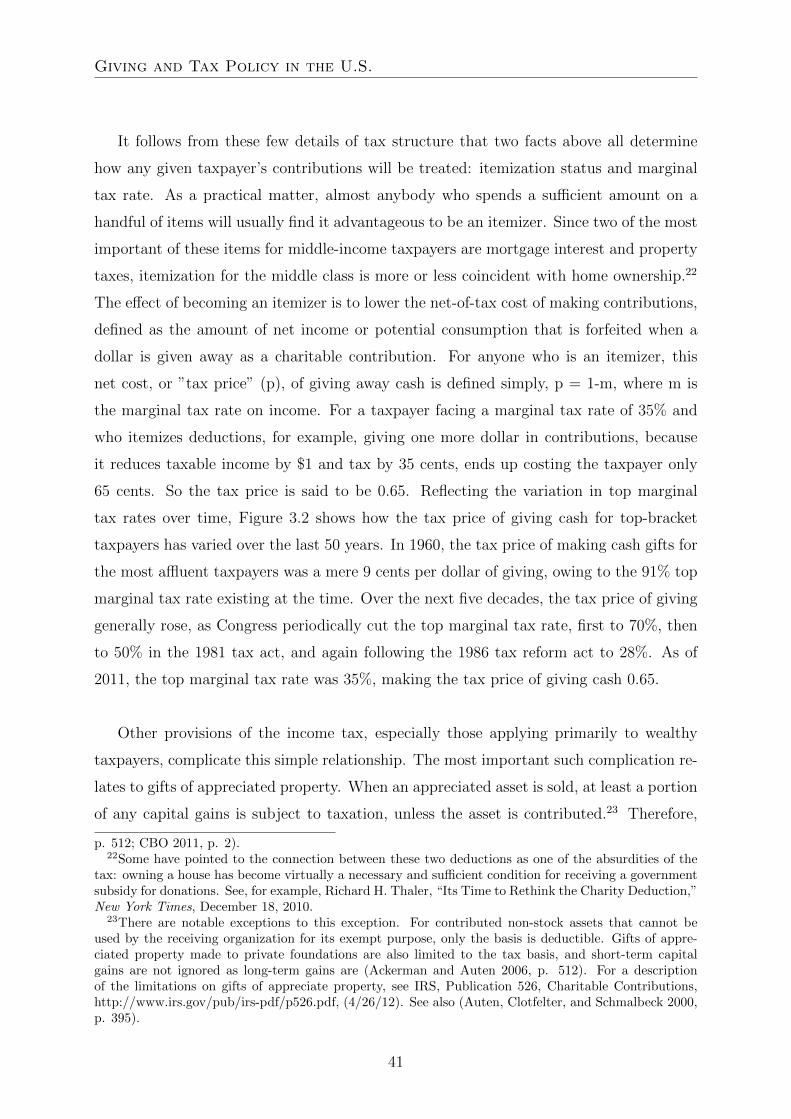
Giving and Tax Policy in the U.S.
It follows from these few details of tax structure that two facts above all determine
how any given taxpayer’s contributions will be treated: itemization status and marginal
tax rate. As a practical matter, almost anybody who spends a sufficient amount on a
handful of items will usually find it advantageous to be an itemizer. Since two of the most
important of these items for middle-income taxpayers are mortgage interest and property
taxes, itemization for the middle class is more or less coincident with home ownership.22
The effect of becoming an itemizer is to lower the net-of-tax cost of making contributions,
defined as the amount of net income or potential consumption that is forfeited when a
dollar is given away as a charitable contribution. For anyone who is an itemizer, this
net cost, or ”tax price” (p), of giving away cash is defined simply, p = 1-m, where m is
the marginal tax rate on income. For a taxpayer facing a marginal tax rate of 35% and
who itemizes deductions, for example, giving one more dollar in contributions, because
it reduces taxable income by $1 and tax by 35 cents, ends up costing the taxpayer only
65 cents. So the tax price is said to be 0.65. Reflecting the variation in top marginal
tax rates over time, Figure 3.2 shows how the tax price of giving cash for top-bracket
taxpayers has varied over the last 50 years. In 1960, the tax price of making cash gifts for
the most affluent taxpayers was a mere 9 cents per dollar of giving, owing to the 91% top
marginal tax rate existing at the time. Over the next five decades, the tax price of giving
generally rose, as Congress periodically cut the top marginal tax rate, first to 70%, then
to 50% in the 1981 tax act, and again following the 1986 tax reform act to 28%. As of
2011, the top marginal tax rate was 35%, making the tax price of giving cash 0.65.
Other provisions of the income tax, especially those applying primarily to wealthy
taxpayers, complicate this simple relationship. The most important such complication re-
lates to gifts of appreciated property. When an appreciated asset is sold, at least a portion
of any capital gains is subject to taxation, unless the asset is contributed.23 Therefore,
p. 512; CBO 2011, p. 2).22Some have pointed to the connection between these two deductions as one of the absurdities of the
tax: owning a house has become virtually a necessary and sufficient condition for receiving a governmentsubsidy for donations. See, for example, Richard H. Thaler, “Its Time to Rethink the Charity Deduction,”New York Times, December 18, 2010.
23There are notable exceptions to this exception. For contributed non-stock assets that cannot beused by the receiving organization for its exempt purpose, only the basis is deductible. Gifts of appre-ciated property made to private foundations are also limited to the tax basis, and short-term capitalgains are not ignored as long-term gains are (Ackerman and Auten 2006, p. 512). For a descriptionof the limitations on gifts of appreciate property, see IRS, Publication 526, Charitable Contributions,http://www.irs.gov/pub/irs-pdf/p526.pdf, (4/26/12). See also (Auten, Clotfelter, and Schmalbeck 2000,p. 395).
41
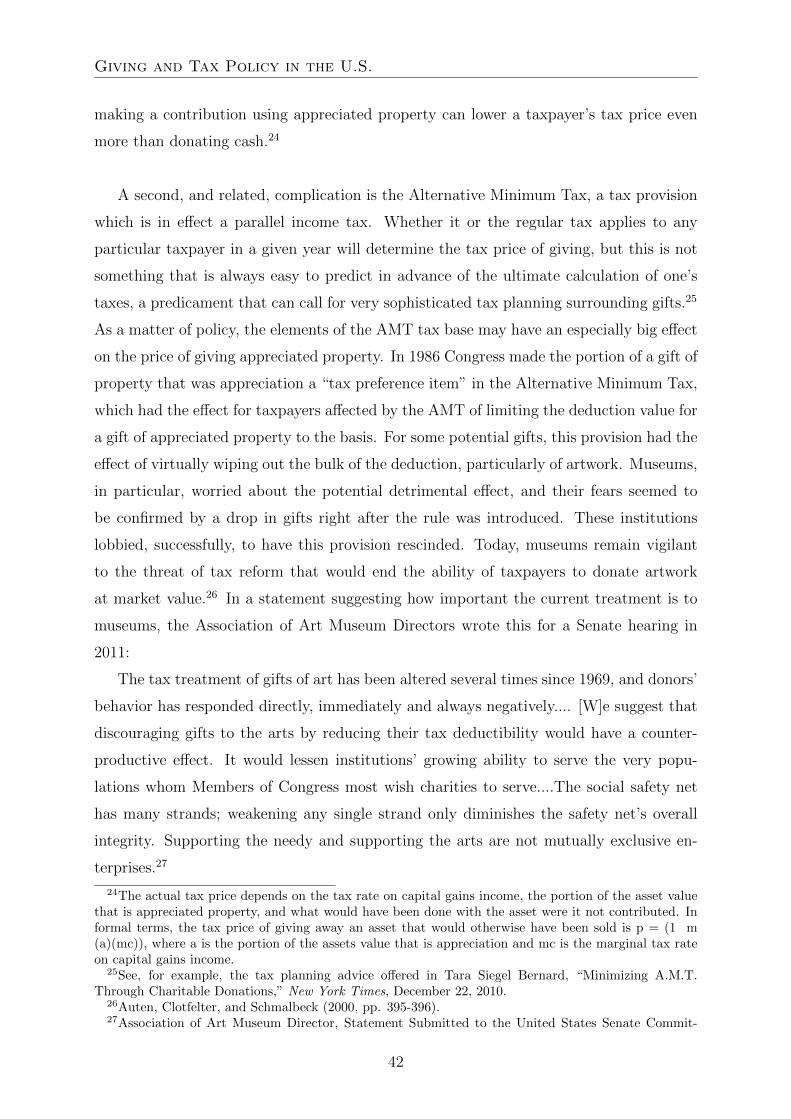
Giving and Tax Policy in the U.S.
making a contribution using appreciated property can lower a taxpayer’s tax price even
more than donating cash.24
A second, and related, complication is the Alternative Minimum Tax, a tax provision
which is in effect a parallel income tax. Whether it or the regular tax applies to any
particular taxpayer in a given year will determine the tax price of giving, but this is not
something that is always easy to predict in advance of the ultimate calculation of one’s
taxes, a predicament that can call for very sophisticated tax planning surrounding gifts.25
As a matter of policy, the elements of the AMT tax base may have an especially big effect
on the price of giving appreciated property. In 1986 Congress made the portion of a gift of
property that was appreciation a “tax preference item” in the Alternative Minimum Tax,
which had the effect for taxpayers affected by the AMT of limiting the deduction value for
a gift of appreciated property to the basis. For some potential gifts, this provision had the
effect of virtually wiping out the bulk of the deduction, particularly of artwork. Museums,
in particular, worried about the potential detrimental effect, and their fears seemed to
be confirmed by a drop in gifts right after the rule was introduced. These institutions
lobbied, successfully, to have this provision rescinded. Today, museums remain vigilant
to the threat of tax reform that would end the ability of taxpayers to donate artwork
at market value.26 In a statement suggesting how important the current treatment is to
museums, the Association of Art Museum Directors wrote this for a Senate hearing in
2011:
The tax treatment of gifts of art has been altered several times since 1969, and donors’
behavior has responded directly, immediately and always negatively.... [W]e suggest that
discouraging gifts to the arts by reducing their tax deductibility would have a counter-
productive effect. It would lessen institutions’ growing ability to serve the very popu-
lations whom Members of Congress most wish charities to serve....The social safety net
has many strands; weakening any single strand only diminishes the safety net’s overall
integrity. Supporting the needy and supporting the arts are not mutually exclusive en-
terprises.27
24The actual tax price depends on the tax rate on capital gains income, the portion of the asset valuethat is appreciated property, and what would have been done with the asset were it not contributed. Informal terms, the tax price of giving away an asset that would otherwise have been sold is p = (1 m(a)(mc)), where a is the portion of the assets value that is appreciation and mc is the marginal tax rateon capital gains income.
25See, for example, the tax planning advice offered in Tara Siegel Bernard, “Minimizing A.M.T.Through Charitable Donations,” New York Times, December 22, 2010.
26Auten, Clotfelter, and Schmalbeck (2000, pp. 395-396).27Association of Art Museum Director, Statement Submitted to the United States Senate Commit-
42
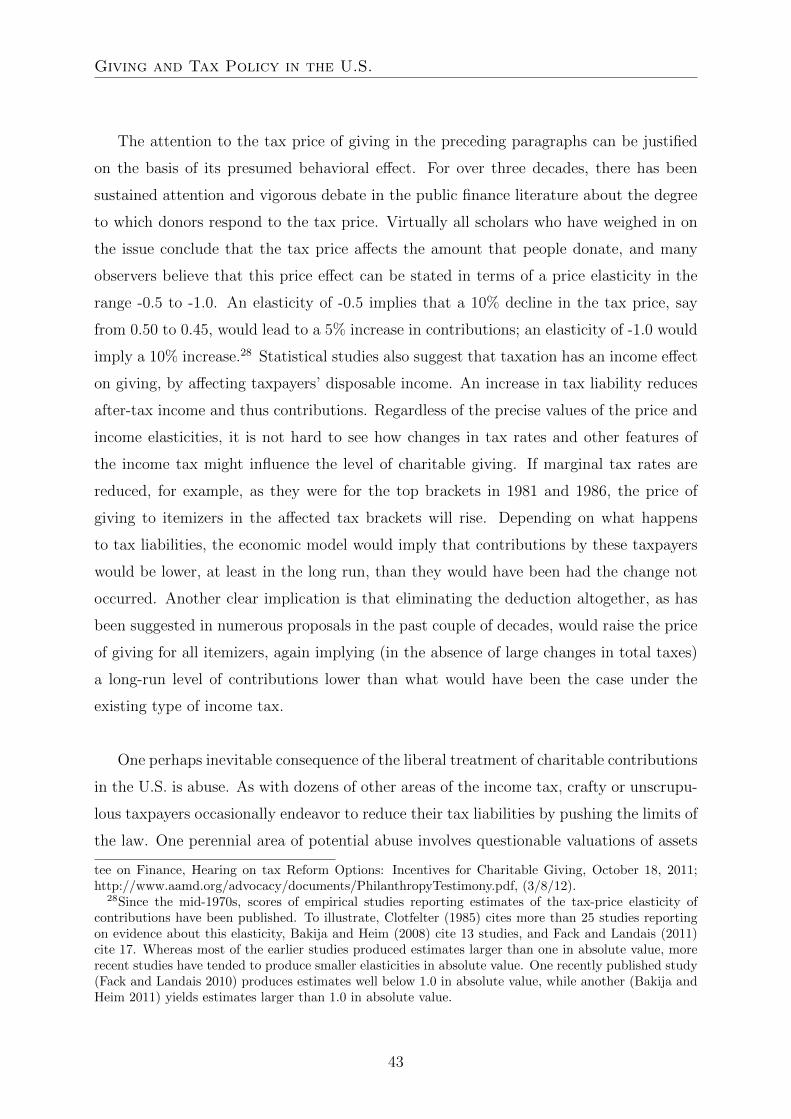
Giving and Tax Policy in the U.S.
The attention to the tax price of giving in the preceding paragraphs can be justified
on the basis of its presumed behavioral effect. For over three decades, there has been
sustained attention and vigorous debate in the public finance literature about the degree
to which donors respond to the tax price. Virtually all scholars who have weighed in on
the issue conclude that the tax price affects the amount that people donate, and many
observers believe that this price effect can be stated in terms of a price elasticity in the
range -0.5 to -1.0. An elasticity of -0.5 implies that a 10% decline in the tax price, say
from 0.50 to 0.45, would lead to a 5% increase in contributions; an elasticity of -1.0 would
imply a 10% increase.28 Statistical studies also suggest that taxation has an income effect
on giving, by affecting taxpayers’ disposable income. An increase in tax liability reduces
after-tax income and thus contributions. Regardless of the precise values of the price and
income elasticities, it is not hard to see how changes in tax rates and other features of
the income tax might influence the level of charitable giving. If marginal tax rates are
reduced, for example, as they were for the top brackets in 1981 and 1986, the price of
giving to itemizers in the affected tax brackets will rise. Depending on what happens
to tax liabilities, the economic model would imply that contributions by these taxpayers
would be lower, at least in the long run, than they would have been had the change not
occurred. Another clear implication is that eliminating the deduction altogether, as has
been suggested in numerous proposals in the past couple of decades, would raise the price
of giving for all itemizers, again implying (in the absence of large changes in total taxes)
a long-run level of contributions lower than what would have been the case under the
existing type of income tax.
One perhaps inevitable consequence of the liberal treatment of charitable contributions
in the U.S. is abuse. As with dozens of other areas of the income tax, crafty or unscrupu-
lous taxpayers occasionally endeavor to reduce their tax liabilities by pushing the limits of
the law. One perennial area of potential abuse involves questionable valuations of assets
tee on Finance, Hearing on tax Reform Options: Incentives for Charitable Giving, October 18, 2011;http://www.aamd.org/advocacy/documents/PhilanthropyTestimony.pdf, (3/8/12).
28Since the mid-1970s, scores of empirical studies reporting estimates of the tax-price elasticity ofcontributions have been published. To illustrate, Clotfelter (1985) cites more than 25 studies reportingon evidence about this elasticity, Bakija and Heim (2008) cite 13 studies, and Fack and Landais (2011)cite 17. Whereas most of the earlier studies produced estimates larger than one in absolute value, morerecent studies have tended to produce smaller elasticities in absolute value. One recently published study(Fack and Landais 2010) produces estimates well below 1.0 in absolute value, while another (Bakija andHeim 2011) yields estimates larger than 1.0 in absolute value.
43

Giving and Tax Policy in the U.S.
that are donated. For the common man, this ploy might take the form of claiming an
exaggerated value for old clothes donated to the Salvation Army thrift store. Because
valuations of this sort mostly work on the honor system, there is often latitude for a tax-
payer to overstate the market value of the donated items, should he or she be so inclined.
A recent study found surprisingly large amounts claimed for contributions of non-cash
items. For those taxpayers claiming a deduction for used clothing, the average amount
deducted in 2004 was more than $1,400. For household items, it was more than $1,300
(Ackerman and Auten 2008, Table 4). Similar abuse has been associated with donating
used cars, but much of the abuse associated with that form of giving has been eliminated
in recent years.29 The real potential for mischief lies in donations of assets whose value
has risen rather than fallen. Thus one tempting form of abuse is exaggerating the value of
donated art work, making such behavior a longstanding concern for policy makers and tax
authorities. Another suspicious pattern recently documented is gifts of company stock to
family foundations and other charities. A study found that a remarkably large proportion
of such gifts were made when the company’s stock was at its peak price (Yerdmack 2009).30
3.3 The Outsized Role of the Rich
A signal feature of the American grants economy, noted in section I, is the considerable
influence that individuals have over the allocation of public subsidies. For the affluent,
this point deserves to be made in bold face type. A Methodist congregation in Kansas
can decide to put a steeple on its church building, and the government will subsidize that
steeple, but only to the extent that those parishioners itemize their deductions. If, as is
often the case in many religious congregations across the country, most members take the
standard deduction, there will be little in the way of tax subsidy for that steeple. Now
consider a taxpayer who wishes to make a $50,000 gift to Stanford University. A gift of
29It was possible a decade ago to deduct exaggerated values for vehicles whose true market value werefar below the value shown on standard publications, and even then the nonprofit organizations typicallyreceived only a portion of that, after fundraising companies specializing in these transactions had takenas much as two thirds of the value. In 2004, the law was changed, requiring vehicles to be donated to low-income individuals. See Tyler Cabot, “The Tow-Away Tax Break: Why Car Donation Programs BenefitEveryone but the Charities Theyre Intended to Help,” Washington Monthly, June 2002, pp. 39-42 andArden Dale, ‘Tax Breaks for Donating a Car,” Wall Street Journal, July 25, 2008. Such compliance issuesare the reason why the charitable deduction appears on the IRSs “Dirty Dozen Tax Scams for 2012” list;http://www.irs.gov/newsroom/article/0,,id=254383,00.html, (3/16/12).
30In addition, Yerdmack (2009) also found that stock given to family foundations was held rather thansold, allowing the donor to retain voting power in the corporation.
44
Giving and Tax Policy in the U.S.
this size might be made to set up a special fund for library collections or for need-based
financial aid. Or, for the athletically-inclined, a gift of this amount will allow a donor to
travel with the Stanford football team to an away game.31 If this donation is made in
cash, American taxpayers, by virtue of the deduction, in effect subsidize the gift to the
tune of $17,500, leaving the donor to bear the remaining $32,500.
Three features of the income tax treatment of contributions are particularly conducive
to this outsized influence. One is the standard deduction, which effectively limits item-
ization to a minority of taxpayers, most of whom have above-average incomes. A second
is the upside-down nature of the deduction. Owing to the role of itemization and the
progressivity of the tax rate structure of the tax, the affluent face the lowest tax price of
giving among all taxpayers. Third, the especially favorable treatment of gifts of appre-
ciated property, which is held disproportionately by the affluent, further reduces the tax
price. Beyond these advantages, the affluent and their tax advisors over the years have
shown remarkable ingenuity in devising ways of reducing their tax burdens while making
contributions. For its part, Congress has responded by erecting restrictions on giving,
whose primary effect is on high-income taxpayers, but these limits do not negate those
three features of the law.
By virtue of their high incomes and these favorable tax features, the wealthy not only
account for a vastly disproportionate share of the country’s total charitable donations,
but they also account for an even bigger share of tax subsidies for donations. As shown
in Table 3.4, individuals with incomes over $500,000, representing just 1% of all taxpay-
ers and earning 18% of all income, accounted for almost a quarter of all contributions in
2008 (including those made by non-itemizers). By contrast, taxpayers with incomes under
$50,000, who were almost two thirds of all taxpayers, had about a fifth of the income and
made about a fifth of all donations. To see that the distribution of tax subsidies was even
more lopsided than the distribution of donations, consider the table’s last column, show-
ing the percentage of taxpayers in each income category who itemized their deductions.
The table shows that only 15% of these under-$50,000 taxpayers were itemizers, imply-
ing that 85% of the taxpayers in that category received no subsidy at all. In contrast,
31Stanford’s athletic booster organization, the Buck-Cardinal Club, publishes a chart showing thebenefits available at various giving levels. A gift of $50,000 enrolls the donor in the Directors Circle andentitles the donor “to travel with the football team to a select away game (maximum of two people).”http://grfx.cstv.com/photos/schools/stan/genrel/auto pdf/BCC-Benefits-chart.pdf, (3/8/12).
45
Giving and Tax Policy in the U.S.
virtually all those in the top categories itemized their deductions. Further differentiating
the subsidies received at the top and bottom of the income scale is the fact that those at
the top also faced higher marginal rates on average, making the subsidy per dollar given
greater than for those who itemized in the bottom income category. In 2006 taxpayers
with incomes over $100,000 received 76% of the total $40.9 billion tax subsidy due to the
charitable deduction, although they made just 57% of all donations. In contrast, those
with incomes less than $50,000 received just 5% of the subsidy, despite making 19% of all
contributions (CBO 2011, p. 4).32
These differences in the rate of tax subsidy across the income scale take on added
significance when one considers the particular charitable tastes of the wealthy. As noted
above, taxpayers with incomes over $1 million tend to favor higher education, health,
and the arts. For the super-wealthy, these preferences are even more pronounced. An
analysis of the 90 largest gifts in 1996, for example, showed a stunning 56% of the to-
tal going to higher education. In addition, 17% went to health organizations, 14% to
arts and culture, and 8% to private foundations.33 Patterns of charitable bequests by
the wealthy lean heavily toward private foundations.34 A tabulation for estates in 1995
showed that nearly three quarters of bequests from estates over $20 million went to foun-
dations. The wealthy have long occupied a prominent position in American philanthropy,
of course, as seen in the foundations established by captains of industry like Carnegie,
Duke, and Rockefeller. Today’s stars of industry and finance are no less prominent, and,
indeed, discussion of “the 1%” is very prominent these days. One development of note,
though, is a movement among some of America’s wealthiest individuals to emulate those
nineteenth century philanthropists by giving away most of their money. This movement
has been formalized in the form of a public pledge to give a majority of their wealth to
philanthropy in their lifetimes or after their death.35 The very biggest donors, indeed,
are in a class by themselves. Not surprisingly, they enjoy a disproportionate amount
of influence in the governance of the nonprofit organizations receiving their donations.
32These figures, like those in Table 3.4, are based on all taxpayers, not just those who itemized.33See Clotfelter et al., (1998, Table 12.2, p. 406). For the most recent data on large gifts, see the
Slate 60, http://www.slate.com/articles/life/the slate60/2011/02/the 2010 slate 60.html, (3/29/12). Bycomparison, charitable bequests reveal similar patterns, with private foundations accounting for thelargest share for the very biggest estates. The shares of bequests in 2007 for estates of $3.5 million ormore were: philanthropy, 56.5%; education, 12.3%; arts, 6.7%; human services, 4.9%; health and medical,4.3%; religion, 4.2%; environment, 2.3%; and other, unknown, 8.8% (Raub 2009).
34Auten, Clotfelter, and Schmalbeck (2000, p. 415).35The Giving Pledge http://givingpledge.org/, (3/29/12). Michael Bloomberg, Warren Buffett, Paul
Allen, Charles Feeney, Bill and Melinda Gates. T. Boone Pickens, Ted Turner.
46

Giving and Tax Policy in the U.S.
A glance at the board of directors of any large museum or private university, even the
guest list in the president’s box at a university’s football stadium, will attest to this dis-
proportionate influence. Arguably, their influence would be large even if there were no
charitable deduction, but U.S. tax policy enhances that influence. What else do these big
donors get in return for their big gifts? According to Ostrower (1995), philanthropy for
the wealthy takes on considerable social significance, acting as a marker of elite status.
Being identified as a member of this exclusive circle is strengthened by membership on
boards and recognition at dinners, receptions, and other public events. Not only do they
sit on governing boards and boards of visitors, but they are also invited to receptions,
and singled out for recognition at public events. There are also naming opportunities,
ranging from the scholarship or alcove worth a million dollars to having a building, or
even a school, named after you. At one extreme, Odendahl (1989, p. 243) has argued
that the wealthiest donors fund institutions from which they benefit and over which they
exert great control: “Whether it be high culture, high education, or the high medicine of
private nonprofit hospitals, the rich fund and make policy for these institutions, while, on
the whole, the middle class produces the cultural and intellectual products and services.”36
Although the charitable deduction has been justified on the basis that money given
away is no longer available to the donor, and therefore should not be taxed as income,
there are ways for donors, particularly wealthy ones, to retain considerable control even
after the donation has been made. The most effective means of doing so is the private
foundation. Subject to several limitations, most of which were imposed by the Congress in
1969, wealthy individuals can retain control over how their charitable funds are distributed
to the ultimate charitable recipients simply by remaining in control of their own private
foundation.37 For less expense and trouble, donors with more modest means can likewise
receive an immediate tax deduction while retaining some control over the disposition of
funds by utilizing donor-advised funds, commonly overseen by community foundations
36Community leaders from the middle class may play similar leadership roles in local fundraisingefforts. In their classic sociological study of American urban life in the 1920s, Lynd and Lynd (1929,p.464) describe the launching of the community chest drive in Muncie, Indiana: “The first step was toenlist the big men in town, the Rotary crowd, as the responsible heads upon whom success or failuredepended. There was the minimum of Christian caritas about it, no zeal for a particular emergency orneedy family....”
37Among the limitations imposed on foundations are: a lower portion of income may be deducted forgifts to them; deductions of gifts of appreciated property to them are limited to the tax basis rather thantheir market value; a minimum of 5% of assets must be distributed each year; there are limitations onself-dealing; and there is an excise tax on investment income (Auten, Clotfelter, and Schmalbeck 2000,p. 397).
47
Giving and Tax Policy in the U.S.
and investment companies, or a so-called supporting organization, often established by
large nonprofits like universities.38 These latter two mechanisms also offer the taxpayer a
chance to smooth their giving over time when their income fluctuates from year to year.
More commonly, large gifts often confer influence of an informal nature. Big donors may
be rewarded, for example, with a seat on the museum’s board of directors or the univer-
sity’s board of visitors.39
Americans often write in celebratory terms about the country’s generosity and volun-
tary spirit, and indeed there is much that is admirable in the U.S system. But, as John
Shoven (2000, pp. 425-426) has noted, one can question just how public-spirited some
of this giving really is. Since donations are often used for things the government would
not have purchased, it is natural to compare the public benefit of tax expenditures for
donations with what those dollars would have paid for in the absence of the donation.
Shoven’s example is a $3 million bequest to pay for a fountain on a university campus.
Shoven asks the question: Which taxpayer is more charitable, the one who makes the do-
nation, thereby imposing all taxpayers to subsidize it, or the one who makes no donation,
thus increasing total tax receipts by the amount that would otherwise have been forgone
tax revenue? The answer will inevitably depend in part on one’s comparison of the so-
cial value of the donation and that of the government’s counterfactual expenditure. But
suppose gridlock on Capitol Hill means that the kinds of international programs under-
taken by the Gates Foundation can only be done through charitable contributions. Then
Shoven’s speculation could well be turned on its head, leading back to what has become
one of the principal justifications for nonprofit organizations - that they plug holes in the
provision of public goods left when both the market and government fail to supply them.40
This example suggests the possibility of applying different rates of subsidy to different
types of donations depending on the public benefit generated, an approach implied by
some theoretical models (e.g., Saez 2004). The U.S. tax law has largely sidestepped this
issue, choosing instead to differentiate simply by allowing or disallowing gifts by type of
organization. The result is that the tax system can end up subsidizing donations that
yield little apparent public benefit.41
38See Auten, Clotfelter, and Schmalbeck (2000, p. 398). In recent years, Fidelity and other invest-ment companies have made it easy for investors to set up donor-advised funds. See Fidelity Charitable,http://www.fidelitycharitable.org/giving-strategies/give/donor-advised.shtml, (5/2/12).
39See, for example, Meer and Rosen (2009), for an analysis of the behavior of alumni donors to a privateuniversity.
40For a cogent statement of this thesis, see Weisbrod (1988).41One such category is donations to aid commercial college sports enterprises. See Charles Clotfelter,
48

Giving and Tax Policy in the U.S.
3.4 Ongoing Issues in U.S. Tax Policy and Charitable
Giving
Change could come about in U.S. tax policy toward charitable giving - inadvertently or
deliberately. As to the first, the treatment of contributions could find itself an innocent
bystander affected by wider tax reform. Judging from the policy debates in Washington,
the individual income tax, that reliable source of more federal revenue than any other
source, has many critics but precious few admirers. Among the most frequent charges
against it are that it is unnecessarily complex, that it taxes the rich too lightly, and that
its many loopholes make it unfair and inefficient. At the same time, among the existing
tax’s many provisions, the deduction for charitable contributions does enjoy wide sup-
port, a fact that becomes evident as soon as someone proposes to simplify the income
tax by getting rid of base-eroding loopholes, usually for the purpose of lowering tax rates.
“Flat rate tax” schemes, a tax reform cottage industry in the 1980s, enjoyed a resur-
gence in 2012 with one presidential candidate’s advocacy of a plan to tax income at a
flat 9% rate.42 The argument that the rich are taxed lightly, central to the opposition
to extending the George W. Bush tax cuts for the high-income taxpayers, got a second
wind thanks to billionaire Warren Buffett’s complaint that he paid a lower income tax
rate than his secretary.43 The debate about fairness was also fueled by evidence showing
that households at the very top of the income distribution were enjoying a growing share
of the economic pie.44 Whether any of these complaints would ultimately lead to tax
reform was unclear, they bring to mind the quip that “skeptical politicians rank serious
tax reform with gun control and free world trade - as worthy causes unworthy of the time
of realists.”45 Yet major tax reform - incorporating changes in marginal tax rates or the
charitable deduction itself - does occasionally happen, and when it does, it will inevitably
affect donors’ incentives to give.
“Uncle Sam Takes one for the Team,” Washington Post, December 31, 2010.42Herman Cains “999” plan was not a fully fleshed out proposal, however, as were some of the proposals
of the 1980s, like the Hall-Rabuska Flat Tax; http://www.hoover.org/publications/books/8329, (4/1/12).43Warren E. Buffett, “Stop Coddling the Super-Rich,” New York Times, August 14, 2011.44Between 1977 and 2007, the share of total income going to households in the top 1% doubled, from
10% to 20% (CBO, Trends, 2011, p. xi).45Editorial, “Yes, There Is a Better Income Tax,” New York Times, June 6, 1982.
49

Giving and Tax Policy in the U.S.
Beyond the slim but ever-present possibility of fundamental reform, a second way tax
treatment of charitable giving could change is by way of deliberate modification of the
current deduction. One motivation for change is unhappiness with the whole upside-down
nature of the existing subsidy. A straightforward remedy would be to replace the deduc-
tion with a credit that applies to all taxpayers. A less radical approach would be to cap
the tax rate applied to the deduction, exemplified by the Obama Administration’s pro-
posal to limit itemized deductions to 28%, or to allow nonitemizers to deduct donations,
as they could briefly, in 1986.46 But in opposition to any expansion of the deduction are
those who want to see the tax base expanded rather than narrowed. Thus one perennial
idea is to permit a deduction, but only for donations that exceed a certain floor. Not only
would a floor reduce the amount of revenue lost, it would also simplify tax compliance,
since taxpayers giving less than the floor would not need to keep records. It would also
eliminate at least one source of potentially questionable deductions, since the tax author-
ities currently have no way to verify small charitable contributions. A drawback to a floor
is that some taxpayers would lose the tax incentive, at the margin, to donate, or might
seek to bunch their gifts, for example, by donating every other year, so that they could
deduct more of their giving, thus negating some of a floor’s potential revenue savings.
Such a floor (at 1% of income) was one of the reforms proposed by a prominent panel
in 2005. The panel’s other ideas for reforming the treatment of charitable contributions
included mandating that charities report to the IRS all gifts over a certain size, reconsid-
ering the kinds of organizations eligible to receive deductible gifts, and requiring the gains
on gifts of appreciated property to be realized, while retaining the non-taxation of gains.47
To assess the likely effects of some of these reforms, the CBO recently produced projec-
tions based on simulated effects for individual taxpayers, using data for 2006. Presented
in Table 5, the first two show the projected effects of placing a floor beneath the current
deduction. Imposing a $1,000 floor for joint returns ($500 for individuals) would, as ex-
pected, save revenue and discourage contributions, but imposing a much more stringent
2% of AGI floor would have much bigger effects, of both kinds.48 Extending the deduction
to nonitemizers would increase the tax subsidy by more than 10% but increase total giving
by only 1%. The last four options included in the table show the effects of replacing the
46Robert Frank, “Why Obamas Jobs Bill Could be Bad for Charity,” Wall Street Journal, September13, 2011.
47President’s Advisory Panel on Federal Tax Reform (2005, pp. 75-78).48Ackerman and Auten (2006) provide simulations for a 1% floor, which are similar to those produced
by the CBO for a 2% floor.
50

Giving and Tax Policy in the U.S.
current deduction with a nonrefundable credit applied to all taxpayers. Contributions
and total subsidy are predicted to rise in the case of a credit of 25% with no floor. The
other three credit options show declines in both.
Most of the tax policy issues applying to donations during life have a counterpart in
the estate and gift tax with respect to charitable bequests. Only the aggregate dollar
amounts of charitable bequests are much smaller. Whereas deductible contributions in
the income tax were $158 billion in 2009, deductions for charitable bequests in estates
were only about $20 billion.49 To be sure, as noted above, the great bulk of charitable
bequests are made by a tiny minority of decedents, and they are much more likely to go
to private foundations or higher education than are contributions from the living. In 2012
the tax applied to estates of $5.12 million or more, with a rate of 35%. As with giving in
life, bequest giving is thought to have a tax price effect.50 So the vitriolic debate over the
“death tax” - which could lead to an increased exemption, a lower rate of tax, or outright
elimination - has the potential to leave a mark on charitable bequests. Econometric stud-
ies imply that eliminating the tax would result in declines in charitable bequests ranging
from 20 to 37% (Joulfaian 2009, p. 1227).51
3.5 Conclusion
Charitable contributions play a bigger role in the provision of public goods in the United
States than in other developed countries. By allowing taxpayers to have a large role in
allocating public subsidies, American tax law reflects a tradition of reliance on nonprofit
organizations and individual choice, as opposed to tax-financed government provision.
The centerpiece of U.S. tax policy is a deduction for contributions to charitable, educa-
tional and scientific nonprofit organizations, a feature that ends up subsidizing the gifts of
high-income taxpayers the most, lower-income renters the least, and middle-class home-
owners in the middle. One of the most significant consequences of this tax treatment of
charitable giving is to give to the wealthiest taxpayers a disproportionate role in allocating
49Deductions in individual income tax: U.S. Internal Revenue Service, Statistics of Income 2009, Table2.1; charitable bequests: $19.7 billion in 2007, http://www.irs.gov/pub/irs-soi/07es01fy.xls, (4/8/12).
50I.R.S., Publication 950, Introduction to Estate and Gift Taxes, p. 4.51For taxpayers with enough wealth to be subject to the estate tax, making donations in life has the
extra tax benefit of reducing the taxable estate. Thus part of the observed tax effect on lifetime givingcould be masking an estate tax effect as well.
51
Giving and Tax Policy in the U.S.
public resources and influencing the direction that institutions will take. Within Amer-
ican policy, therefore, there exists an inherent conflict between participatory citizenship
and elitism.
This tax treatment could change, for either of two reasons. First, tax reforms that
modify the tax rate structure or the portion of taxpayers who itemize their deductions
will necessarily affect the tax price of giving for some or many taxpayers. Second, any
one of a number of reforms specifically related to charitable giving, such as applying a
floor, could also affect the tax price of giving. These changes would affect not only the
amount of revenue lost, but also, depending on the assumed behavioral parameters, the
amount of donations made. In light of the budget pressure to raise revenues, it would
not be surprising if one of these changes had been adopted by the time this volume goes
to press. A floor on the charitable deduction is attractive because it will save time and
revenue, depending on the amount of the floor, could have a minimal effect on charitable
giving, since it would not affect the subsidy applied to the last dollar of giving. A limit
on deductions, however, will have such an effect for taxpayers who are at the limit, thus
removing the subsidy on donations at the margin. From the standpoint of economic
efficiency, reforms that equalize subsidy rates across taxpayers, including a deduction for
non-itemizers or a tax credit, would be attractive. Politically, the latter reform seems
most unlikely.
52

Giving and Tax Policy in the U.S.
Figure 3.1: Contributions as Percent of Income:
23
Tables and figures Figure 1. Contributions as Percent of Income
6810266 16 0.038 0.0329063244 17 0.059 0.02
!0.020.000.020.040.060.080.100.120.140.160.180.20
7 12 17
Contrib
utions/A
GI
Logarithm3 of3Adjusted3Gross3 Income3(AGI)
Source:1Statistics1of1Income12009,1Table12.1.
Note:1size1of1points1are1proportional1to1contributions.
Source: Statistics of Income 2009, Table 2.1.Note: size of points are proportional to contributions.
53
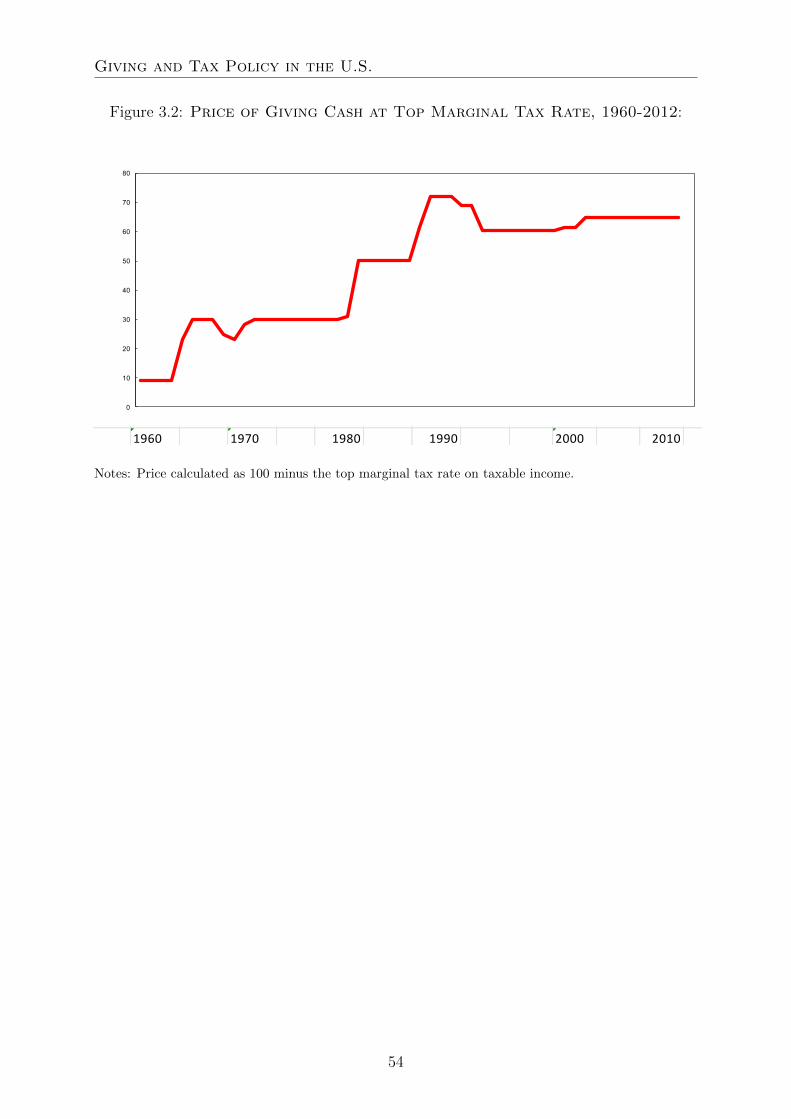
Giving and Tax Policy in the U.S.
Figure 3.2: Price of Giving Cash at Top Marginal Tax Rate, 1960-2012:
24
F igure'2''P rice'of'G iving'C ash'at'Top'Marginal'Tax'R ate,'1960@2012'
F IGUR E '1THE 'PR IC E 'OF 'G IVING 'C AS H'AND'APPR E C IATE D'PROPE R TY
1960''@''1997
1960 1970 1980 1990 2000 2010
Note:'P rice'calculated'as '100'minus 'the'top'marg inal'tax'rate'on'taxable'income.
0
10
20
30
40
50
60
70
80
Notes: Price calculated as 100 minus the top marginal tax rate on taxable income.
54
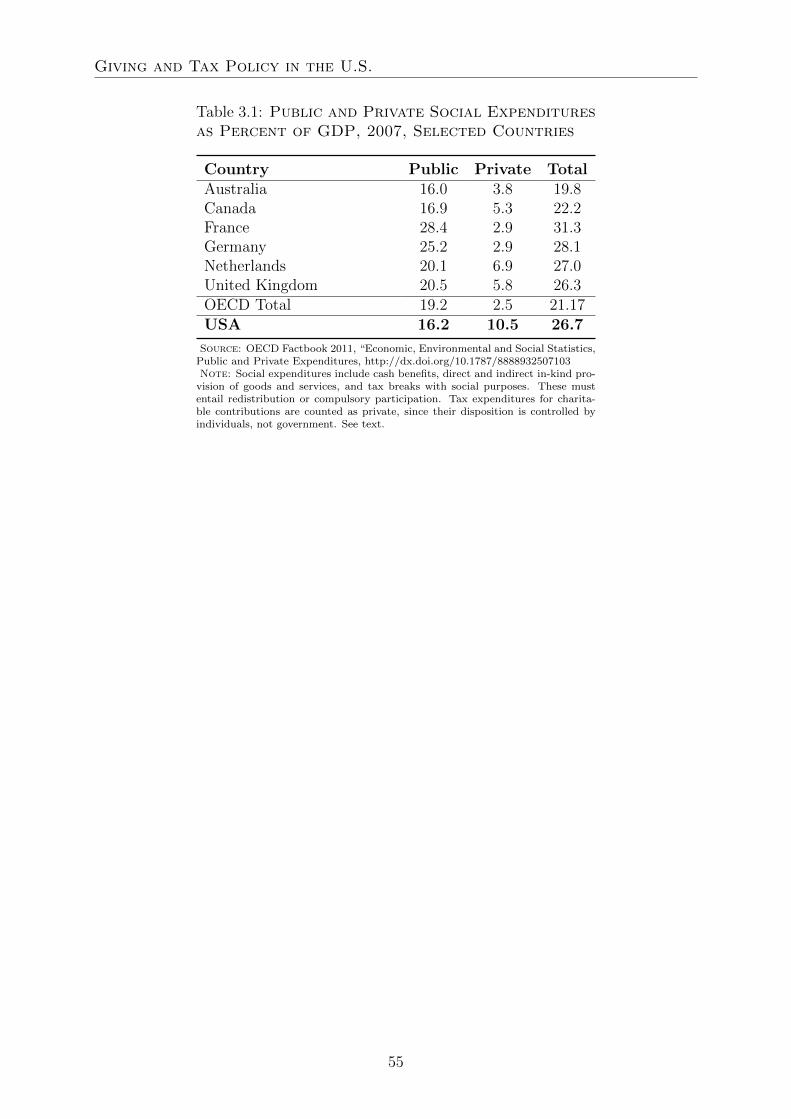
Giving and Tax Policy in the U.S.
Table 3.1: Public and Private Social Expendituresas Percent of GDP, 2007, Selected Countries
Country Public Private TotalAustralia 16.0 3.8 19.8Canada 16.9 5.3 22.2France 28.4 2.9 31.3Germany 25.2 2.9 28.1Netherlands 20.1 6.9 27.0United Kingdom 20.5 5.8 26.3OECD Total 19.2 2.5 21.17USA 16.2 10.5 26.7
Source: OECD Factbook 2011, “Economic, Environmental and Social Statistics,Public and Private Expenditures, http://dx.doi.org/10.1787/8888932507103Note: Social expenditures include cash benefits, direct and indirect in-kind pro-
vision of goods and services, and tax breaks with social purposes. These mustentail redistribution or compulsory participation. Tax expenditures for charita-ble contributions are counted as private, since their disposition is controlled byindividuals, not government. See text.
55

Giving and Tax Policy in the U.S.
Table 3.2: National Giving as Percentof GDP, Selected Countries
Country Percent
Australia 0.69Canada 0.72France 0.14Germany 0.22Netherlands 0.45United Kingdom 0.73USA 1.67
Note: Based on surveys of adults covering various years between2000 and 2004Source: International Comparisons of Charitable Giving,(Kent, UK: Charities Aid Foundation, November 2006, p.6)
56
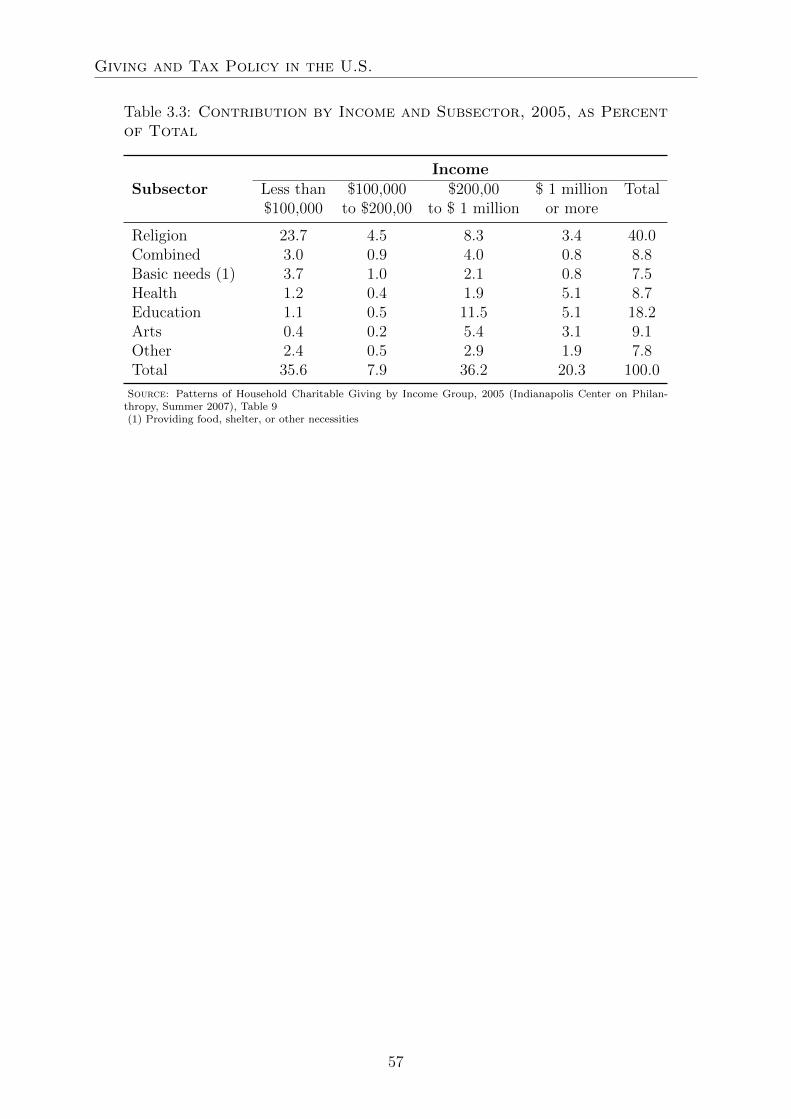
Giving and Tax Policy in the U.S.
Table 3.3: Contribution by Income and Subsector, 2005, as Percentof Total
IncomeSubsector Less than $100,000 $200,00 $ 1 million Total
$100,000 to $200,00 to $ 1 million or more
Religion 23.7 4.5 8.3 3.4 40.0Combined 3.0 0.9 4.0 0.8 8.8Basic needs (1) 3.7 1.0 2.1 0.8 7.5Health 1.2 0.4 1.9 5.1 8.7Education 1.1 0.5 11.5 5.1 18.2Arts 0.4 0.2 5.4 3.1 9.1Other 2.4 0.5 2.9 1.9 7.8Total 35.6 7.9 36.2 20.3 100.0
Source: Patterns of Household Charitable Giving by Income Group, 2005 (Indianapolis Center on Philan-thropy, Summer 2007), Table 9(1) Providing food, shelter, or other necessities
57
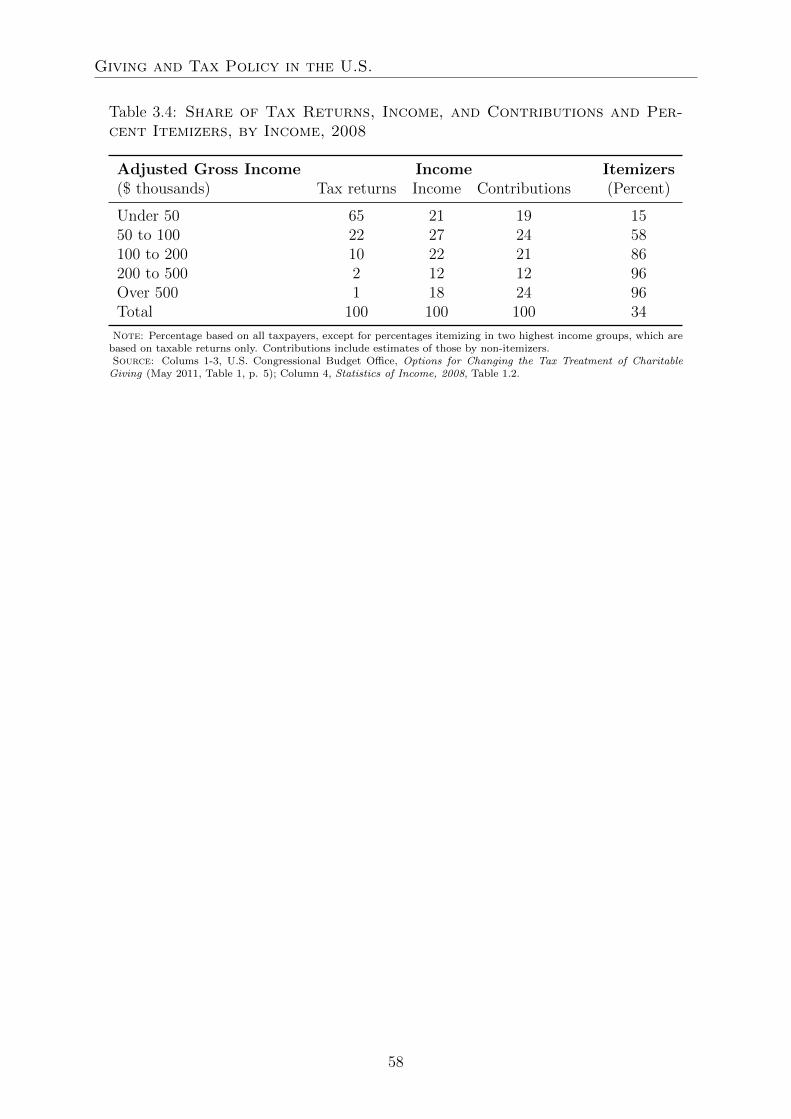
Giving and Tax Policy in the U.S.
Table 3.4: Share of Tax Returns, Income, and Contributions and Per-cent Itemizers, by Income, 2008
Adjusted Gross Income Income Itemizers($ thousands) Tax returns Income Contributions (Percent)
Under 50 65 21 19 1550 to 100 22 27 24 58100 to 200 10 22 21 86200 to 500 2 12 12 96Over 500 1 18 24 96Total 100 100 100 34
Note: Percentage based on all taxpayers, except for percentages itemizing in two highest income groups, which arebased on taxable returns only. Contributions include estimates of those by non-itemizers.Source: Colums 1-3, U.S. Congressional Budget Office, Options for Changing the Tax Treatment of CharitableGiving (May 2011, Table 1, p. 5); Column 4, Statistics of Income, 2008, Table 1.2.
58

Giving and Tax Policy in the U.S.
Table 3.5: CBOs Predicted Effects for Eight Illustrative Tax Reforms,2006 Levels
Floor for Total Taxdonations? Contributions subsidy
($ billion) ($ billion)
Current LawDeduction for itemizers only No 203.0 40.9
Changes from current LawDeduction for itemizers only $500 / $ 1,000 -0.5 -5.6Deduction for itemizers only 2% of AGI -3.0 -15.7Extend Deduction to nonitemizers No 2.0 5.2Extend Deduction to nonitemizers 2% of AGI 1.9 -13.1Replace deduction with 25% credit No 2.7 7.1Replace deduction with 25% credit 2% of AGI -1.0 -11.9Replace deduction with 25% credit No -7.8 -13.3Replace deduction with 25% credit 2% of AGI -10.0 -24.6
Note: $500/$1,000 would be $500 for individual filers and $1,000 for joint filers. Credits would be non-refundable.Changes in contributions assume a price elasticity of -0.5.Source: Congressional Budget Office (2011, Summary Table 1, p ix).
59
Giving and Tax Policy in the U.S.
References
Ackerman, Deena and Gerald E. Auten, “Floors, Ceilings, and Opening the Door for
a Non-Itemizer Deduction,” National Tax Journal 59 (2006), 509-530.
Ackerman, Deena and Gerald Auten, “Tax Expenditures for Noncash Charitable Con-
tributions,” draft chapter presented at the NBER conference, “Incentive and Distribu-
tional Consequences of Tax Expenditures,” March 27-29, 2008.
Alesina, Alberto, Edward Glaeser, and Bruce Sacerdote, “Why Doesn’ t the United
States Have a European-Style Welfare State?” Brookings Papers on Economic Activity 2
(2001), 1-69.
Andrews, William D., “Personal Deductions in an Ideal Income Tax,” Harvard Law
Review 86 (1972), 309-385.
Auten, Gerald E., Charles T. Clotfelter, and Richard L. Schmalbeck, “Taxes and
Philanthropy among the Wealthy,” in Joel Slemrod (ed.), Does Atlanta Shrug? The
Economics Consequences of Taxing the Rich (New York NY and Cambridge MA: Russell
Sage Foundation and Harvard University Press, 2000), pp. 392-424.
Auten, Gerald E., Holger Sieg, and Charles T. Clotfelter, “Charitable Giving, Income
and Taxes: An Analysis of Panel Data,” American Economics Review 92 (2002), 371-382.
Auten, Gerald, James Cilke, and William Randolph, “The Effects of Tax Reform on
Charitable Contributions,” National Tax Journal 45 (1992), 267-290.
Bakija, Jon and Bradley Heim, “How Does Charitable Giving Respond to Incentives
and Income? New Estimates for Panel Data,” National Tax Journal 64 (June 2011),
615-650.
Bremner, Robert H., “Private Philanthropy and Public Needs: Historical Perspec-
tive,” in Commission on Private Philanthropy and Public Needs, Research Papers, Vol. I
(Washington: U.S. Treasury Department, 1977).
Cabot, Tyler, “The Tow-Away Tax Break: Why Car Donation Programs Benefit
Everyone but the Charities They’re Intended to Help,” Washington Monthly, June 2002,
pp. 39-42.
Center on Philanthropy, Indiana University, Patterns of Household Charitable Giving
by Income Group 2005 (2007).
Clotfelter, Charles T., American Universities in a Global Market (Chicago: University
of Chicago Press, 2010).
Clotfelter, Charles T., “The Economics of Giving,” in John W. Barry and Bruno V.
60

Giving and Tax Policy in the U.S.
Manno (eds.), Giving Better, Giving Smarter: Working Papers of the National Com-
mission on Philanthropy and Civic Renewal (Washington, DC: National Commission on
Philanthropy and Civic Renewal, 1997), pp. 31-55. Clotfelter, Charles T., Federal Tax
Policy and Charitable Giving (Chicago: University of Chicago Press, 1985).
Clotfelter, Charles T. (ed.), Who Benefits from the Nonprofit Sector? (Chicago: Uni-
versity of Chicago Press, 1992).
Eaton, David H. and Martin I. Milkman, “An Empirical Examination of the Factors
that Influence the Mix of Cash and Noncash Giving to Charity,” Public Finance Review
32 (2004), 610-630.
Fack, Gabrielle, and Camille Landais. 2010. ”Are Tax Incentives for Charitable Giving
Efficient? Evidence from France,” American Economic Journal: Economic Policy, 2(2):
117-41. Giving USA 2011 (Indianapolis: Center on Philanthropy, Indiana University,
2011).
Hammack, David C. (ed.), Making the Nonprofit Sector in the United States Bloom-
ington: Indiana University Press, 1998.
Howard, Christopher, The Hidden Welfare State: Tax Expenditures and Social Policy
in the United States (Princeton: Princeton University Press, 1997).
Joulfaian, David, “On Estate Tax Repeal and Charitable Bequests,” Tax Notes, June
8, 2009.
Karlan, Dean and John List, “Does Price Matter in Charitable Giving? Evidence
from a Large-Scale Natural Field Experiment” American Economic Review 97 (2007)
1774-1793.
Lynd, Robert S. and Helen Merrell Lynd, Middletown: A Study in Contemporary
American Culture (New York: Harcourt, Brace and Company, 1929). Marron, Donald,
“Spending in Disguise,” National Affairs, Summer, 2011.
Meer, Jonathan and Harvey S. Rosen, “Family Bonding with Universities,” NBER
Working Paper 15493, November 2009.
Odendahl, Teresa, “The Culture of Elite Philanthropy in the Reagan Years,” Nonprofit
and Voluntary Sector Quarterly 18 (Fall 1989), 237-248.
OECD, OECD Factbook 2001, “Economic, Environmental and Social Statistics, Pub-
lic and Private Social Expenditures,” http://dx.doi.org/10.1787/888932507103.
Ostrower, Why the Wealthy Give: The Culture of Elite Philanthropy (Princeton:
Princeton University Press, 1995).
President’s Advisory Panel on Federal Tax Reform, Simple, Fair, and Pro-Growth:
61

Giving and Tax Policy in the U.S.
Proposal to Fix America’s Tax System, November 2005.
Prewett, Kenneth, “American Foundations: What Justifies Their unique Privileges
and Powers,” in Kenneth Prewitt et al. (eds.), The Legitimacy of Foundations: United
States and European Perspectives (New York: Russell Sage Foundation, 2006).
Raub, Brian, “A Look at Estate Tax Returns Filed for Wealthy Decedents Since 2001,”
Statistics of Income Bulletin, Fall 2009.
Saez, Emmanuel, “The Optimal Treatment of Tax Expenditures” Journal of Public
Economics 88 (2004), 2657-2684.
Salamon, Lester M., “The Resilient Sector: The State of Nonprofit America,” in Lester
M. Salamon (ed.), The State of Nonprofit America (Washington: Brookings Institution
Press, 2002).
Shoven, John, “Commentary on Chapter 12,” in Joel Slemrod (ed.), Does Atlanta
Shrug? The Economics Consequences of Taxing the Rich (New York NY and Cambridge
MA: Russell Sage Foundation and Harvard University Press, 2000), pp 425-426.
Smeeding, Timothy, “Poor People in Rich Nations: The United States in Comparative
Perspective,” Journal of Economic Perspectives 20 (Winter 2006), 69-90.
U.S. Congressional Budget Office, The Estate Tax and Charitable Giving (Washington:
CBO, July 2004).
U.S. Congressional Budget Office, Options for Changing the Tax Treatment of Chari-
table Giving (Washington: CBO, May 2011).
U.S. Congressional Budget Office, Trends in the Distribution of Household Income
Between 1979 and 2007 (Washington: CBO, October 2011).
U.S. Office of Management and Budget, Fiscal Year 2012 Budget of the U.S. Govern-
ment (Washington: Government Printing Office, 2010).
U.S. Senate Finance Committee, Keeping Bad Things from Happening to Good Char-
ities, Hearing, June 22, 2004, U.S. Senate, Finance Committee, Washington DC, http:
//finance.senate.gov/sitepages/hearing062204.htm
Weisbrod, Burton, The Nonprofit Economy (Cambridge: Harvard University Press,
1988).
Wing, Kennard T., Thomas H. Pollak, and Amy Blackwood, The Nonprofit Almanac
(Washington: Urban Institute Press, 2008).
Yermack, David, “Deductio ad absurdum: CEOs donating their own stock to their
own family foundations,” Journal of Financial Economics 94 (October 2009), 107-123.
62

4 Philanthropy, Tax Policy and Tax Cheat-
ing: A Long Run Perspective on US data
Gabrielle Fack & Camille Landais
4.1 Introduction
Tax incentives for charitable giving have existed in the U.S. federal income tax system
since 1917. In 2007, U.S. taxpayers reported in their income tax returns a total of $193.6
Bn in charitable contributions. This figure represents 2.2% of total adjusted gross income
(AGI). The basis for subsidizing private charitable contributions is indeed well-established:
Private charitable contributions finance many socially valuable activities (education, the
arts, nonprofits, religious organizations, and so forth) and therefore have a positive exter-
nal effect that can be encouraged with Pigouvian subsidization. Nevertheless, there still
exists a substantial debate over the optimal level of the subsidy rate. The presidential
administration of Barack Obama has recently introduced a proposal that would cap the
subsidy rate for the top income-earning households. Other countries, such as France, have
recently considerably increased the level of the tax subsidy for contributions in order to
boost private provision of public goods (Fack and Landais [2009]). Policy recommenda-
tions in the debate over the optimal level of the subsidy rely on a large body of theoretical
and empirical work (see Andreoni [2006] for a complete survey). Yet, this literature fo-
cuses almost exclusively on a single parameter, the price elasticity of contributions, which
is implicitly assumed to be a sufficient statistic to infer tax policy.1
Surprisingly, there is very little discussion in the literature that the federal income tax
deduction for charitable contributions is also an easy channel for tax evasion because of
1Crowding-out parameters (the extent to which public provision of a public good crowds-out privatecontributions to the public good) have also received some attention (Warr [1982], Kingma [1989], orGruber and Hungerman [2007] for instance).
63

Philanthropy, Tax Policy and Tax Cheating
the permissive tax enforcement regime applicable to charitable gifts. Some studies have
nevertheless shown that tax cheating may be a concern. Ackerman and Auten [2008] in-
vestigate contributions of used cars and find evidence of significant overvaluation of used
cars by donors on their tax forms. Yermack [2008] analyzes contributions of stocks by
CEOs to their own private foundations and finds that these gifts, which are not subject
to insider trading laws, often occur just before sharp declines in their companies’ share
prices, suggesting that some CEOs backdate stock gifts to increase personal income tax
benefits. Slemrod [1989] and Feldman and Slemrod [2007] also try to measure tax evasion
occurring through charitable deductions with audited and unaudited tax returns, respec-
tively. But overall, there has been no general investigation into the extent of tax cheating
through private charitable contributions, nor has there been any attempt to understand
to what extent tax cheating may modify our normative approach to subsidizing private
philanthropy.
The aim of this paper is to twofold. First we show for the first time evidence of
substantial behavioral responses of wealthy taxpayers to charitable giving deductions in a
very long time perspective. Second, we show that part of this response may be due to tax
cheating. We develop a model of tax cheating and show that tax cheating is a first-order
phenomenon to assess optimal tax policies for charitable contributions. Then, we unveil
the existence of substantial tax evasion carried out through charitable deductions using a
natural experiment on tax enforcement in the US.
We begin our paper with the estimation of the price elasticity of reported contributions.
We improve on previous research by building a long-term dataset of contributions and
marginal tax rates for top incomes in the United States since 1917. The creation of
this long-term dataset offers several advantages for our purposes. First, it gives us the
opportunity to address the simultaneity issue of variations in price and income. By using
many more legislative changes of the income tax schedule than did previous tax studies, we
obtain substantial price variations over time affecting differently different income groups.
This enables us to create several instruments for price and income variations. In addition,
we can control for differential trends in giving across groups and investigate dynamic
issues, such as state dependence or time shifting of contributions. Our results demonstrate
that the long-term price elasticity of contributions in the United States is inferior to one
in absolute value but not significantly different from one for the top .1% of taxpayers.
However, these policy recommendations become very misleading in the presence of tax
64

Philanthropy, Tax Policy and Tax Cheating
cheating.
In order to derive policy recommendation in the presence of tax cheating, we develop
a general framework to define the sufficient statistics to be estimated to assess the opti-
mality of tax subsidies for contributions in the presence of tax cheating. Our optimal tax
formula generalizes to the case of tax cheating the unit elasticity rule, which assumes that
the price elasticity of reported contributions is a sufficient statistic to infer tax policy. Our
results show that, in the presence of tax cheating, three welfare-sufficient statistics must
be estimated to assess tax subsidy optimality for charitable contributions. These statistics
are the price elasticity of reported contributions, the share of contributions that is cheated,
and the price elasticity of cheating contributions. These results can be compared with
those of Chetty [2009a] which demonstrates that, in the presence of tax sheltering, the
taxable income elasticity is no longer a welfare-sufficient statistic to calculate deadweight
loss, which becomes a weighted average of taxable income and full income elasticities.
We then show evidence of cheating behaviors in the United States. We focus on a nat-
ural experiment that significantly modified tax enforcement of contributions to private
foundations. In 1969, Congress passed a law preventing “self dealing” and other possibil-
ities for abuses through contributions to private foundations. Annual creation of private
foundations dropped by more than 80% between 1968 and 1970 suggesting that private
foundations were largely used as tax sheltering vehicles. Moreover, the reform lowered
incentives to cheat as it pertained to rich taxpayers who had private foundations, but did
not affect taxpayers at lower levels of income. We therefore use a standard difference-
in-difference strategy, and look at the effect of the reform on contributions reported by
the top .01% of taxpayers relative to contributions of other top income groups not rich
enough to set up their own private foundations. The results suggest that a very signif-
icant fraction (around 30%) of contributions reported by the very wealthy before 1969
were driven by tax avoidance or tax cheating purposes. We then use these estimates to
calibrate our model.
The paper is organized as follows. The next section presents long run data on philan-
thropy in the US, and corresponding estimates of elasticity of charitable giving. Next, we
show how these statistics can be misleading in the presence of tax cheating and develop
a general model of optimal subsidy in the presence of tax cheating. We then present
our natural experiment of tax enforcement and use it to calibrate our model and discuss
65
Philanthropy, Tax Policy and Tax Cheating
optimal tax policy in the presence of tax cheating.
4.2 The long run of charitable contributions by the
very wealthy
4.2.1 Elasticity of reported contributions: long-term perspec-
tive
Tax incentives for charitable giving have existed in the U.S. federal income tax system
since 1917. The system works as a deduction from taxable income of the amount of pri-
vate contributions. The subsidy rate for a contribution is therefore equal to the marginal
tax rate faced by a taxpayer, and we define the price of a contribution as 1− τ , where τ
is the marginal tax rate of the taxpayer. Since the seminal work of Feldstein and Taylor
[1976], a wide range of empirical studies have focused on the estimation of price elasticity
of charitable contributions. Nevertheless, there are sizeable differences in the estimates
produced by these studies due to several empirical issues on U.S. microdata.
The first issue to cope with is that of simultaneity of price and income variations.
Early studies, (such as Feldstein and Taylor [1976]), use cross-sectional data to estimate
both price and income elasticities of charitable giving. They find that the elasticity of
giving with respect to the tax-defined price is greater than one in absolute value, suggest-
ing a high responsiveness to tax incentives. However, these early studies were plagued
by identification problems caused by the simultaneous variations of income and price of
giving. Since the deduction rate is equal to the marginal tax rate in the United States,
and is therefore a function of income, it is difficult to disentangle the effect of a change in
income from the effect of a change in price. Studies on panel data (including Randolph
[1995], Barett et al. [1997] and Bakija [2000]) have tried several methods to separately
estimate the transitory changes in prices caused by fluctuations in income and the per-
manent changes in prices (for a review of studies that use U.S. data, see Bakija and Heim
[2011]). When breaking down income and prices in transitory and permanent components,
Randolph finds estimates of the elasticity of giving with respect to the permanent price
of giving ranging from -0.3 to -0.5, which is much lower than earlier findings. However,
Auten et al. [2002], relying on a different method to identify transitory and permanent
66
Philanthropy, Tax Policy and Tax Cheating
income shocks2, find higher permanent price elasticities, ranging from -0.79 to -1.26, and
lower transitory elasticities than other studies. Fack and Landais [2009] overcome this
problem of simultaneity in price and income variation by focusing on the French income
tax credit for charitable contributions, whereby every taxpayer gets the same subsidy
rate, and find much smaller price elasticity estimates than previous studies on U.S. data.
Second, identification in these studies is essentially brought by legislated tax changes that
affect differently different income groups. Most studies focus on recent data with few tax
changes. Therefore, one needs to assume that there are no differential trends in giving
across groups. This is a standard identification problem in empirical tax studies, as shown
by Saez et al. [2009]. In addition, recent studies, such as Bakija and Heim [2011], have
shown that sizeable short-term responses due to time shifting of reported contributions
may occur, with the consequence of largely overstating the estimate of the long-term price
elasticity of contributions. Finally, Bradley et al. [2005] and Fack and Landais [2009] show
that censoring/selection may severely affect the estimation of the elasticity of charitable
giving in samples in which a significant portion of households do not contribute or do not
itemize deductions.
Overall, empirical studies on the price elasticity of charitable giving have so far pro-
duced mixed results. If a consensus seems to have emerged that price elasticity is inferior
to one in absolute value for the population of taxpayers as a whole, heterogeneity ac-
cording to income appears to be large. In particular, it appears that the value of price
elasticity rises with income, but little is known about the true value of the price elasticity
among top-income households, because sources of identification at the very top of the in-
come distribution have been scarce3. Here, we improve on previous literature by building
a long-term dataset of contributions and marginal tax rates for top incomes in the U.S.
since 1917 that offers a large number of variations in marginal tax rates among taxpayers
at the very top of the income distribution.
2They work directly on the variance-covariance matrix of income and prices and assume that thesevariables experience both random persistent shocks and transitory shocks that disappear after one year
3Bakija and Heim [2011] use a panel of taxpayers spanning the years 1979 to 2005 that oversampleshigh income households. Our longer panel allows us to track changes in marginal tax rate of the topbracket over a century, including the high increase in the 1940’s-1950’s and the decrease in the 1970’s-1980’s
67

Philanthropy, Tax Policy and Tax Cheating
Data & strategy
Data on contributions for 1917 to 1960 come from the published Statistics of Income
(SOI) of the Internal Revenue Service (IRS). We interpolated charitable contributions
from yearly tabulations of exhaustive reported contributions by income bracket to com-
pute the evolution of total reported contributions of various stable income groups among
top income households (the top decile of taxpayers since 1917). For 1960 to 2005, we used
yearly samples of microdata from the IRS with oversampling of high-income households.
To compute long-term time series on effective marginal tax rates since 1917, we created
a federal income tax simulator to compute effective marginal tax rates on earned income
and on capital gains for top income groups, taking into account all reported income and
deductions interpolated from yearly SOI tabulations. To the best of our knowledge, this
is the first time such a simulator has been created, and it can now be used for several
historical tax studies. For 1960 to 2005, we computed effective marginal tax rates from
IRS microdata using the tax simulator of the National Bureau of Economic Research
(NBER), Taxsim9. Further details on the series can be found in Appendix A.
The creation of this long-term dataset offers several advantages. First, it gives us the
opportunity to address the simultaneity issue of variations in price and income. Using
numerous legislated changes of the income tax schedule over time affecting differently dif-
ferent income groups, we create several instruments for price and income variations. Our
first instrument for the price faced by a given income group at time t is the price for a
synthetic level of income calculated as a times the average income, a being the long-term
ratio (computed over the century) of the average income of the group divided by the aver-
age income in the population. We also use as an instrument the price of a contribution at
the level of income of year n-1 inflated by the CPI between year n−1 and year n. Focusing
on data aggregated at the income group level is also useful, because we can assume that
mean reversion effects are averaged out at the (aggregate) income group level, as opposed
to panel data analysis in which sophisticated treatments of transitory price and income
variations are needed. These mean reversion effects can be very important, like in the
taxable income elasticity literature (Saez et al. [2009]), and this is the reason why different
ways to control for them in panel data analysis lead to substantial differences in the esti-
mates of Auten et al. [2002] and Randolph [1995]. Note that with data aggregated at the
income group level, censoring issues are also alleviated, and the effect that we estimate
is a mixture of responses at both the intensive and the extensive margins. In addition,
68
Philanthropy, Tax Policy and Tax Cheating
our long-term dataset enables us to investigate dynamic issues. The numerous legislated
tax changes spanned by our dataset allow us to include differential trends across income
groups without destroying identification. We also look for time shifting behaviors by in-
cluding the potential effects of lagged and forward variations in price due to anticipated
changes in the legislation. Finally, we control for possible state dependence of contri-
butions at the income group level with Blundell-Bond estimation models (Blundell and
Bond [1998]) in which we allow contributions to follow an autoregressive process of order p.
Our baseline specification can be summarized as follows.
log(contribution)i,t =∑i
αi +∑t
θt + εlog(priceit) + βlog(incomeit) + εi,t (4.1)
where αi are 6 income groups fixed effects and θt are year fixed effects. incomei,t is the
average gross income of the income group minus the average income tax computed without
the benefit of the charitable deduction. Note that since 1917, taxpayers can deduct gifts
of assets in the U.S. federal tax system and that the implicit capital gain on the asset
donated is not subject to tax. To control for this, we computed the price variables as
follows:
priceit = 1−mtrearned income − ηit ∗ sit ∗mtrkgains
ηit is the percentage appreciation of contributed asset relative to purchase price. Since
we do not have information on η in our data, we rely on Bakija and Heim [2011] who
estimated it to be 0.65, on average, based on Alternative Minimum Tax returns from
1989 to 1992. sit is the share of asset contributions in total contributions. sit may
be endogenously correlated to the difference between the marginal tax rate on capital
gain and the marginal tax rate on earned income. To avoid this issue, we use the long-
term average of the share of asset contribution for each income group, sit. mtrkgains is
the marginal tax rate on capital gains, and mtrearned income is computed as the marginal
tax rate on taxable earned income, not taking into account the deduction for charitable
contributions.
Results
Our long-term data bring some interesting new findings. Figures 4.1 to ?? display the
main aspects of the long-term evolution of marginal tax rates and contributions. Figure
4.1 shows the long-term evolution of contributions as a percentage of total income in the
69
Philanthropy, Tax Policy and Tax Cheating
United States for three income groups among the top decile of taxpayers since 1917. Two
points are noteworthy. First, the variations in reported contributions for the top 10% to
top 1% and for the top 1% to top .01% have been quite modest, compared with the vari-
ations experienced by the top .01% of taxpayers. Second, the top .01% of taxpayers have
demonstrated very significant variations in reported contributions over the century, with
a dramatic increase from the early 1930s to the late 1960s, and then a significant decrease.
Figure 4.2 suggests that the surge in contributions by the top .01% of taxpayers from the
early 1930s to the late 1960s is correlated with the dramatic increase in marginal tax rates
for these top income taxpayers to levels as high as 90% in the mid-1940s. As can be seen
in figures 4.3 and 4.4, it appears that the overall responsiveness of charitable contributions
to marginal tax rates is less important when considering the entire top decile of taxpayers.
Table 4.1 displays estimation results for the top decile over the century. The main
finding is that the overall price elasticity is inferior to one in absolute value in the very
long-term, and equal to about −.6, meaning that on average over the century, a 1% in-
crease in the price of giving for top income groups has translated into a reduction in
contributions of approximately .6%. This baseline estimate is very robust to the use of
different instruments. Column (3) displays results of the specification in which log(price)
is instrumented by the log of the price computed at a times the average income among
all U.S. taxpayers, a being the long-term ratio (averaged over the century) of the average
income of the income group divided by the average income among all U.S. taxpayers.
Column (4) displays the results using as an instrument the log of the price computed at
the average income level of the group in year n− 1, inflated by the consumer price index
variation between year n− 1 and year n. To control for possible simultaneous variations
of income and price in year n due to labor supply responses (or due to other types of
income reporting responses to tax rate variations) we also instrument income in year n
by the inflated income of year n−1. Results are displayed in column (5). In all cases, the
value of the elasticity is stable around −.6. Note also that the income elasticity is very
close to one, suggesting that private contributions can be considered as a normal good.
This result is also robust across all specifications.
As highlighted by our model, we have strong reasons to believe that the price elastic-
ity of contributions is very sensitive to different tax enforcement regimes. Therefore, we
concentrate in table 4.2 on the tax enforcement regime of years 1970 to 2004. The rules
70
Philanthropy, Tax Policy and Tax Cheating
applicable for tax filing, for the ceiling of the deduction as a percentage of income, and
for gifts of assets and to private foundations were stable over this period.4 The results in
table 4.2 demonstrate that the price elasticity of reported contributions has been around
−.6 for the top decile of U.S. taxpayers for 1970 to 2004, which is very similar to the
price elasticity computed for 1917 to 2004. This estimate is robust to the inclusion of
controls for short-term shifting behaviors and of controls for differential trends in giv-
ing across income groups. In column (3), we control for state dependence by allowing
contributions to follow an AR(5) process, and estimate the model with the Blundell &
Bond estimator (Blundell and Bond [1998]). We also allow in this model errors to be
serially correlated by assuming that errors follow a MA(1) process. The estimated price
elasticity in this model is very similar to the previous estimates. Note that the coeffi-
cient on the first three lags of contributions are significant, implying that contributions
are somehow state-dependent, but this does not affect our estimates of the price elasticity.
In columns (4) to (7) of table 4.2, we look at the heterogeneity of the price elasticity
among income groups. First, we focus on the top 10% to top 1% income groups and find
that the point estimates for the price elasticity are significantly lower than the average
price elasticity for the entire top decile. Columns (6) and (7) confirm that the price
elasticity is larger for the top 1% of taxpayers. Note that identification is still possible
among the top 1% of taxpayers because this top percentile is broken down in four income
groups in our data that experienced significantly different evolution of marginal tax rates
over the period, as confirmed by data in table 4.7. The estimated elasticity for the top 1%
of taxpayers is around−.75 to−.9 and not significantly different from one. Various reasons
may explain why contributions of households at the very top of the income distribution
are more responsive to taxation. Tax rates being higher in general for these taxpayers,
tax rate variations may be more salient for these taxpayers than for taxpayers with lower
income. Another reason is that taxpayers at the top of the income distribution have
access to complicated tax cheating technologies. We argue in the following sections that
“cheating” contributions may actually represent a significant fraction of contributions
reported by the highest-income households.
4There is only one change: the brief inclusion as an Alternative Minimum Tax preference between1986 and 1992 of unrealized capital gains on donations of some classes of appreciated assets.
71

Philanthropy, Tax Policy and Tax Cheating
4.3 Charitable giving policy in the presence of tax
cheating
4.3.1 A model of optimal subsidy in the presence of tax cheating
This section analyzes how tax cheating modifies the optimal treatment of tax expendi-
tures. We focus on the case of the optimal level of a subsidy for charitable contributions.
We begin by explaining the intuition behind our model in the simple case of a pure public
finance objective in which the government seeks to maximize the amount of private con-
tributions, given the public finance cost of the subsidy. Then we move to a more general
model of optimal subsidy with warm-glow of giving (Andreoni [2006]) and crowding-out
of private contributions through direct provision of the public good (Kingma [1989]). We
derive a formula indicating the welfare-sufficient statistics to be estimated to assess the
optimality of the subsidy rate in the presence of tax cheating.
The positive external effects of charitable contributions may justify tax incentives to-
wards charitable giving, and numerous empirical studies have analyzed the effect of tax
subsidies towards private philanthropy. However, the normative side of the analysis has
been much less investigated,5 and the issue of tax avoidance through charitable deduction
has been even less investigated 6.
Our model builds on the approach developped by Saez [2004] for the optimal treat-
5Atkinson [1983] analyzes the optimal tax problem with a log functional form specification for theutility function in a model in which high-income households want to redistribute income to lower-incomehouseholds. He then uses his optimal tax formula to study whether a deduction is more socially desirablethan a flat-rate tax credit. Roberts [1987] investigates the issue of crowding-out of private contributionsby direct public provision of a public good and derives a formula to determine whether direct fundingof a public good via tax revenue is more desirable than subsidies to private contributions. Diamond[2006] analyzes the optimal subsidy for private donations in a nonlinear income tax schedule. His paperexplores optimal policy, using first a model with standard preferences and then a model with warm glowof giving. Diamond’s paper emphasizes an important point for welfare analysis with the warm-glowmodel of giving, namely, that the optimal policy with warm-glow preferences is highly sensitive to thechoice of preferences that are relevant for a social welfare evaluation. Indeed, one may consider thatincluding warm-glow preferences in the social welfare function is somehow double-counting the utilitygain of contributions for individuals. This is a standard problem encountered in welfare analysis withnonstandard preferences (such as hyperbolic discounting models, for instance) as underlined by Bernheim[2008]. Here we abstract from these issues and consider the warm-glow motive as part of the preferencesto be included in the social welfare function. Saez [2004] considers a very generalized model of optimalsubsidy with a linear income tax and direct provision of public good by the government.
6Slemrod [1989] is the only paper - to our knowledge, that has analyzed the normative consequencesof tax cheating, by stressing out that the traditional analysis of the efficiency of charitable deductionswas not valid anymore in the presence of tax cheating.
72

Philanthropy, Tax Policy and Tax Cheating
ment of tax expenditures in order to investigate the consequences of tax cheating on the
optimal subsidy for charitable contributions. The distinction between illegal evasion and
legal avoidance is not critical for our analysis: the term cheating is used as a general
description of all evasion and avoidance behaviors that consist in using the charitable de-
duction for items that do not produce any positive externality.7 Issues of tax evasion and
tax avoidance have received growing attention in tax studies ever since the seminal work
of Allingham and Sandmo [1972]. Andreoni et al. [1998] and Slemrod and Stephan [2007]
survey this literature. But, apart from Slemrod [1989], who shows that in the presence of
tax evasion, Feldstein’s unit elasticity rule does not hold, the normative implications of
avoidance have never been raised for the analysis of the optimal policy for charitable con-
tributions. Here, however, for the sake of simplicity, we do not model the tax enforcement
technology per se, contrary to most models of tax evasion in which the level of evasion
chosen at the individual’s optimum depends on the probability of being detected, which
varies with the tax enforcement technology. We investigate the optimality of the subsidy
rate for a given level of tax enforcement. Two important reasons explain why we abstract
from modeling the tax enforcement technology. First, we are mainly interested in the
level of the optimal subsidy rate.8 Second, the choice of the tax enforcement regime is
by itself not a critical question, because one tax enforcement regime strictly dominates
all the others, namely, third-party reporting of charitable contributions by nonprofit or-
ganizations. The technology for third-party reporting is in fact already in place, making
a switch to this regime virtually free of cost.9 And as shown by Kleven et al. [2011] and
Kleven et al. [2009], cheating behaviors are close to zero with third-party reporting. Of
course, greater enforcement might also entail nonpecuniary social costs, such as invasion
of privacy (Slemrod [2006]) that we do not take into account here, but that may partly
explain why third-party reporting is not yet generalized.
7The fact that the distinction between avoidance and evasion is not necessarily relevant for deadweightloss analysis was already underlined by Chetty [2009a].
8Moreover, it is hard to consider tax enforcement technology as a well-behaved function of audit rates,as most models do. Tax enforcement is fundamentally discontinuous in the case of charitable giving anddepends on different reporting regimes (whether households must keep receipts, can give away assets, cangive to their private foundations, etc.).
9The UK system has indeed already a third party reporting system for a large share of charitablecontributions: through the gift aid scheme charities are entitled to reclaim a part of the tax paid bycontributors, while taxpayers can reclaim the other part of the tax. This generates third party reportingof contributions by charities.
73

Philanthropy, Tax Policy and Tax Cheating
A simple case: unit elasticity rule with and without tax cheating
To explain how tax cheating affects the optimal tax policy for charitable contributions,
we begin by focusing on a simple case of objective function in which the government only
seeks to maximize the amount of private contributions, given the cost of the subsidy. This
simple, objective function is actually not very far from what most governments have in
mind when modifying the level of the subsidy rate, as shown by the recent debate about
the Obama administration’s proposal of capping the level of the subsidy for high-income
households.
In the absence of tax cheating, this public finance objective yields a simple rule for
assessing the optimality of the subsidy rate. The government’s program is the following:
Maxτ W = g − τg
where τ is the subsidy rate and g is the aggregate level of private charitable contributions
in the economy. Then, it follows that:
dW
dτ= −g − (1− τ)
∂g
∂(1− τ)= −g(1 + εg)
where εg = dgd(1−τ)
1−τg
is the elasticity of contributions with respect to 1 − τ . εg is
therefore sufficient to infer tax policy, and optimality is determined by the famous unit
elasticity rule popularized by Feldstein and Clotfelter [1976]: The subsidy should be in-
creased if |εg| ≥ 1.
The simplicity of this rule and the fact that it states that the elasticity of reported
contributions is the only statistic necessary to determine the opportunity of raising the
subsidy rate explains why most empirical studies have focused on measuring whether this
elasticity was superior or inferior to one in absolute value (Auten et al. [2002], Bakija and
Heim [2011], Clotfelter [1980]).
Introducing tax cheating into this simple framework nevertheless substantially modifies
the sufficient statistics to be estimated to assess the opportunity for increasing the subsidy
rate. If we assume that reported contributions are a mix of contributions producing
externality (“True contributions” g) and contributions that do not produce any externality
74

Philanthropy, Tax Policy and Tax Cheating
(“Cheating contributions” gc), the government objective is now:
Max W = g − τg − τgc
This yields:
dW
dτ= −(g + gc)− (1− τ)
∂g
∂(1− τ)+ τ
∂gc∂(1− τ)
The criterion for increasing the subsidy rate becomes |εg| ≥ 1α
+ τ1−τ
1−αα|εgc |. Or
equivalently:
|εgT | ≥ 1 +1− α1− τ
|εgc | (4.2)
where gT = g + gc stands for total reported contributions. α = ggT
is the share of
“true” contributions in total reported contributions. εgT is the elasticity of total reported
contributions with respect to 1− τ , and εgc is the elasticity of cheating contributions with
respect to 1− τ . Equation 4.2 clearly states that the unit elasticity rule is no longer valid
and that εgT is no longer sufficient to infer tax policy. An elasticity of reported contribu-
tion greater than one in absolute value does not necessarily mean that the subsidy rate
should be increased. One also needs to estimate εgc and α. If |εgc| is large, or if the share
(1− α) of contributions not producing any externality is large, then focusing only on the
elasticity of reported contributions can lead to substantial deviations from the optimal
level of the subsidy. The intuition is straightforward. The larger the share of “cheating”
contributions (1−α), the greater the reported contributions’ elasticity overstates the true
social gain of the subsidy. And the larger the elasticity of “cheating” contributions εgc ,
the greater the revenue loss generated by an increase in the tax subsidy on “cheating”
contributions.
A model of optimal subsidy with tax cheating
We now generalize the intuition of the previous subsection to a model of optimal subsidy
for charitable contributions in the presence of tax cheating, with warm-glow of giving and
crowding-out of private charitable contributions by direct public provision of public goods.
The setup of the model is as follows. There is a continuum of individuals with density
dν(i) over i, i ε I, I being an index set. There are basically three goods in the economy:
75
Philanthropy, Tax Policy and Tax Cheating
private consumption c, earnings z, and a contribution good g. The utility of individuals is
increasing in c and decreasing in z, meaning that labor supply is costly. The contribution
good g enters positively in the utility function, which means that we allow individuals to
derive positive utility from the fact of giving, following the warm-glow model of Andreoni
[2006]. To model the public good nature of contributions, we assume that the total level
of contributions per capita G enters positively into the utility function of each individ-
ual. Since the government can contribute directly to the public good, G is the sum of
private and public contributions to the public good (G = G0 +GP , G0 being direct public
provision of public good, and GP =∫gdν(i) is total private contributions). In addition,
we consider each individual atomistic, so that G is considered as given by each individ-
ual to avoid results such as those found in Warr [1982]. Finally, we take into account
the possibility that individuals evade taxes through the contribution good:10 individu-
als can report “cheating contributions” in their tax form and gain an extra subsidy on
these cheating contributions. But cheating has a utility cost for individuals, reflecting the
probability of being caught and getting a fine, or simply reflecting pro-social compliance
preferences. This utility cost makes our evasion model formally comparable to a Alling-
ham and Sandmo [1972] tax evasion model or a Slemrod-type avoidance model (Slemrod
and Stephan [2007]).
The individual’s program can therefore be summarized as follows:
Maxc,z,g,gcUi = ui(c, z, g, gc, G)
s.t. c+ g + gc ≤ R + (1− t)z + τg + τgc
where τ is the tax subsidy rate on contributions and t is the (linear) tax rate on
earnings. Note that contrary to the actual US tax system, which works as a deduction
of private contributions from taxable income, we do not link t and τ in our model, and
formally consider a subsidy working as a tax credit. For a discussion of the optimality
of a tax credit over a deduction from taxable income, see Atkinson [1983] or Saez [2004].
We denote by νi(1 − t, 1 − τ,G,R) the indirect utility function of individual i. Demand
functions, given the tax parameters, are denoted by zi(1 − t, 1 − τ,G,R) for earnings,
gi(1− t, 1− τ,G,R) for true contributions, and gci(1− t, 1− τ,G,R) for cheating contri-
10We consider here only the case where reported contributions and real contributions differ becauseof tax cheating, but our model easily generalizes to other cases where reported contributions and truecontributions differ, like for instance because of underreporting of contributions.
76

Philanthropy, Tax Policy and Tax Cheating
butions.11 With the Roy’s identity conditions, we can also compute the welfare effect of
changes in t and τ for each individual: νi1−t = ziνiR and νi1−τ = −(g + gc)νiR.
We make two assumptions regarding the government’s program. First we assume that
the government can contribute directly to the public good through direct provision fi-
nanced by tax revenue.12 The total amount of public contribution to the public good is
G0. Following Saez [2004], we introduce the useful notations G = G((1− t, 1− τ,G0, R),
Gc = Gc((1 − t, 1 − τ,G0, R)and Z = Z((1 − t, 1 − τ,G0, R) which denote average con-
tribution, average cheating contribution and average earning for a given level of public
provision of the public good. GG0 is the crowding-out of public provision on private contri-
butions. We make the assumption that there is no crowding-out on cheating contributions
(GcG0 = 0). Second, we make the assumption that the government can observe G at the
aggregate level (for instance, through accounting of the nonprofit sector), it is only at the
individual level that the government cannot disentangle true from cheating contributions.
The government’s program thus can be written as follows:
Maxt,τ,G0W =
∫µiνi(1− t, 1− τ,G,R)
s.t. tZ ≥ R + τG+ τGc +G0
G0 ≥ 0
where µi is the social weight associated with individual i in the social welfare function.
We denote by λ the Lagrange multiplier of the government budget constraint, which is
therefore equal to the social marginal value of public funds. The first-order conditions of
the government’s program are:
∫µi[νi1−t + νiGG1−t]dν(i) + λ[−Z + tZ1−t − τ(G1−t + Gc
1−t)] = 0∫µi[νi1−τ + νiGG1−τ ]dν(i) + λ[tZ1−τ + G+ Gc − τ(G1−τ + Gc
1−τ )] = 0∫µi[νiR + νiGGR]dν(i) + λ[tZR − 1− τ(GR + Gc
R)] = 0∫µi[νiG + νiGGG0 ]dν(i) + λ[−1 + tZG0 − τGG0 ] = 0
11We do not impose any restrictions on the utility function in this model. Note, however, that in thepresence of complementarity between true and cheating contributions (g and gc), any tax enforcementreform aimed at reducing cheating contributions may reduce true contributions as well, which wouldcomplicate the choice of the tax enforcement regime that is here taken as given.
12In some cases, this assumption may not hold, as is the case for religious organizations in the UnitedStates for instance.
77
Philanthropy, Tax Policy and Tax Cheating
To derive our optimal subsidy formula, we make important additional assumptions.
First, we assume that earnings are not affected by G and τ . This assumption is implicitly
done in all empirical studies that attempt to measure the elasticity of reported contri-
butions with respect to 1 − τ . Indeed, it is very likely that people do not change their
labor supply because of changes in the subsidy rate on charitable contributions. Still, for
public goods such as poverty relief, it may be that increasing the level of the public good
provided reduces the labor supply of low-income households. In the absence of clear-cut
empirical evidence regarding these types of effects, it seems reasonable to assume zero
effect.
Second, we assume that a compensated change on the tax rate on earnings has no effect on
contributions. This assumption is also usually made in empirical studies on the elasticity
of reported contributions. This means that a change in the tax rate on earnings only af-
fects charitable contributions to the extent that it affects disposable earnings. Finally, we
assume that there are no income effects on earnings at the individual level: ∂z/∂R = 0.
Since giving is highly concentrated among high-income households and given that most
empirical studies find small-income effects relative to substitution effects for high-ability
individuals, it is reasonable to assume that the labor supply of our population of interest
is not affected by changes in the lump sum transfer R.
The derivation of our optimal subsidy formula can then be obtained by direct manip-
ulation of the first-order conditions using the previous assumptions. Here, we give a more
intuitive proof following the methodology of Roberts [1987] or Saez [2004]. We suppose
that the government increases the subsidy rate dτ > 0 with an adjustment of public pro-
vision such that dG + dG0 = 0, thus leaving the size of the external effect unchanged.
This change in the subsidy rate τ has four effects:
1. First, it has a mechanical effect on tax revenue: Increasing the subsidy rate on
contributions reduces tax revenues by the amount of total private charitable contri-
butions plus total cheating contributions.
A = −(G+ Gc)dτ
2. There is also a welfare gain for individuals because of the increase in the sub-
sidy rate. For each individual i, this effect can be written using Roy’s identity
conditions: dui = −νi1−τdτ = +(g + gc)νiRdτ We introduce the useful notation
78

Philanthropy, Tax Policy and Tax Cheating
β(GT ) =∫ µi(g+gc)νiR
λ(G+Gc)dν(i), which is the average social weight weighted by reported
contributions. Integrating over i, we find the aggregate effect on individual’s welfare:
B = β(GT )(G+ Gc)dτ
3. The third effect is due to behavioral responses on contributions. This generates a
revenue loss of: −τ(dG+dGc). The effect on private contributions can be rewritten
using the price effect and the crowding-out effect: dG = −G1−τdτ − GG0dG0 =−G1−τdτ1+GG0
. Assuming no crowding-out on cheating contributions, we can also rewrite
dGc = −Gc1−τdτ . The total effect of behavioral responses on contributions is thus:
C = τ(G1−τdτ
1 + GG0
+ Gc1−τdτ)
4. Finally, there is the cost of adjusting the public provision of the public good for the
government. By definition, this cost is:
D = −dG0 = dG
At the optimum, the sum of these four effects must be zero. A + B + C + D = 0.
With some manipulations, we therefore get that, at the optimum, the following equation
must hold:
− α
1 + GG0
εg +τ(1− α)
1− τεgc = 1− β(GT ) (4.3)
Or equivalently, we can rewrite equation 4.3 with the elasticity of total reported con-
tributions (εgT ) to make it comparable with equation 4.2:
εgT = (1 + GG0)[−(1− β(GT )) + (1− α)(1
1 + GG0
+τ
1− τ)εgc ] (4.4)
In the absence of tax cheating, we get that, at the optimum, the following equation
must hold:
εgT = −(1− β(GT ))(1 + GG0) (4.5)
Equation 4.5, which is very similar to the formula derived by Saez [2004], shows that
our model generalizes the unit elasticity rule in the absence of tax cheating: With Rawl-
sian redistributive tastes (β(GT ) = 0) and no crowding-out (GG0 = 0), equation 4.5 states
that at the optimum, we must have εgT = −1. In the presence of crowding-out, the abso-
79

Philanthropy, Tax Policy and Tax Cheating
lute value of the elasticity of reported contributions can nevertheless be less than unity.
Equation 4.4 generalizes the insight of the simple public finance formula (4.2) pre-
sented in the previous section. In the presence of tax cheating, and with no redistributive
tastes and no crowding-out, the absolute value of the elasticity of reported contributions
must be larger than one at the optimum. Two additional statistics need to be estimated
to assess the opportunity of increasing the subsidy rate: α, the share of true contribu-
tions in total reported contributions and εgc the elasticity of cheating contributions with
respect to 1− τ . Note also that equation 4.3 can be compared with the sufficient statis-
tics formula derived by Chetty [2009a] in the case of taxable income elasticity with tax
sheltering: Taxable income elasticity is no longer sufficient to estimate deadweight loss in
this case, and the size of the welfare loss is given by a weighted average of the elasticity
of taxable income and of the elasticity of total earnings.
We interpret our results in light of the welfare-sufficient statistics literature by noting
that three sufficient statistics are needed to assess the subsidy rate optimality for a given
level of tax enforcement. These statistics are the elasticity of reported contributions, the
share of “cheating” contributions in total reported contributions, and the elasticity of
cheating contributions with respect to 1− τ . Compared with structural approaches, the
sufficient statistics approach has two advantages: It allows for fairly general models, such
as the welfare model presented here, and it limits the number of parameters to be iden-
tified, especially in the case of cheating, whereby identification opportunities are scarce.
Of course, the full structural primitives of the model are interesting per se, as for instance
the behavioral nonstandard aspects (warm-glow parameters). But to be able to estimate
these parameters, it is necessary to impose much more structure on the model. Moreover,
estimation of a full structural model in the field of charitable giving is best-suited to ran-
domized experiments in which one can control identification sources, as in DellaVigna et
al. [2009]. Here, to the contrary, we claim that important welfare recommendations can
be derived by pinning down a few parameters that can be estimated in non-randomized
experimental settings. Of course, this is conditional on a certain number of assumptions
usually made in the sufficient statistics literature. We rely noticeably on the assumption
that the elasticities are somehow immutable parameters, or at least, that they do not vary
with small changes of τ . For a discussion of the pros and cons of the welfare-sufficient
statistics approach, a thorough analysis is given by Chetty [2009b].
80

Philanthropy, Tax Policy and Tax Cheating
In the remainder of the paper, we empirically estimate the share of “cheating” contri-
butions, using a natural experiment from the US. We then use our estimates to calibrate
our model and provide suggestive evidence that ignoring cheating parameters is likely to
lead to large deviations from the optimal subsidy for several credible values of the elastic-
ity of cheating contributions. The source of this discrepancy is first, the share of cheating
contributions, which is susbtantial in most tax systems - especially when marginal tax
rates are high - and, second, the price elasticity of cheating contributions, which is likely
to be large, especially when tax enforcement is limited, e.g. when receipts are not required
to be attached to the tax return, as is still the case for most contributions in the United
States.
4.3.2 A natural experiment on tax enforcement
In this section, we focus on a natural experiment on tax enforcement in the US. The Tax
Reform Act of 1969 (TRA69) tightened significantly the rules applying to the functioning
of private foundations in order to prevent financial abuses in charitable contributions to
private foundations that had been abundantly reported during the 1950s and 1960s.
Several approaches have been taken in prior empirical literature to measure tax eva-
sion. The first approach relies on audited returns. A number of studies therefore uti-
lize cross-sectional variation across taxpayers in observed levels of compliance using the
Taxpayer Compliance Monitoring Project (TCMP), which describes the outcome of IRS
audits of randomly chosen tax returns. Clotfelter [1983], using TCMP microdata, finds
that noncompliance is strongly positively related to the marginal tax rate, whereas Fe-
instein [1991] finds a negative impact. Klepper and Nagin [1989] show that, across line
items, noncompliance rates are related to proxies for the traceability and ambiguity of
items. Slemrod [1989] uses TCMP data to investigate specifically the extent of tax eva-
sion through charitable deduction. As with any cross-sectional study of the impact of
taxes on behavior, this type of approach is made difficult by the fact that the marginal
tax rate is a function of income, making it difficult to identify the tax rate and income
effects separately without making strong functional form assumptions. Moreover, the use
of audited returns raises issues. If audited returns come from selected samples of audited
taxpayers, then selection becomes a problem. If on the other hand, audited returns come
from random audits, the overall level of evasion is difficult to infer because of the likely
81

Philanthropy, Tax Policy and Tax Cheating
strong concentration of cheating behaviors across taxpayers.
A second approach taken in the literature uses experimental methods to investigate
tax compliance and its response to tax rates and enforcement. Blumenthal et al. [1998]
analyze the results of a randomized controlled experiment conducted by the State of Min-
nesota Department of Revenue. Kleven et al. [2011] use a randomized experiment in
Denmark and find a high level of compliance. Their results also suggest that the informa-
tional framework may be even more important than socioeconomic variables in explaining
tax compliance.
The third type of approach is indirect and involves observing quantities, such as na-
tional income and product accounts from external sources and inferring evasion from these
quantities. Gorodnichenko et al. [2009], for instance, rely on the gap between consump-
tion in household expenditure surveys and reported earnings before and after a flat tax
reform in Russia. The main drawback of this type of approach is that external surveys
may lack reliability, and the gap between tax data and survey data is usually very noisy.
In a similar vein, a number of studies have focused on indirect sources of identification
of evasion. Fisman and Wei [2004] examine the misclassification of Chinese imports from
Hong Kong. They find that the gap at the detailed good level between reported Chinese
imports from Hong Kong and reported exports from Hong Kong to China is largest for
goods with high tax and tariff rates. Hsieh and Moretti [2006] uncover evidence of un-
derpricing and bribes in Iraq’s Oil-for-food program by comparing prices charged by Iraq
for oil with prices of close substitutes sold on the world market.
Here, we rely on another type of approach by exploiting a natural experiment on tax
enforcement with tax data. The approach most closely related to ours is that of Marion
and Muehlegger [2008b], who examine the effects of a federal regulatory innovation in Oc-
tober 1993, the addition of red dye to untaxed diesel fuel at the point of distribution that
significantly lowered the cost of regulatory enforcement. LaLumia and Sallee [2001] also
use an enforcement reform that made it very difficult for taxpayers to inapropriately claim
additional dependants for tax purpose in order to infer the proportion of tax cheaters.
Compared to these papers, our natural experiment focuses specifically on a tightening of
the rules for the tax treatment of charities, and allows us to analyze how this change in
tax enforcement affected the amount charitable gifts declared for tax purposes.
82
Philanthropy, Tax Policy and Tax Cheating
United States, 1969: Tightening of the rules regulating private foundations
The natural experiment that we focus on took place in the United States in 1969 and
significantly modified the tax enforcement of contributions to private foundations.
As shown in figure 4.1, reported charitable contributions of the top .01% of U.S.
taxpayers experienced a tremendous surge during the 1940s and 1950s. At that time,
marginal tax rates for these taxpayers reached an historical peak, with rates as high as
90%. These very high marginal tax rates constituted a major incentive to donate to
charitable causes. But these very high tax rates also constituted a significant incentive
to engage in tax avoidance behaviors. Indeed, during the 1940s and 1950s, the number
of private foundations’ created surged. Foundations experienced very lax control before
1969, and apart from their tax-exempt status, the rules regulating their functioning were
nearly nonexistent. Moreover, the audit rates of foundations by the IRS were very low.13
Therefore, family charitable trusts and private foundations constituted a highly practical
vehicle for tax sheltering.14 Soon, a large number of abuses were reported.
These abuses are in fact well-documented thanks to a series of reports commissioned
by different committees appointed by the U.S. Congress or by the U.S. Department of the
Treasury. The Cox Committee Report (1952), the Reece Report (1954), the U.S. Treasury
Department report (1965), and the Peterson Report (1970) all provide numerous detailed
accounts of frauds and abuses. Overall, the most common fraudulent practices included:
* “Self dealing”: prior to TRA69, the tax law permitted transactions between a
donor or those related to him and his private foundation if they were at reason-
able or arm’s length terms. This permitted a variety of doubtful transactions to
occur. An anonymous survey of accountants of nearly 500 foundations by Arthur
Andersen on behalf of the Peterson Commission reported that 9% of accountants
acknowledged common financial self dealing practices within private foundations
and that 8% acknowledged that the grants distributed by the foundation were
made based on friendship.
13Cf. Peterson [1970].14It is interesting to note that tax evasion motives have always played a key role in the history of trusts.
For instance, trusts have historically developed for tax evasion reasons in feudal England, as mentionedby North et al. [2009]. Land trusts were a way of evading the feudal obligations (military service andtaxes) linked to land holding by transferring the title of land ownership to a third party (the trustee).
83

Philanthropy, Tax Policy and Tax Cheating
* Overvaluation of property contributed to one’s own private foundation to in-
crease the amount of one’s tax deduction. These types of overvaluation were
especially numerous with property for which there was no ascertainable market
price.
* Falsely claimed deductions.
* Foundations set up to maintain ownership of a business while benefiting from
tax exemption of income generated.
* Political briberies: a famous example involved the Wolfson Foundation that
made a long-term agreement for sizable annual payments to Associate Justice
Abe Fortas of the U.S. Supreme Court.
Overall, this resulted in extremely low payout rates for a significant number of private
foundations that functioned, for many of them, as pure tax shelters. Because of growing
public concerns, in 1969, the U.S. Congress passed a tax reform act, TRA69, to better
regulate the use of private foundations by high-income taxpayers. The provisions of the
new tax law included:
* Prohibition of “self dealing”, defined as activities that benefit foundation man-
agers, officers, substantial contributors, and other foundation insiders.
* Stricter tax rules on unrelated business income (UBI). In particular, business in-
come that was not closely related to the charitable activities of the organization
became subject to tax.
* Establishment of a minimum payout rate as a percentage of investment assets. It
was to be the greater of the foundation’s actual investment income and a predeter-
mined rate, originally set at 6%. Foundations that failed to meet these requirements
84

Philanthropy, Tax Policy and Tax Cheating
were subject to an additional tax.
* Creation of an excise tax on the investment income of private foundations, with
an original rate of 4%.
* Further, while the income ceiling of deductions for public charitable foundations
was increased from 30% to 50%, it stayed at 20% for private non-operating foun-
dations, with no possibility for carryover.
TRA69 therefore represents an interesting natural experiment on tax enforcement.
First, it substantially increased the cost of tax avoiding contributions that became much
more difficult to carry on. In addition, the IRS committed to significantly increase the
audit rates on foundations. Second, it is important to note that the reform did not affect
the price of “true” contributions. The mandatory payout rate was set at a very low level in
order to not penalize properly operating foundations, and almost no donors hit the ceiling
of 20% prior to the reform. Therefore the reform is expected to have reduced so-called
“cheating contributions” in the model section, without affecting “true” contributions.
This gives us an opportunity to estimate a lower bound on the share of contributions that
were “cheated” (1− α).
Data & strategy
The effects of TRA69 are visible in figure 4.5, which displays the number of foundations
created and terminated from 1960 to 1972. While the number of new foundations was
stable around 1,300 every year before 1969, it suddenly dropped to fewer than 300 after
1969. In the meantime, the number of foundations terminated surged. This evidence
suggests that before 1969, a significant number of foundations had been created for tax
sheltering purposes. The overall effect of the 1969 tax reform can also be seen in figure
??, which shows the percentage of total contributions going to different sectors from 1940
to 1974. Contributions to private foundations are included in the “All other” category,
whose contributions suddenly dropped from 11% of total giving to 6% of total giving
between 1970 and 1974.
85

Philanthropy, Tax Policy and Tax Cheating
To identify the effect of TRA69 on private contributions, we use data from IRS micro-
files, with oversampling of high-income taxpayers spanning 1960 to 1990. These samples
are repeated cross-sections drawn from individuals’ tax returns and contain detailed in-
formation on sources of income and deductions claimed. 15 The identification strategy
relies on the fact that only a small fraction of taxpayers have their own private foun-
dations. As shown in figure 4.6, households with income below the 99th percentile do
not have private foundations. It is only among the top .01% of taxpayers that private
foundations are a common practice. Substantial evidence also confirms that among these
high-income taxpayers (top .01%), the majority of reported charitable contributions are
made through family trusts and foundations.16 We therefore use a standard difference-
in-difference strategy and look at the effect of the reform on contributions reported by
the top .01% of taxpayers relative to contributions of other top income groups not rich
enough to set up their own private foundations. Figure 4.7 gives graphical evidence of
the reform’s impact following our identification strategy: It displays the evolution of total
reported charitable contributions for the top .01% of taxpayers (treated group) and for
two income groups unaffected by the reform (control), the top 8% to top 7% of taxpayers
(P92-93) and the top 5% to top 4% of taxpayers (P95-96). While the aggregate levels of
reported contributions for these three groups exhibit parallel trends during the 1960s, a
substantial drop in total contributions appears following TRA69 for the top .01% of tax-
payers relative to the two unaffected groups, which continue to exhibit the same parallel
trends as before TRA69.
Since all relevant information concerning treatment and control in this natural exper-
imental setting comes at the income group level, we collapsed our observations at the
income group level to avoid inference issues due to potential correlation of errors within
income groups (as is well-known since Moulton [1990]). Our standard diff-in-diff specifica-
tion to estimate the impact of TRA69 on cheating contributions can thus be summarized
15Note that for 1960 to 1972, information on charitable contributions is only present once every twoyears (in 1960, 1962, 1964, etc.). Note as well that, unfortunately, it is not possible to disentanglecontributions by recipient type in these microfiles.
16A survey conducted in 1970 by the University of Michigan on behalf of the Commission on PrivatePhilanthropy and Public Needs using data from the IRS indicated that nearly 70% of contributionsfrom taxpayers with income above $1,000,000 were dedicated to a remainder category mainly includingcontributions to foundations. This evidence is also confirmed by recent surveys conducted by the Centeron Philanthropy at Indiana University for the Bank of America on high-net-worth households ( see Centeron Philanthropy, ed [2009]) These surveys demonstrate that most contributions by the very wealthy aredonated to their own giving vehicle (trust or private foundation). Interestingly, when asked why theychose to establish a private foundation, the top two answers given by wealthy households in 2008 is “tomaximize charitable deductions” (59%) and “to avoid capital gain taxation” (35.7%).
86
Philanthropy, Tax Policy and Tax Cheating
as follows:
log(contribution)i,t =∑i
δi+∑t
θt−(1−α)∗(Treated group∗after 69)+Xi,tβ+εi,t (4.6)
where δi are income groups’ fixed effects, θt are year fixed effects, and Xi,t is a vector
of controls including percentage of married couples, log of average disposable income,
and log of average price to control for possible small variations of price or income across
groups. The coefficient before (Treated group ∗ after 69) gives us the percentage drop in
total reported contributions for the treatment group that we interpret as −(1 − α), the
share of contributions that was cheated by the treatment group. Of course, some cheat-
ing may still be occurring, even after the 1969 reform, among the treatment group. Our
estimates must therefore be interpreted as a lower bound on 1−α for very rich taxpayers.
The baseline specification compares group P99.99-100 (top .01% of taxpayers) versus
group P90-95 (top 10% to top 5% of taxpayers) for the time window 1960 to 1980.17 We
compare 1960 to 1968 with 1970 to 1980.18 Concerning the timing of the reform, even
though some elements of the reform were discussed publicly as early as 1965, it is unlikely
that the wealthiest taxpayers had the opportunity to fully anticipate TRA69, because
Congressmen moved more quickly than anticipated, and TRA69 was signed by President
Nixon on December 30, 1969 before the Peterson Commission had time to release its final
report (August 1970).19
Results
Results are presented in table 4.3. To control for inference issues arising in difference-in-
difference estimates from potential serial correlation of errors by income group (Bertrand
et al. [2004]), cluster-robust standard errors are displayed (with clustering at the income
group level). Our baseline estimates (column (2)) state that contributions by the top
.01% of taxpayers dropped by 28% following TRA69, relative to contributions of income
groups not affected by the reform. This suggests that a substantial share of contributions
17We also considered a narrower time window (1964 to 1975) in our sensitivity analysis without anyloss of robustness.
18Note that, unfortunately, information on charitable deductions is not present in the 1969 sample fromthe IRS.
19The U.S. Treasury Report on Private Foundations of 1965 had already asked for the U. S. governmentto intervene in the actions of foundations and force them to become more accountable through a seriesof tax laws that would assure the tax-exempt status of foundations would no longer be abused. Therecommendations published in the U.S. Department of the Treasury’s report included many of the mainprovisions of TRA69.
87

Philanthropy, Tax Policy and Tax Cheating
by the very wealthy had been motivated by tax avoidance purposes.
We also present in table 4.3 results controlling for potential bias arising in diff-in-diff
analysis due to preexisting trends, as highlighted, for instance, in Wolfers [2006]. We first
regress our dependent variable (log of contributions) for years prior to the 1969 reform on
the same set of regressors, and we include differential time trends across groups.
log(contribution)i,t =∑i
δi +∑t
θt +∑i
ηi(δi ∗ t) +Xi,tβ + εi,t
Then we regress the difference between actual contributions and fitted values of the pre-
ceding model for years after the reform on a set of year dummies and an indicator for
treatment:
log(contribution)i,t − log(contribution)i,t =∑t
θt − (1− α) ∗ (Treated) + εi,t
Results are presented in column (4) and confirm that the inclusion of controls for pre-
existing trends does not affect the robustness of the previous estimates. Note that we
conducted the same procedure without year 1968 to control for possible shifting behav-
iors in anticipation of TRA69, and we also conducted the procedure with second-order
polynomial trends with no loss of robustness.
The last two columns of table 4.3 present results from placebo regressions, in order to
ensure that the estimates are not purely spurious correlations. The first placebo regres-
sion consists in comparing two control groups, artificially attributing treatment to group
P90-95 after 1969. The second placebo regression consists in comparing the treatment
group and the baseline control group before the reform, artificially attributing treatment
years to 1965 to 1968. In these two cases, columns (5) and (6) demonstrate that the co-
efficient on the interaction term (treated*after reform) is not significantly different from 0.
Results therefore suggest that a very significant fraction (around 25% to 30%) of con-
tributions reported by the very wealthy before 1969 were driven by tax avoidance or tax
cheating purposes. These results have interesting implications for policies regarding tax
expenditures. They tend to confirm that higher marginal tax rates reduce importantly
voluntary compliance, as noted in some previous studies about evasion (such as, for in-
stance, Clotfelter [1983] or Poterba [1987]). When marginal tax rates reach very high
88
Philanthropy, Tax Policy and Tax Cheating
levels, as was observed from the 1940s to 1960s, tax expenditures are widely utilized as
channels of evasion, and tax enforcement likely needs to be increased. Our results using
TRA69 as a natural experiment on tax enforcement give a good sense of how significant
avoidance strategies can be when marginal tax rates increase.20 Nevertheless, because
of the setting of this natural experiment, only “treatment on the treated” effect can be
estimated, and we cannot investigate heterogeneity issues. We have reasons to believe,
though, that the propensity to cheat is not likely to be the same across taxpayers, either
for idiosyncratic reasons or because of differential incentives to cheat. In particular, the
share of contributions that is cheated is clearly a function of marginal tax rates, but in our
setting, we are compelled to estimate the share of cheating contributions taking marginal
tax rates as given. The inability to estimate the elasticity of cheating contributions with
respect to marginal tax rates in the TRA69 case is due to the lack of marginal tax rate
variations among the treatment group (top .01%) in which every taxpayer hits the top
marginal tax rate of the tax schedule. We can nevertheless calibrate our model and show
that even for moderate levels of elasticity of “cheating” contributions, one needs an elas-
ticity of reported contribution much larger than one in absolute value in order to justify
the existence of tax deductions for charitable giving.
Calibration
Table 4.4 shows the results of the calibrations of our model. The first line of table 4.4
recalls the baseline elasticity rule: when all reported contributions are true contributions
and without any crowding-out, tax deductions are justified as long as the elasticity of
reported contributions is at least equal to 1 in absolute value. The last panel of the
table also shows that with an elasticity of reported charitable contributions equal to 0.6
in absolute value, as previously estimated with our long panel, one needs to assume a
crowding-out of at least 40% in order to justify tax deductions. Such level of crowding
out is in the upper bound of the existing estimates on US data (see Hungerman [2005] and
Gruber and Hungerman [2007]). We can finally see from table 4.4 how taking cheating
into account modifies the assessment of the optimality of the tax deduction. Taking the
lower bound of our estimates on “cheating contributions”, we assume in our calibrations
that true contributions represent only 75% of the total reported contributions and that
the remaining 25% of contributions are the result of non-compliance behaviors. The
20It is worth mentioning, however, that even though top marginal tax rates have substantially decreasedand tax enforcement on contributions has been tightened, tax avoidance and evasion through charitablecontributions may still be important among the wealthiest taxpayers, as highlighted by Yermack [2008].
89

Philanthropy, Tax Policy and Tax Cheating
different panels of table 4.4 show the elasticity of reported contributions that would be
needed to justify optimal charitable tax deductions as a function of the elasticity of
“cheating” contributions, in the case of Rawlsian preferences and for varying baseline
levels of deduction rates.21 This calibration exercise shows that, even if we assume a level
of crowding out of 40%, as soon as the elasticity of “cheating” contributions increases from
1 to 0.5, it is not optimal anymore to have tax deductions for an elasticity of reported
contribution lower or equal to one in absolute value. Estimates on French data indeed
suggest that the elasticity of “cheating” contributions might be close to 1.5−2 in absolute
value (see Fack and Landais [2011]). If “cheating” contributions are very responsive, total
reported contributions would also have to be very responsive for tax deductions to remain
optimal. This calibration exercise has obvious limitations -in particular, it only allows for
a very simple type of tax deductions that apply to all levels of incomes and all gifts. But
this simple model clearly shows that in the presence of tax cheating, the unit elasticity
rule is not valid anymore for policy recommendations.
Conclusion
This paper demonstrates that tax cheating is a first-order concern to evaluate the optimal
tax subsidy for charitable contributions. First, we derive a general framework to define
the optimality of tax subsidies for contributions in the presence of tax cheating. Our
results show that three welfare-sufficient statistics are needed to assess the optimality of
subsidies for charitable giving: the price elasticity of reported contributions, the share
of “cheating” contributions in total reported contributions, and the price elasticity of
“cheating” contributions. Then, we provide new estimates on the elasticity of reported
contributions. We improve on previous literature by building a long-term dataset of con-
tributions and marginal tax rates for top incomes in the United States since 1917. We
then estimate the share of “cheating” contributions using a natural experiment on tax
enforcement of gifts to private foundations in the US. Our results also demonstrate that
significant cheating behaviors take place through the charitable deduction channel. We
show that the share of cheating contributions is substantial in the absence of third-party
reporting of contributions.
These results have important policy implications. First, our calibrations show that
21We calibrated our model for baseline deduction rates that span between 0.3 and 0.7 to reflect theevolution of marginal reduction rates over the century for top income households.
90
Philanthropy, Tax Policy and Tax Cheating
tax cheating can no longer be neglected in assessing the optimal policy for charitable
contributions. Second, the subsidy rate may not be the only relevant policy instrument
to deal optimally with contributions by the very wealthy, contrary to recents proposals for
reform that tends to focus on capping the subsidy rate. Indeed, despite the 2005 reform
of filing requirements of charitable contributions,22 tax enforcement of private contribu-
tions is still considerably lax in the United States compared with other countries, such
as France, that switched to a system very close to third-party reporting of contributions.
In this context, cheating contributions are likely to remain significant, and third-party
reporting might prove more efficient than capping the subsidy rate.
22From 2006 on, contributions must fulfill the following requirements: For cash contributions in excessof $250, the taxpayer must keep a receipt; for noncash contributions of more than $500, the taxpayermust fill out qnd file IRS Form 8283.
91

Philanthropy, Tax Policy and Tax Cheating
References
Ackerman, D. and G. Auten, Incentive and Distributional Consequences of Tax Expendi-
tures NBER Chapters, National Bureau of Economic Research, Inc, April 2008.
Allingham, M. G. and A. Sandmo, “Income tax evasion: a theoretical analysis,” Journal
of Public Economics, 1972, 1 (3-4), 323 – 338.
Andreoni, J., Philanthropy, Vol. 1 of Handbook on the Economics of Giving, Reciprocity
and Altruism, Elsevier, September
, B. Erard, and J. Feinstein, “Tax Compliance,” Journal of Economic Literature, 1998,
36 (2), 818–860.
Atkinson, A. B., “The income tax treatment of charitable contributions,” in “Social justice
and public policy,” Cambridge: MIT Press, 1983.
Auten, G. E., H. Sieg, and C. T. Clotfelter, “Charitable Giving, Income and Taxes: An
Analysis of Panel Data,” The American Economic Review, 2002, 92 (1), 371–382.
Bakija, J., “Distinguishing Transitory and Permanent Price Elasticities of Charitable
Giving with Pre-announced Changes in Tax Law,” Working Paper, 2000.
and B. Heim, “How Does Charitable Giving Respond to Incentives and Income? New
Estimates from Panel Data,” National Tax Journal, 2011, 64 (2).
Barett, K.S., A. M. McGuirk, and R. Steinberg, “Further Evidence of the Dynamic Impact
of Taxes on Charitable Giving,” National Tax Journal, 1997, 50 (2), 321–334.
Bernheim, B. D., “Behavioral Welfare Economics,” NBER working paper series n.14622,
December 2008, (14622).
Bertrand, M., E. Duflo, and S. Mullainathan, “How Much Should We Trust Differences-
in-Differences Estimates?,” Quaterly Journal of Economics, 2004, 119 (1), 249–275.
Blumenthal, M., C. Christian, and J. Slemrod, “The Determinants of Income Tax Compli-
ance: Evidence from a Controlled Experiment in Minnesota,” NBER Working Papers
n.6575, May 1998, (6575).
Blundell, R. and S. Bond, “Initial conditions and moment restrictions in dynamic panel
data models,” Journal of Econometrics, 1998, 87, 115–143.
Bradley, R., S. Holden, and R. McLelland, “A Robust Estimation of the Effects of Taxa-
tion on Charitable Contributions,” Contemporary Economic Policy, 2005, 23, 545–554.
Center on Philanthropy, ed., The 2008 Study of High Net Worth Philanthropy: Issues
Driving Charitable Activities among Affluent Households” March 2009.
92

Philanthropy, Tax Policy and Tax Cheating
Chetty, R., “Is the Taxable Income Elasticity Sufficient to Calculate Deadweight Loss?
The Implications of Evasion and Avoidance,” American Economic Journal: Economic
Policy, 2009, 1, 31–52.
, “Sufficient Statistics for Welfare Analysis: A Bridge Between Structural and Reduced-
Form Methods,” Annual Review of Economics, 2009, (1), 451–488.
Clotfelter, C. T., “Tax incentives and charitable giving: evidence from a panel of taxpay-
ers,” Journal of Public Economics, 1980, 13 (3), 319 – 340.
Clotfelter, C. T, “Tax Evasion and Tax Rates: An Analysis of Individual Returns,” The
Review of Economics and Statistics, August 1983, 65 (3), 363–73.
DellaVigna, S., J. List, and U. Malmendier, “Testing for Altruism and Social Pressure in
Charitable Giving,” July 2009. Mimeo UC Berkeley.
Diamond, P., “Optimal tax treatment of private contributions for public goods with and
without warm glow preferences,” Journal of Public Economics, May 2006, 90 (4-5),
897–919.
Fack, G. and C. Landais, “Are tax incentives for charitable contributions efficient? Evi-
dence from France,” American Economic Journal: Economic Policy, 2009. forthcoming.
and , “Charitable giving and tax policy in the presence of tax cheating: Theory and
evidence from the US and France,” Working Paper, 2011.
Feinstein, J. S., “An Econometric Analysis of Income Tax Evasion and its Detection,”
Rand Journal of Economics, 1991, 22 (1), 14–35.
Feldman, N. E. and J. Slemrod, “Estimating tax noncompliance with evidence from unau-
dited tax returns,” Economic Journal, 03 2007, 117 (518), 327–352.
Feldstein, M. and A. Taylor, “The Income Tax and Charitable Contributions,” Econo-
metrica, 1976, 44 (6), 1201–1222.
and C. T. Clotfelter, “Tax incentives and charitable contributions in the United States
: A microeconometric analysis,” Journal of Public Economics, 1976, 5 (1-2), 1 – 26.
Fisman, R. and S.-J. Wei, “Tax Rates and Tax Evasion: Evidence from “Missing Imports”
in China,” Journal of Political Economy, April 2004, 112 (2), 471–500.
Gorodnichenko, Y., J. Martinez-Vazquez, and K. Sabirianova Peter, “Myth and Reality
of Flat Tax Reform: Micro Estimates of Tax Evasion Response and Welfare Effects in
Russia,” Journal of Political Economy, 2009, 117 (3), 504–554.
Gruber, J. and D. M. Hungerman, “Faith-based charity and crowd-out during the great
93

Philanthropy, Tax Policy and Tax Cheating
depression,” Journal of Public Economics, 2007, 91 (5-6), 1043 – 1069.
Hsieh, C.-T. and E. Moretti, “Did Iraq Cheat the United Nations? Underpricing, Bribes,
and the Oil for Food Program,” The Quarterly Journal of Economics, November 2006,
121 (4), 1211–1248.
Hungerman, D. M., “Are church and state substitutes? Evidence from the 1996 welfare
reform,” Journal of Public Economics, December 2005, 89 (11-12), 2245–2267.
Kingma, B., “An Accurate Measurement of the Crowd-Out Effect, Income Effect, and
Price Effect for Charitable Contributions,” The Journal of Political Economy, 1989, 97
(5).
Klepper, S. and D. Nagin, “The Anatomy of Tax Evasion,” Journal of Law, Economics
and Organization, Spring 1989, 5 (1), 1–24.
Kleven, H. J., C. T. Kreiner, and E. Saez, “Why Can Modern Governments Tax So
Much? An Agency Model of Firms as Fiscal Intermediaries,” NBER working paper
series n.15218, August 2009, (15218).
Kleven, H., M. Knudsen, K. Kreiner, S. Pederson, and E. Saez, “Unwilling or Unable to
Cheat? Evidence from a Randomized Tax Audit Experiment in Denmark,” Economet-
rica, May 2011, 79 (3), 651–692.
LaLumia, S. and J. M. Sallee, “The Value of Honesty: Empirical Estimates from the Case
of the Missing Children,” NBER working paper series n.17247, July 2001.
and , “Measuring Illegal Activity and the Effects of Regulatory Innovation: Tax
Evasion and the Dyeing of Untaxed Diesel,” Journal of Political Economy, 2008, 116
(4), 633–666.
Moulton, B. R., “An Illustration of a Pitfall in Estimating the Effects of Aggregate Vari-
ables on Micro Unit,” Review of Economics and Statistics, 1990, 72 (2), 334–338.
North, D., J. Wallis, and B. Weingast, Violence and Social Orders: A Conceptual Frame-
work for Interpreting Recorded Human History, Cambridge University Press, 2009.
Peterson, P., Foundations, private giving and public policy: report and recommendations
of the commission on foundations and private philanthropy, University of Chicago Press,
1970.
Piketty, T. and E. Saez, “Income Inequality in the United States, 1913-1998,” Quarterly
Journal of Economics, 2003, 118 (1), 1–39.
Poterba, J. M, “Tax Evasion and Capital Gains Taxation,” American Economic Review,
94
Philanthropy, Tax Policy and Tax Cheating
May 1987, 77 (2), 234–39.
Randolph, W. C., “Dynamic Income, Progressive Taxes, and the Timing of Charitable
Contributions,” Journal of Political Economy, 1995, 103 (4), 709–738.
, “Financing Public Goods,” The Journal of Political Economy, 1987, 95 (2), 420–437.
Saez, E., “The Optimal Tax Treatment of Tax Expenditures,” Journal of Public Eco-
nomics, 2004, 88, 2657–2684.
, J. B. Slemrod, and S. H. Giertz, “The Elasticity of Taxable Income with Respect to
Marginal Tax Rates: A Critical Review’,” NBER Working Paper No. 15012, 2009.
, “Are Estimated Tax Elasticities Really Just Tax Evasion Elasticities? The Case of
Charitable Contributions,” The Review of Economics and Statistics, 1989, 71 (3).
Slemrod, J. B., ““Taxation and Big Brother: Information, Personalization, and Privacy
in 21st Century Tax Policy”,” Fiscal Studies, 2006.
and D. Stephan, “Cheating Ourselves: The Economics of Tax Evasion,” Journal of
Economic Perspectives, 2007, pp. 25–48.
Warr, P. G., “Pareto optimal redistribution and private charity,” Journal of Public Eco-
nomics, 1982, 19 (1), 131 – 138.
Wolfers, J., “Did Unilateral Divorce Laws Raise Divorce Rates? A Reconciliation and
New Results,” The American Economic Review, 2006, 96 (5), 1802–1820.
Yermack, D., “Deductio Ad Absurdum: CEOs Donating Their Own Stock to Their Own
Family Foundations,” November 2008. Mimeo NYU Stern.
95

Philanthropy, Tax Policy and Tax Cheating
Figure 4.1: Charitable contributions as a percentage of total income fortop income groups United States, 1917 to 2005
0.0
5.1
.15
.2.2
5D
onat
ions
as
a fra
ctio
n of
tota
l inc
ome
1915
1920
1925
1930
1935
1940
1945
1950
1955
1960
1965
1970
1975
1980
1985
1990
1995
2000
2005
year
Top 10% to top 1%Top 1% to top .01%Top .01%
Notes: All series show reported donations for top income groups as a fraction of total income excludingcapital gains.Sources: authors’ computation from income tax statistics.
96

Philanthropy, Tax Policy and Tax Cheating
Figure 4.2: Effective marginal tax rates and reported donations as a frac-tion of total income for top .01% of richest taxpayers in the US, 1917 to2005
0.2
.4.6
.81
MTR
0.0
5.1
.15
.2.2
5Fr
actio
n of
tota
l inc
ome
1915
1920
1925
1930
1935
1940
1945
1950
1955
1960
1965
1970
1975
1980
1985
1990
1995
2000
2005
year
ContributionsEffective MTR
Notes: Contribution series show reported donations for top income groups as a fraction of total incomeexcluding capital gains. Effective marginal tax rates series come from authors’ historical tax simulatorbefore 1960 and NBER TAXSIM after 1960 (See Appendix).Sources: authors’ computation from income tax statistics.
97
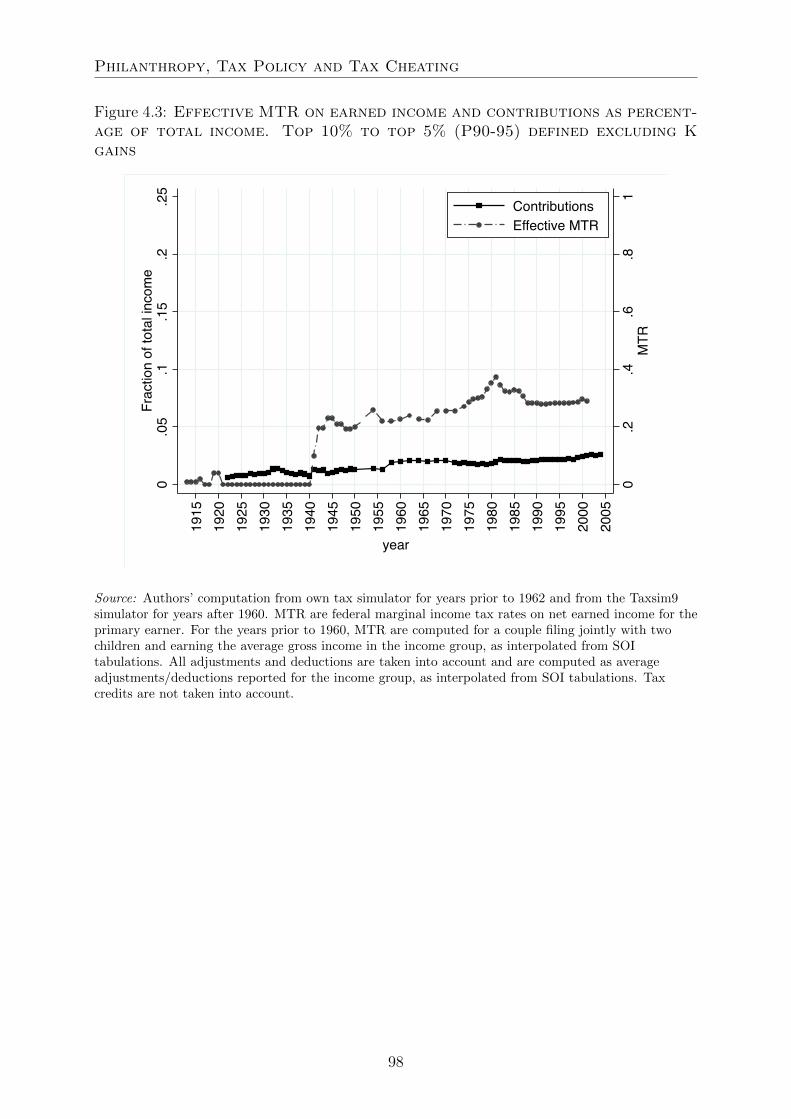
Philanthropy, Tax Policy and Tax Cheating
Figure 4.3: Effective MTR on earned income and contributions as percent-age of total income. Top 10% to top 5% (P90-95) defined excluding Kgains
0.2
.4.6
.81
MTR
0.0
5.1
.15
.2.2
5Fr
actio
n of
tota
l inc
ome
1915
1920
1925
1930
1935
1940
1945
1950
1955
1960
1965
1970
1975
1980
1985
1990
1995
2000
2005
year
ContributionsEffective MTR
Source: Authors’ computation from own tax simulator for years prior to 1962 and from the Taxsim9simulator for years after 1960. MTR are federal marginal income tax rates on net earned income for theprimary earner. For the years prior to 1960, MTR are computed for a couple filing jointly with twochildren and earning the average gross income in the income group, as interpolated from SOItabulations. All adjustments and deductions are taken into account and are computed as averageadjustments/deductions reported for the income group, as interpolated from SOI tabulations. Taxcredits are not taken into account.
98

Philanthropy, Tax Policy and Tax Cheating
Figure 4.4: Effective MTR on earned income and contributions as percent-age of total income. Top 5% to top 1% (P95-P99) defined excluding Kgains
0.2
.4.6
.81
MTR
0.0
5.1
.15
.2.2
5Fr
actio
n of
tota
l inc
ome
1915
1920
1925
1930
1935
1940
1945
1950
1955
1960
1965
1970
1975
1980
1985
1990
1995
2000
2005
year
ContributionsEffective MTR
Source: Authors’ computation from own tax simulator for years prior to 1962 and from the Taxsim9simulator for years after 1960. MTR are federal marginal income tax rates on net earned income for theprimary earner. For the years prior to 1960, MTR are computed for a couple filing jointly with twochildren and earning the average gross income in the income group, as interpolated from SOItabulations. All adjustments and deductions are taken into account and are computed as averageadjustments/deductions reported for the income group, as interpolated from SOI tabulations. Taxcredits are not taken into account.
99

Philanthropy, Tax Policy and Tax Cheating
Table 4.1: Price elasticity estimates, P90-100 (1917 to 2004)
(1) (2) (3) (4) (5)OLS OLS IV IV IV
fe weighted fe fe fe
logprice -0.649∗∗∗ -0.683∗∗∗ -0.595∗∗∗ -0.620∗∗ -0.658∗∗∗
(0.0941) (0.0764) (0.0975) (0.219) (0.0826)
logincome 0.965∗∗ 1.024∗∗ 0.914∗∗∗ 0.938∗∗∗ 1.032∗∗∗
(0.178) (0.150) (0.212) (0.251) (0.180)
Year fixed YES YES YES YES YESeffectsN 407 407 407 407 407
col. (2) OLS f.e. weighted by share of the group in total contrib.
col. (3) logprice instrumented by logprice at a * (average income). a = long-term
ratio of mean income of the group divided by mean income of the pop.
col. (4) logprice instrumented by logprice at inflated income of year n-1
col. (5) logincome instrumented by inflated reported income of year n-1.
Clustered robust s.e. in parentheses. ∗ p < 0.05, ∗∗ p < 0.01, ∗∗∗ p < 0.001
Income groups: P90-P95, P95-P99, P99-P99.95, P99.95-P99.99, P99.99-100.
P90: 90th percentile of the income distribution excluding K gains.
100

Philanthropy, Tax Policy and Tax Cheating
Table 4.2: Dynamic panel model estimates: P90-100, 1970-2004
Top 10% Top 10 to top 1% Top 1%IV IV IV IV IV IV IVfe fe Bl.-Bond fe fe fe fe(1) (2) (3) (4) (5) (6) (7)
logprice -0.738∗∗∗ -0.661∗∗∗ -0.648∗∗∗ -0.391 -0.159 -0.915∗∗∗ -0.749∗∗∗
(0.153) (0.0832) (0.124) (0.357) (0.194) (0.150) (0.148)
∆t.logprice 0.322 0.856 0.447(0.185) (1.116) (0.349)
∆t+1.logprice 0.142 -0.620 -0.000123(0.135) (0.690) (0.159)
logincome 0.783∗∗∗ 0.531∗∗∗ 0.799∗∗∗ 0.542 0.610 0.859∗∗∗ 0.441∗∗
(0.0761) (0.0870) (0.0812) (0.328) (0.342) (0.115) (0.136)
logcontribt−1 0.342∗∗∗
(0.0890)
logcontribt−2 -0.0719∗∗
(0.0241)
logcontribt−3 -0.0548∗
(0.0267)
logcontribt−4 0.0789(0.0793)
logcontribt−5 0.0260(0.0486)
Year FE YES YES YES YES YES YES YES
Trends interacted YES YES YESwith group FEN 192 198 168 64 66 128 132
Cluster-robust standard errors in parentheses; ∗ p < 0.05, ∗∗ p < 0.01, ∗∗∗ p < 0.001Column (3): Blundell-Bond estimator. We allow contributions to follow a AR(5) process
101

Philanthropy, Tax Policy and Tax Cheating
Figure 4.5: Number of new foundations created and foundations termi-nated, United States (1960 to 1972)
0500
1000
1500
Num
ber
of fo
undations
1960 1961 1962 1963 1964 1965 1966 1967 1968 1969 1970 1971 1972
Year
New foundations created Foundations terminated
Source: Caplin and Drysdale and the Foundation Center. Reproduced from Research Papers sponsoredby the the Commission on Private Philanthropy and Public Needs, volume III, p. 1638, figure B-13.
102

Philanthropy, Tax Policy and Tax Cheating
Figure 4.6: Percentage of households with charitable trust or charitablefoundation by income level, United States (1973)
P99 P99.9 P99.990
.05
.1.1
5.2
Fra
ctio
n w
ith
priva
te f
ou
nd
atio
n
Less
than
$10
,000
$10,
000
− 19
,999
$20,
000−
29,9
99
$30,
000−
49,9
99
$50,
000−
99,9
99
$100
,000
−199
,999
$200
,000
−499
,999
Mor
e th
an $
500,
000
Source: IRS & Institute for Social Research (Univ. of Michigan). Research Papers, Commission onPrivate Philanthropy and Public Needs, vol. I, p. 188, Figure 6.Note: P99 = 99th percentile of incomeexcluding capital gains.
103

Philanthropy, Tax Policy and Tax Cheating
Figure 4.7: Total contributions by income group, United States (1960 to1980)
50
75
100
125
150
Tota
l contr
ibutions (
basis
: 100=
1968)
1960 1965 1970 1975 1980 1985Year
P99.99−100 P90−95 P96−98
Note: P99.99-100 = households with income above the 99.99th percentile of income excluding capitalgains. P95-96= households with income above the 95th percentile but below the 96th percentile ofincome excluding capital gains. P92-93= households with income above the 92nd percentile but belowthe 93rd percentile of income excluding capital gains.
104

Philanthropy, Tax Policy and Tax Cheating
Table 4.3: DiD estimates of the effect of TRA69 on charitable contribu-tions of top income households. Dependent variable: log of contributions
(1) (2) (3) (4) (5) (6)P99.99-100 P99.99-100 P99.99-100 P99.99-100 P90-95 P99.99-100
vs. vs. vs. vs. vs. vs.P90-95 P90-95 P80-95 P90-95 P70-90 P90-95
(placebo) (placebo)
Treated*after69 -0.388∗∗∗ -0.282∗∗∗ -0.259∗∗ -0.308∗∗∗
(0.0128) (0.0226) (0.0474) (0.0111)
placebo1 0.0730(0.0494)
placebo2 -0.0122(0.0312)
Controls forincome & price NO YES YES YES YES YES
Controls forpreexisting trend NO NO NO YES NO NO
N 84 84 98 54 126 30Number of clusters 6 6 7 6 7 6
Cluster-robust standard errors in parentheses (clustering at the income group level)∗ p < 0.05, ∗∗ p < 0.01, ∗∗∗ p < 0.001
Placebo 1: Treated group is supposed to be P90-95 and control is P70-90.
Placebo 2: Reform is assumed to be happening in 1964 (1960 to 1964 vs. 1965 to 1968).
105

Philanthropy, Tax Policy and Tax Cheating
Table 4.4: Calibrations of the model
Share of true Deduction Level of Elasticity of Elasticity of reportedcontributions rate Crowding out “cheating” contributions that would
(α) (τ) (GG0) contributions (εgc) justify the subsidy (εgT )
1 0.3 0 - 1.00.75 0.3 0 0.5 1.20.75 0.3 0 1 1.40.75 0.3 0 1.5 1.50.75 0.3 0 2 1.70.75 0.5 0 0.5 1.30.75 0.5 0 1 1.50.75 0.5 0 1.5 1.80.75 0.5 0 2 2.00.75 0.7 0 0.5 1.40.75 0.7 0 1 1.80.75 0.7 0 1.5 2.30.75 0.7 0 2 2.7
1 0.5 -0.4 1 0.60.75 0.5 -0.4 0.5 0.90.75 0.5 -0.4 1 1.30.75 0.5 -0.4 1.5 1.60.75 0.5 -0.4 2 1.9
Note: We assume Rawlsian preferences. A crowding out level of −0.4 is consistent with the upper bound of the estimate of ?, andwould justify tax deductions for charitable contributions for estimated reported elasticities of around 0.6 in absolute value.
106

Philanthropy, Tax Policy and Tax Cheating
Appendix A: Long-term series on contributions and
effective marginal tax rates by income group.
This appendix describes the series of contributions and effective marginal tax rates thatwe have built using tax return data. The U.S. income tax was begun in 1913 and adeduction for charitable contributions was first created in 1917. Starting in 1916, theInternal Revenue Service (IRS) has published detailed statistical tables on tax returnsin Statistics of Income: Individual Income Tax Returns (SOI) (the tables for 1913 to1915 were published in the Annual Reports of the Commissioner of Internal Revenue).These annual 1913 to 2005 tables provide information on the number of tax returns, onthe amounts reported for each source of income, and on deductions claimed for a largenumber of income brackets. Starting in 1960, the IRS has constructed large microfiles oftax returns oversampling taxpayers at the top of the income distribution. These micro-files were constructed annually covering the period 1966 to 1999 and are available to thepublic.23
Piketty and Saez [2003] have also used these same data to compute series on the num-ber of tax units, as well as series on the income level and income share of top incomegroups since 1913 that we have used for our own computations. To our knowledge, noother research has used these data over the long run to study the evolution of charitablecontributions. And, more important, the information available in these data has neverbeen exploited to compute long-term series on effective income taxation. These series oneffective marginal tax rates by income groups24 span a century of numerous and importanttax reforms and may therefore be used for a variety of historical tax studies.
Following Piketty and Saez [2003], we computed two types of series that treat differ-ently realized capital gains.25 The first set of series ranks taxpayers according to incomefully including capital gains. But because of the volatility and, more important, of theendogeneity of capital gain realization with respect to taxation, it proved useful to buildseries ranking taxpayers according to income excluding capital gains. Indeed, at the samelevel of income, taxpayers with different shares of capital gains in total income face dif-ferent incentives to give because of different marginal tax rates on earned income and oncapital gains. The difference between the two marginal tax rates can be substantial, inparticular at the very top of the income distribution (top .01% of taxpayers). Therefore,series on contributions for taxpayers ranked according to income including capital gainsand series ranked by income excluding capital gains are necessary. In the following sub-section, we describe in greater detail the re-ranking issues encountered when computingthese two types of series.
23No microfiles are available for 1961, 1963 and 1965, and the microfiles for 1967, 1969 and 1971 do notinclude as many tax return variables as the files for the following years. In particular, these files do notinclude information on itemized deductions claimed. Note that tabulations of deductions broken downby income brackets are not available for these years, nor for 1951, 1955, 1957 and 1959. For these years,only aggregate deductions were reported in SOI.
24Computations of effective average tax rates are also available from the authors upon request.25For more details on the rationale behind these two types of series, see Piketty and Saez [2003].
107

Philanthropy, Tax Policy and Tax Cheating
Contributions
Series on reported contributions displayed in tables 4.5 and 4.6 were constructed as fol-lows. For the 1960 to 2004 period, the series were computed directly from the IRSmicrofiles. The microfiles allow us to easily rank tax returns by income excluding capitalgains or by income including full capital gains. We computed charitable contributionsas total charitable contributions including carryover from previous years.26 To computecharitable contributions as a percentage of total income, we computed total gross incomefollowing the same definition of total income as in Piketty and Saez [2003]. Note thatwhen computing charitable contributions as a percentage of income, we always considercharitable contributions divided by income re-including capital gains for the two typesof series of taxpayers (i.e., ranked including or excluding capital gains). This is becausecapital gains have an income effect on contributions, regardless of the marginal tax ratethat the taxpayer faces.
For the 1917 to 1960 period, the series were estimated from the published SOI ta-bles by linear interpolation according to the following methodology (all computations areavailable from the authors upon request).27:
* Published IRS tables rank tax returns by net income (1917 to 1943) or by AGI(1944 and after). These tables use a large number of income brackets (the thresh-olds P90, P95, P99, P99.5, P99.9, and P99.99 are usually very close to one of theincome bracket thresholds), and one can use standard Pareto interpolation tech-niques in order to estimate the relevant income levels and income thresholds (P90,P95, etc.) of the distribution of net income (1917 to 1943) and AGI (1944 and af-ter). We then use these thresholds to linearly interpolate the sum of total reportedcontributions above each threshold. This gives us total reported contributions forthe top 10% of taxpayers, the top 5% of taxpayers, and so forth ranked by netincome (1917 to 1943) or AGI (1944 and after). Total reported contributions forgroups P90-95, P95-99, and so forth are obtained by difference. We checked thatour estimation technique does not yield large errors due to linear interpolation ap-proximation. We did the same computation mentioned above with SOI for yearsfor which we also have micro-files. Overall, errors are negligible. The main reasonis the very large number of income brackets in SOI tabulations, especially at thetop of the income distribution.
Note that for a number of years, the filing threshold is very high, and fewer than10% of tax units actually file returns. To correct for this problem of missing re-turns, we adopted the same rule as that proposed by Piketty and Saez [2003]. Theprinciple is that the filing thresholds for singles is substantially lower than thefiling threshold for married households. Thus from 1917 forward, it is always the
26We include carryover in our series in order to guarantee homogeneity over time, because for someyears, only total contributions (including carryover) are available from SOI.
27Note that information on contributions is not available in SOI for 1918 to 1921, 1951, 1955, 1957,1959, 1961, 1963, 1965, 1967, 1969 and 1971.
108

Philanthropy, Tax Policy and Tax Cheating
case that more than 10% of single tax units are actually filing returns, althoughfor some years fewer than 10% of married tax units are filing returns. We adjustedfor missing married returns using a simple extrapolation method, based on theassumption that marital ratios (i.e., ratios of married tax units to single men nothead of household tax units) across income brackets is constant over years.28
* The 1917 to 1960 raw series obtained from linear interpolation were corrected invarious ways. First, the raw series were adjusted to control for the switch from netincome to AGI brackets in 1943 to 1944. We built homogeneous series computedby AGI levels. To do so, we adjusted upward the 1917 to 1943 series computedby net income levels. The potential issue here is that taxpayers may experiencesome re-ranking, because taxpayers deducting large contributions are mechanicallyranked higher on an AGI scale than on net income (AGI minus deductions) scale.We were able to check with the IRS microfiles for 1960 to 2004 that re-rankingissues do not affect the series of contributions for income groups below the top.1%. For taxpayers ranked above the top .1%, slight corrections proved necessary,however, and we used multipliers computed from IRS microfiles to adjust contri-butions’ series of the top .1% for 1917 to 1943.
* Next, and most importantly, corrections need to be made to go from AGI seriesto gross income series (including and excluding capital gains). The tax treatmentof capital gains has changed many times since 1913: from 1913 to 1933, 100% ofcapital gains were included in net income (there was no capital gains exclusion);from 1934 to 1937, 70% of capital gains were included in net income (i.e., 30% ofcapital gains were excluded); from 1938 to 1941, 60% of capital gains were includedin net income (i.e., 40% of capital gains were excluded); from 1942 to 1978, 50%of capital gains were included in net income (1942 to 1943) or in AGI (1944 to1978) (i.e., 50% of capital gains were excluded); from 1979 to 1986, 40% of capitalgains were included in AGI (i.e., 60% of capital gains were excluded); and from1987 forward, 100% of capital gains were included in AGI (there was, once again,no capital gains exclusion). The main issue when going from AGI to gross incomeseries is re-ranking of taxpayers. This issue is likely to arise if taxpayers with a highshare of capital gains contribute differently from taxpayers with a low level of cap-ital gains. A priori, re-ranking effects are totally ambiguous. This is why we reliedon microfiles for 1960 to 2004 to compute adjustment coefficients taking advantageof the reforms in capital gains inclusion in AGI. Our analysis suggested that forincome groups below the top .1%, adjustments are not necessary, because there isno significant difference between the series ranked by AGI, gross income includingcapital gains, and gross income excluding capital gains. For income groups abovethe top .1%, some adjustments proved necessary, because our analysis showed thattaxpayers with large capital gain realizations contribute less for a given level ofincome, which is in line with the fact that their marginal tax rate is lower ceterisparibus. To go from series ranked by AGI to series ranked by gross income fullyincluding capital gains, we therefore had to adjust upward contributions of theP99.9-P99.99 income group and downward contributions of the P99.99-100 income
28The value of the multipliers that we used is available upon request.
109

Philanthropy, Tax Policy and Tax Cheating
group. Note that these adjustments are always lower than 5% and that for 1913to 1933, we made no adjustment to compute series fully including capital gains,because AGI did include 100% of capital gains. We followed the same strategy togo from AGI series to series ranked by income excluding capital gains. All adjust-ment coefficients are available from the authors upon request.
Effective marginal tax rates
To compute series of effective marginal tax rates by top income groups, we relied on dif-ferent sources. First, we used the “Synopsis of federal tax laws” in Statistics of Incomefor 1959, part I, (pp. 307-343). This synopsis provides all the details of the individualincome tax laws for 1913 to 1950. In particular, it gives detailed tables on requirementsfor filing, exemption levels, credits for dependents, normal tax rates, surtax rates, capitalgains taxes, earned income credit, deductions, and so forth. For 1950 to 1960, we relieddirectly on the information given every year on tax laws in the SOI. For the years after1960, we used NBER’s Taxsim9 simulator. Note that we focus on federal income tax anddo not compute state income tax in our simulator. Note as well that marginal tax ratesare computed at the average income level of the income group. For most income groups,this is not an issue, because there is very little difference between the marginal tax rateat the average income of the group and the average marginal tax rate in the group. Forthe top .01% of taxpayers, though, the difference may matter. Unfortunately, there is noeasy way to cope with this issue, due to the lack of microdata before 1960.
For years prior to 1960, the series are computed as follows. We take the average grossincome of the income group. We deduct average reported adjustments and deductionsthat we interpolated following the same strategy as for contributions. With no informa-tion on the average matrimonial status of taxpayers by income group, we focus on thecase of a married couple filing jointly with two children. Concerning capital gains, we usethe composition series in Piketty and Saez [2003], which give the share of capital gains intotal income by income groups for series ranked including and excluding capital gains.29
We then compute income tax liability and marginal income tax rates on earned incomeand on capital gains.
Among the many features that our 1913 to 1960 Federal Income Tax simulator takesinto account, we can mention the alternative tax on capital gains, the Earned IncomeCredit, as well as all special taxes and refunds, such as the Defense Tax and Victory Tax.All the files necessary to the functioning of our simulator in Stata format are availablefrom the authors upon request.
29Note, however, that due to data limitations, these capital gains series cannot disentangle short-termfrom long-term capital gains. Our computations for 1913 to 1960 are therefore based on the assumptionthat all capital gains are long-term capital gains with respect to the functioning of the alternative tax oncapital gains.
110
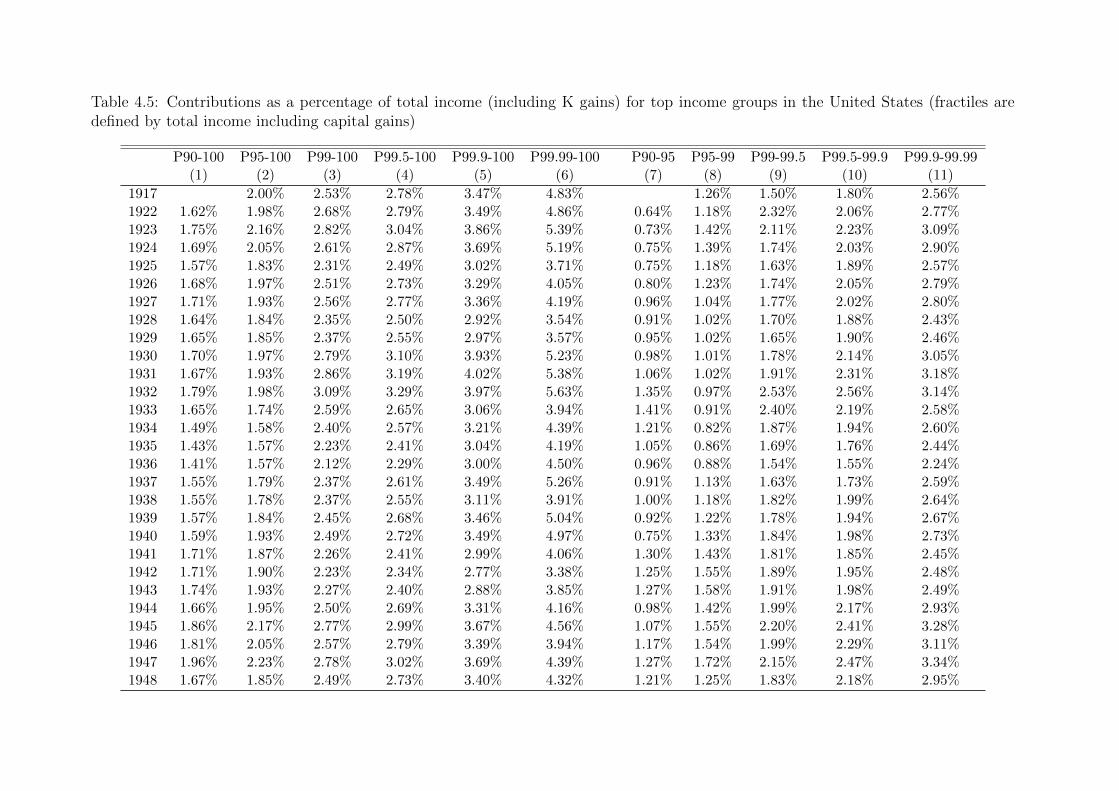
Table 4.5: Contributions as a percentage of total income (including K gains) for top income groups in the United States (fractiles aredefined by total income including capital gains)
P90-100 P95-100 P99-100 P99.5-100 P99.9-100 P99.99-100 P90-95 P95-99 P99-99.5 P99.5-99.9 P99.9-99.99(1) (2) (3) (4) (5) (6) (7) (8) (9) (10) (11)
1917 2.00% 2.53% 2.78% 3.47% 4.83% 1.26% 1.50% 1.80% 2.56%1922 1.62% 1.98% 2.68% 2.79% 3.49% 4.86% 0.64% 1.18% 2.32% 2.06% 2.77%1923 1.75% 2.16% 2.82% 3.04% 3.86% 5.39% 0.73% 1.42% 2.11% 2.23% 3.09%1924 1.69% 2.05% 2.61% 2.87% 3.69% 5.19% 0.75% 1.39% 1.74% 2.03% 2.90%1925 1.57% 1.83% 2.31% 2.49% 3.02% 3.71% 0.75% 1.18% 1.63% 1.89% 2.57%1926 1.68% 1.97% 2.51% 2.73% 3.29% 4.05% 0.80% 1.23% 1.74% 2.05% 2.79%1927 1.71% 1.93% 2.56% 2.77% 3.36% 4.19% 0.96% 1.04% 1.77% 2.02% 2.80%1928 1.64% 1.84% 2.35% 2.50% 2.92% 3.54% 0.91% 1.02% 1.70% 1.88% 2.43%1929 1.65% 1.85% 2.37% 2.55% 2.97% 3.57% 0.95% 1.02% 1.65% 1.90% 2.46%1930 1.70% 1.97% 2.79% 3.10% 3.93% 5.23% 0.98% 1.01% 1.78% 2.14% 3.05%1931 1.67% 1.93% 2.86% 3.19% 4.02% 5.38% 1.06% 1.02% 1.91% 2.31% 3.18%1932 1.79% 1.98% 3.09% 3.29% 3.97% 5.63% 1.35% 0.97% 2.53% 2.56% 3.14%1933 1.65% 1.74% 2.59% 2.65% 3.06% 3.94% 1.41% 0.91% 2.40% 2.19% 2.58%1934 1.49% 1.58% 2.40% 2.57% 3.21% 4.39% 1.21% 0.82% 1.87% 1.94% 2.60%1935 1.43% 1.57% 2.23% 2.41% 3.04% 4.19% 1.05% 0.86% 1.69% 1.76% 2.44%1936 1.41% 1.57% 2.12% 2.29% 3.00% 4.50% 0.96% 0.88% 1.54% 1.55% 2.24%1937 1.55% 1.79% 2.37% 2.61% 3.49% 5.26% 0.91% 1.13% 1.63% 1.73% 2.59%1938 1.55% 1.78% 2.37% 2.55% 3.11% 3.91% 1.00% 1.18% 1.82% 1.99% 2.64%1939 1.57% 1.84% 2.45% 2.68% 3.46% 5.04% 0.92% 1.22% 1.78% 1.94% 2.67%1940 1.59% 1.93% 2.49% 2.72% 3.49% 4.97% 0.75% 1.33% 1.84% 1.98% 2.73%1941 1.71% 1.87% 2.26% 2.41% 2.99% 4.06% 1.30% 1.43% 1.81% 1.85% 2.45%1942 1.71% 1.90% 2.23% 2.34% 2.77% 3.38% 1.25% 1.55% 1.89% 1.95% 2.48%1943 1.74% 1.93% 2.27% 2.40% 2.88% 3.85% 1.27% 1.58% 1.91% 1.98% 2.49%1944 1.66% 1.95% 2.50% 2.69% 3.31% 4.16% 0.98% 1.42% 1.99% 2.17% 2.93%1945 1.86% 2.17% 2.77% 2.99% 3.67% 4.56% 1.07% 1.55% 2.20% 2.41% 3.28%1946 1.81% 2.05% 2.57% 2.79% 3.39% 3.94% 1.17% 1.54% 1.99% 2.29% 3.11%1947 1.96% 2.23% 2.78% 3.02% 3.69% 4.39% 1.27% 1.72% 2.15% 2.47% 3.34%1948 1.67% 1.85% 2.49% 2.73% 3.40% 4.32% 1.21% 1.25% 1.83% 2.18% 2.95%

Table 4.5: (continued)
P90-100 P95-100 P99-100 P99.5-100 P99.9-100 P99.99-100 P90-95 P95-99 P99-99.5 P99.5-99.9 P99.9-99.99(1) (2) (3) (4) (5) (6) (7) (8) (9) (10) (11)
1949 1.82% 2.01% 2.72% 2.99% 3.75% 4.84% 1.35% 1.36% 2.03% 2.35% 3.23%1950 1.72% 1.87% 2.42% 2.65% 3.24% 4.95% 1.32% 1.32% 1.80% 2.14% 2.58%1952 1.95% 2.21% 2.96% 3.26% 4.14% 5.41% 1.37% 1.54% 2.19% 2.57% 3.55%1953 2.04% 2.31% 3.14% 3.47% 4.47% 5.69% 1.47% 1.63% 2.35% 2.70% 3.90%1954 2.07% 2.36% 3.23% 3.57% 4.57% 6.51% 1.42% 1.61% 2.35% 2.75% 3.58%1956 2.22% 2.61% 3.45% 3.68% 4.79% 6.98% 1.33% 1.90% 2.86% 2.75% 3.65%1958 2.58% 2.89% 3.83% 4.14% 5.57% 8.54% 1.92% 2.13% 3.07% 2.99% 4.07%1960 2.72% 3.10% 3.96% 4.44% 5.78% 8.72% 1.95% 2.41% 2.76% 3.32% 4.12%1962 2.76% 3.08% 3.97% 4.45% 5.99% 8.62% 2.10% 2.38% 2.79% 3.18% 4.48%1964 2.71% 3.00% 3.74% 4.20% 5.76% 7.82% 2.09% 2.40% 2.66% 2.88% 4.46%1966 2.55% 2.82% 3.55% 4.00% 5.38% 7.39% 1.98% 2.24% 2.45% 2.79% 4.15%1968 2.64% 2.90% 3.71% 4.13% 5.33% 6.62% 2.06% 2.20% 2.59% 2.97% 4.46%1970 2.60% 2.88% 3.70% 4.19% 5.63% 7.79% 2.05% 2.31% 2.58% 3.05% 4.41%1972 2.54% 2.87% 3.76% 4.22% 5.68% 7.92% 1.88% 2.20% 2.64% 2.98% 4.32%1973 2.37% 2.64% 3.47% 3.94% 5.15% 7.07% 1.84% 2.06% 2.43% 3.00% 4.16%1974 2.35% 2.60% 3.40% 3.80% 4.90% 6.77% 1.85% 2.04% 2.51% 2.96% 4.01%1975 2.40% 2.68% 3.52% 3.99% 5.23% 7.39% 1.85% 2.11% 2.52% 3.08% 4.16%1976 2.43% 2.77% 3.62% 4.13% 5.44% 7.61% 1.77% 2.19% 2.51% 3.15% 4.37%1977 2.38% 2.70% 3.57% 4.04% 5.23% 7.13% 1.75% 2.11% 2.52% 3.13% 4.24%1978 2.35% 2.63% 3.45% 3.92% 5.24% 7.40% 1.80% 2.07% 2.41% 2.92% 4.21%1979 2.33% 2.62% 3.27% 3.61% 4.44% 5.24% 1.73% 2.11% 2.43% 2.84% 3.90%1980 2.41% 2.71% 3.40% 3.72% 4.52% 5.54% 1.81% 2.19% 2.61% 2.98% 3.91%1981 2.55% 2.86% 3.60% 3.94% 4.71% 5.43% 1.94% 2.28% 2.73% 3.18% 4.26%1982 2.49% 2.66% 3.20% 3.37% 3.62% 3.81% 2.14% 2.22% 2.71% 3.10% 3.49%1983 2.54% 2.75% 3.27% 3.40% 3.54% 3.57% 2.06% 2.31% 2.89% 3.23% 3.52%1984 2.54% 2.75% 3.21% 3.41% 3.30% 3.63% 2.08% 2.34% 2.58% 3.54% 3.05%1985 2.71% 2.94% 3.54% 3.87% 4.21% 3.76% 2.18% 2.38% 2.48% 3.44% 4.55%1986 2.75% 3.00% 3.62% 3.87% 4.16% 3.23% 2.09% 2.29% 2.65% 3.46% 4.93%1987 2.51% 2.72% 3.12% 3.16% 3.53% 4.10% 2.03% 2.35% 3.01% 2.76% 3.17%

Table 4.5: (continued)
P90-100 P95-100 P99-100 P99.5-100 P99.9-100 P99.99-100 P90-95 P95-99 P99-99.5 P99.5-99.9 P99.9-99.99(1) (2) (3) (4) (5) (6) (7) (8) (9) (10) (11)
1988 2.31% 2.40% 2.57% 2.61% 2.89% 3.65% 2.06% 2.21% 2.43% 2.26% 2.34%1989 2.42% 2.54% 2.76% 2.86% 3.25% 3.96% 2.12% 2.31% 2.42% 2.40% 2.76%1990 2.38% 2.49% 2.68% 2.75% 3.07% 3.85% 2.11% 2.28% 2.48% 2.38% 2.54%1991 2.53% 2.67% 2.96% 3.08% 3.48% 4.25% 2.20% 2.40% 2.60% 2.66% 3.00%1992 2.44% 2.53% 2.62% 2.69% 2.93% 3.39% 2.23% 2.44% 2.40% 2.41% 2.61%1993 2.60% 2.75% 3.14% 3.27% 3.77% 4.54% 2.24% 2.38% 2.71% 2.71% 3.25%1994 2.62% 2.79% 3.25% 3.47% 4.07% 5.25% 2.21% 2.34% 2.57% 2.79% 3.28%1995 2.52% 2.64% 3.03% 3.19% 3.73% 4.65% 2.21% 2.24% 2.52% 2.55% 3.13%1996 2.59% 2.73% 3.13% 3.34% 3.96% 4.81% 2.22% 2.28% 2.43% 2.54% 3.34%1997 2.75% 2.90% 3.32% 3.57% 4.31% 5.33% 2.30% 2.40% 2.41% 2.56% 3.54%1998 2.70% 2.84% 3.19% 3.35% 3.82% 4.70% 2.27% 2.40% 2.56% 2.68% 3.14%1999 2.82% 2.96% 3.28% 3.47% 4.00% 4.99% 2.38% 2.53% 2.51% 2.67% 3.24%2000 2.81% 2.92% 3.26% 3.43% 3.89% 4.84% 2.46% 2.44% 2.52% 2.66% 3.06%2001 2.85% 2.97% 3.33% 3.54% 4.06% 4.90% 2.50% 2.53% 2.55% 2.82% 3.39%2002 2.91% 3.01% 3.34% 3.55% 4.05% 4.98% 2.65% 2.64% 2.63% 2.91% 3.36%2003 2.97% 3.09% 3.44% 3.67% 4.24% 5.26% 2.62% 2.69% 2.62% 2.89% 3.44%2004 3.00% 3.11% 3.42% 3.61% 4.16% 4.98% 2.68% 2.70% 2.69% 2.79% 3.46%
Source: Authors’ computation from Statistics of Income (1917 to 1960) and IRS samples of taxpayers (1962 to 2005).
Note: Contributions are total reported contributions including carry-over from previous years.
P90-100: Taxpayers with income above the 90th percentile of the income distribution including K gains.
P90-95: Taxpayers with income between the 90th and the 95th percentile of the income distribution including K gains.
P95-99: Taxpayers with income between the 95th and the 99th percentile of the income distribution including K gains, etc.

Table 4.6: Contributions as a percentage of total income (including K gains) for top income groups in the United States (fractiles aredefined by total income excluding capital gains)
P90-100 P95-100 P99-100 P99.5-100 P99.9-100 P99.99-100 P90-95 P95-99 P99-99.5 P99.5-99.9 P99.9-99.99(1) (2) (3) (4) (5) (6) (7) (8) (9) (10) (11)
1917 1.89% 2.34% 2.54% 3.07% 3.87% 1.26% 1.50% 1.80% 2.54%1922 1.70% 2.10% 2.91% 3.10% 4.13% 6.47% 0.64% 1.18% 2.32% 2.06% 2.98%1923 1.87% 2.32% 3.15% 3.49% 4.80% 8.35% 0.73% 1.42% 2.11% 2.23% 3.10%1924 1.79% 2.19% 2.89% 3.25% 4.48% 7.73% 0.75% 1.39% 1.74% 2.03% 2.88%1925 1.60% 1.89% 2.45% 2.70% 3.47% 5.12% 0.75% 1.18% 1.63% 1.89% 2.55%1926 1.66% 1.95% 2.51% 2.74% 3.36% 4.38% 0.80% 1.23% 1.74% 2.05% 2.76%1927 1.68% 1.91% 2.55% 2.78% 3.45% 4.53% 0.96% 1.04% 1.77% 2.02% 2.79%1928 1.59% 1.80% 2.34% 2.51% 3.00% 3.90% 0.91% 1.02% 1.70% 1.88% 2.41%1929 1.60% 1.80% 2.35% 2.54% 3.02% 3.85% 0.95% 1.02% 1.65% 1.90% 2.45%1930 1.69% 1.95% 2.79% 3.10% 3.98% 5.51% 0.98% 1.01% 1.78% 2.14% 3.04%1931 1.65% 1.90% 2.80% 3.11% 3.90% 5.22% 1.06% 1.02% 1.91% 2.31% 3.12%1932 1.87% 2.10% 3.34% 3.61% 4.61% 7.44% 1.35% 0.97% 2.53% 2.56% 3.23%1933 1.82% 1.97% 3.07% 3.29% 4.31% 7.83% 1.41% 0.91% 2.40% 2.19% 2.49%1934 1.59% 1.73% 2.71% 3.00% 4.08% 6.95% 1.21% 0.82% 1.87% 1.94% 2.68%1935 1.47% 1.64% 2.39% 2.62% 3.49% 5.50% 1.05% 0.86% 1.69% 1.76% 2.49%1936 1.47% 1.66% 2.30% 2.53% 3.51% 6.01% 0.96% 0.88% 1.54% 1.55% 2.31%1937 1.61% 1.88% 2.55% 2.84% 3.97% 6.61% 0.91% 1.13% 1.63% 1.73% 2.70%1938 1.65% 1.92% 2.67% 2.97% 4.02% 6.62% 1.00% 1.18% 1.82% 1.99% 2.71%1939 1.71% 2.04% 2.87% 3.25% 4.66% 8.85% 0.92% 1.22% 1.78% 1.94% 2.69%1940 1.74% 2.16% 2.96% 3.35% 4.85% 9.20% 0.75% 1.33% 1.84% 1.98% 2.79%1941 1.90% 2.15% 2.82% 3.16% 4.58% 8.58% 1.30% 1.43% 1.81% 1.85% 2.75%1942 1.94% 2.22% 2.85% 3.18% 4.57% 8.61% 1.25% 1.55% 1.89% 1.95% 2.85%1943 1.94% 2.22% 2.85% 3.19% 4.65% 9.59% 1.27% 1.58% 1.91% 1.98% 2.89%1944 1.86% 2.24% 3.11% 3.54% 5.25% 10.10% 0.98% 1.42% 1.99% 2.17% 3.35%1945 2.04% 2.43% 3.33% 3.79% 5.59% 10.78% 1.07% 1.55% 2.20% 2.41% 3.73%1946 1.98% 2.29% 3.10% 3.56% 5.25% 9.68% 1.17% 1.54% 1.99% 2.29% 3.50%1947 2.12% 2.47% 3.30% 3.77% 5.49% 9.76% 1.27% 1.72% 2.15% 2.47% 3.74%1948 1.83% 2.08% 2.99% 3.44% 5.08% 9.48% 1.21% 1.25% 1.83% 2.18% 3.32%

Table 4.6: (continued)
P90-100 P95-100 P99-100 P99.5-100 P99.9-100 P99.99-100 P90-95 P95-99 P99-99.5 P99.5-99.9 P99.9-99.99(1) (2) (3) (4) (5) (6) (7) (8) (9) (10) (11)
1949 1.96% 2.23% 3.20% 3.67% 5.37% 9.77% 1.35% 1.36% 2.03% 2.35% 3.55%1950 1.85% 2.07% 2.85% 3.26% 4.66% 9.93% 1.32% 1.32% 1.80% 2.14% 2.98%1954 2.18% 2.54% 3.69% 4.26% 6.37% 12.03% 1.42% 1.61% 2.35% 2.75% 4.09%1956 2.31% 2.77% 3.87% 4.31% 6.52% 12.67% 1.33% 1.90% 2.86% 2.75% 3.96%1958 2.65% 3.01% 4.19% 4.69% 7.16% 13.93% 1.92% 2.13% 3.07% 2.99% 4.41%1960 2.82% 3.26% 4.35% 5.08% 7.31% 13.76% 1.96% 2.45% 2.78% 3.54% 4.54%1962 2.86% 3.24% 4.38% 5.10% 7.72% 14.00% 2.11% 2.43% 2.85% 3.34% 5.02%1964 2.82% 3.19% 4.24% 4.87% 7.63% 13.80% 2.08% 2.44% 2.92% 3.01% 4.92%1966 2.60% 2.91% 3.77% 4.40% 6.40% 11.50% 1.98% 2.26% 2.39% 2.92% 4.18%1968 2.69% 3.00% 4.00% 4.58% 6.74% 11.88% 2.05% 2.21% 2.65% 2.97% 4.64%1970 2.64% 2.94% 3.86% 4.45% 6.55% 11.40% 2.07% 2.31% 2.63% 3.05% 4.56%1972 2.56% 2.91% 3.97% 4.49% 6.50% 10.56% 1.89% 2.18% 2.87% 3.11% 4.76%1973 2.41% 2.70% 3.65% 4.22% 5.93% 9.71% 1.85% 2.09% 2.48% 3.12% 4.51%1974 2.38% 2.63% 3.53% 4.00% 5.43% 8.65% 1.89% 2.03% 2.56% 3.05% 4.20%1975 2.42% 2.73% 3.61% 4.12% 5.60% 8.83% 1.85% 2.17% 2.56% 3.14% 4.30%1976 2.44% 2.78% 3.70% 4.22% 5.84% 9.09% 1.81% 2.20% 2.62% 3.14% 4.51%1977 2.39% 2.74% 3.66% 4.17% 5.70% 8.92% 1.75% 2.14% 2.61% 3.14% 4.41%1978 2.36% 2.66% 3.53% 4.02% 5.62% 8.62% 1.80% 2.10% 2.52% 2.93% 4.43%1979 2.37% 2.69% 3.47% 3.88% 5.12% 7.10% 1.73% 2.15% 2.54% 2.91% 4.15%1980 2.47% 2.79% 3.55% 3.94% 5.14% 7.33% 1.86% 2.25% 2.64% 3.02% 4.12%1981 2.60% 2.95% 3.88% 4.34% 5.62% 7.93% 1.96% 2.30% 2.82% 3.35% 4.56%1982 2.54% 2.74% 3.36% 3.65% 4.25% 5.34% 2.16% 2.27% 2.62% 3.11% 3.69%1983 2.59% 2.85% 3.45% 3.70% 4.21% 4.95% 2.07% 2.37% 2.81% 3.24% 3.81%1984 2.59% 2.82% 3.45% 3.74% 3.90% 5.18% 2.12% 2.32% 2.65% 3.58% 3.18%1985 2.75% 3.04% 3.81% 4.27% 5.13% 5.18% 2.12% 2.40% 2.55% 3.40% 5.11%1986 2.87% 3.20% 4.10% 4.59% 4.07% 4.84% 2.09% 2.33% 2.54% 5.09% 3.56%1987 2.49% 2.71% 3.13% 3.17% 3.54% 4.35% 2.03% 2.35% 2.99% 2.82% 3.09%1988 2.30% 2.42% 2.59% 2.63% 2.89% 3.67% 2.01% 2.23% 2.44% 2.33% 2.39%1989 2.40% 2.52% 2.77% 2.88% 3.26% 3.88% 2.10% 2.27% 2.43% 2.47% 2.87%

Table 4.6: (continued)
P90-100 P95-100 P99-100 P99.5-100 P99.9-100 P99.99-100 P90-95 P95-99 P99-99.5 P99.5-99.9 P99.9-99.99(1) (2) (3) (4) (5) (6) (7) (8) (9) (10) (11)
1990 2.37% 2.48% 2.68% 2.74% 3.06% 3.77% 2.09% 2.29% 2.51% 2.40% 2.63%1991 2.52% 2.68% 2.98% 3.09% 3.49% 4.21% 2.17% 2.41% 2.65% 2.70% 3.07%1992 2.42% 2.51% 2.59% 2.66% 2.86% 3.21% 2.21% 2.43% 2.36% 2.43% 2.65%1993 2.55% 2.71% 3.06% 3.20% 3.60% 4.40% 2.18% 2.37% 2.65% 2.78% 3.13%1994 2.57% 2.74% 3.17% 3.38% 4.02% 5.11% 2.17% 2.33% 2.56% 2.72% 3.37%1995 2.49% 2.61% 2.96% 3.12% 3.66% 4.56% 2.21% 2.25% 2.50% 2.55% 3.15%1996 2.56% 2.70% 3.12% 3.31% 3.93% 5.01% 2.20% 2.25% 2.52% 2.61% 3.26%1997 2.69% 2.85% 3.27% 3.47% 4.22% 5.56% 2.25% 2.38% 2.57% 2.58% 3.41%1998 2.64% 2.80% 3.15% 3.34% 3.91% 5.02% 2.16% 2.40% 2.51% 2.63% 3.22%1999 2.77% 2.91% 3.22% 3.43% 4.03% 5.05% 2.37% 2.52% 2.48% 2.69% 3.38%2000 2.83% 2.96% 3.30% 3.48% 3.97% 4.84% 2.43% 2.52% 2.60% 2.82% 3.41%2001 2.87% 3.01% 3.36% 3.56% 4.13% 5.20% 2.49% 2.61% 2.67% 2.89% 3.45%2002 2.89% 2.99% 3.32% 3.52% 4.09% 5.31% 2.63% 2.64% 2.66% 2.86% 3.34%2003 2.94% 3.10% 3.42% 3.65% 4.30% 5.53% 2.50% 2.75% 2.67% 2.88% 3.49%2004 3.00% 3.12% 3.47% 3.65% 4.30% 5.32% 2.65% 2.70% 2.81% 2.82% 3.60%
Source: Authors’s computation from Statistics of Income (1917 to 1960) and IRS samples of taxpayers (1962 to 2005).
Note: Contributions are total reported contributions including carry-over from previous years.
P90-100: Taxpayers with income above the 90th percentile of the income distribution excluding K gains.
P90-95: Taxpayers with income between the 90th and the 95th percentile of the income distribution excluding K gains.
P95-99: Taxpayers with income between the 95th and the 99th percentile of the income distribution excluding K gains, etc.

Table 4.7: Effective marginal tax rates on earned income for top income groups in the United States
Fractiles defined including K gains Fractiles defined excluding K gains
P90-95 P95-99 P99-99.5 P99.5-99.9 P99.9-99.99 P99.99-100 P90-95 P95-99 P99-99.5 P99.5-99.9 P99.9-99.99 P99.99-100(1) (2) (3) (4) (5) (6) (7) (8) (9) (10) (11) (12)
1913 1.0% 1.0% 1.0% 1.0% 2.0% 5.0% 1.0% 1.0% 1.0% 1.0% 2.0% 5.0%1914 1.0% 1.0% 1.0% 1.0% 2.0% 5.0% 1.0% 1.0% 1.0% 1.0% 2.0% 5.0%1915 1.0% 1.0% 1.0% 1.0% 3.0% 6.0% 1.0% 1.0% 1.0% 1.0% 2.0% 6.0%1916 2.0% 2.0% 2.0% 2.0% 4.0% 11.0% 2.0% 2.0% 2.0% 2.0% 4.0% 11.0%1917 0.0% 2.0% 5.0% 8.0% 16.0% 50.0% 0.0% 2.0% 5.0% 8.0% 16.0% 50.0%1918 0.0% 6.0% 14.0% 17.0% 33.0% 72.0% 0.0% 6.0% 14.0% 17.0% 34.0% 72.0%1919 0.0% 4.0% 11.0% 15.0% 33.0% 68.0% 4.0% 4.0% 11.0% 15.0% 33.0% 68.0%1920 4.0% 4.0% 11.0% 15.0% 29.0% 64.0% 4.0% 4.0% 11.0% 15.0% 30.0% 64.0%1921 0.0% 4.0% 6.0% 13.0% 25.0% 60.0% 0.0% 4.0% 6.0% 13.0% 26.0% 64.0%1922 0.0% 4.0% 9.0% 12.0% 26.0% 57.0% 0.0% 4.0% 9.0% 12.0% 27.0% 57.0%1923 0.0% 3.0% 6.8% 9.0% 21.0% 42.8% 0.0% 3.0% 6.8% 9.8% 21.8% 42.8%1924 0.0% 1.5% 3.0% 9.0% 25.0% 43.0% 0.0% 1.5% 3.0% 9.0% 24.0% 44.0%1925 0.0% 1.1% 2.3% 7.5% 22.0% 25.0% 0.0% 1.1% 2.3% 7.5% 21.0% 25.0%1926 0.0% 1.1% 2.3% 7.5% 22.0% 25.0% 0.0% 1.1% 2.3% 6.8% 21.0% 25.0%1927 0.0% 1.1% 3.0% 7.5% 22.0% 25.0% 0.0% 1.1% 3.0% 7.5% 22.0% 25.0%1928 0.0% 1.1% 3.0% 8.3% 24.0% 25.0% 0.0% 1.1% 3.0% 8.3% 23.0% 25.0%1929 0.0% 1.1% 2.3% 6.8% 22.0% 24.0% 0.0% 1.1% 2.3% 6.8% 22.0% 24.0%1930 0.0% 0.0% 1.1% 5.3% 17.0% 25.0% 0.0% 0.0% 2.3% 5.3% 17.0% 25.0%1931 0.0% 0.0% 1.1% 3.0% 14.0% 25.0% 0.0% 0.0% 1.1% 3.0% 14.0% 25.0%1932 0.0% 0.0% 4.0% 9.0% 19.0% 56.0% 0.0% 0.0% 4.0% 9.0% 19.0% 56.0%1933 0.0% 0.0% 4.0% 9.0% 19.0% 56.0% 0.0% 0.0% 4.0% 9.0% 19.0% 56.0%1934 0.0% 0.0% 4.0% 8.0% 21.0% 56.0% 0.0% 0.0% 4.0% 8.0% 23.0% 56.0%1935 0.0% 0.0% 4.0% 9.0% 23.0% 56.0% 0.0% 0.0% 4.0% 9.0% 23.0% 56.0%1936 0.0% 0.0% 4.0% 11.0% 28.0% 64.0% 0.0% 0.0% 4.0% 11.0% 28.0% 64.0%1937 0.0% 0.0% 4.0% 10.0% 25.0% 64.0% 0.0% 0.0% 4.0% 11.0% 28.0% 64.0%1938 0.0% 0.0% 4.0% 9.0% 23.0% 62.0% 0.0% 0.0% 4.0% 9.0% 23.0% 62.0%

Table 4.7: (continued)
P90-95 P95-99 P99-99.5 P99.5-99.9 P99.9-99.99 P99.99-100 P90-95 P95-99 P99-99.5 P99.5-99.9 P99.9-99.99 P99.99-100(1) (2) (3) (4) (5) (6) (7) (8) (9) (10) (11) (12)
1939 0.0% 0.0% 4.0% 9.0% 23.0% 62.0% 0.0% 0.0% 4.0% 10.0% 25.0% 62.0%1940 0.0% 4.4% 4.4% 13.2% 40.7% 68.2% 0.0% 4.4% 4.4% 13.2% 40.7% 70.4%1941 10.0% 10.0% 17.0% 33.0% 57.0% 70.0% 10.0% 10.0% 17.0% 33.0% 57.0% 70.0%1942 19.6% 22.7% 30.9% 50.5% 71.1% 91.4% 19.6% 22.7% 30.9% 50.5% 72.5% 91.4%1943 19.6% 22.7% 35.0% 53.6% 75.6% 91.4% 19.6% 22.7% 35.0% 53.6% 75.6% 91.4%1944 25.0% 25.0% 37.0% 56.0% 75.0% 93.0% 23.0% 25.0% 37.0% 56.0% 75.0% 93.0%1945 25.0% 29.0% 41.0% 59.0% 75.0% 92.0% 23.0% 25.0% 41.0% 56.0% 75.0% 93.0%1946 20.9% 24.7% 40.9% 56.1% 71.3% 85.5% 20.9% 24.7% 40.9% 56.1% 71.3% 85.5%1947 20.9% 24.7% 40.9% 56.1% 71.3% 85.5% 20.9% 24.7% 40.9% 56.1% 71.3% 85.5%1948 19.4% 22.9% 37.8% 54.6% 68.6% 82.1% 19.4% 22.9% 41.4% 54.6% 68.6% 82.1%1949 19.4% 22.9% 37.8% 51.9% 66.0% 82.1% 19.4% 22.9% 37.8% 51.9% 68.6% 82.1%1950 20.0% 27.3% 42.8% 56.4% 73.7% 83.4% 20.0% 27.3% 42.8% 56.4% 73.7% 84.4%1954 26.0% 30.0% 50.0% 62.0% 75.0% 90.0% 26.0% 30.0% 50.0% 62.0% 75.0% 90.0%1956 22.0% 26.0% 34.0% 50.0% 62.0% 84.0% 22.0% 26.0% 34.0% 47.0% 62.0% 87.0%1958 22.0% 26.0% 34.0% 50.0% 62.0% 84.0% 22.0% 26.0% 34.0% 47.0% 62.0% 84.0%1960 22.8% 28.1% 39.1% 51.4% 62.9% 49.1% 22.7% 27.5% 38.3% 49.6% 64.5% 80.3%1962 24.0% 29.2% 40.8% 52.8% 62.4% 55.2% 24.0% 28.5% 39.8% 50.8% 64.5% 79.7%1964 22.8% 27.9% 38.8% 50.0% 58.0% 55.5% 22.7% 27.2% 38.0% 48.7% 59.7% 72.1%1966 22.4% 27.4% 38.6% 48.5% 56.1% 53.2% 22.4% 26.7% 37.8% 47.1% 58.1% 67.4%1968 25.6% 31.9% 45.0% 54.5% 60.0% 53.6% 25.4% 30.7% 43.7% 52.8% 64.0% 71.7%1970 25.6% 31.2% 42.2% 50.5% 58.3% 55.8% 25.6% 30.5% 41.9% 50.3% 59.8% 67.1%1972 25.7% 31.9% 42.8% 49.7% 56.8% 60.1% 25.6% 31.1% 42.5% 49.8% 59.4% 65.6%1974 27.2% 33.7% 44.2% 50.8% 57.8% 60.5% 27.1% 33.1% 44.3% 51.2% 60.0% 65.2%1975 28.7% 35.6% 45.9% 52.4% 59.3% 60.7% 28.6% 35.1% 46.3% 52.8% 61.1% 64.9%1976 29.9% 36.9% 47.1% 52.9% 58.5% 54.8% 29.7% 36.3% 47.4% 53.6% 61.6% 65.7%1977 30.3% 39.4% 50.7% 55.8% 62.6% 62.6% 30.1% 38.4% 50.8% 56.0% 63.5% 65.6%1978 30.6% 38.9% 48.8% 54.3% 60.8% 62.0% 30.6% 38.2% 49.2% 54.9% 62.7% 65.9%1979 33.3% 40.6% 48.7% 54.1% 57.8% 58.9% 33.1% 40.5% 49.7% 55.7% 62.8% 64.2%1980 35.6% 42.6% 50.2% 55.1% 56.0% 44.4% 35.4% 42.3% 50.8% 56.5% 62.4% 63.0%

Table 4.7: (continued)
P90-95 P95-99 P99-99.5 P99.5-99.9 P99.9-99.99 P99.99-100 P90-95 P95-99 P99-99.5 P99.5-99.9 P99.9-99.99 P99.99-100(1) (2) (3) (4) (5) (6) (7) (8) (9) (10) (11) (12)
1981 37.3% 43.7% 49.9% 54.2% 53.2% 42.7% 37.4% 43.4% 51.0% 55.9% 60.8% 60.4%1982 34.9% 40.9% 46.1% 46.4% 45.0% 42.0% 34.7% 40.6% 46.9% 48.3% 48.4% 47.6%1983 32.5% 37.6% 42.1% 43.8% 43.1% 41.4% 32.4% 37.4% 42.9% 46.2% 47.8% 47.4%1984 32.5% 37.6% 41.4% 43.6% 43.8% 41.5% 32.3% 37.4% 42.4% 45.7% 48.2% 47.9%1985 33.2% 38.5% 43.0% 44.9% 44.6% 43.0% 33.0% 38.3% 43.6% 47.3% 48.9% 48.6%1986 33.0% 37.8% 41.7% 42.2% 42.4% 41.7% 32.5% 37.7% 43.2% 46.4% 48.7% 48.5%1987 31.1% 35.3% 37.8% 37.3% 37.1% 36.4% 30.6% 35.1% 38.7% 38.1% 38.0% 37.7%1988 28.3% 30.9% 31.1% 27.8% 27.6% 27.4% 28.3% 30.2% 31.9% 28.2% 27.7% 27.6%1989 28.3% 31.1% 31.2% 27.8% 27.6% 27.3% 28.3% 30.4% 31.7% 28.2% 27.6% 27.5%1990 28.2% 31.0% 31.0% 27.6% 27.6% 27.3% 28.2% 30.4% 31.6% 27.9% 27.6% 27.4%1991 27.9% 30.4% 33.6% 31.2% 30.9% 30.3% 27.8% 29.9% 33.7% 31.5% 31.1% 30.7%1992 27.9% 29.9% 33.1% 30.8% 30.8% 30.3% 27.9% 29.4% 33.2% 31.0% 31.0% 30.6%1993 28.2% 30.7% 37.9% 38.1% 38.5% 37.6% 28.2% 30.0% 38.0% 38.6% 39.6% 39.1%1994 28.2% 30.9% 38.3% 38.6% 38.4% 37.3% 28.2% 30.2% 38.4% 39.1% 39.4% 38.9%1995 28.2% 31.3% 37.8% 37.6% 37.9% 36.5% 28.2% 30.5% 37.9% 38.2% 39.2% 38.7%1996 28.2% 31.3% 36.1% 35.9% 36.6% 34.7% 28.2% 30.4% 36.5% 36.4% 38.1% 37.9%1997 28.2% 31.8% 37.0% 37.4% 37.3% 36.3% 28.2% 30.8% 37.3% 38.3% 38.9% 38.5%1998 28.5% 32.6% 36.6% 37.1% 37.0% 35.8% 28.5% 31.7% 37.3% 38.4% 38.8% 38.7%1999 28.9% 33.1% 36.4% 37.2% 37.1% 35.9% 28.7% 32.2% 37.2% 38.5% 38.8% 38.5%2000 29.8% 33.5% 36.5% 37.3% 37.1% 35.7% 29.6% 32.7% 37.7% 38.8% 38.9% 38.6%2001 29.0% 32.5% 36.5% 37.2% 37.2% 35.9% 28.9% 31.8% 37.1% 38.1% 38.5% 38.2%
Source: Authors’ computation from own tax simulator for years prior to 1960 and from NBER Taxsim9 simulator for years after 1960.
Note: Marginal tax rates (MTR) are federal marginal income tax rates on net earned income for the primary earner.
MTR are computed for a couple filing jointly with two children and earning the average gross income in the income group, as interpolated from SOI tabulations.
All adjustments, deductions, and earned income credits are taken into account and are computed as average adjustments/deductions reported for the income group,
as interpolated from SOI tabulations.

5 Charitable donations and tax relief in
the UK
Kimberley Scharf & Sarah Smith1
5.1 Introduction
It is estimated that more than 50 per cent of UK residents make charitable contributions
each month;2 private donations amount to three quarters of a percentage point of GDP,
putting the UK second only to the US in the international giving league.3
The UK charitable sector has a long history; its current form dates back to the
sixteenth-century when, following the English Reformation, charity, which had previously
been almost exclusively the domain of the Church, became increasingly organised along
secular lines. Growing concern about poverty - and the social unrest it might create -
resulted in the Elizabethan Poor Laws that enabled private charitable activities to evolve
into an independent charitable sector, enjoying privileges and exemptions that were pre-
viously only afforded to the church and to universities. Most sixteenth century private
charities were hospitals (almshouses). These were individually funded by bequests or en-
dowments and were intended solely to provide aid for the aged and impotent, not the
sick. There were also numerous charities established to assist the young - mainly schools
set up for the education of the young and endowed through bequests or gifts (and some-
times through the corporate action of towns). Later, under the influence of the Puritan
movement, there was an increase in religious - oriented charities - bequests were made
to fund religious lectures and the distribution of Bibles - but the majority of charities
1We would like to thank Charities Aid Foundation and Justgiving who allowed us to survey theirdonors. We have received helpful comments and suggestions from Abigail Payne and Camille Landaisand participants at the CEPR conference on altruism. All remaining errors are our own.
2UK Charities Aid Foundation, “World Giving Index 2010” in September 20103UK Charities Aid Foundation, “International comparisons of charitable giving”, November 2006
120

Charitable donations and tax relief in the UK
remained largely secular. Today the UK charitable sector consists of 160,000+ charities4
with a combined income in 2009/10 of £36.7 billion (2.5 per cent of GDP). Of this income,
£14.3 billion comes from individuals (£6.0 bn from unprompted donations, £4.3 bn from
fees for services, £2.2 bn from donations in response to fundraising activities and £1.8 bn
from legacies); £13.9 billion from statutory sources (£10.9 billion in contracts and fees
and £3.0 in grants) and the remainder from investments and from trading. The activities
of the sector remain distinctive, compared to the US - perhaps reflecting its 16th Century
origins. Social services account for nearly one-quarter of total sector spending, followed by
health (11.0 per cent) and culture and recreation (10.5 per cent). Religious organisations
play a relatively small role in the UK charitable sector compared to the US (4.1 per cent
of all spending).
When income tax was introduced in 1799, charitable organisations were specifically
exempted from paying the tax on the grounds that the activities of charitable organisa-
tions generated a ’public benefit’ - i.e. relieved pressure from the public purse. Initially,
there was no direct tax relief for private donations, but tax liability on money transferred
through deed of covenant - a promise to make regular payments to a trust or individual
over some period of time - could be transferred to the holder of the deed and, since char-
ities were tax exempt, this was one way for individuals to avoid paying income tax on
(regular) donations.
Gift Aid which allows individuals to get tax relief on one-off donations to charity, was
introduced in 1990. Its most distinctive feature is the presence of a match-style element,
as well as the more familiar tax rebate element. Charities can claim basic rate income
tax relief (at 20 per cent) on donations, equivalent to a 25 per cent match on gifts out
of net-of-tax income. Higher-rate taxpayers can additionally reclaim a rebate on the dif-
ference between this and their marginal rate. In principle, both match and rebate affect
the “price” of giving and, in a standard model, would be expected to affect giving in the
same way. However, recent experimental evidence has suggested that this is not the case.
Specifically, lab and field experiments summarized in Eckel and Grossman (2003, 2008),
Davis, Millner and Reilly (2005) and Blumenthal, Kalambokidis and Turk (2012) have
shown that offering donors a match has a bigger effect than an equivalent-value rebate on
4See Table 5.1. This is part of a wider third sector, or civil society which is made up of an estimated900, 000 organisations including co-operatives, faith groups, clubs and societies, universities, housingassociations, NHS charities, sports groups, and trades unions.
121

Charitable donations and tax relief in the UK
the total contributions (including the subsidy) received by the charity. These studies also
find that total contributions are more responsive to variation in the match rate than to
variation in the rebate rate. The UK provides an excellent setting to explore this potential
asymmetry in relation to tax incentives. The focus of this paper is a survey-based study
of UK taxpayers that explores responses to (changes in) the match and rebate elements
in Gift Aid. The next section describes tax reliefs on donations in the UK and section 3
sets out a simple framework for understanding the effects of match and rebate incentives
on giving. Section 4 describes the survey and the sample and sections 5 and 6 presents
the main results. Section 7 concludes.
5.2 Tax relief on giving
Table 5.2 summarizes the main forms of tax relief that individual donors can get on char-
itable donations in the UK.
Gift Aid
Gift Aid provides the main scheme through which individual taxpayers get tax relief
on their donations to charity. The scheme was introduced in 1990, but with a minimum
donation amount of £600, which was abolished in 2000. Gift Aid differs in operation to
the US system of deductions and consists of the following two elements: (i) The charity
can claim tax relief on donations made out of net-of-tax income at the basic rate of tax,
currently 20 per cent, which means that for every £1 donated to charity, the charity can
reclaim 25 pence. This effectively works as a match-style incentive and is often marketed
in this way by charities. (ii) In addition, higher-rate taxpayers can reclaim a rebate equal
to the difference between the higher rate of tax (either 40 per cent or 45 per cent) and the
basic rate of tax at 20 per cent on the “gross” equivalent donation, i.e. the amount before
basic rate tax was deducted. This means that for every £1 donated out of net income,
a higher-rate taxpayer paying 40 per cent can get an additional rebate of 25 pence. In
accounting terms, this dual system is fully equivalent to a rebate system; the main reason
why this was adopted had to do with administrative simplicity: basic rate UK taxpayers
are taxed on their income at source (through the “pay as you earn” system) without filing
an income tax return.
122

Charitable donations and tax relief in the UK
Practically, charities claim back the basic rate relief on Gift Aid donations from HM
Revenue and Customs by submitting a form with information on donor names and dona-
tion amounts. This can be done at any time-up to four years after the donation has been
made. Repayment to charities is usually made within four to five weeks. The claim must
be backed by individual Gift Aid declarations in which donors declare that they want the
charity to claim back the tax relief and they have paid sufficient tax. In each case, this
must have the donors’ name and address. In principle the declaration can be made to the
charity in writing or verbally. But, formally, charities are required to keep an audit trail
that links the Gift Aid claim to individual declarations and must be able to demonstrate
that the repayment claim is accurate. HMRC selects a limited number of charities for
audit. In order for higher-rate taxpayers to receive the additional higher rate rebate, they
need to make a claim through a self-assessment tax return (completed by approximately
a third of all UK taxpayers) or ask for a change in their tax code via a simpler tax review
form.
In principle, charities and donors could overclaim. Only a limited number of charities
are audited and the penalty for overclaiming is to pay back the amount over-claimed (plus
interest). Also, to claim the rebate, higher-rate donors must keep records of their dona-
tions but are not required to provide HMRC with supporting evidence with every claim.
However, the evidence suggests that, instead, there is substantial (net) under-claiming.
The scale of this is illustrated in Table 5.3 which compares total gross donations given
through Gift Aid in recent years with estimates of the total amount given by individuals
each year. This suggests that fewer than half of all donations attract tax relief, although
this proportion has been increasing in recent years-from 36 per cent in 2004/05 to 45 per
cent in 2010-11. The degree of under-claiming may be linked to the administrative costs
for charities, particularly the need for a Gift Aid declaration. The growth in online giving
portals, which facilitate this declaration process, may help to explain the relative growth
in Gift Aid donations. There are also administrative costs for higher-rate donors looking
to reclaim a rebate since they need to fill in a self-assessment form or apply for a change
in tax code.
It has been estimated that 35 per cent of higher-rate donors actually reclaim. Informa-
tion collected as part of our Gift Aid survey (described in more detail in the next section)
123

Charitable donations and tax relief in the UK
suggests that lack of awareness is the main factor for why people do not reclaim. More
than half of those who did not reclaim said that they did not know they could, while
a further 32 per cent of non-reclaimers said that they did not know how to claim back.
The “hassle factor” also appears to be important. Nearly one third of those who did not
reclaim cited the time and effort it would take, while a further 19 per cent said that it was
too complicated. One-quarter said that they did not reclaim because they would only get
a small amount of money back.
As expected, the probability of reclaiming is linked to the total amount given through
Gift Aid. This relationship is shown in more detail in Figure 5.1 which shows the pro-
portion of higher-rate taxpayers who said that they reclaim, according to the size of Gift
Aid donations. This face that bigger donors are more likely to reclaim the rebate means
that reclaimers account for an estimated 35 per cent of higher-rate Gift Aid donors, but
for nearly 80 per cent of total Gift Aid donations made by higher-rate donors. People
working part-time, the self-employed and those who are retired or not working are more
likely to reclaim; this may be because they are more likely to complete a self-assessment
form. Regular givers are more likely to reclaim.
Payroll giving
Employees of firms that run payroll giving schemes can give to charity out of their
gross earnings. The main benefit to a donor making charitable donations via a payroll
giving scheme is the immediate tax relief at the time of making the donation. How-
ever, in spite of this administrative simplicity, take-up is low, even among employees of
firms that run such schemes (where it is estimated that fewer than 6 per cent participate).
Gifts of Shares and Property
Individual and corporate donors have been able to obtain income tax relief on gifts
of shares and securities since 6 April 2000. This was extended in 2002 to cover a gift
of land, and also applies to situations where a donor sells shares or property to a UK
charity at less than market value. Relief is based on the market value of the gifted asset,
which, additionally, is exempted from capitals gains taxation. This implies that transfer-
ring the asset to the charity involves a lower price of giving to a donor than selling the
124

Charitable donations and tax relief in the UK
asset and transferring the receipts to the charity-in some instances significantly so. The
tax relief in this case is always administered as a rebate (i.e. outside the Gift Aid scheme).
Inheritance Tax
Inheritance tax was introduced in 1984 replacing Capital Transfer Tax, which having
been introduced in 1975 had imposed a tax charge on the gift of assets during the tax-
payer’s lifetime. The basic principle of inheritance taxation is that a tax charge arises on
the reduction in the value of an individual’s estate as a result of a transfer of an asset
from the estate. There is a specific exemption from inheritance taxation where assets are
given to charities, which applies equally to lifetime gifts and gifts on death. Additionally,
an individual who receives a legacy can pass it on to a charity through a deed of variation
within two years of the date of death of the deceased person; the gift is then treated as if
it had been made by the deceased person (i.e. it is exempted from taxation).
5.3 Framework for considering the effects of match
and rebate
To clarify our discussion of the effects of match and rebate incentives on contributions,
consider the following simple model of charitable giving that has been used to underpin
most empirical estimates of donor responses to changes in tax incentives for giving. We
assume an economy of i ∈ {1, ..., N} identical consumers, each of whom cares about their
consumption of a private good, xi, and their contribution towards the provision of a char-
itable good, gi.
We assume that each consumer’s preferences can be summarized by a well-behaved utility
function, U(xi, gi) and that each consumer has an exogenously given income, Yi which
can be used for consumption of the private good and for making checkbook donations, di,
towards the charitable good, i.e., each consumer’s budget constraint is Yi = xi + di.5
In the absence of any government subsidy, a checkbook donation from individual i
5We also assume that the marginal rate of transformation in production between the private goodand the charitable good is unity and we abstract from the public component of the charitable good byassuming that each consumer derives some private benefit from their contributions in the form of a warmglow (Andreoni, 1990).
125

Charitable donations and tax relief in the UK
translates into gi = di units of the charitable good, at a cost ci = di in terms of foregone
spending on the private good. If there is a match, then the total contribution, received by
the charity from each individual is equal to gi = (1 +m)di, where m is the rate at which
the checkbook donation, di, is matched by the government. In the UK, m = 0.25). If
there is a rebate, the cost to each individual, ci, of making a nominal checkbook contribu-
tion, di, is equal to ci = (1− r)diwhere r is equal to the rebate rate. In the UK, r = 0.25.
The effect of this is to change each consumer’s budget constraint to Yi = xi + (1 − r)di.To use the model to derive predictions on behaviour, substitute xi = Y − (1 − r)di and
gi = (1 +m)di into the utility function. Then, the consumer’s optimization problem is to
choose di so as to maximize U(Yi − (1− r)di, (1 +m)di). The solution yields an optimal
choice of checkbook donation, d∗i = D(p;Y ) that is characterized by equality between the
marginal rate of substitution between the charitable good and the private good and the
price of giving, p = (1− r)/(1 +m).
Comparative static results show that d{(1+m)D∗(d;Y )}dp
< 0, i.e. dg/dp < 0. That is,
the model predicts that an increase (decrease) in the price of giving will induce a de-
crease (increase) in total contributions. This result is independent of the instrument
(match or rebate) that induces the change in price. If there is a switch from a match to
an equivalent-value rebate, for example, then donors would be assumed to reduce their
checkbook donation to preserve their total contribution.
However, recent US experimental studies conducted in the lab and the field have found
that match and rebate subsidies do not affect total contributions in the same way. Eckel
and Grossman (2003) carried out an experiment in the lab to test responses to equivalent-
value match and rebates. Their experiment involved 181 undergraduate students who
were each given twelve allocation problems - how to allocate an initial endowment be-
tween themselves and a charity of their choice when faced with varying amounts of the
endowment and varying match and rebate rates. The first finding from these studies is
that match subsidies result in a higher level of total contributions than equivalent-value
rebates. Total contributions were 1.2-2 times greater with a match than a rebate. The
second finding is that total contributions are more responsive to changes in the match
than they are to changes in the rebate. The elasticity of total contributions with respect
to changes in the price associated with changes in the match rate (which they call the
match elasticity) is -1.14 , while the elasticity with respect to changes in the price asso-
126

Charitable donations and tax relief in the UK
ciated with changes in the rebate rate (which they call the rebate elasticity) is -0.36.6
Eckel and Grossman (2008) also ran an experiment in the field to test how donors
responded to equivalent value match and rebates. On behalf of Minnesota Public Radio
they mailed out 370,000+ donor solicitations, offering differing values of match rate and
rebate on a random basis. The findings mirrored those from the lab. Based on approxi-
mately 7,000 responses, they found that the match rates resulted in a higher level of total
contributions than equivalent-value rebates. The estimated elasticity of total contribu-
tions was -1.05 in the case of the match rate and -0.11 in the case of the rebate rate.
Experimental studies with similar findings on the asymmetry of the effect of match
and rebate incentives have also been conducted by Davis, Millner and Reilly (2005), Davis
and Millner (2005), David (2006), Lukas, Grossman and Eckel (2011) and Blumenthal,
Kalambokidis and Turk (2012).
There is also a related experimental literature which has explored how donors respond
to match incentives funded by a significant lead donor (Karlan and List, 2007, Huck and
Rasul, 2012). For example, Huck and Rasul, 2012, test the effect of offering donors a 0.5
match and a 1.0 match which are financed by a lead donor who allocates a fixed sum of
money. They compare this to the effect of a lead donation of the same amount with no
match and also to the effect of a simple request to give. They argue that this allows them
separately to identify the effect of a lead donation from the “pure” price effect of varying
the match, although this assumes that the effect of an unconditional lead donation is the
same as using the lead donation to match and also that the effects of a lead donation and
of price variation are additive.
The presence of a lead donation has a strong, positive effect on how much individuals
donate (defined by checkbook donations and total contributions) compared to a simple
request to give. A 0.5 match increases checkbook donations significantly compared to a
simple request to give, but a 1.0 match does not. Under a 0.5 match, checkbook donations
are not significantly different to an unconditional lead donation; under a 1.0 match, how-
ever, checkbook donations are significantly lower than an unconditional lead donation.
Huck and Rasul (2012) interpret these findings as showing that lead donations signifi-
6They do not report that corresponding elasticities for checkbook donations, but these would be −0.14in the case of the match and −0.36 in the case of the rebate.
127

Charitable donations and tax relief in the UK
cantly increase donation given, but that reducing the price of giving results in partial
crowd out. These findings contrast with those from the match/rebate studies, since the
latter typically find elasticities with respect to total contributions that are greater than
1.0 in absolute value, implying crowd in of checkbook donations. The fact that Huck and
Rasul (2012) combine the announcement of a lead donor with changes in the price may
make their study hard to compare directly. A number of possible explanations have been
given in the literature as to why match and rebate may have a different effect on total
contributions (see Lukas, Grossman and Eckel, 2010, for a discussion). One possibility
is that consumers do not understand the implications of changes in the match and re-
bate rates for the price of giving. The fact, for example, that a match rate is higher in
percentage terms than the equivalent value rebate may cause particular confusion (since
m = r/(1 − r)). However, Davis and Millner (2005) show that the difference in respon-
siveness persists when donors are given information on the relationship between their
checkbook donation, the total contribution to the charity and the net cost, suggesting
that the difference cannot simply be attributed to confusion among donors.
Eckel and Grossman (2003, 2008) attribute the difference to preferences. Following
Benabou and Tirole (2006) they argue that the match induces greater giving because it
is associated with a cooperation frame, which makes donors feel more generous, while the
rebate is associated with a reward frame.
In this paper, we provide an alternative explanation that is more closely related to
Davis (2006) who argue that the difference arises because, faced with a complex set of in-
centives, donors ignore both match and rebate and focus only on the checkbook donation.
They refer to this as the ‘isolation’ effect. In this case, the differential effect of match
and rebate on total contributions arises purely as a mechanical consequence of ignoring
(changes in) subsidies. Offering a match has a direct effect on g, while offering a rebate
only affects the cost to the donor. Consistent with this, in our survey we find a high
level of non-adjustment to changes in match and rebate subsidies. However, we show that
there are important differences in the likelihood of adjusting depending on the level of
giving and also on the type of incentive. We therefore argue that, rather than simply
ignoring the match/rebate and focusing on the checkbook donation, donors do care about
their total contribution but because of processing and adjustment costs may rationally
choose to - or not to - process match and rebate in different situations, which is what is
128
Charitable donations and tax relief in the UK
observed in practice. This kind of rational inattention has been discussed in relation to
the salience of taxes that modify consumer prices (Chetty, Looney and Kroft, 2009) but
the application to the effect of different forms of tax incentive that generate equivalent
changes in the price (such as in our example of charitable giving) - and the implications
for the design of effective tax subsidies - have not previously been explored.
Of course, there are a number of other stories about why people give that might ex-
plain a focus on checkbook donations. For example, donors might derive utility not from
their total contribution but from the amount they give out of their net of tax income
(their checkbook donation because it provides a more visible signal (see Glazer and Kon-
rad, 1996, and Harbaugh, 1998). However, in this case (as discussed in Turk et al, 2007),
checkbook donations should be much more responsive to changes in the rebate (which
affect the price of checkbook donations) than to changes in the match (which do not) and
this is not observed in practice in most studies. Our survey also provides some additional
evidence relevant to this issue-when asked about what they thought about when making
their decision about how much to give, 69 per cent of donors said that they thought
about how much the charity claimed (on its own or together with how much they gave)
compared to 13 per cent who cared only about how much they gave and how much they
could reclaim (the remaining 18 per cent reported don’t know). This suggests that an
assumption that donors care about total contributions is appropriate for most givers.
5.4 Survey evidence on match and rebate
We used a survey-based approach to explore how UK donors would respond to changes in
the match and rebate elements of Gift Aid. Invitations to take part in an on-line survey
were e-mailed to 40,000 UK-based donors, split equally between those who had donated
online through Justgiving (an online giving portal) during the previous six months and
those with a Charities Aid Foundation (CAF) charity account. 3,445 respondents were
presented with a number of hypothetical scenarios involving changes to Gift Aid and
asked to say how they would respond. The aim of the research was to explore a set of
possible reforms to the existing system of Gift Aid that reduced the rebate element and
increased the match element. The hypothetical scenarios were designed to reflect this and
only higher-rate taxpayers faced options that changed both match and rebate elements
129

Charitable donations and tax relief in the UK
(Gift Aid does not have a rebate element for basic-rate taxpayers). Our analysis therefore
focuses on responses from just over 1,400 higher-rate donors.
Before describing the research design in more detail, we address two potential concerns
with our approach-first, that we do not sample from the general population of (Gift Aid)
donors and second, that we use a stated choice approach.
Our data are drawn from a convenience sample comprising two groups. The first
group is donors who have given through Justgiving, an online fundraising portal used
primarily by individual fundraisers to collect sponsorship donations. The total popula-
tion of Justgiving donors is around 20 million. The mean reported giving in the last 12
months among the sample respondents in this group who were higher-rate taxpayers is
£2,377. The second group is people with a CAF charity account - an account that can
be used to make donations and that facilitates tax-efficient giving. The total popula-
tion of CAF account holders is around 60,000. The sample respondents from this group
who were higher-rate taxpayers had mean reported giving of £4,846 in the last 12 months.
There is no reliable population information on Gift Aid donors that could act as a true
benchmark for our sample. Even tax authority data is not fully comprehensive since many
Gift Aid donors-including higher-rate donors-do not reclaim a rebate and do not there-
fore declare their giving. The best information is the Individual Giving Survey (IGS), a
population-based survey that collects information on giving. Among the sample of higher-
rate tax Gift Aid users in the IGS, the mean level of giving over the last 12 months was
£1,411, lower than the mean of £3,332 in our combined Justgiving/CAF sample.
One issue is that we almost certainly over-sampled higher-rate taxpayers who reclaim
the rebate - 56 per cent of our sample compared to an estimated 35 per cent in the pop-
ulation. Re-weighting reduces the mean level of giving in our sample to £2,442 which is
closer to the IGS figure, but still higher.
However, the IGS fails to capture major donors and is almost certainly likely to under-
represent the level of giving - the largest donation was £46,000 in the last year in the IGS,
compared to more than 100 donors who reported giving in excess of £100,000 in our sam-
ple. When we exclude donations of £50,000 or more and re-weight for our over-sampling
130
Charitable donations and tax relief in the UK
of reclaimers, the mean level of giving in the Justgiving/CAF sample falls to £1,796,
which is much closer to the IGS figure.
We are therefore confident that our sample is broadly representative of the relevant
population of higher-rate Gift Aid donors, once we take into account the higher propor-
tion of reclaimers and the presence of major donors in our sample. In our analysis, we
look separately at reclaimers and non-reclaimers and we also look at responses to match
and rebate among different quartiles of the donor population.
The second potential issue is our use of a stated choice approach, which is not common
in policy evaluation (although Krueger and Kuziemko, 2011 provide a recent example).
Ideally, we would like to look at responses to real tax changes-through either a field or
natural experiment. However, field experiments involving tax rates are not feasible; nor is
there any data on actual reforms that have taken that is available and detailed enough. In
the absence of evidence on actual tax policy changes, our survey approach complements
existing experimental results but offers some potential advantages over alternatives in the
lab or single-charity field studies. As discussed above, we were able to survey the rele-
vant population, resulting in a reasonably representative sample of higher-rate Gift Aid
donors; and we were able to test donor responses to the relevant instrument, i.e. tax incen-
tives. Our survey approach allowed us to collect information on a large sample of donors
and test for differential responses across donor groups, allowing us to explore alternative
explanations for why total contributions respond differently to match and rebate subsidies.
We incorporated a number of elements into our survey design to make the findings
more credible. We made the scenarios more realistic by asking respondents to consider
how the alternative tax treatments would affect a specific donation that they had previ-
ously in the survey said that they were likely to make in the next six months rather than
asking generally how they would respond to a change in tax incentives. We also use only
within-person variation to identify the effects of match and rebate. In a recent paper,
Johanssen-Stenman and Svedsatter (2008) show in relation to contingent valuation stud-
ies7 that this is more robust than cross-person identification, arguing that people strive for
7Our study differs from a classic WTP study where, according to Harrison and Rustrom (2008) “asa matter of logic, if you do not have to pay for the good but a higher verbal willingness to pay (WTP)response increases the chance of its provision, then verbalize away to increase your expected utility!”In our case, it is not clear ex ante whether donors would over-state since they are directly informed inthe survey about tax changes and incur no real adjustment costs, or under-state since a no adjustment
131

Charitable donations and tax relief in the UK
consistency in their statements. As a measure of the reliability of our survey responses, we
can show that there is close agreement between how much CAF respondents in our sample
reported they gave through Gift Aid during the last year (mean = £2,435) and how much
was actually given by (the population of) CAF donors through CAF charity accounts
during that year (mean = £2,436). We also show that the ordering of the options does
not affect the responses, ruling out the so-called embedding effects (i.e the idea that the
ordering of the scenarios may affect responses) discussed in Diamond and Hausman (1994).
The design of our scenarios was as follows. Respondents were first asked whether they
were likely to make a Gift Aid donation in the next six months. Higher-rate taxpayers
were then randomly allocated to five different treatment sets, each consisting of two hy-
pothetical scenarios reflecting different combinations of match and rebate (summarized
in the first column of Table 5.4). In each case, respondents were asked to say how much
they would give if faced with the alternative system of tax relief (see Appendix A1 for
further details on how the scenarios appeared in the survey).
The design and description of the scenarios in the survey reflect the way Gift Aid is
portrayed to donors-i.e. the charity receives X pence for every £1 given out of net-of-
tax income and the individual can reclaim X pence for every £1 given out of net-of-tax
income. For higher-rate taxpayers, two of the treatment sets (A, B) tested how people
would respond to changes in either the match or the rebate (but not both).
In Set A, individuals were faced with the following two scenarios:
A1: A match of 30 pence and a rebate of 25 pence (price of giving = .577);
A2: A match of 25 pence and a rebate of 30 pence (price of giving = .560).
While in set B, individuals were faced with the following two scenarios:
B1: A match of 20 pence and a rebate of 25 pence (price of giving = .625);
B2: A match of 25 pence and a rebate of 20 pence (price of giving = .640).
Note that the changes in match and rebate were symmetric in terms of pence change
for each £1 donated but not in terms of price changes. The price changes are larger for
the changes in rebate. Eckel and Grossman (2003, 2008) defined match and rebate pairs
that were equivalent in value but had different rates - for example, a 25% match and a
response is the easiest answer to give.
132
Charitable donations and tax relief in the UK
20% rebate. However, experimental evidence shows that individuals respond differently
to alternatives that produce exactly the same outcome but that are presented to them
through what Kahneman and Tversky (1979) refer to as different “frames of reference”
which may imply that donors respond more to what they perceive is a “larger” match.
In our case, if the match and rebate elasticities are the same, there should be a larger
percentage change in total contributions to the rebate change. If we find that total
contributions respond less to the rebate change this is a strong indication that total
contributions are less responsive to changes in the rebate than to changes in the match.
The other treatment sets for higher-rate taxpayers (C, D and E) were designed to explore
responses to specific policy options that involved increasing the generosity of the match
rate, while abolishing the rebate rate. Scenario E1 changed the form of the tax subsidy
but not the price. The other scenarios involved increases in the price of giving compared
to the current system. The same scenarios were included twice (C1 & E2 and C2 & D1) to
test for embedding effects. Specifically, in Set C, individuals were faced with the following
two scenarios:
C1: A match of 50 pence and no rebate (price of giving = .667);
C2: A match of 30 pence and no rebate (price of giving = .769).
In set D, individuals were faced with the following two scenarios:
D1: A match of 30 pence and no rebate (price of giving = .769);
D2: A match of 37 pence and no rebate (price of giving = .730).
While in set E, individuals were faced with the following two scenarios:
E1: A match of 66 pence and no rebate (price of giving = .600);
E2: A match of 50 pence and no rebate (price of giving = .667).
5.5 Results
To explore the effect of the different treatments on contributions, we estimate the following
reduced form model:
log gin = β0 +S∑s=1
βsTsi + νin (5.1)
where gin is the n-th contribution of individual i. For each donor, we observe up to three
contributions - their initial total contribution, gi0, and their contributions under the two
different scenarios they face in their randomly allocated treatment set, i.e.n = 0, 1, 2.
133

Charitable donations and tax relief in the UK
We choose to focus on the total contribution - the checkbook donation plus any match
- for a number of reasons. The total contribution is relevant for the public policy debate;
it is what previous analyses have typically focused on and, as discussed in section 5.3, it
is also what donors are assumed to care about. Although donors directly choose the level
of their checkbook donation, they are assumed to adjust their checkbook donation to take
account of the match or rebate to achieve the desired total contribution. However, we
also report results for checkbook donations, d.
We include a set of binary indicators for each of the hypothetical scenarios (T1i = 1 if
m = .30 and r = .25 and T1i = 0 otherwise; T2i = 1 if m = .25 and r = .30 and T2i = 0
otherwise; and so on). In total there were ten scenarios, but two of these simply involved
varying the ordering of the scenarios in order to test for so-called embedding effects. Since
the ordering made no significant difference to responses, our results focus on the eight
distinct scenarios (S = 8). The error term is decomposed into a constant, individual-
specific effect and a donation-specific random error term that could capture eg rounding
or reporting error for each individual for each scenario they face, i.e. νin = αi + uin. The
results from estimating equation 5.1 using a random effects model are reported in Table
5.4.8
In line with earlier studies, we find that total contributions are more responsive to
changes in the match than to changes in the rebate. Scenario A1 (M = .30; R = .25)
is associated with a bigger increase in total contributions than scenario A2 (M = 0.25;
R = .30), although the price reduction is smaller. Similarly, scenario B1 (M = .20; R =
.25) is associated with a bigger fall in total contributions than scenario B2 (M = .25; R
= .20), although the price increase is smaller. The coefficients associated with scenarios
C1-E2 show that policy options that withdraw the rebate and increase the match result
in an overall increase in total contributions, even where the price of giving has increased
relative to the current system. The final column of Table 5.4 summarizes the proportion
of donors who, for each scenario, report that they would leave their checkbook donation
(i.e. how much they give out of net-of-tax income) unchanged. Levels of non-adjustment
are very high - the majority of donors for each scenario. As already discussed, and as we
explore further in the next section, this non-adjustment is a key factor in understanding
8This is efficient and unbiased if the rebate and match terms are unrelated to individuals’ character-istics. Since the rebate and match terms are randomly allocated to individuals this should be true byassumption. Very similar results were obtained from a fixed effects model.
134
Charitable donations and tax relief in the UK
why total contributions respond more to changes in the match than to changes in the
rebate. A potential concern is that this high level of non-adjustment may be an artefact
of the hypothetical nature of the survey; there is no benefit to respondents if they respond
truthfully and reporting an alternative donation amount may have a small effort/ com-
putational cost. However, as evidence against this, the proportion adjusting does vary
across the scenarios - the proportion adjusting to changes in the rebate is typically greater
than the proportion adjusting to changes in the match and more people adjust to a larger
change in the match rate. In many cases, these differences in the level of non-adjustment
across scenarios arise because the same individual reports that they will adjust in the
case of one of the scenarios and not the other, consistent with respondents taking these
scenarios seriously. We therefore have reason to believe this finding on non-adjustment
is valid. The differences in levels of non-adjustment across scenarios also suggests that
there is more going on than Davis (2006) isolation effect in which donors simply ignore
(changes in) match and rebate rates altogether.
5.6 Heterogeneity of responses across donors
In order to facilitate direct comparisons with earlier studies and to allow convenient
analysis for sub-groups of donors, we estimate separate price elasticities for price changes
associated with changes in the match rate and changes in the rebate rate (referred to
by Eckel and Grossman as match and rebate elasticities). We focus on scenarios A1−B2
which change either the match or the rebate. We estimate regressions of the following
form:
log gin = β0 + βr log(1− rs) + βm log(1 +ms) + νin (5.2)
As before, we focus on total contributions. The terms βr and βm capture the elasticity
of total contributions with respect to changes in the price through the rebate and match
respectively. The basic results are reported in Table 5, panel a. The magnitudes of the
estimated elasticities, -1.12 in the case of the match and -0.22 in the case of the rebate,
are very similar to those from Eckel and Grossman’s experimental studies, -1.14–1.05 for
the match and -.36–.11 for the rebate. Our results provide evidence that the asymmetry
of responses holds with respect to match and rebate subsidies in the tax system. In addi-
tion, we can exploit additional information on the donors collected as part of the survey
135
Charitable donations and tax relief in the UK
to explore potential explanations for why the responses are different.
Reclaimers versus non-reclaimers
One possible explanation for why total contributions are more responsive to the match
than to the rebate may be because of the additional processing cost for the donor associ-
ated with reclaiming the rebate. We explore this by comparing responses among reclaimers
and non-reclaimers. We find that the presence of many non-reclaimers cannot account for
the higher match elasticity. As shown in Table 5.5, the estimated rebate elasticity among
reclaimers is higher than among non-reclaimers, as would be expected (-.415 compared to
.032). However, among reclaimers, the estimated match elasticity is -1.277, significantly
higher than the rebate elasticity.9
Level of understanding
Here, we analyse the responses separately for donors according to their likely level
of understanding of tax incentives. This is assessed on the basis of their response to a
question about how much the match is worth to charities. Respondents are told that the
charity can reclaim basic-rate tax and asked to say how much the charity gets for each
£1 donated out of net-of-tax income (choosing one out of a set of possible responses). If
they respond correctly, we define them as having a good level of understanding. If they
do not choose the correct answer, we define them as having a poor level of understanding.
We find some difference between those with “good” and “poor” understanding” - those
with a good understanding are more responsive to changes in both match and rebate.
Nevertheless, we find that the match elasticity is significantly higher than the rebate elas-
ticity for both groups. This confirms the earlier findings from Davis and Reiley (2005) that
misunderstanding of the subsidies does not appear to be a plausible candidate explanation.
Size of contributions
Table 5.5 also shows elasticity estimates by quartile of contributions. We find that to-
tal contributions from larger donors are more sensitive to changes in the rebate than total
contributions from smaller donors (and we discuss this further below) but the significant
9We did not directly ask whether changes in the rebate affected the decision to reclaim; we thereforesplit the sample by whether people currently reclaim or not.
136

Charitable donations and tax relief in the UK
difference in responsiveness of total contributions to match and rebate persists among all
groups.
Adjusters/non-adjusters
Non-adjustment of checkbook donations to changes in the match/rebate is potentially
important for understanding why total contributions are more responsive to the match
than to the rebate. This is because of the way that non-adjustment differentially impacts
on total contributions in the two cases. If donors do not adjust their checkbook donation
when the match changes, their total contributions automatically adjust (i.e. the elasticity
of contributions is one in absolute value). If consumers do not adjust to a change in the
rebate, on the other hand, there is no effect on their total contribution (i.e. the elasticity
is equal to zero), rather the net cost to the donor adjusts. Non-adjustment can therefore
generate higher contribution elasticities for the match than for the rebate.
Table 5.5 shows estimates of match and rebate elasticities separately for adjusters (i.e.
donors who adjust to at least one of the two scenarios). For this group, total contributions
are much more responsive to changes in the rebate compared to the rest of the sample.
While the match elasticity is still higher than the rebate elasticity, the difference is no
longer statistically significant. This suggests that non-adjustment is a big part of the
explanation for why total contributions respond more to changes in the match than to
changes in the rebate.
Davis (2006) provides an explanation that donors ignore match and rebate changes
altogether and focus only on checkbook donations because the incentives are too complex.
However, this does not explain why some donors do adjust. We propose a slightly differ-
ent interpretation as follows (see Scharf and Smith, 2011 for more detail). Suppose that
donors do not simply ignore match and rebate changes but instead do care about their
total contribution but (rationally) choose to respond to match and rebate changes and
adjust their checkbook donations only when the benefits from doing so are greater than
the costs. There may be some small effort costs involved in processing changes in tax re-
lief and in adjusting checkbook donations. The cost of not adjusting is that donors’ total
contributions are further away from the optimal level. Chetty, Looney and Kroft (2009)
have shown that even small processing or adjustment costs can result in non-adjustment
137
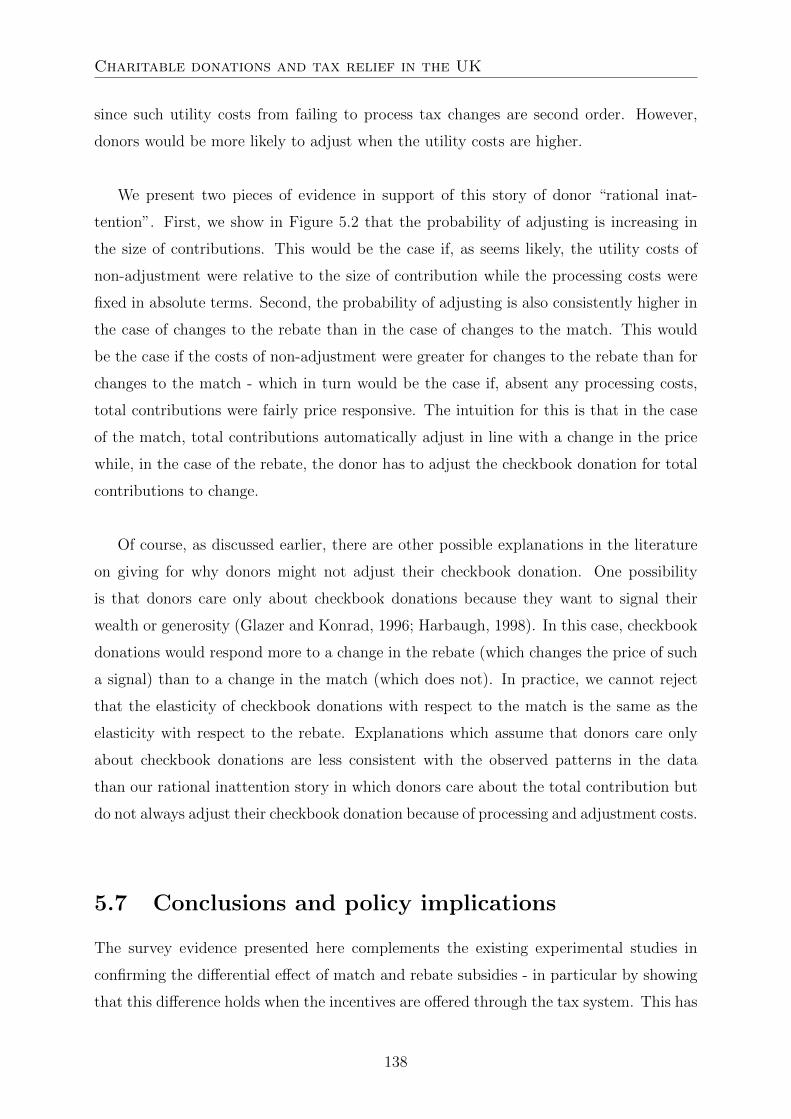
Charitable donations and tax relief in the UK
since such utility costs from failing to process tax changes are second order. However,
donors would be more likely to adjust when the utility costs are higher.
We present two pieces of evidence in support of this story of donor “rational inat-
tention”. First, we show in Figure 5.2 that the probability of adjusting is increasing in
the size of contributions. This would be the case if, as seems likely, the utility costs of
non-adjustment were relative to the size of contribution while the processing costs were
fixed in absolute terms. Second, the probability of adjusting is also consistently higher in
the case of changes to the rebate than in the case of changes to the match. This would
be the case if the costs of non-adjustment were greater for changes to the rebate than for
changes to the match - which in turn would be the case if, absent any processing costs,
total contributions were fairly price responsive. The intuition for this is that in the case
of the match, total contributions automatically adjust in line with a change in the price
while, in the case of the rebate, the donor has to adjust the checkbook donation for total
contributions to change.
Of course, as discussed earlier, there are other possible explanations in the literature
on giving for why donors might not adjust their checkbook donation. One possibility
is that donors care only about checkbook donations because they want to signal their
wealth or generosity (Glazer and Konrad, 1996; Harbaugh, 1998). In this case, checkbook
donations would respond more to a change in the rebate (which changes the price of such
a signal) than to a change in the match (which does not). In practice, we cannot reject
that the elasticity of checkbook donations with respect to the match is the same as the
elasticity with respect to the rebate. Explanations which assume that donors care only
about checkbook donations are less consistent with the observed patterns in the data
than our rational inattention story in which donors care about the total contribution but
do not always adjust their checkbook donation because of processing and adjustment costs.
5.7 Conclusions and policy implications
The survey evidence presented here complements the existing experimental studies in
confirming the differential effect of match and rebate subsidies - in particular by showing
that this difference holds when the incentives are offered through the tax system. This has
138

Charitable donations and tax relief in the UK
clear policy implications. The asymmetry of responses strongly suggests that match-style
tax incentives are likely to be more effective than rebate-style incentives if the objective
is to increase total contributions.
However, replacing the current match and rebate elements of Gift Aid with a higher
match rate could come at a higher cost for the government not only because a higher
match would more generous than the current system for non reclaimers but also because
reclaimers do not reduce their checkbook donations. A key question for policy-makers is
whether it is possible to introduce a revenue-neutral policy change that will lead to an
increase the amount of money going to charities.
To provide some further insight into this, Figure 5.3 shows indicative estimates of the
likely overall effect on total contributions and the estimated percentage change in the
cost of tax relief for each of the four scenarios that involved withdrawing the rebate and
increasing the value of the match for higher-rate donors - £0.30, £0.37, £0.50 and £0.66 -
together with smoothed, linear predictions through these point estimates. These take into
account adjustments by reclaimers and non-reclaimers from the survey and the relative
proportions of the two groups in the population of Gift Aid donors.
The results give an indication that it would be possible to increase gross donations,
without increasing the cost of tax relief compared to the current system - by withdrawing
the rebate and replacing it with a match in the range £0.42 to £0.47, depending on the
proportion of higher-rate reclaimers. Alternatively, there is a possible policy change that
maintains the current level of gross donations but with a cost saving (a match of £0.35).
The form of tax incentive - and the differential responses to match and rebate - therefore
should be taken into account in the design of public policy.
“Rational inattention” - the idea that small processing and adjustment costs may stop
donors from adjusting their checkbook donations - also has a number of other implications
for policy. The evidence shows that contributions from larger donors are more sensitive to
changes in tax incentives than contributions from smaller donors hence targeting incen-
tives on this group is likely to be more cost-effective. Bigger changes in tax rates are also
likely to have relatively more impact. Relevant to this, the UK government announced
a £50,000 cap on tax relief for donations in the most recent UK Budget in March 2012.
139

Charitable donations and tax relief in the UK
This would withdraw tax relief for donations in excess of £200,000 a year, which would
be precisely the group that would be likely to be more responsive to tax incentives (in our
survey the rebate elasticity among donors giving more than £100,000 a year was more than
one in absolute value). Two months later, after a fierce debate, the proposal was dropped.
References
Andreoni, J., 1990. “Impure Altruism and Donations to Public Goods: A Theory of
Warm-Glow Giving,” The Economic Journal, 100: 464-477.
Blumenthal, M., Kalambokidis, L. and Turk, A. (2012). “Subsidizing Charitable Contri-
butions with a Match Instead of a Deduction: What Happens to Donations and Compli-
ance?” National Tax Journal 65: 91-116.
Chetty, R., A. Looney and K. Kroft. 2009. “Salience and Taxation: Theory and Evi-
dence,” American Economic Review 99: 1145-1177.
Congdon, W., Kling, J. And Mullainathan, S. 2009. “Behavioral Economics and Tax
Policy,” National Tax Journal 62: 375-386.
Diamond, P., and J. Hausman. 1994. “Contingent Valuation: Is Some Number Better
Than No Number?” Journal of Economic Perspectives 8: 45-64.
Davis, D. and E. Millner. 2005. “Rebates and Matches and Consumer Behaviour,” South-
ern Economic Journal 72: 410-421.
Davis, D., Millner., E. and R. Reiley. 2005.”Subsidy Schemes and Charitable Contribu-
tions: A Closer Look”, Experimental Economics 8:85-106 (2005)
Davis. D. 2006. “Rebate Subsidies, Matching Subsidies and Isolation Effects,” Judgment
and Decision-Making 1, 13-22 (2006)
Eckel, C., and P. Grossman. 2003. “Rebate Versus Matching? Does how we Subsidize
Charitable Contributions Matter?” Journal of Public Economics 87: 681–701.
Eckel, C., and P. Grossman. 2008. “Subsidizing Charitable Contributions: A Natural
Field Experiment Comparing Matching and Rebate Subsidies,”’ Experimental Economics
11: 234-252.
Finkelstein, A. 2009. “EZ-Tax: Tax Salience and Tax Rates,” Quarterly Journal of Eco-
nomics 124: 969-1010.
Glazer, Amihai and Kai Konrad (1996). “A Signaling Explanation for Charity,” Ameri-
can Economic Review 86: 1019 - 28.
Harbaugh, William (1998). “The Prestige Motive for Making Charitable Transfers,”
140

Charitable donations and tax relief in the UK
American Economic Review, Papers and Proceedings 88: 277 - 82.
Harrison, G., and E. Rutsrom. 2006. “Hypothetical Bias Over Uncertain Outcomes,” in
List, J. (ed.) Using Experimental Methods in Environmental and Resource Economics,
Elgar: Northampton, MA.
Huck, S. and Rasul, I. 2012. “Matched Fundraising: Evidence from a Natural Field Ex-
periment,” Journal of Public Economics 95: 351-362.
Johansson-Stenman, O and Svedsater, H, 2008. “Measuring Hypothetical Bias in Choice
Experiments: The Importance of Cognitive Consistency,” The B.E. Journal of Economic
Analysis & Policy 8, Article 41.
Karlan, D. And List, J. 2007. “Does price matter in charitable giving? Evidence from a
large-scale natural field experiment,” American Economic Review 97: 1774-1793.
Krueger, A. and Kuziemko, I. 2011. “The Demand for Health Insurance Among Unin-
sured Americans: Results of a Survey Experiment and Implications for Policy” NBER
working paper 16978.
Lukas, I., Grossman, P. And Eckel, C. 2010. “Preference or Confusion: Understanding
the Differential Impact of Rebate and Matching Subsidies,” Working Paper. Indiana Uni-
versity, Indianapolis, IN.
Scharf, K. and Smith, S. (2011) ”Rational inattention to subsidies for charitable contri-
butions” CEPR discussion paper 7760
141
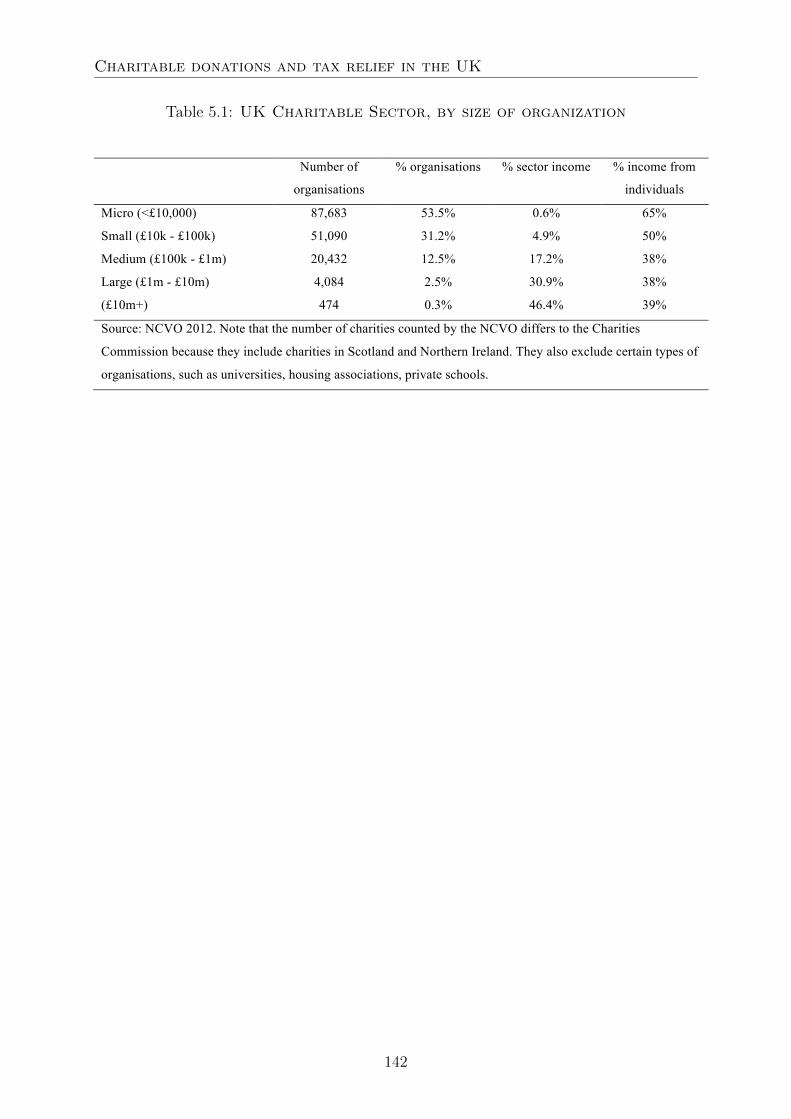
Charitable donations and tax relief in the UK
Table 5.1: UK Charitable Sector, by size of organization
Table 1: UK charitable sector, by size of organisation
Number of
organisations
% organisations % sector income % income from
individuals
Micro (<£10,000) 87,683 53.5% 0.6% 65%
Small (£10k - £100k) 51,090 31.2% 4.9% 50%
Medium (£100k - £1m) 20,432 12.5% 17.2% 38%
Large (£1m - £10m) 4,084 2.5% 30.9% 38%
(£10m+) 474 0.3% 46.4% 39%
Source: NCVO 2012. Note that the number of charities counted by the NCVO differs to the Charities
Commission because they include charities in Scotland and Northern Ireland. They also exclude certain types of
organisations, such as universities, housing associations, private schools.
Table 2: Tax relief on charitable donations in the UK (2010-11) Gross donations Cost of tax relief
Gift Aid £4,914 million £1,435 million Payroll Giving £114 million £30 million Tax relief on shares or property £266 million £60 million Legacies £1,932 million £460 million Notes to table: The cost of Gift Aid tax relief comprises Gift Aid repayments to charities, including transitional relief payments, and the estimated cost of higher-rate relief.
Source: HM Revenue and Customs
Table 3: Estimated proportion of donations attracting tax relief through Gift Aid
Gross donations through Gift Aid
Estimated total individual donations
Proportion given through Gift Aid
2004-05 £2,842 million £7,800 million 0.364 2005-06 £3,410 million £9,400 million 0.363 2006-07 £3,771 million £9,300 million 0.405 2007-08 £4,081 million £10,600 million 0.385 2008-09 £4,299 million £9,800 million 0.439 2009-10 £4,576 million £10,600 million 0.432 2010-11 £4,914 million £11,000 million 0.447
Notes to table: Estimates of total donations from NCVO
142

Charitable donations and tax relief in the UK
Table 5.2: Tax relief on charitable donations in the UK (2010-11)
Table 1: UK charitable sector, by size of organisation
Number of
organisations
% organisations % sector income % income from
individuals
Micro (<£10,000) 87,683 53.5% 0.6% 65%
Small (£10k - £100k) 51,090 31.2% 4.9% 50%
Medium (£100k - £1m) 20,432 12.5% 17.2% 38%
Large (£1m - £10m) 4,084 2.5% 30.9% 38%
(£10m+) 474 0.3% 46.4% 39%
Source: NCVO 2012. Note that the number of charities counted by the NCVO differs to the Charities
Commission because they include charities in Scotland and Northern Ireland. They also exclude certain types of
organisations, such as universities, housing associations, private schools.
Table 2: Tax relief on charitable donations in the UK (2010-11) Gross donations Cost of tax relief
Gift Aid £4,914 million £1,435 million Payroll Giving £114 million £30 million Tax relief on shares or property £266 million £60 million Legacies £1,932 million £460 million Notes to table: The cost of Gift Aid tax relief comprises Gift Aid repayments to charities, including transitional relief payments, and the estimated cost of higher-rate relief.
Source: HM Revenue and Customs
Table 3: Estimated proportion of donations attracting tax relief through Gift Aid
Gross donations through Gift Aid
Estimated total individual donations
Proportion given through Gift Aid
2004-05 £2,842 million £7,800 million 0.364 2005-06 £3,410 million £9,400 million 0.363 2006-07 £3,771 million £9,300 million 0.405 2007-08 £4,081 million £10,600 million 0.385 2008-09 £4,299 million £9,800 million 0.439 2009-10 £4,576 million £10,600 million 0.432 2010-11 £4,914 million £11,000 million 0.447
Notes to table: Estimates of total donations from NCVO
143

Charitable donations and tax relief in the UK
Table 5.3: Estimated proportion of donations attracting tax reliefthrough Gift Aid
Table 1: UK charitable sector, by size of organisation
Number of
organisations
% organisations % sector income % income from
individuals
Micro (<£10,000) 87,683 53.5% 0.6% 65%
Small (£10k - £100k) 51,090 31.2% 4.9% 50%
Medium (£100k - £1m) 20,432 12.5% 17.2% 38%
Large (£1m - £10m) 4,084 2.5% 30.9% 38%
(£10m+) 474 0.3% 46.4% 39%
Source: NCVO 2012. Note that the number of charities counted by the NCVO differs to the Charities
Commission because they include charities in Scotland and Northern Ireland. They also exclude certain types of
organisations, such as universities, housing associations, private schools.
Table 2: Tax relief on charitable donations in the UK (2010-11) Gross donations Cost of tax relief
Gift Aid £4,914 million £1,435 million Payroll Giving £114 million £30 million Tax relief on shares or property £266 million £60 million Legacies £1,932 million £460 million Notes to table: The cost of Gift Aid tax relief comprises Gift Aid repayments to charities, including transitional relief payments, and the estimated cost of higher-rate relief.
Source: HM Revenue and Customs
Table 3: Estimated proportion of donations attracting tax relief through Gift Aid
Gross donations through Gift Aid
Estimated total individual donations
Proportion given through Gift Aid
2004-05 £2,842 million £7,800 million 0.364 2005-06 £3,410 million £9,400 million 0.363 2006-07 £3,771 million £9,300 million 0.405 2007-08 £4,081 million £10,600 million 0.385 2008-09 £4,299 million £9,800 million 0.439 2009-10 £4,576 million £10,600 million 0.432 2010-11 £4,914 million £11,000 million 0.447
Notes to table: Estimates of total donations from NCVO
144

Charitabledonationsand
taxreliefin
theUK
Table 5.4: The effect of alternative tax treatmentsTable 4: The effect of alternative tax treatments
Regression results: Dependent variable =
total contribution (ln gi)
Regression results: Dependent variable =
checkbook donation (ln di)
Proportion adjusting
checkbook donation (di)
Treatment Price N Coeff SE Coeff SE Baseline M = £0.25; R =£ 0.25 0.600
A1 M = £0.30; R =£ 0.25 0.577 283 0.054 ** (0.005) 0.014 ** (0.005) 0.102
A2 M = £0.25; R = £0.30 0.560 283 0.033 ** (0.005) 0.033 ** (0.005) 0.244
B1 M = £0.20; R = £0.25 0.625 289 -0.040 ** (0.005) 0.001 (0.005) 0.069
B2 M = £0.25; R = £0.20 0.640 289 -0.006 (0.005) -0.006 (0.005) 0.138
E1 M = £0.66; R = 0 0.600 267 0.276 ** (0.004) -0.011 ** (0.004) 0.206
C1, E2 M = £0.50; R = 0 0.667 545 0.173 ** (0.003) -0.009 ** (0.003) 0.196
D2 M = £0.37; R = 0 0.730 281 0.068 ** (0.004) -0.024 ** (0.004) 0.228
C2, D1 M = £0.30; R = 0 0.769 559 0.009 ** (0.003) -0.030 ** (0.003) 0.170
Note%to%table:%The%total%contribution%refers%to%the%total%amount%of%funding%received%by%the%charity%(including%the%value%of%the%match).%The%checkbook%donation%refers%to%the%amount%given%out%of%net<of<tax%income,%without%taking%account%of%the%match%and%before%the%donors%has%reclaimed%any%rebate..%**%p%<%0.05
145

Charitable donations and tax relief in the UK
Table 5.5: Elasticity estimates
Table 5: Elasticity estimates
Estimated match elasticity Estimated rebate elasticity P-value
All higher-rate taxpayers -1.127 (.067) -.212 (.041) .0000
Whether or not individual reclaims higher-rate rebate
Reclaimers -1.277 (.096) -.415 (.091) .0000
Non-reclaimers -.946 (.091) .032 (.054) .0000
Level of understanding (higher-rate reclaimers)
“Good” -1.368 (.116) -.440 (.070) .0000
“Poor” -1.095 (.170) -.366 (.102) .0000
Size of donations (higher-rate reclaimers)
Quartile 1: £334 -1.177 (.220) -.473 (.132) .0002
Quartile 2: £1,056 -1.220 (.170) -.277 (.119) .0000
Quartile 3: £2,951 -1.154 (.180) -.366 (.110) .0000
Quartile 4: £20,193 -1.496 (.202) -.559 (.123) .0000
Whether or not donor adjusts checkbook donations (higher rate reclaimers)
Adjusters -1.929 (.297) -1.431 (.179) .0581
Notes: standard errors in parentheses, p-value is for the test that the match and rebate elasticity are equal. Each line represents a separate regression.
146

Charitable donations and tax relief in the UK
Figure 5.1: Proportion of donors that report reclaiming the rebate
! 27!
Figure 1: Proportion of donors that report reclaiming the rebate
Figure 2: Proportion of donors adjusting checkbook donations
0.2
.4.6
.81
Pro
porti
on re
clai
min
g
0 2000 4000 6000 8000 10000Estimated total Gift Aid donations in the last 12 months
147
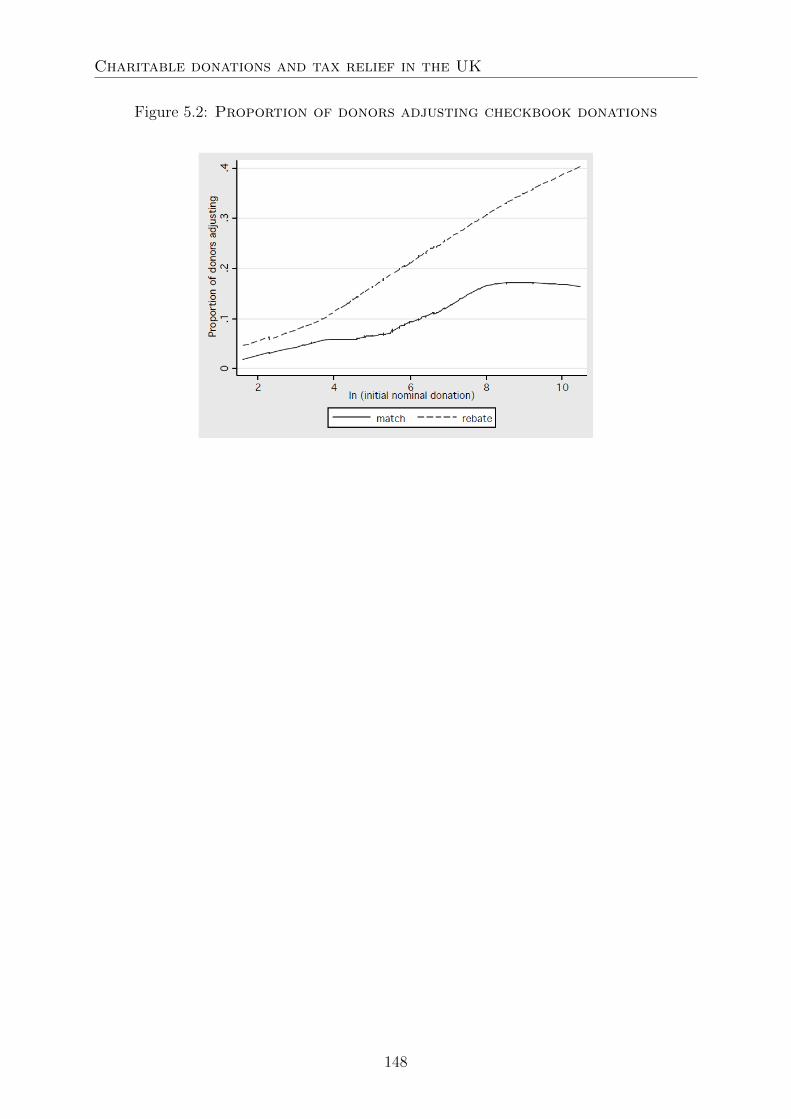
Charitable donations and tax relief in the UK
Figure 5.2: Proportion of donors adjusting checkbook donations
! 27!
Figure 1: Proportion of donors that report reclaiming the rebate
Figure 2: Proportion of donors adjusting checkbook donations
0.2
.4.6
.81
Pro
porti
on re
clai
min
g
0 2000 4000 6000 8000 10000Estimated total Gift Aid donations in the last 12 months
148

Charitable donations and tax relief in the UK
Figure 5.3: : Estimated change in total contributions and cost of tax reliefassociated with match-only options
! 28!
Figure'3:'Estimated'change'in'total'contributions'and'cost'of'tax'relief'associated'with'match9only'options'
!!!!!! !Note!to!figure:!The!central,!bold!line!indicates!the!percentage!changes!in!total!contributions!and!the!cost!of!
tax!relief!compared!to!the!current!system!based!on!an!assumption!that!35%!of!higher@rate!taxpayers!
reclaim!the!rebate.!The!paler!lines!show!the!same,!assuming!that!25%!and!45%!reclaim.
Note: The central, bold line indicates the percentage changes in total contributions and the cost of taxrelief compared to the current system based on an assumption that 35% of higher-rate taxpayersreclaim the rebate. The paler lines show the same, assuming that 25% and 45% reclaim.
149

Charitable donations and tax relief in the UK
! 29!
Appendix A1: Presentation of the Scenarios
Initial donation
How likely are you to make any Gift Aid donations to a charity within the next six months?
This could be a one-off donation or a regular donation set up as a standing order or direct debit.
• Certain
• Very likely
• Fairly likely
• Not very likely
• Not at all likely
• Don’t know
IF ‘Certain’ or ‘Very likely’ or ‘Fairly likely’
And how much do you think that you are likely to give (to the nearest pound)? If the donation
you are thinking about is a regular direct debit or standing order, please give the total of that
donation for a six month period.
Introduction to scenarios
The Gift Aid scheme allows charities to reclaim the basic rate income tax on your donation and
allows higher rate taxpayers to claim back higher rate tax relief. You are now going to be
presented with two hypothetical changes to the Gift Aid scheme – either to the amount that the
charity can reclaim and/or to the amount that higher rate taxpayers can claim back. In each
case you will be asked to consider whether the amount of money that you are likely to give to
charity would be affected by the proposed changes.
Example
Through the Gift Aid scheme, the charity you are donating to reclaims the basic rate income tax
on your donation. This is worth 25 pence for every £1 you donate.
Suppose instead that the charity received 30 pence for every £1 you donate. (Assume that the
amount of higher rate relief that you can claim back is unchanged).
Thinking about your donation of [£X] would this change affect the amount you are likely to
give? SINGLE CODE ONLY
• Yes - I would give more than [£X]
• Yes - I would give less than [£X]
150

Charitable donations and tax relief in the UK
! 30!
• No - I would give the same amount
• Don’t know
IF yes, how much would you be likely to give (to the nearest pound)?
• (write in)
• Don’t know
IF ‘don’t know’, which of these comes closest to what you think you might increase/ reduce
your donation by?
• By 10% or less?
• By more than 10%?
• Don’t know
If more than 10%, Would you increase/ reduce your donation by 25% or more?
• Yes
• No
• Don’t know
If yes, Would you increase/ reduce your donation by 50% or more?
• Yes
• No
• Don’t know
151