characterizing the niwot ridge, colorado c1 site: local ... · 2% of the cfc‐11 measurements at...
TRANSCRIPT
Meteorology
The C1 climate station is located on a ridge‐top in a subalpineforest, 9.7 km east of the Continental Divide. Climate dataexists from the C1 station from 1953 to present, and includestemperature, relative humidity, solar radiation, barometricpressure, wind speed and direction, precipitation, soilmoisture and temperature, snow depth. The prevailing windsare from the northwest to west where typically continentalbackground air is sampled by the gas chromatograph.
C1 wind rose
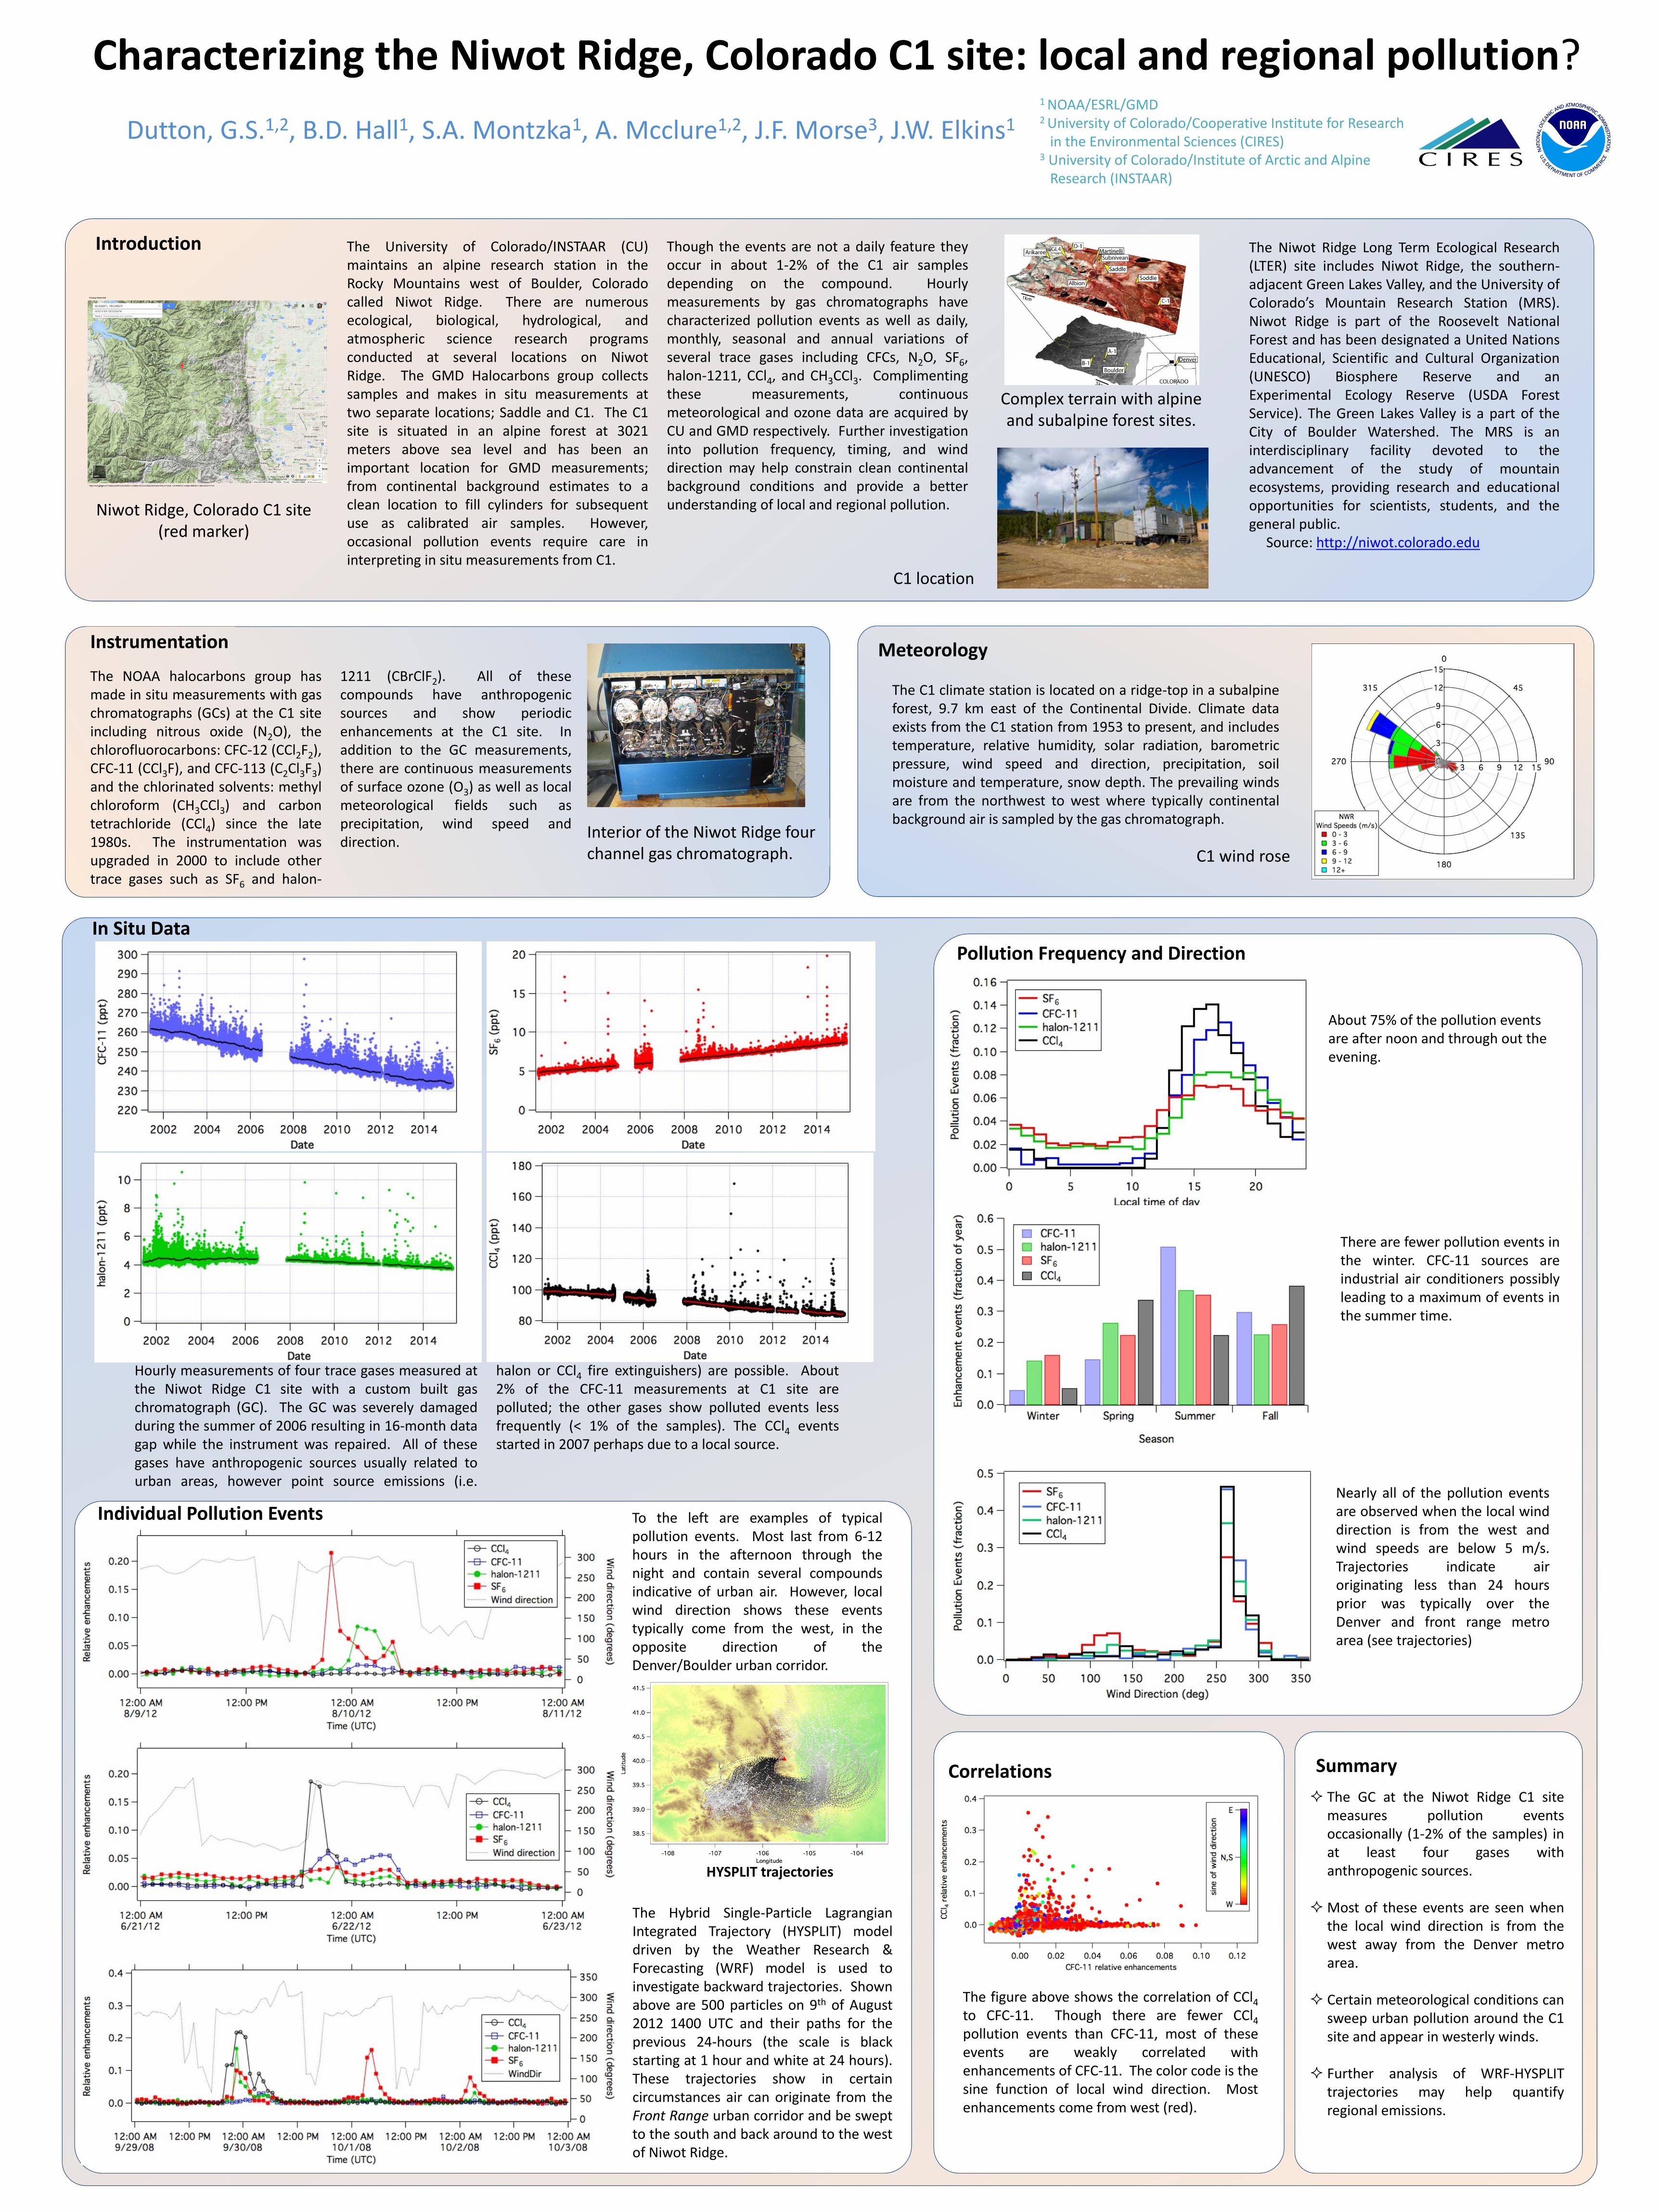
Characterizing the Niwot Ridge, Colorado C1 site: local and regional pollution?
Dutton, G.S.1,2, B.D. Hall1, S.A. Montzka1, A. Mcclure1,2, J.F. Morse3, J.W. Elkins11 NOAA/ESRL/GMD2 University of Colorado/Cooperative Institute for Research in the Environmental Sciences (CIRES)
3 University of Colorado/Institute of Arctic and AlpineResearch (INSTAAR)
Hourly measurements of four trace gases measured atthe Niwot Ridge C1 site with a custom built gaschromatograph (GC). The GC was severely damagedduring the summer of 2006 resulting in 16‐month datagap while the instrument was repaired. All of thesegases have anthropogenic sources usually related tourban areas, however point source emissions (i.e.
halon or CCl4 fire extinguishers) are possible. About2% of the CFC‐11 measurements at C1 site arepolluted; the other gases show polluted events lessfrequently (< 1% of the samples). The CCl4 eventsstarted in 2007 perhaps due to a local source.
In Situ Data
Summary
About 75% of the pollution events are after noon and through out the evening.
There are fewer pollution events inthe winter. CFC‐11 sources areindustrial air conditioners possiblyleading to a maximum of events inthe summer time.
Nearly all of the pollution eventsare observed when the local winddirection is from the west andwind speeds are below 5 m/s.Trajectories indicate airoriginating less than 24 hoursprior was typically over theDenver and front range metroarea (see trajectories)
Pollution Frequency and Direction
To the left are examples of typicalpollution events. Most last from 6‐12hours in the afternoon through thenight and contain several compoundsindicative of urban air. However, localwind direction shows these eventstypically come from the west, in theopposite direction of theDenver/Boulder urban corridor.
The Hybrid Single‐Particle LagrangianIntegrated Trajectory (HYSPLIT) modeldriven by the Weather Research &Forecasting (WRF) model is used toinvestigate backward trajectories. Shownabove are 500 particles on 9th of August2012 1400 UTC and their paths for theprevious 24‐hours (the scale is blackstarting at 1 hour and white at 24 hours).These trajectories show in certaincircumstances air can originate from theFront Range urban corridor and be sweptto the south and back around to the westof Niwot Ridge.
Individual Pollution Events
The University of Colorado/INSTAAR (CU)maintains an alpine research station in theRocky Mountains west of Boulder, Coloradocalled Niwot Ridge. There are numerousecological, biological, hydrological, andatmospheric science research programsconducted at several locations on NiwotRidge. The GMD Halocarbons group collectssamples and makes in situ measurements attwo separate locations; Saddle and C1. The C1site is situated in an alpine forest at 3021meters above sea level and has been animportant location for GMD measurements;from continental background estimates to aclean location to fill cylinders for subsequentuse as calibrated air samples. However,occasional pollution events require care ininterpreting in situ measurements from C1.
Though the events are not a daily feature theyoccur in about 1‐2% of the C1 air samplesdepending on the compound. Hourlymeasurements by gas chromatographs havecharacterized pollution events as well as daily,monthly, seasonal and annual variations ofseveral trace gases including CFCs, N2O, SF6,halon‐1211, CCl4, and CH3CCl3. Complimentingthese measurements, continuousmeteorological and ozone data are acquired byCU and GMD respectively. Further investigationinto pollution frequency, timing, and winddirection may help constrain clean continentalbackground conditions and provide a betterunderstanding of local and regional pollution.
Introduction
Niwot Ridge, Colorado C1 site (red marker)
Complex terrain with alpine and subalpine forest sites.
The Niwot Ridge Long Term Ecological Research(LTER) site includes Niwot Ridge, the southern‐adjacent Green Lakes Valley, and the University ofColorado’s Mountain Research Station (MRS).Niwot Ridge is part of the Roosevelt NationalForest and has been designated a United NationsEducational, Scientific and Cultural Organization(UNESCO) Biosphere Reserve and anExperimental Ecology Reserve (USDA ForestService). The Green Lakes Valley is a part of theCity of Boulder Watershed. The MRS is aninterdisciplinary facility devoted to theadvancement of the study of mountainecosystems, providing research and educationalopportunities for scientists, students, and thegeneral public.
Source: http://niwot.colorado.edu
C1 location
Instrumentation
The NOAA halocarbons group hasmade in situ measurements with gaschromatographs (GCs) at the C1 siteincluding nitrous oxide (N2O), thechlorofluorocarbons: CFC‐12 (CCl2F2),CFC‐11 (CCl3F), and CFC‐113 (C2Cl3F3)and the chlorinated solvents: methylchloroform (CH3CCl3) and carbontetrachloride (CCl4) since the late1980s. The instrumentation wasupgraded in 2000 to include othertrace gases such as SF6 and halon‐
1211 (CBrClF2). All of thesecompounds have anthropogenicsources and show periodicenhancements at the C1 site. Inaddition to the GC measurements,there are continuous measurementsof surface ozone (O3) as well as localmeteorological fields such asprecipitation, wind speed anddirection.
Interior of the Niwot Ridge four channel gas chromatograph.
The GC at the Niwot Ridge C1 sitemeasures pollution eventsoccasionally (1‐2% of the samples) inat least four gases withanthropogenic sources.
Most of these events are seen whenthe local wind direction is from thewest away from the Denver metroarea.
Certain meteorological conditions cansweep urban pollution around the C1site and appear in westerly winds.
Further analysis of WRF‐HYSPLITtrajectories may help quantifyregional emissions.
HYSPLIT trajectories
Correlations
The figure above shows the correlation of CCl4to CFC‐11. Though there are fewer CCl4pollution events than CFC‐11, most of theseevents are weakly correlated withenhancements of CFC‐11. The color code is thesine function of local wind direction. Mostenhancements come from west (red).