characterizing the electromechanical response of flexible
TRANSCRIPT

Brigham Young University Brigham Young University
BYU ScholarsArchive BYU ScholarsArchive
Theses and Dissertations
2017-11-21
Characterizing the Electromechanical Response of Flexible Foam Characterizing the Electromechanical Response of Flexible Foam
for Multifunctional Impact-Sensing Applications for Multifunctional Impact-Sensing Applications
Evan Troy Bird Brigham Young University
Follow this and additional works at: https://scholarsarchive.byu.edu/etd
BYU ScholarsArchive Citation BYU ScholarsArchive Citation Bird, Evan Troy, "Characterizing the Electromechanical Response of Flexible Foam for Multifunctional Impact-Sensing Applications" (2017). Theses and Dissertations. 9262. https://scholarsarchive.byu.edu/etd/9262
This Thesis is brought to you for free and open access by BYU ScholarsArchive. It has been accepted for inclusion in Theses and Dissertations by an authorized administrator of BYU ScholarsArchive. For more information, please contact [email protected].

Characterizing the Electromechanical Response of Flexible Foam
for Multifunctional Impact Sensing Applications
Evan Troy Bird
A thesis submitted to the faculty of Brigham Young University
in partial fulfillment of the requirements for the degree of
Master of Science
David T. Fullwood, Chair Anton E. Bowden Matthew K. Seeley
Department of Mechanical Engineering
Brigham Young University
Copyright © 2017 Evan Troy Bird
All Rights Reserved

ABSTRACT
Characterizing the Electromechanical Response of Flexible Foam for Multifunctional Impact Sensing Applications
Evan Troy Bird Department of Mechanical Engineering, BYU
Master of Science
Flexible foams have unique properties that make them well-suited to several engineering systems. They are often used in impact-related applications because of their superior energy absorption performance. Many multifunctional materials are also derived from flexible foams due to their high customizability, which allows them to satisfy a wide range of performance requirements. Though flexible foams have high potential in these and other classes of material applications, their success relies on the proper characterization of their complex behavior. This thesis promotes the application of flexible foams by characterizing their electromechanical response through both experimental and theoretical approaches. One study in this thesis theoretically determines material indices that minimize a foam’s mass and cost while meeting particular energy absorption requirements. These novel indices are combined with a common Ashby approach to facilitate materials selection of energy-absorbing foam components. Another study uses a particular multifunctional nanocomposite foam to experimentally determine deviations in its voltage response while under a cyclic impacting regime; specifically, factors of transient effects, environmental conditions (humidity and temperature), and permanent material degradation are investigated. Results presented in this thesis promote the application of flexible foams to various forms of impact-absorbing sports equipment (specifically football helmet pads and gait-sensing shoe insoles), but are also useful in various other engineering designs. Keywords: foam, impact, multifunctional, energy absorption, materials selection, nanocomposite, piezoelectric, signal drift

ACKNOWLEDGEMENTS
This work was supported by funding from the National Science Foundation [grant
numbers CMMI-1538447, CMMI-1235365, and STTR-1549719] and related REU supplements.
I thank my advisor, Dr. Fullwood for his guidance, support, and initial motivation to undertake
this project. I also thank the other professors in my committee, Dr. Bowden and Dr. Seeley for
their support and direction. I thank present and past members of the BYU Nanocomposite Sensor
Research Lab for their day-to-day support and advice. I thank the staff of BYU Mechanical
Engineering Department for their technical support. Most of all, I thank my family for their
confidence and continual encouragement.

iv
TABLE OF CONTENTS
LIST OF TABLES ......................................................................................................................... vi
LIST OF FIGURES ..................................................................................................................... viii 1 Introduction ............................................................................................................................. 1
2 Background .............................................................................................................................. 5
Foam ................................................................................................................................. 5
Materials Selection ........................................................................................................... 6
Multifunctional and Self-Sensing Materials .................................................................... 7
3 Materials Selection of Open-cell Flexible Foams in Energy Absorption Applications ........ 11
Abstract .......................................................................................................................... 11
Keywords ....................................................................................................................... 12
Introduction .................................................................................................................... 12
Methods .......................................................................................................................... 14
3.4.1 Mass-Minimizing Material Index ........................................................................... 17
3.4.2 Mass-Minimizing Material Selection ..................................................................... 21
3.4.3 Cost-Minimizing Material Index ............................................................................ 25
3.4.4 Cost-Minimizing Material Selection....................................................................... 25
Discussion ...................................................................................................................... 26
3.5.1 Case Study .............................................................................................................. 29
Conclusion ...................................................................................................................... 30
Acknowledgements ........................................................................................................ 31
4 Effect of Environmental and Material Factors on the Response of Nanocomposite Foam Impact Sensors ....................................................................................................................... 33
Abstract .......................................................................................................................... 33
Keywords ....................................................................................................................... 34
Introduction .................................................................................................................... 34
Methods .......................................................................................................................... 38
4.4.1 Experimental Protocol ............................................................................................ 41
4.4.1.1 Transient Effects .............................................................................................. 41
4.4.1.2 Environmental Drift: Humidity ....................................................................... 42
4.4.1.3 Environmental Drift: Temperature .................................................................. 43
4.4.1.4 Signal Decay Due to Material Degradation ..................................................... 44

v
Results and Discussion ................................................................................................... 45
4.5.1 Transient Effects ..................................................................................................... 45
4.5.2 Environmental Drift: Humidity............................................................................... 51
4.5.3 Environmental Drift: Temperature ......................................................................... 54
4.5.4 Signal Decay Due to Material Degradation ............................................................ 56
Conclusions .................................................................................................................... 57
Acknowledgements ........................................................................................................ 59
5 Conclusion ............................................................................................................................. 61
References ..................................................................................................................................... 63

vi
LIST OF TABLES
Table 3-1: Variable definitions and units...................................................................................... 16

viii
LIST OF FIGURES
Figure 3-1: Typical flexible foam stress-strain curve ................................................................... 15 Figure 3-2: (a) Models of the relationship between 𝑚𝑚𝑓𝑓 and 𝜌𝜌𝑠𝑠 in Eq. 3-9 over the range of
polymer 𝐸𝐸𝑠𝑠 values. (b) Power models of coefficients 𝑎𝑎 and 𝑏𝑏 as functions of 𝐸𝐸𝑠𝑠, used in Eq. 3-10. ................................................................................................................ 20
Figure 3-3: Ashby chart showing full range of polymer envelopes, fit on axes of solid Young’s modulus and solid density.. ....................................................................................... 22
Figure 3-4: Inset of Figure 3-3, showing material envelopes with the highest values of 𝑀𝑀𝑚𝑚. ..... 23 Figure 3-5: Ranges of dominance of top-performing materials (with their required relative
densities) to minimize mass of a foam pad as a function of 𝜎𝜎𝑚𝑚𝑚𝑚𝑚𝑚. ........................... 24 Figure 3-6: Ashby chart showing polymer envelopes fit on axes of solid Young’s modulus and
relative material cost*solid density.. ......................................................................... 26 Figure 3-7: Inset of Figure 3-6, showing material envelopes with the highest values of 𝑀𝑀𝑐𝑐. ...... 27 Figure 3-8: Ranges of dominance of top-performing materials (with their required relative
densities) to minimize material cost of a foam pad as a function of 𝜎𝜎𝑚𝑚𝑚𝑚𝑚𝑚 ................ 28 Figure 4-1: NCF sensor, with embedded aluminum-masked PET film........................................ 35 Figure 4-2: An NCF sensor’s raw voltage signal corresponding to two consecutive and identical
impacts ....................................................................................................................... 36 Figure 4-3: Drift in an NCF sensor’s signal while under a consistent cyclic impacting regime .. 37 Figure 4-4: Experimental setup, showing NCF sensor under the cyclic impacting machine ....... 40 Figure 4-5: Raw vertical acceleration data gathered from an accelerometer rigidly mounted onto
the weight carriage of the cyclic drop testing machine ............................................. 41 Figure 4-6: Data showing an NCF sensor’s response time to changes in humidity ..................... 44 Figure 4-7: Effect of rest time, following a previous impact test, on transient voltage response
under a consistent impacting regime ......................................................................... 46 Figure 4-8: Piecewise function fitting sensor rest time against rise time ..................................... 48 Figure 4-9: Effect of impact magnitude on transient voltage response under consistent impacting
regimes ....................................................................................................................... 49 Figure 4-10: Influence of humidity on transient voltage response ............................................... 52 Figure 4-11: Influence of humidity on an NCF sensor’s average steady-state peak voltage per
impact ........................................................................................................................ 53 Figure 4-12: Positive linear influence of temperature on an NCF sensor’s average steady-state
peak voltage per impact ............................................................................................. 55 Figure 4-13: Linear signal decay resulting from material degradation in an NCF sensor. ........... 57

1
1 INTRODUCTION
Multifunctional polymeric foams represent a unique class of self-sensing materials; their
highly customizable electromechanical properties allow them to reach levels of performance
required by a diverse range of applications. However, their successful implementation requires
that both their electrical and mechanical behaviors be adequately characterized. Compared to
solid materials, foams present a unique challenge in this effort; their inherent composite nature
and intricate cellular structure create complex electromechanical properties. This thesis addresses
both aspects of performance to help develop and implement multifunctional foams. Specific
focus is placed on impact-related applications, where a single component is required to both
absorb and measure high strain (and strain rate) deformations. Such applications include impact-
monitoring helmet pads, gait-tracking shoe insoles, damage-sensing packaging materials, and
more.
Though there are numerous aspects of mechanical performance important to
multifunctional foams, this thesis focuses on energy absorption, since it is most critical in
impact-related applications. A foam’s energy absorption is influenced by many factors, including
loading characteristics, base polymer, foamed density, geometry, and others. Experimentally
characterizing energy absorption in response to these factors requires an intensive testing regime;
each factor must be explicitly isolated over its entire range of interest. To alleviate the hefty time
and cost demands of this method, a theoretical approach is preferable. Chapter 3 presents such a

2
solution, derived from a novel application of the Ashby materials selection method. Results from
this research allow a wide range of solid polymers to be compared by the mass and cost each
would require when foamed in order to reach a specific energy-absorption performance. Though
many of the materials considered in this work are not typically used in a self-sensing capacity,
recent advances in foam manufacturing processes are widening the material range available to
select from. This chapter has been accepted for publication as a peer-reviewed original research
journal article in Materials & Design. The co-authors for this paper are Anton Bowden, Matthew
Seeley, and David Fullwood.
A multifunctional foam’s electrical capabilities are most commonly exploited in self-
sensing applications. This thesis specifically investigates nanocomposite foam (NCF), an open-
cell polyurethane foam matrix with two forms of micro- to nano-scale nickel additives (nickel-
coated carbon fiber and nickel powder) dispersed throughout it. Triboelectric interactions
between the foam matrix and embedded fillers produce a quasi-piezoelectric effect under
dynamic strain; this voltage response has been found to correlate with the magnitude of applied
impact. Even more so than its energy absorption response, NCF’s electrical behavior is very
complex and sensitive to many factors, including environmental conditions and time-related
effects. This causes various forms of signal drift in NCF’s voltage response, which introduces
substantial error in long-term applications. In order for NCF to retain accuracy through such
measurements, signal drift effects must be mitigated. There have been several methods
developed to accomplish this, including periodic recalibration, utilizing reference sensors or
sensor networks, and machine learning-based drift correction algorithms. The long-term impact-
sensing application of NCF favors a more direct approach: experimentally characterizing factor-
specific drift, then utilizing these models in a drift-compensation algorithm or circuit. Chapter 4

3
presents this work of investigating signal drift in NCF sensors to promote their use in various
multifunctional capacities. Specifically, drift caused by transient effects, humidity, temperature,
and material degradation is characterized. This chapter is under review for publication as a peer-
reviewed original research journal article. Co-authors for this paper are Jake Merrell, Parker
Rosquist, Adin Martineau, Anton Bowden, Matthew Seeley, and David Fullwood.
The research presented in this thesis helps promote the development of multifunctional
foam impact sensors through both mechanical design and electrical implementation. Chapter 5
provides a summary of the conclusions from this work and suggests paths of future research to
further the advances of this thesis.

5
2 BACKGROUND
Foam
Foams constitute a broad class of materials and are used in a variety of applications.
While some foams are made through natural processes, manufacturing methods have been
developed to disperse gas through nearly any solid material [1-3]. When a material is foamed, its
properties change drastically from those of its dense, solid state. This happens for two main
reasons: 1. a secondary substance (gas) is added, and 2. the original material’s structure is
changed.
Foam can be considered as a composite: the base material acting as the matrix, with a gas
being the filler. As with other fillers, introducing gas to a matrix can affect all types of the
overall composite’s properties: physical (e.g., density), electrical (e.g., conductivity [4-7],
dielectric strength [8, 9]), chemical (e.g., flammability [10, 11]), and thermal (e.g., conductivity
[3, 12, 13], thermal expansion [14]). When particular characteristics of both a gas (such as low
density or high resistivity) and solid material (such as high stiffness and strength) are needed in a
single component, it is often possible to obtain all of the desirable features by combining the two
as a composite foam [15]. This is exploited in many applications, including thermal insulation
and lightweight flotation devices.
A foam’s mechanical properties (e.g., stiffness, energy absorption) are mostly influenced
by its small-scale geometrical configuration [2, 16-19]. Under ideal foaming processes, gas is

6
introduced within the liquid matrix such that it reaches a fairly uniform distribution [20-22]. This
forces the matrix material to solidify into a cellular or even lattice-like structure, characterized by
a network of thin walls or struts [23, 24]. The orientation of these structures in foams is typically
systematic; hence, they impart global anisotropic mechanical properties to the foam [25-27]. The
intricacy of this microstructure gives foams a unique macro-scale mechanical response compared
to solid materials [28, 29]. Since individual cells are so thin, they readily buckle under small
loads; as load increases, layers of cells (perpendicular to the loading direction) collapse over a
large range of strain and at a remarkably low stress [27, 30]. It is for this reason that foams are
well-suited for many damping and energy absorption-related applications [31-33]. This response
continues until much of the cellular network has collapsed onto itself, upon which the foam
stiffens, approaching its Young’s modulus as a solid material [28, 34].
Aside from base material (polymer/metal/ceramic), foams are generally classified by
their structure (open/closed cell) and mechanical behavior (flexible/rigid, elastic/plastic) [30, 35].
Since foams can contain anywhere from small, isolated voids to a large interconnected air
network, they can reach a much broader range of properties than their solid counterparts [15, 36].
The extensive customization offered by foam materials (from base material, structure, and
density) lends them to be optimized for specific stiffness, energy absorption, and other complex
properties [1, 37, 38]. This capability is exploited across a spectrum of both high-performance
(sandwich panels [3, 37], etc.) and more common applications (cushioning [39, 40], etc.).
Materials Selection
Various methods have been developed with the aim to systematically choose materials
that are best suited for a particular design application [41-44]. Among these, the method

7
developed by Michael Ashby in the late 20th century is arguably the most widely used today [44,
45]. This approach takes place relatively early on in the design process; it involves identifying a
component’s basic performance requirements, translating those requirements into an objective,
and evaluating materials based on their effectiveness in fulfilling that objective [42]. Material
indices articulate design objectives (in terms of common material properties) and serve as a
benchmark to compare performance across materials. For ease of material evaluation, they are
plotted with material envelopes on axes of design-critical properties. As many components
perform similar functions, Ashby has already derived some material indices that can be used for
common design objectives (light and stiff panels, strong pressure vessels with high fracture
toughness, low cost thermal insulators, etc.) [42].
Ashby’s method has not only offered solutions for common materials selection scenarios,
it has uncovered unique avenues for future materials research and development. The concept of
an Ashby plot has exposed gaps in achievable material property combinations; these identify
distinct roles that composites and other new materials can fill [42, 46]. For designs with complex
and unique requirements, the basic framework of Ashby’s method can be utilized to derive novel
material indices [47, 48]. Finally, this method has been appended by considering not only the
effects of material choice, but also those of geometry and the manufacturing process selection
[44, 49].
Multifunctional and Self-Sensing Materials
Multifunctional materials are a subset of composites, distinguished by their ability to
fulfill several roles. While we traditionally consider a material as having a predefined envelope
of properties, multifunctional materials are customized to satisfy the diverse needs of a particular

8
application [50]. The main purpose of such materials is usually to bear a mechanical load, but its
other capabilities are often completely unrelated to structural performance [51, 52]. Some of the
more common existing variations double as sensors [53, 54], actuators [55], self-healing
components [56, 57], energy harvesters [58, 59], multiscale structures [60], electrical and
thermal conductors/insulators [61-64], and biodegradable/recyclable components [65]. These
materials can simplify complex physical systems by reducing the number of components they
require, which consequently decreases cost [66]. Countless multifunctional materials are made
through natural processes (such as bones and leaves), but mankind’s pursuit in creating custom
variations has proved difficult [67, 68]. Designing a multifunctional material requires mastery in
manufacturing complex material features (including those related to both morphology and
composition) and accurately characterizing their effect on overall performance [69, 70]. Modern
advances in manufacturing technology have increased the feasibility of multifunctional materials
and allowed them to gain traction in recent years [51].
Among the most advanced multifunctional materials are self-sensing components, which
exhibit piezo-responsive behavior as they perform their mechanical functions [71]. This
electrical reaction can be categorized as either piezoelectric or piezoresistive. Piezoelectrics
measure dynamic strain through a self-generated voltage [72, 73]. Piezoresistive sensors, on the
other hand, measure static strain through their electrical resistance [74, 75]. Along with the cost
and space-saving advantages of other multifunctional materials, self-sensing components allow
the unique benefit of simple in situ installation, which can additionally help to remove the
measurement bias associated with mounting placement [76-78]. Both piezoelectric and
piezoresistive materials have been created by adding conductive fillers into elastomeric polymers
[79-83]. These sensors are particularly useful because they can accommodate the high strain

9
applications unattainable by piezo-responsive metals and ceramics, such as wearable sensors [84,
85]. The downside to these flexible elastomeric sensors is that they are prone to signal drift [86-
88]. Unless somehow compensated for, this drift diminishes measurement accuracy, especially in
long-term sensing applications [86].

11
3 MATERIALS SELECTION OF OPEN-CELL FLEXIBLE FOAMS IN ENERGY
ABSORPTION APPLICATIONS
Abstract
Foam must be engineered to absorb a particular range of energy in various impact-related
applications. Since energy absorption is dependent upon the unique stress-strain response of each
foam specimen, it is difficult to quantify analytically; thus, energy absorption cannot be easily
compared across materials. Current methods accomplish this using an experimental approach,
individually testing foam materials, densities, and geometries to quantify how each influences
energy absorption. Such methods require large amounts of time and money to characterize a
narrow range of foams. This paper facilitates foam selection by deriving generalized energy
absorption material indices. Assuming Euler buckling of columns in the open-cell foam
structure, this paper applies equations derived by Maiti et al. to a typical impact scenario wherein
the indices are extracted. Using existing Ashby charts, these indices allow polymers to be ranked
by the mass and cost each would require as a foamed structure to satisfy specific energy
absorption constraints. The presented method allows the energy absorption of a wide range of
flexible foams to be compared and relieves the need for extensive factor-specific testing. This
method is applied to football helmet foam selection; however, it can be used for many
applications where energy absorption is of interest.

12
Keywords
energy absorption, materials selection, foam, football helmet, Ashby methods
Introduction
Energy absorption is the most important performance requirement in many impact-related
applications of foam components. Ideally, a foam’s energy absorption and resultant stress in
response to an impact could be directly compared across materials during the materials selection
stage of design. However, comparing foams based upon their energy absorption performance is
complicated; there is no optimal energy absorbing material design for all possible applications.
This is because a particular foam specimen’s energy absorption capacity is dependent upon its
base polymer, foamed density, geometry, stress-strain relationship, and magnitude of applied
impact [89, 90]. To characterize energy absorption and stress behavior among foam materials,
most current methods (developed primarily in the packaging industry) follow an experimental
rather than analytical approach [89, 91, 92]. Following this methodology, individual experiments
are designed to isolate the change in a foam’s energy absorption performance based on only one
of its many influencing factors [89]. Performing experimentation in this fashion requires
extensive amounts of time and money for a meager end result: the characterization of a narrow
array of materials and design conditions. Such inefficiency makes the task of optimizing key
aspects of a foam design (such as mass or cost) nearly impossible.
An analytical approach to quantifying energy absorption performance is needed to
improve foam design and save time and cost relative to the current foam selection strategy [93].
One method has been developed to analytically accomplish a comparable goal (but using solid
materials with different design objectives) by deriving a series of complex materials selection
criteria [94]. Such an approach can consider a very wide range of possible designs, but it uses an

13
indirect materials selection technique. This paper takes the opposite approach, using a simpler
materials selection method with a more constrained design space. Materials selection indices are
developed for energy absorption of polymer-based open-cell flexible foams using common
material properties. Using methods introduced by Michael Ashby, this energy absorption metric
is combined with other properties of interest (material cost and density) to define a performance
index and select the optimal materials for a specific design [95]. This is done using two-
dimensional plots of relevant physical properties for a wide range of materials, simultaneously
[45]. The proposed method of selecting a foam material design is illustrated in a case study,
where the mass of a football helmet’s top pad is minimized for given energy absorption and
maximum stress requirements. The application of football helmet foam selection was chosen
because energy absorption is of primary interest [96-98], only flexible foam is used [99], and
energy absorption requirements vary by location within a single helmet [100-102].
Typical helmets for football (and other applications) are comprised of two main parts: a
hard plastic shell and interior foam padding [103, 104]. The shell (usually solid polycarbonate or
ABS) serves to delocalize the impact and engage a large area of foam padding inside it, where
most of the energy is absorbed [89, 99, 103, 105]. This foam is crucial to the helmet design; a
football helmet’s ability to prevent concussion and traumatic brain injury is directly related to its
impact energy absorption capacity [96, 97]. Since football helmets are required to protect players
from multiple impacts, only flexible foams (that operate in the elastic region of the stress-strain
curve) are used; plastic foams are not considered because their energy absorption potential
degrades with each impact [103, 106]. Though energy absorption performance is the most
important requirement in helmet foam, other factors including mass, geometry, and cost must
also be optimized [93]. In addition, foam must be customized to match the energy absorption

14
needs of the helmet’s different locations, based on the magnitude of impact each typically
receives as well as the sensitivity of each region of the head [99, 102, 105, 107]. For example,
foam is usually thicker and stiffer in the top of football helmets because that is where the greatest
impacts statistically occur [102, 108]. Conversely, foam on the back and sides is less stiff to
absorb the more frequent, lower magnitude impacts [102, 108]. Because a helmet’s energy
absorption requirements differ spatially, the current methodology dictates that the laborious foam
selection process must be repeated for four unique locations: top, forehead, sides/back, and jaw
[102, 104]. Thus, the costs involved with the materials selection design stage must unnecessarily
scale with the increasing complexity of helmet design.
This paper proceeds by deriving material indices to optimize a foam pad’s mass and cost,
given energy absorption and maximum stress requirements. These are plotted on Ashby charts to
identify the optimum polymers for various design objectives. Material choices are validated for
feasibility by calculating their required mass, foamed density, and thickness for the particular
application. Finally, a case study is outlined to select a lightweight foam material design for a
football helmet’s top pad.
Methods
Open-cell flexible foams exhibit a unique stress response under compressive strain
(Figure 3-1). Like most materials, their stress-strain curves have a linear elastic region, where
stress quickly increases at small strains. As strain increases, stress levels off in the plateau
region, where cell walls elastically buckle over a large range of strain [109]. This continues until
a very high strain (where most cell walls have buckled) and stress exponentially increases
through the densification region (where plastic deformation occurs). To absorb the most energy

15
without experiencing plastic deformation, flexible foams are designed to absorb impacts just
below the densification stress [27, 99, 110, 111].
Figure 3-1: Typical flexible foam stress-strain curve, showing linear elastic, plateau, and densification regions.
To illustrate the process of foam selection with related energy absorption requirements,
let us consider a simple impact scenario, using notation as defined in Table 3-1: a football player
with equivalent mass (𝑚𝑚𝑝𝑝) runs with a velocity (𝑣𝑣) into a head-on collision with a rigid object.
During impact, some amount of foam in the nearest helmet pad (𝑚𝑚𝑓𝑓) deforms to absorb the
player’s kinetic energy �12𝑚𝑚𝑡𝑡𝑡𝑡𝑡𝑡𝑣𝑣2�. To protect against traumatic brain injury, helmets are
designed to keep an impact severity metric (e.g., head linear and angular acceleration, force,
stress, and combinations of these) below a threshold value [96, 112, 113]. For convenience, the
metric of maximum external stress on the player’s head during impact (𝜎𝜎𝑚𝑚𝑚𝑚𝑚𝑚) is used in this

16
derivation. As well as absorbing energy at a safe force, it is typically desirable for helmet foams
to be lightweight and inexpensive. To produce material indices for minimizing the mass and cost
of a foam pad, this derivation proceeds by combining the presented scenario’s energy absorption
and stress requirements with the equation for the maximum energy absorption of a foam, derived
by Maiti et al. [34]. This relation is then substituted into mass and cost minimizing functions, set
in terms of solid polymer properties to isolate effects of foamed density. From here, material
indices are extracted and plotted on Ashby charts to rank polymers based on mass and cost
performance. Finally, the optimal polymer is selected along with its foamed density and
thickness, which are determined using its solid mechanical properties.
Table 3-1: Variable definitions and units.
𝑊𝑊 Energy absorption/volume (J/m³) 𝜌𝜌𝑓𝑓 Density of the foamed material (kg/m³) 𝜌𝜌𝑠𝑠 Density of the solid (unfoamed) material (kg/m³) 𝜎𝜎𝑑𝑑 Foam densification stress (Pa) 𝐸𝐸𝑠𝑠 Solid material Young’s modulus (Pa) 𝜎𝜎𝑚𝑚𝑚𝑚𝑚𝑚 Maximum allowable stress (Pa) 𝑚𝑚𝑡𝑡𝑡𝑡𝑡𝑡 Total mass of player and foam (kg) 𝑣𝑣 Velocity of impact (m/s) 𝑉𝑉 Volume of foam engaged to absorb an impact (m³) 𝐴𝐴 Area of foam engaged to absorb an impact (m²) 𝑡𝑡 Thickness of foam engaged to absorb an impact (m) 𝑚𝑚𝑓𝑓 Mass of foam engaged to absorb an impact (kg) 𝑚𝑚𝑝𝑝 Equivalent mass of player involved in impact (kg) 𝜀𝜀 Strain 𝜀𝜀𝑑𝑑 Strain at the onset of densification
𝑀𝑀𝑚𝑚 Material index to minimize foam mass �𝑃𝑃𝑚𝑚0.729
𝑘𝑘𝑘𝑘𝑚𝑚3
�
𝑀𝑀𝑐𝑐 Material index to minimize foam cost �𝑃𝑃𝑚𝑚0.729
𝑐𝑐𝑡𝑡𝑠𝑠𝑡𝑡𝑘𝑘𝑘𝑘𝑚𝑚3�
𝐶𝐶 Total relative cost of foam (cost) 𝐶𝐶𝑚𝑚 Relative cost of foam material (cost/kg)

17
3.4.1 Mass-Minimizing Material Index
According to Maiti et al. [34], the maximum energy absorption per unit volume (𝑊𝑊) of
open-cell flexible foams prior to densification is
𝑊𝑊 = 0.11𝜎𝜎𝑑𝑑78𝐸𝐸𝑠𝑠
18 (3-1)
where 𝐸𝐸𝑠𝑠 is the Young’s modulus of the solid (unfoamed) material, and 𝜎𝜎𝑑𝑑 is the stress at the
onset of densification. Because this equation assumes Euler buckling of columns within the
open-cell foam structure, it is only valid for foams with a relative density, 𝜌𝜌𝑓𝑓𝜌𝜌𝑠𝑠
, between 0.01 and
0.3, where 𝜌𝜌𝑓𝑓 and 𝜌𝜌𝑠𝑠 are the material’s foamed and unfoamed densities, respectively. In this
region, columns within the foam are of the appropriate slenderness ratio for the analysis. To
utilize the foam’s full energy absorption capacity in the elastic regime, we will assume that for
the ideal foam 𝜎𝜎𝑑𝑑 = 𝜎𝜎𝑚𝑚𝑚𝑚𝑚𝑚 (the maximum allowable stress on the head). 𝑊𝑊 must also be equated
with the energy absorption requirements in this impact scenario. This is done by dividing the
player’s kinetic energy by the volume of foam engaged to absorb it:
𝑊𝑊 = 𝑚𝑚𝑡𝑡𝑡𝑡𝑡𝑡𝑣𝑣2
2𝑉𝑉= 𝑚𝑚𝑡𝑡𝑡𝑡𝑡𝑡𝑣𝑣2
2𝐴𝐴𝑡𝑡 (3-2)
Here, 𝑚𝑚𝑡𝑡𝑡𝑡𝑡𝑡 is the combined equivalent mass of the player and foam, 𝑉𝑉 is the volume of foam
deformed by impact, 𝑣𝑣 is the relative impact velocity, 𝑡𝑡 is the foam thickness (length of foam in
impact direction engaged to absorb impact energy, before deformation shortening), and 𝐴𝐴 is the
cross-sectional area of compressed foam between the helmet and player's head in the direction of
the impact. Assuming the foam is compressed to densification and its Poisson’s ratio is
negligibly small in this regime [34], Eq. 3-1 and 3-2 can be set equal to one another and solved
for 𝑡𝑡:

18
𝑡𝑡 = 𝑚𝑚𝑡𝑡𝑡𝑡𝑡𝑡𝑣𝑣2
0.22𝐴𝐴𝜎𝜎𝑚𝑚𝑚𝑚𝑚𝑚
78 𝐸𝐸𝑠𝑠
18 (3-3)
This foam thickness, expressed in terms of energy absorption capacity (in the
denominator) and design requirements (in the numerator), can be substituted into another relation
for mass (Eq. 3-4).
mf = Vρf = Atρf = � mtotv2
0.22σmax
78 Es
18� ρf (3-4)
𝑚𝑚𝑓𝑓 is the mass of a foam pad (assuming its full cross-sectional area is engaged to absorb the
impact) and 𝜌𝜌𝑓𝑓 is its density. We can replace 𝑚𝑚𝑡𝑡𝑡𝑡𝑡𝑡 with 𝑚𝑚𝑓𝑓 + 𝑚𝑚𝑝𝑝 and divide both sides by 𝑚𝑚𝑓𝑓,
which gives the foam mass minimizing function:
1mf
= 1mp
�0.22σmax
78 Es
18
v2ρf− 1� (3-5)
This shows that the required mass of a foam pad is dependent upon its mechanical properties 𝐸𝐸𝑠𝑠18
𝜌𝜌𝑓𝑓,
since all other variables in the equation (𝑚𝑚𝑝𝑝, 𝑣𝑣, and 𝜎𝜎𝑚𝑚𝑚𝑚𝑚𝑚) are constants for the given impact
scenario. For this relation to be useful in comparing base polymers, foamed density must be
replaced with 𝜌𝜌𝑠𝑠. We can accomplish this using an equation relating relative density to strain at
the onset of densification (𝜀𝜀𝑑𝑑, Eq. 3-6) and another equation relating 𝜎𝜎𝑑𝑑 to any strain (𝜀𝜀, Eq. 3-7),
both derived by Maiti et al. [34].
εd = 1 − 3 �ρfρs� (3-6)
σdEs
= 0.059(1 − ε)2 �1 − �1−ε3�13�
2
(3-7)

19
Replacing ε in Eq. 3-7 with Eq. 3-6 gives the complex relation
σd = 0.53Es ��ρfρs�83 − 2 �ρf
ρs�73 + �ρf
ρs�2� (3-8)
which cannot be analytically solved for 𝜌𝜌𝑓𝑓 (an analytical solution would enable ready
substitution back into Eq. 3-5 and simple material index extraction). However, Eq. 3-5 and 3-8
can be combined and solved numerically to find the underlying relation between 𝑚𝑚𝑓𝑓 and each of
the mechanical properties 𝐸𝐸𝑠𝑠 and 𝜌𝜌𝑠𝑠. This is done by solving Eq. 3-5 for 𝜌𝜌𝑓𝑓 and substituting it
into Eq. 3-8, which yields
σd = 0.53Es ��0.22σmax
78 Es
18
v2ρs�mpmf
+1��
83
− 2�0.22σmax
78 Es
18
v2ρs�mpmf
+1��
73
+ �0.22σmax
78 Es
18
v2ρs�mpmf
+1��2
� (3-9)
Recalling that 𝜎𝜎𝑑𝑑 is set equal to 𝜎𝜎𝑚𝑚𝑚𝑚𝑚𝑚, we can vary 𝐸𝐸𝑠𝑠 and 𝜌𝜌𝑠𝑠 (while keeping 𝑚𝑚𝑝𝑝, 𝑣𝑣, and 𝜎𝜎𝑚𝑚𝑚𝑚𝑚𝑚
constant) to find their proportional (∝) influence on 𝑚𝑚𝑓𝑓:
mf ∝ 105.3Es−0.729ρs − 3.697e8Es−1.464 (3-10)
This is depicted in Figure 3-2 over the range of 890 < 𝜌𝜌𝑠𝑠 < 2300 𝑘𝑘𝑘𝑘𝑚𝑚3 and 0.6 < 𝐸𝐸𝑠𝑠 < 9 𝐺𝐺𝐺𝐺𝑎𝑎,
wherein typical engineering polymers lie.

20
(a) (b)
Figure 3-2: (a) Models (R²>0.99 for all) of the relationship between 𝒎𝒎𝒇𝒇 and 𝝆𝝆𝒔𝒔 in Eq. 3-9 over the range of polymer 𝑬𝑬𝒔𝒔 values. The relationship at each value of 𝑬𝑬𝒔𝒔 takes the form 𝒎𝒎𝒇𝒇 = 𝒂𝒂𝝆𝝆𝒔𝒔 + 𝒃𝒃, where the coefficients 𝒂𝒂 and 𝒃𝒃 are functions of 𝑬𝑬𝒔𝒔. (b) Power models (R²=0.99) of coefficients 𝒂𝒂 and 𝒃𝒃 as functions of 𝑬𝑬𝒔𝒔, used in Eq. 3-10.
Examining the right hand side of Eq. 3-10, we find that the second term
(3.697𝑒𝑒8𝐸𝐸𝑠𝑠−1.464) has a very small effect on 𝑚𝑚𝑓𝑓 (change of 0.002-0.05 g over the full range of
𝐸𝐸𝑠𝑠) compared to that of the first term (105.3𝐸𝐸𝑠𝑠−0.729𝜌𝜌𝑠𝑠, which generates a change in 𝑚𝑚𝑓𝑓 from 8-
97 g over the full ranges of 𝐸𝐸𝑠𝑠 and 𝜌𝜌𝑠𝑠). As such, this first term alone is a good representation of
the influence 𝐸𝐸𝑠𝑠 and 𝜌𝜌𝑠𝑠 have on 𝑚𝑚𝑓𝑓 over the space of interest. Neglecting this second term and
dropping the constant on the first, we can invert what remains on both sides of Eq. 3-10 to
establish a mass-minimizing material index (𝑀𝑀𝑚𝑚):
1mf
∝ Es0.729
ρs= Mm (3-11)
When maximized, this index helps to find the material with the minimum mass required
to absorb a specified amount of impact energy. Since this material index is a function of only
Young’s modulus and density of the solid (unfoamed) material, it can be utilized to compare all

21
polymers used to produce flexible foams. This is depicted graphically in Figure 3-3 on a typical
Ashby plot (created using MATLAB software). Ashby charts show solid material envelopes
(representing the full range of achievable properties) on axes of various engineering material
properties [42]. Figure 3-3 and Figure 3-4 show only polymer envelopes, mapped on axes of
solid density and solid Young’s modulus (the constituents of the material index), with dashed
lines representing values of the derived material index (Eq. 3-11). All materials along the slope
of this line will have the same ratio of 𝐸𝐸𝑠𝑠0.729
𝜌𝜌𝑠𝑠 and are therefore equally effective at minimizing a
foam pad’s mass for a set energy absorption capacity. Since 𝑀𝑀𝑚𝑚 is independent of design
requirements, it would appear that the polymer with the highest value of 𝐸𝐸𝑠𝑠0.729
𝜌𝜌𝑠𝑠 should be used for
all energy absorbing applications seeking to minimize mass. However, the exact material choice
and its foamed density will be limited by considering the entire set of design scenario constraints.
3.4.2 Mass-Minimizing Material Selection
The material search should now be narrowed by enforcing constraints. The first of these
is that only polymers that can be foamed to flexible open-cell structures may be considered.
Figure 3-3 shows many polymers that can be foamed into closed-cell or plastic foams that may
not be considered since they are out of the scope covered by this material index (due to the
assumption of Euler buckling during plateau strain). Next we must enforce the constraints on
maximum allowable stress and relative density (0.01 < 𝜌𝜌𝑓𝑓𝜌𝜌𝑠𝑠
< 0.3; again, due to the Euler
buckling assumption). The feasibility of a mass-minimizing material (determined by 𝑀𝑀𝑚𝑚) with
respect to these constraints is first verified by ensuring that the solid polymer’s compressive
yield strength is higher than 𝜎𝜎𝑚𝑚𝑚𝑚𝑚𝑚. Then, 𝐸𝐸𝑠𝑠 is substituted into Eq. 3-8 with the application-

22
Figure 3-3: Ashby chart showing full range of polymer envelopes, fit on axes of solid Young’s modulus and solid density. The derived material index 𝑴𝑴𝒎𝒎 is plotted twice: at the bottom for reference and at the top to show materials that require the least mass to absorb a set amount of energy.
defined 𝜎𝜎𝑚𝑚𝑚𝑚𝑚𝑚, solving numerically for the relative density, 𝜌𝜌𝑓𝑓𝜌𝜌𝑠𝑠
. If this yields a relative density
outside of the constraints, the material being evaluated is unacceptable for the design. At this
point, the material with the next highest value of 𝑀𝑀𝑚𝑚 and a different Young’s modulus (higher if
𝜌𝜌𝑓𝑓𝜌𝜌𝑠𝑠
> 0.3 and lower if 𝜌𝜌𝑓𝑓𝜌𝜌𝑠𝑠
< 0.01) should be tried. Following this process, Figure 3-5 was
populated with the dominant mass-minimizing material envelopes from the Ashby chart in
Figure 3-4. It shows the ranges of 𝜎𝜎𝑚𝑚𝑚𝑚𝑚𝑚 and 𝜌𝜌𝑓𝑓𝜌𝜌𝑠𝑠
over which each dominant material can be

23
Figure 3-4: Inset of Figure 3-3, showing material envelopes with the highest values of 𝑴𝑴𝒎𝒎.
foamed in order to meet the design requirements at a mass lower than other polymers can
achieve.
Once the optimal material envelope that satisfies these constraints is selected using
Figure 3-5, a particular relative density can be chosen from its shaded area. Preference should be
given to the lower relative densities, since they will reduce the foam’s mass (but require stiffer
variations of that material). This material’s relative density can now be substituted into Eq. 3-8
with 𝜎𝜎𝑚𝑚𝑚𝑚𝑚𝑚 to solve for the required solid Young’s modulus, 𝐸𝐸𝑠𝑠. Finally, the required foamed

24
density can be found by substituting the material’s 𝜌𝜌𝑠𝑠 (at the specified 𝐸𝐸𝑠𝑠) into the definition of
relative density, 𝜌𝜌𝑓𝑓𝜌𝜌𝑠𝑠
.
Figure 3-5: Ranges of dominance of top-performing materials (with their required relative densities) to minimize mass of a foam pad as a function of 𝝈𝝈𝒎𝒎𝒂𝒂𝒎𝒎. Only polymers from Figure 3-4 are shown, though some materials from Figure 3-3 with lower Young’s moduli will dominate in applications requiring a very small 𝝈𝝈𝒎𝒎𝒂𝒂𝒎𝒎.

25
3.4.3 Cost-Minimizing Material Index
Extracting an index to minimize cost of foam can be done using the previously derived
equations for minimizing mass. Consider that the relative material cost of a foam pad (𝐶𝐶) can be
expressed as
𝐶𝐶 = 𝐶𝐶𝑚𝑚𝑚𝑚𝑓𝑓 (3-12)
where 𝐶𝐶𝑚𝑚 is relative material cost per unit of mass. Rearranging this to a form conducive to
minimizing cost yields
1C
= 1Cmmf
(3-13)
which can be combined with Eq. 3-11 to extract a cost-minimizing material index (𝑀𝑀𝑐𝑐):
1C
∝ Es0.729
Cmρs= Mc (3-14)
This material index identifies the materials that fulfill energy absorption requirements while
minimizing material cost. It is similar to that of minimizing mass, but is multiplied by the
constant 𝐶𝐶𝑚𝑚 in the denominator. This keeps the slopes for the two selection lines the same, but
changes the x-axis of the Ashby plot to include relative cost, as shown in Figures 3-6 and 3-7.
3.4.4 Cost-Minimizing Material Selection
Following the process used for selecting mass-minimizing materials, constraints must be
enforced to narrow the material search for cost-minimizing foams. Ensuring that only polymers
capable of being foamed into open-cell flexible structures are being considered, Figure 3-8 can
be used to choose the dominant cost-minimizing material and its foamed density for a wide range
of maximum allowable stresses.

26
Figure 3-6: Ashby chart showing polymer envelopes fit on axes of solid Young’s modulus and relative material cost*solid density. The derived material index 𝑴𝑴𝒄𝒄 is plotted twice: at the bottom for reference and at the top to show materials that require the smallest material cost to absorb a set amount of energy.
Discussion
Depending upon the particular maximum allowable stress requirement, the top-
performing polymers at minimizing foamed mass are thermoset polyester, phenolic,
polyoxymethylene (POM), polystyrene (PS), acrylonitrile butadiene styrene (ABS),
polypropylene (PP), polyethylene (PE), and elastomers (at very low maximum allowable
stresses). These same polymers (with the exception of ABS) hold the best performance for
minimizing material cost.

27
Figure 3-7: Inset of Figure 3-6, showing material envelopes with the highest values of 𝑴𝑴𝒄𝒄.
There are some limitations to the approach taken in this methodology. Among these is the
assumption that these polymers can be manufactured to reach all values of 𝐸𝐸𝑠𝑠 and 𝜌𝜌𝑠𝑠 in their
elliptical envelope as shown in the Ashby plots (Figures 3-3, 3-4, 3-6, and 3-7). On top of this,
we assume that they can be foamed to a relative density as low as 0.01 over that entire envelope
(while maintaining a flexible open-cell structure). Though some materials shown in the Ashby
plots are currently unable to satisfy these assumptions, materials and processes continue to
develop to make this possible. In practice, this methodology can be followed with fewer discrete
material choices, plotted as points on the Ashby charts, but doing so will limit the foam’s mass

28
Figure 3-8: Ranges of dominance of top-performing materials (with their required relative densities) to minimize material cost of a foam pad as a function of 𝝈𝝈𝒎𝒎𝒂𝒂𝒎𝒎. Only polymers from Figure 3-7 are shown, though some materials from Figure 3-6 with lower Young’s moduli will dominate in applications requiring a very small 𝝈𝝈𝒎𝒎𝒂𝒂𝒎𝒎.
or cost-minimizing potential. Another limitation is that the equation for the energy absorption
capacity of a flexible open-cell foam material (Eq. 3-1, derived by Maiti et al.) only accounts for
energy absorption through buckling of the cell walls. It disregards energy absorption through
fluid losses in the open-cell network, which may become non-negligible near densification stress,
depending upon deformation rate [114]. Energy absorption through such means may vary by
material, and thus change the derived material indices.

29
3.5.1 Case Study
To illustrate this foam selection method, let us design a foam pad for the top of a football
helmet, minimizing its mass. Suppose that an existing helmet design requires the top pad to have
a specified two-dimensional shape, with a cross-sectional area of 180 cm². This pad must absorb
the energy of a player with an equivalent mass of 80 kg as he runs head-on into a perfectly rigid
object (with no rotation during impact) at 0.75 m/s, all while keeping the stress on his head
below a threshold level. Broglio et al. report severe observed impact forces to the top of a helmet
in excess of 3.96 kN among high school athletes [108]. Dividing this force by the pad area, we
will designate the maximum allowable stress on the top of the head to be 220 kPa. Introducing a
safety factor of 1.1, this maximum allowable stress reduces to 200 kPa. At this stress, Figure 3-5
shows thermoset polyester to be the best choice for minimizing foam mass. This maximum
allowable stress is well below the compressive yield stress of this material. A closer inspection of
Figure 3-5 shows that thermoset polyester dominates when the relative density is between 0.0125
and 0.0145. Substituting these values into Eq. 3-8, the solid Young’s modulus of the particular
polyester used must lie between 3.14 and 4.1 GPa. Let us assume that two polyester material
options are available in this range, with solid Young’s moduli of 4 and 3.3 GPa and respective
solid densities of 1100 and 1050 kg/m³. To minimize mass, the stiffer option is selected. This 𝐸𝐸𝑠𝑠
can now be substituted back into Eq. 3-8, which determines the required relative density of the
material of 0.0127. Multiplying this by its solid density gives a foamed density of 13.97 kg/m³.
Substituting this foamed density along with the player’s mass and speed, solid material’s
Young’s modulus, and maximum allowable stress into Eq. 3-5 yields a minimized foam pad
mass of 4.2 g. Finally, Eq. 3-4 determines that this material design requires a foam pad thickness
of 1.7 cm, which is thinner than existing top pads in football helmets. Compare this to a few

30
materials traditionally used in football helmets; for this design scenario, polypropylene and
polyethylene pads require a mass of at least 11.1 and 20.0 g and thickness of 3.6 and 4.0 cm,
respectively.
Conclusion
The methodology presented in this paper helps engineers to select and design foam for a
particular application based on energy absorption requirements, while minimizing mass or cost.
Current foam selection methods are inefficient, since they lack an analytical approach to
determine the energy absorption capacity of foam materials. This paper develops material indices
that allow the energy absorption of different flexible foam materials to be compared. Material
indices for minimizing foam mass and cost are derived by combining results from Maiti et al. on
foam energy absorption with Ashby’s material selection methodology. This process not only
facilitates the selection of a foam’s base material, but also its particular Young’s modulus,
foamed density, and thickness for the specific design. This method can be implemented in many
applications using flexible foams for energy absorption, including helmets, packaging, and
various forms of athletic and safety equipment.
The study focuses primarily on flexible foams, which can elastically deform to absorb
repeated impacts without experiencing permanent deformation. However, for other applications,
such as bicycle helmets, the energy absorption of plastically deforming foams may be of
interest. Future studies could apply the same approach used in this paper to determine equivalent
materials selection methods for plastic foams. Further research might additionally consider the
energy absorption due to fluid losses and its dependency on strain rate. This work also considers
only single-polymer foams, though the design space can be enlarged by adding material

31
envelopes representing hybrid foams. Finally, for minimizing foam cost, this paper only
compares the cost of solid materials. Future work can be done to quantify and compare the
manufacturing costs required to foam solid materials to various relative densities, which can
better represent overall costs.
Acknowledgements
This work was funded by the National Science Foundation [grant number CMMI
1538447] and related REU supplements. This paper represents work done by students of the
Brigham Young University Mechanical Engineering Department’s Design and Materials
Applications class over the last three years. The authors would like to specifically thank Parker
Rosquist, Cory Newton, and David Wood for their contributions to the methods presented in this
work.

33
4 EFFECT OF ENVIRONMENTAL AND MATERIAL FACTORS ON THE
RESPONSE OF NANOCOMPOSITE FOAM IMPACT SENSORS
Abstract
Nanocomposite foam (NCF) is a multifunctional material that can be used to measure
impact. Interactions between the flexible polymer matrix and conductive particles dispersed
throughout it produce a voltage signal under dynamic strain, which correlates to the magnitude
of impact. Though promising in applications requiring both impact sensing and energy
absorption, NCF’s voltage response has been observed to suffer from significant signal drift.
This paper investigates several causes of variance in the response of NCF sensors to consistent
impacts. These effects can be classified into three general types: recoverable transient effects
(such as those relating to viscoelasticity or capacitive charging), environmental drift (due to
humidity and temperature), and permanent signal decay from material degradation. The
motivation for the study arises from various potential repeat-impact applications where periodic
recalibration of the sensor would be difficult (such as a gait-tracking insole in use for a marathon
event). A cyclic drop testing machine was used to apply consistent impacts to NCF, and drift
resulting from each factor (in ranges typical of an insole environment) was experimentally
isolated. Models representing each factor’s contribution to signal drift are presented. Of the
factors investigated, humidity and temperature caused the most significant drift, with permanent
material degradation accounting for only minor decay in voltage response. Transient effects were

34
also observed, with a characteristic ‘warm-up’ (or ‘charging’) time required for the NCF to
achieve steady-state; this phenomenon, and the related ‘recovery’ time for the material to return
to its original state, were determined. The resultant data can be leveraged to implement a
correction algorithm or other drift-compensating method to retain an NCF sensor’s accuracy in
both long and short data collection scenarios.
Keywords
signal drift, multifunctional, self-sensing, foam, impact, nanocomposite
Introduction
Multifunctional materials are sought after in all areas of engineering as humankind’s
desire to monitor the world around it increases dramatically. The ability of modern materials to
self-sense their own condition eliminates the need for arrays of expensive sensors. One such
material is nanocomposite foam (NCF; Figure 4-1), a relatively new material that delivers impact
sensing capabilities. The general material is comprised of a flexible polymeric foam matrix,
embedded with nano and micro-scale particles that induce charge separation during impact, and
form a network for transferring the charge to embedded probes. The specific foam studied in this
paper involves a polyurethane foam matrix, embedded with 2 types of nickel-based additives:
nickel-coated carbon fiber (micro-scale) and nickel powder (nano-scale). Upon deformation from
impact, interactions between these additives and the surrounding foam matrix produce a distinct
voltage response (Figure 4-2). Previous work has determined this response to be related to the
magnitude of impact applied to the sensor [80, 115, 116]. This quasi-piezoelectric effect can be
harnessed to measure impact directly from a component that imparts energy-absorbing and
cushioning properties. Certain NCF characteristics (such as foamed density, matrix material, and

35
geometry) can be engineered to reach the mechanical performance required by a wide range of
applications. To date, applications include self-sensing shoe insoles [116], football helmet pads
[81], and health-monitoring bushings/pads for machine mounts [80].
Figure 4-1: NCF sensor (1 x 2 x 0.15 inches (25 x 51 x 4 mm)), with embedded aluminum-masked PET film for collecting the voltage signal under impact.
Despite its advantages, there are challenges associated with the adoption of NCF in
sensing systems; not the least of these is signal drift. The magnitude of NCF’s voltage response
has been observed to systematically change with repeated impacts under identical loading
conditions (Figure 4-3). This drift takes three general forms, which we will label transient
effects, environmental drift, and signal decay. Transient effects dominate the sensor’s response
for a short time (less than 15 minutes) when impacts are first applied during a period of
continuous use. This is caused by the time-recoverable changes in the sensing material (such as

36
Figure 4-2: An NCF sensor’s raw voltage signal corresponding to two consecutive and identical impacts. The large (~0.31 V) voltage spikes reflect initial impact while the smaller (~0.05 V) spikes reflect the removal of the weight that was dropped to apply impacts. Data was gathered at 1030 Hz with a custom-built microcontroller. Due to limitations in the data acquisition system, the negative voltage signal is aliased and railed out at -0.3 V; thus, it is disregarded in the analyses for all tests.
mechanical hysteresis or capacitive charging) when it transitions from a state of rest to being
cyclically impacted. After this transient period, the signal stabilizes and is mildly affected by the
other two types of drift. Environmental drift is reversible and follows the humidity and
temperature within the sensor. Signal decay causes a permanent decrease in the voltage response,
as more impacts are applied to the sensor throughout its life. Unless compensated for, all of these
forms of drift decrease an NCF sensor’s accuracy in use. Signal drift has proved to be a common
problem among similar polymer-based sensing materials; it has been attributed to various causes,
including mechanical hysteresis [117-120], creep [121], material degradation [117, 120],
temperature [88, 122, 123], humidity/water absorption [119, 124], and chemical interactions

37
Figure 4-3: Drift in an NCF sensor’s signal (peak voltage/impact) while under a consistent cyclic impacting regime (impacts applied at 0.93 Hz). Voltage peaks increase dramatically in the transient section (shown in the inset), following a power-law trend. This continues up to the ‘rise time’ (about 10 minutes in this case) where the signal reaches a steady-state peak voltage. From here, the signal experiences minor drift for the remainder of the 5-hour testing session.
[125]. Though these sensing materials (and their output signals) are permanently affected by
some of these factors (e.g., creep), they can completely recover from the influence of others (e.g.,
hysteresis). In order for NCF sensors to retain accuracy through both long-term and repeated
short-term measurements, signal drift resulting from all of these factors must be characterized
and compensated for.

38
This paper focuses on characterizing signal drift in NCF sensors to facilitate their
adoption as various impact sensors, an example being gait-sensing shoe insoles [116]. Factors
most likely to cause signal drift in such an application were explicitly investigated, including
sensor rest time, humidity, temperature, and material degradation. Tests were conducted to
isolate these drift effects on NCF sensors while applying consistent impacts using a cyclic
impacting mechanism. Mathematical models characterizing drift specific to each factor are
reported. Results are interpreted using both electrical and mechanical perspectives to investigate
the possible mechanisms causing drift. Finally, possible drift-compensation methods and other
future work are outlined.
Methods
NCF sensors (provided by Nano Composite Products, Inc.) were made in a foam
manufacturing facility (Rogers Corporation, Rogers, CT) by combining a polyurethane polyol
base with nickel-coated carbon fiber (1-mm chopped, 3wt%) and nickel powder (Novamet,
15wt%). This was stirred until the conductive particles were well-dispersed before adding
isocyanate to initiate the cross-linking reaction. While curing, the mixture was cast onto both
sides of a thin aluminum-masked PET film. Once cured, individual sensors were cut from this
foam sheet to a size of 1 x 2 x 0.15 inches (25 x 51 x 4 mm). A small tab of the conductive film
was left exposed as a medium to collect the voltage signal from the sensor (Figure 4-1).
Experimentation was performed by impacting these sensors with a custom-built cyclic
drop testing machine (Figure 4-4). This machine was designed to simulate the loading and
environmental conditions an NCF sensor might experience as a running shoe insole or other
impact sensor. It is powered by a DC motor that rotates a pair of snail cams, forcing a weight

39
carriage and drop head (with a combined mass of 450 g) to rise 0.48 inches (12 mm) and then
freely drop onto the sensor beneath. This relatively low level of impact was chosen because it
produces a peak voltage (about 0.3 V) similar to those observed in identical NCF sensors as they
measure human walking and running impacts [116]. The weight carriage rests atop the sensor for
about 70% of the loading cycle until being raised by the cams in preparation for the next drop,
similar to a running/walking loading pattern [126, 127]. The machine is capable of applying
impacts at frequencies up to about 2.5 Hz, but all testing was done at 0.86-0.93 Hz to simulate a
typical step frequency (per foot) while walking [128]. Figure 4-5 shows the acceleration data
resulting from this impacting regime, which was gathered by an accelerometer (Vernier 25-g
Accelerometer, connected to a LabQuest®2 data collection module) mounted to the drop
carriage. This data is used to validate the consistency of applied impacts; this allows any
systematic deviations in the NCF sensor’s voltage signal to be attributed to signal drift. The
entire machine is encased in a clear acrylic box to isolate it from the surrounding environment.
Different temperatures and humidities were applied to the system with a heat gun and humidifier
through a gap under the box. Tests were performed through the full range of steady-state
temperatures and humidities that could safely be applied to the system (21.5-31°C (70.7-87.8°F)
and 33-87% RH, respectively).
NCF sensors were placed between nylon blocks to electrically isolate them from the
surrounding machine. The voltage response from the sensor was measured at 1030 Hz using a
custom-built microcontroller (also provided by Nano Composite Products, Inc.). The conductive
film between the two foam layers of the sensor was used to detect voltages generated during
impacts. A tab on this film extending beyond the foam was connected to the microcontroller’s
analog input channel via an alligator clip.

40
Figure 4-4: NCF sensor (1) positioned between electrically-insulating nylon blocks (2) to sense impacts from a cyclic drop testing machine. Voltage data was collected through an alligator clip, connecting the NCF sensor’s conductive film (3) to an A/D channel of a custom-built microcontroller (not shown). Acceleration data was gathered through an accelerometer (4), mounted to the front of the weight carriage (5). Temperature data was collected through a thermocouple (6) inserted between underside of NCF sensor and bottom nylon block. Humidity data was gathered through a hygrometer probe (7) situated near the sensor. The entire system is encased in an acrylic box to allow temperature and humidity control.

41
Figure 4-5: Raw vertical acceleration data gathered from an accelerometer rigidly mounted onto the weight carriage of the cyclic drop testing machine. The first eight drops of a typical impacting test are shown. Similar to the NCF sensor voltage signal, there are large spikes (~215 m/s/s) reflecting the impacts and smaller ones (~35 m/s/s) corresponding to the weight carriage being lifted off of the sensor. Data was gathered at 10 kHz.
4.4.1 Experimental Protocol
4.4.1.1 Transient Effects
Recoverable drift effects were isolated by repeating the same impacting test on the same
NCF sensor, varying rest time between tests. The purpose of this experiment was to determine
the portion of signal drift that could be recovered as the sensor was allowed to recover from
impact-induced strains. For each test, the sensor was cyclically impacted for 10 mins (long

42
enough to reach a steady-state voltage response) following the previously described impacting
regime, at an impact frequency of 0.86 Hz. Nine different rest times were explicitly tested in the
range of 1.5 minutes to 64 hours. During rest, the sensor was left in position on the cyclic drop
testing machine, with the weight of the carriage resting atop it. This series of tests was repeated
with the carriage weight lifted off the sensor during rest, and no significant difference was found
in the recovery characteristics between the two variations.
Tests were also run to investigate the effect of impact magnitude (speed and mass) on
transient drift. Impact speed was varied using nylon blocks of different thicknesses, stacked on
top of the NCF sensor to adjust drop height. To determine impact speed, the potential energy at
these drop heights was assumed to be entirely converted to kinetic energy at the sensor height
(i.e. assuming negligible friction losses during freefall). Mass was adjusted by adding small steel
weights to the carriage, rigidly attached with nuts and bolts. Tests were performed at five
different impact speeds (0.327-0.595 m/s) while holding mass constant, and five masses (0.45-
0.88 kg) while holding impact speed constant. The NCF sensor was allowed at least 22 hours of
rest before applying impacts (for 10 minutes) in this series of tests. Temperature, humidity, and
acceleration data were gathered and found to be consistent across all transient effect trials.
4.4.1.2 Environmental Drift: Humidity
Humidity was applied to the NCF sensor via a humidifier (Honeywell MistMate™
HUL520P) routed into the acrylic box. Humidity measurements were made by an Omega® RH-
201 hygrometer probe placed inside, near the NCF sensor. Though this probe is not embedded in
the NCF sensor, its measurements reflect the humidity inside the foam’s cellular structure within
a few seconds (Figure 4-6). Under static conditions, the water content in air can take significant

43
time to permeate a polyurethane foam’s open-cell network and reach a steady-state concentration
[129]; however, as the sensor is cyclically impacted, air is forced to circulate through it and a
steady-state humidity is reached much faster. For each data collection, the sensor was allowed to
rest for at least 22 hours before the ten-minute impacting regime was started. Testing was
performed at 15 humidity levels in the range of 35-90% RH, reflecting the widest possible range
of atmospheric conditions (specifically favoring higher humidities to simulate the elevated
moisture content in shoes during various exercises) [130]. To eliminate the confounding effect of
permanent damage to the sensor’s conductive film during testing (due to either oxidation of the
aluminum masking or physical wear), the order of individual tests was randomized. Temperature
and impact acceleration data were also gathered and found to be consistent across all tests.
4.4.1.3 Environmental Drift: Temperature
For temperature tests, heat was applied to the interior of the acrylic box until it reached a
steady-state temperature, whereupon impacts were applied at 0.86 Hz for 10 minutes (sufficient
to reach a steady-state voltage signal). Five different temperatures in the widest feasible range of
21.5-31°C (70.7-87.8°F) were applied to the system, reflecting the slightly elevated temperatures
of the foot and insole during walking [131, 132]. Temperature was measured using a
thermocouple, mounted between the underside of the NCF sensor and the nylon block beneath it.
This data was collected at 5 Hz through a National Instruments™ LabVIEW DAQ system for
each entire test to ensure a steady-state temperature was maintained. The order of individual tests
was randomized and the NCF sensor was allowed at least 22 hours of rest time before each test.
Impact accelerations were monitored for all tests and shown to be consistent. Humidity was
significantly affected as temperatures were varied in the system, so the voltage signal was

44
Figure 4-6: Data showing an NCF sensor’s response time to changes in humidity. A sensor was impacted at room humidity until it reached a steady-state. At 65 seconds, the humidifier (routed into the acrylic box) was turned on at maximum output. The NCF sensor took about four impacts (4 seconds) beyond the time of the hygrometer to respond to the humidity change.
normalized to represent a constant humidity, using a model generated from the humidity test
results.
4.4.1.4 Signal Decay Due to Material Degradation
Material degradation testing involved impacting two new (never before impacted) NCF
sensors 300,000 times, simulating a typical number of steps in the lifetime of a running shoe
(derived using 750 foot strikes per kilometer from Taunton et al. [133] and a typical life of 500

45
miles per shoe, per manufacturer recommendations). This experiment was designed to isolate
temporary drift effects from the various forms of permanent material degradation that could
cause damage as more impacts are applied to the sensor, including plastic deformation (from
foam densification), fatigue, the Mullins effect, as well as damage to the embedded fibers or
conductive film [114, 117, 120, 124]. Tests were performed following the same consistent
impacting regime (at 0.93 Hz) in thirteen 7-hour long sessions (total of 23,000 impacts per
session), allowing at least 22 hours between tests to overcome temporary material rest time
effects. Temperature, humidity, and impact accelerations were monitored across all tests. Impact
acceleration and temperature were found to be consistent, but there were significant changes in
the ambient humidity over such long testing periods. The peak voltage signal was again
normalized to a constant value of humidity, to isolate material degradation-related signal decay
from environmental drift.
Results and Discussion
4.5.1 Transient Effects
Other factors kept constant, a sensor’s rest time was shown to have a dramatic effect on
its transient response (Figure 4-7). If the sensor is rested for a long period following any usage,
the initial peak voltage per impact is very small, requiring several impacts to rise to a steady
signal. Conversely, after resting for a short time, a sensor starts with a relatively high peak
voltage signal that can quickly rise to the steady response. Across all tests, the signal reached a
comparable steady-state peak voltage (0.34-0.38 V), independent of rest time.

46
Figure 4-7: Effect of rest time, following a previous impact test, on transient voltage response under a consistent impacting regime. Best fit curves (using power and exponential models) of the peak voltage per impact are plotted for each rest time. A similar steady-state peak voltage (about 0.36 V) was reached in all tests, independent of rest time. Resting the NCF sensor for the shortest time (1.5 minutes) caused the signal to start at the steady-state peak voltage, whereas the longest rest (64 hours) caused it to start from 0 volts, thus taking a maximum time to reach steady-state.
Using the data from Figure 4-7, the relationship between sensor rest time and rise time
(time required to reach 90% of the steady-state peak voltage magnitude) was extracted (Figure
4-8). Impacts that follow a short rest time (≤ 3mins) result in a peak voltage that is 90% of the
steady-state value at the first impact. Conversely, impacts that follow long rest times (estimated
to be greater than 8 hours from Figure 4-8) result in almost zero volts from the initial impact,
followed by a 90% rise time of about 5.4 minutes.
Figures 4-7 and 4-8 represent tests of impacts with a constant energy (0.11 J). When the
impact energy is varied, the rate that the voltage recovers and reaches steady-state values

47
changes dramatically. Figure 4-9 represents data from sensors that have been rested for more
than 8 hours, and are then impacted in a cyclic manner at different energy levels. The data shows
that for larger impact-sensing applications, the transient effects are overcome more quickly once
impacts are applied. However, the peak voltage in these tests always started from almost 0 volts
at the first impact (compared to short rest times, which start near steady-state), suggesting that
the rise time is non-zero even for higher impact; i.e. more than one impact is required for the
sensor voltage to reach steady-state values, at least for the range of impact energies tested here.
Hence, although rise time decreases with larger impacts, some number of impacts must still be
applied to the sensor after a long rest to ‘warm-up’ to a steady-state voltage signal.
The results in Figures 4-7 through 4-9 are considered from both mechanical and electrical
perspectives, in an attempt to explain the cause of these dramatic transient effects. Both
perspectives assume the same triboelectric charging mechanism as a basic explanation for the
quasi-piezoelectric voltage response. This mechanism suggests that under dynamic strain, nickel-
coated carbon fibers rub against the surrounding polyurethane matrix; the large difference in
stiffness between the two materials maximizes friction at their interfaces, and their opposing
triboelectric affinities translates that friction into electric charge accumulation [134, 135].
The mechanical perspective suggests that increasing global strain on an NCF sensor will
increase the measured voltage signal. This is caused by the increased contact (in both amount
and rate) of local matrix/fiber interfaces and number of those sites engaged to generate charge
within the sensor [134-136]. Considering these triboelectric interactions with the foam’s
viscoelastic effects, it is apparent that global strain (and strain rate) may change as a test
progresses, even though consistent cyclic impacts are applied to the sensor [90, 137-139]. If the
polyurethane’s relaxation time (time required to return from a strained to unstrained state) is

48
Figure 4-8: Piecewise function fitting sensor rest time against rise time (time to reach 90% of steady-state peak voltage per impact). Below about 3 minutes of rest, the NCF sensor instantly reaches a near steady-state peak voltage signal once impacts are applied. From rest times between 3 and 500 minutes (8 hours), the required 90% rise time logarithmically increases from 0 to the upper bound of 5.4 minutes.
greater than the time allowed by the testing mechanism between impacts, maximum strain per
cycle will increase with successive impacts. Assuming that this global strain directly influences
charge generation at the triboelectric sites, this could cause a net effect of higher peak voltages as
repeated impacts increase the time-averaged deformation until the peak deformation and voltage
signal reach a steady-state. This mechanical perspective also suggests that higher strains force
conductive particles within the foam matrix (both nickel-coated carbon fiber and nickel powder)
closer together. This decreases the sensor’s effective electrical resistance, allowing charge

49
Figure 4-9: Effect of impact energy on transient voltage rise time (R²=0.756) under consistent impacting regimes.
generated at more triboelectric sites to flow to the data collection device [83].
However, slow-motion video data indicates that the foam has adequate time to fully
recover, from a mechanical perspective. During impact, the sensor exhibits an underdamped
strain response; strain reaches a maximum almost instantaneously (3 ms) after initial contact,
following which it visibly oscillates until reaching a steady-state (reflecting the static weight of
the carriage). This steady-state is reached 52 ms after initial impact, which is well before the
carriage begins its ascent (over 750 ms later) in preparation for the next cycle. This suggests that
the only residual strain requiring recovery during the 350 ms relaxation period (where the
carriage does not rest on the sensor) is that induced by the carriage’s static weight. The static
carriage induces a force of 8.63 N (considering the maximum carriage mass of 0.88 kg) and

50
corresponding strain of 2.6% (using the sensor’s experimentally derived stiffness of 85.8 kN/m)
to the sensor, which indicates that this deformation is within its linear elastic region (about 0-5%
strain). Deformation through this region is characterized by the bending of cell walls (as opposed
to the more dramatic buckling that occurs in the plateau region) [34]. Though foams can require
significant time to relax from cell wall buckling, strain from bending alone can be overcome
much faster. This suggests that the time required by the foam to overcome the static carriage-
induced strain is even smaller than the 52 ms required to reach a steady-state after impact (where
it recovered from cell wall buckling). Additionally, the sensor’s relaxation time is certainly
shorter than the predicted 8 hours needed to completely reset transient effects (Figure 4-8).
We hypothesize that the dependence of NCF’s transient voltage response on sensor rest
time is predominantly caused by electrical means. This theory suggests that the signal is
dominated by capacitive effects, through a mechanism similar to that of common ferroelectrets.
Ferroelectric sensors are formed by corona charging thin sheets of polymer foams; this polarizes
cells within the foam structure (open or closed-cell), thus creating an electric field [140, 141]. As
the charged foam is mechanically strained, the disrupted electric field creates a measurable
piezoelectric voltage response [140, 141]. Though ferroelectrets are charged externally, NCF is
theorized to self-charge internally as it deforms from impacts, due to triboelectric interactions
between the fillers and matrix. With successive impacts, this charge builds until it reaches a
maximum local threshold (defined by the micro-scale capacitive properties of the matrix and
fibers). After enough impacts, and related charge build-up to the NCF sensor’s capacitive limit,
every test reaches the same steady-state peak voltage magnitude, independent of rest time.
Following this theory, a sensor’s peak voltage during an impact is influenced by the strength of
its internal electric field (which itself is a function of the nature and history of previously applied

51
impacts) and strain forcing changes to that electric field at impact. Even if the sensor from Figure
4-7 was strained similarly for each impact in a given test, this theory suggests that earlier impacts
could have generated smaller peak voltages because the rest time dissipated some of the sensor’s
stored charge, and thus weakened its electric field. Applying this theory to the data in Figure 4-8,
we suggest that the capacitive charge held in a sensor dissipates with rest time, more quickly at
first, then slowly over many hours until all charge is lost. A similar phenomenon is seen in
ferroelectrets, whose piezoelectric coefficient decays with time (mostly in the first few days)
following the initial corona charging [141]. This phenomenon can also explain why increasing
impact magnitude decreases voltage rise time (Figure 4-9); the higher global strain rate
associated with larger impacts increases the local relative rubbing speed between fibers and the
matrix, which may increase the efficiency of triboelectric charge accumulation each impact
[136]. The increase in steady-state peak voltage with larger impacts can be explained by the
sensor’s effective capacitance. Higher speeds and masses induce more global strain and engage
more matrix/fiber triboelectric sites during impact, thus increasing the internal electric field
strength and consequently the steady-state voltage.
4.5.2 Environmental Drift: Humidity
The humidity test data (in Figures 4-10 and 4-11) shows that an NCF sensor’s steady-
state voltage signal drops with increasing humidity. This voltage dependence on humidity has a
very high sensitivity (10 mV/%RH) at lower humidities, up to 63%RH where the signal reaches
a minimum value. This relationship is observed (for the given carriage mass and drop height) to
be given by:

52
35 ≤ %𝑅𝑅𝑅𝑅 < 63 𝑚𝑚𝑣𝑣𝑎𝑎𝑎𝑎𝑚𝑚𝑘𝑘𝑎𝑎 𝑝𝑝𝑎𝑎𝑚𝑚𝑘𝑘 𝑣𝑣𝑡𝑡𝑣𝑣𝑡𝑡𝑚𝑚𝑘𝑘𝑎𝑎𝑖𝑖𝑚𝑚𝑝𝑝𝑚𝑚𝑐𝑐𝑡𝑡
= −0.01 ∗ (%𝑅𝑅𝑅𝑅) + 0.63
%𝑅𝑅𝑅𝑅 ≥ 63 𝑚𝑚𝑣𝑣𝑎𝑎𝑎𝑎𝑚𝑚𝑘𝑘𝑎𝑎 𝑝𝑝𝑎𝑎𝑚𝑚𝑘𝑘 𝑣𝑣𝑡𝑡𝑣𝑣𝑡𝑡𝑚𝑚𝑘𝑘𝑎𝑎𝑖𝑖𝑚𝑚𝑝𝑝𝑚𝑚𝑐𝑐𝑡𝑡
= 0.03 (4-1)
Though the minimum peak voltage signal at high humidities is quite low (0.03 V), it is
still distinguishable from the microcontroller noise (less than 0.01 V) and clearly corresponds
with individual impacts.
Figure 4-10: Influence of humidity on transient voltage response. Raw peak voltages per impact from four of the 14 humidity tests are shown (fit with exponential and power models).
We propose that the same capacitive charging effect responsible for the transient rise
time also helps to explain this humidity-related environmental drift. It is well known that
triboelectric efficiency between materials diminishes with increasing humidity [135, 142]. Once
inside the foam structure, high-humidity air can dissipate charges produced by triboelectric

53
Figure 4-11: Influence of humidity on an NCF sensor’s average steady-state peak voltage per impact. Data is fit to a piecewise function (Eq. 4-1): negative linear from 35 to 63%RH, and constant from 63 to 87%RH.
rubbing that would normally be stored in drier conditions. This causes a net decrease in the
sensor’s effective capacitance, and thus steady-state peak voltage per impact. The critical
humidity of 63%RH corresponds to the maximum level at which the sensor can store charge;
voltage signals from tests above this humidity may have been produced solely by triboelectric
rubbing between the polyurethane foam and conductive film in direct contact with it. This
hypothesis is supported by experimental results comparing peak voltages between NCF and neat
foam under high impact; neat foam generated voltages that were 3-7% of those from NCF
(accounting for the effect of probe surface area), whereas Figure 4-11 shows that peak voltage in
NCF at high humidity is 10% of that in low humidity [143]. Though this is higher than the 3-7%
observed in other tests, the discrepancy may be explained by the higher ratio of probe area to

54
foam volume for sensors tested in this paper. Since the capacitive charging effect is suppressed at
high humidities, this can explain why the 82%RH curve (Figure 4-10) reaches its steady-state
peak voltage at the first impact. Analyzing this data from a mechanical perspective offers little to
help identify the underlying drift mechanism. Though humidity is known to influence the
mechanical response of viscoelastic polymers [144, 145], it has been shown to soften
polyurethane foam at higher levels (by 0.8%/%RH) [146, 147], which should increase both peak
strain (by 0.57%/%RH) and peak voltage per impact (by the same 0.57%/%RH, assuming a
linear relationship between peak strain and peak voltage) [80]. It is likely that this mechanical
effect causes minor drift in the response (in the opposite direction), but it only serves to slightly
weaken the dominating electrical effect.
4.5.3 Environmental Drift: Temperature
For a typical insole environment, temperature was found to have a positive linear effect
on an NCF sensor’s steady-state peak voltage (Figure 4-12). This dependence (Eq. 4-2) has a
moderately high sensitivity (13.5 mV/°C, normalized to 35%RH using Eq. 4-1) over the range
tested.
21.5 ≤ 𝑇𝑇 ≤ 31°𝐶𝐶 𝑚𝑚𝑣𝑣𝑎𝑎𝑎𝑎𝑚𝑚𝑘𝑘𝑎𝑎 𝑝𝑝𝑎𝑎𝑚𝑚𝑘𝑘 𝑣𝑣𝑡𝑡𝑣𝑣𝑡𝑡𝑚𝑚𝑘𝑘𝑎𝑎𝑖𝑖𝑚𝑚𝑝𝑝𝑚𝑚𝑐𝑐𝑡𝑡
(𝑛𝑛𝑛𝑛𝑛𝑛𝑚𝑚𝑎𝑎𝑛𝑛𝑛𝑛𝑛𝑛𝑒𝑒𝑛𝑛 𝑡𝑡𝑛𝑛 35%𝑅𝑅𝑅𝑅) =
0.0135(𝑇𝑇) + 0.12 (4-2)
We attribute the greater portion of this temperature drift to mechanical softening effects.
Increasing the temperature of a viscoelastic polymer is known to decrease its stiffness [138,
144]; Young’s moduli of similar polyurethanes have been shown to linearly decrease by as much
as 3%/°C in this temperature range [148, 149]. Considering that strain is proportional to
𝑠𝑠𝑡𝑡𝑛𝑛𝑠𝑠𝑠𝑠𝑛𝑛𝑒𝑒𝑠𝑠𝑠𝑠 √2⁄ in the linear elastic region (for a set amount of absorbed energy) and there is an

55
approximately linear relationship between strain and voltage in these sensors [80, 81, 115], this
can theoretically induce a voltage sensitivity of 2.12%/°C (compared to the actual 2.9%/°C
average voltage sensitivity shown in Figure 12). This higher strain increases triboelectric rubbing
(by engaging more fiber/matrix contact sites and forcing more friction at each site) and the
conductivity of the network that transports the resultant voltage to the measurement probe. On
top of this mechanical effect, the signal’s response to temperature may be partially attributed to
an electrical mechanism. Multiple sources have reported increased triboelectric charge
accumulation and retention in various materials as they are brought to higher temperatures
Figure 4-12: Positive linear influence (R²=0.871) of temperature on an NCF sensor’s average steady-state peak voltage per impact. This data was normalized to 35%RH (using Eq. 4-1) to isolate the temperature effect from humidity-related drift.
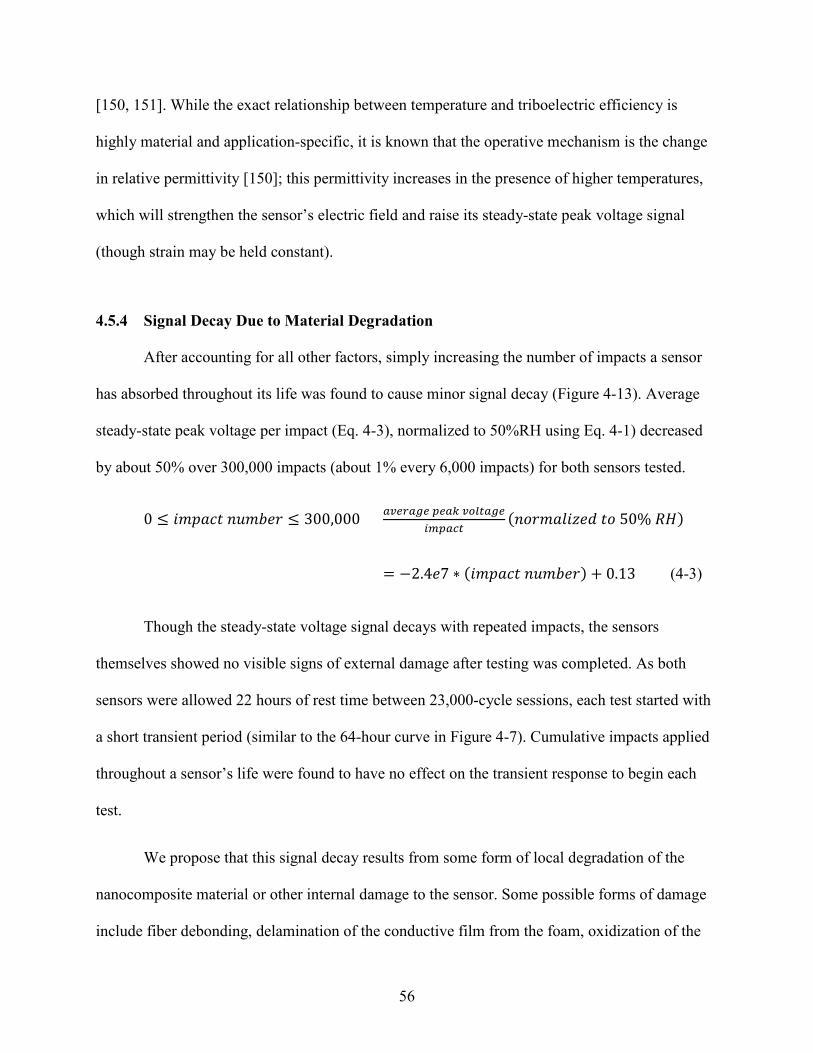
56
[150, 151]. While the exact relationship between temperature and triboelectric efficiency is
highly material and application-specific, it is known that the operative mechanism is the change
in relative permittivity [150]; this permittivity increases in the presence of higher temperatures,
which will strengthen the sensor’s electric field and raise its steady-state peak voltage signal
(though strain may be held constant).
4.5.4 Signal Decay Due to Material Degradation
After accounting for all other factors, simply increasing the number of impacts a sensor
has absorbed throughout its life was found to cause minor signal decay (Figure 4-13). Average
steady-state peak voltage per impact (Eq. 4-3), normalized to 50%RH using Eq. 4-1) decreased
by about 50% over 300,000 impacts (about 1% every 6,000 impacts) for both sensors tested.
0 ≤ 𝑛𝑛𝑚𝑚𝑖𝑖𝑎𝑎𝑖𝑖𝑡𝑡 𝑛𝑛𝑛𝑛𝑚𝑚𝑏𝑏𝑒𝑒𝑛𝑛 ≤ 300,000 𝑚𝑚𝑣𝑣𝑎𝑎𝑎𝑎𝑚𝑚𝑘𝑘𝑎𝑎 𝑝𝑝𝑎𝑎𝑚𝑚𝑘𝑘 𝑣𝑣𝑡𝑡𝑣𝑣𝑡𝑡𝑚𝑚𝑘𝑘𝑎𝑎𝑖𝑖𝑚𝑚𝑝𝑝𝑚𝑚𝑐𝑐𝑡𝑡
(𝑛𝑛𝑛𝑛𝑛𝑛𝑚𝑚𝑎𝑎𝑛𝑛𝑛𝑛𝑛𝑛𝑒𝑒𝑛𝑛 𝑡𝑡𝑛𝑛 50% 𝑅𝑅𝑅𝑅)
= −2.4𝑒𝑒7 ∗ (𝑛𝑛𝑚𝑚𝑖𝑖𝑎𝑎𝑖𝑖𝑡𝑡 𝑛𝑛𝑛𝑛𝑚𝑚𝑏𝑏𝑒𝑒𝑛𝑛) + 0.13 (4-3)
Though the steady-state voltage signal decays with repeated impacts, the sensors
themselves showed no visible signs of external damage after testing was completed. As both
sensors were allowed 22 hours of rest time between 23,000-cycle sessions, each test started with
a short transient period (similar to the 64-hour curve in Figure 4-7). Cumulative impacts applied
throughout a sensor’s life were found to have no effect on the transient response to begin each
test.
We propose that this signal decay results from some form of local degradation of the
nanocomposite material or other internal damage to the sensor. Some possible forms of damage
include fiber debonding, delamination of the conductive film from the foam, oxidization of the

57
aluminum masking on the film (in the interior of the foam), fiber breakage, local foam
densification around fibers, or chipping of the fiber nickel coating. It is unlikely that the foam
itself was globally influenced by fatigue, plastic deformation, or the Mullins effect, since the
sample showed no external damage and the voltage signal corresponding to the first few impacts
was not significantly different from the following 300,000 [117, 120, 124].
Figure 4-13: Linear (R²=0.628) signal decay resulting from material degradation in one of the two NCF sensors tested. This data was normalized to 50%RH (using Eq. 4-1) to isolate material degradation signal decay from the more sensitive humidity drift effect.
Conclusions
NCF has several advantages compared to other impact sensors, but it is subject to signal
drift. In response to cyclic impacting, its voltage signal can be divided into two sections that

58
follow unique drift patterns: the transient response and steady-state signal. While in a simulated
shoe insole or other impact-sensing environment, the transient response was found to be highly
influenced by sensor rest time. Steady-state drift was found to be sensitive to environmental
effects of humidity and temperature, and material degradation (resulting from normal use) was
found to induce slight signal decay. Models of drift as a function of each factor are presented,
with hypotheses on the underlying mechanisms causing it, including triboelectric rubbing,
capacitive charging, and mechanical strain effects. Drift resulting from rest time, humidity, and
temperature (in ranges typical of an impact-sensing application) was found to be recoverable as
time passed and environmental conditions returned to a normal state.
In order to compensate for drift in NCF’s response signal, a few viable options are
available. The first of these is to explicitly sense the factors shown to cause drift [124]. Then,
recalibrated analytical models (similar to those derived in this paper) can be used by a
compensation algorithm to remove drift effects from the signal, either in real time or as a post-
processing step [152, 153]. Another option is to implement a machine learning method.
Currently, only a supervised algorithm (trained with drift models) is feasible; as more sensors are
used and a larger quantity of data becomes available, an unsupervised method may become
practical [154, 155]. Many other methods have been developed to correct signal drift (including
sensor networks [124, 152, 156], reference sensors [124, 157], isolating drift factors [124, 158],
and periodic recalibration [124, 159]) that are impractical and cumbersome to use in typical
applications of NCF sensors.

59
Acknowledgements
This work was supported by funding from the National Science Foundation [grant
number CMMI 1538447] and related REU supplements.

61
5 CONCLUSION
Multifunctional self-sensing foam is a useful material for a wide variety of impact-related
applications. A single material can be engineered to both absorb and measure impacts applied to
it, which can save space and cost while providing unique advantages associated with in situ
components. Whether considering mechanical or electrical performance, successful utilization of
such materials requires their behavior to be properly characterized. This thesis presents results
that help typify each type of response. A theoretical approach was used to derive material indices
based on complicated energy absorption performance requirements. In combination with the
Ashby method, these indices promote selection of a minimized mass or cost-based foam material
design among a wide range of solid polymers. An experimental method was employed to
characterize the quasi-piezoelectric impact-sensing performance of NCF in response to various
environmental conditions, transient effects, and permanent material degradation. Though specific
applications of protective padding in football helmets and gait-tracking shoe insoles are
investigated, the results of these chapters can be applied to various other impact-sensing foam
systems, such as packaging materials, crash test equipment, machine health-monitoring bushings,
and other sports equipment.
The work presented in this thesis can serve as a foundation for various avenues of future
research and application. Chapter 3 develops material indices specific to flexible open-cell foams

62
that are designed to operate within the elastic region of the stress-strain curve. Further research
can be done to develop different material indices for rigid and plastically-deforming foams. Also,
consideration can be given to the effect of fluid losses and strain rate on energy absorption
performance. While Chapter 4 reports a characterization of NCF’s response to environmental
and material factors, future work can be done to develop compensation methods to correct these
various forms of signal drift. Incorporating correction algorithms that are capable of restoring
sensing accuracy in real-time can accommodate NCF sensors to extended-use applications (such
as monitoring how gait changes due to physiological fatigue in a marathon run). The
experimental results also encourage research from a more fundamental scientific perspective.
Discussion of the mechanisms that influence NCF’s electrical response give insight to future
experimentation that can be performed to better understand the quasi-piezoelectric effect and
micro-scale phenomena operating to produce it.

63
REFERENCES
1. Ashby, M.F. and R.M. Medalist, The mechanical properties of cellular solids.
Metallurgical Transactions A, 1983. 14(9): p. 1755-1769.
2. Gibson, L.J., Biomechanics of cellular solids. Journal of biomechanics, 2005. 38(3): p. 377-399.
3. Gibson, L., Mechanical behavior of metallic foams. Annual review of materials science, 2000. 30(1): p. 191-227.
4. Phelan, R., et al., The conductivity of a foam. Journal of Physics: Condensed Matter, 1996. 8(34): p. L475.
5. Dharmasena, K. and H. Wadley, Electrical conductivity of open-cell metal foams. Journal of materials research, 2002. 17(3): p. 625-631.
6. Datye, A.K. and R. Lemlich, Liquid distribution and electrical conductivity in foam. International journal of multiphase flow, 1983. 9(6): p. 627-636.
7. Motlagh, G., A. Hrymak, and M. Thompson, Improved through‐plane electrical conductivity in a carbon‐filled thermoplastic via foaming. Polymer Engineering & Science, 2008. 48(4): p. 687-696.
8. Argin, M. and G. Karady, Characterization of polyurethane foam dielectric strength. IEEE Transactions on Dielectric and Electrical Insulation, 2008. 15(2): p. 350-356.
9. Krause, B., et al., Ultralow-k dielectrics made by supercritical foaming of thin polymer films. Advanced materials, 2002. 14(15): p. 1041-+.
10. Levchik, S.V., Introduction to flame retardancy and polymer flammability. Flame retardant polymer nanocomposites, 2007: p. 1-29.
11. Cleary, T.G. and J.G. Quintiere, Flammability characterization of foam plastics. 1991: National Institute of Standards and Technology, Building and Fire Research Laboratory.
12. Doermann, D. and J. Sacadura, Heat transfer in open cell foam insulation. TRANSACTIONS-AMERICAN SOCIETY OF MECHANICAL ENGINEERS JOURNAL OF HEAT TRANSFER, 1996. 118: p. 88-93.

64
13. Leach, A., The thermal conductivity of foams. I. Models for heat conduction. Journal of Physics D: Applied Physics, 1993. 26(5): p. 733.
14. Lakes, R., Cellular solid structures with unbounded thermal expansion. Journal of materials science letters, 1996. 15(6): p. 475-477.
15. Ashby, M., The properties of foams and lattices. Philosophical Transactions of the Royal Society of London A: Mathematical, Physical and Engineering Sciences, 2006. 364(1838): p. 15-30.
16. Gent, A. and A. Thomas, Mechanics of foamed elastic materials. Rubber Chemistry and Technology, 1963. 36(3): p. 597-610.
17. Simone, A. and L. Gibson, The effects of cell face curvature and corrugations on the stiffness and strength of metallic foams. Acta Materialia, 1998. 46(11): p. 3929-3935.
18. Dement'ev, A. and O. Tarakanov, Effect of cellular structure on the mechanical properties of plastic foams. Mechanics of Composite Materials, 1970. 6(4): p. 519-525.
19. Warren, W. and A. Kraynik, The linear elastic properties of open-cell foams. Journal of Applied Mechanics, 1988. 55(2): p. 341-346.
20. Ibeh, C.C. and M. Bubacz, Current trends in nanocomposite foams. Journal of Cellular Plastics, 2008. 44(6): p. 493-515.
21. Barg, S., et al., Cellular ceramics by direct foaming of emulsified ceramic powder suspensions. Journal of the American Ceramic Society, 2008. 91(9): p. 2823-2829.
22. Thirumal, M., et al., Effect of foam density on the properties of water blown rigid polyurethane foam. Journal of applied polymer science, 2008. 108(3): p. 1810-1817.
23. Kraynik, A.M., Foam structure: From soap froth to solid foams. Mrs Bulletin, 2003. 28(4): p. 275-278.
24. Deshpande, V., M. Ashby, and N. Fleck, Foam topology: bending versus stretching dominated architectures. Acta materialia, 2001. 49(6): p. 1035-1040.
25. Kraynik, A.M., D.A. Reinelt, and F. van Swol, Structure of random foam. Physical Review Letters, 2004. 93(20): p. 208301.
26. Huber, A. and L. Gibson, Anisotropy of foams. Journal of Materials Science, 1988. 23(8): p. 3031-3040.
27. Gibson, L.J. and M.F. Ashby, Cellular solids: structure and properties. 1999: Cambridge university press.

65
28. Brydon, A., et al., Simulation of the densification of real open-celled foam microstructures. Journal of the Mechanics and Physics of Solids, 2005. 53(12): p. 2638-2660.
29. Weaire, D. and M. Fortes, Stress and strain in liquid and solid foams. Advances in Physics, 1994. 43(6): p. 685-738.
30. Scheffler, M. and P. Colombo, Cellular ceramics: structure, manufacturing, properties and applications. 2006: John Wiley & Sons.
31. Ashby, M.F. and T. Lu, Metal foams: a survey. Science in China Series B: Chemistry, 2003. 46(6): p. 521-532.
32. Golovin, I. and H.-R. Sinning, Damping in some cellular metallic materials. Journal of Alloys and Compounds, 2003. 355(1): p. 2-9.
33. Rusch, K., Energy‐absorbing characteristics of foamed polymers. Journal of Applied Polymer Science, 1970. 14(6): p. 1433-1447.
34. Maiti, S., L. Gibson, and M. Ashby, Deformation and energy absorption diagrams for cellular solids. Acta metallurgica, 1984. 32(11): p. 1963-1975.
35. Gibson, L.J. and M.F. Ashby. The mechanics of three-dimensional cellular materials. in Proceedings of the Royal Society of London A: Mathematical, Physical and Engineering Sciences. 1982. The Royal Society.
36. Ramamurty, U. and A. Paul, Variability in mechanical properties of a metal foam. Acta Materialia, 2004. 52(4): p. 869-876.
37. Ashby, M.F., et al., Metal foams: a design guide. 2000: Elsevier.
38. Salimon, A., et al., Potential applications for steel and titanium metal foams. Journal of materials science, 2005. 40(22): p. 5793-5799.
39. Miltz, J. and G. Gruenbaum, Evaluation of cushioning properties of plastic foams from compressive measurements. Polymer Engineering & Science, 1981. 21(15): p. 1010-1014.
40. Ramon, O., S. Mizrahi, and J. Miltz, Mechanical properties and behavior of open cell foams used as cushioning materials. Polymer Engineering & Science, 1990. 30(4): p. 197-201.
41. Kutz, M., Handbook of materials selection. 2002: John Wiley & Sons.
42. Ashby, M.F., Materials Selection in Mechanical Design. 4 ed. 2011: Butterworth-Heinemann.

66
43. Deng, Y.-M. and K. Edwards, The role of materials identification and selection in engineering design. Materials & design, 2007. 28(1): p. 131-139.
44. Murray, G., Handbook of materials selection for engineering applications. 1997: CRC Press.
45. Ashby, M.F., Overview No. 80: On the engineering properties of materials. Acta metallurgica, 1989. 37(5): p. 1273-1293.
46. Ashby*, M.F., Hybrids to fill holes in material property space. Philosophical Magazine, 2005. 85(26-27): p. 3235-3257.
47. Srikar, V. and S.M. Spearing, Materials selection in micromechanical design: an application of the Ashby approach. Journal of Microelectromechanical Systems, 2003. 12(1): p. 3-10.
48. Rashedi, A., I. Sridhar, and K.J. Tseng, Multi-objective material selection for wind turbine blade and tower: Ashby’s approach. Materials & Design, 2012. 37: p. 521-532.
49. Weaver, P. and M. Ashby, The optimal selection of material and section-shape. Journal of Engeering Design, 1996. 7(2): p. 129-150.
50. McDowell, D.L., et al., Integrated design of multiscale, multifunctional materials and products. 2009: Butterworth-Heinemann.
51. Gibson, R.F., A review of recent research on mechanics of multifunctional composite materials and structures. Composite structures, 2010. 92(12): p. 2793-2810.
52. Curtis, P., Multifunctional polymer composites. advanced performance materials, 1996. 3(3-4): p. 279-293.
53. Yao, S. and Y. Zhu, Wearable multifunctional sensors using printed stretchable conductors made of silver nanowires. Nanoscale, 2014. 6(4): p. 2345-2352.
54. Zhang, J., et al., A novel statistical spring-bead based network model for self-sensing smart polymer materials. Smart Materials and Structures, 2015. 24(8): p. 085022.
55. McEvoy, M.A. and N. Correll, Materials that couple sensing, actuation, computation, and communication. Science, 2015. 347(6228): p. 1261689.
56. Thakur, V.K. and M.R. Kessler, Self-healing polymer nanocomposite materials: A review. Polymer, 2015. 69: p. 369-383.
57. Guadagno, L., et al., Development of self-healing multifunctional materials. Composites Part B: Engineering, 2017. 128: p. 30-38.

67
58. Wang, Y. and D.J. Inman, Simultaneous energy harvesting and gust alleviation for a multifunctional composite wing spar using reduced energy control via piezoceramics. Journal of Composite Materials, 2013. 47(1): p. 125-146.
59. Lu, Z., et al., Silk fabric-based wearable thermoelectric generator for energy harvesting from the human body. Applied Energy, 2016. 164: p. 57-63.
60. Liu, K. and L. Jiang, Multifunctional integration: from biological to bio-inspired materials. Acs Nano, 2011. 5(9): p. 6786-6790.
61. Seepersad, C.C., et al., Design of multifunctional honeycomb materials. AIAA journal, 2004. 42(5): p. 1025-1033.
62. Ponnamma, D., et al., Carbon nanotube based elastomer composites–an approach towards multifunctional materials. Journal of Materials Chemistry C, 2014. 2(40): p. 8446-8485.
63. Ortega, N., et al., Multifunctional magnetoelectric materials for device applications. Journal of Physics: Condensed Matter, 2015. 27(50): p. 504002.
64. Deng, H., et al., Progress on the morphological control of conductive network in conductive polymer composites and the use as electroactive multifunctional materials. Progress in Polymer Science, 2014. 39(4): p. 627-655.
65. Mukhopadhyay, S., Nanoscale Multifunctional Materials: Science & Applications. 2011: John Wiley & Sons.
66. Salonitis, K., et al., Multifunctional materials used in automotive industry: A critical review. Engineering Against Fracture, 2009. 1: p. 59.
67. Salonitis, K., et al., Multifunctional materials: engineering applications and processing challenges. The International Journal of Advanced Manufacturing Technology, 2010. 49(5): p. 803-826.
68. Nicole, L., et al., Hybrid materials science: a promised land for the integrative design of multifunctional materials. Nanoscale, 2014. 6(12): p. 6267-6292.
69. Christodoulou, L. and J.D. Venables, Multifunctional material systems: The first generation. JOM, 2003. 55(12): p. 39-45.
70. Evans, A.G., et al., The topological design of multifunctional cellular metals. Progress in Materials Science, 2001. 46(3): p. 309-327.
71. Preumont, A., Responsive systems for active vibration control. Vol. 85. 2012: Springer Science & Business Media.
72. Pohl, D.W., Dynamic piezoelectric translation devices. Review of scientific instruments, 1987. 58(1): p. 54-57.

68
73. Jaffe, B., Piezoelectric ceramics. Vol. 3. 2012: Elsevier.
74. Chung, D., Piezoresistive cement-based materials for strain sensing. Journal of Intelligent Material Systems and Structures, 2002. 13(9): p. 599-609.
75. Li, X., C. Levy, and L. Elaadil, Multiwalled carbon nanotube film for strain sensing. Nanotechnology, 2008. 19(4): p. 045501.
76. Malik, S.A., et al., Self-sensing composites: In-situ detection of fibre fracture. Sensors, 2016. 16(5): p. 615.
77. Aktakka, E.E., et al., A microactuation and sensing platform with active lockdown for in situ calibration of scale factor drifts in dual-axis gyroscopes. IEEE/ASME Transactions on Mechatronics, 2015. 20(2): p. 934-943.
78. Han, B., S. Ding, and X. Yu, Intrinsic self-sensing concrete and structures: A review. Measurement, 2015. 59: p. 110-128.
79. Wang, J., et al., A highly sensitive and flexible pressure sensor with electrodes and elastomeric interlayer containing silver nanowires. Nanoscale, 2015. 7(7): p. 2926-2932.
80. Bird, E.T., et al., Vibration monitoring via nano-composite piezoelectric foam bushings. Smart Materials and Structures, 2016. 25(11): p. 115013.
81. Merrell, A.J., et al., Nano-Composite Foam Sensor System in Football Helmets. Annals of Biomedical Engineering, 2017: p. 1-8.
82. Johnson, O.K., et al., Multiscale model for the extreme piezoresistivity in silicone/nickel nanostrand nanocomposites. Metallurgical and Materials Transactions A, 2011. 42(13): p. 3898-3906.
83. Johnson, O.K., et al., Optimization of nickel nanocomposite for large strain sensing applications. Sensors and Actuators A: Physical, 2011. 166(1): p. 40-47.
84. Yamada, T., et al., A stretchable carbon nanotube strain sensor for human-motion detection. Nature nanotechnology, 2011. 6(5): p. 296-301.
85. Boland, C.S., et al., Sensitive, high-strain, high-rate bodily motion sensors based on graphene–rubber composites. ACS nano, 2014. 8(9): p. 8819-8830.
86. Wong, C., et al., Wearable Sensing for Solid Biomechanics: A Review. Sensors Journal, IEEE, 2015. 15(5): p. 2747-2760.
87. Wong, R.D.P., J.D. Posner, and V.J. Santos, Flexible microfluidic normal force sensor skin for tactile feedback. Sensors and Actuators A: Physical, 2012. 179: p. 62-69.

69
88. Park, J., et al., Giant tunneling piezoresistance of composite elastomers with interlocked microdome arrays for ultrasensitive and multimodal electronic skins. ACS nano, 2014. 8(5): p. 4689-4697.
89. Shuaeib, F.M., et al., Motorcycle helmet: Part II. Materials and design issues. Journal of materials processing technology, 2002. 123(3): p. 422-431.
90. Saha, M., et al., Effect of density, microstructure, and strain rate on compression behavior of polymeric foams. Materials Science and Engineering: A, 2005. 406(1): p. 328-336.
91. Honarmandi, P., A.M. Sadegh, and P.V. Cavallaro, Modelling and impact analysis of football player head with helmet toward mitigating brain concussion. International Journal of Experimental and Computational Biomechanics, 2015. 3(4): p. 267-299.
92. Cournoyer, J., et al., The ability of American football helmets to manage linear acceleration with repeated high-energy impacts. Journal of athletic training, 2016. 51(3): p. 258-263.
93. McIntosh, A.S. and D.A. Patton, The impact performance of headguards for combat sports. British journal of sports medicine, 2015. 49(17): p. 1113-1117.
94. Wanner, A., Minimum-weight materials selection for limited available space. Materials & Design, 2010. 31(6): p. 2834-2839.
95. Ashby, M.F. and D. Cebon, Materials selection in mechanical design. Le Journal de Physique IV, 1993. 3(C7): p. C7-1-C7-9.
96. McIntosh, A.S. and P. McCrory, Impact energy attenuation performance of football headgear. British journal of sports medicine, 2000. 34(5): p. 337-341.
97. Post, A., et al., An examination of American football helmets using brain deformation metrics associated with concussion. Materials & Design, 2013. 45: p. 653-662.
98. Collins, M., et al., Examining concussion rates and return to play in high school football players wearing newer helmet technology: a three-year prospective cohort study. Neurosurgery, 2006. 58(2): p. 275-286.
99. Caswell, S., T. Gould, and J. Wiggins, Protective helmets in sports. Materials in sports equipment, 2007. 2: p. 87-126.
100. Gimbel, G. and T.B. Hoshizaki, A comparison between vinyl nitrile foam and new air chamber technology on attenuating impact energy for ice hockey helmets. Int J Sports Sci Eng, 2008. 2(3): p. 154-161.
101. Hoshizaki, T.B., et al., Current and future concepts in helmet and sports injury prevention. Neurosurgery, 2014. 75: p. S136-S148.

70
102. Daneshvar, D.H., et al., Helmets and mouth guards: the role of personal equipment in preventing sport-related concussions. Clinics in sports medicine, 2011. 30(1): p. 145-163.
103. Liu, D.-S., et al., Influence of environmental factors on energy absorption degradation of polystyrene foam in protective helmets. Engineering Failure Analysis, 2003. 10(5): p. 581-591.
104. Levy, M.L., et al., Birth and evolution of the football helmet. Neurosurgery, 2004. 55(3): p. 656-662.
105. Mills, N., Foam protection in sport. Materials in Sports Equipment, 2003. 1: p. 20-29.
106. Ozturk, U.E. and G. Anlas, Energy absorption calculations in multiple compressive loading of polymeric foams. Materials & Design, 2009. 30(1): p. 15-22.
107. Post, A., et al., Differences in region-specific brain tissue stress and strain due to impact velocity for simulated American football impacts. Proceedings of the Institution of Mechanical Engineers, Part P: Journal of Sports Engineering and Technology, 2014: p. 1754337114527742.
108. Broglio, S.P., et al., Head impacts during high school football: a biomechanical assessment. Journal of athletic training, 2009. 44(4): p. 342-349.
109. Ghaedizadeh, A., et al., Designing composites with negative linear compressibility. Materials & Design, 2017.
110. Gong, L., S. Kyriakides, and W.-Y. Jang, Compressive response of open-cell foams. Part I: Morphology and elastic properties. International Journal of Solids and Structures, 2005. 42(5): p. 1355-1379.
111. DeMarco, A.L., et al., The impact response of motorcycle helmets at different impact severities. Accident Analysis & Prevention, 2010. 42(6): p. 1778-1784.
112. Hernandez, F., et al., Six degree-of-freedom measurements of human mild traumatic brain injury. Annals of biomedical engineering, 2015. 43(8): p. 1918-1934.
113. Jadischke, R., et al., On the accuracy of the Head Impact Telemetry (HIT) System used in football helmets. Journal of biomechanics, 2013. 46(13): p. 2310-2315.
114. Avalle, M., G. Belingardi, and R. Montanini, Characterization of polymeric structural foams under compressive impact loading by means of energy-absorption diagram. International Journal of Impact Engineering, 2001. 25(5): p. 455-472.
115. Merrell, A.J., et al. Applications of Nano-Composite Piezoelectric Foam Sensors. in ASME 2013 Conference on Smart Materials, Adaptive Structures and Intelligent Systems. 2013. American Society of Mechanical Engineers.

71
116. Rosquist, P.G., et al., Estimation of 3D Ground Reaction Force Using Nanocomposite Piezo-Responsive Foam Sensors During Walking. Annals of biomedical engineering, 2017.
117. Diani, J., B. Fayolle, and P. Gilormini, A review on the Mullins effect. European Polymer Journal, 2009. 45(3): p. 601-612.
118. Liu, L., et al., Experimental study on the dynamic response of in-plane deformation of dielectric elastomer under alternating electric load. Smart Materials and Structures, 2014. 23(2): p. 025037.
119. Melnykowycz, M., et al., Comparison of piezoresistive monofilament polymer sensors. Sensors, 2014. 14(1): p. 1278-1294.
120. Pan, L., et al., An ultra-sensitive resistive pressure sensor based on hollow-sphere microstructure induced elasticity in conducting polymer film. Nature communications, 2014. 5.
121. Rizzello, G., et al., Closed loop control of dielectric elastomer actuators based on self-sensing displacement feedback. Smart Materials and Structures, 2016. 25(3): p. 035034.
122. Hobeck, J., R. Owen, and D. Inman, Residual thermal effects in macro fiber composite actuators exposed to persistent temperature cycling. Applied Physics Letters, 2016. 108(11): p. 111901.
123. Schulz, M., et al., Embedded carbon nanotube thread piezoresistive strain sensor performance. Sensor Review, 2014. 34(2): p. 209-219.
124. Yu, L., B.J. Kim, and E. Meng, Chronically implanted pressure sensors: challenges and state of the field. Sensors, 2014. 14(11): p. 20620-20644.
125. Badocco, D., A. Mondin, and P. Pastore, Signal drift of oxygen optical sensors. Part I: Rationalization of the drift nature and its experimental check with a light intensity detection based sensor. Sensors and Actuators B: Chemical, 2013. 181: p. 943-948.
126. Gindre, C., et al., Aerial and terrestrial patterns: a novel approach to analyzing human running. International journal of sports medicine, 2016. 37(01): p. 25-26.
127. Remelius, J., J. Hamill, and R. van Emmerik, Prospective dynamic balance control during the swing phase of walking: stability boundaries and time-to-contact analysis. Human movement science, 2014. 36: p. 227-245.
128. Mendonça, C., et al., The effect of instruction to synchronize over step frequency while walking with auditory cues on a treadmill. Human movement science, 2014. 33: p. 33-42.
129. Scarfato, P., L. Di Maio, and L. Incarnato, Structure and physical-mechanical properties related to comfort of flexible polyurethane foams for mattress and effects of artificial weathering. Composites Part B: Engineering, 2017. 109: p. 45-52.

72
130. Smith, C.J., et al., Design data for footwear: sweating distribution on the human foot. International Journal of Clothing Science and Technology, 2013. 25(1): p. 43-58.
131. Shimazaki, Y. and M. Murata, Effect of gait on formation of thermal environment inside footwear. Applied ergonomics, 2015. 49: p. 55-62.
132. Van Roekel, N.L., E.M. Poss, and D.S. Senchina, Foot temperature during thirty minutes of treadmill running in cotton-based versus olefin-based athletic socks. BIOS, 2014. 85(1): p. 30-37.
133. Taunton, J., D. McKenzie, and D. Clement, The role of biomechanics in the epidemiology of injuries. Sports medicine, 1988. 6(2): p. 107-120.
134. Sow, M., D.J. Lacks, and R.M. Sankaran, Effects of material strain on triboelectric charging: Influence of material properties. Journal of Electrostatics, 2013. 71(3): p. 396-399.
135. Diaz, A. and R. Felix-Navarro, A semi-quantitative tribo-electric series for polymeric materials: the influence of chemical structure and properties. Journal of Electrostatics, 2004. 62(4): p. 277-290.
136. Liu, L., et al., Effect of relative rubbing speed on the tribo‐electrification of continuous filament yarn by stainless steel pins. Journal of the Textile Institute, 2011. 102(12): p. 1075-1085.
137. Azizi, Y., P. Davies, and A.K. Bajaj, Identification of nonlinear viscoelastic models of flexible polyurethane foam from uniaxial compression data. Journal of Engineering Materials and Technology, 2016. 138(2): p. 021008.
138. Bower, D.I., An introduction to polymer physics. 2002: Cambridge University Press.
139. Greco, A. and F. Lionetto, The influence of the stress relaxation and creep recovery times on the viscoelastic properties of open cell foams. Polymer Engineering & Science, 2009. 49(6): p. 1142-1150.
140. Wegener, M. Piezoelectric polymer foams: Transducer mechanism and preparation as well as touch-sensor and ultrasonic-transducer properties. in SPIE Smart Structures and Materials+ Nondestructive Evaluation and Health Monitoring. 2010. International Society for Optics and Photonics.
141. Mellinger, A., et al., Thermal and temporal stability of ferroelectret films made from cellular polypropylene/air composites. Ferroelectrics, 2006. 331(1): p. 189-199.
142. Schönert, K., K. Eichas, and F. Niermöller, Charge distribution and state of agglomeration after tribocharging fine particulate materials. Powder technology, 1996. 86(1): p. 41-47.

73
143. Merrell, A.J., et al., The Triboelectric Phenomenological Model of Nano Composite Foam Sensors. 2017.
144. Şerban, D.A., et al., Tensile properties of semi-crystalline thermoplastic polymers: Effects of temperature and strain rates. Polymer Testing, 2013. 32(2): p. 413-425.
145. White, S.W., et al., Experimental techniques and identification of nonlinear and viscoelastic properties of flexible polyurethane foam. Nonlinear Dynamics, 2000. 22(3): p. 281-313.
146. Dounis, D.V., et al., The mechano‐sorptive behavior of flexible water‐blown polyurethane foams. Journal of applied polymer science, 1993. 50(2): p. 293-301.
147. Payen, D., Stiffness, damping and creep properties of a polyurethane foam including the effects of temperature and humidity, in Aeronautical Research Council Current Papers. 1967, Ministry of Aviation: London, England.
148. Sheth, J.P., et al., Influence of system variables on the morphological and dynamic mechanical behavior of polydimethylsiloxane based segmented polyurethane and polyurea copolymers: a comparative perspective. Polymer, 2004. 45(20): p. 6919-6932.
149. Szycher, M., Szycher's handbook of polyurethanes. 1999: CRC press.
150. Manouchehri, H.-R., K. Hanumantha Rao, and K. Forssberg, Triboelectric charge, electrophysical properties and electrical beneficiation potential of chemically treated feldspar, quartz and wollastonite. Physical Separation in Science and Engineering, 2002. 11(1-2): p. 9-32.
151. Carta, M., et al., Triboelectric phenomena in mineral processing. Theoretic fundamentals and applications. Journal of Electrostatics, 1981. 10: p. 177-182.
152. Regtien, P.P., Sensors for mechatronics. 2012: Elsevier.
153. Wang, H., et al., Ultrastable eddy current displacement sensor working in harsh temperature environments with comprehensive self-temperature compensation. Sensors and Actuators A: Physical, 2014. 211: p. 98-104.
154. Alpaydin, E., Introduction to machine learning. 2014: MIT press.
155. Michalski, R.S., J.G. Carbonell, and T.M. Mitchell, Machine learning: An artificial intelligence approach. 2013: Springer Science & Business Media.
156. Kumar, D., S. Rajasegarar, and M. Palaniswami. Automatic Sensor drift detection and correction using Spatial Kriging and Kalman filtering. in Distributed Computing in Sensor Systems (DCOSS), 2013 IEEE International Conference on. 2013. IEEE.

74
157. Badocco, D., A. Mondin, and P. Pastore, Signal drift of oxygen optical sensors. Part II:“Smart” drift correction algorithm and its experimental check with a light intensity detection based sensor. Sensors and Actuators B: Chemical, 2013. 181: p. 949-954.
158. Burnham-Fay, E.D., et al., Strain characteristics of additive manufactured polyvinylidene fluoride (PVDF) actuators. Sensors and Actuators A: Physical, 2017.
159. Talluru, K., et al., A calibration technique to correct sensor drift issues in hot-wire anemometry. Measurement Science and Technology, 2014. 25(10): p. 105304.