characterizations of an integrated ultrasound, photoacoustic, and thermoacoustic tomography
TRANSCRIPT
Performance Characterization of an Integrated Ultrasound,
Photoacoustic, and Thermoacoustic Imaging System
Haixin Ke*, Todd N. Erpelding
a, Ladislav Jankovic
a, Lihong V. Wang
*
*Optical Imaging Laboratory, Department of Biomedical Engineering, Washington
University
1 Brookings Drive, St. Louis, MO 63130, USA;
aPhilips Research North America, 345 Scarborough Road, Briarcliff Manor, NY 10510,
USA.
ABSTRACT
We developed a tri-modality imaging system for breast cancer imaging by integrating
photoacoustic (PA) and thermoacoustic (TA) imaging techniques into a modified
commercial ultrasound scanner. Laser and microwave excitation pulses were interleaved
to enable PA and TA data acquisition in parallel at the rate of 10 frames per second. The
performance of the tri-modality imaging system was evaluated in-vitro using phantom
samples. A plastic tube (7 mm inner diameter, 25 mm length) filled with 30 mM
methylene blue dye placed at a depth of 8.4 cm in chicken breast tissue was successfully

detected in PA images with an ultrasonic bandwidth of 1–5 MHz. The SNR at this depth
was 15 dB after averaging 200 signal acquisitions. Similarly, a plastic tube (7 mm inner
diameter, 25 mm length) filled with high concentration salt water placed at a depth of
5.1 cm in porcine fat tissue was successfully detected in TA images. A PA noise-
equivalent-sensitivity to methylene blue solution of 260 nM was achieved in chicken
tissue at a depth of 3.4 cm and with a laser fluence of 17 mJ/cm2.
Keywords: Photoacoustic tomography, thermoacoustic tomography, ultrasound imaging
1. INTRODUCTION
Ultrasound (US) imaging, also called ultrasonography and echo imaging, is an
imaging technique that is widely used in clinical practice [1]. However, its application
in cancer detection is somewhat limited by the poor sensitivity. Photoacoustic (PA)
tomography (PAT) and thermoacoustic (TA) tomography (TAT) are novel hybrid
imaging techniques that combine high ultrasonic resolution and high contrast due to
light or microwave/radio-frequency (RF) absorption [2], [3]. Photoacoustic and
thermoacoustic effects are based on the generation of pressure waves upon absorption of
electromagnetic energy [4]. Absorbed energy is converted into heat, which launches a
pressure wave via thermoelastic expansion. In PAT, biological tissues are usually
irradiated by a pulsed laser. When the excitation laser is replaced by microwave or RF

sources, the technique is called TAT [5]–[7]. PA or TA image contrasts reflect the
absorbed optical or RF energy within the sample, respectively. The absorption reveals
optical or dielectric tissue properties that are closely related to the physiological and
pathological state of the tissue [2], [8]. PAT/TAT overcomes the disadvantages of pure
optical or microwave/RF imaging such as shallow penetration depth or poor spatial
resolution and the disadvantages of pure ultrasonic imaging such as the poor soft-tissue
contrast and speckle. It is capable of high-resolution structural, functional, and
molecular imaging free of speckle artifacts.
PAT and TAT techniques have been widely studied for biomedical applications
such as brain structural and functional imaging, blood-oxygenation and hemoglobin
monitoring, and imaging of tumor angiogenesis [9]–[12]. Combinations of PAT/TAT or
PAT/US had also been investigated previously for breast cancer and sentinel lymph
node imaging [2], [4], [13]–[15]. A co-registered PA, TA, and US system had been
constructed for small animal imaging [16]. However, that system uses different
detectors for PA/TA and US data. We successfully integrated all three modalities into
one system based on a modified clinical US imaging scanner. PA, TA, and US data are
exactly co-registered because they use the same array transducer for detection. Each
modality has inherent limitations. However, the combination of the three results in a
novel imaging system that is capable of simultaneously collecting complementary tissue
information. In this paper, we present results of the system performance in terms of
resolution, sensitivity and penetration depth.
2. METHODS AND MATERIALS
We developed the tri-modality imaging system by modifying a clinical US
imaging scanner. The system diagram is shown in Fig. 1. The system had four main
components: a laser system, a microwave system, a modified clinical ultrasound scanner
(iU22, Philips Healthcare), and a custom-made data acquisition system. The commercial
US scanner was modified to allow access to raw per-channel RF acoustic data, while all
imaging capabilities of the commercial US scanner were retained [13]. The laser system
consists of a tunable dye laser (PrecisionScan-P, Sirah) pumped by a Q-switched
Nd:YAG laser (PRO-350-10, Newport). Laser pulses are delivered by free space optics
to the opening of a horn antenna through a small hole on the narrow side wall and
expanded to form a beam with 1.25 cm radius at the antenna opening. The microwave
system generates 3.0 GHz microwave pulses with different pulse widths (0.18–1.2 s)
and repetition rates (< 100 Hz) and directed the pulses toward the target through the
horn antenna. Since the microwave operates in TE10 mode, the electrical field is parallel
to the narrow side wall and approaches zero on the wall, which minimizes the effect of

the hole on the electromagnetic field. An US phased array probe (S5-1, Philips
Healthcare) with 80 elements and a nominal frequency band of 1–5 MHz is used to
acquire US, PA, and TA signals. While this probe has a lower center frequency than
typical breast imaging probes, it is well suited for detecting low-MHz frequency,
microwave-induced thermoacoustic signals. The probe can be positioned arbitrarily
depending on which tissue cross-section is to be imaged. The custom-made data
acquisition system controls the triggering of all three modalities and collects raw data
for image display and post-processing. PA and TA images are reconstructed using a
Fourier beam-forming algorithm implemented in MATLAB, generating cross-sectional
B-mode images [17].
Low-density polyethylene (LDPE) tubes (7 mm inner diameter, 25 mm length),
filled with either methylene blue solution or salt water, were embedded in tissues as
targets for PAT and TAT, respectively. The LDPE tube has low light and low microwave
absorption, such that the tube itself has no detectable PA or TA signal [4]. Methylene
blue dye is routinely used clinically during sentinel lymph node biopsy for axillary
staging of breast cancer patients. Salt water was used for TAT because previous studies
showed the TAT contrast between normal and tumor tissues was mainly due to the
higher sodium and water content in tumors [5], [18]. In PAT, the laser wavelength was
chosen to be 650 nm, which is close to the peak absorption wavelength for methylene
blue. The laser pulse width was 6.5 ns and the repetition rate was 10 Hz; while in TAT,
the microwave pulse width was 0.3 s and the repetition rate was 10 Hz.
In penetration depth experiments, layers of chicken breast were used to increase
the imaging depth for PAT, while porcine fat was used for TAT. To improve the signal-
to-noise ratio (SNR), PA and TA acquisitions were repeated 200 times and raw data
were averaged before image reconstruction. In the methylene blue sensitivity
experiments, an LDPE tube of methylene blue solution was buried within layers of
chicken breast tissue at a fixed depth and the concentration of the solution was changed.
Again, the raw data were averaged before image reconstruction. In resolution
experiments, the resolution was evaluated using black hairs mounted on a plastic holder
placed in a water tank.
3. RESULTS
3.1 Multi-modality phantom imaging
A phantom test was conducted to validate and show the benefits of the tri-
modality system. The experiment setup is illustrated in Fig. 2(a). Three LDPE tubes
filled with either mineral oil, methylene blue (30 mM), or 0.9% saline solution were

placed at the opening of the antenna. The US image, overlaid PA/US image, and
overlaid TA/US image are shown in Fig. 2 (b), (c), and (d), respectively. As expected,
all three tubes were observed in the US image. Only the methylene blue tube was
observed in the PA image due to the strong optical absorption of the dye at 650 nm.
Both the methylene blue and saline solution tubes were observed in the TA image, but
the signal from methylene blue was weaker than that from saline solution as saline has
stronger microwave absorption than methylene blue. Accurate co-registration of the
tube locations was maintained in all three modalities, which was facilitated by use of the
same probe for detection of US, PA, and TA signals.
The tubes were identified in the images by the boundaries facing the ultrasound
transducer. Only the boundaries of the tubes were visible because the low-frequency
information in the acoustic signal was filtered by the transducer bandwidth. Moreover,
the transducer position was fixed and had a limited aperture for detection, leading
incomplete boundaries of the tubes in the images [19].
The spatial resolutions of the tri-modality imaging system were estimated using
black human hairs immersed in a water-tank and using PA excitation only. Fig. 2(e)
shows an image of the hairs placed at a depth of 2.7 cm. The spatial resolutions of the
tri-modality system are mainly determined by characteristics of the ultrasound probe (i.e.
bandwidth, center frequency, aperture size, elevational lens). The axial resolution was
on the order of hundreds of microns and was nearly constant over a range of depths,
while the lateral and elevational resolutions vary as a function of depth. In general, the
spatial resolutions of this system are adequate for imaging breast tumors, which range in
size from several millimeters to several centimeters for clinically significant tumors.
3.2 PAT penetration depth in chicken breast tissue
An LDPE tube filled with methylene blue solution (30 mM) was embedded in
layers of chicken breast tissue to measure the PAT penetration depth. Chicken breast
tissue has comparable optical properties to human breast. The optical 1/e penetration
depth in chicken breast tissue at 650 nm is about 1.13 cm [20] and that of human breast
at 656 nm is about 0.78 cm [21]. The whole sample was placed inside a plastic container
to support the layers of chicken breast during the experiment, as shown in Fig. 3(a). The
same thicknesses of the tissue were used above and below the methylene blue tube to
ensure that both the laser/microwave pulses and the generated acoustic signals travelled
the same distance. With this arrangement, penetration depth measurements acquired in
transmission mode are analogous to reflection mode acquisitions, where both the source
and detector are placed on the same side of the tissue. The laser beam had a diameter of
2.5 cm at the surface of the tissue and the fluence was about 19 mJ/cm2. With these
settings, a maximum penetration depth of 8.4 cm was obtained. Fig. 3(b) and Fig. 3(c)
show the overlaid PA/US images at depths of 3.4 cm and 8.4 cm, respectively. PA
signals at different depths from the methylene blue tube were normalized to the signal at
the smallest depth and plotted in Fig. 3(d). By fitting the data based on Beer’s law, the
1/e penetration depth was calculated to be 1.11 cm, which matches the previously
reported value of 1.13 cm [20]. The R2 value of the fitting was 0.97. The 8.4 cm depth is
approximately 7.5 times the 1/e penetration depth, corresponding to nearly 33 dB
attenuation of the incident laser power density. The SNR at 8.4 cm in the reconstructed
image was about 15 dB.
TAT of the tube filled with methylene blue solution reached a depth of
approximately 2 cm due to the combination of the strong microwave attenuation by the
chicken breast tissue and weak microwave absorption of methylene blue.
3.3 TAT penetration depth in porcine fat tissue
A similar penetration depth experiment was done using porcine fat. The target
tube was filled with 0.35 mL methylene blue (30 mM) and 0.55 mL salt water. To obtain
the maximum contrast, salt was added until saturation. Fig. 4(a) shows the layers of

porcine fat used. Fig. 4(b) and Fig. 4(c) show the overlaid TA/US images at depths of
1.3 cm and 5.1 cm, respectively. The maximum penetration depth obtained was 5.1 cm,
where the SNR was ~17.6 dB. Fig. 4(d) shows the normalized TA signal in dB from the
tube as a function of depth. Since the sample was placed in the near field of the antenna,
the signal strength dropped faster at smaller depth.
PAT images were also acquired for the same setup. PA signals from the diluted
methylene blue solution were obtained up to a depth of 4 cm with an SNR of ~30 dB.
3.4 PAT sensitivity for methylene blue
An LDPE tube was buried in layers of chicken breast tissue. Fig. 5(a) shows
how the tube was positioned in the tissue. The LDPE tube was tested to ensure that it
was not stained by methylene blue during our experiment. Both ends of the LDPE tube
were cut open and were connected to soft tygon tubes. A syringe was used to circulate
methylene blue solution of different concentrations in and out of the LDPE tube via the
tygon tubes. This way, we avoided any change in the setup while varying the
concentration. The thicknesses of the chicken tissue above and below the tube were 3.5
cm and 3.4 cm, respectively. The laser fluence at the illuminated surface was 17 mJ/cm2.
The tube was first filled with distilled water and the PA signal was taken as a baseline.

Methylene blue solution was then filled in from low concentration to high concentration.
The concentration was varied from 2 μM to 1 mM. The SNRs were plotted in Fig. 5(b)
versus the concentration of methylene blue. The baseline PA signal was defined as the
signal from the tube filled with water and treated as background. The baseline PA signal
was subtracted from the PA signal from each concentration of methylene blue before
linear curve-fitting and plotting the data on a log scale. The linear curve-fitting of these
data gave an R2 value of 0.996, which means the SNR changes linearly as the
concentration changes. At concentration higher than 1 mM, the PA signal varied in a
nonlinear fashion because the depth-dependent distribution of optical energy deposition
inside the methylene blue [22]. The SNR from the tube filled with 2 μM is 7.8 or
17.8 dB. Therefore the noise equivalent sensitivity, defined as the ratio of the methylene
blue concentration to the SNR, is ~260 nM at a depth of 3.4 cm in chicken breast tissue.
4. DISCUSSION
We aimed to design a clinical imaging system that combines contrasts from PAT,
TAT, and ultrasonography to monitor functional changes during breast neoadjuvant
therapy and predict treatment efficacy. We showed that our custom-designed PAT and
TAT system and the modified clinical ultrasound machine worked compatibly. Three

types of images can be acquired without having to move any system components. With
the free space laser delivery design, we achieved a high laser fluence for PAT that was
within ANSI safety limits [23]. The high laser fluence and probe sensitivity enabled PA
imaging at depths of 8.4 cm in chicken breast tissue. This penetration depth exceeds the
previously reported depth for PA detection of methylene blue by more than 3 cm [24].
The noise equivalent sensitivity for methylene blue in chicken breast measured with this
system (260 nM at a depth of 3.4 cm) is a significant improvement over previous
reports [24]. We measured the resolution of the tri-modality imaging system, which is
suitable for deep PAT/TAT. These results help to quantify the system performance,
which is critical for future clinical applications of the system.
This study is not without limitations. We used chicken breast and porcine fat
tissue to mimic human breast. However, real human breast is more complicated. It
consists of various structures and may contain more blood than excised chicken breast
tissue and more water than porcine fat; thus attenuating more light and microwave
energy. As mentioned before, the 1/e optical penetration depth in human breast at
656 nm is ~0.78 cm [21] and is smaller than that in chicken breast at 650 nm, which is
~1.13 cm [20]. Also, it has been reported that the 1/e penetration depth of microwave at
3 GHz in normal human breast tissue is ~4 cm, while that in fat is more than 8 cm [25].
Breast tumors may be less absorptive than the methylene blue solution or salt water.
Although we aim to image endogenous contrast from breast tumors, methylene blue and
salt water solutions serve as reference materials to quantify the system performance.
The imaging penetration depth in real human breast tissue will be more accurately
assessed in human subjects.
The interaction of microwave and biological tissues is rather complicated. The
biological effects of microwave do not depend solely on the external power density. The
intensity of the internal fields depends on a number of parameters: frequency, intensity,
and polarization of the external field; size, shape, and dielectric properties of the body;
spatial configuration between the exposure source and the exposed body; and the
presence of other objects in the vicinity [26].
5. CONCLUSIONS
We developed a multi-modality system that integrates three imaging techniques,
namely, ultrasound, photoacoustic, and thermoacoustic tomography. The system adds
PA and TA contrast mechanisms to traditional US imaging techniques and provides
complementary information on optical, dielectric, and ultrasonic tissue properties. We
evaluated the performance of the system in terms of penetration depth, spatial resolution,
and sensitivity. We demonstrated a maximum penetration depth of PAT in chicken breast

tissue was 8.4 cm and the maximum penetration depth of TAT in porcine fat was 5.1 cm.
The noise-equivalent-sensitivity of the methylene blue solution in chicken tissue was
measured to be 260 nM at a depth of 3.4 cm. These promising results motivate further
development of the system for clinical applications in breast cancer imaging.
6. ACKNOWLEDGEMENTS
We would like to acknowledge John Dean, Viktor Gornstein and Ramon Erkamp from
Philips Research North America for their help with building the system. This work is
supported by grants from the National Institutes of Health (R01 CA134539). L.V.W. has
a financial interest in Microphotoacoustics, Inc. and in Endra, Inc., which, however, did
not support this work.
REFERENCES
[1] S. Y. Emelianov, S. R. Aglyamov, J. Shah, S. Sethuraman, W. G. Scott, R. Schmitt, M. Motamedi,
A. Karpiouk, and A. Oraevsky, “Combined ultrasound, optoacoustic and elasticity imaging,”
Proceeding of SPIE 5320:101–112 (2004).
[2] G. Ku, B. D. Fornage, X. Jin, M. Xu, K. K. Hunt, and L. V. Wang, “Thermoacoustic and
photoacoustic tomography of thick biological tissues toward breast imaging,” Technology in Cancer
Research and Treatment 4 (5), 559–566 (2005).
[3] L. V. Wang, “Prospects of photoacoustic tomography,” Medical Physics 35 (12), 5758–5767 (2008).
[4] M. Pramanik, G. Ku, C. H. Li, and L. V. Wang, “Design and evaluation of a novel breast cancer
detection system combining both thermoacoustic (TA) and photoacoustic (PA) tomography,”
Medical Physics 35, 2218–2223 (2008).
[5] R.A. Kruger, D. R, Reinecke, and G. A. Kruger, "Thermoacoustic computed tomography–technical
considerations," Medical Physics, 26 (9), 1832–1837 (1999).
[6] L. V. Wang, X. Zhao, H. Sun, and G. Ku, "Microwave-induced acoustic imaging of biological
tissues," Review of Scientific Instruments, 70 (9), 3744–3748 (1999).
[7] M. Xu and L. V. Wang, “Photoacoustic imaging in biomedicine,” Review of Scientific Instruments
77, 041101-(1–22) (2006).
[8] Y. Xu and L. V. Wang, "Effects of acoustic heterogeneity on thermoacoustic tomography in the
breast," IEEE Transactions on Ultrasonics Ferroelectrics and Frequency Control 50 (9), 1134–1146
(2003).
[9] R. A. Kruger, K. D. Miller, H. E. Reynolds, W. L. Kiser, D. R. Reinecke, and G. A. Kruger, “Breast
cancer in vivo: contrast enhancement with thermoacoustic CT at 434 MHz – Feasibility study,”
Radiology 216(1), 279–283 (2000).
[10] L. V. Wang, X. M. Zhao, H. T. Sun, and G. Ku, “Microwave-induced acoustic imaging of biological
tissues,” Review of Scientific Instruments 70(9), 3744–3748 (1999).
[11] X. D. Wang, Y. J. Pang, G. Ku, X. Y. Xie, G. Stoica, and L. V. Wang, “Noninvasive laser-induced
photoacoustic tomography for structural and functional in vivo imaging of the brain,” Nature
Biotechnology 21(7), 803–806 (2003).
[12] G. Ku, X. D. Wang, X. Y. Xie, G. Stoica, and L. V. Wang, “Imaging of tumor angiogenesis in rat
brains in vivo by photoacoustic tomography,” Applied Optics 44(5), 770–775 (2005).
[13] T. N. Erpelding, C. Kim, M. Pramanik, L. Jankovic, K. Maslov, Z. Guo, J. A. Margenthaler, M. D.
Pashley, and L. V. Wang, “Sentinel Lymph Nodes in the Rat: Noninvasive Photoacoustic and US
Imaging with a Clinical US System,” Radiology 256 (1), 102–110 (2010).
[14] [C. Kim, T. N. Erpelding], L. Jankovic, M. D. Pashley, and L. V. Wang, “Deeply penetrating in vivo
photoacoustic imaging using a clinical ultrasound array system,” Biomedical Optics Express 1(1),
278–284 (2010).
[15] C. Kim, T. N. Erpelding, K. Maslov, L. Jankovic, W. J. Akers, L. Song, S. Achilefu, J. A.
Margenthaler, M. D. Pashley, and L. V. Wang, “Handheld array-based photoacoustic probe for
guiding needle biopsy of sentinel lymph nodes,” Journal of Biomedical Optics 15 (4), 046010 (2010).
[16] D. R. Reinecke, R. A. Kruger, R. B. Lam, S. P. Del Rio, “Co-registered photoacoustic,
thermoacoustic and ultrasound mouse imaging,” Proceeding of SPIE 7564, 756420 (2010).

[17] K. P. Köstli, M. Frenz, H. Bebie, H. P. Weber, “Temporal backward projection of optoacoustic
pressure transients using fourier transform methods,” Physics in Medicine and Biology 46(7), 1863–
1872 (2001).
[18] K. R. Foster and J. L. Schepps, “Dielectric properties of tumor and normal tissues at radio through
microwave frequencies,” Journal of Microwave Power 16(2), 107–119 (1981).
[19] Y. Xu, L. V. Wang, G. Ambartsoumian, and P. Kuchment, “Reconstructions in limited-view
thermoacoustic tomography,” Medical Physics 31(4), 724–733 (2004).
[20] G. Marquez, L. V. Wang, S.-P. Lin, J. A. Schwartz, and S. L. Thomsen, "Anisotropy in the
absorption and scattering spectra of chicken breast tissue," Applied Optics 37, 798–805 (1998).
[21] L. Spinelli, A. Torricelli, A. Pifferi, P. Taroni, G. M. Danesini, and R. Cubeddu, “Bulk optical
properties and tissue components in the female breast from multiwavelength time-resolved optical
mammography,” Journal of Biomedical Optics 9(6), 1137–1142 (2004).
[22] M. Sivaramakrishnan, K. Maslov, H. F. Zhang, G. Stoica, and L. V. Wang, "Limitations of
quantitative photoacoustic measurements of blood oxygenation in small vessels," Physics in
Medicine and Biology 52(5), 1349–1361 (2007).
[23] Laser Institute of America, American National Standard for Safe Use of Lasers ANSI Z136.1-2000,
American National Standards Institute, Inc., New York, NY, 2000.

[24] [C. Kim, T. N. Erpelding], L. Jankovic, M. D. Pashley, and L. V. Wang, “Deeply penetrating in vivo
photoacoustic imaging using a clinical ultrasound array system,” Biomedical Optics Express 1(1),
278–284 (2010).
[25] S. S. Chaudhary, R. K. Mishra, A. Swarup, and J. M. Thomas, “Dielectric properties of normal &
malignant human breast tissues at radiowave & microwave frequencies.” Indian Journal of
Biochemistry and Biophysics 21, 76–79 (1984).
[26] A. Vorst, A. Rosen, and Y. Kotsuka, “RF/Microwave interaction with biological tissues,” IEEE
Press, New Jersey, 2006.
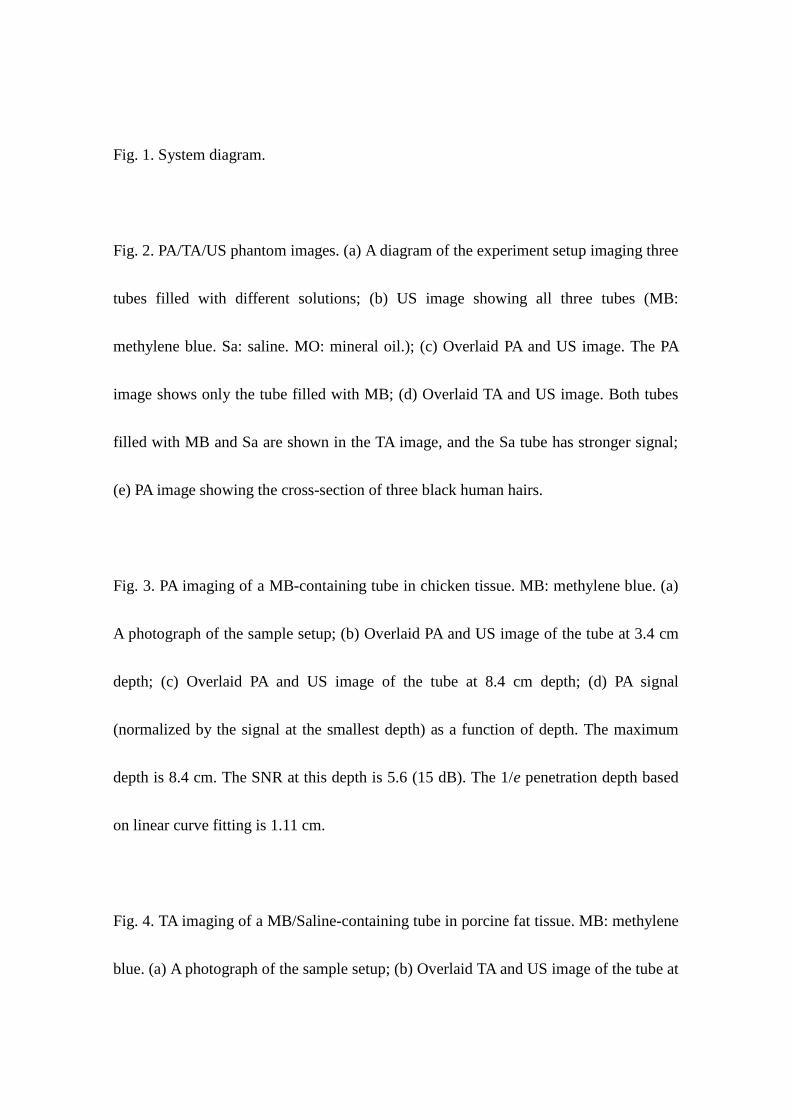
Fig. 1. System diagram.
Fig. 2. PA/TA/US phantom images. (a) A diagram of the experiment setup imaging three
tubes filled with different solutions; (b) US image showing all three tubes (MB:
methylene blue. Sa: saline. MO: mineral oil.); (c) Overlaid PA and US image. The PA
image shows only the tube filled with MB; (d) Overlaid TA and US image. Both tubes
filled with MB and Sa are shown in the TA image, and the Sa tube has stronger signal;
(e) PA image showing the cross-section of three black human hairs.
Fig. 3. PA imaging of a MB-containing tube in chicken tissue. MB: methylene blue. (a)
A photograph of the sample setup; (b) Overlaid PA and US image of the tube at 3.4 cm
depth; (c) Overlaid PA and US image of the tube at 8.4 cm depth; (d) PA signal
(normalized by the signal at the smallest depth) as a function of depth. The maximum
depth is 8.4 cm. The SNR at this depth is 5.6 (15 dB). The 1/e penetration depth based
on linear curve fitting is 1.11 cm.
Fig. 4. TA imaging of a MB/Saline-containing tube in porcine fat tissue. MB: methylene
blue. (a) A photograph of the sample setup; (b) Overlaid TA and US image of the tube at

1.3 cm depth; (c) Overlaid TA and US image of the tube at 5.0 cm depth. (d) TA signal
(normalized by the signal at the smallest depth) as a function of depth. The maximum
depth is 5.0 cm. The SNR at this depth is 7.6 (17.6 dB).
Fig. 5. PA signal strength as a function of methylene blue concentration at a depth of
3.4 cm measured using the S5-1 probe: (a) A photograph of the setup; (b) SNR vs.
concentration after subtraction of the baseline signal.
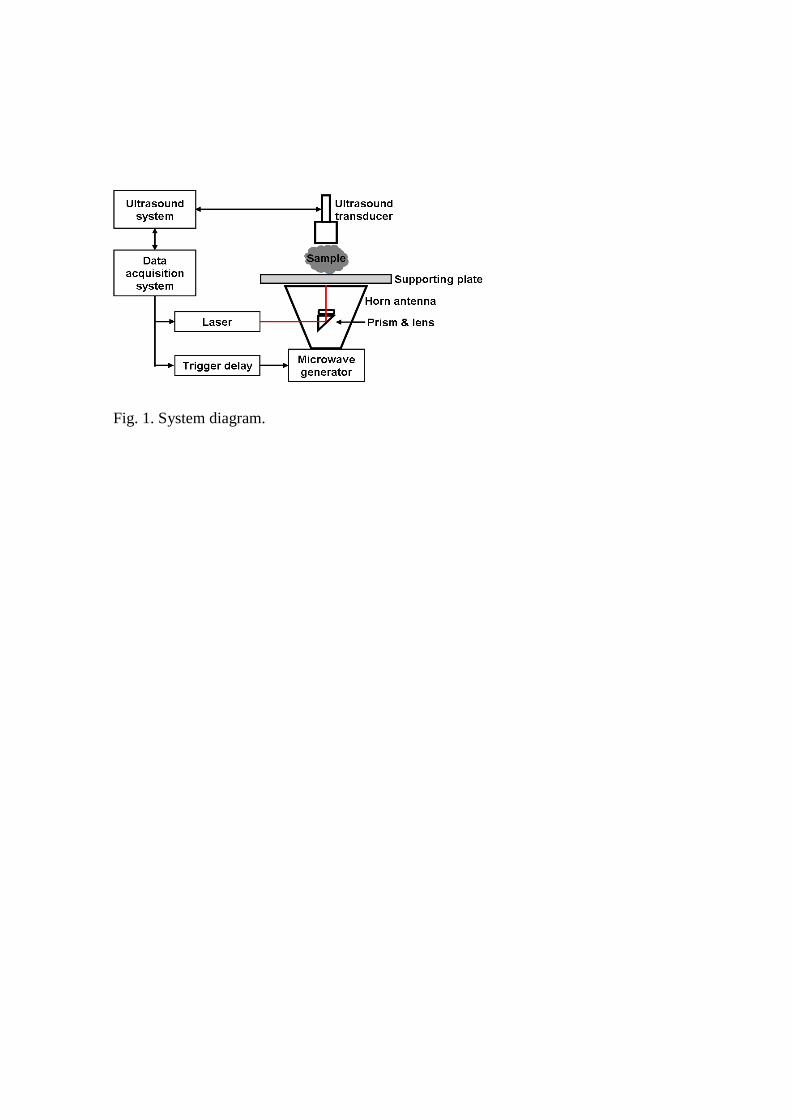
Fig. 1. System diagram.

Fig. 2. PA/TA/US phantom images. (a) A diagram of the experiment setup imaging three
tubes filled with different solutions; (b) US image showing all three tubes (MB:
methylene blue. Sa: saline. MO: mineral oil.); (c) Overlaid PA and US image. The PA
image shows only the tube filled with MB; (d) Overlaid TA and US image. Both tubes
filled with MB and Sa are shown in the TA image, and the Sa tube has stronger signal;
(e) PA image showing the cross-section of three black human hairs.

Fig. 3. PA imaging of a MB-containing tube in chicken tissue. MB: methylene blue. (a)
A photograph of the sample setup; (b) Overlaid PA and US image of the tube at 3.4 cm
depth; (c) Overlaid PA and US image of the tube at 8.4 cm depth; (d) PA signal
(normalized by the signal at the smallest depth) as a function of depth. The maximum
depth is 8.4 cm. The SNR at this depth is 5.6 (15 dB). The 1/e penetration depth based
on linear curve fitting is 1.11 cm.

Fig. 4. TA imaging of a MB/Saline-containing tube in porcine fat tissue. MB: methylene
blue. (a) A photograph of the sample setup; (b) Overlaid TA and US image of the tube at
1.3 cm depth; (c) Overlaid TA and US image of the tube at 5.0 cm depth. (d) TA signal
(normalized by the signal at the smallest depth) as a function of depth. The maximum
depth is 5.0 cm. The SNR at this depth is 7.6 (17.6 dB).

Fig. 5. PA signal strength as a function of methylene blue concentration at a depth of
3.4 cm measured using the S5-1 probe: (a) A photograph of the setup; (b) SNR vs.
concentration after subtraction of the baseline signal.