characterization of visible, uv and nir femtosecond pulses...
TRANSCRIPT

united nation, ab<IUSeducational, scientific
and culturalorganization
theiInternational centre for theoretical physics
international atomicenergy agency
SMR 1302- 10
WINTER SCHOOL ON LASER SPECTROSCOPY AND APPLICATIONS
19 February - 2 March 2001
Characterization of visible, UV and NIRfemtosecond pulses
Lecture II
E. RIEDLELudwig-Maximilians-Universitaet Munich
Lehrstuhl fuer Biomolekular Optik - Sektion PhysikMunich, Germany
These are preliminary lecture notes, intended only for distribution to participants.
strada costiera, II - 34014 trieste italy - tel. +39 04022401 I I fax +39 040224163 - [email protected] - www.ictp.trieste.it


Characterization of visible, UV and NIR femtosecond pulses
- pulse energy
- spectral distribution
- beam profile
- intensity autocorrelation
- fringe resolved autocorrelation
- crosscorrelation
- FROG: frequency resolved optical gating
- SPIDER: spectral phase interferometry for direct electric-field reconstruction
- concluding remarks
WINTER SCHOOL ON LASER SPECTROSCOPY AND APPUCATIONS (19 February - 2 March 2001) E. Riedle
Powermeter for Femtosecond Pulses ???
Wavelength Ranges of SmartSensors
100 nm 1,000 m*\
10.000 nm 100,000 nm
Thermal Sensors250 nrn • • • • •
190 mi • • • • •190 nm BBHH
10,600 nm
6,000 nm
250 nm • • • • • • • • • •Semiconductor Sensors
400 nm
3,500 nm
400 ran0OOnm
Pyroelectrlc Sensors190 nm!
1.064 nm1,550nm
unit i

a
/
s
i
7
s § § g
1
§
§
g
§
§
Grating Efficiency Curves
300 Unttftnm Qradngs
„ /" J, /I /
\s
1200 Untsftnm OraUnot
. \f »
••
\
2400 UntsAnm OraHnos
I : A'Si
600 U r m M m OraUnot
i£
1: \•• •
3600 UnMMm Gratings
: A

oogCD
o
3
O"
Autocorrelation Measurements
Correlation function:oe
= JThe shape of a sample pulse is measured by observing the overlap with a shorterreference pulse at variable delay. A nonlinear detector records the signal.
Such a reference pulse is often not available and the sample pulse itself is used.
Intensity AC:oo
A AC(x) = J - x)dt
Pulse:
5(t) slowly varying envelope of the electric field
<p(t) slowly varying phase
co| carrier frequency of laser
By suitable experimental observation all fast variations of the field and all spatialdependencies are averaged. Only the terms pertaining to 5(t) are recorded.

Fundamental
100-
co
2 10-Hgooo
10-2 4
A44
/• sech2fit %
£ T =25.6 fs ?•
-100 -50 0 50 100
Delay Time (fs)
700 750 800Wavelength (nm)
AvAt = 0.47
25 fs Second Harmonic Generation
100 4
co
fio-H8(0CO
2 10-2
J Gauss Fit ';
i FWHM=47fs'
-100 -50 0 50 100
Delay Time (fs)
360 380 400
Wavelength (nm)
25 fs
AvAt = 0.55
Autocorrelation measurementof ultrashort pulses
PMT
Filter
dichroicmirror
delay time

In a Michelson interferometer (with second harmonic detection) there is nocomplete averaging and the phase of the electric field has be taken into account:
AAQinterferometric(x) ~ J dt
R e
A(x) = J d t j ^ t - x ) + g*(\) + 4£2(t-x)5|(t)l "background" + "envelope"
B(x)= Jdt
C(x)= j d t
"fringes"
"higher order terms"
interferometric autocorrelation / fringe resolved
10 fs pulses at 630 nm
AX = 63 nmAvAx = 0.5
-40 -20 0 20 40delay time (fs)

Pulse Characterization by Photodiodes
AIGaAs LED: quadratic dependence at 800 nm, AC of 80 fs-pulsesD. T. Reid, M. Padgett, C. McGowan, W. E. Sleat, and W. Sibbett, Opt. Lett. 22, 233 (1997)
GaAsP photodiode: quadratic dependence at 800 nm, AC of 6 fs-pulsesJ. K. Ranka, A. L. Gaeta, A. Baltuska, M. S. Pshenichnikov, D. A. Wiersma, Opt. Lett. 22, 1345 (1997)
SiC photodiode: quadratic dependence at 497 nm, AC of 90 and 480 fs-pulsesT. Feurer, A. Glass, R. Sauerbrey, Appl. Phys. B. 65, 295 (1997)
Advantages :
• no phase matching => no angle tuning, broad acceptance bandwidth
• no polarization dependence
• no photomultiplier needed
• robust and compact
• readily available and inexpensive
Experimental Setup
UG5
IFAC, CC: 0
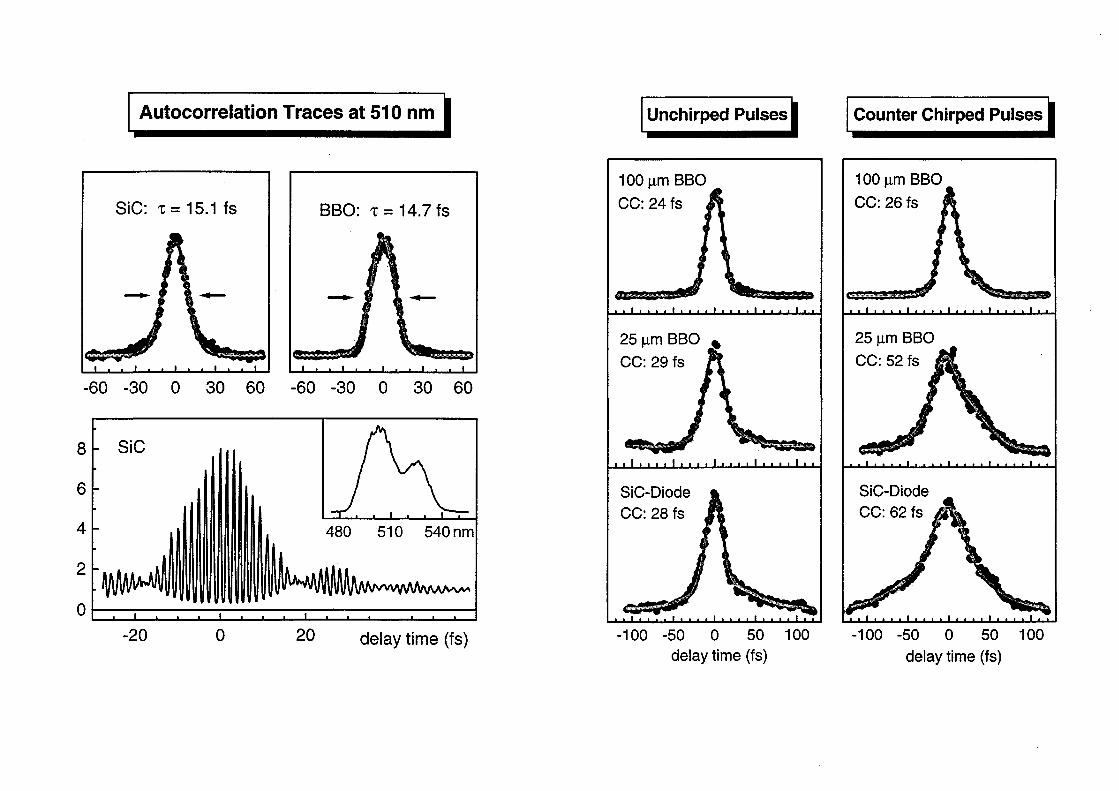
Autocorrelation Traces at 510 nm
SiC: T = 15.1 fs BBO: T = 14.7fs
-60 -30 0 30 60 -60 -30 0 30 60
480 510 540 nm
00 2 0 delay time (fs)
Unchirped Pulses
100 nm BBO
CC: 24 fs
25 nm BBOCC: 29 fs
SiC-DiodeCC: 28 fs
I
i i i i i I i i i i 1 i i i i I i i i i I
Counter Chirped Pulses
100p.m BBO
CC: 26 fs
25 nm BBOCC: 52 fs
SiC-DiodeCC: 62 fs
-100 -50 0 50 100 -100 -50 0 50 100delay time (fs) delay time (fs)

2 *
80 -
& eo-
6 40o
20 -
• i experiment" • • simulation•-
_ SiC BBO BBO25}im 100 |im
SiC BBO25 nm
• •HBBO
100 |xm
iSiC BBO
25 nm
|
11IIBBO
100 urn"
-
-
Gaussian pulses:
At = 18fs
Chirp:
1.9fs/THzat600nm
-2.1fs/THzat500nm
no chirp red pulse chirped pulses counter chirped
* A. M. Weiner, IEEE J. Quantum Electron. 19,1276 (1983), SVA-appr.
no phase
matching
phase
matching in
100 |nm BBO
Frequency Resolved Sum Frequency Signal
no chirpred pulse
chirped
pulses parallel
chirpedpulses counter
chirped
1140
1120 g1100 b
1080 %
1060 ^
1140 3
1120
1100
1080
1060
-80-40 0 40 80 -80-40 0 40 80 -80-40 0 40 80 -80-40 0 40 80
delay time x (fs)
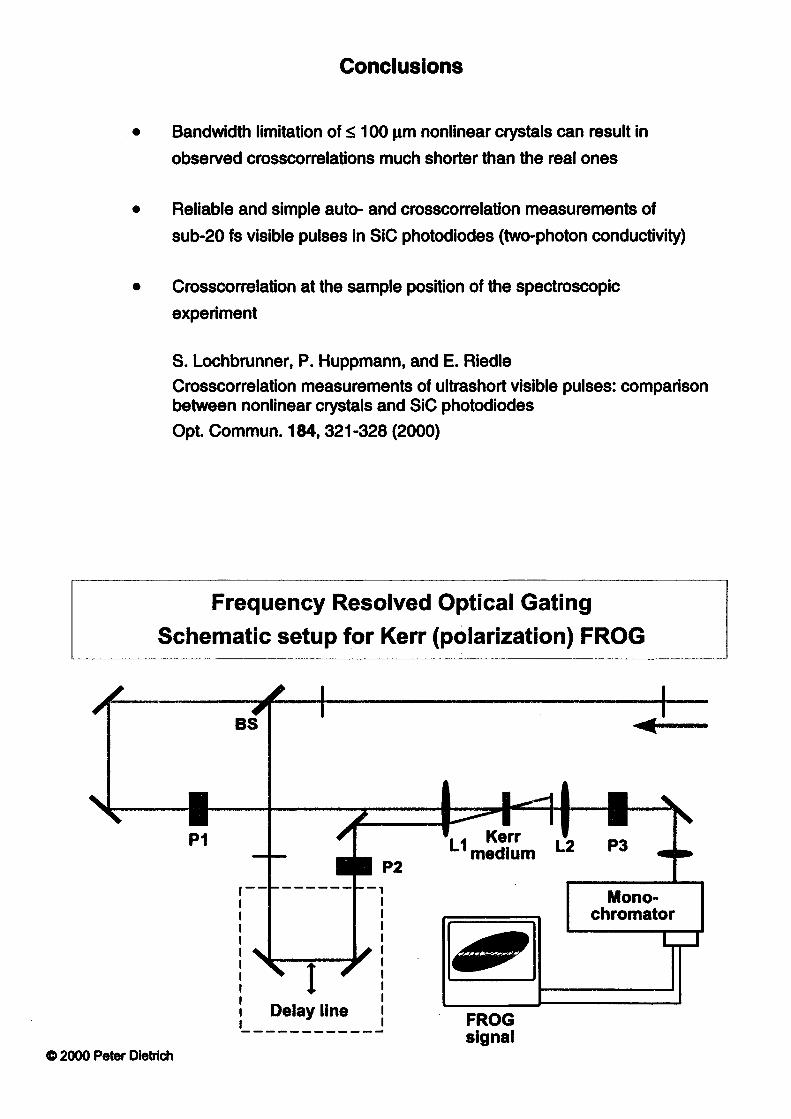
Conclusions
• Bandwidth limitation of £ 100 |xm nonlinear crystals can result in
observed crosscorrelations much shorter than the real ones
• Reliable and simple auto- and crosscorrelation measurements of
sub-20 fs visible pulses in SiC photodiodes (two-photon conductivity)
• Crosscorrelation at the sample position of the spectroscopic
experiment
S. Lochbrunner, P. Huppmann, and E. Riedle
Crosscorrelation measurements of ultrashort visible pulses: comparisonbetween nonlinear crystals and SiC photodiodes
Opt. Commun. 184,321-328 (2000)
Frequency Resolved Optical GatingSchematic setup for Kerr (polarization) FROG
BS
PI
Delay line
11 Kerr , 9L 1 medium L 2
Mono-chromator
1 I
©2000 Peter Dietrich
FROGsignal
oJ3C(D3O
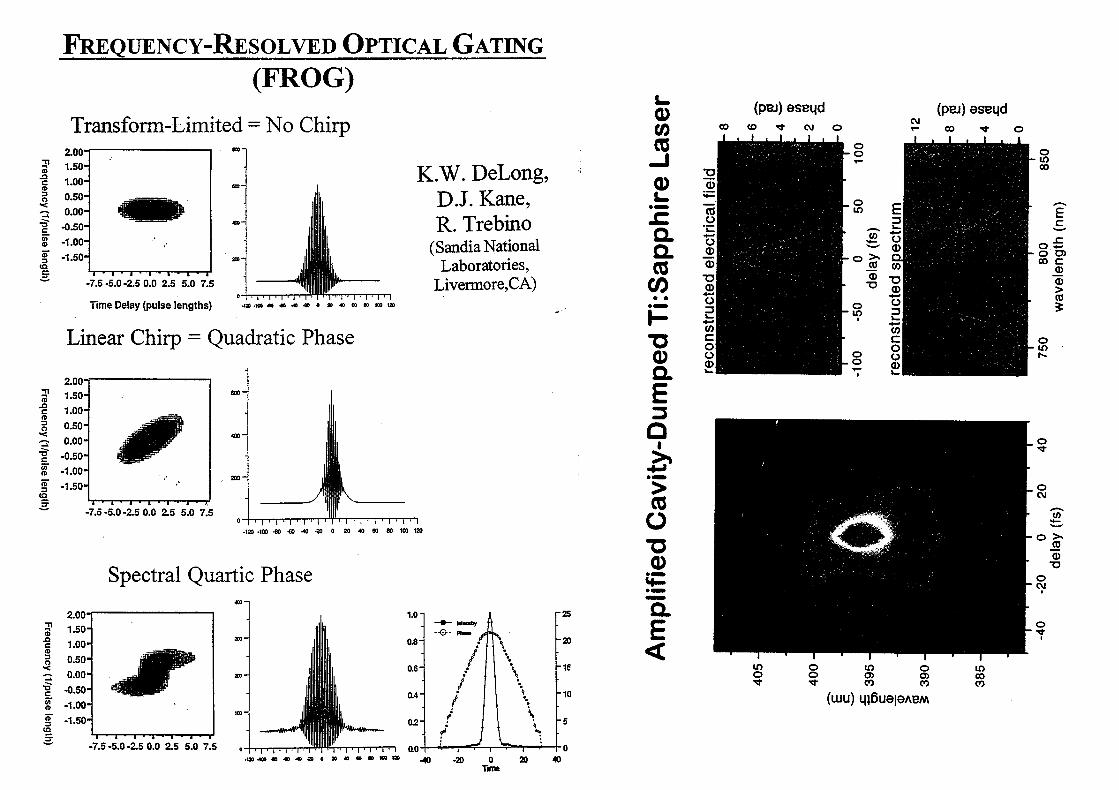
FREQUENCY-RESOLVED OPTICAL GATING
(FROG)
Transform-Limited = No Chirp
3.Q
J
ncl/
Iselen
gtf
2.00-1.50-1.00-0.50-0.00-
-0.50--1.00--1.50-
-7.5-5.0-2.5 0.0 2.5 5.0 7.5
Time Delay (pulse lengths)
K.W. DeLong,DJ. Kane,R. Trebino
(Sandia NationalLaboratories,
Livermore,CA)•123 -100 -60 • « -40 40 60 80 100 120
Linear Chirp = Quadratic Phase
-7.5 -5.0 -2.5 0.0 2.5 5.0 7.5
•120 -100 -60 -60 -40 -20 0 20 40 60 80 100 120
Spectral Quartic Phase
-7.5-5.0-2.5 0.0 2.5 5.0 7.5
1.0-
0.8"
0.6"
0.4"
02-
—•— Mamity
-•©•- Phaas
/
/
f J
A
\n-25
-20
-15
-10
- 5
0)0)CO
0
aaCO
CO
a
Qi
COO
0)
<
(pea) esaqd (PBJ) 9SBt|d
(OIU) L|}6ue|9ABM
•40 -20 0Time
20

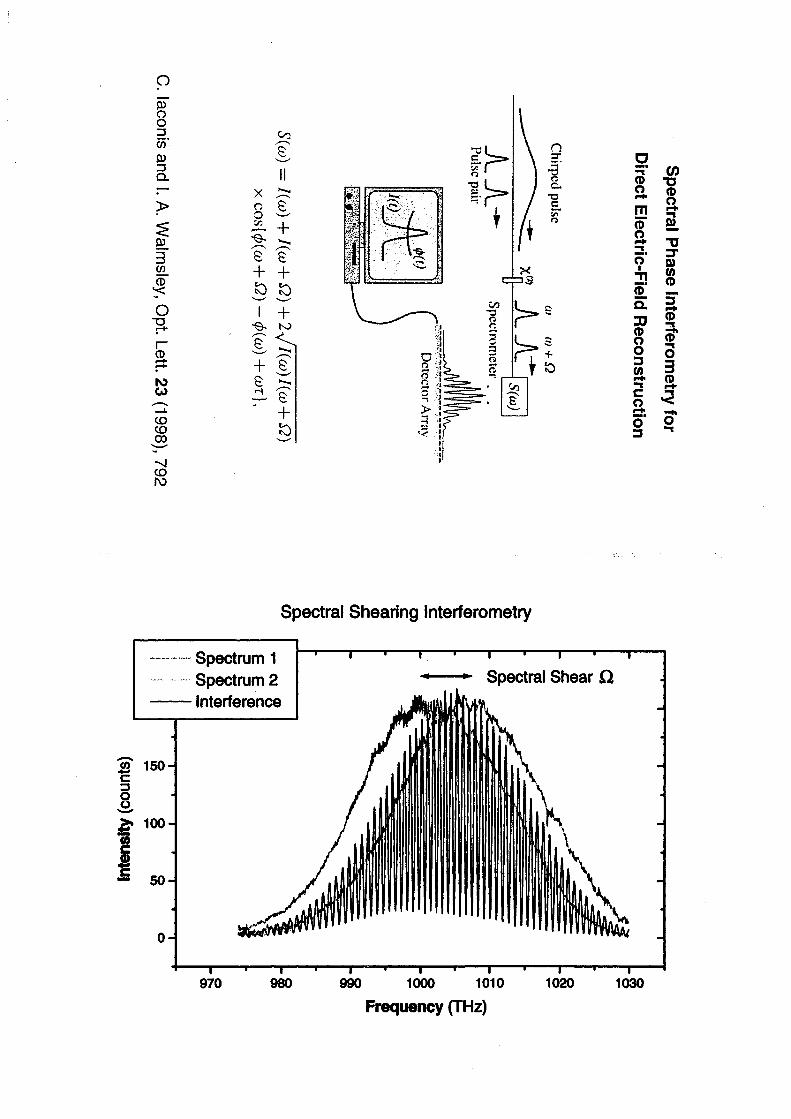
Characterisation of Laser Pulseswith SPIDER
(Spectral Phase Interferometry for Direct Electric-Field Reconstruction)
• Principle• Experimental Setup• Results• Conclusion
Intensity (counts) Length
a . t
Delay
CO I(0
1C
5
p
oo13C/)"
CL
>
Imsle
O• a
0tt.
IOCO
1998
IIx ^0 £0
f f
s S
im00•-•••nil
O"*T1•JLI(DaR
ec
0€0
tio
w73Octr
SL"DITfi>(00
D'erfei
03ao1
"HI
CD
r
Spectral Shearing Interferometry
Spectrum 1Spectrum 2Interference
150-
100-
— 5 0 -
0-
Spectral Shear Q,
970 980 990 1000 1010
Frequency (THz)
1020 1030

Fouriertransform
Frequency
Frequency
i
Retrieveargument of
inverseFourier
transform
• Unwrap phase- Subtract calibration
- Concatenate
Fouriertransform
Frequency
Window
/
STime
iSelect
temporalsideband
.LTime
Time
CO
15a>
oCLX
LU

Spectral Phase of NOPA after Chirped Mirror
0-
-5 -
g -10-
-15-
-20-
-25-
0 Reflexes18 Reflexes40 Reflexes
980 990 1000 1010Frequency (THz)
1020 1030
Pulse Shape of NOPA after Chirped Mirror
-1.0 -0.8 -0.6 -0.4
Time (a.u.)0.0