characterization of the dna adducts induced by aristolochic acids in oligonucleotides by...
TRANSCRIPT
RAPID COMMUNICATIONS IN MASS SPECTROMETRY
Rapid Commun. Mass Spectrom. 2008; 22: 3735–3742
) DOI: 10.1002/rcm.3791
Published online in Wiley InterScience (www.interscience.wiley.comCharacterization of the DNA adducts induced by
aristolochic acids in oligonucleotides by electrospray
ionization tandem mass spectrometry
Wan Chan1, Hao Yue1, Ricky N. S. Wong2 and Zongwei Cai1*1Department of Chemistry, Hong Kong Baptist University, Kowloon Tong, Kowloon, Hong Kong SAR, China2Department of Biology, Hong Kong Baptist University, Kowloon Tong, Kowloon, Hong Kong SAR, China
Received 5 June 2008; Revised 13 August 2008; Accepted 23 September 2008
*CorrespoKong BapE-mail: zContract/Grants CHKBU24Contract/Baptist UContract/Fund fromgrant num
Metabolic activation of carcinogenic aristolochic acids (AA) produces reactive aristolactam-
nitrenium ion intermediates. Electrophilic attack of the aristolactam-nitrenium ion via its C7 position
to the exocyclic amino group in the purine bases leads to the formation of DNA adducts.
DNA-binding assays have demonstrated that carcinogens show site- and sequence-specificity and
the biological consequence is defined by the nature of binding aswell as their position in the genome.
In this study, electrospray ionization tandem mass spectrometry was applied for the identification
and position mapping of DNA adducts in oligonucleotides (ODNs). The developed method
was successfully applied for the analysis of unmodified and AA-modified ODNs (5(-TTTATT-3(,5(-TTTGTT-3( and 5(-TACATGTGT-3(). The observation of the modified bases (modified adenine
and guanine) together with the complementary product ions ([an-B�n]
S, wS) from the cleavage of the
3( C–O bond adjacent to the modified base in MS/MS analyses readily enabled the identification of
the AA-binding site in ODNs. Copyright # 2008 John Wiley & Sons, Ltd.
The formation of covalently bonded DNA adducts is a
key cellular event in the mechanism of action of many
carcinogens and mutagens. Thus, detection of DNA adducts
has been used as the biomarker for carcinogen exposure
studies. The traditional approach to investigate DNA
adducts involves enzymatic hydrolysis of the modified
DNA prior to analysis at the nucleobase, nucleoside or
nucleotide levels.1–14 Although these approaches can pro-
vide quantitative data, the characterization of DNA adducts
after enzymatic hydrolysis results in the loss of all sequence-
specific information. The sequencing of modified oligonu-
cleotides (ODNs) is important for the therapeutic industry
and for toxicologists because the biological consequences of
carcinogen–DNA adducts are defined by the structure of the
lesion and its position within the genome. Methods based on
molecular biology, such as Maxam–Gilbert sequencing and
polymerase chain reaction, have been used extensively to
determine the site- and sequence-selectivity of carcinogens in
ODN binding assays.15–18 However, these techniques give
no structural information regarding the adducts formed.
Electrospray ionization tandemmass spectrometry (ESI-MS/
ndence to: Z.W. Cai, Department of Chemistry, Hongtist University, Kowloon, Hong [email protected] sponsor: Research Grant Council, Universityommittee of Hong Kong; contract/grant number:59/06M.grant sponsor: Faculty Research Grant of Hong Kongniversity; contract/grant number: FRG/06-07/II-56.grant sponsor: Health and Health Services Researchthe Food andHealth Bureau of Hong Kong; contract/ber: 05060141.
MS) with the capability to generate informative fragment
ions has been used for the characterization of synthetic
ODNs19–26 and for the position mapping of modified bases
within ODNs.27–29 It has been observed that alkylation of
guanine labilizes the glycosidic bond, resulting in the loss
of the alkylated base followed by cleavage of the 30 C–O
bond adjacent to the alkylated residue. The resulting
complementary pairs of sequence ions ([an-B�n]
�, w�) readily
enabled the identification of the binding site.28,29
Aristolochic acid (AA) is a mixture of structurally related
nitrophenanthrene carboxylic acids derived from the herbal
species Aristolochia and Asarum.30–32 Major components of
AA include aristolochic acid I (AAI, 8-methoxy-6-nitrophe-
nanthro(3,4-d)-1,3-dioxolo-5-carboxylic acid) and aristo-
lochic acid II (AAII, 6-nitrophenanthro(3,4-d)-1,3-dioxolo-5-
carboxylic acid) that differ by a methoxy group (Scheme 1).
AA-containing herbs were widely used to treat tumors,
snake bites, obstetrics, rheumatism, small pox and pneumo-
nia33,34 until AA was observed to be a strong carcinogen
in rats.35 Although being banned worldwide, misuse of
AA-containing herbs exists.
AA is a known nephrotoxin36,37 and also one of the most
potent carcinogens in the Carcinogenic Potency Database.38
Upon metabolic activation by mammalian enzymes, AA is
reduced to aristolactam via an aristolactam-nitrenium ion
intermediate.3–14,40,41 Electrophilic attack of the aristolactam-
nitrenium ion via its C7 position to the exocyclic amino
group in the purine bases (dA and dG) leads to the formation
of major adducts (Scheme 1).6–9,42 DNA-AA adducts
were detected in laboratory rodents3–8 and in patients
suffering from aristolochic acid nephropathy.12–14 The
Copyright # 2008 John Wiley & Sons, Ltd.
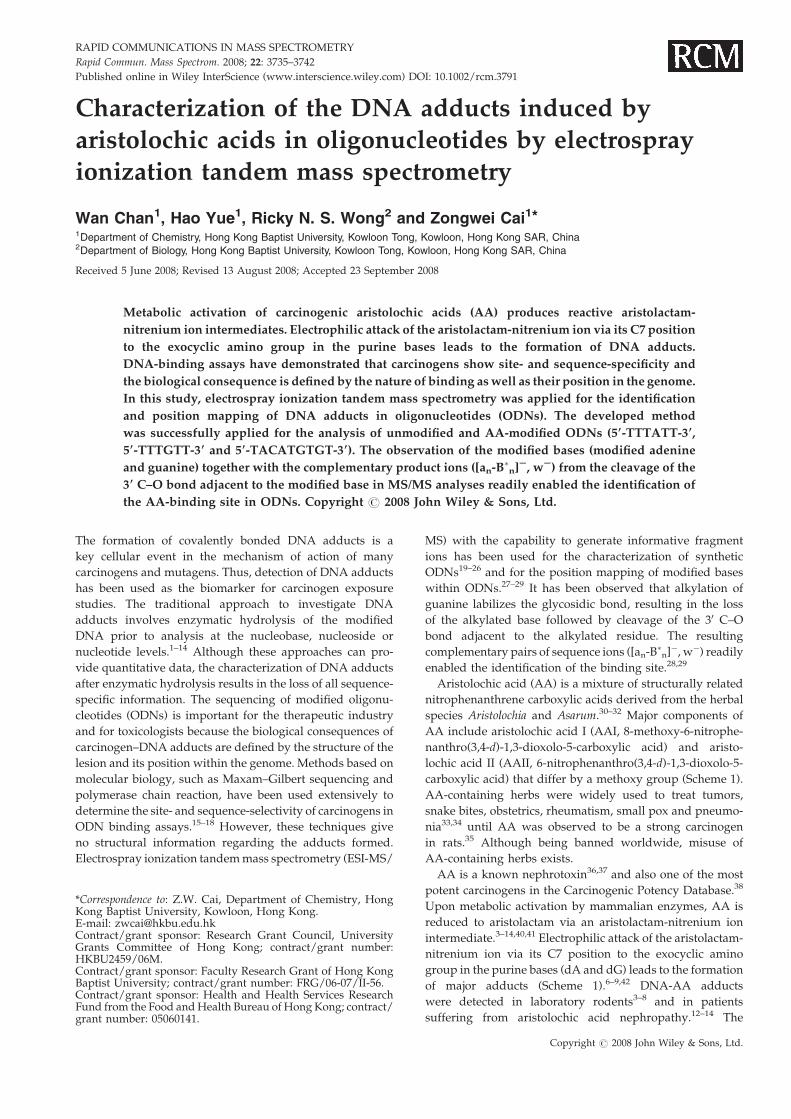
Scheme 1. Metabolic activation and DNA adduct formation of aristolochic acids.
3736 W. Chan et al.
reported DNA-AA adducts were elucidated spectroscopi-
cally as 7-(deoxyadenosine-N6-yl)aristolactam I (dA-AAI),
7-(deoxyguanosine-N6-yl)aristolactam I (dG-AAI), 7-(deox-
yadenosine-N6-yl)aristolactam II (dA-AAII) and 7-(deoxy-
guanosine-N6-yl)aristolactam II (dG-AAII).8
DNA–AA binding assays at nucleoside/nucleotide levels by
using 32P-postlabelling have been conducted extensively.3–9,11–14
In our previous study, liquid chromatography/tandem mass
spectrometry (LC/MS/MS)was used to study theDNAadducts
induced by AA at the nucleoside level.10 Recently, an LC/
ESI-MS method was developed by Grollman et al. for the
analysis of DNA-AA adducts in the renal tissue of patients
suffering from Balkan endemic nephropathy.39 Multiple-stage
mass spectrometric analyses (MS/MS and MS3) on a two-
dimensional quadrupole ion trap (2D-QIT) mass spectrometer
were performed for the peak identification. Similar to our
observation,10 the AA-DNA adducts showed characteristic
fragmentation loss of a deoxyribose moiety with 116Da.
Characteristic fragment ions at m/z 262 and 292 were detected
for the DNA adducts induced by AAII and AAI, respectively.
The site- and sequence-specificity of AA in base modification
was investigated by using PCR.16–18 Despite the potential
advantages in applying ESI-MS/MS to study the site- and
sequence-specificity of AA inODNs, its application has not been
reported, to the best of our knowledge. In this paper, we report
the first application of ESI-MS/MS for the position mapping of
base modification by AA in ODNs.
EXPERIMENTAL
ChemicalsODNs were obtained from Bio Basic Inc. (Ontario, Canada).
Aristolochic acid (AA), mixture of AAI and AAII (96%, 1:1),
was purchased from Acros (NJ, USA). AAI was obtained by
Copyright # 2008 John Wiley & Sons, Ltd.
chromatographic separation of the AA mixture by reversed-
phase high-performance liquid chromatography (RP-HPLC).
Zinc powder (60mesh) was obtained from Aldrich and was
ground using a mortar and pestle before use. Oasis HLB
solid-phase extraction (SPE) cartridges (Plus) were obtained
fromWaters (MA, USA). Acetic acid and ammonium acetate
were obtained from Panreac (Barcelona, Spain). HPLC-grade
acetonitrile was purchased from Tedia (OH, USA). Water
was produced by a Milli-Q Ultrapure water system (Waters,
CT, USA) with the water outlet operating at 18.2MV.
Modification and purification of ODNsThe lyophilized ODNs together with 10 equivalents of AA
(mixture of AAI and AAII for 50-TTTATT-30, 50-TTTGTT-30,
50-TTTCTT-30 and AAI for 50-TACATGTGT-30) were dis-
solved in a mixture of 500 mL of water/acetic acid (99:1). The
reaction was initiated by the addition of 20mg of zinc
powder. The mixtures were vortex-mixed and allowed to
stand at room temperature for 10min before 100 mL of
water/acetic acid (95:5) and 5 equivalents of AAwere added
and incubated for another 10min. To further increase the
yield of the modification to the ODNs, the above processes
were repeated four more times.
The reaction mixture for each of TTTATT, TTTGTT and
TTTCTTwas purified by SPE. The SPE cartridge (Oasis HLB)
after activation by acetonitrile was conditioned by using
5mL of water containing 0.1M ammonium acetate. The
reaction mixtures were then loaded to the cartridges
followed by washing with 1mL of water and eluted by
5mL of water/acetonitrile (50:50). Fraction of the eluents
were evaporated to dryness and reconstituted in water/
acetonitrile (50:50) with 5mM of ammonium acetate
immediately before analysis. The reaction mixture of
TACATGTGT was purified by RP-HPLC with fluorometric
Rapid Commun. Mass Spectrom. 2008; 22: 3735–3742
DOI: 10.1002/rcm
ESI-MS/MS characterization of AA-DNA adducts in ODNs 3737
detection (Ex 399; Em 474) on a Waters Alliance 2695 HPLC
system equipped with a 446 fluorescence detector (Milford,
MA, USA). The collected HPLC fraction pools were freeze-
dried, desalted by using SPE as described above, evaporated
to dryness and redissolved in water/acetonitrile (50:50) with
5mM of ammonium acetate immediately before analysis.
Analytical methods and instrumentationESI-MS and MS/MS analyses were performed on a
quadrupole time-of-flight (Qq-TOF) mass spectrometer
equipped with a standard ESI source in negative ionization
mode (API Q-STAR Pulsar i, Applied Biosystems, Foster
City, USA). Prepared samples were infused into the mass
spectrometer at a flow rate of 5mL/min by aHarvard syringe
pump. The electrospray voltage (ES), declustering potential I
(DPI), declustering potential II (DPII) and focusing potential
(FP) used were optimized to be �4.0 kV, �80V, �150V and
15V, respectively. The mass range was from m/z 100–1800.
The collision energy for product ion scans was typically in
the range of 40 to 50 eV for the MS/MS experiments. The ion
source gas I (GSI), curtain gas (CUR) and collision-assisted
dissociation gas (CAD) was set at 40, 25 and 3psi,
respectively. Mass calibration of the TOF analyzer was
performed by infusing 10 pmol/mL of TTTATT at a flow rate
of 5mL/min. Mass spectra were recorded on a personal
computer with the Analyst QS software (service pack 7,
Applied Biosystems). Sixty to ninety scans were summed for
each spectrum.
Optimization of ESI-MS parametersTo optimize the ESI-MS parameters, TTTATT in acetonitrile/
water (1:1) with 5mMof ammonium acetate was infused into
the Qq-TOFMS system. It was found that the use of negative
ionization mode produced a MS signal about four times
stronger than that in the positive ionization mode. Negative
ionization mode was therefore used in the subsequent
analysis. With TTTATT as the model compound, the ESI
source parameters (IS, DPI, DPII and FP)were optimized (see
Analytical Methods and Instrumentation).
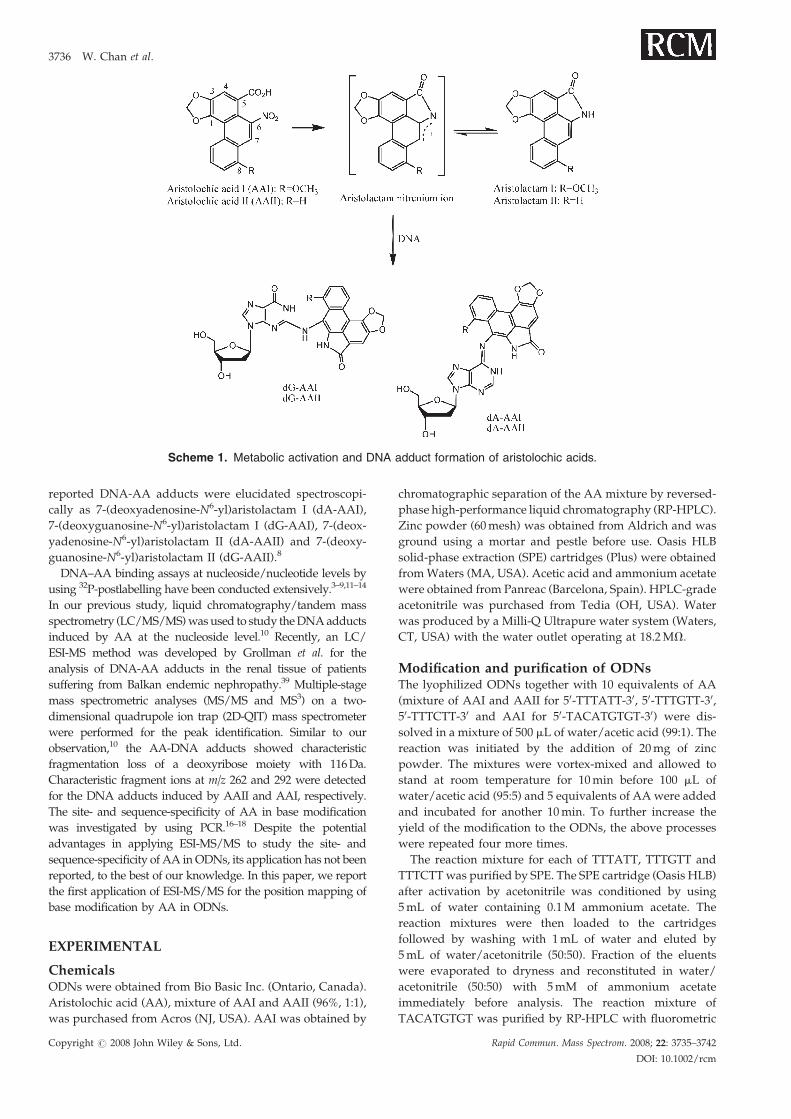
Scheme 2. Nomenclature for fragment io
et al.19 Possible fragments along the phosp
-OH group are termed a, b, c and d, while frag
termed w, x, y and z.
Copyright # 2008 John Wiley & Sons, Ltd.
To investigate the effect of the solvent system for the ESI-MS
analysis of ODNs, TTTATT at equimolar were prepared in
different buffer solutions and infused into the Qq-TOF
instrument. It was found that the addition of 5mM of
ammonium acetate to the acetonitrile/water mixture (1:1)
increased the MS signal by more than two times. Further
increase in the ammonium acetate concentration, however,
gave no significant signal enhancement. It was also observed
that the addition of ammonium acetate to the acetonitrile/
water (1:1) solvent system did not alter the fragmentation
pattern of the ODNs in MS/MS analysis so 5mM of
ammonium acetate in acetonitrile/water (1:1) mixture was
used to dissolve the unmodified and modified ODNs in the
subsequent ESI-MS/MS analyses.
Preparation of modified ODNsODNs containing single exocyclic amino groups bearing a
base (TTTATT, TTTGTT and TTTCTT) were reacted with
the AA mixture (AAI and AAII) while the ODN containing
multiple potential target sites (TACATGTGT) were reacted
with AAI, by using zinc powder in acetic acid as the
activation system. A modification to the activation system
reported by Broschard et al.16 was used in this study, in
which the phosphate buffer of pH 5.8 was replaced by 1%
acetic acid solution and the addition of AA was made in
several small portions. The increased acid content in the
reaction system allowed the nitroreduction of AA to be
completed in a shorter period of time (from 6 h to 1 h) and at
a lower temperature (from 378C to 218C). Because the
nitroreduction of AA proceeded rapidly in the modified
environment and the adducts were formed only when
the reactive intermediate (aristolactam nitrenium ion)
approached the purine bases within the ODNs, the addition
of AA was also divided into small portions so as to allow a
higher yield of the modified ODNs. The modified ODNs
were purified either by SPE for TTTATT, TTTGTT and
TTTCTT or by off-line HPLC for TACATGTGT. The
purified fractions were then infused individually into the
Qq-TOF mass spectrometer for analyses by ESI-MS and -
MS/MS.
ns of ODNs proposed by McLuckey
hodiester backbone containing the 50
ments containing the 30 -OH group are
Rapid Commun. Mass Spectrom. 2008; 22: 3735–3742
DOI: 10.1002/rcm
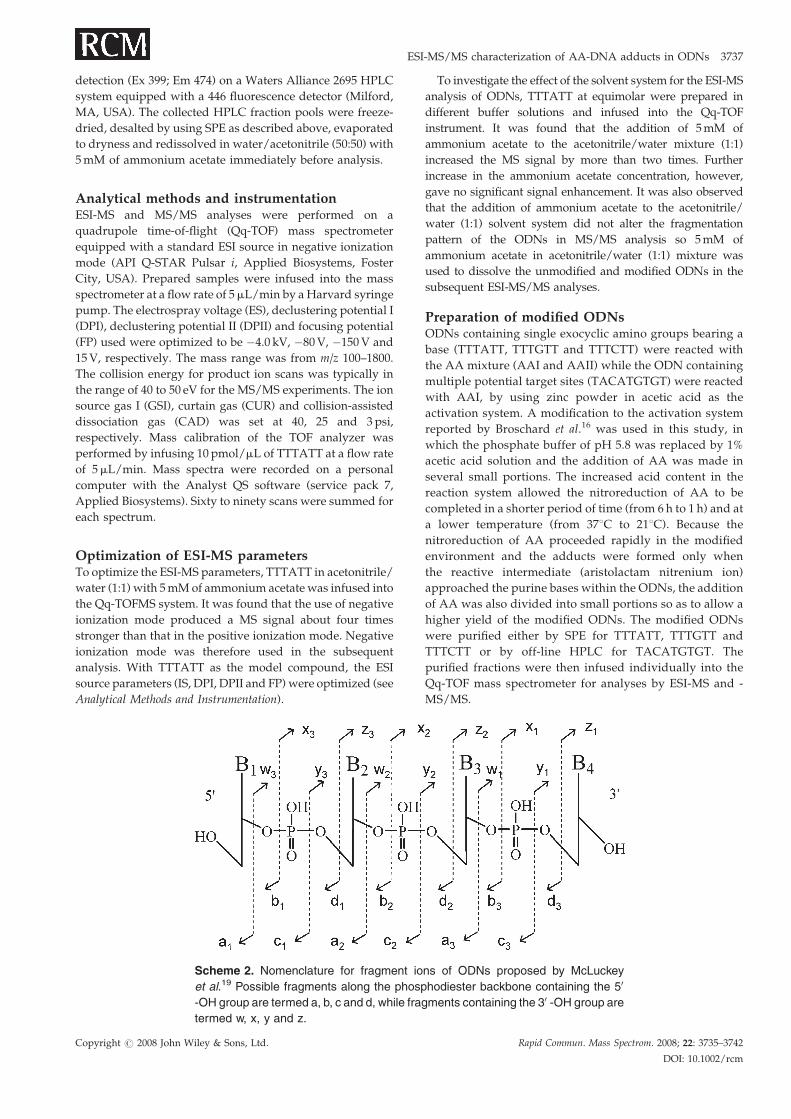
Figure 1. Typical ESI-MS spectrum of 50-TTTATT-30 modified with 35 equivalents
of AA (mixture of AAI and AAII). Labeled peaks displaym/z values of the [M–2H]2�
ions of the unmodified and AA-modified ODNs.
3738 W. Chan et al.
RESULTS AND DISCUSSION
ESI-MS and ESI-MS/MS analyses of themodified and unmodified ODNs
The challenge in using ESI-MS/MS for the positional
mapping of base modification in ODNs includes: (1) The
complexity of the tandem mass spectrometry of modified
and unmodifiedODNs because of the possible fragmentation
along the entire phosphate linkage (Scheme 2); (2) The
limited availability of modified ODNs for the analysis
because of the low conversion efficiency into DNA adducts
(e.g. 0.1–0.4% of the AAI employed);8 (3) The treatment of
ODNs containing multiple targeted bases for a carcinogen
results in the formation DNA adducts at any of the potential
bases, thus a series of positional isomers can be formed; and
(4) The complexity of themodification induced to the ODN is
increased by the potential multiple adduct formation in the
ODN.
Because ODNs had poor retention on RP-HPLC columns,
ion-pairing LC/MS methods were developed for the analysis
of ODNs.43,44 However, the severe interference caused by the
ion-pairing reagents affects the on-line coupling ofHPLCwith
MS detection. Most studies involving ODNs have therefore
been performed by syringe infusion.19–28 In this study, the
modified and unmodified ODNs were analyzed by ESI-Qq-
TOFMS. The nomenclature introduced byMcLuckey et al. was
used to describe the fragments originated from the modified
and unmodified ODNs.19 While the possible fragments along
the phosphodiester backbone containing the 50 –OH group
were termed a, b, c and d, fragments containing the 30 –OH
group were termed w, x, y and z ions (Scheme 2).
Mechanism studies on the dissociation of unmodified
ODNs in the gas phase showed that the loss of the nucleobase
(B) was the initial dissociation step, leading to the subsequent
cleavage of the 30 C–O bond. [an–Bn]� and w� ions were
observed as the major ions.20,25 It was also observed that
electron-withdrawing modifications to the nucleobase
enhanced the loss of the modified nucleobase (B�) and the
Copyright # 2008 John Wiley & Sons, Ltd.
fragmentation of the adjacent 30 C–O bond to yield the
[an–Bn�]� and w� ions.27,28
ODNs containing single site-specific AA lesions are
important for understanding the mutagenicity or carcino-
genicity of AA.16–18,45 In those studies, AA-modified ODNs
were characterized by denaturing gel electrophoresis and32P-postlabelling analyzed after their enzymatic hydrolysis.
These processes are time-consuming (days) and laborious. In
this study, the site-specificity of AA in DNA binding was
investigated by using ODNs containing a single exocyclic
amino group bearing bases (TTTATT, TTTGTT and
TTTCTT). A typical ESI-MS spectrum from the analysis of
the reconstituted SPE eluent of TTTATT is shown in Fig. 1.
[M–2H]2� ions of the modified and unmodified oligonucleo-
tides were detected. Peaks at m/z 884.6, 1015.2 and 1030.2
corresponded to the unmodified, AAII-modified and AAI-
modified ODNs, respectively. The peak intensity of the [M–
2H]2� ions of AAI- and AAII-modified TTTATT were
similar, indicating that AAI and AAII have similar reactivity
in the tested ODN.Adduct formationwas also observed to be
at a higher yield with the A moiety than on the G moiety of
the tested ODNs.
ESI-MS/MS analyses were performed on the hexaODNs to
demonstrate the feasibility of the developed method for the
identification and position mapping of AA modifications on
ODNs. The MS/MS spectra of the [M–2H]2� ions of
(A) unmodified, (B) AAII-modified and (C) AAI-modified
TTTATT are shown in Fig. 2. Both unmodified (Fig. 2(A)) and
modified ODNs (Figs. 2(B) and 2(C)) showed similar
fragmentations, with the [an–Bn]� and [w]� ions observed
as the major fragment ions. Mass calibration was performed
by infusing standard ODN TTTATT solution prior to
analysis. The calibrated TOF analyzer allowed the identifi-
cation of product ions at mass accuracy better than 20ppm.
The high resolution capability of the TOF instrument readily
allowed the determination of multiply charged ions, i.e. ion
peaks in the ion clusters of doubly charged ions are 0.5Da
apart while that for triply charged ions are 0.33Da apart.
Rapid Commun. Mass Spectrom. 2008; 22: 3735–3742
DOI: 10.1002/rcm
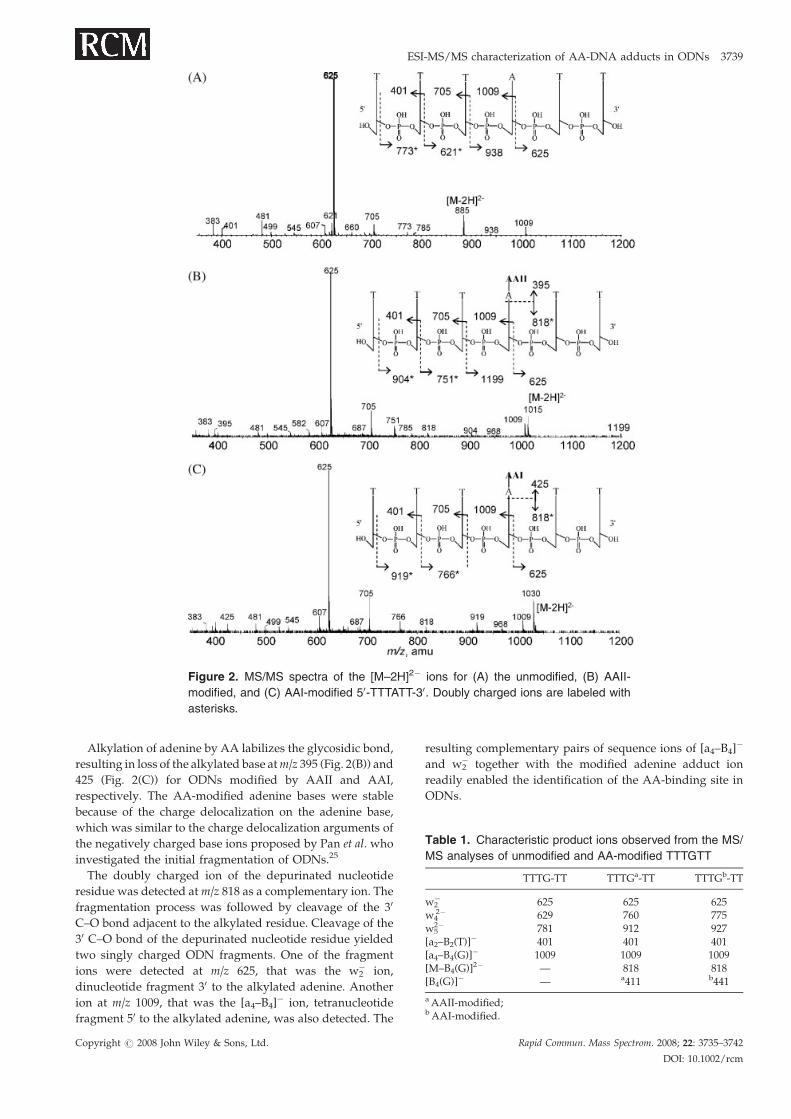
Table 1. Characteristic product ions observed from the MS/
MS analyses of unmodified and AA-modified TTTGTT
TTTG-TT TTTGa-TT TTTGb-TT
w2� 625 625 625
w42� 629 760 775
w52� 781 912 927
[a2–B2(T)]� 401 401 401
[a4–B4(G)]� 1009 1009 1009[M–B4(G)]2� — 818 818[B4(G)]� — a411 b441
aAAII-modified;bAAI-modified.
Figure 2. MS/MS spectra of the [M–2H]2� ions for (A) the unmodified, (B) AAII-
modified, and (C) AAI-modified 50-TTTATT-30. Doubly charged ions are labeled with
asterisks.
ESI-MS/MS characterization of AA-DNA adducts in ODNs 3739
Alkylation of adenine by AA labilizes the glycosidic bond,
resulting in loss of the alkylated base atm/z 395 (Fig. 2(B)) and
425 (Fig. 2(C)) for ODNs modified by AAII and AAI,
respectively. The AA-modified adenine bases were stable
because of the charge delocalization on the adenine base,
which was similar to the charge delocalization arguments of
the negatively charged base ions proposed by Pan et al. who
investigated the initial fragmentation of ODNs.25
The doubly charged ion of the depurinated nucleotide
residue was detected atm/z 818 as a complementary ion. The
fragmentation process was followed by cleavage of the 30
C–O bond adjacent to the alkylated residue. Cleavage of the
30 C–O bond of the depurinated nucleotide residue yielded
two singly charged ODN fragments. One of the fragment
ions were detected at m/z 625, that was the w2� ion,
dinucleotide fragment 30 to the alkylated adenine. Another
ion at m/z 1009, that was the [a4–B4]� ion, tetranucleotide
fragment 50 to the alkylated adenine, was also detected. The
Copyright # 2008 John Wiley & Sons, Ltd.
resulting complementary pairs of sequence ions of [a4–B4]�
and w2� together with the modified adenine adduct ion
readily enabled the identification of the AA-binding site in
ODNs.
Rapid Commun. Mass Spectrom. 2008; 22: 3735–3742
DOI: 10.1002/rcm
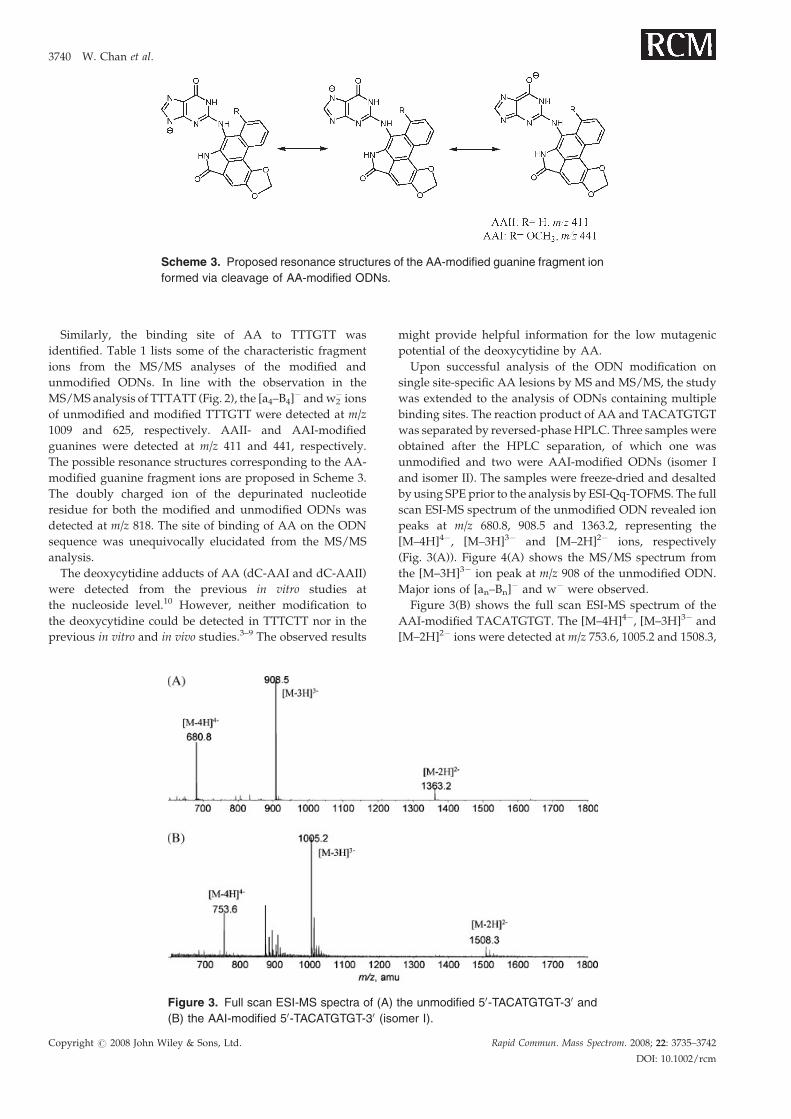
Scheme 3. Proposed resonance structures of the AA-modified guanine fragment ion
formed via cleavage of AA-modified ODNs.
3740 W. Chan et al.
Similarly, the binding site of AA to TTTGTT was
identified. Table 1 lists some of the characteristic fragment
ions from the MS/MS analyses of the modified and
unmodified ODNs. In line with the observation in the
MS/MS analysis of TTTATT (Fig. 2), the [a4–B4]� andw2
� ions
of unmodified and modified TTTGTT were detected at m/z
1009 and 625, respectively. AAII- and AAI-modified
guanines were detected at m/z 411 and 441, respectively.
The possible resonance structures corresponding to the AA-
modified guanine fragment ions are proposed in Scheme 3.
The doubly charged ion of the depurinated nucleotide
residue for both the modified and unmodified ODNs was
detected at m/z 818. The site of binding of AA on the ODN
sequence was unequivocally elucidated from the MS/MS
analysis.
The deoxycytidine adducts of AA (dC-AAI and dC-AAII)
were detected from the previous in vitro studies at
the nucleoside level.10 However, neither modification to
the deoxycytidine could be detected in TTTCTT nor in the
previous in vitro and in vivo studies.3–9 The observed results
Figure 3. Full scan ESI-MS spectra of (A)
(B) the AAI-modified 50-TACATGTGT-30 (iso
Copyright # 2008 John Wiley & Sons, Ltd.
might provide helpful information for the low mutagenic
potential of the deoxycytidine by AA.
Upon successful analysis of the ODN modification on
single site-specific AA lesions by MS and MS/MS, the study
was extended to the analysis of ODNs containing multiple
binding sites. The reaction product of AA and TACATGTGT
was separated by reversed-phase HPLC. Three samples were
obtained after the HPLC separation, of which one was
unmodified and two were AAI-modified ODNs (isomer I
and isomer II). The samples were freeze-dried and desalted
by using SPE prior to the analysis by ESI-Qq-TOFMS. The full
scan ESI-MS spectrum of the unmodified ODN revealed ion
peaks at m/z 680.8, 908.5 and 1363.2, representing the
[M–4H]4�, [M–3H]3� and [M–2H]2� ions, respectively
(Fig. 3(A)). Figure 4(A) shows the MS/MS spectrum from
the [M–3H]3� ion peak at m/z 908 of the unmodified ODN.
Major ions of [an–Bn]� and w� were observed.
Figure 3(B) shows the full scan ESI-MS spectrum of the
AAI-modified TACATGTGT. The [M–4H]4�, [M–3H]3� and
[M–2H]2� ions were detected at m/z 753.6, 1005.2 and 1508.3,
the unmodified 50-TACATGTGT-30 and
mer I).
Rapid Commun. Mass Spectrom. 2008; 22: 3735–3742
DOI: 10.1002/rcm
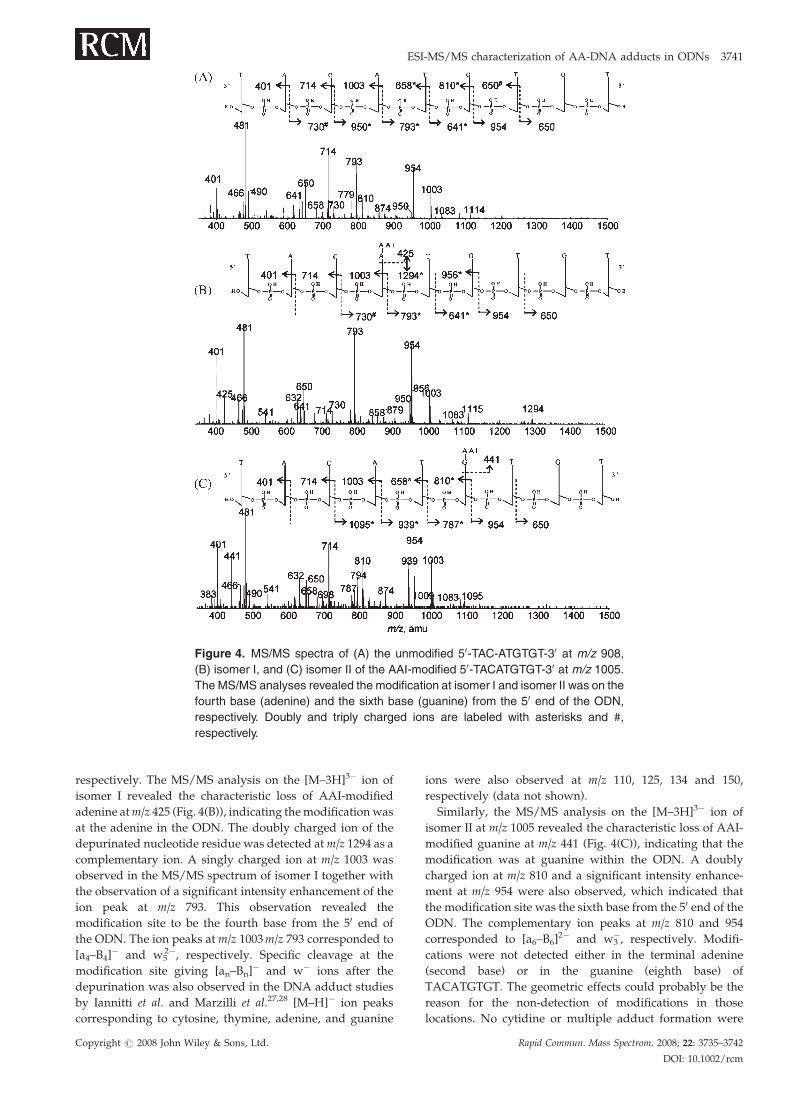
Figure 4. MS/MS spectra of (A) the unmodified 50-TAC-ATGTGT-30 at m/z 908,
(B) isomer I, and (C) isomer II of the AAI-modified 50-TACATGTGT-30 at m/z 1005.
The MS/MS analyses revealed the modification at isomer I and isomer II was on the
fourth base (adenine) and the sixth base (guanine) from the 50 end of the ODN,
respectively. Doubly and triply charged ions are labeled with asterisks and #,
respectively.
ESI-MS/MS characterization of AA-DNA adducts in ODNs 3741
respectively. The MS/MS analysis on the [M–3H]3� ion of
isomer I revealed the characteristic loss of AAI-modified
adenine atm/z 425 (Fig. 4(B)), indicating themodificationwas
at the adenine in the ODN. The doubly charged ion of the
depurinated nucleotide residue was detected atm/z 1294 as a
complementary ion. A singly charged ion at m/z 1003 was
observed in the MS/MS spectrum of isomer I together with
the observation of a significant intensity enhancement of the
ion peak at m/z 793. This observation revealed the
modification site to be the fourth base from the 50 end of
the ODN. The ion peaks at m/z 1003m/z 793 corresponded to
[a4–B4]� and w5
2�, respectively. Specific cleavage at the
modification site giving [an–Bn]� and w� ions after the
depurination was also observed in the DNA adduct studies
by Iannitti et al. and Marzilli et al.27,28 [M–H]� ion peaks
corresponding to cytosine, thymine, adenine, and guanine
Copyright # 2008 John Wiley & Sons, Ltd.
ions were also observed at m/z 110, 125, 134 and 150,
respectively (data not shown).
Similarly, the MS/MS analysis on the [M–3H]3� ion of
isomer II at m/z 1005 revealed the characteristic loss of AAI-
modified guanine at m/z 441 (Fig. 4(C)), indicating that the
modification was at guanine within the ODN. A doubly
charged ion at m/z 810 and a significant intensity enhance-
ment at m/z 954 were also observed, which indicated that
the modification site was the sixth base from the 50 end of the
ODN. The complementary ion peaks at m/z 810 and 954
corresponded to [a6–B6]2� and w3
�, respectively. Modifi-
cations were not detected either in the terminal adenine
(second base) or in the guanine (eighth base) of
TACATGTGT. The geometric effects could probably be the
reason for the non-detection of modifications in those
locations. No cytidine or multiple adduct formation were
Rapid Commun. Mass Spectrom. 2008; 22: 3735–3742
DOI: 10.1002/rcm
3742 W. Chan et al.
identified. We believed the low binding efficiency (0.1–0.4%
of the AAI employed in dA-AAI or dG-AAI synthesis)8 of
AA to DNA could be the reason for the non-detection of
multiple adduct formation.
CONCLUSIONS
Electrospray ionization tandem mass spectrometry was
shown here to be an effective approach for the position
mapping of DNA adducts induced by AA in ODNs.
The results presented in this paper confirm that A and G
are the reactive bases towards electrophilic attack by the
aristolactam-nitrenium ion. The reactions were conducted
with single-stranded ODNs, which might affect reactivity
and selectivity of adduction products. The observation of the
modified bases (modified adenine and guanine) together
with the complementary product ions ([an–B�n]
�, w�) from
the cleavage of the 30 C–O bond adjacent to the modified base
readily enabled the identification of the AA-binding site in
ODNs.
AcknowledgementsFinancial support from the Research Grant Council, Univer-
sity Grants Committee of Hong Kong (HKBU2459/06M),
Faculty Research Grant of Hong Kong Baptist University
(FRG/06-07/II-56), and the Health and Health Services
Research Fund from the Food and Health Bureau of Hong
Kong (05060141) is acknowledged.
REFERENCES
1. Koc H, Swenberg JA. J. Chromatogr. B 2002; 778: 323.2. de Kok TMCM, Moonen HJJ, van Delft J, van Schooten FJ.
J. Chromatogr. B 2002; 778: 345.3. Pfau W, Schmeiser HH, Wiessler M. Carcinogenesis 1990; 11:
1627.4. PfauW, Schmeiser HH, Wiessler M. Chem. Res. Toxicol. 1991;
4: 581.5. Bieler CA, Stiborova M, Wiessler M, Cosyns JP, deStrihou
CV, Schmeiser HH. Carcinogenesis 1997; 18: 1063.6. Stiborova M, Frei E, Wiessler M, Schmeiser HH. Chem. Res.
Toxicol. 2001; 14: 1128.7. Stiborova M, Frei E, Breuer A, Wiessler M, Schmeiser HH.
Mutat. Res. 2001; 493: 149.8. Pfau W, Schmeiser HH. Carcinogenesis 1990; 11: 313.9. Stiborova M, Frei E, Sopko B, Sopkova K, Markova V,
Lankova M, Kumstyrova T, Wiessler M, Schmeiser HH.Carcinogenesis 2003; 24: 1695.
10. Chan W, Zheng YF, Cai ZW. J. Am. Soc. Mass Spectrom. 2007;18: 642.
11. Schmeiser HH, Frei E, Wiessler M, Stiborova M. Carcinogen-esis 1997; 18: 1055.
12. Bieler CA, Stiborova M, Wiessler M, Cosyns J-P, van Yperselede Strihou C, Schmeiser HH. Carcinogenesis 1997; 18: 1063.
13. Stiborova M, Frei E, Sopko B, Wiessler M, Schmeiser HH.Carcinogenesis 2002; 23: 617.
Copyright # 2008 John Wiley & Sons, Ltd.
14. Arlt VM, Pfohl-Loszkowicz A, Cosyns J-P, Schmeiser HH.Mutat. Res. 2001; 494: 143.
15. Antsypovich S, Quirk-Dorr D, Pitts C, Tretyakova N. Chem.Res. Toxicol. 2007; 20: 641.
16. Broschard TH, Wiessler M, Schmeiser HH. Cancer Lett. 1995;98: 47.
17. Arlt VM, Wiessler M, Schmeiser HH. Carcinogenesis 2000; 21:235.
18. Arlt VM, Schmeiser HH, Pfiefer GP. Carcinogenesis 2001; 22:133.
19. McLuckey SA, Van Berkel QJ, Glish GL. J. Am. Soc. MassSpectrom. 1992; 3: 60.
20. McLuckey SA, Habibi-Goudarzi S. J. Am. Chem. Soc. 1993;115: 12085.
21. Wan KX, Gross J, Hillenkamp F, Gross ML. J. Am. Soc. MassSpectrom. 2001; 12: 193.
22. Wan KX, Gross ML. J. Am. Soc. Mass Spectrom. 2001; 12:580.
23. Monn STM, Schurch S. J. Am. Soc. Mass Spectrom. 2005; 16:370.
24. Tromp JM, Schurch S. J. Am. Soc. Mass Spectrom. 2005; 16:1262.
25. Pan S, Verhoevan K, Lee JHK. J. Am. Soc.Mass Spectrom. 2005;16: 1853.
26. Wu J, McLuckey SA. Int. J. Mass Spectrom. 2004; 237: 197.27. Iannitti P, Sheil MM,WickhamG. J. Am. Chem. Soc. 1997; 119:
1490.28. Marzilli LA,WangD, KobertzWR, Essigmann JM, Vouros P.
J. Am. Soc. Mass Spectrom. 1998; 9: 676.29. Sherman CL, Pierce SE, Brodbelt JS, Tuesuwan B, Kerwin
SM. J. Am. Soc. Mass Spectrom. 2006; 17: 1342.30. Kite GC, Yule MA, Leon C, Simmonds MSJ. Rapid Commun.
Mass Spectrom. 2002; 16: 585.31. Zhou XG, Zheng CY, Sun JY, You TY. J. Chromatogr. A 2006;
1109: 152.32. Chan W, Lee KC, Liu N. J. Chromatogr. A 2007; 1164: 113.33. Kupchan MS, Doskotch RW. J. Med. Pharm. Chem. 1962; 5:
657.34. Rucker G, Chung BS. Plant Med. 1975; 27: 68.35. Mengs U, Lang W, Poch JA. Arch. Toxicol. 1982; 51: 107.36. Debelle FD, Nortier JL, De Prez EG, Garbar CH, Vienne AR,
Salmon IJ, Deschodt-Lanckman MM, Vanherweghem JL.J. Am. Soc. Nephrol. 2002; 13: 431.
37. Vanherweghem JL, Depierreux M, Tielemans C, Abramo-wicz D, Dratwa M, Jadoul M, Richard C, Vandervelde D,Verbeelen D, Vanhaelenfastre R, Vanhaelen M. Lancet 1993;341: 387.
38. Gold LS, Zeiger E. Handbook of Carcinogenic Potency andGenotoxicity Databases. CRC Press: Boca Raton, 1997.
39. GrollmanAP, Shibutani S,MoriyaM,Miller F,Wu L,Moll U,Suzuki N, Femandes A, Rosenquist T,Medverec Z, JakovinalK, Brdar B, Slade N, Turesky RJ, Goodenough AK, Rieger R,Vukelic M, Jelakovic B. Proc. Natl. Acad. Sci. USA 2007; 104:12129.
40. Chan W, Cui L, Xu GW, Cai ZW. Rapid Commun. MassSpectrom. 2006; 20: 1755.
41. Chan W, Luo H-B, Zheng YF, Cheng YK, Cai ZW. DrugMetab. Dispos. 2007; 35: 866.
42. Arlt VM, Stiborova M, Schmeiser HH. Mutagenesis 2002; 17:265.
43. Apffel A, Chakel JA, Fischer S, Lichtenwalter K, HancockWS. Anal. Chem. 1997; 69: 1320.
44. Deguchi K, Ishikawa M, Yokokura T, Ogata I, Ito S,Mimura T, Ostrande C. Rapid Commun. Mass Spectrom.2002; 16: 2133.
45. Debrauwer L, Rathanao E, Couve C, Poulain S, Pouyet C,Jouanin I, Paris A. J. Chromatogr. A. 2002; 976: 123.
Rapid Commun. Mass Spectrom. 2008; 22: 3735–3742
DOI: 10.1002/rcm