characterization of hybrid materials by means of inverse gas chromatography and chemometrics
TRANSCRIPT
Characterization of Hybrid Materials by Means of InverseGas Chromatography and Chemometrics
JOANNA KOŁODZIEJEK,1 ADAM VOELKEL,1 KAROLY HEBERGER2
1Institute of Chemical Technology and Engineering, Poznan University of Technology, Poznan 60-965, Poland
2Research Centre for Natural Sciences, Hungarian Academy of Sciences, Budapest H-1025, Hungary
Received 20 December 2012; revised 31 January 2013; accepted 8 February 2013
Published online 4 March 2013 in Wiley Online Library (wileyonlinelibrary.com). DOI 10.1002/jps.23489
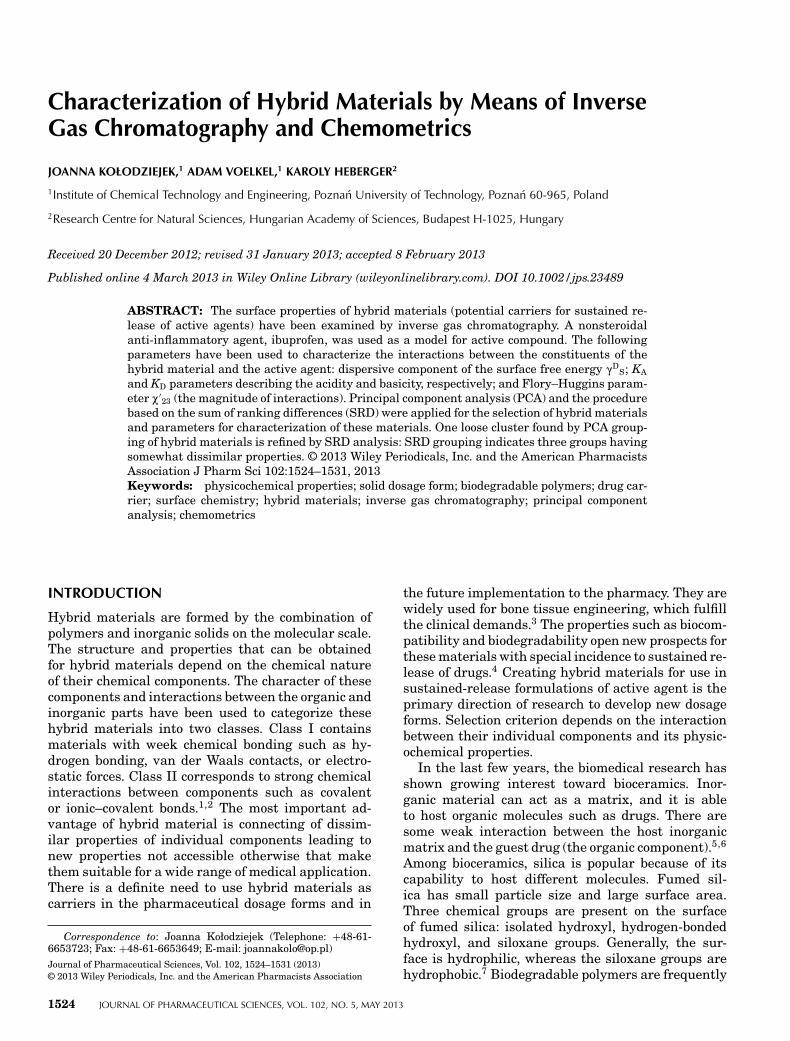
ABSTRACT: The surface properties of hybrid materials (potential carriers for sustained re-lease of active agents) have been examined by inverse gas chromatography. A nonsteroidalanti-inflammatory agent, ibuprofen, was used as a model for active compound. The followingparameters have been used to characterize the interactions between the constituents of thehybrid material and the active agent: dispersive component of the surface free energy (D
S; KA
and KD parameters describing the acidity and basicity, respectively; and Flory–Huggins param-eter P′
23 (the magnitude of interactions). Principal component analysis (PCA) and the procedurebased on the sum of ranking differences (SRD) were applied for the selection of hybrid materialsand parameters for characterization of these materials. One loose cluster found by PCA group-ing of hybrid materials is refined by SRD analysis: SRD grouping indicates three groups havingsomewhat dissimilar properties. © 2013 Wiley Periodicals, Inc. and the American PharmacistsAssociation J Pharm Sci 102:1524–1531, 2013Keywords: physicochemical properties; solid dosage form; biodegradable polymers; drug car-rier; surface chemistry; hybrid materials; inverse gas chromatography; principal componentanalysis; chemometrics
INTRODUCTION
Hybrid materials are formed by the combination ofpolymers and inorganic solids on the molecular scale.The structure and properties that can be obtainedfor hybrid materials depend on the chemical natureof their chemical components. The character of thesecomponents and interactions between the organic andinorganic parts have been used to categorize thesehybrid materials into two classes. Class I containsmaterials with week chemical bonding such as hy-drogen bonding, van der Waals contacts, or electro-static forces. Class II corresponds to strong chemicalinteractions between components such as covalentor ionic–covalent bonds.1,2 The most important ad-vantage of hybrid material is connecting of dissim-ilar properties of individual components leading tonew properties not accessible otherwise that makethem suitable for a wide range of medical application.There is a definite need to use hybrid materials ascarriers in the pharmaceutical dosage forms and in
Correspondence to: Joanna Kołodziejek (Telephone: +48-61-6653723; Fax: +48-61-6653649; E-mail: [email protected])Journal of Pharmaceutical Sciences, Vol. 102, 1524–1531 (2013)© 2013 Wiley Periodicals, Inc. and the American Pharmacists Association
the future implementation to the pharmacy. They arewidely used for bone tissue engineering, which fulfillthe clinical demands.3 The properties such as biocom-patibility and biodegradability open new prospects forthese materials with special incidence to sustained re-lease of drugs.4 Creating hybrid materials for use insustained-release formulations of active agent is theprimary direction of research to develop new dosageforms. Selection criterion depends on the interactionbetween their individual components and its physic-ochemical properties.
In the last few years, the biomedical research hasshown growing interest toward bioceramics. Inor-ganic material can act as a matrix, and it is ableto host organic molecules such as drugs. There aresome weak interaction between the host inorganicmatrix and the guest drug (the organic component).5,6
Among bioceramics, silica is popular because of itscapability to host different molecules. Fumed sil-ica has small particle size and large surface area.Three chemical groups are present on the surfaceof fumed silica: isolated hydroxyl, hydrogen-bondedhydroxyl, and siloxane groups. Generally, the sur-face is hydrophilic, whereas the siloxane groups arehydrophobic.7 Biodegradable polymers are frequently
1524 JOURNAL OF PHARMACEUTICAL SCIENCES, VOL. 102, NO. 5, MAY 2013
CHARACTERIZATION OF HYBRID MATERIALS BY MEANS OF INVERSE GAS CHROMATOGRAPHY ANDCHEMOMETRICS
1525
applied as organic materials because of the fact thatproducts of their metabolic processes are completelyremovable and nontoxic.8
Many experiments including physicochemical testsshould be carried out to implement a new hybrid ma-terial such as an excipient for pharmaceutical use.Inverse gas chromatography (IGC) will be particu-larly useful in this case. This is a new applicationfor the investigation of physicochemical properties ofthe materials used as drug carriers. This method canbe helpful in understanding the changes in hybridmaterials by various pharmaceutical processes.9 Theexamined material is placed in the chromatographiccolumn. The test solutes are injected into the flow ofcarrier gas and transported over the surface of the ex-amined material. The retention times of test solutesresults from the interactions between solute and sta-tionary phase (examined material). These retentiondata are further applied to estimate the properties ofmaterial of interest.
The retention times can be used for the determina-tion of surface activity by determination of (D
S, thedispersive component of the free surface energy, theacidity and basicity of the surface (KA and KD parame-ters); and Flory–Huggins interaction parameter P′
23,expressing the strength of interactions between theconstituents of the hybrid material.10,11 The reversed-flow gas chromatography (RFGC) is a version of IGC,and RFGC has been successfully applied (1) for themeasurement of the dispersive component of sur-face free energy, (ii) for the determination of Flory–Huggins interaction parameters, and (iii) for the de-termination of solubility parameters in polymer–sol-vent systems.12,13
The aim of this study was the characterization ofhybrid materials by IGC and application chemomet-rics to select one group of materials that could be usedas a drug carrier.
Computer programs such as Statistica [StatSoft,Inc. (2005). STATISTICA (data analysis software sys-tem), version 7.1. www.statsoft.com.] and Compari-sion of Ranks by Random Numbers–sum of rankingdifferences (SRD) allow the assessment of the qualityof results including the separation of the parametersmost relevant to the studied phenomenon. Experi-mental data were analyzed by principal componentanalysis (PCA) and a procedure based on SRD. Thesemethods allow to find similarities and dissimilaritiesamong various hybrids materials.
EXPERIMENTAL
Materials
Preparation of ternary hybrid materials with incor-poration of the active agent was achieved by the sorp-tion of ibuprofen on silica and evaporation of the
solvent. Aerosil 200V and Aerosil 816 were purchasedfrom Degussa (Darmstadt, Germany), and microcel-lulose was purchased from Rettenmaier (Weibenborn,Germany), which were used as supporting base forhybrid materials. The inorganic part was covered bypolymer. The organic constituent of hybrid materialwas obtained by using one of the following polymers:polyethylene glycol (PEG 10000), poly(L-lactide) weresupplied by Fluka, Pluronic F127 (Sigma–Aldrich,Poznan, Poland). Ibuprofen was obtained from Pol-pharma (Poznan, Poland). Hybrid systems containindividual specimens in different proportions (w/w).The amount of ibuprofen in hybrid material wasequal to 200 mg. Examined materials are presented inTable 1.
IGC Experiments
Inverse gas chromatography measurements were car-ried out with the use of a gas chromatograph (SMSLtd.) equipped with a thermal conductivity detectorand a flame-ionization detector. Carrier gas was dryhelium with flow rate of 15.0 mL/min. Each columnwas made from glass (internal diameter 4 mm, length30 cm). The measurements were carried out at 37◦C;injector and detector temperature was equal to 150◦C.The column filling was prepared by covering glassbeads with the powder to obtain homogeneous layerof the examined material. The columns were condi-tioned for 2 h at the temperature and flow rate usedduring IGC experiment. As test solutes, the followingswere used:
• nonpolar compounds: hexane (C6, purity 99%;Chempur, Tarnowskie Gory, Poland), heptane(C7, purity 99%; Sigma–Aldrich) octane (C8, pu-rity 99%; Fluka, Poznan, Poland), nonane (C9,purity 99%; Acros Organics, Gliwice, Poland);
• polar compounds: chloroform (CHCl3, analyti-cal grade; POCH S.A., Gliwice, Poland), ethanol(EtOH, purity 99%; POCH S.A.) 1,4-dioxane(C4H8O2, purity 99%, Fluka), acetonitrile (CAN,analytical grade; POCH S.A.), and ethyl acetate(CH3COOC2H5, HPLC grade; POCH S.A.).
Parameters describing surface properties of hybridmaterials were calculated from the retention data oftest solutes injected into a column with examined ma-terial played a role of stationary phase.
The dispersive component of the free surface energy(D
S was determined by two methods: Dorris–Grayand Schultz–Lavielle.14–16 In case of Schultz–Laviellemethod, (D
S parameter was calculated based on thefollowing equation:
RT ln VN = 2Na√(D
S (DL + C (1)
DOI 10.1002/jps JOURNAL OF PHARMACEUTICAL SCIENCES, VOL. 102, NO. 5, MAY 2013
1526 KOŁODZIEJEK, VOELKEL, AND HEBERGER
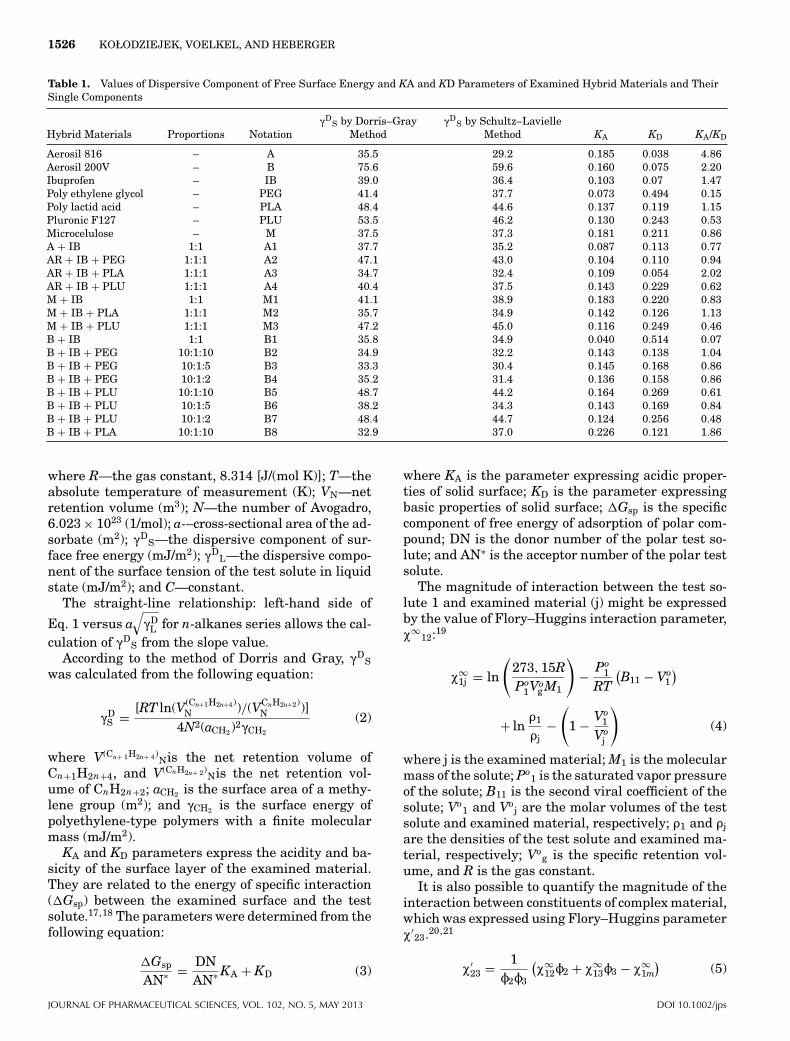
Table 1. Values of Dispersive Component of Free Surface Energy and KA and KD Parameters of Examined Hybrid Materials and TheirSingle Components
Hybrid Materials Proportions Notation(D
S by Dorris–GrayMethod
(DS by Schultz–Lavielle
Method KA KD KA/KD
Aerosil 816 – A 35.5 29.2 0.185 0.038 4.86Aerosil 200V – B 75.6 59.6 0.160 0.075 2.20Ibuprofen – IB 39.0 36.4 0.103 0.07 1.47Poly ethylene glycol – PEG 41.4 37.7 0.073 0.494 0.15Poly lactid acid – PLA 48.4 44.6 0.137 0.119 1.15Pluronic F127 – PLU 53.5 46.2 0.130 0.243 0.53Microcelulose – M 37.5 37.3 0.181 0.211 0.86A + IB 1:1 A1 37.7 35.2 0.087 0.113 0.77AR + IB + PEG 1:1:1 A2 47.1 43.0 0.104 0.110 0.94AR + IB + PLA 1:1:1 A3 34.7 32.4 0.109 0.054 2.02AR + IB + PLU 1:1:1 A4 40.4 37.5 0.143 0.229 0.62M + IB 1:1 M1 41.1 38.9 0.183 0.220 0.83M + IB + PLA 1:1:1 M2 35.7 34.9 0.142 0.126 1.13M + IB + PLU 1:1:1 M3 47.2 45.0 0.116 0.249 0.46B + IB 1:1 B1 35.8 34.9 0.040 0.514 0.07B + IB + PEG 10:1:10 B2 34.9 32.2 0.143 0.138 1.04B + IB + PEG 10:1:5 B3 33.3 30.4 0.145 0.168 0.86B + IB + PEG 10:1:2 B4 35.2 31.4 0.136 0.158 0.86B + IB + PLU 10:1:10 B5 48.7 44.2 0.164 0.269 0.61B + IB + PLU 10:1:5 B6 38.2 34.3 0.143 0.169 0.84B + IB + PLU 10:1:2 B7 48.4 44.7 0.124 0.256 0.48B + IB + PLA 10:1:10 B8 32.9 37.0 0.226 0.121 1.86
where R—the gas constant, 8.314 [J/(mol K)]; T—theabsolute temperature of measurement (K); VN—netretention volume (m3); N—the number of Avogadro,6.023 × 1023 (1/mol); a-–cross-sectional area of the ad-sorbate (m2); (D
S—the dispersive component of sur-face free energy (mJ/m2); (D
L—the dispersive compo-nent of the surface tension of the test solute in liquidstate (mJ/m2); and C—constant.
The straight-line relationship: left-hand side of
Eq. 1 versus a√(D
L for n-alkanes series allows the cal-culation of (D
S from the slope value.According to the method of Dorris and Gray, (D
Swas calculated from the following equation:
(DS = [RT ln(V(Cn+1H2n+4)
N )/(VCnH2n+2)N )]
4N2(aCH2)2(CH2
(2)
where V(Cn+ 1H2n+ 4)Nis the net retention volume of
Cn+1H2n+4, and V(CnH2n+ 2)Nis the net retention vol-
ume of CnH2n+2; aCH2 is the surface area of a methy-lene group (m2); and (CH2 is the surface energy ofpolyethylene-type polymers with a finite molecularmass (mJ/m2).
KA and KD parameters express the acidity and ba-sicity of the surface layer of the examined material.They are related to the energy of specific interaction(�Gsp) between the examined surface and the testsolute.17,18 The parameters were determined from thefollowing equation:
�Gsp
AN∗ = DNAN∗ KA + KD (3)
where KA is the parameter expressing acidic proper-ties of solid surface; KD is the parameter expressingbasic properties of solid surface; �Gsp is the specificcomponent of free energy of adsorption of polar com-pound; DN is the donor number of the polar test so-lute; and AN∗ is the acceptor number of the polar testsolute.
The magnitude of interaction between the test so-lute 1 and examined material (j) might be expressedby the value of Flory–Huggins interaction parameter,P∞
12:19
P∞1j = ln
(273, 15RPo
1Vog M1
)− Po
1
RT
(B11 − Vo
1
)
+ lnD1
Dj−
(1 − Vo
1
Voj
)(4)
where j is the examined material; M1 is the molecularmass of the solute; Po
1 is the saturated vapor pressureof the solute; B11 is the second viral coefficient of thesolute; Vo
1 and Voj are the molar volumes of the test
solute and examined material, respectively; D1 and Djare the densities of the test solute and examined ma-terial, respectively; Vo
g is the specific retention vol-ume, and R is the gas constant.
It is also possible to quantify the magnitude of theinteraction between constituents of complex material,which was expressed using Flory–Huggins parameterP′
23.20,21
P′23 = 1
N2N3
(P∞
12N2 + P∞13N3 − P∞
1m
)(5)
JOURNAL OF PHARMACEUTICAL SCIENCES, VOL. 102, NO. 5, MAY 2013 DOI 10.1002/jps
CHARACTERIZATION OF HYBRID MATERIALS BY MEANS OF INVERSE GAS CHROMATOGRAPHY ANDCHEMOMETRICS
1527
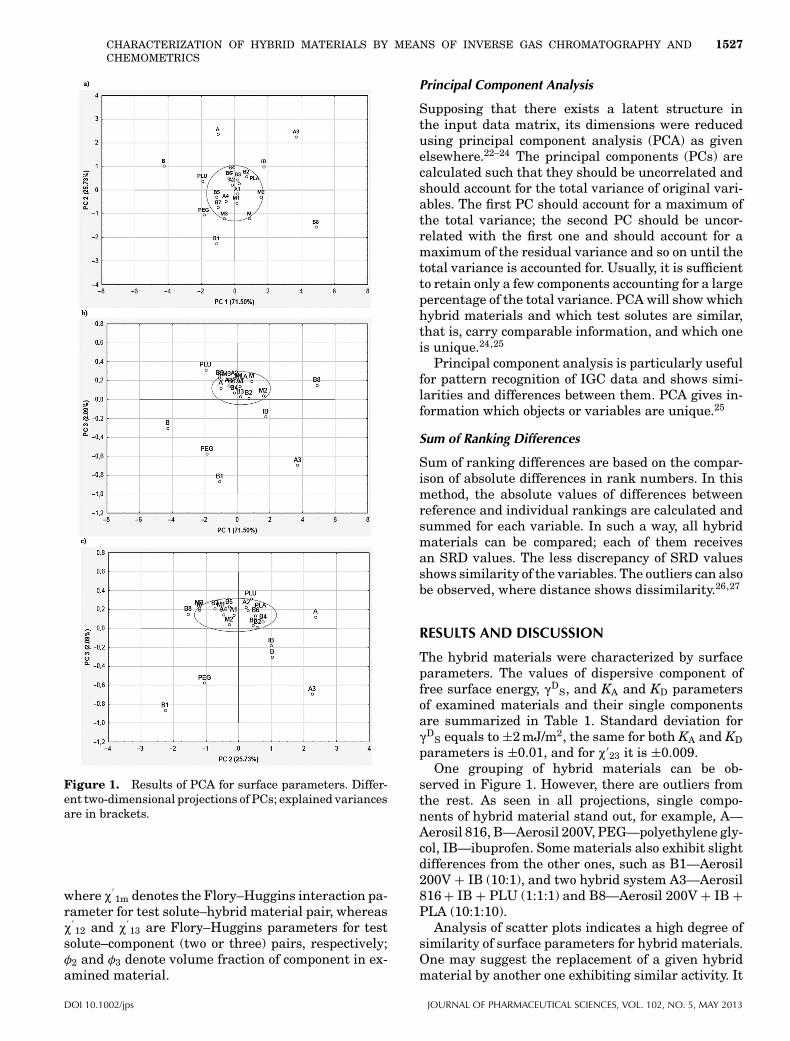
Figure 1. Results of PCA for surface parameters. Differ-ent two-dimensional projections of PCs; explained variancesare in brackets.
where P′1m denotes the Flory–Huggins interaction pa-
rameter for test solute–hybrid material pair, whereasP
′12 and P
′13 are Flory–Huggins parameters for test
solute–component (two or three) pairs, respectively;φ2 and φ3 denote volume fraction of component in ex-amined material.
Principal Component Analysis
Supposing that there exists a latent structure inthe input data matrix, its dimensions were reducedusing principal component analysis (PCA) as givenelsewhere.22–24 The principal components (PCs) arecalculated such that they should be uncorrelated andshould account for the total variance of original vari-ables. The first PC should account for a maximum ofthe total variance; the second PC should be uncor-related with the first one and should account for amaximum of the residual variance and so on until thetotal variance is accounted for. Usually, it is sufficientto retain only a few components accounting for a largepercentage of the total variance. PCA will show whichhybrid materials and which test solutes are similar,that is, carry comparable information, and which oneis unique.24,25
Principal component analysis is particularly usefulfor pattern recognition of IGC data and shows simi-larities and differences between them. PCA gives in-formation which objects or variables are unique.25
Sum of Ranking Differences
Sum of ranking differences are based on the compar-ison of absolute differences in rank numbers. In thismethod, the absolute values of differences betweenreference and individual rankings are calculated andsummed for each variable. In such a way, all hybridmaterials can be compared; each of them receivesan SRD values. The less discrepancy of SRD valuesshows similarity of the variables. The outliers can alsobe observed, where distance shows dissimilarity.26,27
RESULTS AND DISCUSSION
The hybrid materials were characterized by surfaceparameters. The values of dispersive component offree surface energy, (D
S, and KA and KD parametersof examined materials and their single componentsare summarized in Table 1. Standard deviation for(D
S equals to ±2 mJ/m2, the same for both KA and KDparameters is ±0.01, and for P′
23 it is ±0.009.One grouping of hybrid materials can be ob-
served in Figure 1. However, there are outliers fromthe rest. As seen in all projections, single compo-nents of hybrid material stand out, for example, A—Aerosil 816, B—Aerosil 200V, PEG—polyethylene gly-col, IB—ibuprofen. Some materials also exhibit slightdifferences from the other ones, such as B1—Aerosil200V + IB (10:1), and two hybrid system A3—Aerosil816 + IB + PLU (1:1:1) and B8—Aerosil 200V + IB +PLA (10:1:10).
Analysis of scatter plots indicates a high degree ofsimilarity of surface parameters for hybrid materials.One may suggest the replacement of a given hybridmaterial by another one exhibiting similar activity. It
DOI 10.1002/jps JOURNAL OF PHARMACEUTICAL SCIENCES, VOL. 102, NO. 5, MAY 2013
1528 KOŁODZIEJEK, VOELKEL, AND HEBERGER
Table 2. Values of Flory–Huggins Parameter of Examined Hybrid Materials
Materials C6 C7 C8 C9 CHCl3 EtOH CH3COOC2H5 ACN C4H8O2
B2 −3.215 −1.701 −0.537 0.537 2.429 −0.532 −3.708 −0.207 0.873B3 −3.052 −0.311 −3.625 −4.035 −3.605 −5.552 −12.106 −8.097 −0.286B4 −9.205 −2.956 −9.963 −10.33 −6.03 −13.09 −24.293 −15.92 −0.886B5 3.216 7.631 −2.081 −1.725 2.135 −2.005 −6.223 −2.676 1.561B6 −0.293 4.269 −5.188 −5.299 −1.968 −4.258 −11.408 −6.569 0.266B7 −0.999 1.224 −3.242 −3.098 6.769 −2.094 −14.986 −11.06 9.375B8 1.979 3.453 1.937 1.659 4.039 −0.846 3.765 −1.425 13.996A2 −5.083 −4.882 −4.711 −3.827 −9.245 −10.21 −11.111 −10.90 −8.409A3 −13.87 −19.34 −6.041 −5.972 −3.204 0.008 −6.521 0.929 −3.122A4 −4.993 −4.828 −4.846 −4.137 −4.663 −14.30 −7.402 −9.739 −3.925M2 1.359 4.19 0.854 0.272 0.103 3.201 1.05 5.561 0.588M3 8.205 7.764 4.496 4.598 5.727 6.385 3.733 15.118 3.593
might enable the selection of various materials hav-ing the same or very similar activity. Much higherexpectations can be associated with Flory–Hugginsparameter P′
23.The magnitude of Flory–Huggins parameter be-
tween the components of hybrid material will prob-ably depend on the chemical structure of polymericcomponent and amount of both organic and inorganicparts in the system. However, the analysis (eval-uation) of the relationship between P′
23 value andthe type of test solute used in IGC experiment isa hard task. This is a well known problem in theIGC literature.21,28,29 Values of Flory–Huggins inter-action parameter for hybrid materials are collected inTable 2.
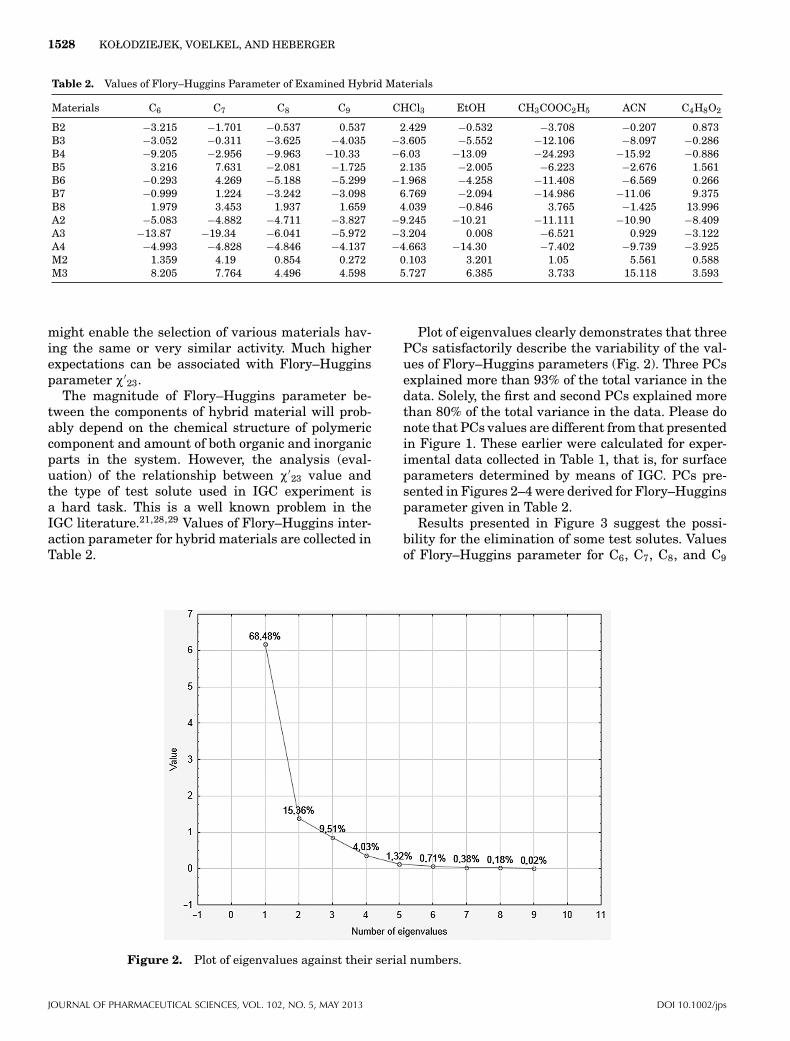
Plot of eigenvalues clearly demonstrates that threePCs satisfactorily describe the variability of the val-ues of Flory–Huggins parameters (Fig. 2). Three PCsexplained more than 93% of the total variance in thedata. Solely, the first and second PCs explained morethan 80% of the total variance in the data. Please donote that PCs values are different from that presentedin Figure 1. These earlier were calculated for exper-imental data collected in Table 1, that is, for surfaceparameters determined by means of IGC. PCs pre-sented in Figures 2–4 were derived for Flory–Hugginsparameter given in Table 2.
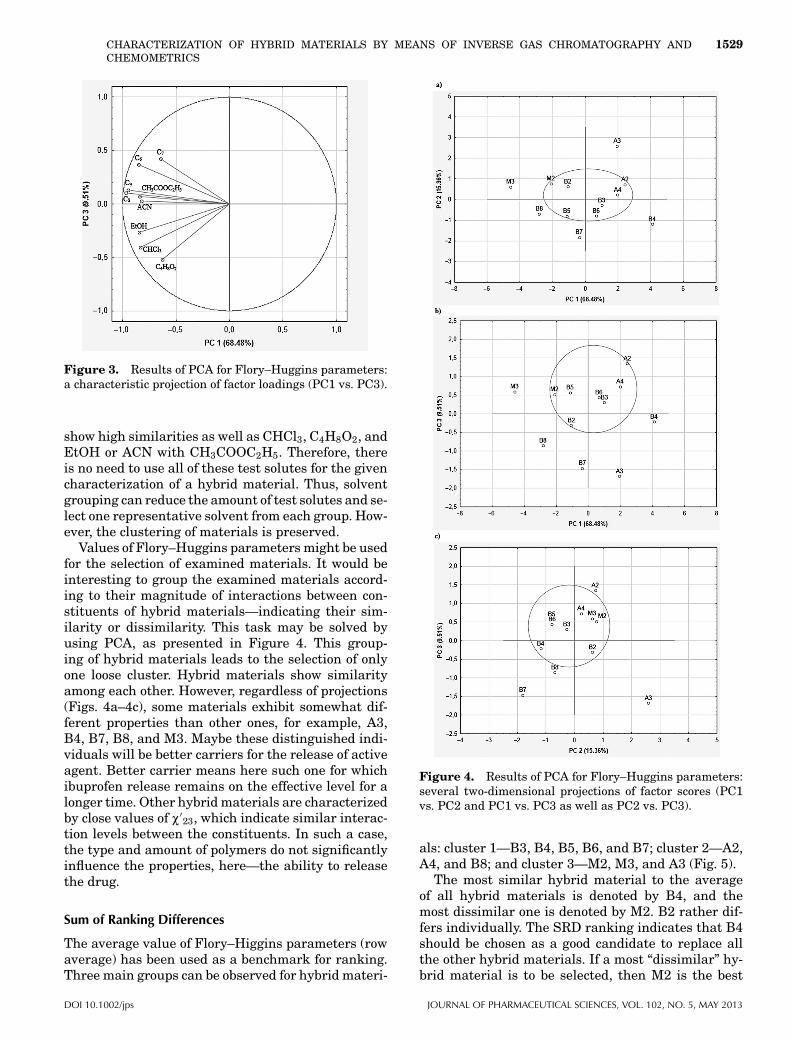
Results presented in Figure 3 suggest the possi-bility for the elimination of some test solutes. Valuesof Flory–Huggins parameter for C6, C7, C8, and C9
Figure 2. Plot of eigenvalues against their serial numbers.
JOURNAL OF PHARMACEUTICAL SCIENCES, VOL. 102, NO. 5, MAY 2013 DOI 10.1002/jps
CHARACTERIZATION OF HYBRID MATERIALS BY MEANS OF INVERSE GAS CHROMATOGRAPHY ANDCHEMOMETRICS
1529
Figure 3. Results of PCA for Flory–Huggins parameters:a characteristic projection of factor loadings (PC1 vs. PC3).
show high similarities as well as CHCl3, C4H8O2, andEtOH or ACN with CH3COOC2H5. Therefore, thereis no need to use all of these test solutes for the givencharacterization of a hybrid material. Thus, solventgrouping can reduce the amount of test solutes and se-lect one representative solvent from each group. How-ever, the clustering of materials is preserved.
Values of Flory–Huggins parameters might be usedfor the selection of examined materials. It would beinteresting to group the examined materials accord-ing to their magnitude of interactions between con-stituents of hybrid materials—indicating their sim-ilarity or dissimilarity. This task may be solved byusing PCA, as presented in Figure 4. This group-ing of hybrid materials leads to the selection of onlyone loose cluster. Hybrid materials show similarityamong each other. However, regardless of projections(Figs. 4a–4c), some materials exhibit somewhat dif-ferent properties than other ones, for example, A3,B4, B7, B8, and M3. Maybe these distinguished indi-viduals will be better carriers for the release of activeagent. Better carrier means here such one for whichibuprofen release remains on the effective level for alonger time. Other hybrid materials are characterizedby close values of P′
23, which indicate similar interac-tion levels between the constituents. In such a case,the type and amount of polymers do not significantlyinfluence the properties, here—the ability to releasethe drug.
Sum of Ranking Differences
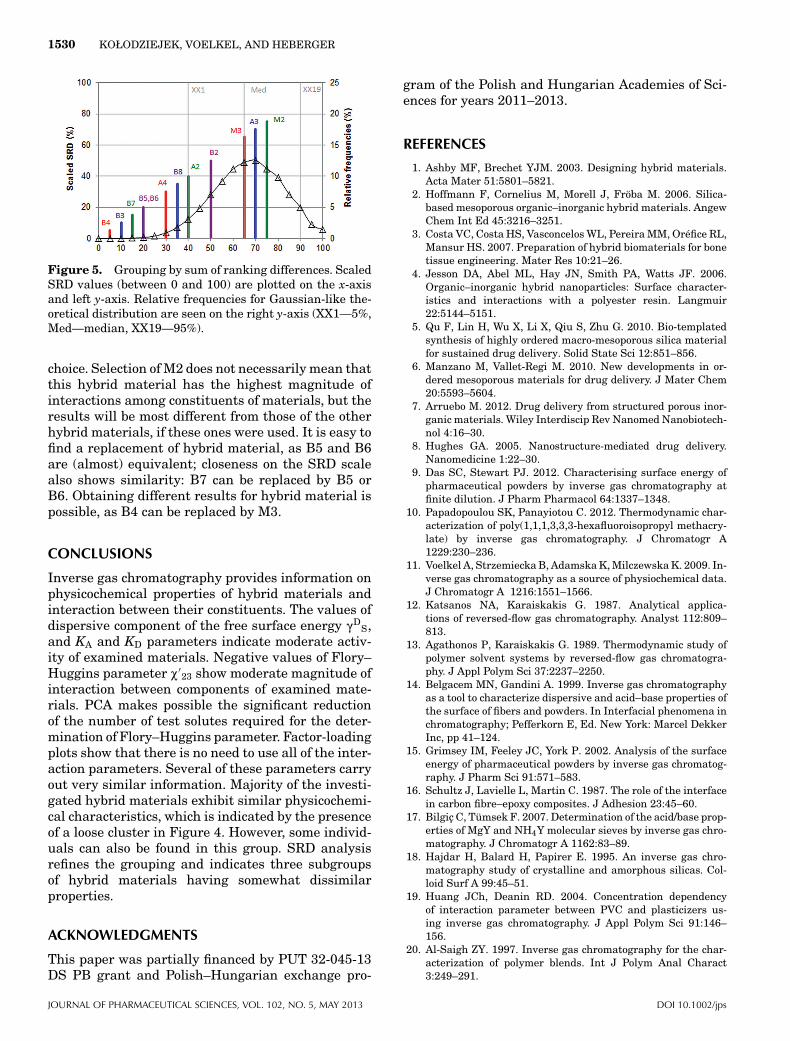
The average value of Flory–Higgins parameters (rowaverage) has been used as a benchmark for ranking.Three main groups can be observed for hybrid materi-
Figure 4. Results of PCA for Flory–Huggins parameters:several two-dimensional projections of factor scores (PC1vs. PC2 and PC1 vs. PC3 as well as PC2 vs. PC3).
als: cluster 1—B3, B4, B5, B6, and B7; cluster 2—A2,A4, and B8; and cluster 3—M2, M3, and A3 (Fig. 5).
The most similar hybrid material to the averageof all hybrid materials is denoted by B4, and themost dissimilar one is denoted by M2. B2 rather dif-fers individually. The SRD ranking indicates that B4should be chosen as a good candidate to replace allthe other hybrid materials. If a most “dissimilar” hy-brid material is to be selected, then M2 is the best
DOI 10.1002/jps JOURNAL OF PHARMACEUTICAL SCIENCES, VOL. 102, NO. 5, MAY 2013
1530 KOŁODZIEJEK, VOELKEL, AND HEBERGER
Figure 5. Grouping by sum of ranking differences. ScaledSRD values (between 0 and 100) are plotted on the x-axisand left y-axis. Relative frequencies for Gaussian-like the-oretical distribution are seen on the right y-axis (XX1—5%,Med—median, XX19—95%).
choice. Selection of M2 does not necessarily mean thatthis hybrid material has the highest magnitude ofinteractions among constituents of materials, but theresults will be most different from those of the otherhybrid materials, if these ones were used. It is easy tofind a replacement of hybrid material, as B5 and B6are (almost) equivalent; closeness on the SRD scalealso shows similarity: B7 can be replaced by B5 orB6. Obtaining different results for hybrid material ispossible, as B4 can be replaced by M3.
CONCLUSIONS
Inverse gas chromatography provides information onphysicochemical properties of hybrid materials andinteraction between their constituents. The values ofdispersive component of the free surface energy (D
S,and KA and KD parameters indicate moderate activ-ity of examined materials. Negative values of Flory–Huggins parameter P′
23 show moderate magnitude ofinteraction between components of examined mate-rials. PCA makes possible the significant reductionof the number of test solutes required for the deter-mination of Flory–Huggins parameter. Factor-loadingplots show that there is no need to use all of the inter-action parameters. Several of these parameters carryout very similar information. Majority of the investi-gated hybrid materials exhibit similar physicochemi-cal characteristics, which is indicated by the presenceof a loose cluster in Figure 4. However, some individ-uals can also be found in this group. SRD analysisrefines the grouping and indicates three subgroupsof hybrid materials having somewhat dissimilarproperties.
ACKNOWLEDGMENTS
This paper was partially financed by PUT 32-045-13DS PB grant and Polish–Hungarian exchange pro-
gram of the Polish and Hungarian Academies of Sci-ences for years 2011–2013.
REFERENCES
1. Ashby MF, Brechet YJM. 2003. Designing hybrid materials.Acta Mater 51:5801–5821.
2. Hoffmann F, Cornelius M, Morell J, Froba M. 2006. Silica-based mesoporous organic–inorganic hybrid materials. AngewChem Int Ed 45:3216–3251.
3. Costa VC, Costa HS, Vasconcelos WL, Pereira MM, Orefice RL,Mansur HS. 2007. Preparation of hybrid biomaterials for bonetissue engineering. Mater Res 10:21–26.
4. Jesson DA, Abel ML, Hay JN, Smith PA, Watts JF. 2006.Organic–inorganic hybrid nanoparticles: Surface character-istics and interactions with a polyester resin. Langmuir22:5144–5151.
5. Qu F, Lin H, Wu X, Li X, Qiu S, Zhu G. 2010. Bio-templatedsynthesis of highly ordered macro-mesoporous silica materialfor sustained drug delivery. Solid State Sci 12:851–856.
6. Manzano M, Vallet-Regi M. 2010. New developments in or-dered mesoporous materials for drug delivery. J Mater Chem20:5593–5604.
7. Arruebo M. 2012. Drug delivery from structured porous inor-ganic materials. Wiley Interdiscip Rev Nanomed Nanobiotech-nol 4:16–30.
8. Hughes GA. 2005. Nanostructure-mediated drug delivery.Nanomedicine 1:22–30.
9. Das SC, Stewart PJ. 2012. Characterising surface energy ofpharmaceutical powders by inverse gas chromatography atfinite dilution. J Pharm Pharmacol 64:1337–1348.
10. Papadopoulou SK, Panayiotou C. 2012. Thermodynamic char-acterization of poly(1,1,1,3,3,3-hexafluoroisopropyl methacry-late) by inverse gas chromatography. J Chromatogr A1229:230–236.
11. Voelkel A, Strzemiecka B, Adamska K, Milczewska K. 2009. In-verse gas chromatography as a source of physiochemical data.J Chromatogr A 1216:1551–1566.
12. Katsanos NA, Karaiskakis G. 1987. Analytical applica-tions of reversed-flow gas chromatography. Analyst 112:809–813.
13. Agathonos P, Karaiskakis G. 1989. Thermodynamic study ofpolymer solvent systems by reversed-flow gas chromatogra-phy. J Appl Polym Sci 37:2237–2250.
14. Belgacem MN, Gandini A. 1999. Inverse gas chromatographyas a tool to characterize dispersive and acid–base properties ofthe surface of fibers and powders. In Interfacial phenomena inchromatography; Pefferkorn E, Ed. New York: Marcel DekkerInc, pp 41–124.
15. Grimsey IM, Feeley JC, York P. 2002. Analysis of the surfaceenergy of pharmaceutical powders by inverse gas chromatog-raphy. J Pharm Sci 91:571–583.
16. Schultz J, Lavielle L, Martin C. 1987. The role of the interfacein carbon fibre–epoxy composites. J Adhesion 23:45–60.
17. Bilgic C, Tumsek F. 2007. Determination of the acid/base prop-erties of MgY and NH4Y molecular sieves by inverse gas chro-matography. J Chromatogr A 1162:83–89.
18. Hajdar H, Balard H, Papirer E. 1995. An inverse gas chro-matography study of crystalline and amorphous silicas. Col-loid Surf A 99:45–51.
19. Huang JCh, Deanin RD. 2004. Concentration dependencyof interaction parameter between PVC and plasticizers us-ing inverse gas chromatography. J Appl Polym Sci 91:146–156.
20. Al-Saigh ZY. 1997. Inverse gas chromatography for the char-acterization of polymer blends. Int J Polym Anal Charact3:249–291.
JOURNAL OF PHARMACEUTICAL SCIENCES, VOL. 102, NO. 5, MAY 2013 DOI 10.1002/jps

CHARACTERIZATION OF HYBRID MATERIALS BY MEANS OF INVERSE GAS CHROMATOGRAPHY ANDCHEMOMETRICS
1531
21. Milczewska K, Voelkel A. 2012. Inverse gas chromatographyin characterization of composites interaction. In Advanced gaschromatography—Progress in agricultural, biomedical and in-dustrial applications; Mohd MA, Ed. Rijeka, Croatia: InTech,pp 421–436.
22. Forlay-Frick P, Fekete J, Heberger K. 2005. Classifi-cation and replacement test of HPLC systems usingprincipal component analysis. Anal Chim Acta 536:71–81.
23. Pasadakis N, Yiokari C, Varotsis N, Vayenas C. 2001. Charac-terization of hydrotreating catalysts using the principal com-ponent analysis. Appl Catal A 207:333–341.
24. Otto M. 1999. Chemometrics, statistics and computer applica-tion in analytical chemistry. Weinheim, Germany: Wiley-VCH.
25. Wold S, Esbensen K, Geladi P. 1987. Principal component anal-ysis. Chemometr Intell Lab Syst 2:37–52.
26. Heberger K. 2010. Sum of ranking differences compares meth-ods or models fairly. Trends Anal Chem 29: 101–109.
27. Heberger K, Kollar-Hunek K. 2011. Sum of ranking differencesfor method discrimination and its validation: Comparison ofranks with random numbers. J Chemometr 25:151–158.
28. Fernandez-Sanchez E, Fernandez-Torres A, Garcia-Dominguez JA, Santiuste JM, Pertierra-Rimada E. 1988.Solubility parameters of gas chromatographic mixed station-ary phases. J Chromatogr 457:55–71.
29. Farooque AM, Deshpande DD. 1992. Studies ofpolystyrene–polybutadiene blend system by inverse gaschromatography. Polymer 33:5005–5018.
DOI 10.1002/jps JOURNAL OF PHARMACEUTICAL SCIENCES, VOL. 102, NO. 5, MAY 2013