characterization of ed-xrf technology applied to …
TRANSCRIPT

533
WOOD RESEARCH 59 (4): 2014 533-546
CHARACTERIZATION OF ED-XRF TECHNOLOGY
APPLIED TO WOODEN MATRIX
Marco Fellin, Martino Negri Cnr-Ivalsa, Trees and Timber Institute
S.Michele All’adige, Italy
Federico MazzeiTq Technologies for Quality Srl
Genova, Italy
Roberto Zanuttini*University of Torino Disafa, Department of Agricultural, Forestry and Food
SciencesGrugliasco, Italy
(Received April 2014)
ABSTRACT
The Energy Dispersive X-ray (ED-XRF) Fluorescence is an analyticals technique for detection and quantification of heavy metals, widely used in portable devices basically conceived for metallic alloys. Preliminary tests are needed to use the instrument on different matrices like wood. In this work minimum detection limit (MDL), signal to noise ratio (SNR), repeatability, relationship between measurement time and elements detected, depth of measurement, set-up (background, operator ergonomics and operator X-ray adsorbed dose) have been investigated or tested. MDL varies with time ranging from few thousands (e.g. Cl) to few units (e.g. As) of mg.kg-1. Repeatability error is 5-6 %. Average SNR ranges from 5 to 31 in function of measurement time. The measurement time influences detection of elements. Measurement depth ranges from 15 to 24 mm according to wood density and anatomy. Best backgrounds are air and shield cap. Best set-up is inside X-ray protection cabinet. Radiation leakages have been found in bench top operations. Effectiveness of technique has been proven, with limitations, in multielement analysis of wood-based products.
KEYWORDS: ED-XRF characterization, wood products, chemical composition, multielement analysis.

534
WOOD RESEARCH
INTRODUCTION
X-ray f luorescence is a well known technique for detection and quantification of chemical elements in various matrices. ED-XRF has been used to trace elements in plants since years (Williams 1976), it was used to link bark to atmospheric pollutions (Schelle 2004), and recently was successfully applied for online sorting of wood waste (Hasan et al. 2010). ED-XRF devices are basically conceived for materials different than wood, and since the analysis is strongly influenced by the analyzed matrix, this paper presents preliminary tests of calibration.
ED-XRF is based on the ionization of the inner atomic shells obtained by irradiating the samples with electromagnetic radiation: inner shell vacancies get promptly filled by outer shell electrons, with the release of radiant energy within characteristic lines carrying a signature of the emitting atom.
Fuorescence technology provides simultaneous detection of a wide number of elements analyzed, acceptable reliability, high portability, low operational costs, and short time for a single measurement. It can be used to monitor elements with atomic number (Z) higher than 12 (Mg) in high concentration, and higher than 22 (Ti) for concentrations as low as few (5 - 50) mg.kg-1 (Beckhoff et al. 2006).
Several international standards are based as well on ED-XRF technology. EN 15309: 2007 uses the technology for determination of elemental composition in waste and soil. ASTM D 4764-01: 2006 uses it in quantification of Ti in paints, by comparing the ratio of the intensities of Ti and Br peaks in the test paint and a reference standard. ASTM D7343-12: 2012 provides information about the caution should be taken in the use of ED-XRF dealings with detector resolution known interferences artifacts (escape peaks, pile-up or summation peaks, line overlaps, diffraction peaks), and proper setting. Various standards (ASTM D6052-97: 2003, ASTM F2980-13: 1998 and ASTM B568-09: 2013) consider calibration and validation processes. However none of these standards concerns wood matrices.
The appropriate use of ED-XRF involves matrix and background corrections for trace analysis (Sorensen 1981). In fact some elements providing the bulk of wood (such as C, O, H, N) are not detected by XRF (they constitute the so called “dark matter”), even if they affect the total attenuation of emitted X-rays. A software correction of the results is therefore necessary and usually done with appropriate models that manage the attenuation of the undetectable matrix and the concentration relative to the elements detected. Different models are managed as Fundamental Parameters (FP) methods (De Boer et al. 1993, Criss et al. 1978), Empirical methods and Screening methods. The analysis reported in the present work, specific for wood based materials was carried out using a specific proprietary method based on the FP method, designed to perform scans on a typical wooden matrix composed by C, O, H, N in proportions of 51, 42, 6.3, 0.1 %, respectively (EN 14961-1: 2011).
Critic aspects of ED-XRF analyses are related to MDL, occurrence of false positives-negatives, Signal to Noise Ratio (SNR), measurement time. Then, other boundaries conditions/parameters shall be accurately characterized: the error of repeatability, the quantification of measurement depth and the evaluation of different types of instrument set-up and background (which also play a key role on detection and quantification of chemical elements, on the operator ergonomics and on operator safety).
Key factor of ED-XRF use is the minimum detection limit (MDL, or limit of detection): the partial overlap of close peaks and the continuous background in the X spectra determines a MDL for the concentration of the various elements. We can assume that the MDL for a given element is the square root of C, where C is the counts number of the background, centered at

535
Vol. 59 (4): 2014
the energy of the interested peak, in the range of 3 FWHM (full width at half maximum) of the peak itself. If the efficiency of the detector, the parameters of the excitation and the solid angle are known is possible to calculate the MDL in ppm. Unfortunately some of these parameters are not available, so the MDL in ppm is not calculable. Since the innate heterogeneity of wood may complicate calibration process, in order to estimate the MDL in wood it is possible to use the MDL of polyethylene available in literature instead of the wood one. In fact the X-ray attenuation effect of these two materials behaves similarly for energies higher than 4-5 keV. A verification of this statement may be done by calculating the (μ/ρ) attenuation coefficient for used energies (Hubbell and Seltzer 1996). MDL data for polyethylene matrix are available in literature concerning 9 elements and 3 scan times. The MDL values are provided by the manufacturer (Oxford Instruments 2008 and 2009), quoted at 3 σ confidence level (99.7 %). These data may be implemented for a wide number of elements, since the MDL behavior may be approximated as very similar among elements within the same (+/-1.5 keV) energy line (Kα or Lα). This constancy is caused either by the detector efficiency either by the background noise, which do not vary significantly among similar energy. Through this process it it is possible to calculate the MDL in function of sum (C) of photon counts (cps) of a spectrum of natural non contaminated wood matrix, which is ruled by the following equations (Eqs.1-3):
(1)
where: MDL - the limit of detection (in counts), C - the number of counts in the range of 3FWHM centered on the given energy on ED-XRF spectrum, as ruled by:
(2)
where: cps - the readings of the instrument at various energies (in counts per second), E - the energy line of the element (in keV), FWHM - the full width at half maximum of the peak centered on E line. It is worth noting double space resolution in a Si detector follows the equation:
(3)
where: a and b - constant (respectively -0.0057 and 0.065), E - the energy line, in keV.
The a and b coefficient are calculated analyzing a pure Mn and Pb samples and measuring the FWHM of the Kα of Mn and the Lα of Pb.
These measures are done using natural wood, which results to be positive to certain elements, indicated in the raw ED-XRF spectra by a peak centred on energy E. In order to calculate MDL for these elements, the peak should be zeroed to a “background” line having as ends the number of counts in E+1.5 FWHM and E-1.5 FWHM.
Through the above process it is possible to calculate the MDL expressed in counts for a wide range of elements and one measurement time. With a direct proportion it is therefore possible to convert the MDL in counts to the MDL in ppm based on mass (or mg.kg-1), using the given

536
WOOD RESEARCH
MDL for polyethylene matrix found literature, which are suitable to be used for elements with similar energies (+/ 1.5 keV). Since the MDLs decreases with the square root of measurement time t following the formula (Eq. 4).
MDL(t) = MDL(t0)/t0.5 (4)
it is possible to calculate the MDL of desired measurement time tx using the equation(Eq. 5)
MDL(tx) = MDL(t30)*300.5/x0.5 (5)
where: MDL(tx) - the MDL for measuring time x, MDL(t30) - the MDL for measuring time 30 s.
These statements have a tolerable level of approximation for the goal of calculating MDL for all elements above Z 20, while for lighter elements the approximations becomes poor.
The length of measurement is a critical topic; for each element and concentration there is the due (unknown) scan time. The general rule is that longest the time, lower the MDL, lower the positives/negatives false and better the accuracy. This works within given limits, beyond which MDL, positives/negatives false and accuracy do not significantly vary.
Although setting large measurement time decreases the possibilities of false results, it reduces as well one of the main advantages of the instrument, the low time consuming.
In order to assure an acceptable accuracy together with low scan time, statistical analyses have been done, considering replica measurements, standard deviation of measurements and using logic functions to provide a semi-automatic evaluation of reliability of results (Fellin et al. 2013) these preliminary investigations involved a Limit Of Quantification 5 times higher than the MDL.
Error of repeatability describes the deviation of the measurements, repeated under the same experimental conditions (therefore without changing operator, environmental conditions, specimen, place of measurement, instrument set up...). The error of repeatability is usually expressed by the coefficient of variation (cov %) of a large set of measurements normally distributed.
SNR may be calculated in several ways depending on the type of measurement and accessible output from the instrument. SNR has been calculated using raw spectrum data from the instrument following the Eq. 6 (Bushbert 2002).
SNR= N/σ (6)
where: N - the average of signal, σ - the standard deviation.
Increasing the measurement time increases the number of photons counted by the instrument, therefore increases the SNR and reduces the MDL. The internal calibration of the instrument transforms the raw count per energy spectrum into a more user-friendly list of detected elements with concentration and standard deviation on the measurement. Changes in the measurement time causes variations in the list, either in detection of elements either in quantification of their concentration.
The maximum depth of measurement and the change of measured concentration according to variation of sample thickness are also important factors to be considered. In fact, assuming that natural wood matrix is chemically homogeneous, if a metal contaminant is present inside the matrix (e.g. a broken nail into a spruce board), the depth of ED-XRF measurement gives
537
Vol. 59 (4): 2014
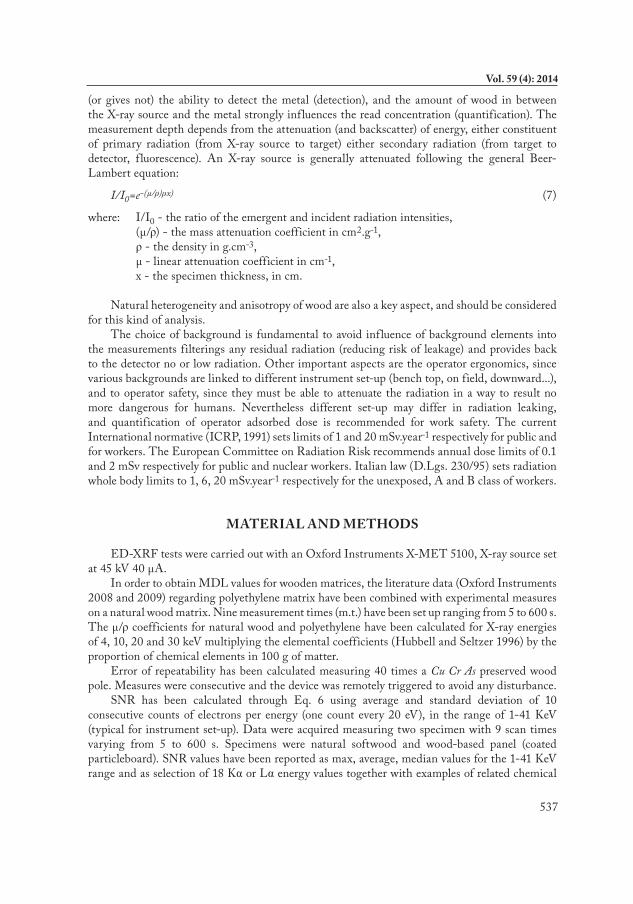
(or gives not) the ability to detect the metal (detection), and the amount of wood in between the X-ray source and the metal strongly influences the read concentration (quantification). The measurement depth depends from the attenuation (and backscatter) of energy, either constituent of primary radiation (from X-ray source to target) either secondary radiation (from target to detector, f luorescence). An X-ray source is generally attenuated following the general Beer-Lambert equation:
I/I0=e-(μ/ρ)ρx) (7)
where: I/I0 - the ratio of the emergent and incident radiation intensities, (μ/ρ) - the mass attenuation coefficient in cm2.g-1, ρ - the density in g.cm-3, μ - linear attenuation coefficient in cm-1, x - the specimen thickness, in cm.
Natural heterogeneity and anisotropy of wood are also a key aspect, and should be considered for this kind of analysis.
The choice of background is fundamental to avoid influence of background elements into the measurements filterings any residual radiation (reducing risk of leakage) and provides back to the detector no or low radiation. Other important aspects are the operator ergonomics, since various backgrounds are linked to different instrument set-up (bench top, on field, downward...), and to operator safety, since they must be able to attenuate the radiation in a way to result no more dangerous for humans. Nevertheless different set-up may differ in radiation leaking, and quantification of operator adsorbed dose is recommended for work safety. The current International normative (ICRP, 1991) sets limits of 1 and 20 mSv.year-1 respectively for public and for workers. The European Committee on Radiation Risk recommends annual dose limits of 0.1 and 2 mSv respectively for public and nuclear workers. Italian law (D.Lgs. 230/95) sets radiation whole body limits to 1, 6, 20 mSv.year-1 respectively for the unexposed, A and B class of workers.
MATERIAL AND METHODS
ED-XRF tests were carried out with an Oxford Instruments X-MET 5100, X-ray source set at 45 kV 40 μA.
In order to obtain MDL values for wooden matrices, the literature data (Oxford Instruments 2008 and 2009) regarding polyethylene matrix have been combined with experimental measures on a natural wood matrix. Nine measurement times (m.t.) have been set up ranging from 5 to 600 s. The μ/ρ coefficients for natural wood and polyethylene have been calculated for X-ray energies of 4, 10, 20 and 30 keV multiplying the elemental coefficients (Hubbell and Seltzer 1996) by the proportion of chemical elements in 100 g of matter.
Error of repeatability has been calculated measuring 40 times a Cu Cr As preserved wood pole. Measures were consecutive and the device was remotely triggered to avoid any disturbance.
SNR has been calculated through Eq. 6 using average and standard deviation of 10 consecutive counts of electrons per energy (one count every 20 eV), in the range of 1-41 KeV (typical for instrument set-up). Data were acquired measuring two specimen with 9 scan times varying from 5 to 600 s. Specimens were natural softwood and wood-based panel (coated particleboard). SNR values have been reported as max, average, median values for the 1-41 KeV range and as selection of 18 Kα or Lα energy values together with examples of related chemical

538
WOOD RESEARCH
elements. Instrument was set-up on bench top position, air background.The relationship between measurement time and detected elements has been verified, using
the same settings and specimens above described. For each measurement time the chemical element presence and concentration were recorded.
In order to evaluate depth of measurement, 30x30x0.2 mm plates of Cu (99.7 % pure) were glued to wooden specimens oriented in the 3 anatomical directions of wood. Five species were used: Spruce (Picea abies), larch (Larix decidua), beech (Fagus sylvatica), and two African mahoganies (Entandrophragma spp. and Khaya spp.) conditioned at 12 % of moisture content. Specimens were processed with repeated cross cut sessions alternated with about 7 ED-XRF measurements targeted right on the copper plate, through the 3 anatomical directions of wood. Readings of Cu concentration given by the instrument were noted together with specimen thickness and anatomical direction crossed by X-rays. In order to guarantee the statistical validity, the measurements were replicated on another set of beech specimens, 2 specimens for anatomical direction. Each wedge shaped specimen measured 500 mm in length, 20 mm in width, 10 and 25 mm in the short and long thickness. An automatic measuring system performed 22 measurements per 11 replicas, for a total of 1452 measurements.
The maximum thickness of detection has been identified in the point where ED-XRF stops reading the wood natural concentration of Cu, and it starts reading the Cu concentration power curve given by the Cu plate readings in function of wood thickness. The wood natural concentration of Cu is the average of those measurements where specimen thickness completely attenuated X-rays to reach Cu plate, resulting in a constant linear response of Cu concentration in function of thickness. On the opposite, the Cu concentration power curve is given by those measurements of Cu where X-rays reached the Cu plate. The intersection point of these two lines (the power curve and the straight line) corresponds to the maximum thickness of detection, and has been pinpointed through the use of first derivative and the coefficient of determination (r2) of the two lines.
It shall be noted that since the primary X-rays beam direction is rotated about 25 degrees (Oxford 2009) in respect to the vertical axis of the used set-up, the real path passed by X-rays is therefore a=b/cos25, where a is the effective X-ray path and b is the specimen thickness. For the end user the real path has no practical meaning, therefore in the rest of the paper only the specimen thickness has been considered.
Various set-up of ED-XRF are possible. Set-up includes the orientation of the device which may be downward (typical for on field application), horizontal (e.g. wood pole on field), upward (bench-top, laboratory set-up). Set-up also includes the boundaries X-rays protections for operator, which may be a leaded cabinet (designed for radiography), an enclosure made of 2.5 mm thick lead which surrounds the equipment letting an aperture on the top, a safety shield cap (Oxford Instruments plc). These protections are particularly useful when measuring low density samples like wood-based materials, which may let radiations passing through them and/or may cause radiation scatter. Each set-up requires the choice of an appropriate background. Various backgrounds have been tested placing the ED-XRF in direct contact with them (most severe test), then acquiring the spectrum in the range of 1-41 KeV. The tested backgrounds were a background plate and a safety shield cap given as accessories with the instrument, a homemade background plate, an amount of normal air (about 40 cm, to be used only for measurements in upward position inside an X-ray protection cabinet).
Radiation leakage was monitored using a Vectoreen Fluke 451P ion chamber, on the above set-up and backgrounds parameters. Measures were done at various distances and with or without a 1 cm thick specimen of spruce.

539
Vol. 59 (4): 2014
RESULTS AND DISCUSSION
Calibration tests helped in definition of limits and capabilities of the ED-XRF system applied to wooden matrices. The calculation of MDL for wooden matrix gave the results presented in Tab. 1. Values are rounded and expressed for convenient m.t. and most useful chemical elements.
Elements with atomic number lighter than 17 cannot be traced, while for elements ranging Z 39-45 and Z 54 there is a lack of literature data for calculating a reliable MDL. The MDL resulted to be in mid concentrations (thousands of mg.kg-1) for elements up to 19 (K), in concentrations of tenths-hundreds mg.kg-1 for elements higher than 20 (Ca) and from 51 (Sb) to 56 (Ba), and as low as few mg.kg-1 for the remaining elements.
Tab. 1: ED-XRF Oxford 5100 minimum detection limits (MDL) for wooden matrix. Rounded values.
MDL in wood matrix (mg.kg-1)Element Measurement time (s)
Z Name Symbol 5 10 15 20 30 60 120 180 60017 Chlorine Cl 23000 16000 13000 11000 9000 7000 5000 4000 200019 Potassium K 20000 14000 12000 10000 8000 6000 4000 3000 200020 Calcium Ca 350 250 200 170 140 100 70 60 3022 Titanium Ti 300 200 180 150 130 90 60 50 3023 Vanadium V 30 19 15 13 11 8 5 4 224 Chromium Cr 20 16 13 11 9 6 5 4 225 Manganese Mn 19 13 11 9 8 5 4 3 226 Iron Fe 38 27 22 19 16 11 8 6 327 Cobalt Co 15 11 9 8 6 4 3 3 128 Nickel Ni 15 10 8 7 6 4 3 2 129 Copper Cu 23 16 13 11 9 7 5 4 230 Zinc Zn 20 14 12 10 8 6 4 3 233 Arsenic As 12 9 7 6 5 4 3 2 134 Selenium Se 12 9 7 6 5 4 3 2 135 Bromine Br 12 9 7 6 5 4 3 2 138 Strontium Sr 4 3 2 2 2 1 1 1 0.447 Silver Ag 30 21 17 15 12 9 6 5 348 Cadmium Cd 29 21 17 15 12 8 6 5 350 Tin Sn 61 43 35 30 25 18 12 10 651 Antimony Sb 59 42 34 29 24 17 12 10 555 Cesium Cs 340 240 190 170 140 100 70 56 3156 Barium Ba 300 210 180 150 120 90 60 51 2873 Tantalum Ta 23 16 13 11 9 7 5 4 274 Tungsten W 26 18 15 13 10 7 5 4 279 Gold Au 4 3 2 2 1 1.0 0.7 0.6 0.380 Mercury Hg 3 2 2 1 1 0.8 0.6 0.5 0.381 Thallium Tl 12 8 7 6 5 3 2 2 182 Lead Pb 2 2 1 1 1 0.7 0.5 0.4 0.290 Thorium Th 3 2 2 1 1 0.8 0.6 0.5 0.392 Uranium U 4 3 2 2 2 1.1 0.8 0.6 0.4
540
WOOD RESEARCH
The measurements for calculating the repeatability error resulted to be normally distributed (Shapiro-Wilk test, Shapiro and Wilk (1965). Repeatability error resulted, to be 5 5.4 and 5.9 % for Cr, Cu and As, respectively.
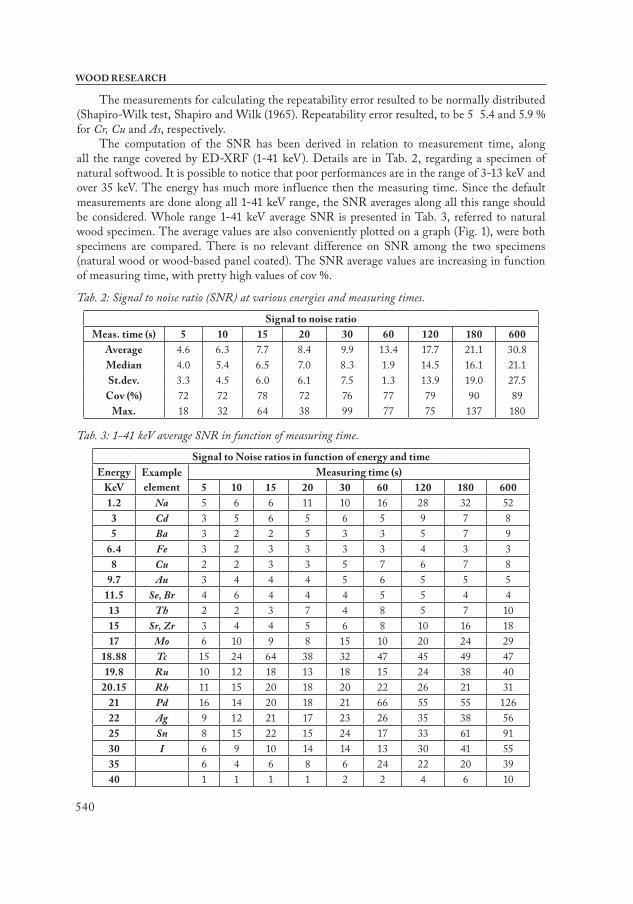
The computation of the SNR has been derived in relation to measurement time, along all the range covered by ED-XRF (1-41 keV). Details are in Tab. 2, regarding a specimen of natural softwood. It is possible to notice that poor performances are in the range of 3-13 keV and over 35 keV. The energy has much more influence then the measuring time. Since the default measurements are done along all 1-41 keV range, the SNR averages along all this range should be considered. Whole range 1-41 keV average SNR is presented in Tab. 3, referred to natural wood specimen. The average values are also conveniently plotted on a graph (Fig. 1), were both specimens are compared. There is no relevant difference on SNR among the two specimens (natural wood or wood-based panel coated). The SNR average values are increasing in function of measuring time, with pretty high values of cov %.
Tab. 2: Signal to noise ratio (SNR) at various energies and measuring times.
Signal to noise ratioMeas. time (s) 5 10 15 20 30 60 120 180 600
Average 4.6 6.3 7.7 8.4 9.9 13.4 17.7 21.1 30.8Median 4.0 5.4 6.5 7.0 8.3 1.9 14.5 16.1 21.1St.dev. 3.3 4.5 6.0 6.1 7.5 1.3 13.9 19.0 27.5
Cov (%) 72 72 78 72 76 77 79 90 89Max. 18 32 64 38 99 77 75 137 180
Tab. 3: 1-41 keV average SNR in function of measuring time.
Signal to Noise ratios in function of energy and timeEnergy Example
elementMeasuring time (s)
KeV 5 10 15 20 30 60 120 180 6001.2 Na 5 6 6 11 10 16 28 32 52
3 Cd 3 5 6 5 6 5 9 7 85 Ba 3 2 2 5 3 3 5 7 9
6.4 Fe 3 2 3 3 3 3 4 3 38 Cu 2 2 3 3 5 7 6 7 8
9.7 Au 3 4 4 4 5 6 5 5 511.5 Se, Br 4 6 4 4 4 5 5 4 413 Th 2 2 3 7 4 8 5 7 1015 Sr, Zr 3 4 4 5 6 8 10 16 1817 Mo 6 10 9 8 15 10 20 24 29
18.88 Tc 15 24 64 38 32 47 45 49 4719.8 Ru 10 12 18 13 18 15 24 38 40
20.15 Rh 11 15 20 18 20 22 26 21 3121 Pd 16 14 20 18 21 66 55 55 12622 Ag 9 12 21 17 23 26 35 38 5625 Sn 8 15 22 15 24 17 33 61 9130 I 6 9 10 14 14 13 30 41 5535 6 4 6 8 6 24 22 20 3940 1 1 1 1 2 2 4 6 10

541
Vol. 59 (4): 2014
Fig. 1: 1-41 keV average SNR in function of measuring time, for 2 specimens of natural wood (in white) and wood-based panel (in grey).
Measurements performed with different m.t. on natural or polluted specimens showed variations in elements detection and concentration in function of measurement time (Fig. 2 and 3). In general, some elements (Ba, Cr, Fe, Pb, Sr, Ti, Zn for wooden panel and Ca, Mn, Sr, Zn for natural wood) were detected for all m.t. (with some lack in 5 or 10 s of m.t.). Some elements (As, Cu for wooden panel and Cu for natural wood) begun to be detected from 60 s m.t. Some elements (Br, Hg, Ni, Ta for wooden panel and Cd, Cr for natural wood) appeared in low concentrations with m.t. of 2 or 3 minutes. Remaining elements (Mn, Sb, Se, for wooden panel and Ag, Ni, Pb for natural wood) begun to be detected at extremely low concentrations at 10 minutes m.t. Case apart are the detection of Sn and Ag in 5 s measurements, which can be considered as a probable false positive observing the raw spectra. Regarding concentration values, for all elements they ranged in function of m.t. slightly increasing or decreasing; there is no common trend, but the oscillations around the average are limited.
It is possible to identify 3 threshold measurement times of 15 s, 60 s and 600 s which may be respectively used for a fast and accurate detection of mid-high concentration elements, a quite fast and accurate detection of low concentration elements and a slow (10 minutes) detailed analysis of very low concentration elements.
Fig. 2: (left) and 3: Chemical element detection and concentration in function of measurement time; measurements on natural wood (left) and wood-based panel (right).
Calculation of X-ray mass attenuation coefficient gave the results showed in Tab. 4. Among broad-leaves and coniferous woods there are no significant variations while among wood and polyethylene there is a slight difference that ranges from 13 to 46 %. This may be taken in consideration and used as correction factor in calculation of MDL.

542
WOOD RESEARCH
Tab. 4: X-ray mass attenuation coefficient for wood and polyethylene for convenient energies.
Mass attenuation coefficients (μ/ρ)Energy Coniferous wood Broad-leaf wood Polyethylene Coniferous/ PET Broad-leaf / PET
μ/ρ μ/ρ μ/ρkeV cm2 .g-1 cm2 .g-1 cm2 .g-1 Difference %
4 5848 5959 3242 45 4610 374 381 209 44 4520 61 62 43 30 3030 31 31 27 13 14
Test about measurement depth gave a range of 15-24 mm, as maximum detection thickness. Details are shown in Tab. 5. There are modest differences among anatomical directions, probably caused by variations in backscatter and wood constitution (e.g. early rings...).
Since the density ρ is a key parameter to determine measurement depth (x), it is possible to plot thickness of detection in function of wood density at 12 % moisture content (Fig. 4 left), allowing an esteem of values for other species of known density. The quantification of concentration of the Cu it is strongly influenced by the thickness of material in between metal and instrument, which attenuates the X-rays (Fig. 5).
Tab. 5: Maximum thickness of wood allowing the detection of a Cu plate.
Wood species
Max detection thickness (mm)Radial Tangential Axial
Picea 24.1 22.6 24.1Khaya 20.0 21.4 19.8Larix 17.2 21.2 19.7Fagus 15.8 14.8 15.3
Entandrophragma 15.5 15.0 16.6
Testing of different backgrounds resulted that the shield cap (Oxford Instruments plc) and 40 cm of air at normal conditions have better attenuation of radiations (Fig. 6). The background plate (Oxford Instruments plc) had slightly lower performances and the homemade background plate resulted to be the worst one.
Various set-ups have been tested and evaluated for operator safety, type of background used, operator ergonomics and maximum dimensions of specimens (Tab. 6). All the set-ups that involve a direct protection (cases 1, 2, 3) showed no radiation leaks (background radiation = 0.1 μSv.h-1). These set-ups use best (cases 1 and 2) and good (3) backgrounds, but they have fair (1 and 3) and severe (2) restrictions in specimen size. The operator ergonomics is average in cases 1 and 2 because of the need to close cabinet or cap at every measurement; it is low in case 3 because of the accurate re-positioning of the enclosure at every measurement and finally it is average in case 6 (measurement on wood pole) for the need of supporting the device for all the length of measurement. In the cases 4 (typical for on-field measurements) and case 5 the operator ergonomics is good and there are no limitations on specimen size. Leakages of radiation are detected, approx. double in case 5 than case 4, and six times greater in case 6 than in 4. These leaks have been measured at just 0.1 m from source, a distance were only the operator hand is present for the first few seconds of measurements (then measures continues automatically, without the need of maintaining the trigger pushed by the operator, who can remove the hand to a safer

543
Vol. 59 (4): 2014
Fig. 4: Detection of metal plate in function of wood thickness and anatomical direction of wood. Fagus measurements, in black, have more statistical validity.
Fig. 5: Changes in quantification of copper plate in function of wood thickness. Various species, radial measurement. Fagus measurements, in black, have more statistical validity.
place if there is no need of supporting the instrument like in case 6). In cases 5a and 5b are reported radiation measurements done for set-up 5 at 0.3 and 1 m from source: radiation exposure drastically decreases with distance, and reaches zero at 1 m (the approx. instrument-operator head distance). Similarly the radiation exposure drastically decreases with distance in case 6, even if it does not reach zero, suggesting to avoid or to take extra care when using this kind of set-up.
Summarizing the various set-ups tradeoff, the case 1 results to be the best choose for safety, background and size of specimens. On-field measurements (case 4) should be preferred to bench top measurements (case 5), but in both cases operator should take care of using a specimen of adequate thickness/density and to distance oneself as soon as measurement starts. Wood pole measurements maintain a certain level of radiation leakage, which suggest to limit this kind of analyses.
Fig. 6: ED-XRF spectra of various backgrounds.

544
WOOD RESEARCH
Tab. 6: ED-XRF set-ups and relative operator adsorbed dose. Maximum exposure time is calculated on 1 mSv.year-1 threshold.
Case
Set-up Radiation leakage Operations
OrientationSpecimen
(1 cm spruce)Protection
Back-
ground
Distance of
measurement
(m)
EmissionsMaximum
exposure
(h.year-1)
Operator
ergonomics
Max
specimen
size (cm)0.1 0.3 1 μSv.h-1
1 upward no cabinet Air x 0.1 10000 low 60x60x302 upward no shield cap Cap x 0.1 10000 average 8x4x2,53 down-ward no enclosure Plate x 0.1 10000 average 40X40x204 down-ward yes none Plate x 12 83 good Unlimited5 upward yes none Air x 29 34 good Unlimited5a upward yes none Air x 3 333 good Unlimited5b upward yes none Air x 0.1 10000 good Unlimited6 horizontal yes none Air x 70 14 average Unlimited6a horizontal yes none Air x 14 71 average Unlimited6b horizontal yes none Air x 0.3 3333 average Unlimited
CONCLUSIONS
ED-XRF is a technology designed for metallic alloys, which may be used conveniently on wooden matrices after a proper calibration.
MDL of elements lighter than Cl can be difficulty or not be traced, elements up to K can be traced in mid concentrations (thousands of mg.kg-1), higher than Ca and from Sb to Ba in concentrations of tenths-hundreds mg.kg.1, remaining elements can be traced up to concentrations as low as few mg.kg-1. The repeatability error has been quantified in 5-6 %. The SNR showed greater variability in function of energy than in function of measurement time. Whole range 1-41 keV energy average SNR ranged from 5 to 31 for 5 and 600 s of measurement time, respectively. Changing measurement time varies the elements detected. Measurement time thresholds of 15 s, 60 s and 600 s may be respectively used for a fast and accurate detection of mid-high concentration elements, a quite fast and accurate detection of low concentration elements and a detailed analysis of very low concentration elements. Measurement depth reached at maximum 24 mm in lower density wood specie, and was measured in 15 mm for more dense specie. Depth of measurement showed a strong influence in quantification of metals. Best backgrounds resulted to be the shield cap (Oxford Instruments plc) and 40 cm of air at normal conditions. Best trade-off in set-up parameters resulted to be ED-XRF placed bench top inside the X-ray protection cabinet. Radiation leakages were found in some other set-up, which should be carefully considered by operators.
The boundaries conditions, limit and potential of ED-XRF technology applied to wooden matrices have been quantified. The use of this detection instrument applied to wood-based products is proficient for detection and quantification of heavy metals, and it gives reliable results if proper set-up is chosen.
ACKNOWLEDGEMENTS
TQ Technologies for Quality Srl for helping characterizing the instrument, Eleonora Ragno - CNR for law exposition limits and radiation leakage measurements, Dario Sacco for the help in statistics.

545
Vol. 59 (4): 2014
REFERENCES
1. ASTM B568, 1998 (Reapproved 2009): Standard test method for measurement of coating thickness by X-Ray spectrometry.
2. ASTM D4764, 2006 (Reapproved 2012): Standard test method for determination by X-ray f luorescence spectroscopy of titanium dioxide content in paint.
3. ASTM D7343, 2012 (Designation: 558/07): Standard practice for optimization, sample handling, calibration, and validation of X-ray f luorescence spectrometry methods for elemental analysis of petroleum products and lubricants.
4. ASTM D6052, 2003: Standard test method for preparation and elemental analysis of liquid hazardous waste by energy-dispersive X-Ray fluorescence.
5. ASTM F2980, 2013: Standard test method for analysis of heavy metals in glass by field portable X-Ray fluorescence (XRF).
6. Beckhoff, B., Kanngießer, B., Langhoff, N., Wedell, R., Wolff, H., 2006: Handbook of practical X-Ray fluorescence analysis. Springer Berlin Heidelberg. NewYork, 878 pp.
7. De Boer, D.K.G., Borstrok, J.J.M., Leenaers, A.J.G., Van Sprang, H.A., Brouwer, P.N., 1993: How accurate is the fundamental parameter approach? XRF analysis of bulk and multilayer samples. X-Ray Spectrometry 22(1): 33-38.
8. Bushbert, J. T., 2002: The Essential physics of medical imaging. Lippincott Williams & Wilkins, 933 pp.
9. Criss, J.W., Birks, L.S., Gilfrich, J.V., 1978: Versatile x-ray analysis program combining fundamental parameters and empirical coefficients. Analytical Chemistry, 50(1): 33–37.
10. Decreto Legislativo D.Lgs. 17/3/1995: N° 230, Attuazione delle direttive 89/618/Euratom, 90/641/Euratom, 92/3/Euratom e 96/29/Euratom in materia di radiazioni ionizzanti.
11. EN 14961, 2010: Solid biofuels: Fuel specifications and classes.12. EN 15309, 2007: Characterization of waste and soil. Determination of elemental
composition by x-ray f luorescence.13. Fellin, M., Negri, M., Zanuttini, R., 2013: Multi-elemental analysis of wood waste using
energy dispersive X-ray f luorescence (ED-XRF) analyzer. European Journal of Wood and Wood 12(21): 199-211.
14. Hasan, R., Schindler, J., Solo-Gabriele, H.M., Townsend, T.G., 2010: Online sorting of recovered wood waste by automated XRF-technology. Part I: detection of preservative-treated wood waste. Waste management 31(4): 688-694.
15. Hubbell, J.H., Seltzer, S.M., 1996: Standard reference database 126, tables of X-ray mass attenuation coefficients and mass energy-absorption coefficients from 1 keV to 20 MeV for elements Z = 1 to 92 and 48 additional substances of dosimetric interest. National Institute of Standards and Technology.
16. ICRP, 1991: 1990 Recommendations of the international commission on radiological protection. ICRP Publication 60. Ann. 21 (1-3).
17. Oxford Instruments, 2008: Elements detection limits – Soil package. Technical note.18. Oxford Instruments, 2009: X-MET5000 and 5100 User Manual, Rev.1.10. Part Number
5102113-4VE.19. Schelle, E.L., 2004: Multielemental analysis of tree bark with special reference to
measurement and mapping of air pollution. PhD thesis, University of Scheffield (U.K.).20. Shapiro, S.S., Wilk, M.B., 1965: An analysis of variance test for normality (complete
samples). Biometrika 52(3-4): 591-611.

546
WOOD RESEARCH
21. Sorensen, I., 1981: A calculated background correction method for XRF. Spectrochimica Acta 36B(3): 243-249.
22. Williams, C., 1976: The rapid determination of trace elements in soils and plants by X-ray f luorescence analysis. Journal of the Science of Food and Agriculture 27(6): 561-570.
Marco Fellin, Martino Negri Cnr-Ivalsa, Trees and Timber Institute
Via Biasi 75 and FoxlabVia Mach 1
38010 S. Michele All’adige Italy
Federico MazzeiTq Technologies for Quality SrlVia Marsilio Da Padova, 2 Rosso
16146 Genova Italy
Roberto Zanuttini*University of Torino Disafa,
Dept. of Agricultural, Forestry and Food Sciences Via Leonardo Da Vinci 44
10095 Grugliasco Italy
Phone: +390116705542Corresponding author: [email protected]