characterization of dam breaching following … of dam breaching following overtopping ... performed...
TRANSCRIPT

Characterization of dam breaching following overtopping
Ana Margarida Bento
November 4, 2013
Abstract
Bearing in mind the scope of the present paper, the overall objective is the characterization of e�uent
hydrographs caused by overtopping failures of earth dams. Two laboratory experiments on homo-
geneous embankments (hdam = 45/48 cm) were performed in a medium scale facility of National
Laboratory of Civil Engineering (LNEC). Suitable instrumentation and measurement methods en-
abled two indirect and one direct estimation of the breach e�uent hydrograph. Di�erent compaction
energies and di�erent pilot channel geometries were used. The resultant hydrographs show that the
surface erosion is the main mechanism for breach enlargement, although key features such as sudden
increase are explained by localized mass instability events.
Keywords: overtopping, dam-breach, e�uent hydrograph, LSPIV
1 Introduction
The large bene�t of dams to people worldwide is well known. Nevertheless, the large quantities of water
suddenly released and the consequences of dam failure, such as the property damage and the loss of life,
are all of prime importance to our society (Wahl, 1998). A dam-break �ood event may also cause adverse
ecological and environment impact upstream and downstream of the dam. In Portugal, the failure of
the Fonte Santa mine tailings dam generated a �ood wave that caused signi�cant morphological changes
in the valley of Ribeira da Fonte Santa, tributary of Rio Sabor, mostly due to the deposition of muds
contaminated with metals from mine washing.
According to ICOLD (2013), 75 % of the dams in service around the world are embankment dams, which
can also be divided in 'earth �ll' and 'rock �ll' dams, depending on whether it is comprised of compacted
earth or mostly compacted of dumped rock, respectively.
From all the causes of dam failures, overtopping phenomenon constitutes the most common in embank-
ment dams. According to ICOLD (2013), it represents 35 % of all embankment failures in the world.
Thus and due to the impossibility of completely eliminate that risk, the challenge lies on understanding
how the dam behaves face to an overtopping failure.
Therefore, the purpose of this work is to quantify the breach hydrograph resulting from overtopping of
an homogeneous earth dam and to discuss the inherent hydraulic and geotechnical phenomena. Two
dam-breach experiments on homogeneous embankments are performed to further the understanding of
the breach mechanisms underlying the interaction between the �uid �ow and the dam material.
1
In order to ensure adequate hydraulic and mechanical properties for the soil and homogeneity of the
embankments, two trial embankments were performed, varying the compactor, energy of compaction and
the layer thickness.
2 Dam-breach experiments
2.1 Experimental set-up
2.1.1 Facilities
The dam-breach experiments were conducted in a channel 31.5 m long, between 6.60 - 1.70 m wide and
between 0.5 - 1.30 m deep. At 17.7 m from the reservoir inlet, vertical concrete walls (0.5 m height) were
built to narrow the length of the dam crest of the embankment models (1 m for the �rst experiment
and 1.5 m for the second experiment - see �gure 9 and 10). The reservoir �lling did not required special
care with wave development due to its high capacity. The channel �lling was performed by a pumping
system, which as a �ow controller with 200 l/s as maximum capacity (two pumps - 100 l/s each). Water
was pumped from a storage tank (with approximately 90 m3/s of maximum stored volume) to another
tank located above the pumping room where it was transported, by gravity, to the reservoir by a pipe
with 350 mm diameter. This channel had an antechamber separated from the main channel by a hollow
brick wall to curb large turbulent scales and evenly distribute the �ow towards the embankments. At
the end of the channel was located a settling basin with 1.7 m width, 4.5 m length and a maximum
water/sediments height of approximately 0.60 m. For the second experiment, two lateral spillways, 2.5
m long, were performed with the aim of improving the control/measurement of the temporal variation of
the reservoir water level.
2.1.2 Earth embankments
The embankment models built to perform the two dam-breach experiments used only one type of soil.
The speci�c gravity (Gs) was measured with a pycnometer (Gs = 2.64). The grain-size distribution curve
was built from sieve and sedimentation analysis and is shown in �gure 1.
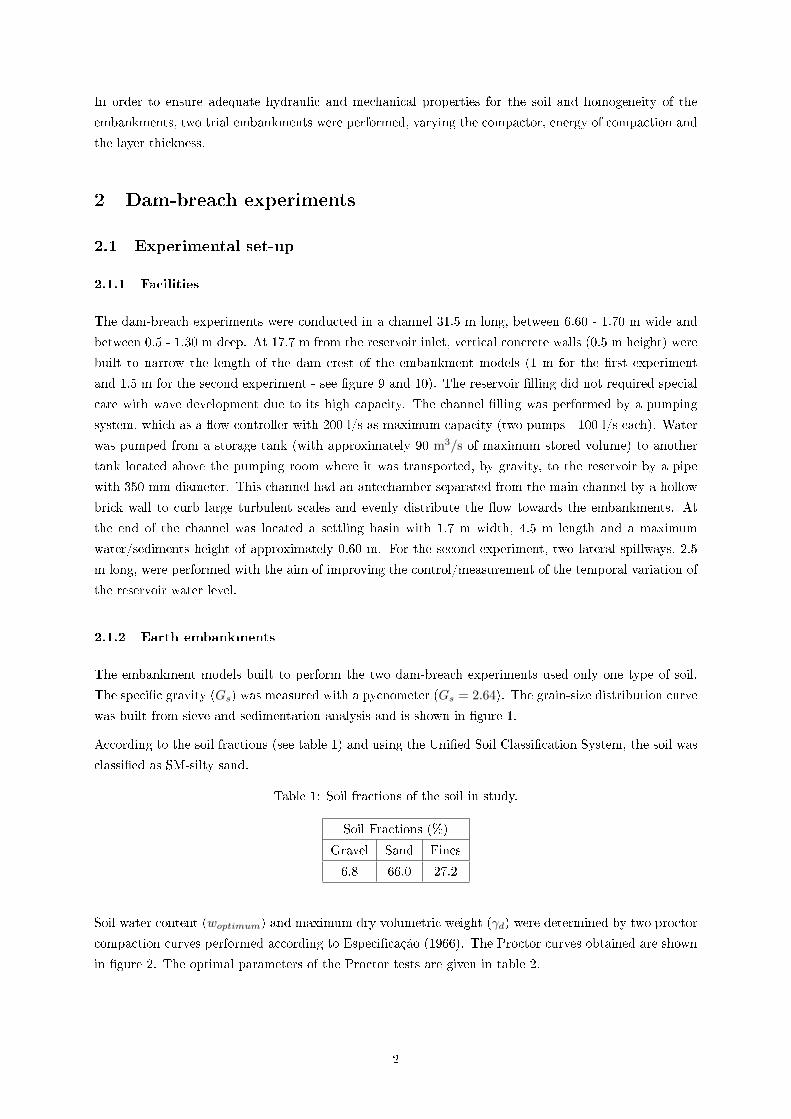
According to the soil fractions (see table 1) and using the Uni�ed Soil Classi�cation System, the soil was
classi�ed as SM-silty sand.
Table 1: Soil fractions of the soil in study.
Soil Fractions (%)
Gravel Sand Fines
6.8 66.0 27.2
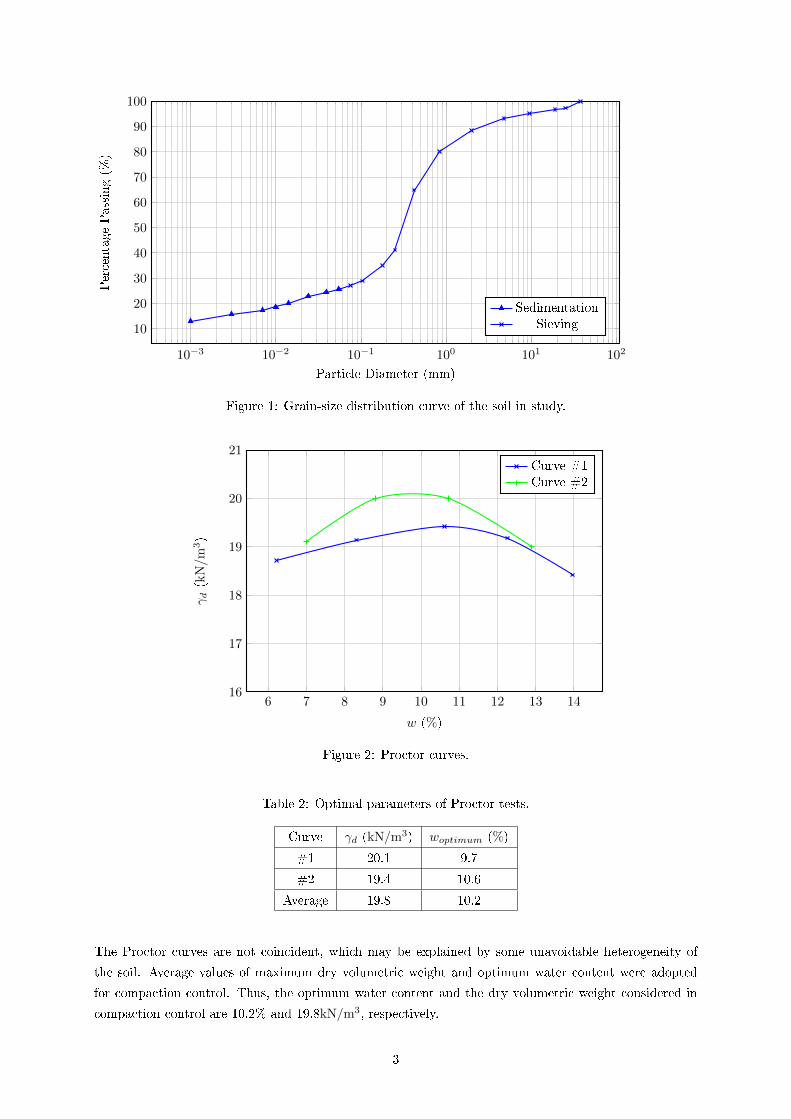
Soil water content (woptimum) and maximum dry volumetric weight (γd) were determined by two proctor
compaction curves performed according to Especi�cação (1966). The Proctor curves obtained are shown
in �gure 2. The optimal parameters of the Proctor tests are given in table 2.
2
10−3 10−2 10−1 100 101 102
10
20
30
40
50
60
70
80
90
100
Particle Diameter (mm)
PercentagePassing(%
)
SedimentationSieving
Figure 1: Grain-size distribution curve of the soil in study.
6 7 8 9 10 11 12 13 1416
17
18
19
20
21
w (%)
γd(kN/m
3)
Curve #1Curve #2
Figure 2: Proctor curves.
Table 2: Optimal parameters of Proctor tests.
Curve γd (kN/m3) woptimum (%)
#1 20.1 9.7
#2 19.4 10.6
Average 19.8 10.2
The Proctor curves are not coincident, which may be explained by some unavoidable heterogeneity of
the soil. Average values of maximum dry volumetric weight and optimum water content were adopted
for compaction control. Thus, the optimum water content and the dry volumetric weight considered in
compaction control are 10.2% and 19.8kN/m3, respectively.
3

Before the dam construction, two trial embankments were performed to ensure a proper compaction of
them. The �rst trial embankment was performed using a wood rod with a sheaf coupled to a wood
plate at a bottom with a 10 cm layer thickness and the second was performed by a slick roller without
vibration. Further details are given in Bento (2013).
The embankments of each dam-breach experiment were, therefore, performed using the compactor of the
1st trial embankment (see �gure 3), although applying di�erent compaction energies. The �rst considered
four blows in each layer whilst in the second twelve blows were applied in order to study the density e�ects.
For the type of soil in study, it was speci�ed that the degree of compaction for the second embankment
should show a minimum of 85% and a water content within the interval w ∈ [woptimum, woptimum + 2%].
Figure 3: Compactor of the 1st trial embankment.
The dams built incorporated a multiple stage system to ensure a uniformity and an accurate compaction.
Each construction stage involved the placement of an equal material thickness of soil (10 cm) to which
some water was added until the soil showed the right amount of water content for proper compaction
(using the �Hand Test� as reference being this test always performed by the same person). Then, they
were shaped in order to achieve the proper upstream and downstream slopes. Shaping was done using
a set-square as a trowel to ensure the uniformity of the slope (Figure 4 and 5), for each embankment).
At the middle of the embankment crest, an initial rectangular shaped breach section of 0.10 m wide and
0.055 m high was carved for the �rst. For the second embankment, an initial triangular shaped breach
section was considered. This was done not only to control the area of concentrated �ow and the initial
erosion at the beginning of the overtopping phenomenon, but also to mitigate the e�ects of the side walls
of the channel, where the experiments were performed. The embankments geometry, for each dam-breach
experiment, are illustrated below in �gures 4 and 5.
4

Figure 4: Dimensional scheme of the �rst embankment.
Figure 5: Dimensional scheme of the second embankment.
The initial breach geometries of each embankment are shown in �gures 6 and 8, respectively.
Figure 6: Geometry of the pilot channel of the �rst embankment.
Figure 7: Dimensional scheme of the pilot chan-nel of the second embankment.
Figure 8: Photo of the pilot channel of the secondembankment.
2.1.3 Instrumentation
A set of reliable instrumentation for measuring the variations of the in�ow discharge as well as the water
elevation within the reservoir and downstream the embankment during the �rst dam-breach experiment
was applied. These measurements were possible using a digital electromagnetic �owmeter and water level
5
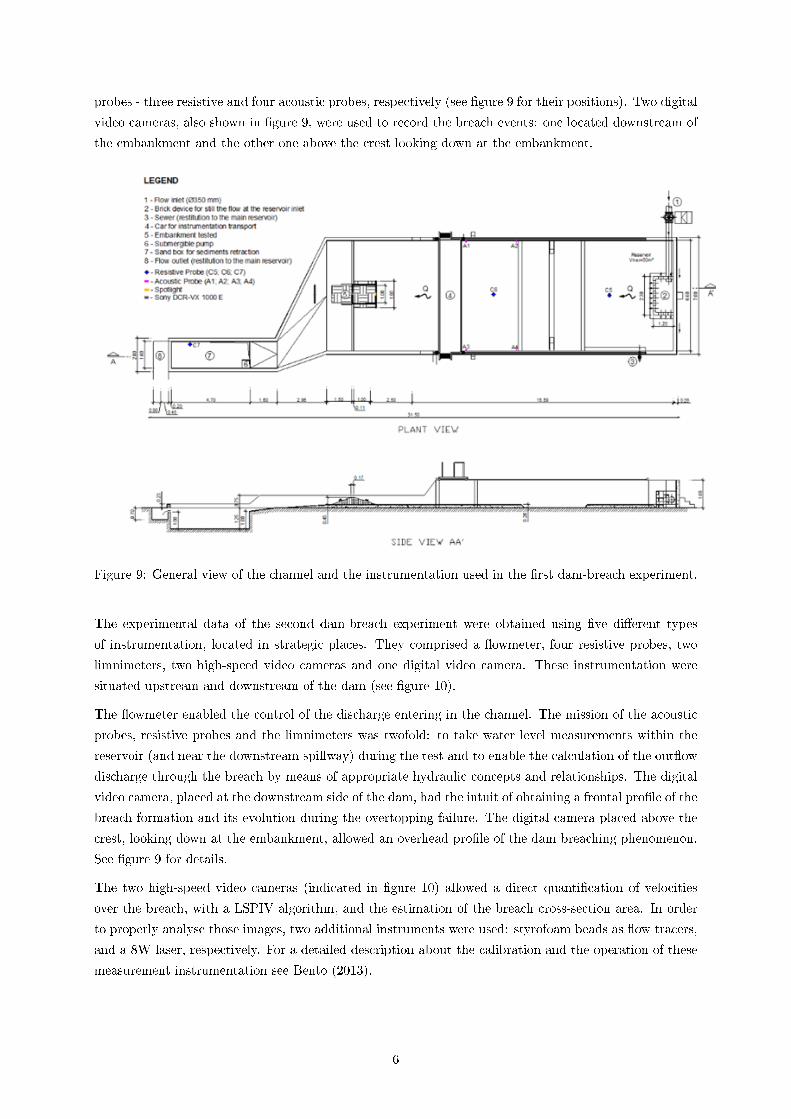
probes - three resistive and four acoustic probes, respectively (see �gure 9 for their positions). Two digital
video cameras, also shown in �gure 9, were used to record the breach events: one located downstream of
the embankment and the other one above the crest looking down at the embankment.
Figure 9: General view of the channel and the instrumentation used in the �rst dam-breach experiment.
The experimental data of the second dam-breach experiment were obtained using �ve di�erent types
of instrumentation, located in strategic places. They comprised a �owmeter, four resistive probes, two
limnimeters, two high-speed video cameras and one digital video camera. These instrumentation were
situated upstream and downstream of the dam (see �gure 10).
The �owmeter enabled the control of the discharge entering in the channel. The mission of the acoustic
probes, resistive probes and the limnimeters was twofold: to take water level measurements within the
reservoir (and near the downstream spillway) during the test and to enable the calculation of the out�ow
discharge through the breach by means of appropriate hydraulic concepts and relationships. The digital
video camera, placed at the downstream side of the dam, had the intuit of obtaining a frontal pro�le of the
breach formation and its evolution during the overtopping failure. The digital camera placed above the
crest, looking down at the embankment, allowed an overhead pro�le of the dam breaching phenomenon.
See �gure 9 for details.
The two high-speed video cameras (indicated in �gure 10) allowed a direct quanti�cation of velocities
over the breach, with a LSPIV algorithm, and the estimation of the breach cross-section area. In order
to properly analyse those images, two additional instruments were used: styrofoam beads as �ow tracers,
and a 8W laser, respectively. For a detailed description about the calibration and the operation of these
measurement instrumentation see Bento (2013).
6

Figure 10: General view of the channel and the instrumentation used in the second dam-breach experi-ment.
3 Experimental results
Before the estimation of the breach e�uent hydrographs was necessary to perform a brief sensitivity
analysis to noise reduction techniques. The data from the water elevation probes showed high level of
background noise, that needed a reduction. Therefore, a digital �lter and a local average technique were
used to improve the reliability of the data.
The instrumentation used for the �rst dam-breach experiment allowed two indirect estimations of the
breach e�uent hydrographs. These estimations were based on the mass balance equation (Equation 1)
and on the calibration curve of the downstream spillway. The �rst had additionally the ability to consider
a simple or a weighted contribution of the probes used in each experiment (applying the Voronoi polygons
within the reservoir).
d∀dt
= Qin(t)−Q(t) (1)
The second estimation, based on the calibration curve of the downstream spillway, showed good results
only for lower discharge values, due to the limited interval of the curve applicability.
For the second dam-breach experiment, a new and robust instrumentation allowed, beyond these indirect
ways, a direct estimation of the breach e�uent hydrograph. This estimation was based on the direct
quanti�cation of the �ow velocity, with a LSPIV algorithm, and on the estimation of the breach cross-
section area, both with the aid of the two high-speed video cameras used.
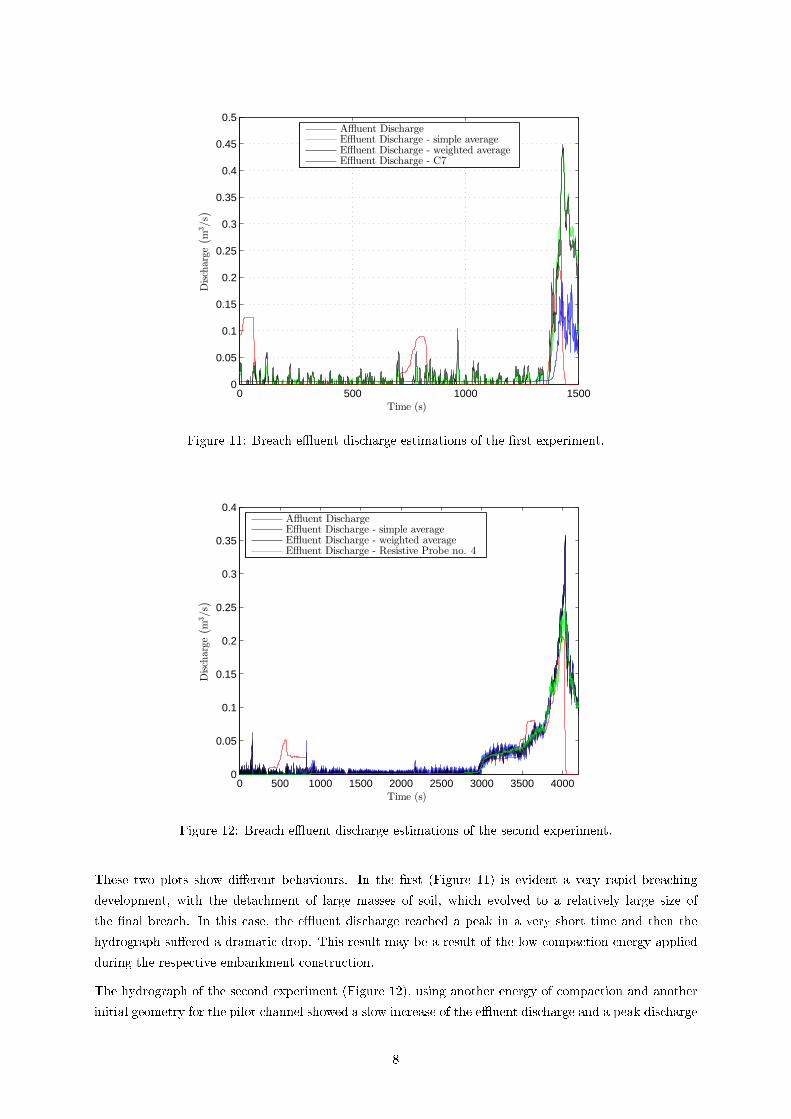
The breach e�uent hydrographs obtained for each dam-breach experiments are represented below (Figure
11 and 12, respectively).
7
0 500 1000 15000
0.05
0.1
0.15
0.2
0.25
0.3
0.35
0.4
0.45
0.5
Time (s)
Discharge
(
m3/s)
Affluent DischargeEffluent Discharge - simple averageEffluent Discharge - weighted averageEffluent Discharge - C7
Figure 11: Breach e�uent discharge estimations of the �rst experiment.
0 500 1000 1500 2000 2500 3000 3500 40000
0.05
0.1
0.15
0.2
0.25
0.3
0.35
0.4
Time (s)
Discharge
(
m3/s)
Affluent DischargeEffluent Discharge - simple averageEffluent Discharge - weighted averageEffluent Discharge - Resistive Probe no. 4
Figure 12: Breach e�uent discharge estimations of the second experiment.
These two plots show di�erent behaviours. In the �rst (Figure 11) is evident a very rapid breaching
development, with the detachment of large masses of soil, which evolved to a relatively large size of
the �nal breach. In this case, the e�uent discharge reached a peak in a very short time and then the
hydrograph su�ered a dramatic drop. This result may be a result of the low compaction energy applied
during the respective embankment construction.
The hydrograph of the second experiment (Figure 12), using another energy of compaction and another
initial geometry for the pilot channel showed a slow increase of the e�uent discharge and a peak discharge
8
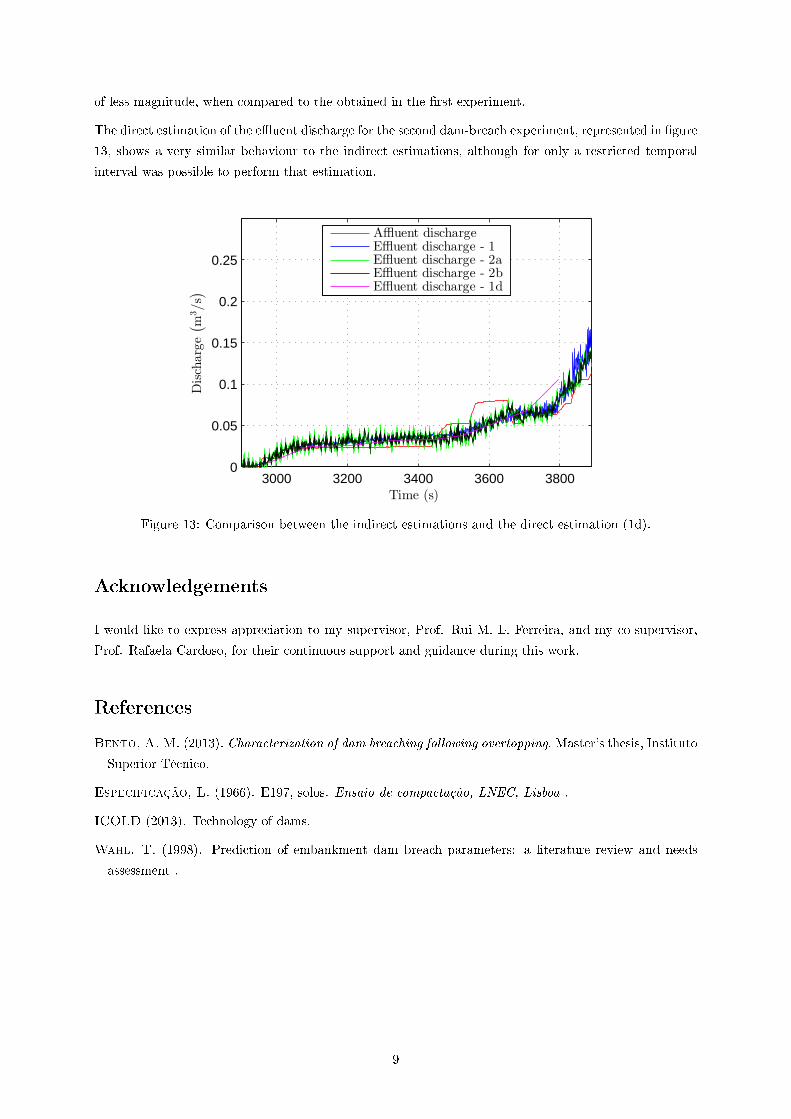
of less magnitude, when compared to the obtained in the �rst experiment.
The direct estimation of the e�uent discharge for the second dam-breach experiment, represented in �gure
13, shows a very similar behaviour to the indirect estimations, although for only a restricted temporal
interval was possible to perform that estimation.
3000 3200 3400 3600 38000
0.05
0.1
0.15
0.2
0.25
Time (s)
Discharge(
m3/s)
Affluent dischargeEffluent discharge - 1Effluent discharge - 2aEffluent discharge - 2bEffluent discharge - 1d
Figure 13: Comparison between the indirect estimations and the direct estimation (1d).
Acknowledgements
I would like to express appreciation to my supervisor, Prof. Rui M. L. Ferreira, and my co-supervisor,
Prof. Rafaela Cardoso, for their continuous support and guidance during this work.
References
Bento, A. M. (2013). Characterization of dam breaching following overtopping. Master's thesis, Instituto
Superior Técnico.
Especificação, L. (1966). E197, solos. Ensaio de compactação, LNEC, Lisboa .
ICOLD (2013). Technology of dams.
Wahl, T. (1998). Prediction of embankment dam breach parameters: a literature review and needs
assessment .
9