characteristics of sensor systems - puc rio
TRANSCRIPT

Characteristics of Sensor SystemsMultispectral, Hyperspectral, Thermal Sensing
Raul Q. FeitosaGilson. A. O. P. Costa
Patrick N. Happ

Contents
Introduction
Spectral Resolution
Characteristics of Orbital Platforms
Sensor Characteristics
Spatial Resolution
Pan-sharpening
Radiometric Resolution
Temporal Resolution
2

Remote Sensing SystemsPassive (Optical) Systems
Do not have their own source of radiation, so they depend on solar radiation as the energy to illuminate/capture the scene.
They measure the reflected solar radiation and/or the radiation emitted by the targets.

Remote Sensing SystemsActive Systems
Have their own source of electromagnetic radiation, usually working in narrow bands of the electromagnetic spectrum (microwave).

Remote Sensing SystemsActive Systems
Have their own source of electromagnetic radiation, usually working in narrow bands of the electromagnetic spectrum (microwave).
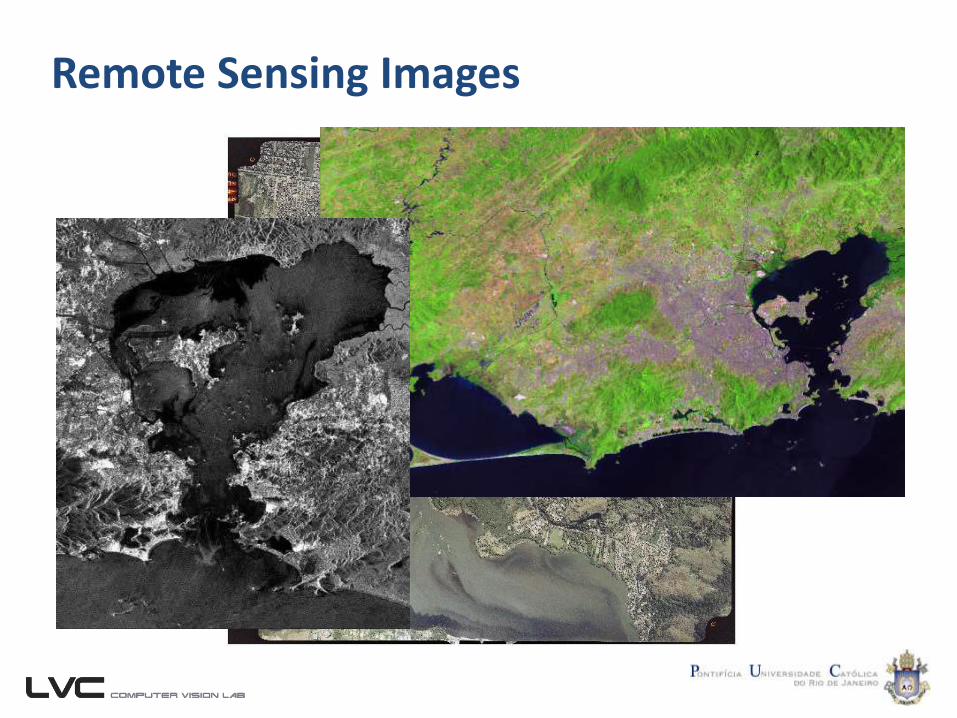
Remote Sensing Images

Remote Sensing Systems
CCD Sensor
WorldView 2
• Systems deliver digital numbers (DN)
• Images: picture element (pixel)
• Signal (radiance) integrated
• Signal (radiance) discretized CPan
BG
RY
RENIR1
NIR2
Digital Sensors

Band 1 (Visible Blue) Landsat 7 TM
0.45–0.52µm

Band 2 (Visible Green) Landsat 7 TM
0.52–0.60µm

Band 3 (Visible Red) Landsat 7 TM
0.63–0.69µm

Band 4 (Near IR) Landsat 7 TM
0.76–0.90µm

Band 5 (Shortwave IR) Landsat 7 TM
1.55–1.75µm

Band 7 (Shortwave IR) Landsat 7 TM
2.08–2.35µm

Band 6 (Thermal IR) Landsat 7 TM
10.4–12.4µm

Spectral ResolutionSpectralBands

Sentinel-2
Spectral Resolution

Blu
e B
an
d
Red
Ban
d
Gre
en
Ban
d
NIR
Ban
d
IKONOS

Co
lor
Co
mp
osit
e
R (
Red
Ban
d)
-G
(G
reen
Ban
d)
-B
(B
lue B
an
d)
IKONOST
rue C
olo
r
Spectral Resolution

Co
lor
Co
mp
osit
e
R (
NIR
Ban
d)
-G
(R
ed
Ban
d)
-B
(G
reen
Ban
d)
Fals
e C
olo
rIKONOS
Spectral Resolution

IKONOS
Spectral Resolution

• The main difference between multispectral and hyperspectral is the number of bands and how narrow the bands are.
• Multispectral imagery generally refers to 3 to 10 bands.
• Hyperspectral imagery consists of much narrower bands (10-20 nm). A hyperspectral image could have hundreds or thousands of bands.
Spectral Resolution

8 bandas 24 bandas 72 bandas
Hyperspectral sensors
Spectral Resolution

MODIS (Hyperspectral)
Band number Range Primary use1 0.620 - 0.670 Cover Transformation, Vegetation Chlorophyll2 0.841- 0.876 Cloud Amount, Cover Transformation3 0.459 – 0.479 Soil/Vegetation Differences4 0.545 - 0.565 Green Vegetation5 1.230 - 1.250 Leaf/Canopy Differences6 1.628 – 1.652 Snow/Cloud Differences7 2.105-2.155 Cloud Properties, Land Properties8 0.405 - 0.420 Chlorophyll9 0.438 - 0.448 Chlorophyll
10 0.483 - 0.493 Chlorophyll11 0.526 - 0.536 Chlorophyll12 0.546 - 0.556 Sediments
13h 0.662 - 0.672 Atmosphere, Sediments13l 0.662 - 0.672 Atmosphere, Sediments14h 0.673 - 0.683 Chlorophyll Fluorescence14l 0.673 - 0.683 Chlorophyll Fluorescence15 0.743 - 0.753 Aerosol Properties16 0.862 - 0.877 Aerosol Properties, Atmospheric Properties17 0.890 - 920 Atmospheric Properties, Cloud Properties18 0.931 - 0.941 Atmospheric Properties, Cloud Properties19 0.915 - 0.965 Atmospheric Properties, Cloud Properties20 3.660 - 3.840 Sea Surface Temperature21 3.929 - 3.989 Fires & Volcanoes22 3.929 - 3.989 Cloud Temperature, Surface Temperature23 4.020 - 4.080 Cloud Temperature, Surface Temperature24 4.433 - 4.498 Cloud Fraction, Troposphere Temperature25 4.482 - 4.549 Cloud Fraction, Troposphere Temperature26 1.360 - 1.390 Cloud Fraction (Thin Cirrus), Troposphere Temperature27 6.535 - 6.895 Mid Troposphere Humidity28 7.175 - 7.475 Upper Troposphere Humidity29 8.400 - 8.700 Surface Temperature30 9.580 - 9.880 Total Ozone31 10.780 - 11.280 Cloud Temperature, Fires, Volcanoes, Surface Temperature32 11.770 - 12.270 Cloud Height, Fires & Volcanoes, Surface Temperature33 13.185 - 13.485 Cloud Fraction, Cloud Height34 13.485 - 13.785 Cloud Fraction, Cloud Height35 13.785 - 14.085 Cloud Fraction, Cloud Height36 14.085 - 14.385 Cloud Fraction, Cloud Height
• Bands 1, 2: 250m
• Bands 3-7: 500m
• Bands 8-36: 1km
Spectral Resolution

Hyperion (Hyperspectral)
https://eo1.usgs.gov/sensors/hyperioncoverage
Spectral Resolution
• Provides a high resolution hyperspectral imager capable of resolving 220 spectral bands (from 0.4 to 2.5 µm) with a 30-meter resolution.
• The instrument can image a 7.5 km by 100 km land area per image, and provide detailed spectral mapping across all 220 channels with high radiometric accuracy.

• The path followed by a satellite is referred to as its orbit.
• Satellite orbits are matched to the capability and objective of the sensor(s) they carry.
• Orbit selection can vary in terms ofaltitude, orientation and rotation relative to the Earth.
Orbital Platforms (Satellites)

• Satellites at very high altitudes (~ 36.000 km), which view the same portion of the Earth's surface at all times have geostationary orbits.
• Geostationary satellites revolve at speeds that match the rotation of the Earth
• Weather and communications satellites commonly have these orbits.
Orbital Platforms (Satellites)

GO
ES-13
(West) 7
5o
Geosta
tionary
Opera
tional E
nvironm
enta
l S
ate
llite
(G
OE
S)

Geosta
tionary
Opera
tional E
nvironm
enta
l S
ate
llite
(G
OE
S) G
OES-1
5 (W
est) 13
5o

• Satellites at very high altitudes (~ 36.000 km), which view the same portion of the Earth's surface at all times have geostationary orbits.
• Geostationary satellites revolve at speeds that match the rotation of the Earth
• Weather and communications satellites commonly have these orbits.
www.nasa.gov/mission_pages/hurricanes/archives/2012/h2012_Isaac.html
Orbital Platforms (Satellites)


• Low Earth orbit (LEO): Geocentric orbits with altitudes up to 2000 km
• Medium Earth orbit (MEO): Geocentric orbits ranging in altitude from 2000 km to just below geosynchronous orbit at 35786 km
• Geostationary orbit (GEO): The orbit around Earth matching Earth's sidereal rotation period
Orbital Platforms (Satellites)

• A sun-synchronous (heliosynchronous) orbit is a geocentric orbit (LEO) which passes by any given point of the Earth's surface at the same local mean solar time.
• A satellite in sun-synchronous orbit might ascend across the equator twelve times a day each time at arround 12:00hs
Orbital Platforms (Satellites)

• Typical sun-synchronous orbits:
• altitude 600-800 km
• periods 96-100 min
• inclinations ~ 98°
• Sun-synchronous are polar orbits
Orbital Platforms (Satellites)

Orbital Platforms (Satellites)

• SENTINEL-2A and SENTINEL-2B occupy the same sun-synchronous orbit, but separated by 180o.
• The mean orbital altitude is 786 km. The orbit inclination is 98.62° and the Mean Local Solar Time (MLST) at the descending node is 10:30 (am).
Orbital Platforms (Satellites)

• SENTINEL-2A and SENTINEL-2B occupy the same sun-synchronous orbit, but separated by 180o.
• The mean orbital altitude is 786 km. The orbit inclination is 98.62° and the Mean Local Solar Time (MLST) at the descending node is 10:30 (am).
• The MLST value is close to the local overpass time of LANDSAT and almost identical to that of SPOT-5, permitting the integration of SENTINEL-2 data with existing and historical missions, and contributing to long-term time series data collection.
Orbital Platforms (Satellites)

view to side (off nadir)
SPO
T-5Swath and View Angle

Modern high resolution optical space sensors rotate the whole satellite for and during imaging
Control Moment Gyros
Reaction Wheels: one by axis
IKONOS
Swath and View Angle


Swath and View Angle

Sensor/detector configurations (optical)
• Frame camera
• Push broom scanner
• Wisk broom scanner
Sensor Characteristics (Optical)

• Digital frame camera: aerial photography
• Area CCD array CCD Sensor
Sensor Characteristics

• Across track scanning (whisk-broom): Landsat
• Linear CCD array CCD Sensor
Sensor Characteristics

• Along track scanning (push-broom): SPOT, QuickBird, IKONOS, WorldView, …
• Linear CCD array
CCD Sensor
Sensor Characteristics

Scanning mirrors:
• Landsat MSS TM ETM+, OLI, GOES, AVHRR, SeaWiFS, AMS, ATLAS
Linear Arrays:
• SPOT, IRS, IKONOS, CBERS, Quickbird, WorldView, ASTER, MISR
Liner and area arrays:
• AVIRIS, CASI, MODIS, ALI, Hyperion, LAC
Sensor Characteristics

IKONOS CCD lines
Panchromatic (2): 12 µm pitch, 13.500 pixels
Multispectral: 48 µm pitch, 3.375 pixels
IKONOS Camera
Focal length: 10m
Sensor Characteristics

Sensor Characteristics
CCD Sensor
WorldView 2
• Systems deliver digital numbers (DN)
• Images: picture element (pixel)
• Signal (radiance) integrated
• Signal (radiance) discretized CPan
BG
RY
RENIR1
NIR2
Digital Sensors

Multiespectral
Pan
Quickbird CCD lines
IKONOS CCD lines
Multiespectral
Pan reverse
Pan forward
Sensor Characteristics

Quickbird
color in front
color following
IKONOS
Sensor Characteristics

Spatial Resolution
• Field of view (FOV)
• Instantaneous field of view (IFOV): β
• Pixel size on ground Ground Resolution Element
Sensor Characteristics

Spatial Resolution
d = detector size
f = focal length
β = IFOV of system
β = 2 arctan (d/2f)
tan(β/2) = (d/2) / f
β ≈ d / f
d
β
H
D
f
Spatial Resolution

Spatial Resolution: IKONOS Panchromatic
d = detector size = 12μm
f = focal length = 10m
β = ?
β ≈ 12x10-6m / 10m
β ≈ d / f
β ≈ 1.2 μrad
d
β
H
D
f
Spatial Resolution

Spatial Resolution
β = IFOV of system
H = system height
D = ground element diameter
D = 2 H tan(β/2)
tan(β/2) = (D/2) / H
D ≈ H β
d
β
H
D
f
Spatial Resolution

Spatial Resolution: IKONOS Panchromatic
β = IFOV of system = 1.2 µrad
H = system height = 681 km
D = ?
D = 681x103m x 1.2x10-6 rad
D ≈ H β
D = 0.817 m
d
β
H
D
f
Spatial Resolution

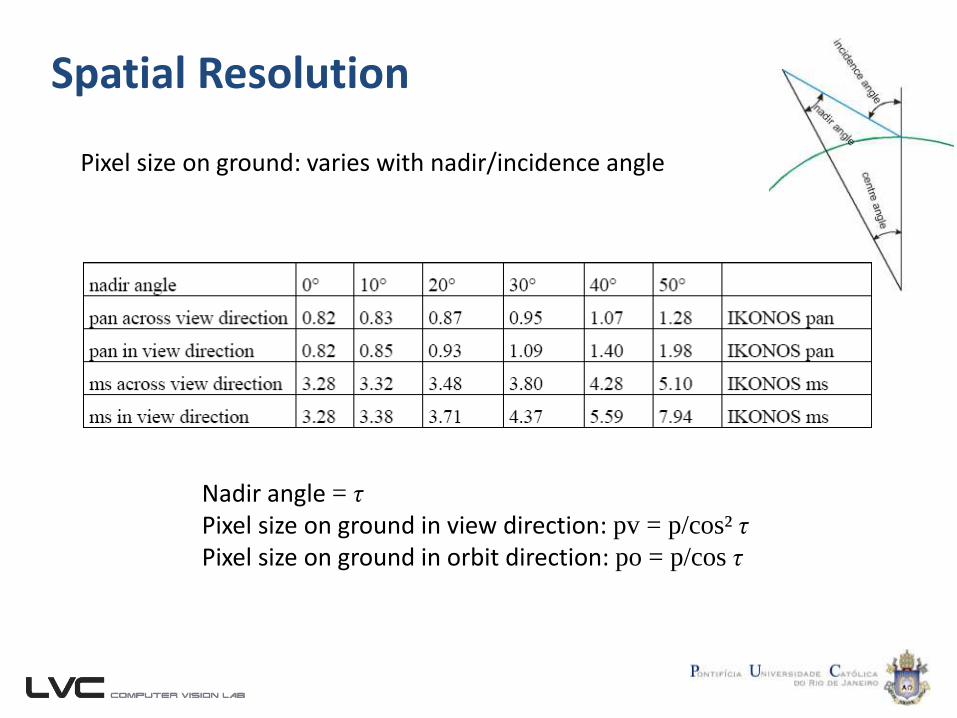
Pixel size on ground: varies with nadir/incidence angle
Spatial Resolution

Pixel size on ground: varies with nadir/incidence angle
Nadir angle = τ
Pixel size on ground in view direction: pv = p/cos² τ
Pixel size on ground in orbit direction: po = p/cos τ
τ = 30°, p=1m in nadir: pv= 1.33m po=1.15m
Spatial Resolution
Pixel size on ground: varies with nadir/incidence angle
Nadir angle = τ
Pixel size on ground in view direction: pv = p/cos² τ
Pixel size on ground in orbit direction: po = p/cos τ
Spatial Resolution

Ground sampling distance (GSD)
• Distance of neighboring pixel centers on ground – for user it looks like the pixel size on the ground
Spatial Resolution

Categorization (somewhat fuzzy)
• Low Resolution: > 100x100m (e.g., MODIS)
• Medium Resolution: > 15x15m (e.g., Landsat)
• High Resolution: > 1x1m (e.g., RapidEye)
• Very High Resolution (VHR): < 1x1m (e.g., WorldView-2)
Spatial Resolution

• Very High (Spatial) Resolution (VHR) Systems: Time-Delay Integration (TDI)
• relative speed of satellite ~ 7km/sec
• 5m in 0.7 msec: just sufficient to properly excite sensors
• 1m in 0.14 msec: too short integration time for sufficient image quality
• Integration of received energy over several pixels
Spectral/Spatial Resolution

Spatial Resolution
CCD Sensor
WorldView 2
• Systems deliver digital numbers (DN)
• Images: picture element (pixel)
• Signal (radiance) integrated
• Signal (radiance) discretized CPan
BG
RY
RENIR1
NIR2
Digital Sensors

IKO
NO
S-2
Blu
e b
an
d (4
m)

IKO
NO
S-2
Gre
en
ban
d (4
m)

IKO
NO
S-2
Red
ban
d (4
m)

IKO
NO
S-2
NIR
ban
d (4
m)

IKO
NO
S-2
Pan
ch
rom
atic
ban
d (1
m)
IKO
NO
S-2
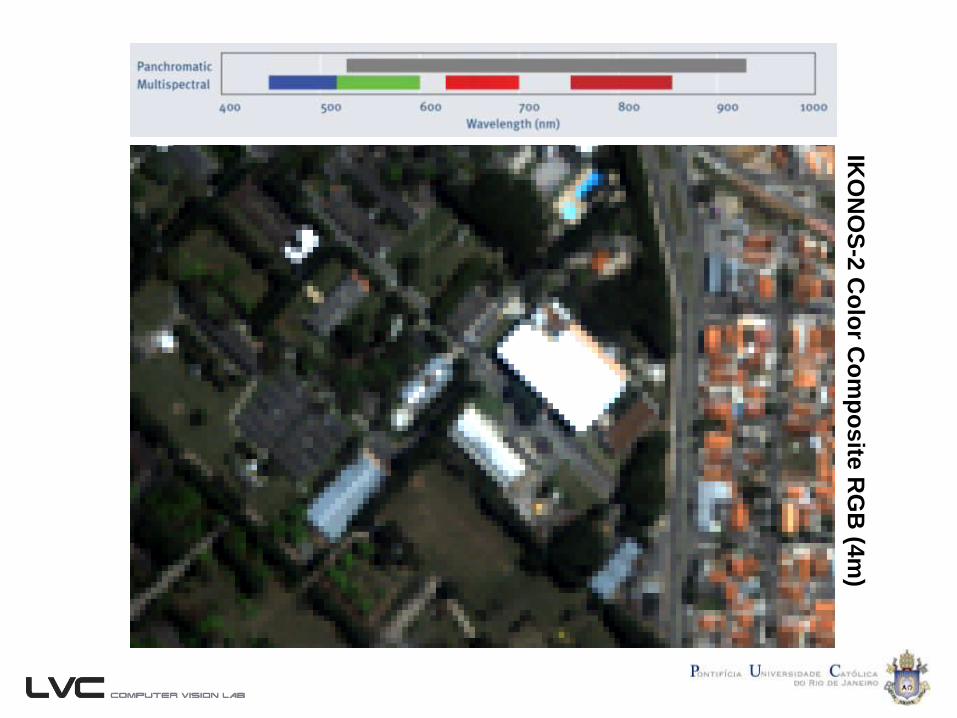
Co
lor C
om
po
site
RG
B (4
m)

IKO
NO
S-2
Co
lor C
om
po
site
RG
B (1
m)
Pan
sh
arp
ed
im
ag
e b
an
ds

Color models: RGB, CMY
Pan-sharpening

Color models: HSI
Pan-sharpening

Color models: convertion HIS-RGB
Pan-sharpening

Procedure…
1) Convert RGB image composite to HSI
2) Resample (enlarge) HSI image to size of panchromatic band
3) Substitute HSI image intensity band by panchromatic band
4) Convert resulting HSI image to RGB
Pan-sharpening

Alternative methods: PCA
• Principal Component Analysis
• First principal component (PC1): weighted average of all bands
• PC1 represents variations in brightness and intensity
• Procedure:
1) Apply PCA over RGB composite
2) Substitute PC1 by panchromatic band
3) Perform inverse PCA on the result
Pan-sharpening

Alternative methods
• Gram-Schmidt Orthogonalization (Spatial domain)
• Wavelet (Frequency domain)
Pan-sharpening

Pansharp an IKONOS image using the HSI method
1) Download image bands from: http://www.ele.puc-rio.br/~visao/TopicosII/IKONOS_SJC.rar
Remember! Resolutions: pan (1m); red(4m); green(4m); blue(4m)
2) Create pansharped color composites:
R(sjc_red), G(sjc_grn), B(sjc_blu)
R(sjc_nir), G(sjc_red), B(sjc_grn)
Use rgb2hsv, hsv2rgb and imresize functions
3) Compare the 3 interpolation methods: nearest neighborhood, bilinear, bicubic
Pan-sharpening

Radiometric resolution
• Describes the system's ability to discriminate very slight differences in sensed radiance
• The finer the radiometric resolution of a sensor, the more sensitive it is to detecting small differences in reflected or emitted energy
Sensor Characteristics

Quantization1bit: 0 and 1

Quantization4bits: 0 and 15

Quantization8bits: 0 and 255

• The number of levels used to express the signal received by a sensor cannot be increased arbitrarily
• Signal to noise ratio (SNR) of the sensor must be taken into consideration
• Step size cannot be less than noise level
Radiometric Resolution

Radiometric resolutions:
• Landsat TM: 8 bits
• Landsat ETM: 9 bits
• CBERS-2B HRC: 8bits
• IKONOS-2: 11bits
• Quickbird: 11bits
• Worldview-2: 11bits
• RapidEye: 12 bits
• MODIS: 12 bits
Radiometric Resolution

• Resolution: spatial x spectral x radiometric
• High spatial resolution: small IFOV
• Small IFOV: small ground resolution elementarea, small amount of energy reaching the sensor
• Reduces the ability to detect fine energy differences (radiometric resolution): larger SNR
• To increase the amount of energy detected without reducing spatial resolution: broaden the wavelength range detected for a particular channel or band: reduces spectral resolution
Radiometric Resolution

Radiometric Resolution

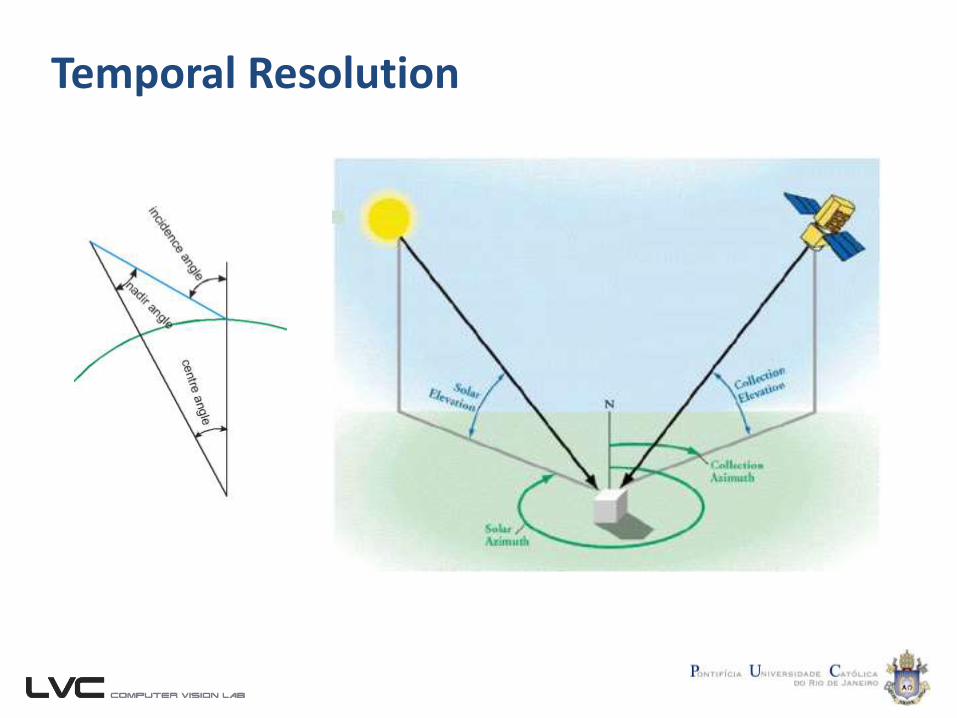
Revisit period: time period for a satellite to see the same point over the Earth
Temporal Resolution

• Orbit cycle time: satellite passes over the same point on the Earth's surface directly below the satellite for a second time
• The interval of time required for the satellite to complete its orbit cycle is not the same as the revisit period
• Using steerable sensors, an satellite-borne instrument can view an area (off-nadir) before and after the orbit passes over a target: revisit time less than the orbit cycle time.
• In near-polar orbits, areas at high latitudes will be imaged more frequently than the equatorial zone due to the increasing overlapin adjacent swaths
Temporal Resolution

Landsat 7
Temporal Resolution

Landsat 7
Temporal Resolution

• The absolute temporal resolution of a remote sensing system: to image the exact same area at the same viewing angle a second time
• The actual temporal resolution of a sensor depends on a variety of factors, including the satellite/sensor capabilities, the swath overlap, and latitude
MODIS – 1 day
Temporal Resolution

Temporal Resolution
Temporal Resolution
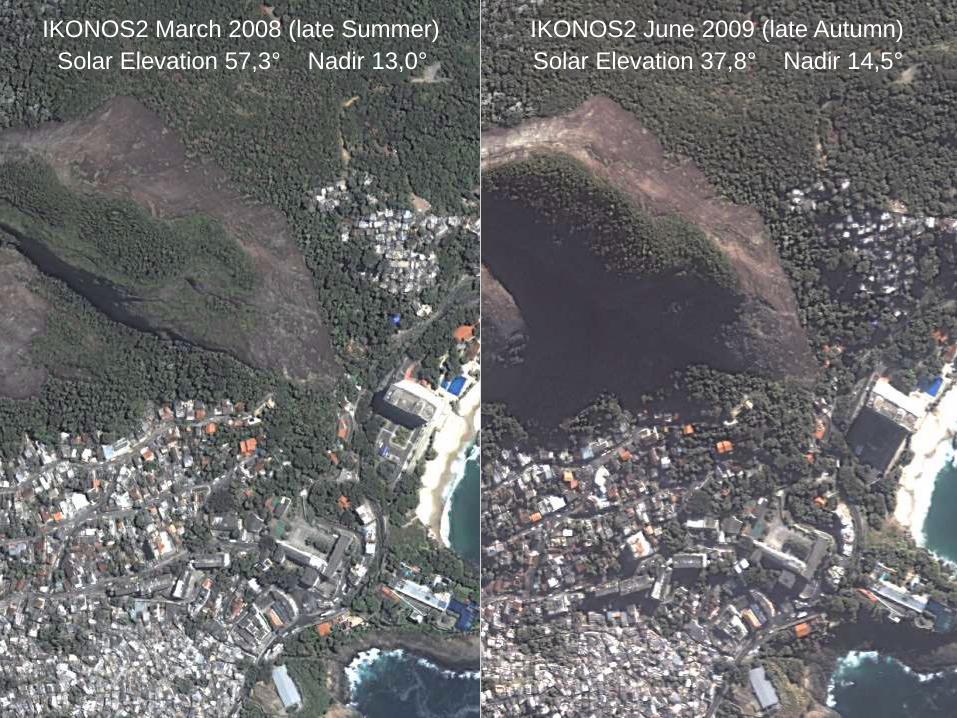
IKONOS2 March 2008 (late Summer) IKONOS2 June 2009 (late Autumn)
Solar Elevation 57,3° Nadir 13,0° Solar Elevation 37,8° Nadir 14,5°

Temporal Resolution

• Collecting imagery of the same area at different periods of time: essential for multitemporal analysis
• Spectral characteristics of features may change over time: detecting change (natural or man made) by comparing multitemporal imagery
• For example: during the growing season, most species of vegetation are in a continual state of change and our ability to monitor those subtle changes using remote sensing is dependent on when and how frequently we collect imagery
Temporal Resolution

• The time factor in imaging is very important when:
• persistent clouds offer limited clear views of the Earth's surface (often in the tropics)
• short-lived phenomena (floods, oil slicks, etc.) need to be imaged
• multitemporal comparisons are required (e.g. the spread of a forest disease from one year to the next)
• the changing appearance of a feature over time can be used to distinguish it from near-similar features (wheat / maize)
Temporal Resolution

Section 2.2 “Characteristics of Imaging Remote Sensing Instruments” of the book “Computer Processing of Remotely-Sensed Images”, Mather & Koch, 4th Edition.
Section 5.2 “General Characteristics of Satellite Remote Sensing Systems Operating in the Optical Spectrum” of the book “Remote Sensing and Image Interpretation”, Lillesand, Kiefer & Chipman, 7th Edition.
Article “Spectral Imaging for Remote Sensing”, Gary A. Shaw and Hsiao-huaK. Burke, Volume 14, Number 1, 2003, MIT Lincoln Laboratory Journal
Lecture Notes

Characteristics of Sensor SystemsMultispectral, Hyperspectral, Thermal Sensing
Raul Q. FeitosaGilson. A. O. P. Costa
Patrick N. Happ