chapter iv urban land use and urban land...
TRANSCRIPT

60
CHAPTER IV
URBAN LAND USE AND URBAN LAND USE CHANGES
4.1 Introduction
4.2 Concept of urban Landuse
4.3 Landuse in PCMC
4.4 Landuse change
4.5 Land use in 2001
4.6 Land use in 2009
4.7 Land use in 2011
4.8 Conclusion
61
CHAPTER IV
URBAN LAND USE AND URBAN LAND USE CHANGES
4.1 Introduction
Urban is a dynamic place and the rapid increase of the world’s urban population
coupled with the slowing of rural population growth has led to a main redeployment of
the population over the past 30 years. Urban growth, particularly the movement of
residential and commercial land use to rural areas at the periphery of metropolitan areas.
Urban land use change is a very important phenomenon which characterizes the urban
and sub urban area surrounding the cities and suitable in general to urbanization activities
(Mohamed Ait Belaid 2003). The transformation of land into urban and suburban uses is
one of the fastest alterations of the developing country landscape today.
In this chapter satellite data is used for interpreting the land use. Two types of
satellite data are used viz., IRS P6 -LISS III (Year 2001 and 2009) and IRS 1D - PAN
(Year 2011) images. LISS III images classified using a supervised classification with
minimum distance parameters. The classified images are verified again for its accuracy.
PAN image is high spatial resolution panchromatic image.
4.2 Concept of urban Landuse
The geographical distribution of land use in urban areas is of most important
attention to the geographer urban sociologist and city planners. The theories of urban land
use have been subjects of a number of criticism, increase and modification since the
1920s. It is a simple attempt to classify urban systems into structure that we can simply
understand and give details. Though the proponents and many authors that had worked on
these theories recognized the fact that every city has unique understanding and history
and thus it is difficult to box into a unified theory or concept the changed process and
pattern of any urban area. It is however undeniable that theorizing and modeling urban
land use greatly help in simplifying complex urban systems for easy understanding,
interpretation, comprehension and therefore management. The three best known of urban
land use structure theories are the concentric zone theory, the sector theory and the multi
62
nuclei theory (O. Oluseyi Fabiyi 2006).Urban growth and land use change can be used by
the public land use planners and policy makers to predictable and plan for the future.
4.3 Landuse in PCMC
The unplanned migration along with the natural growth of population led to rapid
increase in the population of Pimpri-Chinchwad in the last five decades. The chronology
of events in the development of the city of Pimpri Chinchwad is presented below.
1970: The Pimpri Chinchwad Municipal Council with a status of ‘C’ class was formed on
04.03.1970 by merging four villages, namely Pimpri, Chinchwad, Bhosari and Akurdi.
1972: The Pimpri Chinchwad New Town Development Authority (PCNTDA) was
established in 1972 as per the recommendations of the Pune Metropolitan Regional
Planning Board. The main objective was to create a planned environment for the working
population in the vicinity of their work place.
1975: Status of Municipal Council was changed from “C” Class to “A” Class from 7th
January 1975.
1982: A Municipal Corporation was formed by merging seven surrounding villages in the
Municipal Council, namely Sangvi, Rahatani, Thergaon, Wakad (part), Pimple Nilakh,
Pimple Gurav, Pimple Saudagar and the PCNTDA area. A total area of 86 sq. km. came
under PCMC’s jurisdiction vide notification dated 05.10.1982.
1997: The area under the Municipal Corporation was further increased through the
addition of 18 new villages in part or full, constituting an extended area of 84.51 sq.km.
Thus, the total area under the jurisdiction of PCMC measured 170.51 sq.km. These
villages are located on the periphery of the erstwhile PCMC area. The villages Talwade,
Chikhali, Moshi, and Dudulgaon along the Dehu-Alandi road, and Choviswadi and
Wadmukhwadi along the Dighi-Alandi road are located north of the erstwhile PCMC,
bounded by the Indrayani River. Charholi BK, Dighi, and Bopkhel along the Pune-Alandi
road lie towards the east, bordered by the area under the Ministry of Defence. Towards
the south are Dapodi, Sangavi (Aundh Chest Hospital), Bhosari, and Pimple Nilakh
(Rakshak Co-operative Housing Society Private Ltd. and Bharat Electronics Ltd.
Colony). To the west, the river Pavana bisects the villages Mamurdi, Kiwale, and Ravet
from the villages Punawale and Wakad that lie along the westerly Mumbai-Bangalore

63
bypass highway. The present PCMC area is situated to the northwest of Pune on the
Mumbai-Pune National Highway NH4. The Mumbai-Pune rail link also traverses through
the corporation area dividing it into two halves.
2008: The area under the Municipal Corporation was further increased through the
addition of Tathawade new villages. Thus, the total area under the jurisdiction of PCMC
measured 176.41 sq.km.
4.4 Landuse change
Land use beginning from 1986 and subsequent distribution provides the physical
situation within which land use change occurred. As per the town development plan the
total land in the study area is 170.51sq.km. Among them 32.42sq.km, 0.59sq.km. ,
12.33sq.km, 3.89sq.km, 1.66sq.km. and 0.81sq.km. or 32% were developed in 1986, used
for residential, commercial, industrial , transportation public .(Table 4.1)
TABLE NO. 4.1: LAND USE DISTRIBUTION AS PER DEVELOPMENT PLAN
Source: Town Planning Department, Pune
Land use
Area in Sq. Km.
Total Area in
% 1986 DP Newly Merged
areas Residential 10.16 22.26 32.42 19.01
Commercial 0.40 0.19 0.59 0.35
Industrial 10.85 1.48 12.33 7.23
Public and Semi Public 0.84 0.82 1.66 0.97
Public Utilities 0.42 0.39 0.81 0.48
Transport 4.26 2.38 6.64 3.89
Reserved, Forest & Agri. 26.27 33.27 59.54 34.92
Water Bodies 1.89 0.95 2.84 1.67
Quarry 0.22 2.46 2.68 1.57
Recreational/Open Spaces 0.69 0.01 0.70 0.41
Barren/Vacant Lands 30.01 20.29 50.30 29.50
Total 86.01 84.50 170.51 100

FIG. NO
32% of the geographical area of
commercial, industrial, transportation
area is under Reserved, Forest
vacant lands.
4.5 Land use in 2001
While studying land use in the region under study, mainly five categories were
taken into consideration viz
water bodies. The Table No.
percentage in the total area as in 2001 as appended below
In 2001, the land-use for
rich and growing urban areas
2%
2%
0%
30%
PCMC Landuse distribution
O. 4.1: PCMC LAND USE DISTRIBUTION
% of the geographical area of PCMC is built-up area. This includes the
commercial, industrial, transportation, public, semi public and public utility
Reserved, Forest and agriculture.29.50% of the area is under the barren or
use in 2001
While studying land use in the region under study, mainly five categories were
taken into consideration viz- built up land, agricultural land, vegetation, waste land and
Table No. 4.2 shows areas covered under each category and its
percentage in the total area as in 2001 as appended below –
use for PCMC as a whole was predominantly urban
rich and growing urban areas.
19%
0%
7%
1%0%
4%
35%
PCMC Landuse distribution
Residential
Commercial
Industrial
Public and Semi Public
Public Utilities
Transport
Reserved, Forest & Agri.
Water Bodies
Quarry
64
up area. This includes the residential,
and public utility. 35% of the
29.50% of the area is under the barren or
While studying land use in the region under study, mainly five categories were
built up land, agricultural land, vegetation, waste land and
4.2 shows areas covered under each category and its
urban area. There were
Public and Semi Public
Reserved, Forest & Agri.
65
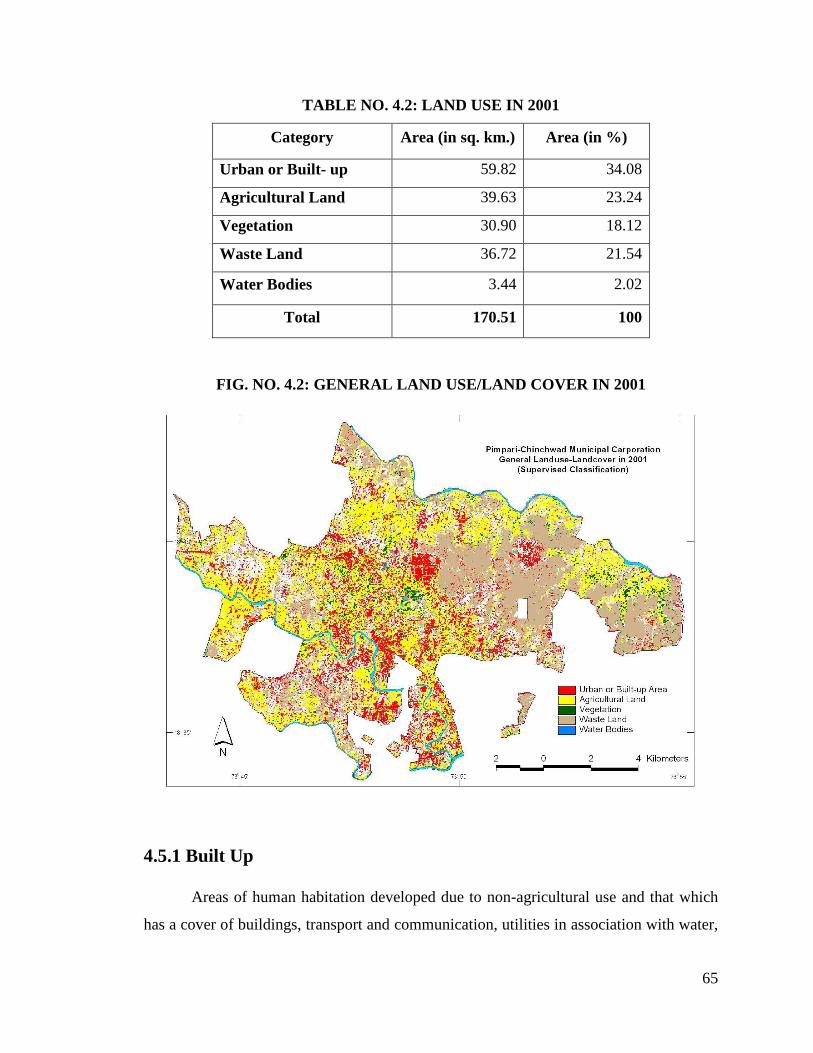
TABLE NO. 4.2: LAND USE IN 2001
Category Area (in sq. km.) Area (in %)
Urban or Built- up 59.82 34.08
Agricultural Land 39.63 23.24
Vegetation 30.90 18.12
Waste Land 36.72 21.54
Water Bodies 3.44 2.02
Total 170.51 100
FIG. NO. 4.2: GENERAL LAND USE/LAND COVER IN 2001
4.5.1 Built Up
Areas of human habitation developed due to non-agricultural use and that which
has a cover of buildings, transport and communication, utilities in association with water,

66
vegetation and vacant lands are classified as built up. All manmade constructions
covering the land surface are included under this category. Their shape and high
reflectivity differentiate them from other classes. Enhancement techniques and band
combination helps in segregation of different parcels. This appears in greenish blue tint in
the imagery.
Pimpri- Chinchwad being an urban area, built up area is an important category. It
includes residential, industrial, commercial, and road network and utility services. It
covers 59.82 sq. km. which is 35.08% of the total area under consideration. It is observed
that built up area category covers the maximum area (Ref table -). Most of the built up
area is seen in the central portion, which has various industries. NH-4 passes through this
area. Besides there is a large scale residential area. In view of the transportation facilities,
industries and recent merging of eighteen villages in the region, the built up area has
increased.
4.5.2 Agricultural Land
Agricultural lands are generally used for production of food crops and other
crops. As seen from table No. 4.2, 39.63 sq.km. i.e. 23.24% of the total area is
agricultural land. Area wise it is next to the built up area. The reason being the presence
of rivers Indrayani, Mula, Pavana with a large area on the banks of rivers is under
cultivation. River Indrayani flows along the northern boundary of the area hence there is
more agricultural area. It mainly includes – Chikhali, Kudalewadi, Jadhavwadi, northern
part of Moshi, Charholi, Kotwalwadi etc. On the Western side, along river Pavana,
Pimple saudagar, Wakad, Rahatni, Thergaon and Walhekarwadi have agricultural land.
4.5.3 Vegetation
These are areas where natural vegetation is dominated by grasses or grass-like
plants and non grass-like herbs. It mainly includes trees along roadsides, trees in the
industrial premises, trees and shrubs on the banks of rivers Indrayani, Mula, and Pavana
and the trees grown in the open areas. Vegetation can be observed in the central area as
well as in the northern part of the region. Such grassland is found in some parts of the
67
North and South West of the study area. The area included in this category of land-use is
30.90 sq. km. it minces 18.12% of the total area.
4.5.4 Waste Land
This category consists of barren land, fallow land, and quarries. It covers 36.72
sq.km. i.e. 21.54 % of the total land under consideration in the region. Fig. No. 4.2 shows
the proportion of waste land in the east is more. There is waste land in the south of
Charholi. Further some parts of west and north have waste land. It includes some part of
east of Walhekarwadi and northern part of Chikhali.
4.5.5 Water Bodies
This class comprises surface waters either impounds in the form of ponds, lakes
and reservoirs or flowing as rivers, streams, canals etc. A stream is a natural course of
water flowing on the land surface along a definite channel. It may be seasonal or
perennial. An area of 3.44 sq.km. i.e. 2.02% of the total area is covered by water bodies.
It consists of rivers Indrayani, Mula, Pavana, so also Sumant Sarovar(lake), bird Valley
Lake, Shahu Maharaj Talav(tank) Goan lake and water contained in the quarries. The
area covered under water bodies is the least of all.
The urban land use in the Pimpri-Chinchwad Municipal Corporation area for the
year 2001, which has maximum built up area (35.08%) followed by agricultural land
(23.24%), waste land(21.54%), vegetation (18.12%) and water bodies (2.02%).
4.6 Land use in 2009
Table No. 4.3 depicts land use in the year 2009. The total area of PCMC in 2001
was 171.59 sq.km. In 2009, after the inclusion of ‘Tathawade’ in PCMC the total area has
become 176.51 sq.km. The land use in 2009 is as follows
68
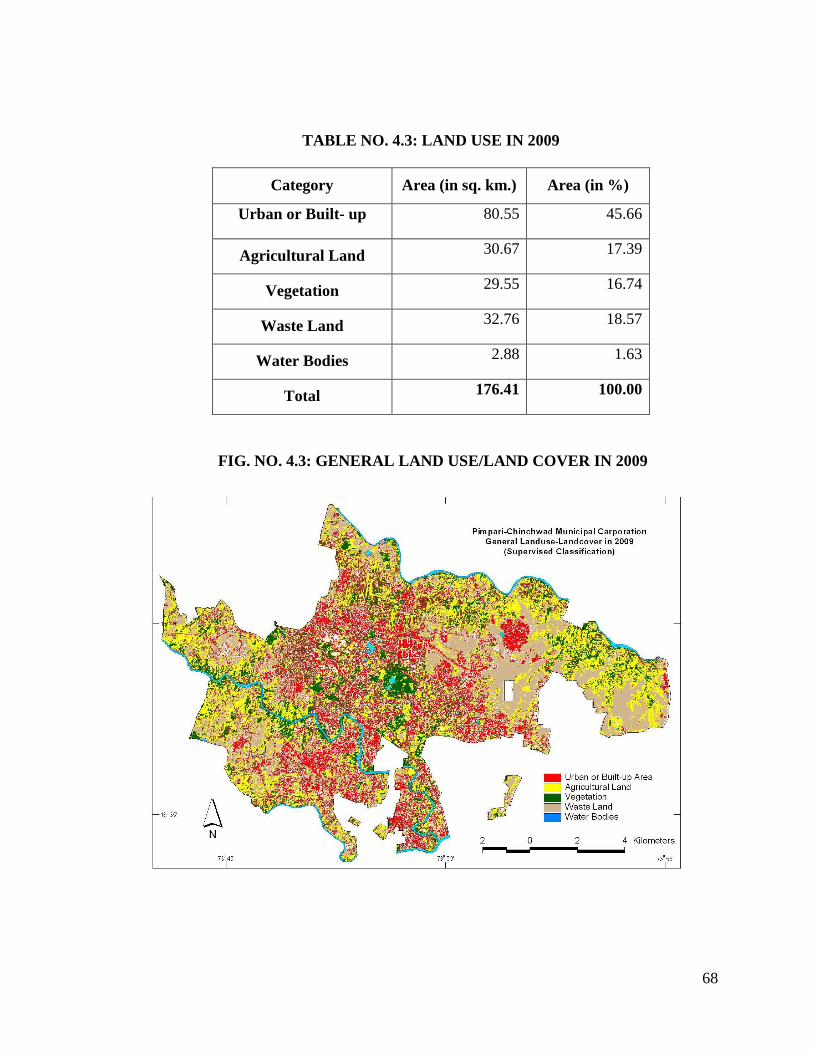
TABLE NO. 4.3: LAND USE IN 2009
Category Area (in sq. km.) Area (in %)
Urban or Built- up 80.55 45.66
Agricultural Land 30.67 17.39
Vegetation 29.55 16.74
Waste Land 32.76 18.57
Water Bodies 2.88 1.63
Total 176.41 100.00
FIG. NO. 4.3: GENERAL LAND USE/LAND COVER IN 2009
69
4.6.1 Built Up
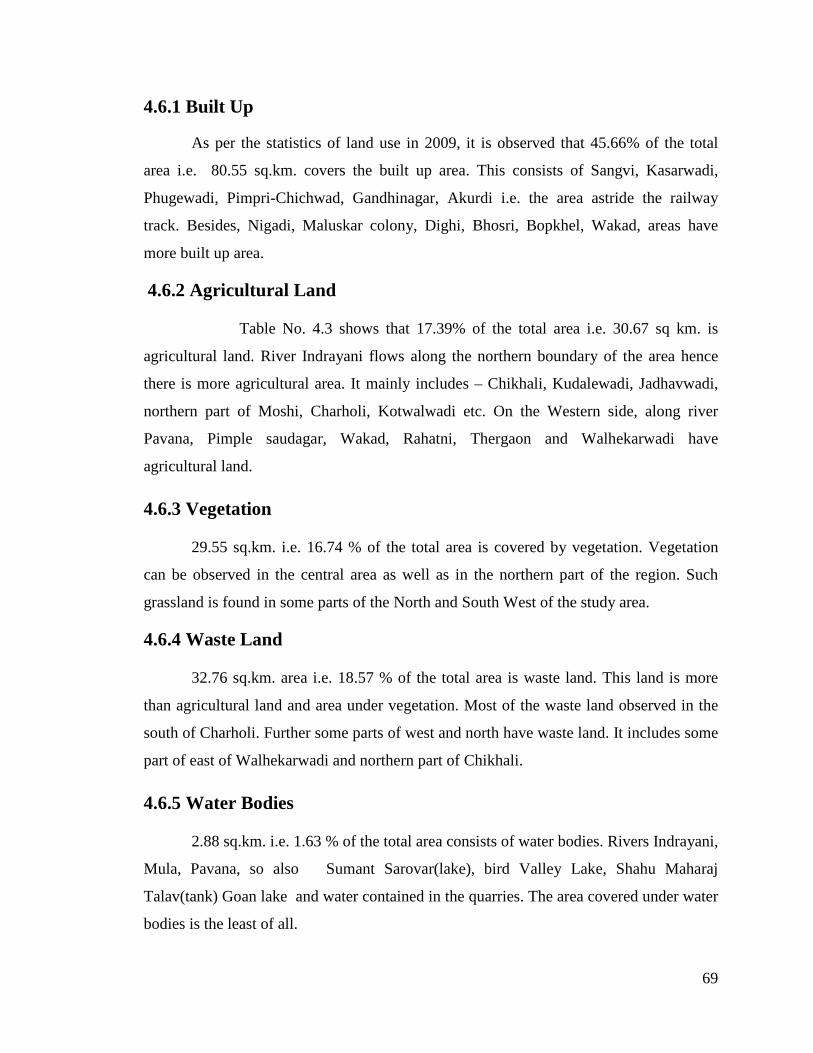
As per the statistics of land use in 2009, it is observed that 45.66% of the total
area i.e. 80.55 sq.km. covers the built up area. This consists of Sangvi, Kasarwadi,
Phugewadi, Pimpri-Chichwad, Gandhinagar, Akurdi i.e. the area astride the railway
track. Besides, Nigadi, Maluskar colony, Dighi, Bhosri, Bopkhel, Wakad, areas have
more built up area.
4.6.2 Agricultural Land
Table No. 4.3 shows that 17.39% of the total area i.e. 30.67 sq km. is
agricultural land. River Indrayani flows along the northern boundary of the area hence
there is more agricultural area. It mainly includes – Chikhali, Kudalewadi, Jadhavwadi,
northern part of Moshi, Charholi, Kotwalwadi etc. On the Western side, along river
Pavana, Pimple saudagar, Wakad, Rahatni, Thergaon and Walhekarwadi have
agricultural land.
4.6.3 Vegetation
29.55 sq.km. i.e. 16.74 % of the total area is covered by vegetation. Vegetation
can be observed in the central area as well as in the northern part of the region. Such
grassland is found in some parts of the North and South West of the study area.
4.6.4 Waste Land
32.76 sq.km. area i.e. 18.57 % of the total area is waste land. This land is more
than agricultural land and area under vegetation. Most of the waste land observed in the
south of Charholi. Further some parts of west and north have waste land. It includes some
part of east of Walhekarwadi and northern part of Chikhali.
4.6.5 Water Bodies
2.88 sq.km. i.e. 1.63 % of the total area consists of water bodies. Rivers Indrayani,
Mula, Pavana, so also Sumant Sarovar(lake), bird Valley Lake, Shahu Maharaj
Talav(tank) Goan lake and water contained in the quarries. The area covered under water
bodies is the least of all.

70
4.7 Land use in 2011
The study of urban land use in 2011 shows that maximum area has come under
built up area (Table No.4.4 and Fig No.4.4). This indicates development in the area under
consideration.
TABLE NO. 4.4: LAND USE IN 2011
Category Area (in sq. km.) Area (in %)
Urban or Built- up 91.42 51.82
Agricultural Land 28.12 15.94
Vegetation 27.78 15.75
Waste Land 25.92 14.49
Water Bodies 3.18 1.80
Total 176.41 100
FIG. NO. 4.4: GENERAL LAND USE/LAND COVER IN 2011

71
4.7.1 Built Up
91.42 sq.km. area i.e. 51.82% of the total area is built up. PCMC being an urban
region, it has more built up area. The central part of the region under study has more built
up area; due to the presence of industries like Tata Motors, Premier, Finolex, Bajaj, Alfa
Laval, Thermax, Hindustan Antibiotics etc. The area adjoining these industries also has
increased built up area.In addition to these due to hospitals, educational institutes,
schools, colleges, malls, markets and roads have increased the built up area. (Fig No.4.4)
Pimpri-Chinchwad, Bhosari, Nigadi, Wakad, being prime locations there is more built up
area.
4.7.2 Agricultural Land
Agricultural land is observed mostly towards east, south-west, north-west, north
and north-eastern region (Fig No. 4.4). Barring southern part and central portion of
PCMC area, the agricultural land can be found on its outer region. Out of the total area,
15.94% is occupied by agriculture.
4.7.3 Vegetation
It mainly consists of natural vegetation and trees and gardens in the premises of
industrial area. A large area in the south of Tata Motors is thickly covered by vegetation.
Area around river Mula, snake park, Sambhaji Nagar, Ajanta Nagar, northern part
Chikhali also has patches of vegetation. Accordingly, in 2011 figures 27.78sq. km i.e.
15.75% of total area is covered with vegetation.
4.7.4 Waste Land
Out Of the total land under consideration, 25.91 sq.km. area i.e.14.49 % of area is waste
land. It lies mainly towards east of area under study, in parts of Moshi, areas adjacent to
Chikhali, Tathawade and Kiwale.

72
4.7.5 Water Bodies
Out of the total land use1.80 % area i.e. 3.18 sq.km. is covered by water
bodies. It is revealed from the land use data of 2011 that the proportion of the built up
land to the total land is maximum, whereas agricultural land, vegetation, waste land and
water bodies comparatively cover very less land.
4.8 Conclusion
In the present chapter the land use pattern of 2001, 2009, and 2011 has been
presented. During 2001, the maximum area is observed to be covered by built up area,
followed by agricultural land and waste land, which are 34.88%, 23.11% and 18.01%
respectively. In the year 2009 there is an increase in the built up area which is 45.63%
and the areas of agricultural land and waste land have been diminished, which are
17.38% and 16.31% respectively. Thus the maximum area is occupied by built up area
only. Even in year 2011 there is an increase in the built up area to 51.82 %.
The constant increase in the built up area in PCMC area indicates speed of
urbanization. Ward ‘A’ has maximum increase in built-up area whereas ward ‘C’ has
minimum increase built-up area. The increase in industrialization and urbanization has
affected land use, in years 2001, 2009 and 2011.