chapter iv results & discussions - um students'...
TRANSCRIPT

34
CHAPTER IV
RESULTS & DISCUSSIONS
4.1 Energy Analysis of the Base Case Clinker Cooler
The energy analysis for the base case grate clinker cooler is performed by using the
formulas in Table 3.1. The mass balance of the system first needs to be analyzed to
show that the clinker cooling process is a steady process, i.e. the total mass input into
the system is equivalent to the total mass output of the system. The study then proceeds
to the energy balance of the system, for which the total energy input of the system
should be equal to the total energy output of the system. The next two subchapters
present the sample of calculations for the mass balance and energy balance, as well as
the calculations for the energy efficiency and the energy recovery efficiency of the
grate clinker cooling system.
4.1.1 Mass Balance
The mass balance of the grate clinker cooler is conceived on the law of mass
conservation using equations below:
∑ min − ∑ mout = 0 (4.1)
(mic + mca)− (mas + mat + moc + mexh) = 0 (4.2)
�1.00 kgkg.ck
+ 2.55 kgkg.ck
� − �0.45 kgkg.ck
+ 0.42 kgkg.ck
+ 1.00 kgkg.ck
+ 1.68 kgkg.ck
� = 0 (4.3)

35
4.1.2 Energy Balance
The energy balance of the grate clinker cooler is conceived on the law of energy
conservation using equations as follows:
∑ Ein − ∑ Eout = 0 (4.4)
(Qic + Qca) − (Qpk + Qpc + Qoc + Qexh) = 0 (4.5)
�1351.5 kJ
kg, ck + 51.5 kJ
kg. ck� − �423.2kJ
kg. ck + 296.6 kJ
kg. ck + 82.8 kJ
kg. ck + 337.4 kJ
kg. ck�
= 262.9 kJkg.ck
unaccountable losses (4.6)
The energy efficiency of the clinker cooler:
ηcooler,I = �Qpk+Qpc+Qoc+Qexh�
Qic+Qca
= �423.2
kJkg.ck
+296.6 kJ
kg.ck+82.8
kJkg.ck
+337.4 kJ
kg.ck�
1351.5 kJ
kg.ck+51.5
kJkg.ck
= 81.3% (4.7)
The energy recovery efficiency of the clinker cooler:
ηrecovery, cooler = QrQic+Qca
=Qpk+QpcQic+Qca
=423.2 kJ
kg.ck+296.6 kJkg.ck
1351.5 kJkg.ck+51.5 kJ
kg.ck
= 51.3% (4.8)
Table 4.1.2 Energy analysis summary of the base case clinker cooler
Material Mass Flow Rate (kg/kg
clinker)
Cp (kJ/kg.˚C) T (˚C) Q
(kJ/kg.ck) %
Input Hot Clinker 1.00 1.06 1300.0 1351.5 96.3 Cooling air 2.55 1.01 45.0 51.5 3.7
Output
Secondary air 0.45 1.14 850.0 423.2 30.2 Tertiary air 0.42 1.13 650.0 296.6 21.1 Cooled Clinker 1.00 0.92 115.0 82.8 5.9 Exhaust air 1.68 1.03 220.0 337.4 24.1 Unaccountable losses 262.9 18.7
(Rasul et al., 2005; Kolip et. al, 2010; Mundhara and Sharma, 2005)

36
Table 4.1.2 presents the summary of energy analysis of the base case clinker
cooler using the theoretical input and output data in Table 3.1.1. The mass input, for
which in this case is taken as kg/kg clinker, is the same as the mass output of the
system at 3.55 kg/kg clinker. The individual specific heat of each material depends on
the temperature of the material. The total energy output of this system at a value of
1403 kJ/kg clinker is equal to the total energy input, taking into account the
unaccountable losses of the system. These losses are primarily due to heat losses via
convection and radiation heat transfers.
From Equation 4.7, the energy efficiency of the system is 81.3%. This figure
represents the overall performance of the grate clinker cooling system, for which heat
energy contained in the exhaust air and the cooled clinker are still considered to be
recovered regardless of the end use. Equation 4.8 shows that the energy recovery
efficiency of the system is much lower at 51.3%. This is due to the fact that for energy
recovery efficiency, only the heat energy recovered and used at other phases of clinker
production is taken into account. The energy recovery efficiency of the system plays a
bigger role in the improvement of the clinker cooler, as the increase in its value
translates to energy and cost saving.
4.2 Exergy Analysis of the Base Case Clinker Cooler
The exergy analysis for the base case grate clinker cooler is almost similar to its energy
analysis counterpart. The mass balance of the system is adopted from the energy
analysis, since the only difference between the exergy and energy analyses lies in the
state of the system’s surroundings. The irreversible process of clinker cooling produces
entropy, which consequently leads to exergy destruction. The next subchapter presents
the sample of calculations for the exergy balance, as well as the calculations for the
exergy efficiency and the exergy recovery efficiency of the grate clinker cooler.
37
4.2.1 Exergy Balance
The steady state exergy balance of the open system of clinker cooling:
T0Sgen = Exd = (Exic + Exca) − (Exoc + Expk + Expc + Exexh)
= �mcke�ck,in + mae�a� − �mcke�ck,out + mase�as+ mate�at + maexhe�exh� (4.9)
where Specific exergy of hot clinker,
mcke�ck,in = mck��h�ck,in − h�0� − T0(sck,in − s0 )� (4.10)
= �1.00kg
kg. ck� ��1351.5
kJkg� − �525.5
kJkg�� = 826.0
kJkg. ck
Specific exergy of cooling air, assuming Pa = Po,
mae�a = ma��h�ca − h�0� − T0(sca − s0 )� (4.11)
= �2.55 kgkg.ck
� ��20.2 kJkg� − �19.6 kJ
kg�� = 1.7 kJ
kg
Specific exergy of cooled clinker,
mcke�ck,out = mck��h�ck,out − h�0� − T0(sck,out − s0 )� (4.12)
= �1.00 kgkg.ck
� ��82.8 kJkg� − �72.4 kJ
kg�� = 10.4 kJ
kg
Specific exergy of secondary air, assuming Pas = Po,
mase�as = mas��h�as − h�0� − T0(sas − s0 )� (4.13)
= �0.45 kgkg.ck
� ��940.4 kJkg� − �450.7 kJ
kg�� = 220.4 kJ
kg
Specific exergy of tertiary air, assuming Pat = Po,
mate�at = mat��h�at − h�0� − T0(sat − s0 )� (4.14)
= �0.42kg
kg. ck� ��705.2
kJkg� − �380.7
kJkg�� = 136.7
kJkg

38
and Specific exergy of exhaust air, assuming Pexh = Po,
mexhe�exh = mexh��h�exh − h�0� − T0(sexh − s0 )� (4.15)
= �1.68kg
kg. ck� ��200.8
kJkg� − �154.5
kJkg�� = 77.8
kJkg
Therefore, the rate of exergy destroyed:
Exd = �(Exic + Exca)− (Exoc + Expk + Expc + Exexh)�
= ��mcke�ck,in + mae�a� − �mcke�ck,out + mase�as+ mate�at + maexhe�exh��
= ��826.0kJ
kg. ck + 1.7kJ
kg. ck� − �10.4kJ
kg. ck + 220.4kJ
kg. ck + 136.7kJ
kg. ck + 77.8kJ
kg. ck��
= 382.2kJ
kg. ck
Based on the second law analysis, the exergy efficiency of the clinker cooler:
ηII,1 = �mcke�ck,out+ mase�as+ mate�at+ maexhe�exh��mcke�ck,in+ mae�a�
=445.3 kJ
kg.ck
827.7 kJkg.ck
= 53.8% (4.16)
The exergy recovery efficiency of the clinker cooler:
ηII,2 = (maseas+ mateat)�mckeck,in+ maea�
=357.1
kJkg.ck
827.7kJ
kg.ck
= 43.2% (4.17)
Table 4.2.1 Exergy analysis summary of the base case clinker cooler
Material
Mass Flow Rate
(kg/kg clinker)
Cp (kJ/kg.˚C) T (˚C) Ex
(kJ/kg.ck) %
Input Hot Clinker 1.00 1.06 1300.0 826.0 99.8 Cooling air 2.55 1.01 45.0 1.7 0.2
Output
Secondary air 0.45 1.14 850.0 220.4 26.6 Tertiary air 0.42 1.13 650.0 136.7 16.5 Cooled Clinker 1.00 0.92 115.0 10.4 1.3 Exhaust air 1.68 1.03 220.0 77.8 9.4 Total Exergy losses 382.2 46.2
(Rasul et al., 2005; Kolip et. al, 2010; Mundhara and Sharma, 2005)

39
Table 4.2.1 presents the summary of exergy analysis of the base case clinker
cooler using the theoretical input and output data in Table 3.1.1, and the energy
analysis results obtained from subchapter 4.1. The mass input, adopted from the energy
analysis, remains balanced at 3.55 kg/kg clinker on each side of the equation. The total
exergy output of this system at a value of 445.3 kJ/kg clinker is 382.2 kJ/kg clinker less
than the total exergy input. This figure represents the total amount of exergy destruction
of the clinker cooling process. It also includes the exergy destruction related to the
energy that is lost through convection and radiation heat transfers.
From Equation 4.16, the exergy efficiency of the system is 53.8%. Similar to
the energy efficiency of the system, this figure represents the overall performance of
the grate clinker cooling system, for which exergy contained in the exhaust air and the
cooled clinker are still considered to be recovered regardless of the end use. The exergy
efficiency of the grate clinker cooling system is relatively low compared to its energy
efficiency at 81.3%. This confirms that at the given system surroundings, not all energy
contained within the system can be converted to useful work. The exergy of the system
is always destroyed in the irreversible clinker cooling process, for which its
constituents are brought to a state of equilibrium with the surroundings.
Equation 4.17 shows that the exergy recovery efficiency of the system is much
lower at 43.2%. This is due to the fact that for exergy recovery efficiency, only the
exergy recovered and used at other phases of clinker production is taken into account.
Similar to the energy recovery efficiency, the exergy recovery efficiency of the system
also plays a bigger role in the improvement of the clinker cooler. Exergy recovery
efficiency represents the real room for improvement for the system.
40
4.3 Operational Parameter: Mass Flow Rate of Cooling Air
4.3.1 Change in First & Second Law Efficiencies of the Grate Clinker Cooling
System
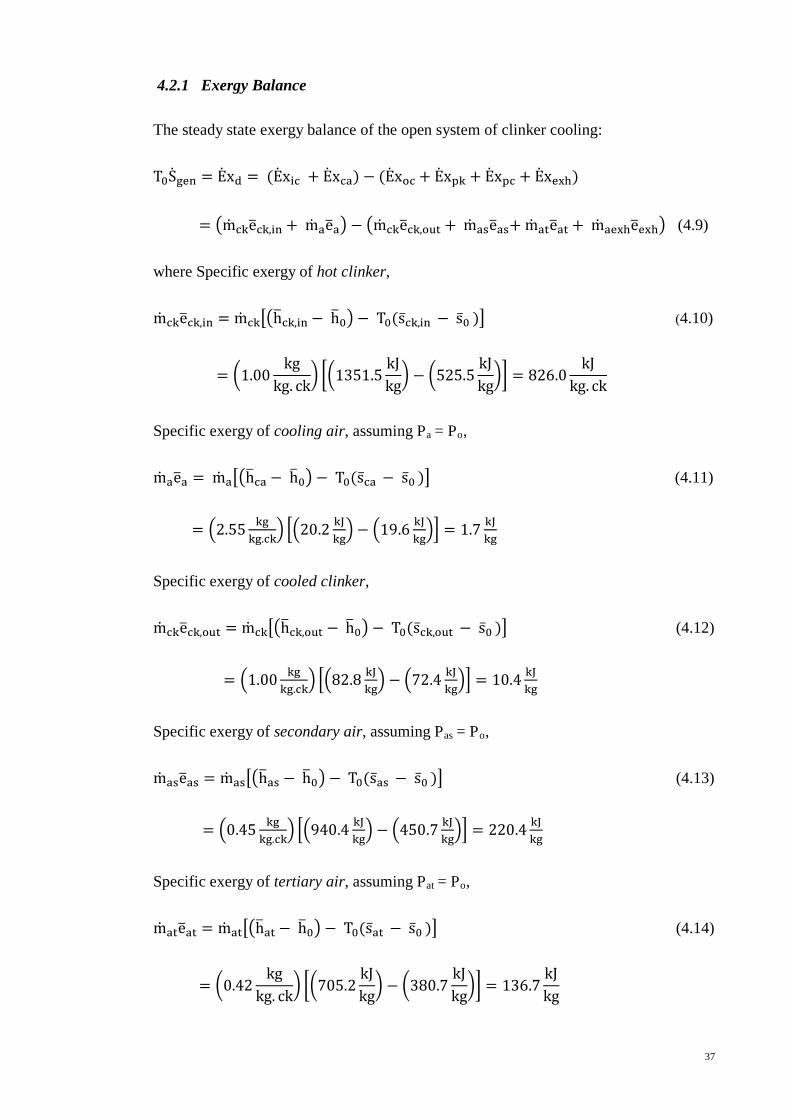
Variation in mass flow rate of cooling air will cause the change in outlet temperature of
clinker, due to an increase or decrease in the rate of heat transfer between the two
mediums. Theoretically, as we increase the mass flow rate of cooling air, we are able to
recover more heat energy from the solid clinker. The increase in mass flow rate of
cooling air will also cause a slight decrease in the outlet temperature of air, i.e. the
secondary and the tertiary air temperatures, and the exhaust air temperature (Mundhara
and Sharma, 2005).
Figure 4.3.1 (a) and Figure 4.3.1 (b) present the temperature profiles of solid
clinker and cooling air along the length of cooler at different mass flow rate of cooling
air, respectively. The temperature variation of clinker and air are estimated from the
corresponding variations in the figures borrowed from the computational results
obtained in the study performed by Mundhara and Sharma (2005).
Figure 4.3.1 (a) Variation of average caloric temperature of the clinker along the length of cooler at different mass flow rate of cooling air Source: Mundhara and Sharma, 2005

41
Figure 4.3.1 (b) Variation of air temperature at freeboard region along the length of cooler at different mass flow rate of cooling air Source: Mundhara and Sharma, 2005
For the air temperature profile, the cooler is divided into three regions, i.e. the
secondary air zone, the tertiary air zone and the exhaust air zone. On the other hand, for
the clinker temperature profile, this would not be necessary as only the temperature at
the outlet is of interest. For this analysis, only the temperature variations between the
circled points, and not the entire profile, are taken into account in order to estimate the
cooler’s performance with variation in its parameters. These points represent the points
of average temperatures for every zone in the cooler. In this analysis, the secondary air
temperature is estimated to decrease 0.2% with every 5% increase in mass flow rate of
cooling air, the tertiary air temperature is estimated to decrease 1.2% with every 5%
increase in mass flow rate of cooling air, and the exhaust air temperature is estimated to
decrease 2.1% with every 5% increase in mass flow rate of cooling air. The temperature
of the clinker outlet, on the other hand, is estimated to decrease 1.9% for every 5%
increase in mass flow rate of cooling air (Mundhara and Sharma, 2005).
42
Referring to the air temperature profile, the temperature of air varies along the
length of the cooler. At the initial length, the heat transfer is more at the bottom layers
of air compared to the upper layers of air. As the air moves upward, the temperature of
air increases and it reaches a temperature equal to the solid temperature and after a
certain bed height, no more heat transfer can take place. The temperature of the top
layer of air will be at a maximum. Moving along the length of the cooler, the heat
transfer increases at the top layers of air and decreases at the bottom layers of air. After
a certain length, the bottom layers of solids reach a temperature equal to the inlet
temperature of air, and no more heat transfer can take place at these layers. Now the air,
which goes to top layers, will be at a lower temperature. The maximum heat transfer
will take place in the upper part of the bed.
The air temperature profile of the air is also affected by the height of the cooler.
At the initial height, heat transfer is more at the cooler entrance layers of air compared
to the cooler exit layers of air. As the solid moves along the length, the temperature of
solid decreases and after a certain length it reaches a temperature very close to the air
temperature. No more heat transfer can take place at this place. Moving along the
height of the cooler it is observed that the heat transfer is increasing at the cooler exit
layers of air and decreasing at the cooler entrance of air, reaching a temperature very
close to the air temperature and ceasing any heat transfer. After a certain height the
temperature of the cooler entrance air has reached a temperature equal to the inlet
temperature of solid where no more heat transfer can take place. The maximum heat
transfer will take place in the region where the high temperature solid goes to the cooler
exit layers.
43
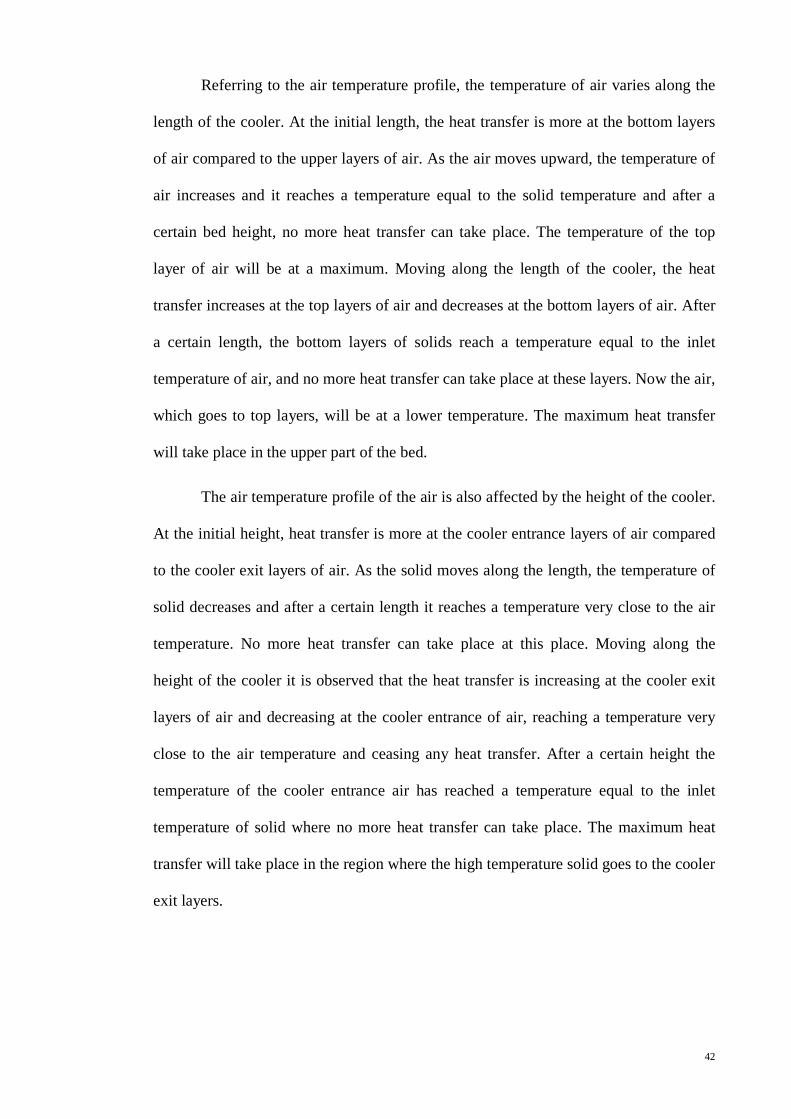
By performing an ideal energy and exergy analyses on the clinker cooler, we are
able to find the trend of the first and the second law efficiencies increment with the
increase of cooling air mass flow rate. Figure 4.3.1 (c) and Figure 4.3.1 (d) present the
variation in the first and the second law efficiencies with increment in mass flow rate of
cooling air, respectively.
Figure 4.3.1 (c) Variation in first law efficiencies of the grate clinker cooler with increment in mass flow rate of cooling air
The overall performance of the system can be represented by the general first
law or energy efficiency. For this study however, the energy recovery efficiency plays a
bigger role as it represents the major opportunity in energy and thus, cost saving. The
trend in Figure 4.3.1 (c) shows that the energy efficiency, as well as the energy
recovery efficiency of the grate clinker cooler increase with increasing mass flow rate
of cooling air. For every 5% increment in mass flow rate of cooling air, the clinker
cooler experiences roughly 1.4% hike in energy efficiency and 2.3% hike in energy
recovery efficiency.
30.0
40.0
50.0
60.0
70.0
80.0
90.0
0 5 10 15 20
η I(%
)
Increment in Flow Rate (%)
First Law Efficiencies vs. Cooling Air Flow Rate
Energy Efficiency
Energy Recovery Efficiency

44
As the mass flow rate of cooling air is increased, the temperature of clinker
solid at the outlet decreases. More energy is able to be absorbed by the increased air
flow and returned to the rotary burner and the pre-calciner as secondary and tertiary air,
respectively. Even though the increase in cooling air mass flow rate causes a drop in air
outlet temperatures, the main sources of energy recovery of the system, i.e. energy from
the secondary and tertiary air, are not significantly affected due to the low temperature
drops of these two parameters. In average, air temperatures near the end of the cooler
are more significantly affected compared to the ones near the beginning, where
secondary and tertiary air are returned to the rotary kiln and pre-calciner respectively.
The optimum mass flow rate of air for which energy recovery is maximum and the
mass flow rate of air and its temperature is suitable for coal burning in rotary kiln and
calciner can be determined with further variation of the parameter studied.
The unaccountable losses of the cooler, which are mainly convection and
radiation heat losses, reduce with increasing mass flow rate of cooling air.
Consequently, the first law efficiencies of the system also increase. These losses are
related primarily to the cooler surface and the surrounding temperatures. Introducing
larger mass flow rate of cooling air into the system improves the heat transfer rates
within the clinker cooler. As interpreted above, the air temperatures within the cooler
will drop with increasing mass flow rate of cooling air, as more air is available to
absorb and recover the same amount of heat energy from a specific amount of clinker.
This drop in temperature consequently leads to a lower average temperature in the
cooler, which causes the cooler wall temperature to drop as well. Since convection and
radiation are both dependent upon the magnitude of temperature difference between the
wall and the surroundings, a drop in wall temperature will decrease the amount of heat
loss to the surroundings.

45
Figure 4.3.1 (d)
Variation in second law efficiencies of the grate clinker cooler with increment in mass flow rate of cooling air
The trend in Figure 4.3.1 (d) shows that the exergy efficiency, as well as the
exergy recovery efficiency of the grate clinker cooler increase with increasing mass
flow rate of cooling air. For every 5% increment in mass flow rate of cooling air, the
clinker cooler experiences roughly 1.2% hike in energy efficiency and 1.9% hike in
energy recovery efficiency. As stated previously, the first law efficiencies of a system
only represent its general performance. It does not give any information on the
degradation of energy that occurs in the clinker cooling process. The second law
efficiencies on the other hand, represent the real room of improvement for the grate
clinker cooler. Similar to the energy recovery efficiency, the exergy recovery efficiency
plays a bigger role compared to exergy efficiency of the system alone.
It is apparent from Figure 4.3.1 (c) and Figure 4.3.1 (d) that the increase in
second law efficiencies of the system is lower than the increase in first law efficiencies,
with increment in cooling air mass flow rate. Actual processes occur in the direction of
decreasing quality of energy, and exergy represents the maximum capacity of a system
to perform useful work as it proceeds to a specified final equilibrium state with its
30.0
35.0
40.0
45.0
50.0
55.0
60.0
0 5 10 15 20
η II (
%)
Increment in Flow Rate (%)
Second Law Efficiencies vs. Increment in Mass Flow Rate
Exergy Efficiency
Exergy Recovery Efficiency

46
surroundings. In actual and irreversible processes such as the clinker cooling process, a
big amount of exergy is always destroyed due to the difference in conditions between
the energy sources and the environment. Compared to first law efficiencies, second law
efficiencies are always lower for any system, because not all the energy sources can be
converted to useful work.
The exergy content of a material depends on its temperature, its specific heat,
and its reference environment. The exergy contents of ideal gases also depend on their
pressures, but for this analysis they are assumed to be equal to that of the environment.
Exergy destruction during the process of clinker cooling is mainly due to the change in
the materials’ temperatures and the specific heat capacities associated with them.
Convection and radiation heat losses to the surroundings also contribute to the external
exergy losses of the system.
4.3.2 Electrical Energy Requirement with Increment in Mass Flow Rate of Cooling
Air
It is evident from the previous analysis that the increase in mass flow rate of cooling air
would bring about the improvement in the first and the second law efficiencies of the
grate clinker cooler. The increment in mass flow rate of cooling air is a result of an
increase in air flow from the cooler fans. To have an increment in air flow, it is fairly
typical for a cement plant to install Variable Speed Drives on the existing fans. This
technology allows fan speed and hence mass flow rate of cooling air to be varied with
respect to loads (Energy Efficiency Guide for Industry in Asia, 2005).

47
It can be estimated that the volumetric flow rate from a fan is directly
proportional to the motor speed, making the most efficient method to control the fan
output through fan speed control. On the other hand, power consumed by the fan motor
is proportional to the motor speed cubed, i.e. a small change in motor speed results in a
large change in power. (Energy Efficiency Guide for Industry in Asia, 2005).
Assuming the grate clinker cooler is originally equipped with fans at four
different sections, i.e. secondary air fans, tertiary air fans, exhaust air fans and cooling
air fans, the upgrade to cooling air fans would also have to be complemented by the
upgrades to these other fans. The additional electrical energy requirements after the
installation of VSD’s would be dependent on the fraction of air flow rate that these fans
have to accommodate.
Taking the plant output to be 3000 tonnes of clinker per day, and 187.5 tonnes
of clinker per hour, i.e. 16 hours of operation per day, we can estimate the additional
amount of electrical energy required from every 5% optimization of the mass flow rate
of cooling air. The density of air is taken as 1.109 kg/m3 at 45˚C, 0.3149 kg/m3 at
850˚C, 0.3835 kg/m3 at 650˚C, and 0.7174 kg/m3 at 220˚C (Cengel, 2006). The motor
power consumption is estimated from the amount of additional air flow rate and
typically used fan sizes. The additional power consumptions of the fan motors are
based on the assumptions that the average fan motor power consumption per unit
volume air flow rate is 0.00128 kW/cmh (Energy Efficiency Guide for Industry in Asia,
2005). Table 4.3.2 presents the additional fan electrical energy requirements for every
5% increase in mass flow rate of cooling air.
48
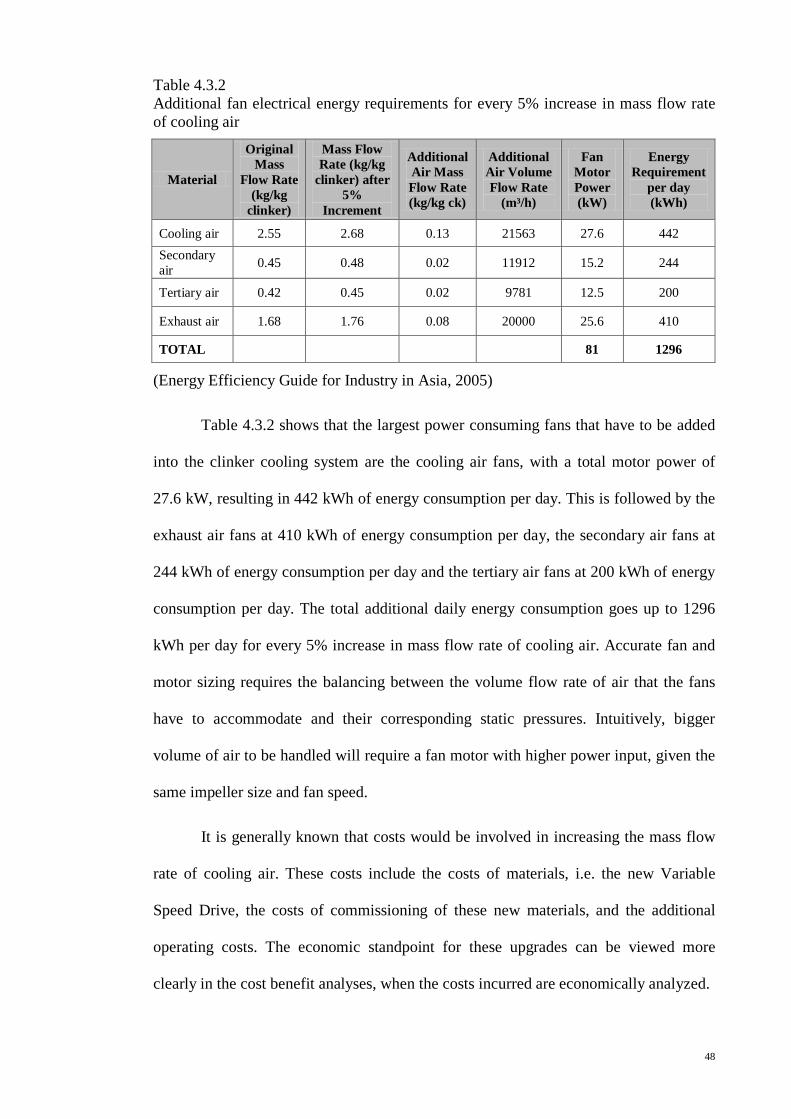
Table 4.3.2 Additional fan electrical energy requirements for every 5% increase in mass flow rate of cooling air
Material
Original Mass
Flow Rate (kg/kg
clinker)
Mass Flow Rate (kg/kg
clinker) after 5%
Increment
Additional Air Mass Flow Rate (kg/kg ck)
Additional Air Volume Flow Rate
(m³/h)
Fan Motor Power (kW)
Energy Requirement
per day (kWh)
Cooling air 2.55 2.68 0.13 21563 27.6 442 Secondary air 0.45 0.48 0.02 11912 15.2 244
Tertiary air 0.42 0.45 0.02 9781 12.5 200
Exhaust air 1.68 1.76 0.08 20000 25.6 410
TOTAL 81 1296
(Energy Efficiency Guide for Industry in Asia, 2005)
Table 4.3.2 shows that the largest power consuming fans that have to be added
into the clinker cooling system are the cooling air fans, with a total motor power of
27.6 kW, resulting in 442 kWh of energy consumption per day. This is followed by the
exhaust air fans at 410 kWh of energy consumption per day, the secondary air fans at
244 kWh of energy consumption per day and the tertiary air fans at 200 kWh of energy
consumption per day. The total additional daily energy consumption goes up to 1296
kWh per day for every 5% increase in mass flow rate of cooling air. Accurate fan and
motor sizing requires the balancing between the volume flow rate of air that the fans
have to accommodate and their corresponding static pressures. Intuitively, bigger
volume of air to be handled will require a fan motor with higher power input, given the
same impeller size and fan speed.
It is generally known that costs would be involved in increasing the mass flow
rate of cooling air. These costs include the costs of materials, i.e. the new Variable
Speed Drive, the costs of commissioning of these new materials, and the additional
operating costs. The economic standpoint for these upgrades can be viewed more
clearly in the cost benefit analyses, when the costs incurred are economically analyzed.
49
4.4 Operational Parameter: Temperature of Cooling Air
4.4.1 Change in First & Second Law Efficiencies of the Grate Clinker Cooling
System
Variation in cooling air temperature will theoretically affect the heat transfer rate
between the cooling air and the hot clinker, as heat transfer is driven by the temperature
difference between these two mediums. The magnitude of heat transfer is dependent
upon the magnitude of the abovementioned temperature difference. Despite the larger
capacity to absorb heat, the lower temperature cooling air also causes fall of air outlet
and clinker outlet temperatures, consequently leading to exergy losses (Touil et al.,
2005)
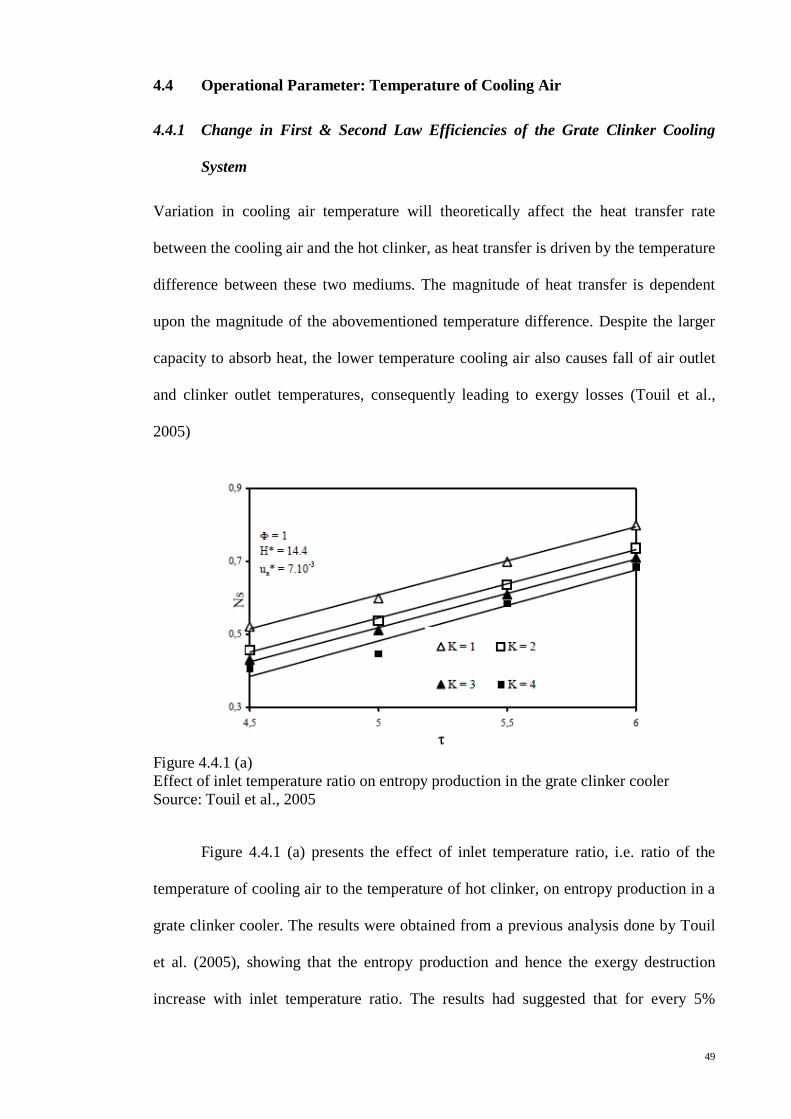
Figure 4.4.1 (a) Effect of inlet temperature ratio on entropy production in the grate clinker cooler Source: Touil et al., 2005
Figure 4.4.1 (a) presents the effect of inlet temperature ratio, i.e. ratio of the
temperature of cooling air to the temperature of hot clinker, on entropy production in a
grate clinker cooler. The results were obtained from a previous analysis done by Touil
et al. (2005), showing that the entropy production and hence the exergy destruction
increase with inlet temperature ratio. The results had suggested that for every 5%

50
decrease in cooling air temperature, the exergy destruction increases 7.4%. Similar to
the case with increasing the mass flow rate of cooling air, reducing its temperature will
also cause a decrease in the outlet temperatures of air, as well as the outlet temperature
of clinker. For this analysis, in order to estimate the first law efficiencies of the clinker
cooler, the clinker outlet temperature, the secondary and the tertiary air temperatures,
and the exhaust air temperature are assumed to vary an average of 2.31% with every
5% variation in temperature of cooling air (Touil et al., 2005).
By performing ideal energy and exergy analyses on the clinker cooler, we are
able to find the trend of the first and the second law efficiencies with variation in
cooling air temperature. Figure 4.4.1 (b) and Figure 4.4.1 (c) present the variation in the
first and the second law efficiencies of the grate clinker cooler with change in
temperature of cooling air, respectively.
Figure 4.4.1 (b) Variation in second law efficiencies of the grate clinker cooler with change in temperature of cooling air
30.0
35.0
40.0
45.0
50.0
55.0
60.0
-5 -4 -3 -2 -1 0 1 2 3 4 5
η II(%
)
Variation in Cooling Air Temperature (%)
Second Law Efficiencies vs. Cooling Air Temperature
Exergy Efficiency
Exergy Recovery Efficiency

51
The trend in Figure 4.4.1 (b) shows that the exergy efficiency, as well as the
exergy recovery efficiency of the grate clinker cooler increase with increasing
temperature of cooling air. The 7.4% increase in exergy destruction that comes with
every 5% decrease in cooling air temperature is partially reflected through the trend of
second law efficiencies of the system, where the exergy efficiency and the exergy
recovery efficiency roughly decrease 2.5% and 1.7% respectively, with every 5%
decrease in cooling air temperature.
Despite of the increased amount of energy that the lower temperature cooling
air is able to recover, this cooling does not restore to the air the initial hot clinker
temperature. This fall of temperature consequently causes internal exergy losses.
Theoretically, it is not desirable to cool clinker with air at low temperature, but at an
optimal high temperature corresponding to the minimum exergy loss. Heat recovery of
the exhaust air is a means that will contribute to the pre-heating of the cooling air and
decreasing external exergy losses.
Figure 4.4.1 (c) Variation in first law efficiencies of the grate clinker cooler with change in temperature of cooling air
20.0
30.0
40.0
50.0
60.0
70.0
80.0
90.0
-5 -3 -1 1 3 5
η I(%
)
Variation in Cooling Air Temperature (%)
First Law Efficiencies vs. Cooling Air Temperature
Energy EfficiencyEnergy Recovery Efficiency

52
With the given magnitude of increment in exergy destruction for every 5%
decrease in cooling air temperature, we are able to come up with an estimate of the
trend of the first law efficiencies of the clinker cooling system. Assuming a balance
variation in air outlet temperatures, i.e. 2.31% decrease with every 5% decrease in
cooling air temperature, the energy efficiency and the energy recovery efficiency of the
system drop roughly 1.2% and 0.1% respectively, with every 5% decrease in cooling
air temperature.
The unaccountable losses of the cooler, which are mainly convection and
radiation heat losses, reduce with increasing cooling air temperature up to a certain
extent. Consequently, the first law efficiencies of the system also increase slightly.
Higher cooling air temperatures result in higher outlet air temperatures, which
translates to higher amount of heat recovered to rotary kiln and pre-calciner. This effect
slightly overcomes the increased amount of heat loss through radiation and convection
to the surroundings, which also rises with increasing average temperature in the cooler.
4.4.2 Heat Energy Requirement with Increment in Temperature of Cooling Air
It has been proven that increasing the temperature of the cooling air to a certain degree
will result in the increment of the first and the second law efficiencies of the grate
clinker cooler. In order to increase the temperature of the cooling air, heat from the
exhaust air needs to be transferred to the cooling air via pipelines. Typically clinker
coolers will utilize a fraction of the exhaust air to perform this job.

53
Considering heat transfer efficiency of 100% between the exhaust air and the
cooling air, the amount of sensible heat required to increase the temperature of cooling
air by 5% is as follows:
Qcooling air = mcave(T2 − T1)
= �2.55kg
kg. ck� x �1.007
kJkg
. K� x (334K − 318K)
= 41.1 kJkg.ck
Taking the total sensible heat contained within the exhaust air for the base case
clinker cooler to be 337.2 kJ/kg.ck, the fraction of heat that is returned to heat the
cooling air is:
% Heat =Qcooling air
Qexh x 100%
=41.1 kJ
kg. ck
337.4 kJkg. ck
x 100% = 12.2%
From the analysis, it is apparent that 12.2% of the sensible heat contained
within the exhaust air is used to preheat the incoming cooling air from 45˚C to
approximately 60˚C. The specific heat of the air is taken at the average temperature of
52.5˚C. This analysis was performed under the assumption that no heat was lost during
the heat transfer. In reality, most of the heat is loss through convection and radiation
heat transfers from the improperly insulated pipelines to the surroundings. Out of the
337.4 kJ/kg clinker of sensible heat contained within the exhaust air, it can be said that
97.8% is dedicated to dry the coal and raw materials.
54
4.5 Operational Parameter: Mass Flow Rate of Clinker
4.5.1 Change in First & Second Law Efficiencies of the Grate Clinker Cooling
System
Mass flow rate generally affects the rate of heat transfer, i.e. the power consumed or
generated for any given system. From the previous study done by Mundhara and
Sharma (2005), we know that reducing the mass flow rate of clinker into the grate
clinker cooling system while maintaining the mass flow rate of cooling air will
theoretically reduce the temperature of clinker outlet. It has also been proven that the
temperatures of the outlet air are not significantly affected by the change in mass flow
rate of clinker (Mundhara and Sharma, 2005).
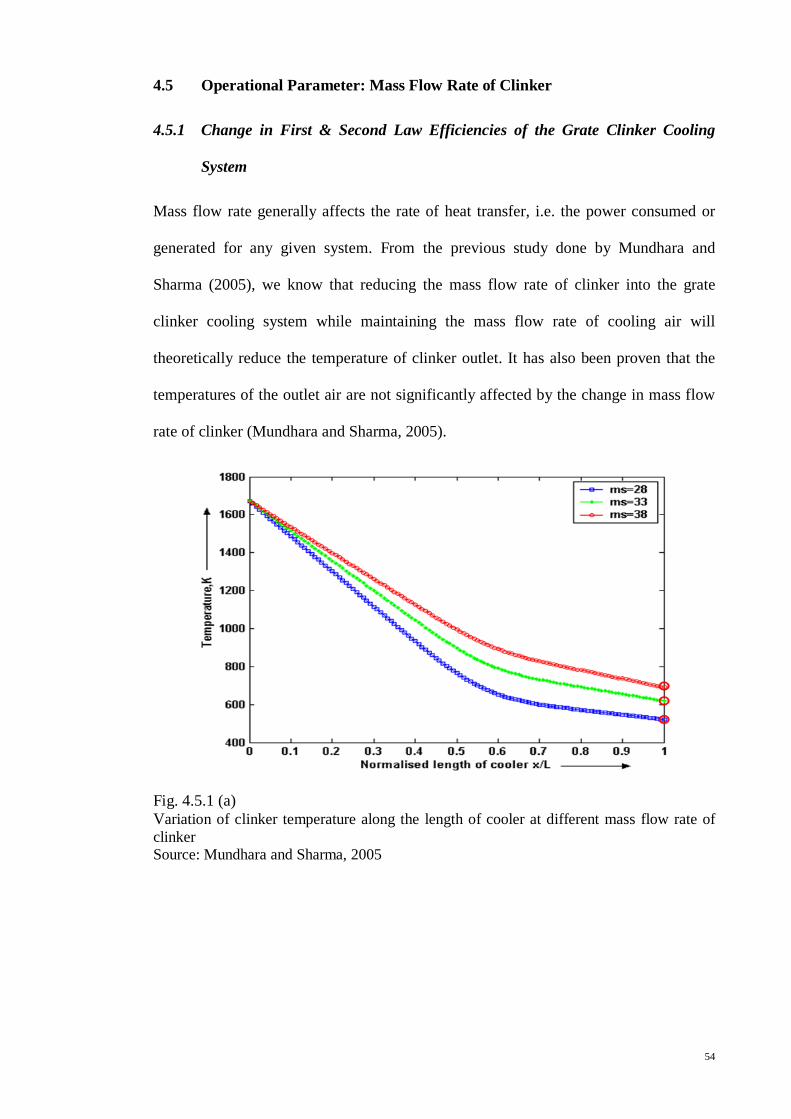
Fig. 4.5.1 (a) Variation of clinker temperature along the length of cooler at different mass flow rate of clinker Source: Mundhara and Sharma, 2005
55
Figure 4.5.1 (a) presents the temperature profiles of solid clinker along the
length of cooler at different mass flow rate of clinker. The temperature variation of
clinker is estimated from the corresponding variation in the figure borrowed from the
computational results obtained in the study performed by Mundhara and Sharma
(2005). The clinker outlet is estimated to decrease 3.7% with every 5% decrease in
mass flow rate of clinker (Mundhara and Sharma, 2005).
Referring to the clinker temperature profile, the temperature of clinker varies
along the length of the cooler. At the initial length, the heat transfer is more at the
bottom layers of clinker bed compared to the upper layers of clinker bed. When the air
moves upward the temperature of air increases and after reaching a certain bed height it
becomes equal to the solid temperature, where no more heat transfer can take place.
Hence, the temperature of the top layer of solids will be at a maximum. As the length of
cooler increases, the heat transfer increases at the top layers of clinker and decreases at
the bottom layers of clinker. The air, which goes up to the top layers, will be at a lower
temperature. After a certain length, the bottom layers of solids have reaches a
temperature equal to the inlet temperature of the air. No more heat transfer can take
place at these layers. The maximum heat transfer will take place in the upper part of the
bed.
By performing ideal energy and exergy analyses on the clinker cooler, we are
able to find the trend of the first and the second law efficiencies with decrement in
clinker mass flow rate. Figure 4.5.1 (b) presents the variation in the first and second law
efficiencies of grate clinker cooler with decrement in mass flow rate of clinker,
respectively.

56
Fig. 4.5.1 (b) Variation in first law efficiencies of the grate clinker cooler with decrement in mass flow rate of clinker
The trend in Figure 4.5.1 (b) shows that the energy efficiency, as well as the
energy recovery efficiency of the grate clinker cooler increase with decreasing mass
flow rate of clinker. For every 5% decrement in mass flow rate of clinker, the clinker
cooler experiences approximately 3.0% hike in energy efficiency and 2.9% hike in
energy recovery efficiency. As the mass flow rate of clinker is decreased, the clinker
outlet temperature experiences a decrement but the air outlet temperatures do not
significantly experience any change. Also, as the mass flow rate of clinker is decreased,
the heat input decreases but there is no decrement in heat transfer between solid and air.
Therefore the air still gets the same amount of heat from the clinker and hence the air
temperature remains constant. But as the heat input is decreasing the clinker
temperature also decreases.
30.0
40.0
50.0
60.0
70.0
80.0
90.0
100.0
0 5 10 15 20
η I(%
)
Mass Flow Rate Decrement (%)
First Law Efficiencies vs. Clinker Mass Flow Rate
Energy Efficiency
Energy Recovery Efficiency

57
The increment in the first law efficiencies actually represents the increased ratio
of cooling air to clinker at an instant, as well as the increase in time for the heat transfer
process to take place. More cooling air with a given amount of clinker to cool and time
for the heat transfer process to take place correspond to better heat transfer and
recovery rates. An optimum value of mass flow rate of clinker is required so that the
recovery of energy is at a maximum in the cooler at a reasonable plant output.
As mentioned above, it takes the same amount of cooling air to absorb a given
amount of heat from clinker, hence there would not be a change in temperature of air
outlets nor the average temperature of the cooler. With an increase in heat transfer
efficiency between the hot clinker and the cooling air, and the same amount of heat loss
through convection and radiation to the surroundings, the total unaccountable losses of
the system decreases significantly with decreasing mass flow rate of clinker.
Figure 4.5.1 (c) Variation in second law efficiencies of the grate clinker cooler with decrement in mass flow rate of clinker
35.0
40.0
45.0
50.0
55.0
60.0
65.0
70.0
0.0 5.0 10.0 15.0 20.0
η II(%
)
Decrement (%)
Second Law Efficiencies vs. Clinker Mass Flow Rate
Exergy Efficiency
Exergy Recovery Efficiency

58
The trend in Figure 4.5.1 (c) also shows an improvement over the second law
efficiencies of the system with decrement in mass flow rate of clinker. For every 5%
decrement in mass flow rate of clinker, the clinker cooler experiences approximately
2.9% hike in exergy efficiency and exergy recovery efficiency each. In this case, the
improvement in second law efficiencies of the system is comparable to its first law
counterparts. As previously discussed, the increase in these efficiencies represents the
improvement in the rates of heat transfer and heat recovery, due to the increased
amount of cooling air per unit clinker and to the prolonged amount of time for the heat
transfer process to occur. The main task of cooler is to cool down the hot clinker to the
lowest possible temperature and at the same time the cooling air should be preheated to
a temperature level such that we need the lowest energy input for the burning process in
rotary kiln. Decreasing the mass flow rate of clinker will improve the system’s first and
second law efficiencies, but at the expense of clinker output of the plant.
4.5.2 Energy Requirement with Decrement in Mass Flow Rate of Clinker
It was proven from the analysis performed that decreasing the mass flow rate of clinker
will result in the increment of the first and the second law efficiencies of the clinker
cooling system. Evidently decreasing the mass flow rate of clinker would also translate
to a decrease in plant output per unit time. It is to be noted that the reduction in mass
flow rate of clinker is not similar to increasing the mass flow rate of cooling air,
secondary air, tertiary air and exhaust air by the same percentage. This is because heat
transfer rate is also affected by the amount of time that the clinker spends inside the
cooler, and not only by the relative mass flow rates of the air to the clinker.

59
The decrement in mass flow rate of clinker would also affect the mass flow rate
of the other phases in the cement production process, as these phases are sequential.
The main phases of interest would be the calcination phase and the burning phase,
because they are energy consumers and are directly related to the clinker cooling phase.
Phases such as milling, mixing and grinding are isolated from the abovementioned
phases, as the materials are commonly stored in silos beforehand. As such, the mass
flow rates of clinker in those phases are not highly affected by the change in mass flow
rate of clinker in the cooling phase.
To come up with the same amount of output rate per day of the plant, the three
phases would have to be run at an extended period of time. Even so, it can be assumed
that no additional thermal energy is required to run the calcination phase and the
burning phase, since the thermal energy consumption rates are based on the rate of
material input into these phases. However, the electrical energy consumption rates, i.e.
by the conveyor motors in the pre-calciner and the rotary kiln that move the clinker, are
affected by the extension of running period. The conveyor motors’ energy consumption
are assumed to be equal that of the energy consumption of the cooler grate, each.
Taking the plant output of 3000 tonnes of clinker per day, and 187.5 tonnes of
clinker per hour, the three phases, i.e. calcination, burning and cooling, would have to
be run for an extended period of 0.84 hour, or 50.5 minutes to reach the plant output
rate mentioned. Table 4.5.2 presents the additional amount of energy consumed for the
clinker cooling system for every 5% decrease in mass flow rate of clinker, i.e. to run at
an extended period of 0.84 hour.

60
Table 4.5.2 Additional energy requirement for the grate clinker cooler for every 5% decrease in mass flow rate of clinker
Power Consumer Power Consumption (kW) Additional Energy Requirement per day (kWh)
Cooling Air Fans 1153 969 Secondary Air Fans 717 602 Tertiary Air Fans 549 461 Exhaust Air Fans 1174 987 Grate 200 168 Conveyors 400 336 TOTAL 3794 3523
From Table 4.5.2, it is shown that the grate clinker cooler will consume a total
of 3187 kWh of energy to run for an additional period of 50.5 minutes a day. The
highest energy consumers from the grate clinker cooling system are the exhaust air
fans, with 987 kWh. This is followed by the cooling air fans at 969 kWh, the secondary
air fans at 602 kWh, the tertiary air fans at 461 kWh, the conveyors at 336 kWh, and
lastly the grate at 168 kWh. It can be seen that the exhaust air fans require more energy
compared to the cooling air fans, as well as the secondary and tertiary air fans. Fan
power consumption is based on volumetric flow rate, and not only on the mass flow
rate of air. Hotter air on the exhaust side has lower density compared to the cooler air
on the intake side, consequently causing the fans at the exhaust side to work harder to
evacuate a given mass flow rate of air.

61
4.6 Operational Parameter: Grate Speed
4.6.1 Change in First & Second Law Efficiencies of the Grate Clinker Cooling
System
Variation in grate speed will result in change of clinker outlet temperature, as well as
the air outlet temperatures. As opposed to previous parameters, change in grate speed
does not result in the commonly predictable trends of outlet temperatures. Studies have
proven that as grate speed is increased, first the air temperature increases with grate
speed and after a certain value of grate speed it starts to decrease. On the other hand as
the grate speed increases the solid bed height will decrease, therefore increasing heat
transfer. Consequently, heat transfer will be at a maximum at a certain grate speed
(Mundhara and Sharma, 2005).
Figure 4.6.1 (a) Variation of air temperature along the length of cooler at different grate speeds Source: Mundhara and Sharma, 2005
62
Figure 4.6.1 (a) presents the temperature profile of cooling air along the length
of cooler at different grate speeds. The temperature variation of air is estimated from
the corresponding variations in the figures borrowed from the computational results
obtained in the study performed by Mundhara and Sharma (2005). Similar to the
previous case, the cooler is divided into three regions, i.e. the secondary air zone, the
tertiary air zone and the exhaust air zone. The secondary and the tertiary air
temperatures, as well as the exhaust air temperature are assumed to vary accordingly.
However, the change in grate speed is assumed to have no significant effect on the
clinker outlet temperature (Mundhara and Sharma, 2005).
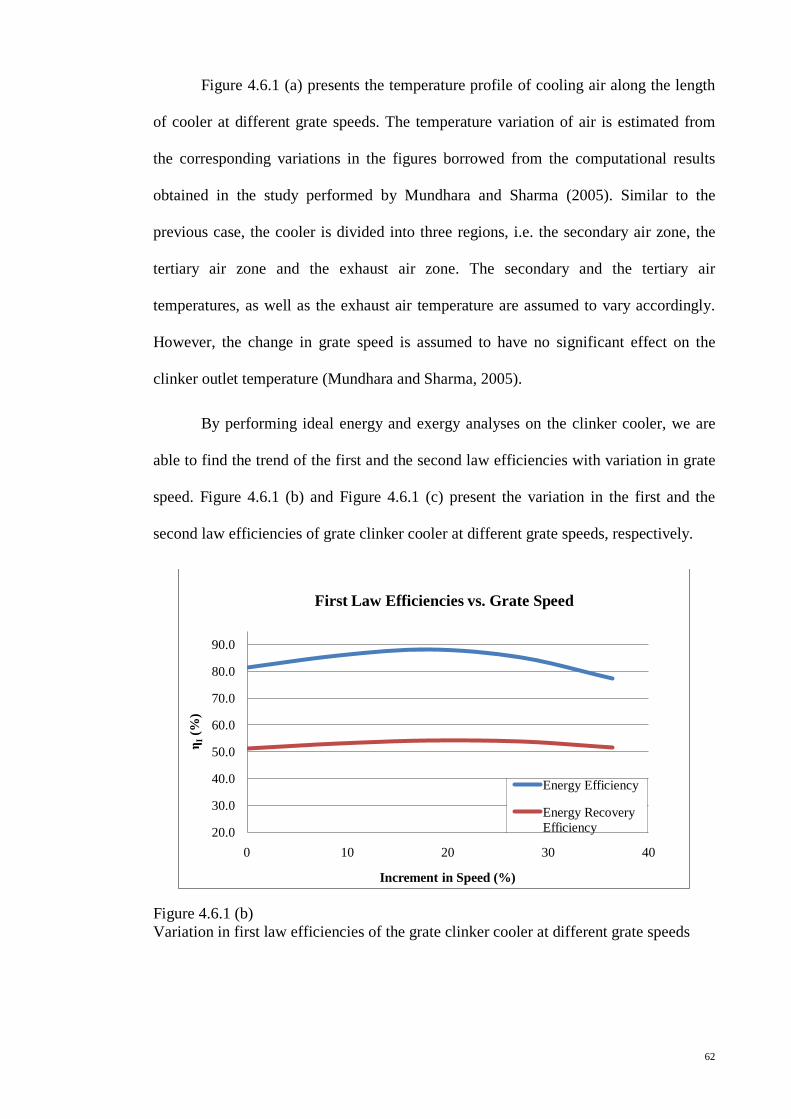
By performing ideal energy and exergy analyses on the clinker cooler, we are
able to find the trend of the first and the second law efficiencies with variation in grate
speed. Figure 4.6.1 (b) and Figure 4.6.1 (c) present the variation in the first and the
second law efficiencies of grate clinker cooler at different grate speeds, respectively.
Figure 4.6.1 (b) Variation in first law efficiencies of the grate clinker cooler at different grate speeds
20.0
30.0
40.0
50.0
60.0
70.0
80.0
90.0
0 10 20 30 40
η I(%
)
Increment in Speed (%)
First Law Efficiencies vs. Grate Speed
Energy Efficiency
Energy Recovery Efficiency
63
The trend in Figure 4.6.1 (c) shows that the first law efficiencies first increase
with increasing grate speed until it reaches a certain maximum, i.e. after 18.2%
increment in speed, and they will then drop with further increasing grate speed. The
highest energy efficiency and energy recovery efficiency for the system are 88.2% and
54.1% at this point, respectively. For this case, the air outlet temperatures play an
important role as they affect the amount of heat recovery of the system, and hence, the
first law efficiencies.
Air temperature will first increase with grate speed until it reaches a certain
maximum, and then drop thereafter. The reason behind this is that as the grate speed is
increased, the residence time of clinker will decrease, giving less time for the given
amount of cooling air to absorb the heat from the hot clinker. This consequently leads
to lower heat transfer between the two mediums. However, as grate speed is increased,
the clinker bed height will decrease, leaving more surface area of the hot clinker
exposed to the cooling air, which consequently leads to higher rate of heat transfer.
This opposing effect causes the first law efficiencies of the system to be at a maximum
at a certain speed, and for this case, it corresponds to the grate speed after 18.2% speed
increment from the base case.
As discussed previously, higher heat transfer efficiency between the two
mediums automatically means less heat energy is loss in the process. Even though
increasing grate speed results in generally higher temperature air outlets, the amount of
energy that is able to be recovered through secondary and tertiary air supersedes the
amount of heat losses to the surroundings via convection and radiation. This is
generally true up to about 27.3% of grate speed increment. Further increment in grate
speeds results in the amount of heat loss to the surroundings through convection and
radiation overcoming the increased heat transfer efficiency between the two mediums
in the cooler, causing lower first law efficiencies of the system.
64
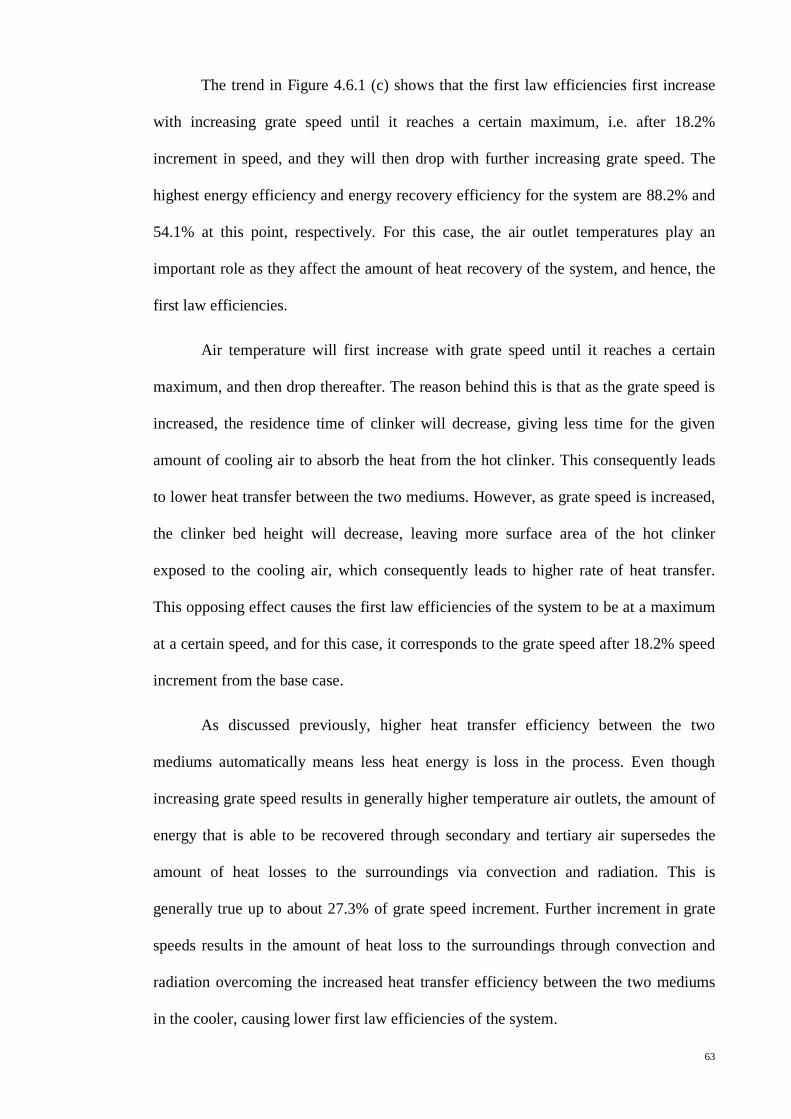
Figure 4.6.1 (c) Variation in second law efficiencies of the grate clinker cooler at different grate speeds
Similar to the trend in first law efficiencies, Figure 4.6.1 (c) also signifies
maximum second law efficiencies after 18.2% increment in grate speed. The exergy
efficiency and the exergy recovery efficiency of the system have values of 60.1% and
46.5% respectively at this very speed. While the energy efficiency and the energy
recovery efficiency increase 7.1% and 2.8% respectively, its second law efficiency
counterparts managed to climb at a comparable magnitude of 6.4% and 3.3%
respectively when the grate speed is increased 18.2%. The exergy efficiency and the
exergy recovery efficiency are at their lowest values of 51.7% and 43.7% after 36.4%
of grate speed increment, respectively.
Higher exergy recovery efficiency improvement compared to energy recovery
efficiency improvement at the optimum speed signifies that the internal exergy
destruction during the process is minimized more than the external exergy destruction.
The second law efficiencies are at a certain extent affected by the temperatures of the
air outlets, clinker and their specific heat, which may also cause the greater
improvement in exergy recovery efficiency over energy recovery efficiency. As we
15.0
25.0
35.0
45.0
55.0
65.0
0 10 20 30 40
η II(%
)
Increment in Speed (%)
Second Law Efficiencies vs. Grate Speed
Exergy Efficiency
Exergy Recovery Efficiency

65
already know, the biggest contributors to heat recovery are the hot air returning to the
rotary burner and pre-calciner as secondary and tertiary air, respectively.
The important note that should be taken when one is able to control the grate
speed is to find the optimum speed at which the first and the second law efficiencies of
the system are at their maximums, as higher grate speed does not only affect these
efficiencies but also the cost incurred in supplying energy to move the grates.
4.6.2 Energy Requirement with Increment in Grate Speed
Up to a certain value of grate speed, its increment will bring about the improvement in
the first and the second law efficiencies of the clinker cooling system. Unfortunately
the increment of grate speed would also mean the increment in power input to move the
grate faster. Similar to the VSD’s that can be installed on the fans of the grate clinker
cooling system, this technology can also be applied to the grates to regulate the speed
in accordance to the load.
The base case cooler grate motor power consumption can be calculated by first
finding the cooler grate drive force, F = Ga x Df where Ga is the grate area in m2, and
Df is the specific cooler drive force in kN/m2. Taking each cooler grate to have a
surface area of 30 m2 and the specific cooler drive force as 11.5 kN/m2 (MathCement
2000):
F = 30m2 x 11.5kNm2
= 345.0 kN

66
The torque at eccentric shaft is T = F x S2 x 1000
, where F is the total drvie force in kN
and S is the stroke length in mm (MathCement 2000).
T = 345.0 kN x 120mm2 x 1000
= 20.7 kN. m
This torque has to be transmitted via chain wheel with a maximum driven sprocket or
strokes per minute of N. The shaft power is then (MathCement 2000):
Ps =2πNT
60
=2π x 22 strokes/ min x 20.7 kN. m
60
= 47.7kW
Taking into account power losses through the gears and etc., the motor power required
to run each grate is as follows (MathCement 2000):
Pm = 1.4Ps
= 1.4 x 47.7kW
= 66.8 kW
The power consumption by each grate to produce the base case travelling speed
is 66.8kW. For a plant producing 3000 tonnes of clinker per day, it is fairly common
for the phase to have three travelling grates. Hence, the total power consumption to
produce the base case travelling speed would be 200.4 kW. Assuming that the
increment in power input to the grate is proportional to the grate speed, the clinker
cooling system would require an additional power of 18.2 kW for every 9.1%
increment in grate speed. This would result in a total of 291.8 kWh per day, assuming
that the plant operates 16 hours daily.
67
Costs that have to be incurred in having the capability to manipulate the grate
speed include the costs of materials, i.e. the new VSD’s, the cost of commissioning of
the new materials, and the additional operating costs for having a higher grate speed.
The cost benefit analyses shall present the economic standpoint for these investments in
a clearer manner, when the costs are economically analyzed using various methods
such as payback period, present value and cost of energy conserved.
4.7 Heat Recovery of Exhaust Air
4.7.1 Change in First & Second Law Efficiencies of the Grate Clinker Cooling
System
Generally, all output flows from the cooler system have potential for waste heat
recovery. One of the main sources of energy conservation is the sensible heat of
exhaust air from the clinker cooler. Considerable amount of heat is lost in the excess
cooler exhaust, which can be used to preheat primary air to the kiln system, as well as
the cooling air into the clinker cooler (Rasul et al., 2005). The effect of exhaust air
recovery is studied under varying mass flow rate of cooling air, temperature of cooling
air, mass flow rate of clinker, and grate speed. For the first and the second law analyses,
all the other parameters of the grate clinker cooler remain the same as with the results
obtained previously. As such, only the recovery efficiency of the cooler will be
affected.
68
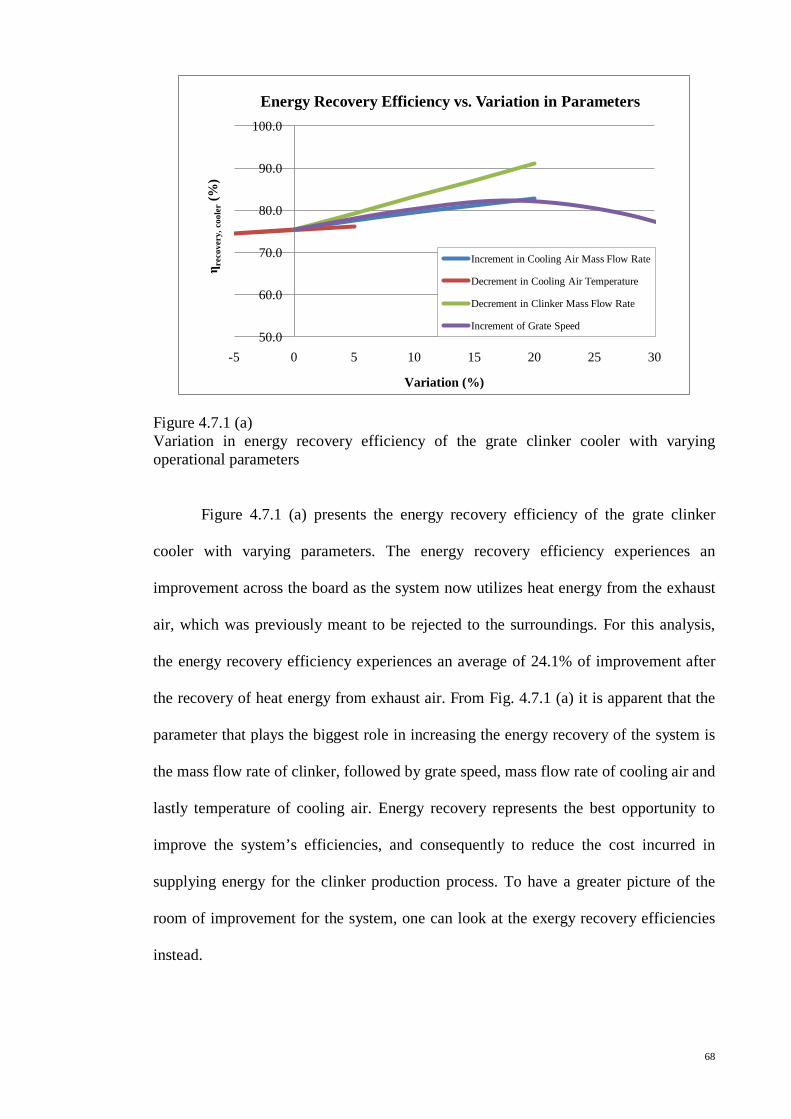
Figure 4.7.1 (a) Variation in energy recovery efficiency of the grate clinker cooler with varying operational parameters
Figure 4.7.1 (a) presents the energy recovery efficiency of the grate clinker
cooler with varying parameters. The energy recovery efficiency experiences an
improvement across the board as the system now utilizes heat energy from the exhaust
air, which was previously meant to be rejected to the surroundings. For this analysis,
the energy recovery efficiency experiences an average of 24.1% of improvement after
the recovery of heat energy from exhaust air. From Fig. 4.7.1 (a) it is apparent that the
parameter that plays the biggest role in increasing the energy recovery of the system is
the mass flow rate of clinker, followed by grate speed, mass flow rate of cooling air and
lastly temperature of cooling air. Energy recovery represents the best opportunity to
improve the system’s efficiencies, and consequently to reduce the cost incurred in
supplying energy for the clinker production process. To have a greater picture of the
room of improvement for the system, one can look at the exergy recovery efficiencies
instead.
50.0
60.0
70.0
80.0
90.0
100.0
-5 0 5 10 15 20 25 30
η rec
over
y,co
oler
(%)
Variation (%)
Energy Recovery Efficiency vs. Variation in Parameters
Increment in Cooling Air Mass Flow Rate
Decrement in Cooling Air Temperature
Decrement in Clinker Mass Flow Rate
Increment of Grate Speed

69
Figure 4.7.1 (b) Variation in exergy recovery efficiency of the grate clinker cooler with varying operational parameters
Figure 4.7.1 (b) presents the exergy recovery efficiency of the grate clinker
cooler under the same variation of parameters as in the case above. The exergy
recovery efficiency also experiences an improvement across the board similar to the
energy recovery efficiency. The exergy recovery efficiency for this case, experiences
an average of 9.4% of improvement after the recovery of heat energy from the exhaust
air. It is also evident from Figure 4.7.1 (b) that the mass flow rate of clinker plays the
biggest role in exergy efficiency improvement. However, the parameter of cooling air
temperature has now not the smallest role. Exergy recovery efficiency with variation in
cooling air temperature is more accurate for this study, since the energy recovery
efficiency was estimated from assumed plug-in temperatures of air outlets.
The hot air exiting from the clinker cooler as exhaust air has not a very high
temperature, for which it cannot be used as secondary air for combustion in the rotary
kiln or as tertiary air going to the pre-calciner for the upcoming calcination process.
Despite that disadvantage, the heat carried by this exhaust air can still be used to
preheat the primary air to the rotary kiln, to dry raw material and coal, as well as to
30.0
35.0
40.0
45.0
50.0
55.0
60.0
65.0
70.0
-5 0 5 10 15 20 25 30
η exe
rgy
reco
very
, coo
ler
(%)
Variation (%)
Exergy Recovery Efficiency vs. Variation in Parameters
Increment in Cooling Air Mass Flow Rate
Decrement in Cooling Air Temperature
Decrement in Clinker Mass Flow Rate
Increment in Grate Speed
70
preheat the cooling air to an optimum temperature. The use of this heat energy is as a
substitute to the heat energy that is supplied by combusting fossil fuel in these phases
of the clinker production process.
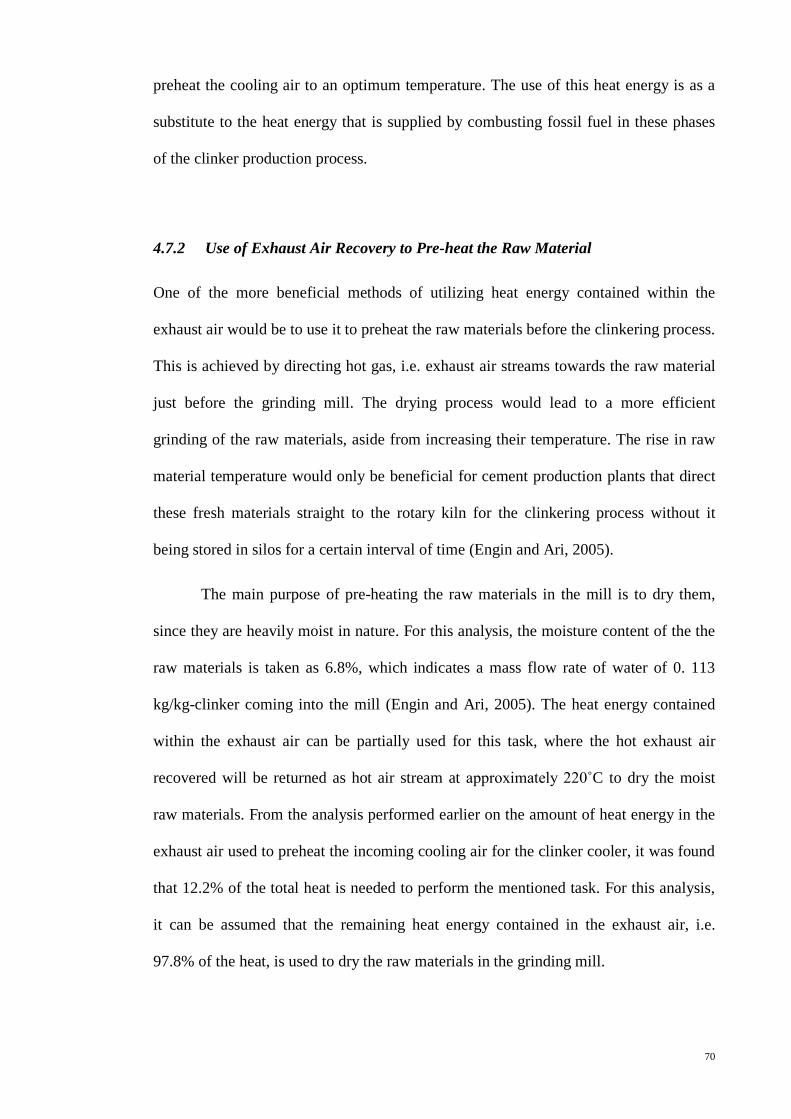
4.7.2 Use of Exhaust Air Recovery to Pre-heat the Raw Material
One of the more beneficial methods of utilizing heat energy contained within the
exhaust air would be to use it to preheat the raw materials before the clinkering process.
This is achieved by directing hot gas, i.e. exhaust air streams towards the raw material
just before the grinding mill. The drying process would lead to a more efficient
grinding of the raw materials, aside from increasing their temperature. The rise in raw
material temperature would only be beneficial for cement production plants that direct
these fresh materials straight to the rotary kiln for the clinkering process without it
being stored in silos for a certain interval of time (Engin and Ari, 2005).
The main purpose of pre-heating the raw materials in the mill is to dry them,
since they are heavily moist in nature. For this analysis, the moisture content of the the
raw materials is taken as 6.8%, which indicates a mass flow rate of water of 0. 113
kg/kg-clinker coming into the mill (Engin and Ari, 2005). The heat energy contained
within the exhaust air can be partially used for this task, where the hot exhaust air
recovered will be returned as hot air stream at approximately 220˚C to dry the moist
raw materials. From the analysis performed earlier on the amount of heat energy in the
exhaust air used to preheat the incoming cooling air for the clinker cooler, it was found
that 12.2% of the total heat is needed to perform the mentioned task. For this analysis,
it can be assumed that the remaining heat energy contained in the exhaust air, i.e.
97.8% of the heat, is used to dry the raw materials in the grinding mill.

71
The majority of the useful energy must be used to heat the water from 15˚ C to
100˚C, and to vaporize it at this temperature completely. For this analysis, the heat
losses to the surroundings, i.e. via convection and radiation are ignored. Energy balance
for the grinding mill will shows the energy interactions within the system (Engin and
Ari, 2005):
Qhot air + Qmoist raw material = Qwater + Qcooled air + Qdry raw material (5.1)
Qcooled air = 6.944 x (1.48 x 300 + 1.78 x 12) − 0.7845 x (419 − 63 + 2257)
− 6.994 x 1.67 x 88
= 153.7 kW
The related enthalpies are shown more clearly in Figure 4.7.2.
Figure 4.7.2 Energy balance of the grinding mill for the drying process of raw materials (Engin and Ari, 2005)

72
4.8 Potential Energy & Cost Savings
An improvement in energy recovery efficiency of the clinker cooling system translates
to energy savings, as the energy recovered serves as a substitute to the energy supplied
through combustion of fossil fuel throughout the whole process of clinker production.
For this analysis we will focus the attention to the improvement in energy recovery
efficiency of the clinker cooler as it represents the theoretical opportunity for cost
saving. Table 4.8 (a) presents the energy saving summary for every 5% optimization of
the parameters analyzed, while Figure 4.8 (a) presents the energy saving contribution
for each operational parameter.
Table 4.8 (a) Energy saving summary for every 5% optimization of operational parameters
Operating Parameters Average Improvement in
Energy Recovery Efficiency (%)
Energy Saved (kJ/kg.ck)
Rotary Kiln
Pre-Calciner TOTAL
Mass Flow Rate of Cooling Air 2.32 22.54 11.48 34.01
Cooling Air Temperature 0.14 13.31 10.12 23.43
Mass Flow Rate of Clinker 2.88 23.98 18.01 41.99
Grate Speed 0.77 (up to 18.2% optimization) 4.75 6.02 10.77
TOTAL 64.58 45.63 110.21
Figure 4.8 Energy saving contribution of operational parameters
Mass Flow Rate of
Cooling Air31%
Cooling Air Temperature
21%
Mass Flow Rate of Clinker
38%
Grate Speed10%

73
The manipulation of operational parameters of the grate clinker cooler will
result in direct energy saving, and improvements over these parameters contribute
directly to heat recovery via secondary and tertiary air to the rotary kiln and the pre-
calciner, respectively. From Figure 4.8, out of the four operational parameters analyzed,
mass flow rate of clinker plays the largest role in contributing to heat recovery, and
hence energy saving. It contributes 38% of the total energy savings from the four
operational parameters analyzed. This score is followed closely by mass flow rate of
cooling air with 31%, cooling air temperature with 21%, and lastly grate speed with
10%.
Considering the average fuel price of USD 4.664/GJ, Table 4.8 (b) presents the
summary of theoretical cost per tonne clinker that can be saved as a result from every
5% optimization of the operational parameters of the grate clinker cooler (Price et al.,
2009). It is to be noted that the cost saving only represents the amount of money saved
from the improvement of the grate clinker cooler’s operational parameters, not taking
into account the increment in cost incurred as a result of the respective upgrades.
Table 4.8 (b) Cost saving summary for every 5% optimization of the operational parameters
Operating Parameters Average Improvement
in Energy Recovery Efficiency (%)
Cost Saving (USD/tonne.ck) Rotary
Kiln Pre-
Calciner TOTAL
Mass Flow Rate of Cooling Air 2.32 0.105 0.054 0.159
Cooling Air Temperature 0.14 0.062 0.047 0.109
Mass Flow Rate of Clinker 2.88 0.112 0.084 0.196
Grate Speed 0.77 (up to 18.2% optimization) 0.022 0.028 0.050
TOTAL 0.301 0.213 0.514
(Price et al., 2009)
74
From Table 4.8 (b), it is apparent that for every tonne of clinker produced, 5%
of mass flow rate of clinker optimization will result in theoretically USD 0.196 of cost
saving. The trend follows with USD 0.159 for the optimization of mass flow rate of
cooling air, USD 0.109 for the optimization of cooling air temperature, and lastly USD
0.050 for the optimization of grate speed. A total cost saving of USD 0.514 per tonne of
clinker is generated for having optimized operational parameters, i.e. an energy
efficient clinker cooling system. For this analysis, the average unit price of fuel paid by
the cement plants, i.e. USD 4.664/GJ does not take into account the price of diesel fuel.
This is due to the fact that only a small amount of diesel is used in most plants, and is
negligible compared to coal consumption (Price et al., 2009).
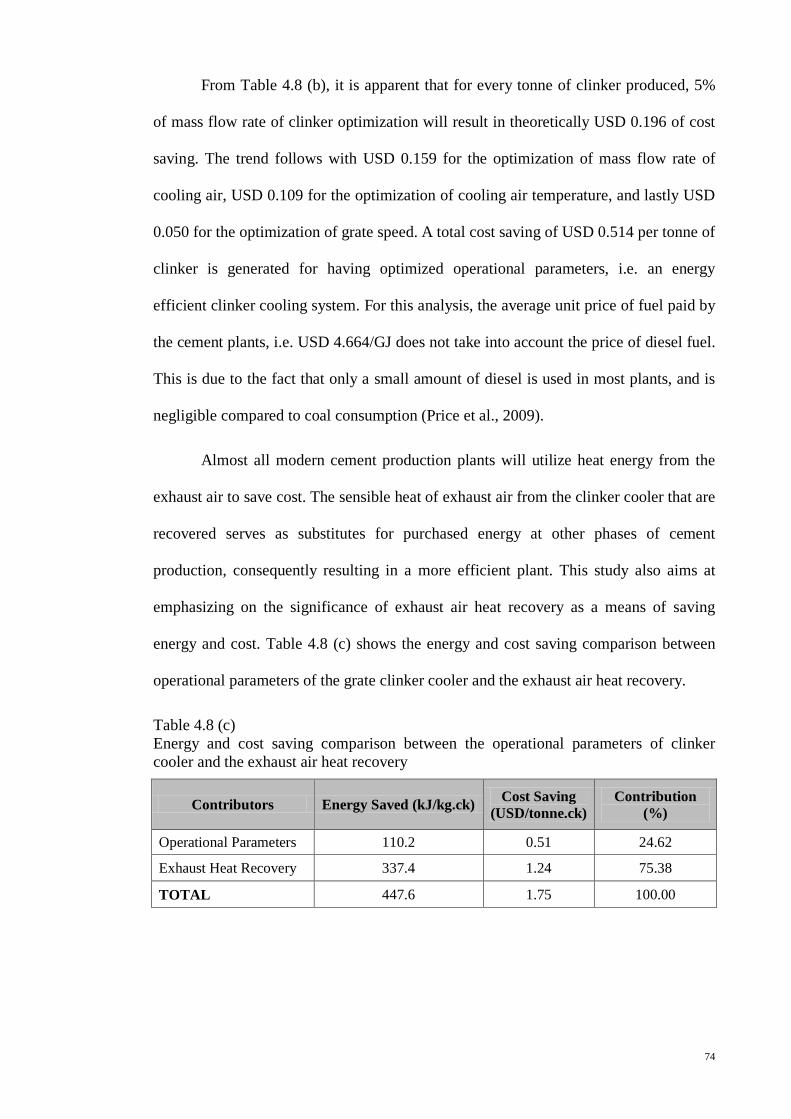
Almost all modern cement production plants will utilize heat energy from the
exhaust air to save cost. The sensible heat of exhaust air from the clinker cooler that are
recovered serves as substitutes for purchased energy at other phases of cement
production, consequently resulting in a more efficient plant. This study also aims at
emphasizing on the significance of exhaust air heat recovery as a means of saving
energy and cost. Table 4.8 (c) shows the energy and cost saving comparison between
operational parameters of the grate clinker cooler and the exhaust air heat recovery.
Table 4.8 (c) Energy and cost saving comparison between the operational parameters of clinker cooler and the exhaust air heat recovery
Contributors Energy Saved (kJ/kg.ck) Cost Saving (USD/tonne.ck)
Contribution (%)
Operational Parameters 110.2 0.51 24.62
Exhaust Heat Recovery 337.4 1.24 75.38
TOTAL 447.6 1.75 100.00

75
From Table 4.8 (c), it is evident that the recovery of heat from exhaust air
overshadows all the operational parameters in terms of energy and cost savings. It
represents roughly 75% of the amount heat recovery itself, as compared to 25% for the
operational parameters. Even though 75% of heat recovery takes place during the
clinker cooling process via heat recovery of exhaust air, not all of the heat acts as a
substitute to heat energy generated from the combustion of fossil fuel or to electrical
energy consumed. For example, heat that is returned to preheat the incoming cooling
air for the clinker cooler to an optimum temperature cannot be counted as a substitute
to energy consumed. This is because in the original configuration, no heat energy is
purchased to heat up the incoming cooling air. For the heat recovery of exhaust air,
12.2% of the recovered heat energy is assumed to be dedicated to pre-heat the cooling
air for the cooler, and the remaining to dry the raw material and the coal.
The focus of this study however, would be on how the improvements in the
grate clinker cooler’s operational parameters alone can generate cost saving. For a
cement plant that produces about 3000 tonnes of clinker per day, and operates 300 days
a year, the theoretical total cost saving from optimizing the four operational parameters
analyzed goes up to USD 462,600.00 annually. The mass flow rate of clinker brings
forth the most saving out of the four operational parameters analyzed, but it is also a
compromise between energy efficiency and clinker output rate of the plant. Mass flow
rate of cooling air and grate speed on the other hand, are a compromise between energy
efficiency and the amount of electrical energy supplied to the blower and the grate,
respectively. The temperature of the cooling air however, has no trade-off for its
improvement, except for the amount of heat energy recovered that one decides to
supply to the air instead of other phases of the production process the drying of raw
material.
76
4.9 Payback Period
The payback period method of appraisal for this analysis is the period of time over
which the energy savings of a project equal the amount of cost incurred at project
inception. This generally tells how much time it takes for the cash inflow will
overcome the amount of cost incurred, taking into account the energy purchased and
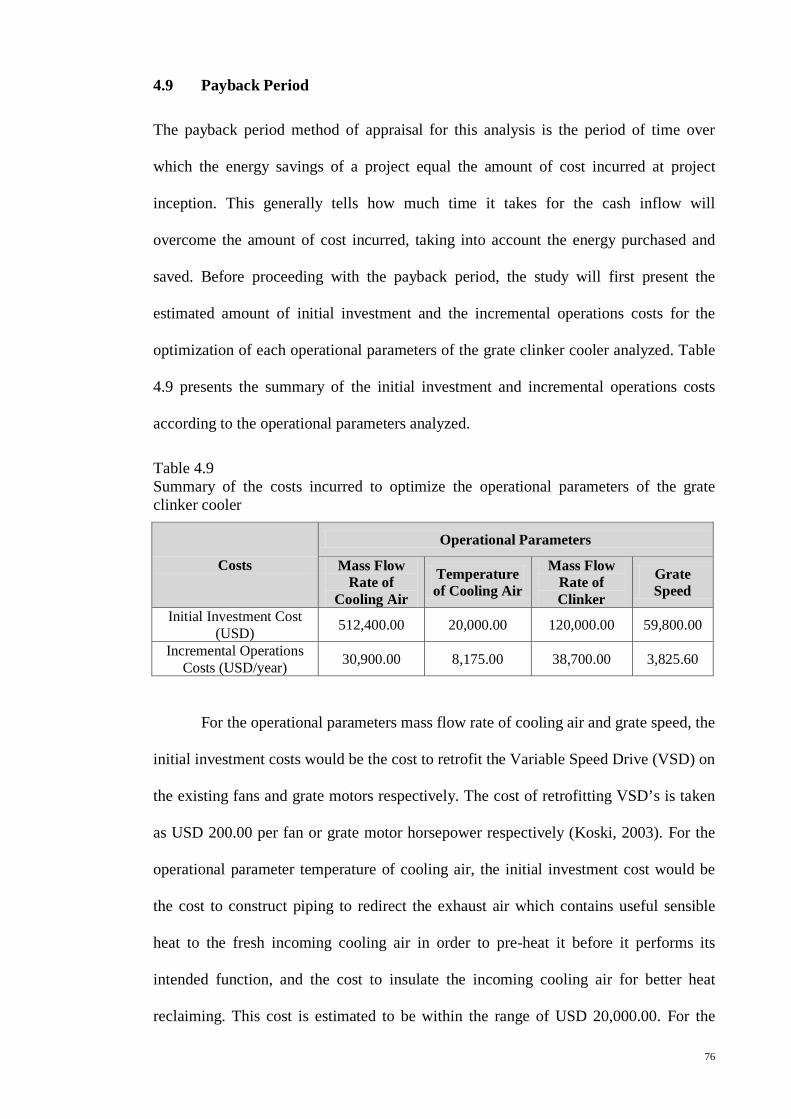
saved. Before proceeding with the payback period, the study will first present the
estimated amount of initial investment and the incremental operations costs for the
optimization of each operational parameters of the grate clinker cooler analyzed. Table
4.9 presents the summary of the initial investment and incremental operations costs
according to the operational parameters analyzed.
Table 4.9 Summary of the costs incurred to optimize the operational parameters of the grate clinker cooler
Costs
Operational Parameters
Mass Flow Rate of
Cooling Air
Temperature of Cooling Air
Mass Flow Rate of Clinker
Grate Speed
Initial Investment Cost (USD) 512,400.00 20,000.00 120,000.00 59,800.00
Incremental Operations Costs (USD/year) 30,900.00 8,175.00 38,700.00 3,825.60
For the operational parameters mass flow rate of cooling air and grate speed, the
initial investment costs would be the cost to retrofit the Variable Speed Drive (VSD) on
the existing fans and grate motors respectively. The cost of retrofitting VSD’s is taken
as USD 200.00 per fan or grate motor horsepower respectively (Koski, 2003). For the
operational parameter temperature of cooling air, the initial investment cost would be
the cost to construct piping to redirect the exhaust air which contains useful sensible
heat to the fresh incoming cooling air in order to pre-heat it before it performs its
intended function, and the cost to insulate the incoming cooling air for better heat
reclaiming. This cost is estimated to be within the range of USD 20,000.00. For the

77
operational parameter mass flow rate of clinker, the initial investment cost would be the
cost to reprogram the feed rate of clinker into the pre-calciner, rotary kiln and the
cooler, as well as equipping VSD’s to the feeder motors.
The optimization of each operational parameter analyzed would result in an
increase in energy input required. The incremental operations cost accounts for such
investments. Figure 4.9 presents the payback period of the investment made for every
5% optimization of the operational parameters of the grate clinker cooler.
Figure 4.9 Payback period of the investment made for every 5% optimization of the operational parameters of the grate clinker cooler
The payback period is a means of determining the relative worth of the
modifications made to the clinker cooling system by calculating the time they will take
to pay back what they cost. From Figure 4.9, it is apparent that the shortest payback
period is for the modification made to optimize the temperature of cooling air, with 1.2
months. This is followed by the modification to optimize the mass flow rate of clinker
with 6.1 months, the modification to optimize the grate speed of the cooler with 17.4
months, and lastly the modification to optimize the mass flow rate of cooling air with
0
10
20
30
40
50
60
Mon
ths
Operational Parameters
Payback Period
Mass Flow Rate of Cooling Air
Temperature of Cooling Air
Mass Flow Rate of Clinker
Grate Speed

78
54.8 months. Unlike the potential energy and cost saving analyses performed earlier,
payback period also takes into account the amount of additional energy that has to be
spent on in order to raise the efficiencies of the clinker cooling system. For example,
the optimization of mass flow rate of cooling air and grate speed would also mean that
additional electrical energy needs to be bought to accommodate the change in the
blower and grate motor power requirement, respectively.
If one makes an investment decision solely on the basis of payback period, the
modification with the shortest payback period should be favoured as opposed to the
ones with longer payback periods. The outcome of insisting that each proposed
investment has a short payback period is that the investors of such modification can
assure themselves of being restored to their initial positions within a short span of time
(Park, 2007). Consequently they can take advantage of the benefits that will come after
these investment costs are recovered.
The simple payback period method of appraisal may sometimes eliminate some
alternatives, thus eliminating such time spent to analyze. However, the serious
drawbacks of this method would be its inability to measure profitability, and its failure
to recognize the differences in the timing of cash flows, i.e. time value of money (Park,
2007). For instance, even though the period it takes to recover the cost incurred in
modifying the clinker cooler to optimize the mass flow rate of cooling air is far
lengthier than the period it takes to cover the cost incurred to optimize the grate speed,
the method does not tell how much the invested money is contributing towards the cost
expense. On top of that, even when two different modifications have the same period of
payback, a front-loaded investment is actually more beneficial because money available
today is worth more than that to be gained later. Payback period method of appraisal
also ignores all proceeds after the payback period, it does not allow for the possible
advantages of an investment with longer life span (Park, 2007).
79
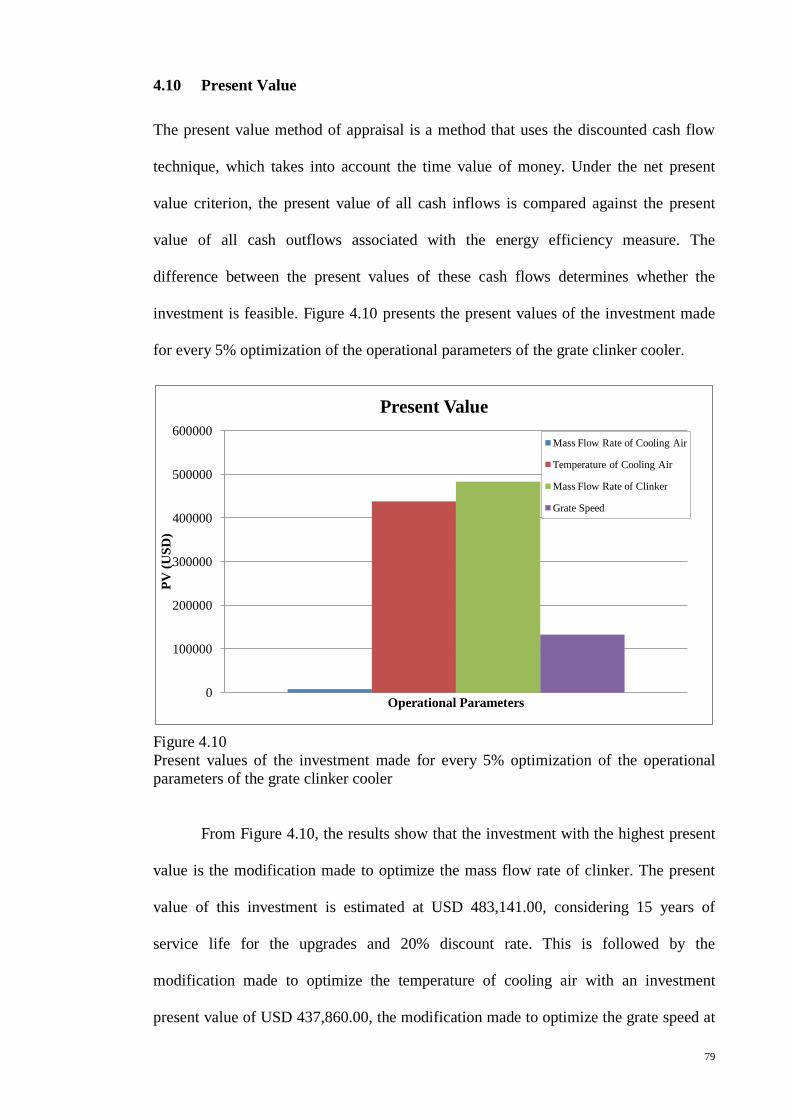
4.10 Present Value
The present value method of appraisal is a method that uses the discounted cash flow
technique, which takes into account the time value of money. Under the net present
value criterion, the present value of all cash inflows is compared against the present
value of all cash outflows associated with the energy efficiency measure. The
difference between the present values of these cash flows determines whether the
investment is feasible. Figure 4.10 presents the present values of the investment made
for every 5% optimization of the operational parameters of the grate clinker cooler.
Figure 4.10 Present values of the investment made for every 5% optimization of the operational parameters of the grate clinker cooler
From Figure 4.10, the results show that the investment with the highest present
value is the modification made to optimize the mass flow rate of clinker. The present
value of this investment is estimated at USD 483,141.00, considering 15 years of
service life for the upgrades and 20% discount rate. This is followed by the
modification made to optimize the temperature of cooling air with an investment
present value of USD 437,860.00, the modification made to optimize the grate speed at
0
100000
200000
300000
400000
500000
600000
PV (U
SD)
Operational Parameters
Present Value
Mass Flow Rate of Cooling Air
Temperature of Cooling Air
Mass Flow Rate of Clinker
Grate Speed

80
a value of USD 132,775.00, and lastly the modification made to optimize the mass flow
rate of cooling air at a value of USD 7,742.00.
Since all the energy efficiency investments show a positive present values, they
are all practically feasible options. However, the most feasible option that should be
considered from this analysis is the investment to optimize the mass flow rate of
clinker. Unlike the conventional payback period, the present value method of appraisal
takes into account the time value of money. It can be clearly seen that each investment
has different annual cash flows from the other. Since we are considering a simple
constant annual cash flow for each energy efficiency measure, the investment with the
lower initial cost and the bigger annual cash flow will have better present value.
When dealing with large amounts of money, long periods of time, or high
interest rates, the change in the value of a sum of money over time becomes extremely
significant. The operation of interest and the time value of money must be taken into
consideration in order to make valid comparisons of different amounts of cash flows at
various times when deciding between the presented energy efficiency investments.
4.11 Capital Recovery Factor
Capital recovery factor indicates the correlation between the real discount rate and the
lifespan of the energy efficient clinker cooling system. It comes in the form of a ratio,
i.e. ratio of a constant annuity to the present value of receiving that annuity for a given
length of time.

81
Taking the life span of the upgrades as 15 years, the capital recovery factor for
the grate clinker cooler for this study is as follows:
CRF =20%
(1 − (1 + 20%)−15)
= 0.2139
The real discount rate is taken as 20% for this study to reflect the barriers to
energy-efficiency investment in the cement industry. According to Worrell et al.
(2008), these barriers include perceived risk, management concerns about production
and other issues, lack of information, opportunity cost, capital constraints and
preference for short payback periods and high internal rates of return.
A real discount rate of 20% is comparatively high for the financial calculation
of the energy efficiency studies in the cement industry, when compared to other
industrial sector analyses. This high discount rate is used for calculating cost of
conserved energy while accounting for the aforementioned barriers to energy-efficiency
improvement. This would avoid overestimation of cost-effective energy-saving
potential (Price et al., 2007).
The choice of the real discount rate is also dependent upon the purpose of the
analysis and the approach used, i.e. prescriptive versus descriptive. A prescriptive
approach uses lower discount rates, typically 4% to 8%, especially for long-term
studies like climate change or public sector analyses. Using low discount rates, one will
have the advantage of treating future generations equally to current generations, but the
comparatively low rates may also cause relatively certain, near-term effects to be
ignored in favour of more uncertain, long-term effects (Price et al., 2007). A descriptive
approach on the other hand, uses comparatively higher discount rates, typically from
10% to 30% to reflect the existence of barriers to energy efficiency investments
(Worrell et al., 2008).

82
4.12 Cost of Conserved Energy
The cost effectiveness and the technical potential for the investments made towards
energy efficiency measures are typically evaluated through the cost of energy
conserved. In the cost of energy conserved, an energy price line, i.e. fuel energy price
line is determined to reflect the current cost of energy. All measures that fall below the
energy price line are can be considered cost effective. Figure 4.12 presents the cost of
conserved energy for each of the operational parameters of the grate clinker cooler
analyzed for optimization.
Figure 4.12 Cost of conserved energy for every 5% optimization of the operational parameters of the grate clinker cooler
Figure 4.12 shows that the modification made to optimize the temperature of
cooling air has the lowest cost of conserved energy with USD 0.04/GJ energy saved.
This is followed by the modification made to optimize the grate speed with USD
0.37/GJ energy saved, the modification made to optimize the mass flow rate of clinker
with USD 0.41/GJ energy saved and lastly the modification made to optimize the mass
0.00
0.20
0.40
0.60
0.80
1.00
1.20
Cos
t of C
onse
rved
Ene
rgy
(USD
/GJ
ener
gy)
Operational Parameters
Cost of Conserved Energy
Mass Flow Rate of Cooling Air
Temperature of Cooling Air
Mass Flow Rate of Clinker
Grate Speed

83
flow rate of cooling air with USD 0.99/GJ energy saved. It is apparent that all four
energy-efficiency measures fall under the average unit price of coal, i.e. USD 4.644/GJ.
This is to say that the cost of conserved energy is less than the average unit price of
coal, i.e. the cost of investing in these for energy-efficiency measures to save one GJ of
energy is less than purchasing one GJ of coal at the given price.
The cost of energy conserved takes into account the initial investment incurred
for each modification made to optimize the operational parameters of the clinker
cooler. These investments however are weighed by the capital recovery factor
calculated earlier, to reflect the barriers to energy-efficiency investments in the cement
industry. From Equation 3.21, it can be noted that the annual increase in operations and
maintenance costs are also taken into consideration. For this analysis, the annual
increment in maintenance costs is neglected. However, to increase the efficiencies of
the operational parameters of the grate clinker cooler, the significant increment in
annual operations costs have to be considered. For example, to optimize the mass flow
rate of cooling air and grate speed, the rise in electrical energy consumption for the fan
and grate motors will highly affect the cost of energy conserved.
It should be highlighted that the cost of conserved energy is a good screening
tool to present energy-efficiency measures and capture the potentials for improvement.
In reality however, the energy-saving potential and cost of each energy-efficiency
measure and technology may vary. They are highly dependent on various conditions
such as raw materials, the technology provider, the production capacity, the size of the
kiln, the fineness of the final product and byproducts, and the time of the analysis
(Price et al., 2007).

84
4.13 Summary of the Cost Benefit Analyses
Table 4.13 Summary of cost benefit analyses
Operational Parameters
Adjusted Cost Saving (USD/month)
Payback Period
(months)
Present Value (USD)
Cost of Conserved Energy (USD)
Mass Flow Rate of Cooling Air 9,350.00 54.8 7742 0.99
Temperature of Cooling Air 8,175.00 2.4 437860 0.04
Mass Flow Rate of Clinker 10,825.00 11.1 483141 0.41
Grate Speed 3,431.00 17.4 132775 0.37
Table 4.13 presents the summary of the cost benefit analyses performed. It can
be clearly seen that in terms of adjusted cost saving and present value of investment,
the modification made to optimize the clinker mass flow rate ranks the highest among
the energy efficiency measures considered. Although the optimization of cooling air
temperature seems like the more feasible option considering the low initial cost,
payback period, and the cost of energy conserved, the adjusted cost saving does not
take into account the thermal energy that is sacrificed for other functions, i.e. to be
returned to dry the raw materials. In a pure sense of energy efficiency improvement,
optimizing the cooling air temperature plays a big role, but it does not tell how much of
actual cost can be saved. It is also wise to note that transferring heat to the cooling air
via piping does involve losses in reality. Optimization of the mass flow rate of clinker
however, evidently increases the efficiencies of the system as well as results in cost
saving. Even though the initial investment cost to be incurred in manipulating such
parameter are of a significant amount, the adjusted cost saving signifies a good cash
inflow, making the energy efficient measure a promising investment.

85
Putting aside the optimization of cooling air temperature, the modification made
to optimize the grate speed is a fairly feasible alternative. Compared to the optimization
of mass flow rate of clinker, this energy efficiency measure does not require as much
initial investment cost. Even though the annual cost saving is smaller compared to the
former, this measure has a higher investment present value for its intended 15 years of
service period, thus making it a highly recommended option. The investment cost of the
latter is not as significant as the former, due to the number of motors that need to be
equipped with VSD’s in order to vary the motor speed and the load as intended. It is to
be noted that VSD retrofitting cost is highly dependent on motor size. Considering a 15
year service life for both options, the energy efficiency measure to optimize the grate
speed presents a better opportunity since it has a higher investment present value and
lower cost of energy conserved.
The cost of energy conserved is a useful measure of how much cost can be
saved via these energy efficiency measures. However, considering the volatile price of
energy in the present and the coming future, one cannot be fully dependent on such
estimations. It can be said though, that the optimization of grate speed is as competent
as the optimization of mass flow rate of clinker, as an alternative.

86
4.14 Emission Reduction
The cumulative amount of emission reduction of NOx, CO and PM, as well as the
greenhouse gas CO2, can be estimated directly from the amount of energy saving
resulting from the optimization of the operational parameters of the clinker cooler.
Table 4.14 presents the amount of emission reduction for every 5% optimization of the
operational parameters analyzed.
Table 4.14 Average emission reduction for every 5% optimization of the grate clinker cooling system’s operational parameters
Operating Parameters Energy Recovery (kJ/tonne clinker)
Average Emission Reduction (kg/tonne clinker)
NOx CO PM (Dust) CO2 Mass Flow Rate of Cooling Air 34013 0.030 0.024 0.002 3.477
Cooling Air Temperature 23427 0.021 0.016 0.001 2.395
Mass Flow Rate of Clinker 41992 0.037 0.029 0.002 4.293
Grate Speed 19607 0.017 0.014 0.001 2.004
(Integrated Pollution Prevention and Control (IPPC), 2001)
The clinker burning phase is the most significant phase in terms of cement
manufacturing environmental issues, as it contributes to the major part of energy use
and emissions to the environment. The key environmental emissions are nitrogen
oxides (NOx) and dust. For this study, the average emission of oxides of Nitrogen
(NOx) is taken as 3.2 kg/tonne clinker, carbon monoxide (CO) as 2.5 kg/tonne clinker,
particulate matter (PM) or dust as 0.21 kg/tonne clinker and carbon dioxide (CO2) as
368 kg/tonne clinker (Integrated Pollution Prevention and Control (IPPC), 2001). The
average fuel energy consumed by the kiln and the pre-calciner is taken as
3600MJ/tonne clinker. Figure 4.14 presents the average emission reduction for every
5% optimization of the grate clinker cooler’s operational parameters.
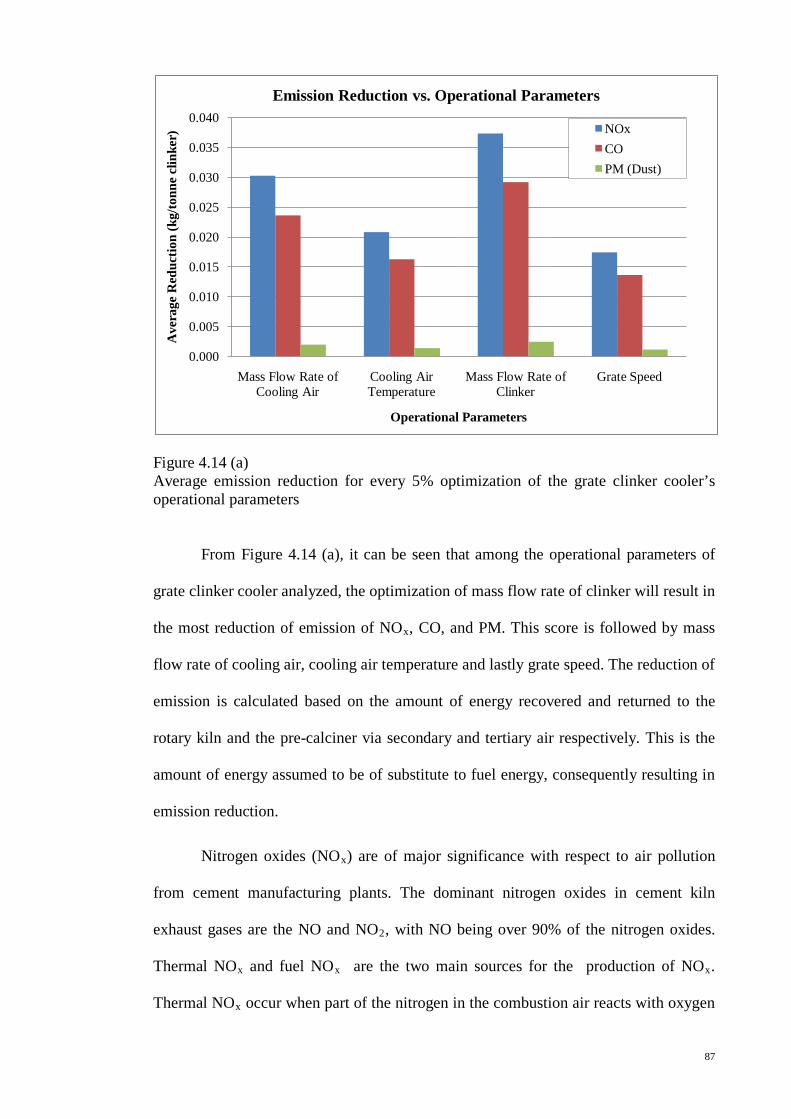
87
Figure 4.14 (a) Average emission reduction for every 5% optimization of the grate clinker cooler’s operational parameters
From Figure 4.14 (a), it can be seen that among the operational parameters of
grate clinker cooler analyzed, the optimization of mass flow rate of clinker will result in
the most reduction of emission of NOx, CO, and PM. This score is followed by mass
flow rate of cooling air, cooling air temperature and lastly grate speed. The reduction of
emission is calculated based on the amount of energy recovered and returned to the
rotary kiln and the pre-calciner via secondary and tertiary air respectively. This is the
amount of energy assumed to be of substitute to fuel energy, consequently resulting in
emission reduction.
Nitrogen oxides (NOx) are of major significance with respect to air pollution
from cement manufacturing plants. The dominant nitrogen oxides in cement kiln
exhaust gases are the NO and NO2, with NO being over 90% of the nitrogen oxides.
Thermal NOx and fuel NOx are the two main sources for the production of NOx.
Thermal NOx occur when part of the nitrogen in the combustion air reacts with oxygen
0.000
0.005
0.010
0.015
0.020
0.025
0.030
0.035
0.040
Mass Flow Rate of Cooling Air
Cooling Air Temperature
Mass Flow Rate of Clinker
Grate Speed
Ave
rage
Red
uctio
n (k
g/to
nne
clin
ker)
Operational Parameters
Emission Reduction vs. Operational Parameters
NOxCOPM (Dust)

88
to form various oxides of nitrogen, while fuel NOx occur when nitrogen containing
compounds chemically bound in the fuel react with oxygen in the air to form various
oxides of nitrogen (Integrated Pollution Prevention and Control (IPPC), 2001).
The major contributor to the emission of CO is the content of organic matter in
the raw materials. CO emission is also a result from poor combustion from sub-optimal
control of the solid fuel feed. Sub-stoichiometric combustion may lead to short term
peaks of greater than 0.5% CO. Dust emission from kiln stacks has been the main
environmental concern in the cement production industry. Dusts are byproducts of the
processes that take place in kilns, raw mills, clinker coolers and cement mills. Large
volumes of gases are flowing through dusty materials in all these processes (Integrated
Pollution Prevention and Control (IPPC), 2001).
Figure 4.14 (b) Average CO2 emission reduction for every 5% optimization of the grate clinker cooler’s operational parameters
0
1
2
3
4
5
Mass Flow Rate of Cooling Air
Cooling Air Temperature
Mass Flow Rate of Clinker
Grate Speed
Ave
rage
Red
uctio
n (k
g/to
nne
clin
ker)
Operational Parameters
CO2 Reduction vs. Operational Parameters

89
Similar to the trend in Figure 4.14 (a), Figure 4.14 (b) shows that the
optimization of mass flow rate of clinker will result in the most reduction of emission
of CO2. This is followed by the mass flow rate of cooling air, the cooling air
temperature and lastly the grate speed. The emissions of CO2 resulting from the
combustion of the carbon content of the fuel is directly proportional to the ratio of
carbon content to the calorific value of the fuel, as well as the specific heat demand
(Integrated Pollution Prevention and Control (IPPC), 2001).