chapter-iv demand and supply position of medicinal plants...
TRANSCRIPT
119
Chapter-IV
DEMAND AND SUPPLY POSITION OF MEDICINAL PLANTS
Introduction
There are 7843 licensed pharmacies of Indian System of Medicine in addition to
857 of Homeopathy and a number of unlicensed small scale processing units engaged
in the manufacture of the medicines to meet the requirement of 4.6 lakh 'registered
practitioners of ISM & H and other users in the country. These pharmacies range from
large Indian drug houses like Baidyanath, Dabur, Zandu, Himalaya Drugs etc.,
employing modern/sophisticated equipments and methods for production of drugs on
mass scale to small ones which manufacture drugs generally following the traditional
prescriptions of ancient medical texts in the form of Nighantus (Lexicons) and texts on
Bhaisaj Kalpana (Pharmacy) that specifically deal with plants and plant products. Many
pharmacies attached to Ayurvedic institutes and hospitals and Vaidyas of villages
produce drugs for their own consumption.
The largest numbers of these pharmacies are located in the states of Uttar
Pradesh, Kerala, Maharashtra and Gujarat and the lowest numbers in the States of
North East (N.E.) region. Apart from pharmacies of Indian System of Medicinal &
Homeopathy (ISM&H) there are herbal industries like Alchem International, Delhi;
Hitashi Chemicals, Calcutta; Kanga Aromatics, Madurai; Herbochem, Hyderabad;
Chemiloids, Vijayawada; Natural Remedies, Bangalore, etc., which specialise in
production and marketing of plant extracts for the use in the products of allopathy and
Homeopathy. Although about 8000 species of plants1 are estimated to be used in
human and animal health care and over 10,000 herbal drug formulations have been
1 FRLHT Research Manuscript on medicinal plants used in Ayurveda

120
recorded in codified medical texts of ayurveda, the pharmaceutical industries are
largely based on about 400 plant species.2 Though accurate and updated data on the
requirement of total quantity and quality of crude drug is not available, conservative
estimates put the economic value of medicinal plant related trade in India to the order
of Rs.1000 crore/year3 and the world trade over U.S. $ 60 billion4. Unfortunately, data
regarding the participation of both licensed and unlicensed firms in the medicinal plants
raw material trade, and the extent of their demand for the raw materials are not readily
available. The structural break-up of licensed pharmacies in terms of large and small
companies is unknown, making it difficult to assess the level of concentration in the
market. Extensive and systematic surveys are required to generate data and information
on this crucial aspect for useful resource planning. However, the task force has made an
attempt to assess the demand and supply position with the help of simple questionnaire
(Annexure-IV) sent to about 25 pharmacies (Annexure-V) but only about half of them
have responded and that too partially.
Demand
Requirement of individual pharmacies varies depending upon the total number
and quantity of high and low value medicinal herbs used by them. For example, Gufic,
Mumbai, engaged in production of herbal formulations and extracts requires annually
49.5 tons of raw material derived from 49 species worth Rs.18,70,000/-, while an
ayurvedic pharmacy Shree Dhootapapeshwar Ltd., Mumbai, requires 204 tons of raw
material of 30 species worth Rs.32,46,960/-. M/s. Sandu Brothers Ltd., need 1760 tons
of 156 species worth Rs.1, 26, 0000.
2 FRLHT Research manuscript on medicinal pants used in Ayurveda 3 ADMA Mumbai, 1996 4 Medicinal Plants by John Lambert, World Bank Report, 1996

121
In a survey conducted in 1991 by Vaidya Khadiwale of Pune for 120 species, a
total demand of 509.4 tons of raw drugs was estimated for pharmacies located in
Maharashtra (Annexure VI). With a modest annual growth rate of 18% suggested for
the industry the figure for 1999 works out to 7335.36 tons for the state. However,
Natural Remedies Pvt. Ltd., Bangalore, engaged in the sale of veterinary formulations
and herbal extracts puts its annual demand of raw material to 6771 tons (Annexure
VII). Arya Vaidya Sala, Kottakal, the most popular one of the 1000 odd pharmacies of
Kerala has an annual demand of 3000 tons of raw material comprising of 700 species of
medicinal plants worth Rs.30 crores (approx.). Medicinal Plants Business Farm Project,
a feasibility done by AFC in 1995, has estimated the annual equirement of raw herbal
drugs for ayurvedic pharmacies to 92,994 tons for the Kerala State (Annexure - VIII)
which is expected to double by 2000 A.D. An assessment made by the traders of
Guwahati suggests that the annual turnover of pharmaceutical concerns in Assam,
where only 18 licensed companies are known to be in operation, could be in the range
of Rs.350 to 450 crores requiring supplies of more than 700 tons of high value
medicinal plants in the region every year. The total crude drug demand of Government
run pharmacies of some states in 1998-99 varied from 60 tons for Madhya Pradesh to
2300 tons for Kerala. The demand averages to 386 tons per state worth Rs.1.48 crores
(Annexure IX).
In state wise assessment of demand for 10 major states it works out to 33000
tons per State per year totalling to approximately 3.5 lakh tons for the country as a
whole. However, individual pharmacy requirement works out to 1292 tons (approx.)
annually. Assuming that there are 100 major pharmacies, the country's demand for
crude drugs on this basis comes to 1.29 lakh tons per year. Combining the averages of
the two sources, the demand estimate is worked out to 2.4 lakh tons of crude drugs per

122
annum. With doubling of the rate of demand every five years the figure is expected to
cross 10 lakh tons by 2010 A.D. The information received through Chemical and Allied
Products Export Promotion Council (CHEMIXCIL) (Annexure X) indicates the total
annual demand of major raw herbal material of 55 species to be 31,680 tons. ADMA
puts the figure to 29,413 tons of 110 species (Annexure XI). Large variation in the
figures received makes the estimation of demand and availability of medicinal plants at
the national level a difficult task which re-affirms the need for a systematic survey in
this regard.
The estimated annual demand of some of the important herbal crude drugs used
in preparation of Indian system of medicines is - Guduchi (Tinospora cordifolia)
(10,000 T), Rasna (Pulchea racemosa) (3000 T), Amla (Emblica officinalis) (2750 T),
Aswagandha (Withania somnifera) (2500 T), Shatawari (Asparagus racemosus) (2500
T), Mandukparni (Centella asiatica) (1500 T), and Gugul (Commiphora wightii),
Sonamukhi (Cassia ungustifolia), Harda (Terminalia chebula), Kalmegh (Andrographis
paniculata) and Kumari (Aloe vera) 1000 tons each. The comparative annual demand of
major crude drugs used by some Indian pharmacies is given in Annexure XII, which
shows considerable variation in species and their quantity used by each pharmacy.
Progressive increase in demand of raw material can be inferred from the fact
that Dabur India Ltd., one of the largest ayurvedic companies has recorded annual
growth rates of 25% in their sales since 1990 and a doubling of their turnover, every
three years5. A study of the ayurvedic products in both the organised and unorganised
marketing channels from 1987-1990 has revealed an increase of nearly 30% in the
trade6. Average Fixed Costs (AFC's) study of 1995 estimates the Kerala State's demand
to double by 2000 A.D.7 trade secret) though 90% of them ultimately come from

123
natural sources of various parts of the country collected by unskilled forest dwelling
communities and purchased by the contractors at a nominal price. This supply chain
often extends to 3 - 4 tiers without much value addition but with increase in sale price
at each level. There is, on an average, 70 to 100% increase in sale price of crude drugs
from primary collector’s level to pharmacy level. Many times the same crude drug is
available in various grades with major traders having considerable difference in price.
For instance various grades of "safed musli" are available at varying prices of Rs.800/-
to 1200/-per kg. The gradation is generally dependent on physical features of the crude
drug as well as the geographical source of origin. Current market prices of certain
expensive crude drugs are given as follows:
Table: - 4.1. Medicinal Plants Having Consumption of more than 10 Tonnes per
Year in India
S. No
Botanical Name Family Habit Part Used
1 Acacia catechu Mimosaceae Tree Stem Extract
2 Achyranthes aspera Amaranthaceae Herb Whole Plant
3 Adhatoda beddomei Acanthaceae Herb Whole Plant
4 Adhatoda zeylanica Acanthaceae Shrub Leaves
5 Aegle marmelos Rutaceae Tree Roots, Fruit Pulp
6 Aerva lanata Amaranthaceae Herb Whole Plant
7 Alpinia galangal Zingiberaceae Herb Rhizomes
8 Alpinia malaccensis Zingiberaceae Herb Rhizomes
9 Andrographis paniculata Acanthaceae Herb Whole Plant
10 Aphanamixis polystachya Meliaceae Tree Bark
11 Aristolochia indica Aristolochiaceae Climber(H) Roots
12 Aristolochia tagala Aristolochiaceae Climber(H) Roots
13 Asparagus racemosus Liliaceae Herb Roots
14 Bacopa monnieri Scrophularaceae Herb Whole plant

124
S. No
Botanical Name Family Habit Part Used
15 Boerhaavia diffusa Nyctaginaceae Herb Whole plant
16 Bombax ceiba Bombacaceae Tree Bark, Gum Exudate
17 Borassus flabellifera Arecaceae Tree Fruit
18 Butea monosperma Fabaceae Tree Bark, Fl & Seeds
19 Caesalpinia bonduc Fabaceae Shrub Roots, Seeds
20 Calycopteris gigantean Asclepiadaceae Herb Roots, Lvs, Fl
21 Calycopteris floribunda Combretaceae Shrub Fruits, Lvs
22 Cassia tora Fabaceae Herb Roots Seets
23 Cayratia pedata Vitaceae Climber(H) Whole Plant
24 Celastrus paniculatus Celastraceae Liana Seeds
25 Centella asiatica Apiaceae Herb Whole Plant
26 Citrullus colocynthis Cucurbitaceae Herb Roots, Fruits
27 Costus speciosus Costaceae Herb Roots
28 Cynodon dactylon Poaceae Grass Whole Plant
29 Cyperus esculentus Cyperaceae Herb Roots
30 Cyperus rotundus Cyperaceae Herb Rhizomes
31 Desmodium gangeticum Fabaceae Shrub Roots
32 Dioscorea bulbifera Dioscoreaceae Climber(H) Tubers
33 Dolichos biflorus Fabaceae Herb Seed
34 Eclipta alba Asteraceae Herb Whole Plant
35 Embelia ribes Myrsinaceae Liana Fruits, Seed, Root
36 Fumaria indica Fumariaceae Herb Whole Plant
37 Garcinia gummigutta Cluciaceae Tree Resin
38 Garcinia india Cluciaceae Tree Fruit/Seeds
39 Garcinia morella Cluciaceae Tree Seeds
40 Gardenia gummifera Rubiaceae Tree Resin(Fl)
41 Gmelina arborea Verbenaceae Tree Roots
42 Helicteres isora Sterculiaceae Shrub Fruits
43 Hemidesmus indicus Asclepiadaceae Climber(H) Roots

125
S. No
Botanical Name Family Habit Part Used
44 Holarthena antidysentrica Apocynaceae Shrub Bark, Seed
45 Ichnocarpus frutescens Apocynaceae Liana Stems
46 Ipomoea maruritiana Convolvulaceae Climber(H) Whole Plant
47 Ipomoea nil Convolvulaceae Herb Seeds
48 Lepidium sativum Brassicaceae Herb Seeds
49 Laptadenia reticulate Asclepiadaceae Shurb Stems
50 Luffa echinata Cucurbitaceae Climber(H) Seeds
51 Mallotus phillipensis Euphorbiaceae Tree Fruits
52 Mucuna pruriens Fabaceae Climber(H) Seeds, Roots
53 Nigella sativa Nigellaceae Herb Seeds
54 Oroxylum indicum Bignoniaceae Tree Roots
55 Pedalium murex Pedaliaceae Herb Whole Plant, Fruits
56 Peganum harmala Zygophyllaceae Herb Seeds
57 Phyllanthus amarus Euphorbiaceae Herb Whole Plant
58 Phyllanthus emblica Euphorbiaceae Tree Fruits
59 Piper longum Piperaceae Shrub Fruits, Roots
60 Plumbago indica Plumbaginaceae Shrub Roots
61 Plumbago zeylanica Plumbaginaceae Herb Roots
62 Polygonum glabrum Polygonaceae Herb Roots, Leaves
63 Premna serratifolia Verbenaceae Tree Roots
64 Pseudarthria viscida Fabaceae Climber(H) Roots
65 Psoralea corylifolia Fabaceae Herb Seeds
66 Puereria tuberose Fabaceae Climber(H) Tubers
67 Punica granatum Punicaceae Shrub Fruit Peels/Rind
68 Ricinus communis Euphobiaceae Shrub Whole Plant
69 Rubia cordifolia Rubiaceae Climber(H) Stems
70 Sida cordifolia Malvaceae Herb Stems, Roots
71 Sida rhombifolia Malvaceae Herb Roots
72 Solanum melongena Solanaceae Shrub Roots, Lvs, Fr

126
S. No
Botanical Name Family Habit Part Used
73 Solanum nigrum Solanaceae Herb Whole Plant
74 Solanum torvum Solanaceae Herb Whole Plant
75 Solanum xanthocarpum Solanaceae Herb Whole Plant
76 Stereospermum suaveolens
Bignoniaceae Tree Roots
77 Symplocos racemosa Symplocaceae Tree Bark
78 Terminalia arjuna Combretaceae Tree Bark, Lvs
79 Terminalia bellerica Combretaceae Tree Fruits, Rind
80 Terminalia chebula Combretaceae Tree Fruits
81 Thespesia populnea Malvaceae Tree Bark
82 Tinospora cordifolia Menispermaceae Climber(H) Stems, Seeds
83 Tragia involucrate Euphorbiaceae Climber(H) Roots
84 Tribulus terrestris Ygophyllaceae Herb Roots, Fruit
85 Vernonia anthelmintica Asteraceae Shrub Fruits/Seeds
86 Withania somnifera Solanaceae Shrub Roots
87 Woodfordia fruticosa Lythraceae Shrub Flowers
Source: M.G. Chandrakanth, A. Ravishankar, M.S. Suneetha and R. Rangesh Parmesh Medicinal and Aromatic Plants Revisted: An Institutional Analysis of The Common Property resources regime (Draft Chapter for a Book on CPR). Orginal from the data base of the Foundation for Revitalization of Local Health Traditions
Medicinal and aromatic plants constitute a major segment of the flora, which
provides raw materials for use in the pharmaceutical, cosmetics, and drug industries.
The indigenous system of medicines, developed in India for centuries, make use of
many medical herbs. These systems include Ayurveda, Siddha, Unani, and many other
indigenous practices. More than 9,000 native plants have established and recorded
curative properties and about 1500 species are known for their aroma and flavour. In
one of the studies by the World Health Organisation, it is estimated that 80 percent of
the population of developing countries relies on traditional plant based medicines for

127
their health requirements (WHO, 1991). Even in many of the modern medicines, the
basic composition is derived from medicinal plants and these have become acceptable
medicines for many reasons that include easy availability, least side effects, low prices,
environmental countries, having 40 percent of the global biodiversity and availability of
rare species. These are well know as the home of medicinal and aromatic crops that
constitute a segment of the flora, and provide raw materials to the pharmaceutical,
cosmetic, fragrance, flavour etc. industries.
The Ministry of Environment and Forest, Government of India has identified
and documented over 9,500 species of medicinal plants that are significant for the
pharmaceutical industry. Of these, 2000 to 2300 species are used in traditional
medicines while at least 150 species are used commercially on a large scale (EXIM
Bank, 1997). The fact that derivatives of medicinal and aromatic plants are non-
narcotic have no ill effects and constitute the natural base for treatments has resulted in
an increase in demand for these plants in developing and non-developed countries. Due
to this rising international demand, many important medicinal plant species are
becoming scarce and some are facing the prospect of extinction. Therefore, it is
important to conserve the extensively traded medicinal plants in its natural environment
or cultivate it in favorable environments. As compared to the traditional crops, the
cultivation of medicinal crops has many advantages. These include:
• Medicinal crops provide better returns than traditional crops
• Have very high domestic and export demand
• Fetch better prices in the market
• Could be stored for a long time, and sold at a time when better prices
prevail in the market
128
• Are the largely drought tolerant, and not easily grazed by animals
• Have low incidence of pest attacks and diseases
• Require minimum resources, therefore the cost of cultivation is lower
compared to the traditional crops
• Could be raised as inter-crops along with traditional crops, and also on
degraded lands
Given these advantages the cultivation of medicinal crops has been picking up in
some regions. However, the spread is not so large to meet the demand of the industry.
Owing to short supply, prices of some medicinal crops have increased substantially in
the recent past. What is also of great concern is that exploitation of some of the species
has threatened their extinction.
Importance of the Medicinal Crops
The Indian farmer is presently in a very difficult situation and the majority is
looking at options other than farming National Sample Survey Organisation (NSSO,
59th round). The farmer is constrained by the shrinking net income flow due to the
increasing cost of cultivation and uncertaininty in prices. Largely, farmers have not
diversified from traditional crops. Production costs of traditional corps are now
becoming costly and the market system is poor. These factors have forced the farmers
to shift towards other crops that have the potential for better returns compared to the
traditional crops. In this backdrop, the cultivation of medicinal crops is less risky in
terms of the incidence of pest attacks, diseases and price fluctuations, and has potential
returns. And this significance is further strengthened by the fact that these crops can be
grown in degraded and marginal soils, or raised as inter crops in plantation corps like
are coconut etc. with less difficulty. The trade demand for these crops is also increasing
129
with the increased interest in western consumers towards eastern medicinal systems.
The estimated area under the medicinal crops in India is in the neighborhood of two
lakh hectares. Nearly 75 percent of the plant material used in indigenous medicines is
collected from forests and wild habitats (GoI, 2000). People hardly have any
knowledge about the plants collect the material and pay little attention to selective
harvest or harvesting of natural plants.
India has been considered a treasure house of valuable medicinal and aromatic
plat species. The Indian system of Medicine uses over 1,100 medicinal plants and most
of them are collected from forests regularly, and over 60 species among them are
particularly in demands (GoI, 2000). On account of the fact that derivatives of
medicinal and aromatic plants have no side effects and deal curatively, the demand for
these plants is on the increase in both developing and developed countries. As a result,
the trade of medicinal plants is increasing fast.
From the trade data available, it is clear that the global market for medicinal
plants has always been large and has been on increase in the recent past. In the report
commissioned by the World Wide Fund for Nature, it is pointed out that, the total
import in 1980 of “vegetable materials used in pharmacy” by the European Economic
Community was 80,738 tons (Lewington 1993). India was the largest supplier with
10.05 tons of plants and 14 tons of vegetable alkaloid and their derivatives. India,
Brazil and China are the largest exporters of medicinal plants. Trade of medicinal
plants from India is estimated to be worth Rs.550 crore. Cosmetics and aromatherapy
products are two important areas where Indian medicinal plants and their extracts like
essential oils can contribute globally. Medicinal and aromatic plants have a high market
130
potential with the world demand for herbal products growing of the rate of seven per
cent per annum.
There is now wide recognition of the contributions that medicinal and aromatic
plants make to the global economy and human welfare (WHO, 1978). But one of the
greatest difficulties in assessing their importance as resources, either locally or
globally, is the shortage of dependable information about the species being used, their
availability and distribution how these are collected or harvested, where the species are
cultivated, the quantities involved and trade statistics. Confidentially still surrounds the
industry as well as the State run systems. Much of thee evidence is anecdotal, although
there has been a concentrated effort in recent years to gather information of these
various aspects. National and regional assessments have been published for several
countries; also various global reports have been prepared such as Husain (1996) on
international trade, marketing and consumption of essential oils, and McAlpine et al.
(1997) on future world trends in supply, utilization and marketing.
In the world trade market the demand for medicinal plants has been increasing
in recent years. One of the interesting features of this trade is that the direction of trade
is from developing countries to the developed countries. That has a positive income
transfer effect. China and India are the two leading countries in the trade sector.
During the past decade, total trade has increased from US $ 52.8 million to US $ 68.7
million, recording a growth rate of 3.56 percent per annum. In spite of that, one cannot
confidentially say that we have reached even the fragment of the potential of trade in
medicinal plants. It is still far below the actual potential of the countries participating
in it. However, there are good prospects for export growth from LDCs for medicinal

131
crops. As estimated by FAO, the trade in herbal medicine alone is estimated to have
exceeded US $ 68.7 during 2002 (FAO, 1996)
Table:- 4.2. Annual Demand for Prioritized Medicinal Plants – India
Crops Demand (Tonnes) Annual Growth
Rate (%) 2001-02 2004-05
Amla 22730 41783 22.5
Andrographis 2005 2197 3.1
Ashwagandha 7029 9128 9.1
Asoka Tree 7051 10724 15
Atis 270 448 18.4
Bacopa 3823 6622 20.1
Bael Tree 5381 7085 9.6
Black Nightshade 2078 2192 1.8
Chitra 965 1285 10
Chlorophytum 38 61 17.2
Costus 1414 1826 8.9
Flamelily 65 101 15.4
Guggul 1505 2549 19.2
Holy basil 3297 5403 17.9
Indian aconite 322 3427 30
Indian barberry 1187 1829 15.5
Indian tinospora 2258 2933 9.1
Jatmansi 675 867 8.7
Liquorice root 873 1360 15.9
Long pepper 3993 6280 16.3
Phylanthus amarus 2213 2985 10.5
Picrorhiza 220 317 12.9
Rauwolfia 424 589 11.6
Sandalwood 635 1073 19.1
Sen N/A 6463 11677 21.8
Shatavari 10925 16659 15.1
Source: Trade in Medicinal Plants, Raw Materials, Tropical and Horticultural Products Service, commodities and Trade Division Economic and Social Department, Food and Agriculture Organisation of the United Nationals, Rome.

132
World Trade in Medicinal Pants
In 1991 world trade was to the tune of US $ 1135 million and in 2002 it was US
$ 1034 million, with annual growth rates averaging between 5 and 15 percent,
depending on the region. The market associated with this sector is expected to have
recorded an evern higher annual average growth rate, i.e., 25 percent between 1990 and
1997. The use of herb-based medicines in developed countries in Europe and the
United States is highly regulated. It is well known that these counties put stringent
restrictions on the quality of products imported by them. That poses a major constraint
for developing countries and LDCs to enter these markets, especially for those whose
products have not undergone stringent tests (Cunningham, 1998). Increasing global
interest in medicinal plants has created a sustainable demand but, at the same time,
hidden trades in plant materials results in indiscriminate harvest of wild varieties and
pose a serious threat to biodiversity.

133
Tab
le:
- 4.3
. W
orl
d E
xp
ort
Valu
e of
Med
icin
al
Pla
nts
(in
Mil
lion
US
$)
Cou
ntr
ies
19
91
1992
1993
1994
1995
1996
1997
1998
19
99
2000
2001
2002
Worl
d
1135.8
1297.4
1176.4
1395.5
1525.1
1406
.4
13
20.9
12
23.5
1102.4
1
097
1061.2
1034.4
US
A
100.5
137
11
5.2
119
12
5
120.3
119.5
104.1
106.7
108.3
78.9
74.1
EU
163.1
181
.7
16
5.5
189.5
215.1
186.6
188.2
203.2
185.7
180.9
16
9.9
17
7.4
Ger
man
y
66.1
75.7
69.5
65.6
75.1
77
.5
76.6
7
6.3
65.6
55.5
53
56.7
Chin
a 208.3
238
.5
23
5.8
410.1
415.4
327.8
238.4
238.4
211.9
216.5
19
9.7
21
5.3
Ind
ia
52.8
55.1
40.7
52.2
65.7
66
.9
63.9
6
3.9
44.2
79.5
78.6
68.7
Afr
ica
33.7
34.4
28.5
34.7
40.9
49
.4
45.4
4
5.4
44.9
40.6
37.4
49.8
Sourc
e: T
rade
in M
edic
inal
P
lants
, R
aw M
ater
ials
, T
ropic
al an
d H
ort
icult
ura
l P
roduct
s S
ervic
e, C
om
modit
ies
and T
rade,
D
ivis
ion
Eco
nom
ic a
nd S
oci
al D
epar
tmen
t, F
ood
an
d A
gri
cult
ure
Org
anis
atio
n o
f th
e U
nit
ed N
atio
ns,
Rom
e.

134
Fig
ure
4 :
Worl
d E
xp
ort
Valu
e of
Med
icin
al
Pla
nts
(in
Mil
lion
US
$)
0
200
400
600
800
1000
1200
1400
1600
1800
1991
1992
1993
1994
1995
1996
1997
1998
1999
2000
2001
2002
Wo
rld
US
A
EU
Ge
rma
ny
Ch
ina
Ind
ia
Afr
ica

135
Tab
le:-
4.4
. W
orl
d E
xp
ort
s volu
me
of
Med
icin
al
Pla
nts
(in
Mil
lion
US
$)
Co
un
trie
s
1991
1992
1993
1994
19
95
1996
1997
1998
1999
2000
20
01
2002
Worl
d
371.9
406.4
421.1
449.4
4
63.1
489
.0
497.5
463.7
478.0
529.1
5
41.4
583
.6
US
A
7.7
10.0
11
.4
13.2
12.9
14.0
14.4
17.4
15
.9
18.0
16.2
12.6
EU
32.3
34.6
35
.1
39.0
54.1
38.7
45.9
44.1
40
.7
40.2
39.7
47.6
Ger
man
y
14.4
14.2
14
.0
14.6
16.5
15.5
16.5
16.5
16
.1
14.3
13.6
14.2
Chin
a 99.0
113.3
126.0
155.4
1
42.5
165
.0
165.2
143.1
165.2
186.4
1
69.2
150
.3
Ind
ia
37.8
36.1
31
.3
37.6
37.6
35.8
41.1
42.6
38
.8
47.8
49.1
45.8
Afr
ica
16.4
18.9
19
.3
26.8
28.2
33.2
36.8
34.9
36
.8
33.4
33.4
39.4
S
ourc
e:
Tra
de
in M
edic
inal
P
lants
, R
aw M
ater
ials
, T
ropic
al an
d H
ort
icult
ura
l P
rod
uct
s S
ervic
e, C
om
modit
ies
and T
rade,
D
ivis
ion
E
conom
ic a
nd S
oci
al D
epar
tmen
t, F
ood
an
d A
gri
cult
ure
Org
anis
atio
n o
f th
e U
nit
ed N
atio
ns,
Rom
e.

136
Fig
ure
5 :
Worl
d E
xp
ort
s volu
me
of
Med
icin
al
Pla
nts
(in
Mil
lion
US
$)
0
10
0
20
0
30
0
40
0
50
0
60
0
70
01991
1992
1993
1994
1995
1996
1997
1998
1999
2000
2001
2002
Wo
rld
US
AE
UG
erm
any
Chin
aIn
dia
Afr
ica
137
Trade statistics is not exhaustive as a substantial part of the trade is not
recorded. Either the collectors of statistics do not identify the plants individually, or do
not separate either medicinal use from other usages. The recorded exports or medicinal
plants from LDCs peaked at US $ 37 million in 1998 before failing to a reported US $
27 million in 1999 (FAO). It averaged around US $ 31 million a year from 1995 to
1999 (FAO, 2004).
Despite the vast potential for exploiting the market for medicinal, aromatic and
exotic plants this sector is still in the nascent stage among many promising country.
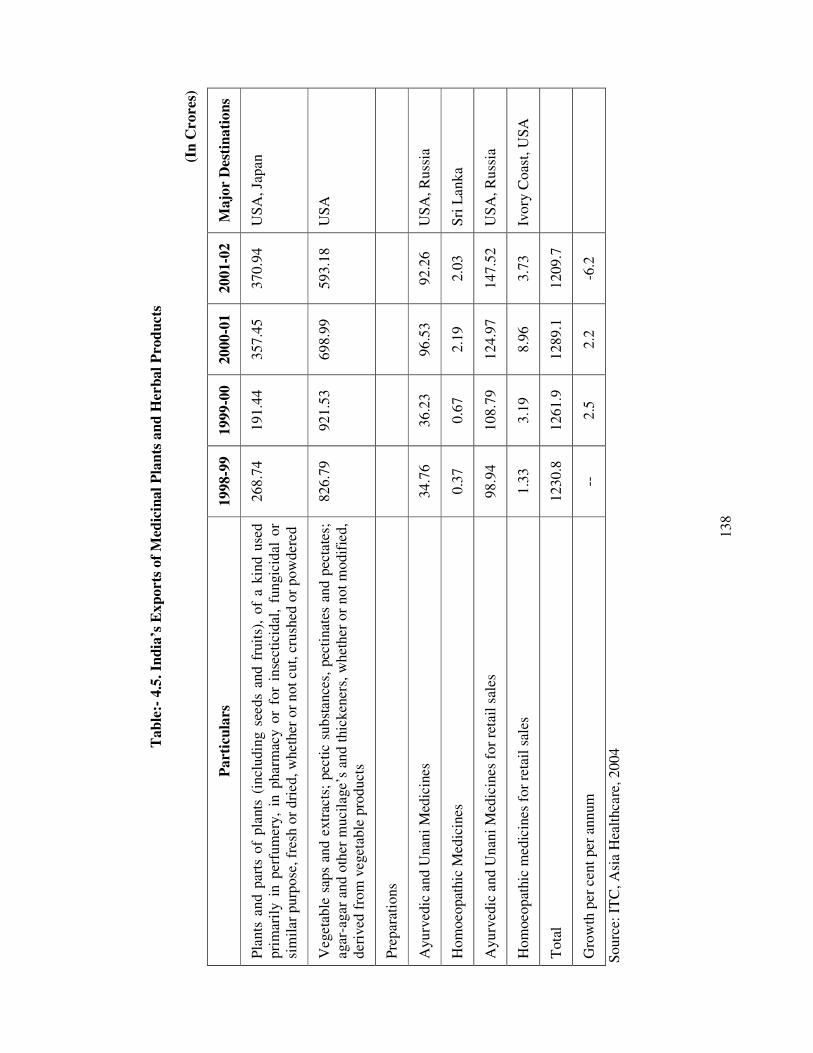
It can be seen from the table that the total export value of Ayurvedic and Unani
medicines is around Rs.300 million. Medicinal plants account for about 70 percent by
value of the total raw materials procured by Ayurvedic Pharmacies. Hence, based on
the growing demand for herb-based medicines, both in the domestic and international
markets, it can be inferred that the demand for the raw material, i.e., medicinal plants
will grow correspondingly. It was estimated that the demand for Ayurvedic medicines
in Kerala State alone is growing at a compound rate of 10-12 percent per annum
(Sunitha, 2004), while there are reports that a similar trend is globally observed for
alternative medicines. The Centre for Monitoring the Indian Economy (CMIE)
estimated that India exported plant based drugs and pharmaceutical products worth
Rs.2,800 million during 1996-97. The world trade in medicinal plants (gathered from
our forests as ‘non-timber forests products’ (NTFPs) is US $ 16 billion per annum.
1
38
Tab
le:-
4.5
. In
dia
’s E
xp
ort
s o
f M
edic
ina
l P
lan
ts a
nd
Her
bal
Pro
du
cts
(I
n C
rore
s)
Part
icu
lars
1
99
8-9
9
199
9-0
0
20
00
-01
2
00
1-0
2
Ma
jor
Des
tin
ati
on
s
Pla
nts
and p
arts
of
pla
nts
(in
cludin
g s
eed
s an
d f
ruit
s),
of
a k
ind u
sed
pri
mar
ily i
n p
erfu
mer
y,
in p
har
mac
y o
r fo
r in
sect
icid
al,
fun
gic
idal
or
sim
ilar
purp
ose
, fr
esh o
r dri
ed,
whet
her
or
no
t cu
t, c
rush
ed o
r p
ow
der
ed
26
8.7
4
191
.44
3
57
.45
3
70
.94
U
SA
, Ja
pan
Veg
etab
le s
aps
and e
xtr
acts
; pec
tic
subst
ance
s, p
ecti
nat
es a
nd p
ecta
tes;
ag
ar-a
gar
and o
ther
muci
lage’
s an
d t
hic
ken
ers,
wh
eth
er o
r n
ot
mo
dif
ied
, der
ived
fro
m v
eget
able
pro
duct
s
82
6.7
9
921
.53
6
98
.99
5
93
.18
U
SA
Pre
par
atio
ns
Ayu
rved
ic a
nd U
nan
i M
edic
ines
3
4.7
6
36
.23
9
6.5
3
92
.26
U
SA
, R
uss
ia
Hom
oeo
pat
hic
Med
icin
es
0.3
7
0.6
7
2.1
9
2.0
3
Sri
Lan
ka
Ayu
rved
ic a
nd U
nan
i M
edic
ines
for
reta
il s
ales
9
8.9
4
108
.79
1
24
.97
1
47
.52
U
SA
, R
uss
ia
Hom
oeo
pat
hic
med
icin
es f
or
reta
il s
ales
1
.33
3.1
9
8.9
6
3.7
3
Ivo
ry C
oas
t, U
SA
Tota
l 1
23
0.8
1
26
1.9
1
28
9.1
1
20
9.7
Gro
wth
per
cen
t per
annum
--
2
.5
2.2
-6
.2
Sourc
e: I
TC
, A
sia
Hea
lthca
re, 2004

139
Table: - 4.6. Export of Major Medicinal Plants from India (2000-01)
S. No. Medicinal Plant/part Quantity
(in Tonnes) Value
(Rs. In lakhs)
1 Liquorice roots (fresh/dried/powdered) 54.9 70.53
2 Nux vomica 1.8 17.97
3 Galangal (rhizomes and roots) 108.6 33.45
4 Ginseng roots 3271 1345.6
5 Agarwood 169 45.1
6 Belladonna leaves 1.7 84.63
7 Belladonna roots 2304.6 331.8
8 Poppy flowers and unripe heads 9.4 18.4
9 Poppy husk 1 0.43
10 Isabgol (husk) 19.27 19993.8
11 Isabgol (seeds) 1000.4 746.8
12 Senna (leaves and pods) 7430.25 1839.97
13 Tukmaria 97.7 49.6
14 Catharanthus roseus 522.9 189.31
15 Neem (seed) 106.5 38.64
16 Neem (leaves/powder) 13.13 6.81
17 Gymnema (oowder) 19.99 110.9
18 Ayurvedic and Unani herbs 9367.12 2250.26
Source: DGCIS reports.

140
Table: - 4.7. Asian Trade in Essential Drugs in 2002
Country Export to
world (US $ thousand)
Intra-regional exports (in % of exports to the world)
Imports from World (US $
thousand)
Intra-regional imports (in % of imports from the
world)
Bangladesh 3137 15.8 21599 26.4
Cambodia 41 0 26738 20.3
China 179893 18.5 557970 1.1
India 692957 14.7 113006 6.1
Indonesia 17639 57.1 43316 5.4
Sri Lanka 570 13.7 76439 6.4
Source: (HS 300490) ITC, Asia Healthcare, 2004.
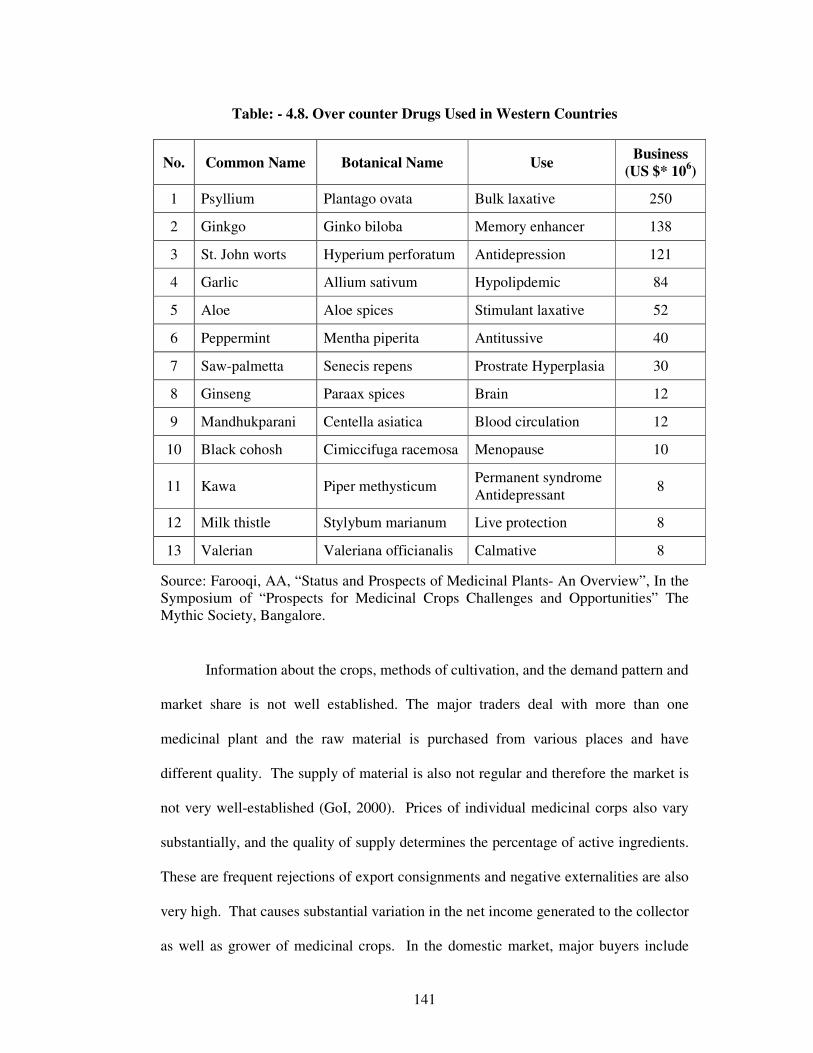
There are a large number of drugs used over the counter in western countries.
These drugs use the herbs indicated as basic ingredients but not normally sold in the
same form as Ayurvedic medicines in the Indian Medical Systems. There are used
substantially without a prescription. A large amount of ingredients that go into making
these drugs are imported from developing countries in a raw form. The total business
established under this channel is about US $ 800 million.
141
Table: - 4.8. Over counter Drugs Used in Western Countries
No. Common Name Botanical Name Use Business
(US $* 106)
1 Psyllium Plantago ovata Bulk laxative 250
2 Ginkgo Ginko biloba Memory enhancer 138
3 St. John worts Hyperium perforatum Antidepression 121
4 Garlic Allium sativum Hypolipdemic 84
5 Aloe Aloe spices Stimulant laxative 52
6 Peppermint Mentha piperita Antitussive 40
7 Saw-palmetta Senecis repens Prostrate Hyperplasia 30
8 Ginseng Paraax spices Brain 12
9 Mandhukparani Centella asiatica Blood circulation 12
10 Black cohosh Cimiccifuga racemosa Menopause 10
11 Kawa Piper methysticum Permanent syndrome Antidepressant
8
12 Milk thistle Stylybum marianum Live protection 8
13 Valerian Valeriana officianalis Calmative 8
Source: Farooqi, AA, “Status and Prospects of Medicinal Plants- An Overview”, In the Symposium of “Prospects for Medicinal Crops Challenges and Opportunities” The Mythic Society, Bangalore.
Information about the crops, methods of cultivation, and the demand pattern and
market share is not well established. The major traders deal with more than one
medicinal plant and the raw material is purchased from various places and have
different quality. The supply of material is also not regular and therefore the market is
not very well-established (GoI, 2000). Prices of individual medicinal corps also vary
substantially, and the quality of supply determines the percentage of active ingredients.
These are frequent rejections of export consignments and negative externalities are also
very high. That causes substantial variation in the net income generated to the collector
as well as grower of medicinal crops. In the domestic market, major buyers include
142
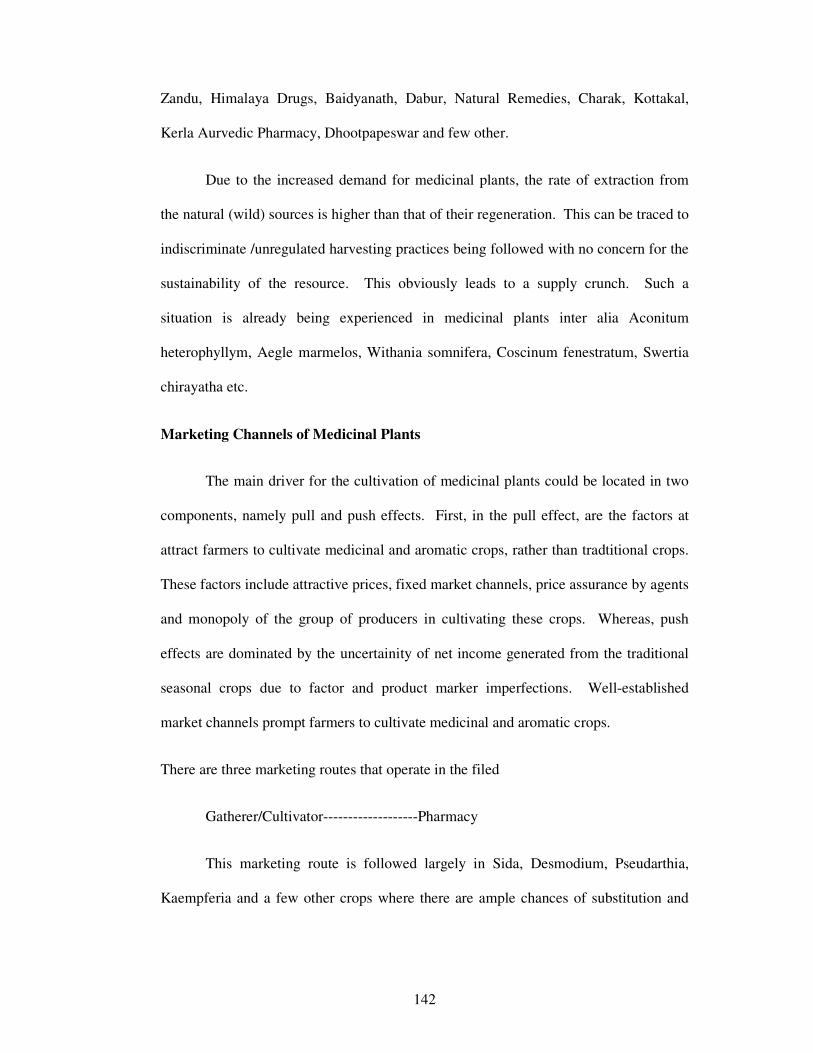
Zandu, Himalaya Drugs, Baidyanath, Dabur, Natural Remedies, Charak, Kottakal,
Kerla Aurvedic Pharmacy, Dhootpapeswar and few other.
Due to the increased demand for medicinal plants, the rate of extraction from
the natural (wild) sources is higher than that of their regeneration. This can be traced to
indiscriminate /unregulated harvesting practices being followed with no concern for the
sustainability of the resource. This obviously leads to a supply crunch. Such a
situation is already being experienced in medicinal plants inter alia Aconitum
heterophyllym, Aegle marmelos, Withania somnifera, Coscinum fenestratum, Swertia
chirayatha etc.
Marketing Channels of Medicinal Plants
The main driver for the cultivation of medicinal plants could be located in two
components, namely pull and push effects. First, in the pull effect, are the factors at
attract farmers to cultivate medicinal and aromatic crops, rather than tradtitional crops.
These factors include attractive prices, fixed market channels, price assurance by agents
and monopoly of the group of producers in cultivating these crops. Whereas, push
effects are dominated by the uncertainity of net income generated from the traditional
seasonal crops due to factor and product marker imperfections. Well-established
market channels prompt farmers to cultivate medicinal and aromatic crops.
There are three marketing routes that operate in the filed
Gatherer/Cultivator-------------------Pharmacy
This marketing route is followed largely in Sida, Desmodium, Pseudarthia,
Kaempferia and a few other crops where there are ample chances of substitution and
143
adulteration (Sunitha, 2004). Here, the gatherer gets 100 percent of the price paid by
the pharmaceutical user but the channel sticks to the enlisted growers.
Gatherer/Cultivator -----------------Trader----------------Pharmacy
Gatherer to pharmacy via trader is one of the frequently resorted market routes.
The price spread in this channel is slightly higher than the earlier channel. The trader
makes most of the profits. A third party gets added in this route, that a commission
agent. The commission agent collects the material from the farmer or the gatherer and
sells it to the trader. Here the market margin increases. The commission agent makes a
large share (about 70 percent) of the value due to the farmer in the pharmacy’s price, by
merely assembling the produce from several gatherers/cultivators (sellers) and later
selling the lot, in bulk, to pharmacies and/ or to traders.
The Department of Agricultural and Cooperation, Ministry of Agricultural,
launched a Central Sector Scheme on Development of Medicinal and Aromatic plants
during the Eighth Five Year Plan with an outlay of Rs.500 crore. Programmes for
development of quality planting material and the establishment of herbal gardens and
regional analytical laboratories were taken up in 16 State Agricultural Universities and
three Regional Research Laboratories (RRL) of the Council of Scientific and Industrial
Research (CSIR). Programmes for the establishment of demonstration plots-cum-seed
multiplication centers were undertaken through the State Department of
Horticulture/Agriculture from 1996-97. The programme was continued during the
Ninth Five Year Plan with an outlay of Rs.14.50 crores. Activities such as area
expansion and training of farmers were included during the Ninth Fiver Year Plan and
continued in the Tenth Plan. With effect from 2000-01, the state departments have
been given the option to include various components in their work plans.
1
44
Tab
le:
- 4
.9.
Fu
ture
dem
an
d f
or
Med
icin
al
Pla
nts
for
dru
g p
rod
uct
ion
Med
icin
al
Pla
nts
Qu
an
tity
av
ail
ab
le a
t p
rese
nt
(in
Kg
s.)
Ex
pec
ted
qu
an
tity
in
fu
ture
(in
Kg
s)
Mea
n
Med
ian
S
.D
Min
M
ax
To
tal
Mea
n
Med
ian
S
.D
Min
M
ax
To
tal
Sid
a rh
om
bif
oli
a 1260
30
0
13
72
.22
2
00
30
00
6
30
0
43
80
9
00
5
15
5.2
8
60
0
12
00
0
21
90
0
Tin
osp
ora
cord
ifoli
a 220
.00
3
03
.31
.0
0
60
0
11
00
4
40
.0
0
60
6.6
3
.00
1
20
0
22
00
Des
modiu
m g
anget
icum
812
40
0
629
.06
3
00
15
00
4
06
0
22
84
9
00
2
02
3.9
3
72
0
450
0
11
42
0
Sal
apar
ni
(pse
udar
thri
a vis
cida)
760
30
0
676
.75
2
00
15
00
3
80
0
22
40
9
00
2
07
3.1
6
40
0
450
0
11
20
0
Adhat
oda
vas
ica
890
40
0
806
.54
2
50
20
00
4
45
0
21
60
1
20
0
19
34
5
00
4
50
0
10
80
0
Cas
sia
seen
a 640
30
0
585
.66
2
00
15
00
3
20
0
13
20
6
00
1
13
6.6
6
40
0
300
0
66
00
Adat
oda
660
60
0
328
.63
3
00
10
00
3
30
0
16
60
1
20
0
85
3.2
3
90
0
300
0
83
00
Sourc
e: C
om
pute
d d
ata
145
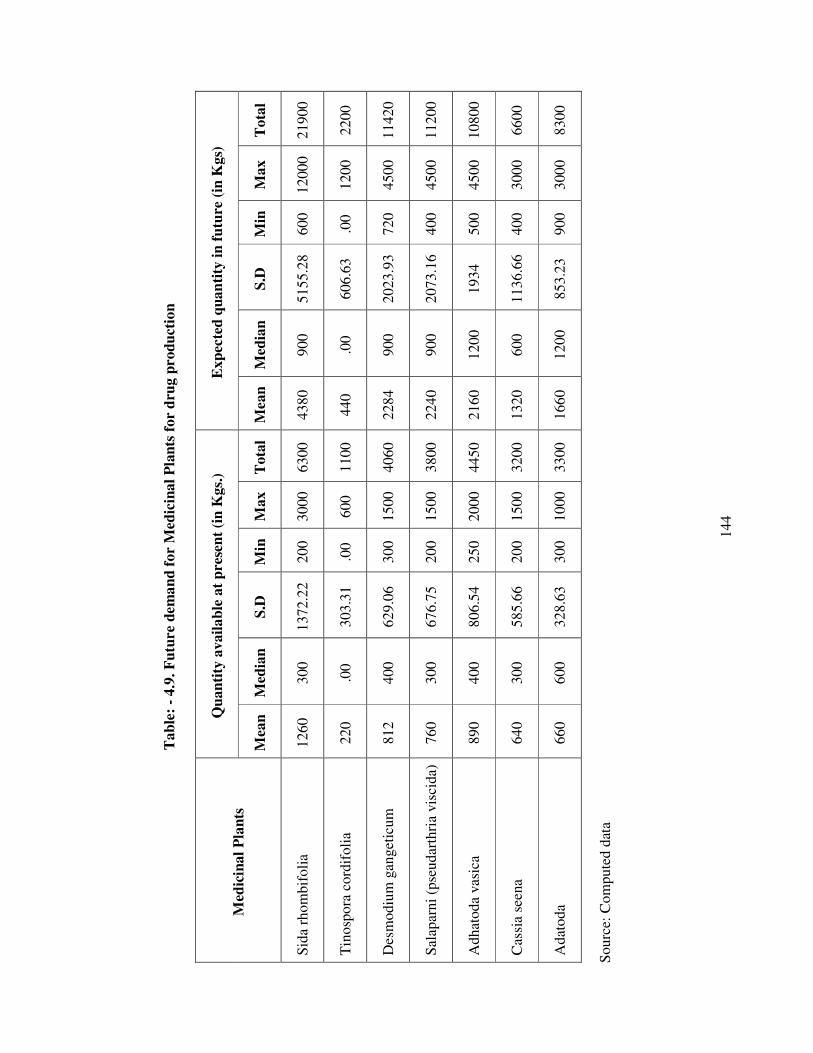
The survey questionnaire also facilitated us to determine actual quantity of
medicinal plants available and expected quantity of medicinal plants in future needs has
been analysed in the above table 4.9.
A list of 960 medicinal plant species forming source of 1289 botanical raw
drugs in trade in the country has been worked out from the (a) literature and (b) data
collected during the study on (i) consumption of botanicals by the herbal manufacturing
units, and (ii) the plant raw drugs traded in the Mandis (raw drug trading centres). This
list includes the known equivalent species, substitutes, and the adulterants in trade for
major botanical raw drugs. Species that are harvested in large quantities from the wild,
whether or not recorded during the survey of herbal industry or the raw drug markets,
have also been included in this list. The list attempts to correlate the trade/ popular
vernacular names with updated botanical nomenclature, including valid author
citations.
The World Health Organization (WHO) has estimated the present demand for
medicinal plants is approximately US $14 billion per year. The demand for medicinal
plant based raw materials is growing at the rate of 15 to 25% annually, and according to
an estimate of WHO, the demand for medicinal plants is likely to increase more than
US $5 trillion in 2050. In India, the medicinal plant-related trade is estimated to be
approximately US $1 billion per year. According to an estimate, the quantity of export
of Ayurvedic products produced in India has tripled between last two financial years
(2001–2002 and 2002–2003). The projected escalating demand of medicinal plants has
led to the over-harvesting of many plants from wild, which subsequently results in the
loss of their existing populations. For example, the large quantity of Himalayan yew
(Taxus baccata) has been gathered from the wild since its extract, taxol, was
146
established as a use in the treatment of ovarian cancer. Aconitum heterophyllum,
Nardostachys grandiflora, Dactylorhiza hatagirea, Polygonatum verticillatum,
Gloriosa superba, Arnebia benthamii and Megacarpoea polyandra are other examples
of north Indian medicinal plant species which have been overexploited for therapeutic
uses and have subsequently been placed today in rare and endangered categories. Many
medicinal plant species are used in curing more than one disease, and as a result, these
species are under pressure due to over collection from wild. For example, Hemidesmus
indicus is used to cure 34 types of diseases; Aegle marmelos 31, Phyllanthus emblica
29, and Gloriosa superba 28. Over-exploitation and continuous depletion of medicinal
plants have not only affected their supply and loss of genetic diversity, but have
seriously affected the livelihoods of indigenous people living in the forest margins.
More than 95% of the 400 plant species used in preparing medicine by various
industries are harvested from wild populations in India. Harvesting medicinal plants for
commercial use, coupled with the destructive harvest of underground parts of slow
reproducing, slow growing and habitat-specific species, are the crucial factors in
meeting the goal of sustainability. Harvesting shoots and leaves of medicinal plants
may decline their photosynthetic capacity, and as well as the potential for survival and
effective propagation. Medicinal plants tolerance to harvest varies with climatic
conditions as the temperate herbs become highly vulnerable to harvest of individuals.
Furthermore, rising demand with shrinking habitats may lead to the local extinction of
many medicinal plant species. Increasing rarity The continuous exploitation of several
medicinal plant species from the wild and substantial loss of their habitats during past
15 years have resulted in population decline of many high value medicinal plant species
over the years. The primary threats to medicinal plants are those that affect any kind of
biodiversity used by humans. The weakening of customary laws, which have regulated

147
the use of natural resources, are among the causes of threatening the medicinal plant
species. These customary laws have often proved to be easily diluted by modern socio-
economic forces. There are many other potential causes of rarity in medicinal plant
species, such as habitat specificity, narrow range of distribution, land use disturbances,
introduction of non-native, habitat alteration, climatic changes, heavy livestock grazing,
explosion of human population, fragmentation and degradation of population,
population bottleneck, and genetic drift. Additionally, natural enemies (i.e., pathogens,
herbivores, and seed predators) could substantially limit the abundance of rare
medicinal plant species in Southern India, especially; the Tirunelveli district is highly
limiting the abundance of medicinal plants due to several reasons. In addition to the
consumption of medicinal plants by animals, there are physical ailments in humans,
which are cured by different species of the same genera. For example, the malarial
fever is treated by many species of Swertia (e.g. Swertia chiraiyta, S. angustifolia, and
S. cordata). Similarly, different species of Berberis (e.g. Berberis aristata, B. asiatica,
B. lycium, B. chitria and B. jaeschkeana) are used as a source of berberidine to cure
certain eye diseases. Furthermore, different species of the same genera contain different
proportions of chemical quantity, and there is a preference over their demand; however,
the degree of threat for their exploitation is relatively lower than those species, which
do not have alternatives.
An estimated 4,000 to 10,000 species of medicinal plants face potential local,
national, regional or global extinction, with subsequent serious consequences for
livelihoods, economies and health care systems. Although, a few studies exist on the
rare and endangered medicinal plant species of the northern India, none of these studies
have complete data set for even a single species. In 2003, 71 rare and endangered
medicinal plant species have been assessed for the northwest Himalaya during the

148
Conservation Assessment and Management Plan workshop, according to the guidelines
of the World Conservation Union. In northern India, Aconitum is the rarest genus with
5 species, followed by Rheum with 4 rare species. Out of the 71 rare medicinal plants,
92% are in active trade; 74% are traded nationally and 35% are traded internationally.
The meagre availability of data on the population and quantum of rare species in
nature, however, has restricted their categorization to a few species on the basis of
herbarium collection and by consultation by a few experts. The present assessments are
also questioned for their validity on the assignment of threat categories to the species,
including the number of taxa in danger for specific area. The problems in assessing the
species is increased in the mountainous region, especially high altitude areas because of
tough and inaccessibility of the terrain, inhospitable climatic conditions, and short life
cycle of plants. Most of the available data have been collected from the easily
accessible areas in these mountains. Indigenous communities and commercial herb
gatherers also raid these same areas for collection of medicinal plants. Therefore, the
estimated population density of categorized rare medicinal plants is not precise because
it differs the areas that never and hardly undergone any collection of such rare
medicinal plant species.
Cultivation of medicinal plants
Information on the propagation of medicinal plants is available for less than
10% and agro-technology is available only for 1% of the total known plants globally.
This trend shows that developing agro-technology should be one of the thrust areas for
research. Furthermore, in order to meet the escalating demand of medicinal plants,
farming of these plant species is imperative. Apart from meeting the present demand,
farming may conserve the wild genetic diversity of medicinal plants. Farming permits
149
the production of uniform material, from which standardized products can be
consistently obtained. Cultivation also permits better species identification, improved
quality control, and increased prospects for genetic improvements. Selection of planting
material for large-scale farming is also an important task. The planting material
therefore should be of good quality, rich in active ingredients, pest- and disease-
resistant and environmental tolerant. For the large scale farming, one has to find out
whether monoculture is the right way to cultivate all medicinal plants or one has to
promote polyculture model for better production of medicinal plants.
Studies conducted on the agro-forestry of medicinal plants elsewhere suggest
that since many medicinal plant species prefer to grow under forest cover, agro-forestry
offers a convenient strategy for their cultivation as well as conservation through:
1) integrating shade tolerant medicinal plants as lower strata species in multi-strata
system, 2) cultivating short cycle medicinal plants as intercrops in existing stands of
tree crops, 3) growing medicinal tree as shade providers and boundary markers, and
4) inter-planting medicinal plants with food crops. Notwithstanding, it is understood
that the cultivation of medicinal plants is not an easy task as the history of medicinal
plants farming reflects. Many farmers in trans-Himalayan region of northern India have
replaced the medicinal plants farming with common crops [i.e., peas (Pisum sativum),
potatos (Solanum tuberosum) and hops (Humulus lupulus)] due to the lengthy
cultivation cycle of medicinal plants like Saussurea costus.. The cost of many
medicinal plants in northern India is lower than many seasonal vegetables, which is a
cause of scanty farming of medicinal plants.

150
Attempts are being made by different organizations to cultivate various
medicinal plant species, including rare and endangered categories. Agro-technology for
about 20 species of rare and endangered medicinal plants of the northern India has been
developed by different organizations. However, the per hectare cost of cultivation, total
annual production and cost benefit ratio fluctuate with different medicinal plant species.
Out of 10 selected rare and endangered medicinal plant species, Rheum emodi was
calculated as a most beneficial cash crop of the medicinal plant in terms of net income
generation in southern India. At present, however, the farming of most of the medicinal
plant species is being operated on a small scale and is restricted to a few hectares of
land in various states of northern India. There is an uncertainty of obtaining the
necessary permits from government agencies for cultivation of medicinal plants.
Additionally, many farmers are unaware about the agency responsible for issuing
permits. If the farmers are not granted permits needed to cultivate, they are forced to
sell their products on the illegal market, which exposes them to action by government
agencies and the exploitation by middlemen
Conclusion
The demand for medicinal plants in India to meet both domestic and export
markets which was projected to increase at about 17 to 23 percent annually between
2010 and 2015. If properly organised, the cultivation and management of medicinal
plants becomes highly remunerative both in financial and economic terms for the small-
scale growers. The annual revenue stream from the three major Indian systems of
medicine, i.e. Ayurveda, Unani and Siddha, is estimated at more than half a billion
dollars annually. In 2015, the gap between demand and supply of MAPs was estimated
to be about 50,000 to 2, 50,000 tons; by 2020 the gas was expected to increase from

151
2,50,000 to 5,00,000 tons (Planning Commission, 2010 & CRPA, 2011). MAP based
industries create employment opportunities in poor, job-starved states, thereby
increasing the cash earnings of local people (Karki, 2002).
152
REFERENCES
1. Kala, CP. Studies on the Indigenous Knowledge, Practices and Traditional Uses
of Forest Products by Human Societies in Uttaranchal State of India. Almora:
GB Pant Institute of Himalayan Environment and Development; 2004.
2. Stein, R. Alternative remedies gaining popularity. The Washington Post. Friday,
May 28, 2004.
3. Kala, CP. Indigenous Knowledges: Transforming the Academy, Proceedings of
an International Conference. Pennsylvania:Pennsylvania State University; 2004.
Revitalizing traditional herbal therapy by exploring medicinal plants: A case
study of Uttaranchal State in India; pp. 15–21.
4. KIT. Bulletin 350. Royal Tropical Institute, Amsterdam, The Netherlands;
2003. Cultivating a Healthy Enterprise.
5. Raven, PH. Medicinal Plants: A Global Heritage, Proceedings of the
International conference on medicinal plants for survival. New Delhi:
International Development Research Center; 1998. Medicinal plants and global
sustainability: The canary in the coal mine; pp. 14–18.
6. Myers N. The world's forests and human population: the environmental
interconnections. Population and Development Review. 1991;16:1–15.
7. Lacuna-Richman C. The socio-economic significance of subsistence non-wood
forest products in Leyte, Philippines. Environmental Conservation. 2002;
29:253–262.
153
8. Kala, CP. Medicinal Plants of Indian Trans-Himalaya. Dehradun: Bishen Singh
Mahendra Pal Singh; 2002.
9. Farooquee NA, Majila BS, Kala CP. Indigenous knowledge systems and
sustainable management of natural resources in a high altitude society in
Kumaun Himalaya, India. Journal of Human Ecology. 2004;16:33–42.
10. Kala CP. Current status of medicinal plants used by traditional Vaidyas in
Uttaranchal state of India. Ethnobotany Research and Applications.
2005;3:267–278.
11. Kala, CP. Ethnobotanical Survey and Propagation of Rare Medicinal Herbs in
the Buffer Zone of the Valley of Flowers National Park, Garhwal Himalaya.
Kathmandu: International Centre for Integrated Mountain Development; 1998.
12. Nautiyal S, Rao KS, Maikhuri RK, Negi KS, Kala CP. Status of medicinal
plants on way to Vashuki Tal in Mandakini Valley, Garhwal, Uttaranchal.
Journal of Non-Timber Forest Products. 2002;9:124–131.
13. Jablonski D. Extinction: past and present. Nature. 2004;427:589. doi:
10.1038/427589a.
14. Kala CP. Status and conservation of rare and endangered medicinal plant in the
Indian trans-Himalaya. Biological Conservation. 2000;93:371–379.
15. Shiva, MP. Inventory of Forestry Resources for Sustainable Management and
Biodiversity Conservation. New Delhi: Indus Publishing Company; 1996.
16. Prajapati, ND.; Purohit, SS.; Sharma, AK.; Kumar, T. A Handbook of
Medicinal Plants. Jodhpur: Agrobios;2003.
154
17. Rao MR, Palada MC, Becker BN. Medicinal and aromatic plants in agro-
forestry systems. Agroforestry Systems. 2004;61:107–122.
18. Singh, DK.; Hajra, PK. Biodiversity Status in the Himalaya. New Delhi: British
Council; 1996. Floristic diversity; pp. 23–38.
19. Samant, SS.; Dhar, U.; Palni, LMS. Medicinal Plants of Indian Himalaya:
Diversity Distribution Potential Values. Almora: G.B. Pant Institute of
Himalayan Environment and Development; 1998.
20. Kala CP, Mathur VB. Patterns of plant species distribution in the trans-
Himalayan region of Ladakh, India. Journal of Vegetation Science.
2002;13:751–754.
21. Chatterjee D. Studies on the endemic flora of India and Burma. Journal of
Royal Asiatic Society Bengal.1939;5:19–67.
22. Dhyani, PP.; Dhar, U. Myrica esculenta Box myrtle Kaphal: A promising
underexploited tree crop of the Himalaya. Almora: G.B. Pant Institute of
Himalayan Environment and Development; 1994.