chapter-iii research design - inflibnetshodhganga.inflibnet.ac.in/bitstream/10603/2352/11/11_chapter...
TRANSCRIPT

Chapter-III
Research Design
Research methodology specifies method for acquiring the information
needed to structure or solve the problem at hand. By methodology of any
research means the selection of the representative sample, collection of relevant
data, application of appropriate research tools and techniques for analysis, and
interpretation of the same for scientific investigation of the problem.
Keeping in view the objectives and hypotheses formulated for the study,
the research methodology for the present study has been divided into two
sections. In Section-I, sample design, data collection and various tools of
analysis, such as mean, standard deviation, median, Wilcoxon Mann-Whitney
tests, Correlation, Regression, DEA, and Malmquist index used for
investigating the comparative profitability, efficiency and productivity of the
public and private sector general insurance companies for both the pre-and
post-reform periods have been discussed. However, in Section-II, the service
quality of these insurance companies has been ascertained through the
application of certain statistical techniques, such as SERVQUAL Scale, t-test,
Chi-square test, Pearson‟s correlation analysis and regression analysis. The
performance of general insurance companies is affected by both the external
and internal factors. Due to difficulties in quantifying the impact of external
factors on performance of a specific general insurance company, this study has
mainly focused on internal factors, such as efficiency, productivity,
profitability and service quality contributing towards the variability of
insurance companies‟ performance.
3.1 Hypotheses of the Study
To achieve the specific objectives of the study, the main hypotheses
formulated for the present study are as follows:
H1: The efficiency of private sector general insurance companies is higher
than that of the public sector general insurance companies.
74
H2: The efficiency of public sector general insurance companies is higher
during the post-reform period than the pre-reform period.
H3: The productivity of private sector general insurance companies is higher
than that of the public sector general insurance companies.
H4: The profitability of private sector general insurance companies is
significantly higher than that of the public sector general insurance
companies.
H5: The profitability of public sector general insurance companies is
significantly higher during the post-reform period than the pre-reform
period.
H6: The private sector general insurance companies are providing better
service quality than the public sector general insurance companies. The
other relevant sub-hypotheses have been discussed in different chapters
of the study separately.
Section-I
In this section, the research methodology used for investigating the
comparative profitability, efficiency and productivity of the public and private
sector general insurance companies during the post-reform period has been
discussed in detail. Also, profitability and efficiency of the public sector
general insurance companies during both the pre- and post-reform periods has
been studied.
3.2 Sample Design, Data Collection and Tools of Analysis
The study is mainly based on the secondary data which has been
collected from IRDA annual reports, annual reports of general insurance
companies, various journals related to insurance, websites etc. The primary
data, wherever necessary, has been collected through proper interviews with
the managers, officers and other employees of various general insurance
companies. The reforms in the insurance industry were initiated in the year
1999 and the private sector general insurance companies started their business
in 2000.
75
A total of eight private sector general insurance companies started their
business from the year 2002-03. So, to analyze the comparative profitability,
efficiency and productivity of the public and private sector general insurance
companies in the post-reform period, all the four public sector companies,
namely, The Oriental Insurance Company Limited, The New India Assurance
Company Limited , National Insurance Company Limited, and United India
Insurance Company Limited; and eight private sector companies, namely,
ICICI Lombard General Insurance Company Limited , Royal Sundram
Alliance Insurance Company Limited, Reliance General Insurance Company
Limited, Iffco Tokio General Insurance Company Limited, TATA AIG
General Insurance Company Limited, Bajaj Allianz General Insurance
Company Limited, Cholamandalam General Insurance Company Limited, and
HDFC-CHUBB General Insurance Company Limited, were taken up for the
study. The period of the study was 2002-03 to 2007-08. To assess the effect of
reforms on the profitability and efficiency of the public sector general
insurance companies, a comparison has been made of all the four public sector
general insurance companies during the pre- and post-reform period. The pre-
reform period includes the years 1993-94 to 1999-00, and the post-reform
period 2000-01 to 2007-08.
Parameters Used to Assess Profitability Performance
Profitability performance of the general insurance companies has been
examined using the following ratios (expressed in percentage form).
1. Claim Ratio (Net claim incurred to net written premium).
2. Expense Ratio (Expenses of management to net written premium).
3. Combined Ratio (Net incurred claim plus expenses to net written
premium).
4. Underwriting Results Ratio (Net written premium minus claim,
expenses and increase in unexpired risk reserve to net written premium).
5. Investment Income Ratio (Investment income to net written premium).
6. Net Retention Ratio (Net written premium to gross-direct premium).
7. Operating Ratio (Profit before tax to net written premium).
76
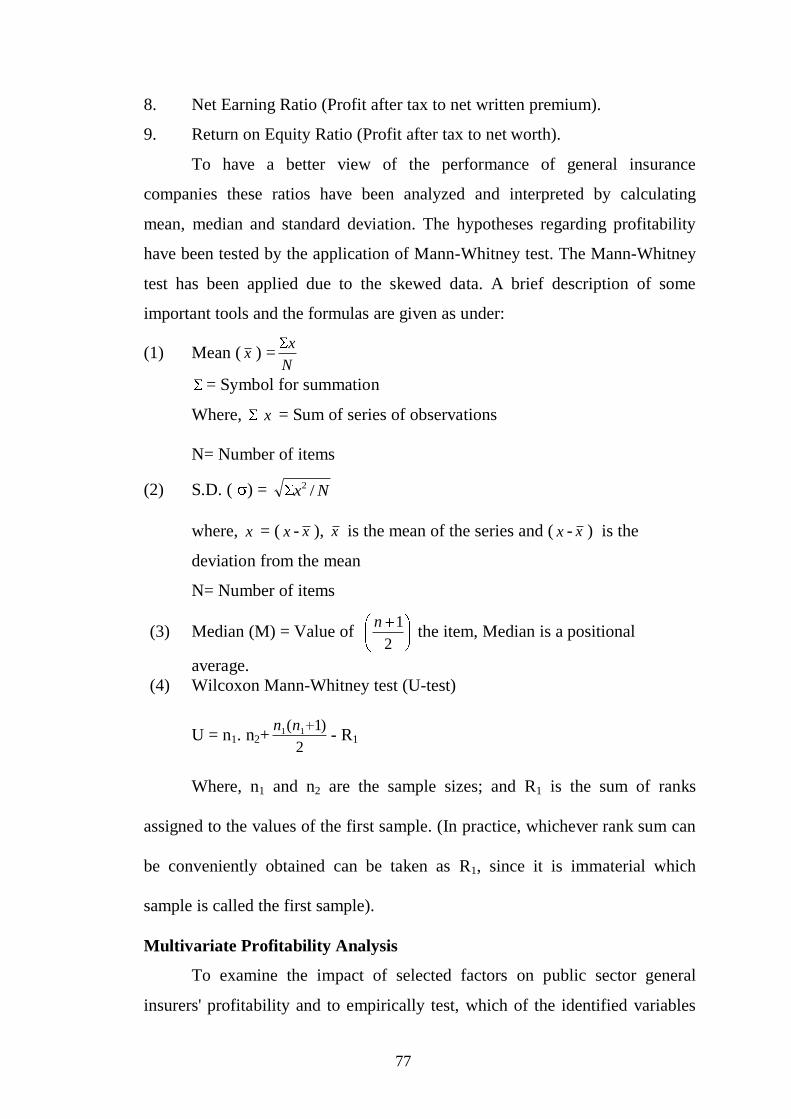
8. Net Earning Ratio (Profit after tax to net written premium).
9. Return on Equity Ratio (Profit after tax to net worth).
To have a better view of the performance of general insurance
companies these ratios have been analyzed and interpreted by calculating
mean, median and standard deviation. The hypotheses regarding profitability
have been tested by the application of Mann-Whitney test. The Mann-Whitney
test has been applied due to the skewed data. A brief description of some
important tools and the formulas are given as under:
(1) Mean ( x ) =N
x
= Symbol for summation
Where, x = Sum of series of observations
N= Number of items
(2) S.D. ( ) = Nx /2
where, x = ( x - x ), x is the mean of the series and ( x - x ) is the
deviation from the mean
N= Number of items
(3) Median (M) = Value of 2
1n the item, Median is a positional
average.
(4) Wilcoxon Mann-Whitney test (U-test)
U = n1. n2+2
)1( 11 nn- R1
Where, n1 and n2 are the sample sizes; and R1 is the sum of ranks
assigned to the values of the first sample. (In practice, whichever rank sum can
be conveniently obtained can be taken as R1, since it is immaterial which
sample is called the first sample).
Multivariate Profitability Analysis
To examine the impact of selected factors on public sector general
insurers' profitability and to empirically test, which of the identified variables
77
have significantly contributed towards general insurers' profitability in either
direction, the Spearman‟s rank correlation analysis and multiple step-wise
regression analysis have been used. The Spearman‟s rank correlation has been
used due to skewed data of profitability parameters. The formulas are as under:
(5) Spearman‟s Rank Correlation
Spearman‟s „r‟ = 1 - )1(
62
2
nn
di
Where, n = number of period observations.
Where d=Rank difference of given series
(6) Multiple regression equation assumes the form
y = a+b1x1+b2x2+b3x3 …………..bnxn
where, x1, x2, x3 and xn are independent variables and y being the
dependent variable and the constant a.
Statistical Tools Used to Assess the Efficiency and Productivity of General
Insurance Companies
To evaluate the efficiency of general insurance companies, Data
Envelopment Analysis (DEA) was used. DEA is a non-parametric
mathematical programming technique used for assessing/evaluating and
comparing the relative performance of economic units with minimal prior
assumption on input-output relation. The DEA method is a generalization of
Farrell's single input single output technical efficiency measure to the multiple
output-multiple input case. The methodology was originally developed by
Charnes et al. (1978) and was later further extended by Banker et al. (1984).
Concept of Technical and Scale Efficiency
The production possibility set can be represented by two alternative but
equivalent ways in terms of the input and output set. For any output bundle y0,
the input requirement set is-
V (y0) = {x:(x, y
0) Ps
Similarly, for any input bundle x0, the producible output set is
78
P (x0) = {y: (x
0, y) Ps}
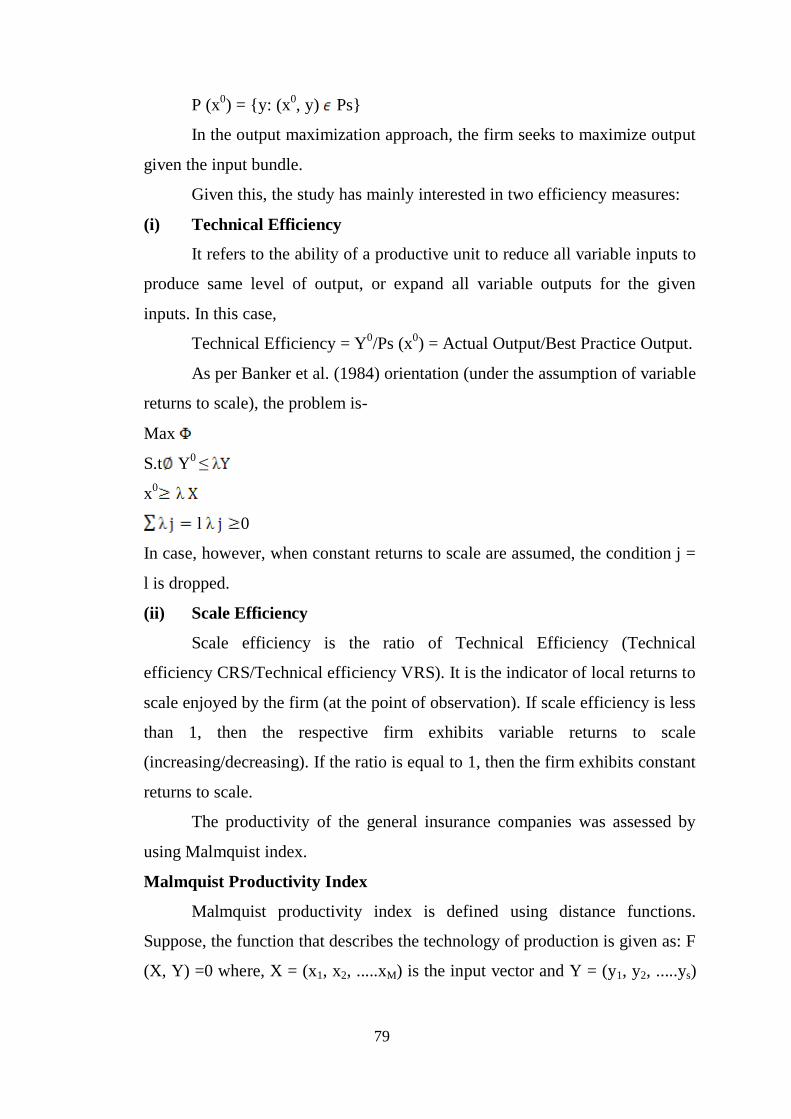
In the output maximization approach, the firm seeks to maximize output
given the input bundle.
Given this, the study has mainly interested in two efficiency measures:
(i) Technical Efficiency
It refers to the ability of a productive unit to reduce all variable inputs to
produce same level of output, or expand all variable outputs for the given
inputs. In this case,
Technical Efficiency = Y0/Ps (x
0) = Actual Output/Best Practice Output.
As per Banker et al. (1984) orientation (under the assumption of variable
returns to scale), the problem is-
Max
S.t Y0
≤
x0
l 0
In case, however, when constant returns to scale are assumed, the condition j =
l is dropped.
(ii) Scale Efficiency
Scale efficiency is the ratio of Technical Efficiency (Technical
efficiency CRS/Technical efficiency VRS). It is the indicator of local returns to
scale enjoyed by the firm (at the point of observation). If scale efficiency is less
than 1, then the respective firm exhibits variable returns to scale
(increasing/decreasing). If the ratio is equal to 1, then the firm exhibits constant
returns to scale.
The productivity of the general insurance companies was assessed by
using Malmquist index.
Malmquist Productivity Index
Malmquist productivity index is defined using distance functions.
Suppose, the function that describes the technology of production is given as: F
(X, Y) =0 where, X = (x1, x2, .....xM) is the input vector and Y = (y1, y2, .....ys)
79
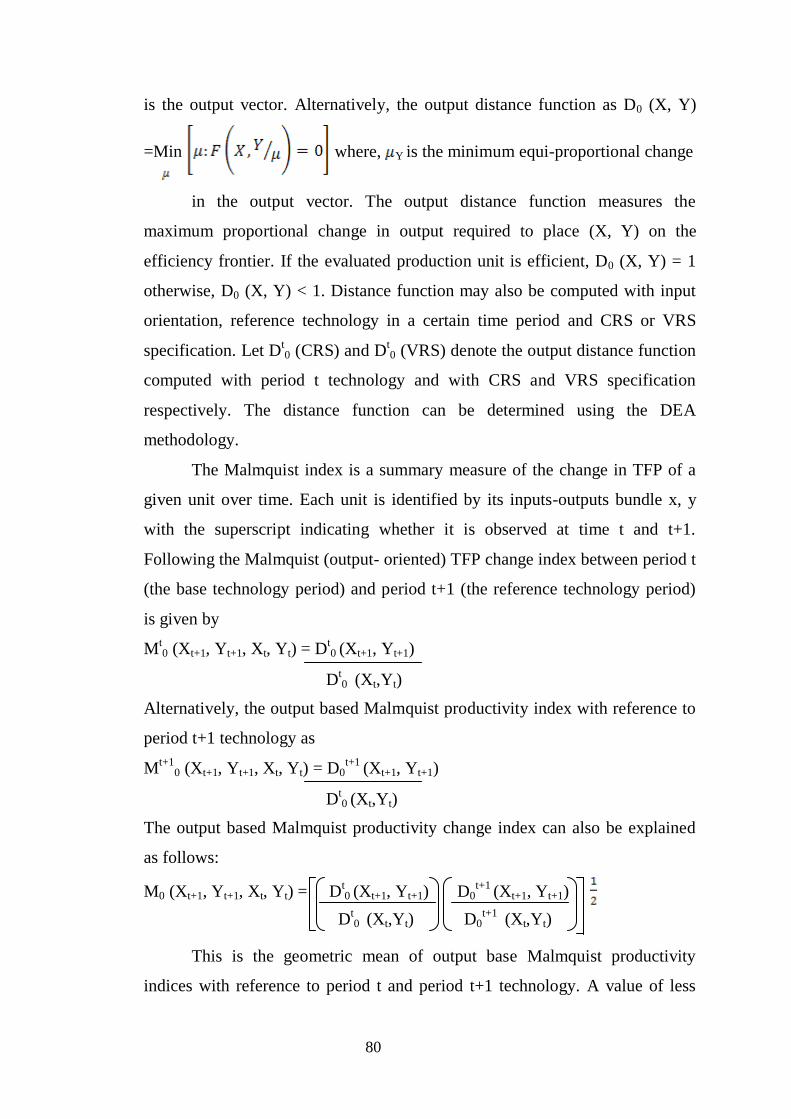
is the output vector. Alternatively, the output distance function as D0 (X, Y)
=Min where, Y is the minimum equi-proportional change
in the output vector. The output distance function measures the
maximum proportional change in output required to place (X, Y) on the
efficiency frontier. If the evaluated production unit is efficient, D0 (X, Y) = 1
otherwise, D0 (X, Y) < 1. Distance function may also be computed with input
orientation, reference technology in a certain time period and CRS or VRS
specification. Let Dt0 (CRS) and D
t0 (VRS) denote the output distance function
computed with period t technology and with CRS and VRS specification
respectively. The distance function can be determined using the DEA
methodology.
The Malmquist index is a summary measure of the change in TFP of a
given unit over time. Each unit is identified by its inputs-outputs bundle x, y
with the superscript indicating whether it is observed at time t and t+1.
Following the Malmquist (output- oriented) TFP change index between period t
(the base technology period) and period t+1 (the reference technology period)
is given by
Mt0 (Xt+1, Yt+1, Xt, Yt) = D
t0 (Xt+1, Yt+1)
Alternatively, the output based Malmquist productivity index with reference to
period t+1 technology as
Mt+1
0 (Xt+1, Yt+1, Xt, Yt) = D0t+1
(Xt+1, Yt+1)
The output based Malmquist productivity change index can also be explained
as follows:
M0 (Xt+1, Yt+1, Xt, Yt) = Dt0 (Xt+1, Yt+1) D0
t+1 (Xt+1, Yt+1)
This is the geometric mean of output base Malmquist productivity
indices with reference to period t and period t+1 technology. A value of less
Dt0 (Xt,Yt)
Dt0 (Xt,Yt)
Dt0 (Xt,Yt)
D0t+1
(Xt,Yt)
80
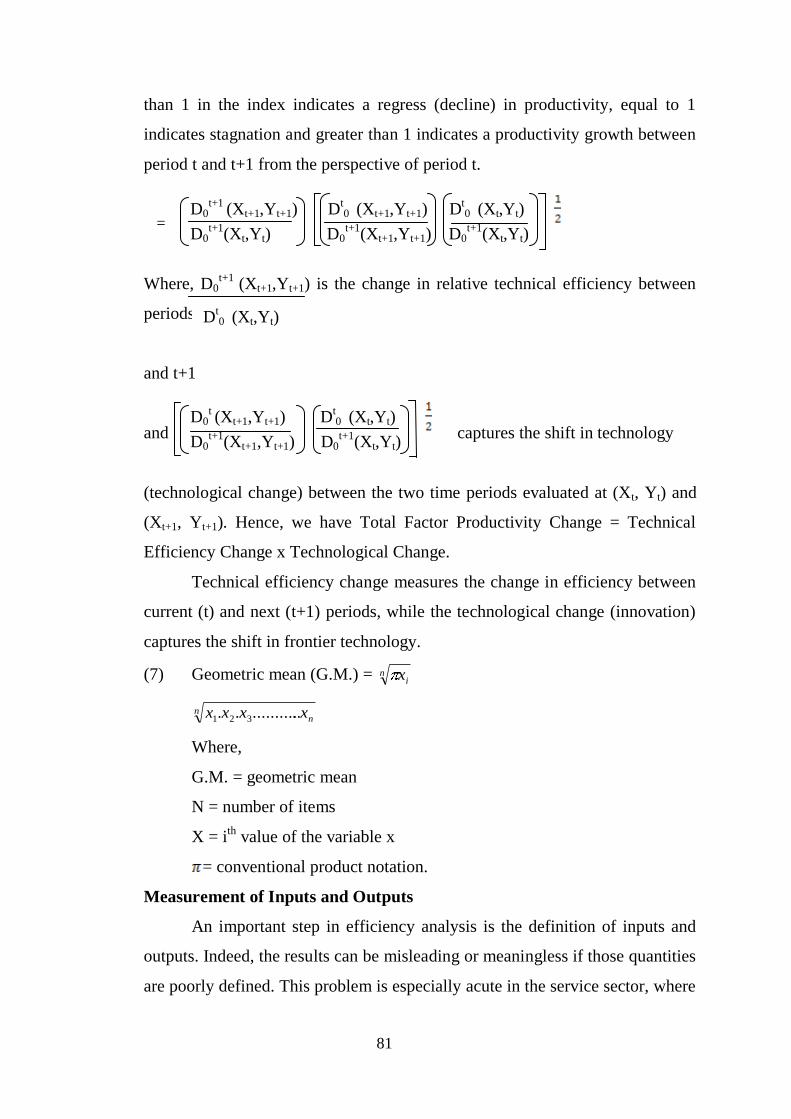
than 1 in the index indicates a regress (decline) in productivity, equal to 1
indicates stagnation and greater than 1 indicates a productivity growth between
period t and t+1 from the perspective of period t.
Where, D0t+1
(Xt+1,Yt+1) is the change in relative technical efficiency between
periods t
and t+1
and captures the shift in technology
(technological change) between the two time periods evaluated at (Xt, Yt) and
(Xt+1, Yt+1). Hence, we have Total Factor Productivity Change = Technical
Efficiency Change x Technological Change.
Technical efficiency change measures the change in efficiency between
current (t) and next (t+1) periods, while the technological change (innovation)
captures the shift in frontier technology.
(7) Geometric mean (G.M.) = nix
nnxxxx .............. 321
Where,
G.M. = geometric mean
N = number of items
X = ith
value of the variable x
= conventional product notation.
Measurement of Inputs and Outputs
An important step in efficiency analysis is the definition of inputs and
outputs. Indeed, the results can be misleading or meaningless if those quantities
are poorly defined. This problem is especially acute in the service sector, where
Dt0 (Xt,Yt)
D0t (Xt+1,Yt+1) D
t0 (Xt,Yt)
D0t+1
(Xt+1,Yt+1) D0t+1
(Xt,Yt)
D0t+1
(Xt+1,Yt+1) Dt0 (Xt+1,Yt+1) D
t0 (Xt,Yt)
D0t+1
(Xt,Yt) D0t+1
(Xt+1,Yt+1) D0t+1
(Xt,Yt)
=
81

many outputs are intangible and many prices are implicit. Defining inputs also
must be done with care, where basic data of some inputs, such as the number of
hours worked and number of employees is not available in public sources. In
spite of the challenges, researchers have come up with ways to measure inputs
and outputs that produce economically meaningful efficiency scores
(Communis and Weiss, 1998). Although the choice of inputs and outputs is
fundamental to the success of any efficiency analysis it has proved to be
problematic in the case of financial services firms.
Particular difficulties can arise in classifying intermediate goods and
services, which can have both input and output characteristics. In general,
inputs such as land, labour and capital represent the resources that are utilized
to produce the firm‟s output, and the acquisition of these inputs represents a
cost to the firm. Output, on the other hand, represents those goods or services
which the customers of the firm are prepared to purchase, and the sale of these
outputs generates revenue. For financial services companies such as insurers,
the output is often intangible, and therefore, difficult to measure. The pragmatic
approach is, therefore, to identify the services provided by such firms and find
measurable proxies that are highly correlated with those services. There has
been considerable disagreement over the appropriate proxies to use the output
for insurance services. When it comes to considering insurance company
output, the majority of efficiency studies have used premium income as a proxy
for the output (of non- investment related) insurance services even though
premiums are really a form of revenue, that is price times quantity rather than a
count of output units. Investment income is often used to proxy for the
investment related services provided by insurers (since again there is no
available count of investment units). The problems with using premium income
to proxy output have led some authors to use the value of claim payments.
The rational for the use of claim to proxy for insurance output is that the
primary function of insurance is risk pooling, i.e., the collection of funds from
the policyholder pool and the redistribution of funds to those pool members
who incur losses. Claims are also a good proxy for “real services” provided by
82
insurers, such as coverage design and providing legal defence in liability suits
(Cummins et al., 1999). However, it is difficult to understand why the
management of insurance companies would seek to maximize the value of
insurance claims, and this therefore, violates the principal characteristic that
more output should be preferred to less (Diacon et al., 2002).
When different outputs provide different conclusions, researchers need
to be careful about interpreting results. It may not be appropriate to use only
one approach and to draw conclusions from the results of that approach (Jeng
and Lai, 2005). Therefore, in this study, three models of output have been used
to examine the efficiency and productivity of general insurance companies in
India. In the first model, net written premium has been taken as proxy for the
output; in the second, net claim incurred has been taken as output; and in the
third, net premium written and investment income have been taken as output.
The premiums are usually paid in advance of loss payment. It is necessary to
appropriately account for investment income when measuring insurance output
(Cummins and Weiss, 1998).
When it comes to the choice of inputs, there is general agreement that
labour (administrative, managerial and sales) and capitals are the main input
resources utilized in the production of insurance. Although it may be possible
to undertake a head count of staff, most studies use total operating and selling
costs as a proxy. In the insurance industry, this approximation is a necessity
because of the widespread industry practice of outsourcing administrative and
sales functions (so that a simple head count would seriously underestimate staff
inputs). This study uses staff and capital resources as the main inputs. The
inputs of sales, administrative and managerial staff are proxied by the insurers
total operating expenses including commission. Capital inputs included
shareholders capital plus reserves & surplus.
In the present study, value measures as proxies for inputs and outputs
have been used to assess the efficiency and productivity. The widespread
practice of using value measures (such as revenue, costs, and capital) as proxies
for the inputs and outputs of financial services firms raises questions about
83
exactly what type of efficiency is being measured. Technical efficiency strictly
requires inputs and outputs to be measured in units. However, the intangible
nature of financial services output often means that no homogeneous unit of
output can be identified (sometimes even conceptually) and output prices
cannot be quality adjusted. Similarly, inputs like capital can only exist in value
terms, and the unit cost of capital is difficult to measure in firms that are not
publicly quoted. Thus, the technical efficiencies reported here are value-based
rather than the more traditional units-based measures found in many non-
financial efficiency studies. The term 'value-based' is used to recognize that the
technical efficiency measures are based on monetary values for inputs and
outputs (using both cost/revenue flows, and capital stocks), but do not capture
optimal choices in response to market prices (Diacon, 2001).
Choice of Model
The question that has to be dealt with is whether to use output or input
orientation model. Input-oriented model deals with input minimization
approach, which holds outputs constant and determines the minimum level of
inputs necessary to achieve that level of outputs. While output orientation
model deals with output maximization which holds inputs constant and
determines the maximum outputs that can be produced for that given level of
inputs.
The current study attempts to measure the efficiency and productivity
using the output maximization model. The Indian insurance industry, still in its
nascent stage, has a huge potential to be tapped. So, it makes sense to use
output maximization model. To curve the impact of inflation, the whole
analysis of efficiency and productivity has been done at constant prices. The
index has been taken from National Income Statistics, July 2008 published by
Centre for Monitoring Indian Economy.
Section-II
This section discusses in detail the research methodology used for
investigating the comparative service quality level of the public and private
84
sector general insurance companies and other perceptions which are helpful in
improving the service quality of these companies.
Data Collection
This study is based on primary as well as secondary data. The primary
data was collected with the help of a structured questionnaire based on
SERVQUAL scale. The secondary data was collected from various research
papers, books, journals published reports of IRDA, IRDA annual reports,
annual reports of general insurance companies and websites.
Sample and Sampling Design
The universe of the study is all general insurance companies operating in
India but due to non-feasibility and time constraint, the scope of the study has
been restricted to five general insurance companies, i.e., two companies from
the public sector, namely, New India Assurance Company Ltd., and Oriental
Insurance Company Ltd.; and three from the private sector companies, namely,
ICICI Lombard General Insurance Co. Ltd., Bajaj Allianz General Insurance
Co. Ltd., and IFFCO-Tokio General Insurance Co. Ltd. The criterion adopted
for selecting the private sector companies was their year of registration. The
reforms in the insurance industry were initiated in the year 1999 and the private
sector general insurance companies started their business in 2000. A total of six
companies were registered during this period. However, for the purpose of
uniformity, top three private sector general insurance companies registered on
the basis of their market share were selected. The primary data was drawn from
customers of both public and private sector general insurance companies and
only in the state of Punjab. As many as 430 customers were approached to
collect the required data for the study. However, 300 questionnaires filled by
the respondents, 60 each from all the five selected companies, with a response
percentage of 69.8 were found complete in all respects for the analysis. In
India, general insurance includes many portfolios like fire, marine, motor,
health, workman, compensation, engineering, personal accident, aviation, etc.
But the questionnaires were got filled from the customers of motor, health and
fire portfolios. These portfolios were selected due to their major market share.
85
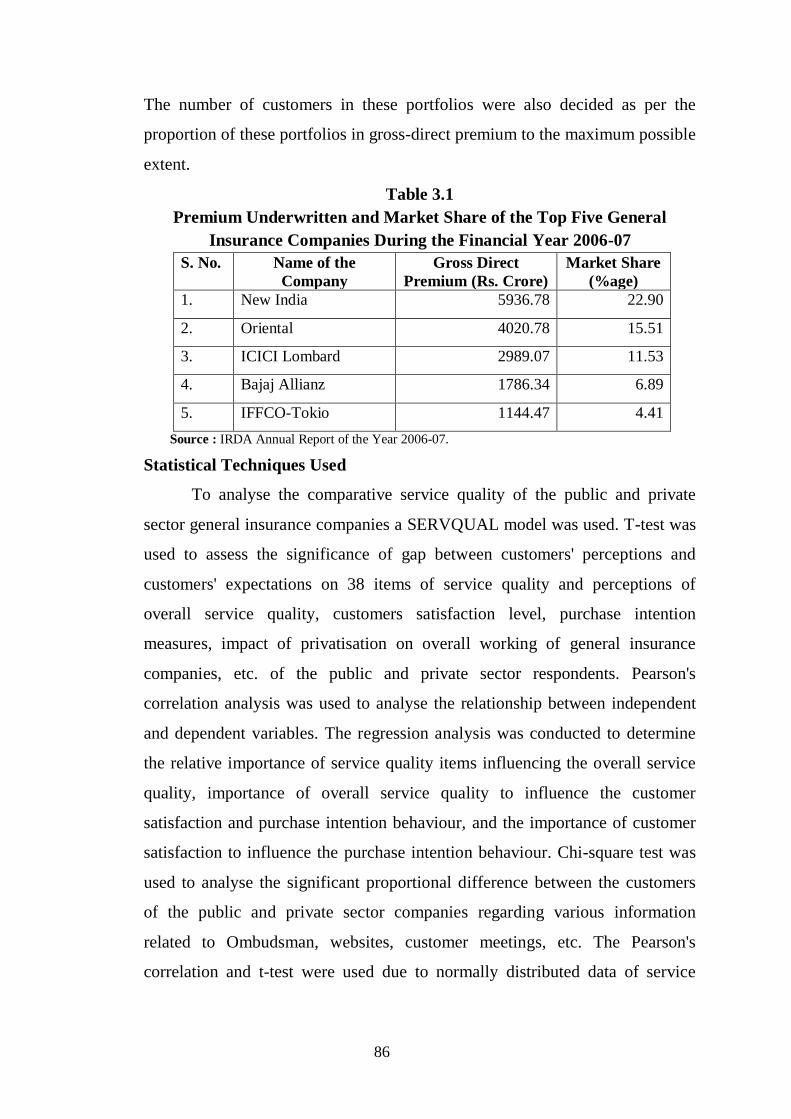
The number of customers in these portfolios were also decided as per the
proportion of these portfolios in gross-direct premium to the maximum possible
extent.
Table 3.1
Premium Underwritten and Market Share of the Top Five General
Insurance Companies During the Financial Year 2006-07
S. No. Name of the
Company
Gross Direct
Premium (Rs. Crore)
Market Share
(%age)
1. New India 5936.78 22.90
2. Oriental 4020.78 15.51
3. ICICI Lombard 2989.07 11.53
4. Bajaj Allianz 1786.34 6.89
5. IFFCO-Tokio 1144.47 4.41
Source : IRDA Annual Report of the Year 2006-07.
Statistical Techniques Used
To analyse the comparative service quality of the public and private
sector general insurance companies a SERVQUAL model was used. T-test was
used to assess the significance of gap between customers' perceptions and
customers' expectations on 38 items of service quality and perceptions of
overall service quality, customers satisfaction level, purchase intention
measures, impact of privatisation on overall working of general insurance
companies, etc. of the public and private sector respondents. Pearson's
correlation analysis was used to analyse the relationship between independent
and dependent variables. The regression analysis was conducted to determine
the relative importance of service quality items influencing the overall service
quality, importance of overall service quality to influence the customer
satisfaction and purchase intention behaviour, and the importance of customer
satisfaction to influence the purchase intention behaviour. Chi-square test was
used to analyse the significant proportional difference between the customers
of the public and private sector companies regarding various information
related to Ombudsman, websites, customer meetings, etc. The Pearson's
correlation and t-test were used due to normally distributed data of service
86
quality dimensions. Brief description and formula of some important tools is
given as under:
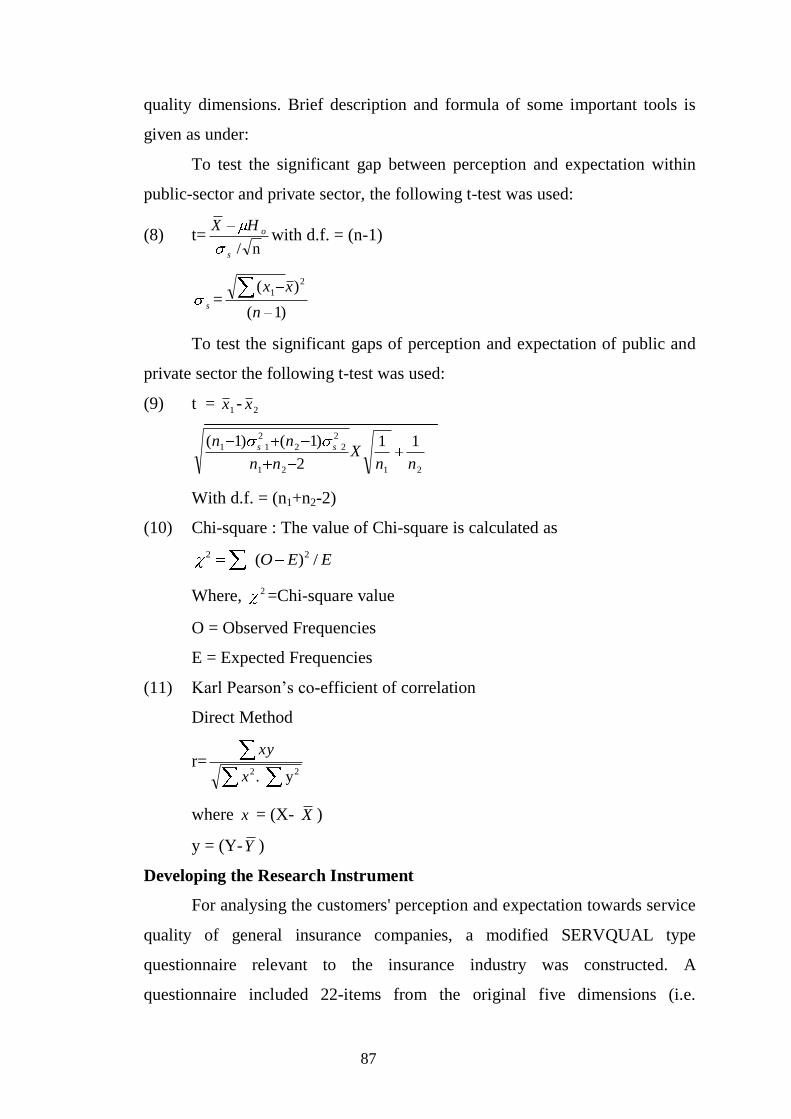
To test the significant gap between perception and expectation within
public-sector and private sector, the following t-test was used:
(8) t=n /s
oHXwith d.f. = (n-1)
s =)1(
)( 2
1
n
xx
To test the significant gaps of perception and expectation of public and
private sector the following t-test was used:
(9) t = 1x - 2x
2121
2
2
21
2
1 11
2
)1()1(
nnX
nn
nn ss
With d.f. = (n1+n2-2)
(10) Chi-square : The value of Chi-square is calculated as
EEO /)( 22
Where, 2 =Chi-square value
O = Observed Frequencies
E = Expected Frequencies
(11) Karl Pearson‟s co-efficient of correlation
Direct Method
r=22 y .x
yx
where x = (X- X )
y = (Y-Y )
Developing the Research Instrument
For analysing the customers' perception and expectation towards service
quality of general insurance companies, a modified SERVQUAL type
questionnaire relevant to the insurance industry was constructed. A
questionnaire included 22-items from the original five dimensions (i.e.
87
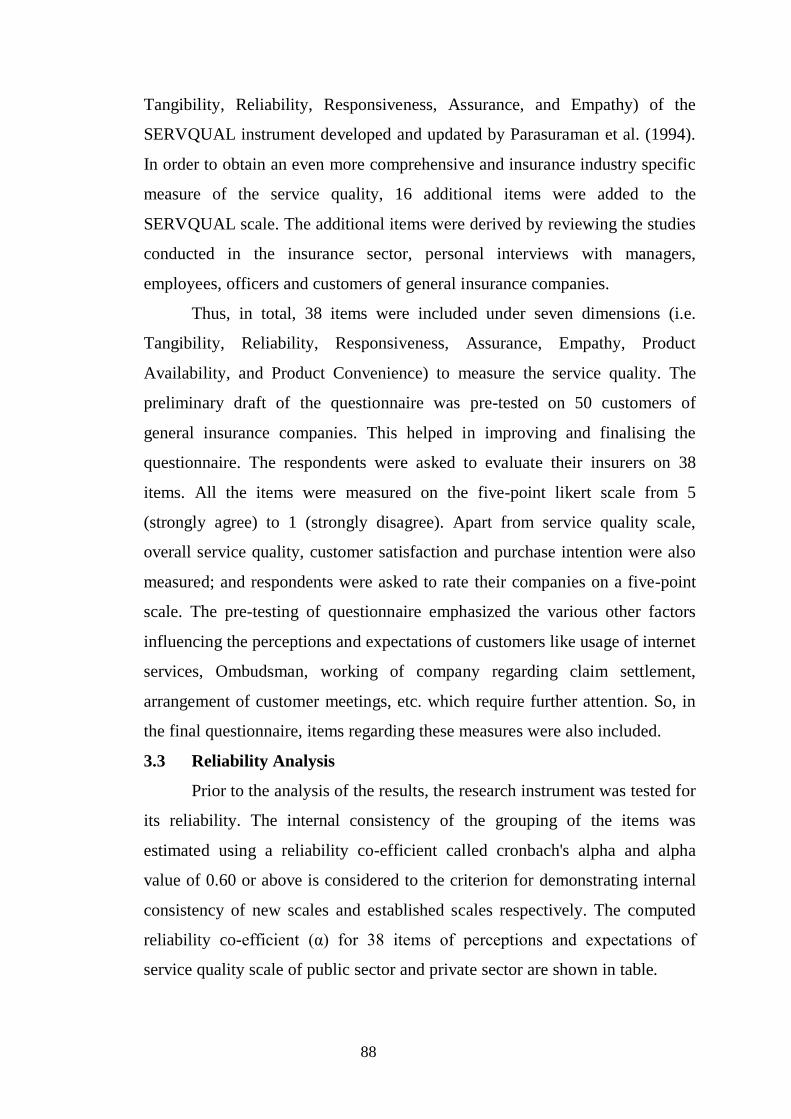
Tangibility, Reliability, Responsiveness, Assurance, and Empathy) of the
SERVQUAL instrument developed and updated by Parasuraman et al. (1994).
In order to obtain an even more comprehensive and insurance industry specific
measure of the service quality, 16 additional items were added to the
SERVQUAL scale. The additional items were derived by reviewing the studies
conducted in the insurance sector, personal interviews with managers,
employees, officers and customers of general insurance companies.
Thus, in total, 38 items were included under seven dimensions (i.e.
Tangibility, Reliability, Responsiveness, Assurance, Empathy, Product
Availability, and Product Convenience) to measure the service quality. The
preliminary draft of the questionnaire was pre-tested on 50 customers of
general insurance companies. This helped in improving and finalising the
questionnaire. The respondents were asked to evaluate their insurers on 38
items. All the items were measured on the five-point likert scale from 5
(strongly agree) to 1 (strongly disagree). Apart from service quality scale,
overall service quality, customer satisfaction and purchase intention were also
measured; and respondents were asked to rate their companies on a five-point
scale. The pre-testing of questionnaire emphasized the various other factors
influencing the perceptions and expectations of customers like usage of internet
services, Ombudsman, working of company regarding claim settlement,
arrangement of customer meetings, etc. which require further attention. So, in
the final questionnaire, items regarding these measures were also included.
3.3 Reliability Analysis
Prior to the analysis of the results, the research instrument was tested for
its reliability. The internal consistency of the grouping of the items was
estimated using a reliability co-efficient called cronbach's alpha and alpha
value of 0.60 or above is considered to the criterion for demonstrating internal
consistency of new scales and established scales respectively. The computed
reliability co-efficient (α) for 38 items of perceptions and expectations of
service quality scale of public sector and private sector are shown in table.
88
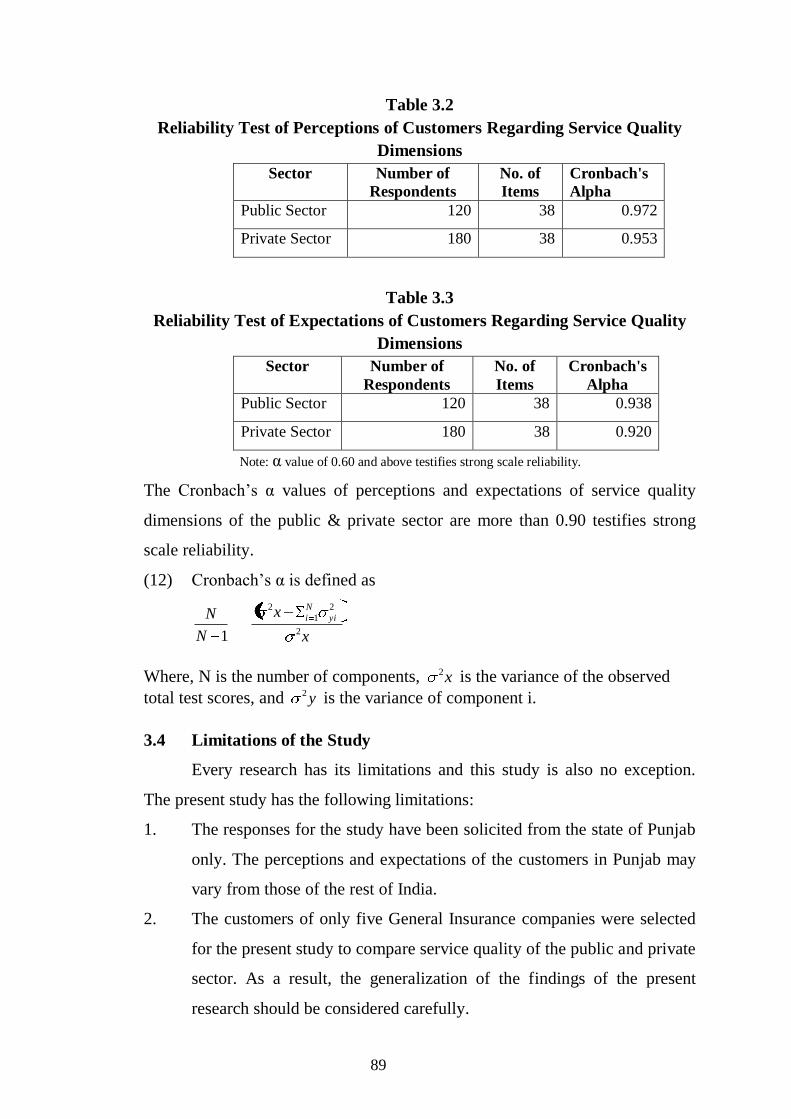
Table 3.2
Reliability Test of Perceptions of Customers Regarding Service Quality
Dimensions
Sector Number of
Respondents
No. of
Items
Cronbach's
Alpha
Public Sector 120 38 0.972
Private Sector 180 38 0.953
Table 3.3
Reliability Test of Expectations of Customers Regarding Service Quality
Dimensions
Sector Number of
Respondents
No. of
Items
Cronbach's
Alpha
Public Sector 120 38 0.938
Private Sector 180 38 0.920
Note: α value of 0.60 and above testifies strong scale reliability.
The Cronbach‟s α values of perceptions and expectations of service quality
dimensions of the public & private sector are more than 0.90 testifies strong
scale reliability.
(12) Cronbach‟s α is defined as
1N
N
x
x yi
N
i
2
2
1
2
Where, N is the number of components, x2 is the variance of the observed
total test scores, and y2 is the variance of component i.
3.4 Limitations of the Study
Every research has its limitations and this study is also no exception.
The present study has the following limitations:
1. The responses for the study have been solicited from the state of Punjab
only. The perceptions and expectations of the customers in Punjab may
vary from those of the rest of India.
2. The customers of only five General Insurance companies were selected
for the present study to compare service quality of the public and private
sector. As a result, the generalization of the findings of the present
research should be considered carefully.
89
3. The present research explores the key dimensions of the service quality
in the general insurance industry. A total of 38 parameters under seven
dimensions were used to measure consumers' perceptions and
expectations of the service quality. Although an attempt has been made
to extensively identify the attributes of the general insurers' service
quality, there may still exist the possibility of missing the key
dimensions influencing the consumers' perceptions and
expectations of the service quality.
4. Any study which is based on the primary data collected through the pre-
designed questionnaire suffers from the basic limitation of possibility of
difference between what is recorded and what is truth, no matter how
carefully the interview has been conducted. The same may be with the
present study because the people may not deliberately report their true
opinion due to some biasness.
5. The information collected for the secondary data based study carries all
the limitations inherent with the secondary data.
6. This research work assessed only the technical efficiency but allocative
efficiency and overall efficiency could not be assessed due to
unavailability of data of inputs and outputs prices of general insurance
companies.
90
References
Banker, R.; Charnes, A.; and Cooper, W.W. (1984), "Some Models for
Estimating Technical and Scale Efficiency" Management Science,
Vol.30, pp.1078-1092.
Charnes, A.; Cooper, W.W. and Rhodes, E. (1978), "Measuring Efficiency of
Decision Making Unit" European Journal of Operation Research,
Vol.2, pp.429-444.
Cummins, J.D.; and Weiss, M.A. (1998), "Analyzing Firm Performance in the
Insurance Industry Using Frontier Efficiency Methods", The Wharton
School, University of Pennsylvania, pp. 1-45.
Cummins, J.D.; Weiss, M.A.; and Zi, H. (1999), "Organisation Form and
Efficiency: The Coexistence of Stock and Mutual Property Liability
Insurance", Management Science, Vol. 45, No. 9, pp. 1254-1269.
http://fic.wharton.upenn.edu./fic /papers/98/9822.pdf dt. 4-12-2007.
Diacon, S. (2001), "The Efficiency of U.K. General Insurance Companies",
University of Nottingham, Centre for Risk and Insurance Studies, CRIS
Discussion Paker Series-2001.111.
www.nottingham.ac.uk/business/ohic.com/index/del/in.cris/papers
Diacon, S.; Starkey, K.; and Brien, C. (2002), "Size and Efficiency in European
Long-term Insurance Companies: An International Comparison”, The
Geneva Papers on Risk and Insurance, Vol.27, No.3, pp.444-466.
www.nottingham.ac.uk/business/ohic.com/index/del/in.cris/papers/2001
-3.pdf dt.5-2- 2007.
Jeng, V.; and Lai, G.C. (2005), "Ownership Structure, Agency Costs,
Specialization and Efficiency: Analysis of Keiretsu and Independent
Insurance Industry", The Journal of Risk and Insurance, Vol. 72, No.1,
pp. 105-138.
Parasuraman, A.; Zeithaml, V.A. and Berry, L.L. (1994), "Reassessment of
Expectations as a Comparison Standard in Measuring Service Quality:
Implications for Further Research" Journal of Marketing, Vol.58,
January, pp.111-124.
91
Chapter IV
Reform Process of Insurance Sector in India
The insurance industry in India has witnessed many radial
transformations during the last about one hundred ninety years of its inception.
The insurance business remained in the hands of private insurers with minimal
government intervention up to 1956. Both the life insurance as well as the
general insurance companies were nationalized by the government in the years
1956 and 1972 respectively, giving them a chance to have monopoly in the
field. But, unlike life insurance, a different structure was created for the general
insurance industry. One holding company was formed with four subsidiaries,
and again, the private sector was allowed to enter the insurance business in the
year 2000.
4.1 Insurance Industry in India: A Historical Perspective
The history of insurance in India can be traced with the establishment of
a British company called the Oriental Life Insurance Company in 1818,
followed by the Bombay Assurance Company in 1823, and the Madras
Equitable Life Insurance Society in 1829. All these companies operated in
India but did not insure the lives of Indians. They were insuring only the lives
of Europeans living in India. The first general insurance company known as
Triton Insurance Company Ltd., was established in 1850. It was owned and
operated by the British. The first indigenous general insurance company was
the Indian Mercantile Insurance Company Limited set up in Bombay in 1907
(Sinha, 2005; Sharma and Agarwal, 2005). The wholly Indian-owned insurance
company, namely, The New India Assurance Company Limited was
incorporated on July 23, 1919 which commenced its operations in October the
same year (Narayanan, 2006).
There was no exclusive legislation to govern the activities of insurance
companies during the 19th
century. To control the operations of life insurance
in India, the Indian Life Insurance Companies Act, 1912 was enacted.
However, the first comprehensive legislation was introduced with the passing
92
of Indian Insurance Act, 1938. The Act made provision for required equity
capital to carry out insurance business, ceiling on shareholding pattern, strict
control on investments, agency commission etc. Subsequently, a separate wing
was established in the Ministry of Finance to administer the provisions under
the Act (Sharma and Agarwal, 2005). Though a number of statutory laws and
insurance Acts were passed from time to time to regulate and control the
business, yet as many as 66 out of 215 life business companies perished
between 1935 and 1955. This was largely due to growing business
mismanagement and malpractices, manipulation of life funds to indulge in
speculative trading, large scale liquidation of insurance companies, inter-
locking of funds, and control and influence of large business houses which led
to public disenchantment and resentment (Rajan and Dhunna, 2002). This led
to the nationalization of life insurance by amalgamating all private companies
under one corporation, i.e., L.I.C. The number of companies in the general
insurance sector increased steadily, and by 1972 their number had gone to 107.
However, out of these 107 companies, more than 50% were in financially bad
shape. Taking into account the bad health of private operators and vast fund
mobilization potential in this sector, Government of India nationalized the
General Insurance sector w.e.f. 1st January, 1973. It formed four subsidiaries,
namely, (1) The New India Assurance Company Ltd., (2) The Oriental
Insurance Company Ltd., (3) The National Insurance Company Ltd., and (4)
The United India Insurance Company Ltd., with a holding company General
Insurance Corporation of India.
In spite of the commendable growth and performance of the LIC and
GIC on both economic and social fronts, a vast potential still exists as majority
of insurable population is still untapped. Macro indicators such as population
coverage, per capita premium, contribution to employment and GDP are still
very low as compared to developed countries, although they compare
reasonably well with other developing countries. The consumers have less
choice of products in the absence of tailor-made products to suit different
categories of people in terms of their levels of income, nature of profession and
93
needs. Therefore, the criticism that is voiced against the state monolith is on
grounds of „efficiency‟. It is believed that competition would lead to reduction
of costs (premium rates) and shall offer a wider choice of products to the
consumers. In consonance with these concerns, the reform process of Indian
insurance sector was initiated by the Government of India.
4.2. Reform Process of Insurance Sector in India
The Government of India constituted the Malhotra Committee to
examine and recommend the measures for the introduction of the reforms
process in the insurance sector. R.N. Malhotra, retired Governor of the Reserve
Bank of India, was named its Chairperson. The committee examined the
structure of the insurance industry and recommended changes to make it more
efficient and competitive, keeping in view the structural changes in other parts
of the financial system of the economy (Sharma and Agarwal, 2005). The
Government accepted the report of the Committee, which was submitted to the
Government in January 1994.
4.3 Recommendations of the Malhotra Committee
The Malhotra Committee had made certain recommendations to the
Government to change the face of the industry and to give it a more meaningful
direction. Regarding the liberalization of the insurance industry, the Committee
made the following important recommendations:
(a) Private sector should be allowed to enter the insurance business:
The Committee had deliberated on the subject and the following issues
weighed in favour of opening the industry to competition:
Competition would lead to better customer service.
It would improve the quality and price of insurance products.
The entry of new players would lead to better penetration of the market.
When other wings of the financial sector like banking, mutual funds,
merchant banking, and non-banking financial sectors were exposed to
competition, there was no reason to keep insurance insulated.
Public view was converging towards competition in the insurance
sector.
94
As public sector insurance institutions had created a good pool of
professional talent and marketing network, there was no fear of they
being incapable of facing competition.
(b) No composite Insurance Companies:
The Committee recommended that no single company should be
allowed to transact both life and general insurance business. The Committee
had so recommended as life and general insurance are two different lines of
business, and prudence demands that there should not be any mixing up of
funds.
(c) Number of new entrants to be controlled:
The Committee felt that this step was necessary to control the cropping
up of small private sector companies and their wilting away during a financial
crisis.
(d) Minimum paid-up capital:
With a view to ensure that only companies with a good track record in
their line of business apply for licenses to act as insurance companies, the
Committee recommended a paid- up capital of Rs.100 crore for the new
entrants. At the same time, the Committee felt that this requirement could be
lowered in cases where the promoters are state level co-operative institutions.
(e) Obligation to do business in rural areas and for weaker sections of the
community:
This stipulation was introduced to ensure a level-playing ground for all
insurance companies. New entrants may tend to concentrate on more lucrative
business to the neglect of the common people and the rural areas. To avoid this,
the Committee had recommended that both life and non-life companies should
procure a prescribed percentage of business from these segments.
(f) Selective entry to foreign companies:
The Committee felt that permitting foreign insurance companies would
be in the interest of the Indian economy, particularly in the context of
globalization. It recommended that entry to foreign companies should be on a
95
selective basis. Foreign companies entering India should be required to float an
Indian company, preferably as a joint venture.
(g) Technology upgradation:
The insurance has become an information-driven industry all over the
world. This, in effect, means heavy dependence on IT and development of
computer support systems. The industry has to develop software to improve
effective customer service and claim management.
(h) Pension Sector:
To popularize the contribution to individual pension funds by self-
employed professionals, traders and workers in the unorganized sectors, the
Committee recommended income tax concessions up to a prescribed limit for
contribution to individual pension schemes floated and managed by insurance
companies. The Committee cited the nature of tax concessions available on
individual contributions to the pension funds and concessions available to
pension funds in the UK; it suggested that substantial concessions should also
be available for contributions to pension funds in India, and this should cover
schemes managed by all the insurance companies as well.
(i) Privatization of LIC and GIC:
The Committee felt that as a State-owned entity, LIC suffered many
operational constraints, and its flexibility and ability to respond to changing
situations was limited. Many of the constraints are due to the reason that, in the
eyes of law, LIC falls within the definition of 'State'. To overcome this
situation, LIC should be taken out of the definition of 'State'. To achieve this,
the share of the Government in the equity of LIC should be reduced to 50% or
to 49% as the Government had decided in the case of certain PSUs. To enable
LIC to run as a board managed company with a dominant shareholding by the
Government, the shareholding pattern has to change, and LIC has to be
registered as a company under the Indian Companies Act.
As far as GIC is concerned, it was recommended that GIC should cease
to be a holding company of four of its subsidiaries, and should act as an Indian
Reinsurer under the Indian Insurance Act. It was further recommended that the
96
share capital of GIC should be raised to Rs.200 crore from its present level of
Rs.107.50 crore. Out of this, 50% of the equity should be held by the
Government and the rest by the Public at large, including employees of GIC.
As far as the four subsidiary companies are concerned, it was suggested that
they should function as independent companies run by a board. It was further
proposed that the equity capital of each of these companies should be raised to
Rs.100 crore with a 50% holding by the Government and the rest by the public
and the employees of the respective companies.
(j) Establishment of an Insurance Regulator:
While considering the implications of opening up the industry to
competition, the Committee also examined the role of the Controller of
Insurance, and the need for a regulatory body for the insurance sector. The
Controller of Insurance was vested with wide powers under the Indian
Insurance Act, 1938. With the progressive nationalization of the life and
general insurance sectors, the powers of the Controller of Insurance were
reduced as many of the functions were transferred to the nationalised
companies themselves or, wherever necessary, the Government itself started
exercising the powers directly. The Committee felt that this dispensation was
flawed even in the context of a State monopoly and would have to change in a
competitive environment. The Committee suggested restoring the office of the
Controller of Insurance to its full statutory powers and segregating it from the
Ministry of Finance. The Committee had also suggested setting up an Insurance
Regulatory Authority as a multi-member body and as a highly professional and
compact organisation with adequate IT support, similar to the Securities and
Exchange Board of India (SEBI). With this in view, the Committee proposed
the establishment of a powerful and autonomous regulatory body on the lines
of SEBI. The Committee also further stated that the regulatory authority should
have full functional autonomy and operational flexibility to discharge its
functions in a free and fair manner (Narayanan, 2006).
97
4.4. Mukherjee Committee Report
Immediately after the publication of the Malhotra Committee Report, a
new committee(called the Mukherjee Committee) was set up to make concrete
plans for the requirements of the newly formed insurance companies.
Recommendations of the Mukherjee Committee were never made public. But,
from the information that filtered out it became clear that the committee
recommended the inclusion of certain ratios in insurance company balance-
sheets to ensure transparency in accounting. But the Finance Minister objected.
He argued (probably on the advice of some of the potential entrants) that it
could affect the prospects of a developing insurance company (Banga, 2007).
4.5 Insurance Regulatory Authority (IRA)
Based on the recommendations of the Committee, the Government
constituted an interim authority, called the Insurance Regulatory Authority, to
look into the implementation aspects of the report. The Authority comprised a
Government nominee and a member each from the life and general insurance
industries. The primary task of the Authority was to frame regulations on its
functioning and act as the insurance regulator. Subsequently, based on the
recommendations of a standing committee, the Authority was vested with the
responsibility of developing the insurance business in India and also train and
develop professionals and intermediaries for the purpose. In August 1997,
when the Insurance Regulatory Authority Bill was piloted in the Lok Sabha, it
could not be passed. The Bill was strongly criticized and denounced and had to
be withdrawn.
4.6 Insurance Regulatory and Development Authority (IRDA)
The IRA Bill, renamed as Insurance Regulatory and Development
Authority Bill, 1998 was passed by the Lok Sabha on December 2, 1999 and
subsequently by the Rajya Sabha on December 7, 1999, and notified on
December 29, 1999. The enactment of the Insurance Regulatory and
Development Authority Act, 1999 ended the State monopoly of the sector. The
IRDA, as an autonomous body, was constituted on April 19, 1999 vide
Government of India notification no. 277. The Act vested the IRDA with the
98
responsibility of regulating and developing the business of insurance and re-
insurance in India.
The principal responsibility of the IRDA includes:
Framing various regulations governing the activities of the insurance
companies and corporations-both Indian and Indian companies with
foreign business partners.
Discharging the responsibility of the Controller of Insurance in opening
offices, licensing intermediaries, etc.
Monitoring the activities of the Tariff Advisory Committee (TAC),
divesting the GIC of its authority to transact non-life business and
designating it as the Indian Reinsurer.
Objectives of the Insurance Regulatory and Development Authority
(IRDA):
To protect the interest of and secure fair treatment to policyholders.
To bring about speedy and orderly growth of the insurance industry for
the benefit of the common man, and to provide long-term funds for
accelerating growth of the economy.
To set, promote, monitor and enforce high standards of integrity,
financial soundness, fair dealing and competence of those it regulates.
To ensure speedy settlement of genuine claim, to prevent insurance
frauds and other malpractices and put in place effective grievance
redressal machinery.
To promote fairness, transparency and orderly conduct in financial
markets dealing with insurance and build a reliable management
information system to enforce high standards of financial soundness
amongst market players.
To take action where such standards are inadequate or ineffectively
enforced.
To bring about optimum amount of self-regulation in day-to-day
working of the industry consistent with the requirement of prudential
regulation (Annual Report of IRDA 2002-03).
99
Functions of Insurance Regulatory and Development Authority:
The IRDA has been established to perform the following regulatory
functions:
Issue and withdraw licenses.
Specify qualification codes of conduct and training for
intermediaries and agents.
Specify the form and manner in which books of accounts shall be
maintained.
Regulate investment of insurance funds.
Specify and percentage of life insurance business to be undertaken
by the insurer in both rural and social sectors.
Approve the appointment of the managing directors (Ali et al.,2007).
The IRDA began functioning on April 19, 2000 with N. Rangachary as
its first Chairperson and with 4 full-time directors and 2 part-time directors, in
addition to the 25-member Insurance Advisory Council. The members of the
council represented various industries and professions. The IRDA appointed its
first advisory panel with 23 members on May 25, 2000.
4.7 Insurance Councils
The insurance councils that were in existence under the provision of the
Indian Insurance Act 1938, were not effective and practically defunct during
the days of State monopoly. After the advent of the IRDA in February 2001,
vide the power vested in it under Sections 64C and 64F of the Insurance Act,
1938, the IRDA revived the Life Insurance Council and the General Insurance
Council. These two councils, each headed by a member of the IRDA, play
significant roles in establishing industry standards. As a need was felt for the
constitution of an appellate authority for the various decisions of the IRDA, on
the lines of the Securities Appellate Tribunal, the Government notified the
setting up of an appellate authority for the insurance industry, and also set up a
single bench and a division bench; it is expected that shortly a full-fledged
appellate body would be set up as envisaged in the Law Commission Report on
the subject.
100
Regulation of insurance is not an exclusive Indian phenomenon.
Insurance is amongst the highly regulated businesses in the world.
Interestingly, a view is strongly emerging that, in India, the insurance council
representing the industry and the IRDA should become a self-regulatory body
and address itself to issues relating to the management of the industry as is
being done in some countries abroad. However, some industry experts opine
that while regulatory mechanisms are regaining lost ground in many countries,
as self-regulation had turned out to be a poor proxy, a switchover from well-
established regulatory systems to a liberal, self-regulatory mechanism might
not be in the interest of the customers.
4.8 Detariffication of Insurance Sector in India
Detariffication has been the most awaited reform in the general
insurance industry ever since the Malhotra Committee recommended gradual
removal of tariffs in the non-life insurance sector. The detariffing exercise has
two phases. The first phase started on January 1, 2007 when the IRDA allowed
companies to charge their own premium for all classes of business that had
been under a tariff till then. The exception was Motor Third Party Liability
Insurance for commercial vehicles. The second phase was started from 1st
January, 2009 as the General Insurance Companies have given more freedom
to design their own products. IRDA in its circular issued on November 6, 2008
has given the general insurance companies the freedom to offer certain covers
outside the scope of the descriptions in the erstwhile tariffs (GIC Re News,
2008).
The reforms have changed the whole scenario of Indian insurance
industry. Its character has changed altogether in the wake of transition from a
controlled to a competition-driven market. Several new players have entered
into the insurance business. The foreign insurers have entered through the joint
venture route. Their entry into the field has generated a tough competition in
the market which resulted into better customer service. The quality and price of
insurance products has greatly improved. The range of products and services
has increased so as to give a wider choice to the customers. Both the existing as
101

well as new players have got ample opportunities to penetrate into untapped
areas, sectors and sub-sectors and unexploited segments of population as
presently both insurance density and penetration are at a low level. Thus, the
reform process started in India has helped the insurance sector to grow in a
quick and orderly manner for the benefit of the common man.
102
References
Ali, S.; Mohammad, R.; and Masharique, A. (2007), "Insurance Sector in Post-
Liberalization, an Impact on Legal Framework" Insurance In India,
Regal Publications, New Delhi, pp.118-124.
Banga, J.S. (2007), "Market Strategies of General Insurance Companies in
India (A Study of Public Sector & Private Sector)," Ph.D. Thesis,
Submitted to Punjab School of Management Studies, Punjabi
University, Patiala.
GIC Re News (2008) "De-tarriffication in India. The Progress So Far" issue 01,
Vol.2, Dec., pp 5-6.
Narayanan, H. (2006), "Indian Insurance and Globalization", Indian Insurance:
A Profile, Jaico Publishing House, Mumbai, pp.94-101.
Rajan, A.K.; and Dhunna, M. (2002), “Liberalization of Insurance Sector :
Social Implications”, Indian Management Studies Journal, Vol.6, No.1,
April, pp.109-118.
Sharma, M.K.; and Agarwal, P. (2005), “Globalization of Indian Insurance
Sector – The Emerging Scenario”, Indian Management Studies Journal,
Vol.9, No.2, Oct., pp.47-58.
Sinha, T. (2005), "An Analysis of the Evolution of Insurance in India", Centre
for Risk and Insurance Studies, Discussion Paper Series-III, pp. 1-68.
www.nottingham.ac.uk/business/cris/papers 2005-3.pdf Accessed on
Aug.10, 2008.
103