chapter iii method of investigation a. research...
TRANSCRIPT
34
CHAPTER III
METHOD OF INVESTIGATION
This chapter discusses sources of data, research design,
research setting, population and sample of research, variables and
indicators of research, methods of data collection, and methods of data
analysis.
A. Research Design
This research is quantitative in nature, because the result
of the students’ achievement in pre test and post test were
expressed in the language of mathematic, evaluated consequently
and also interpreted by appropriate statistical procedures. In this
term, quantitative data refers to the use of T-test.
Experimental Research is an attempt which conducted by
the researcher to maintain control over all factors that may affect
the result of an experiment. In doing this, the researcher attempts
to determine or predict what may occur. An experimental research
involved two groups: experimental group and control group. An
experimental group will receive a new treatment while control
group receives a usual treatment. According to Nunan, experiment
is designed to collect data in such a way that threats to the
reliability and validity of the research are ministered.1
1 David Nunan, Research Method in Language Learning,
(Cambridge: Cambridge University Press, 1992), p.47

35
Referring to this research, the experimental and control
group are consisting of seventh grade of SMPN 23 Semarang. The
experimental group received a new treatment by using Two Stay
Two Stray as cooperative learning technique while the control
group was treated conventionally. This study used pre-test and
post-test to measure both groups changes in the period before and
after receiving a treatment.
The design of the experiment could be described as
follows: 2
Figure 3.1 Research Design
Where:
E = experimental group
C = control group
01 = pre-test for experimental group
02 = post test for experimental group
03 = pre-test for control group
04 = post test for control group
X = treatment using Two Stay Two Stray technique
Y = treatment using conventional method
2 Suharsimi Arikunto, Prosedur Penelitian Suatu Pendekatan
Praktik, (Jakarta:Rineka Cipta, 2006), p. 86.
Pattern: E 01 X 02
C 03 Y 04
36
Based on the above pattern, the subjects of research were
classified into an experimental group (top line) and a control
group (bottom line). The quality of subjects was first checked by
pre-testing them (01 and 03). Then, the experimental treatment
(taught by using Two Stay Two Stray as cooperative learning
technique) was applied to the experimental group. This treatment
was symbolized as “X” while the control group was taught using
conventional method. This treatment was symbolized as “Y”. The
test was held in the form of written. Then, the results of post-test
(02 and 04) were computed statistically.
B. Research Setting
1. Subject and Place of the Research
This study was conducted at SMPN 23 Semarang
which is located at Mijen Semarang. The subject of this study
is the seventh grade of SMPN 23 Semarang in the academic
year of 2014/2015.
2. Time of the Research
This research was conducted from November 11th
to
23th 2014 on the first semester in the academic year
2014/2015, counted since the proposal is submitted until the
end of the research.

37
Table 1
List of Time of Study
No. Activity Month/ Week
November
3
rd 4
th 1
th 2
nd
1. Try-Out Class √
2. Experimental Class
a. Pre-Test √
b. Treatment √ √
c. Post-Test √
3. Control Class
a. Pre-Test √
b. Explaining √ √
c. Post-Test √
C. Source of Data
1. Population
According to Sukardi, population is all members of
well defined class of people, events and objects. Population
can be divided into two kinds, target of population and access
of population. Target of population is population that has been
planned in the research planning. And access of population is
population that can be accessed when the researcher
determined the number of population.3 The population of this
research is All 1st grade of SMPN 23 Semarang in the
Academic Year 2014/2015 which consists of four classes with
thirty two to thirty four students in each class.
3 Sukardi, Metodologi Penelitian Pendidikan, (Yogyakarta: Bumi
Aksara ,2010), p.53-54

38
2. Sample and Sampling Technique
Sample means apart of population that will be
observed, whose characteristic can represent and describe the
real population.4 Sample was done by taking the
subject/sample which is not based on strata, random, or area
but it is based on the consideration of a certain purpose.
Some reasons for using sample:
a. The large amount of population.
b. The observation that done for all unit of population may
damage.
c. Saving time, money, power.
d. Be able to give the comprehensive output
In this research, the researcher used cluster random
sampling in choosing the sample, because it is one of the
techniques that all individual of population may have the same
opportunity and have been chosen as the sample.5 The
researcher took two classes, VII A and VII B as the sample.
Each class has 32 students. The two classes were given the
same material but with different way. VII A as the
experimental class was taught by using cooperative learning
type of Two Stay Two Stray technique and VII B as control
class was taught conventional learning type of Direct Method.
4 Sugiharto, Teknik Sampling, ( Jakarta: Gramedia Pustaka Utama,
2003), 2nd
Ed, p. 2
5 Sukardi, Metodologi Penelitian Pendidikan, p.58
39
D. Variables and Indicators of Research
Every research requires variable since it roles is the
fundamental elements to support the study. The existences of
variable determine the outcome of the research itself. In
quantitative research, where variable are central and knowing the
right variable ought to be based on its appropriate definition. As
variable refers to Suharsimi Arikunto, it simply means the object
in which the research is focused.6
According to Sugiyono, research variable is an attribute,
characteristic, and value of person, object, or the variation of
activity which has been determined by researcher to observe and
take the conclusion. There are two types of variables based on the
term of causation:7
1. Independent Variable (X)
Sugiyono said that independent variable can be called
stimulus, predictor, or antecedent. Independent variable is
variable which has the influence or the cause of change or
make the existence of dependent variable. So, the independent
variable in this research is the use of Two Stay Two Stray as
cooperative learning technique in teaching learning process.
6 Suharsimi Arikunto, Prosedur Penelitian Suatu Pendekatan
Praktik, (Jakarta:Rineka Cipta, 2006), p. 118.
7 Sugiyono, Metode Penelitian Pendidikan (Pendekatan Kuantitatif,
Kualitatif dan R & D), (Bandung: Alfabeta, 2009), p.61
40
This variable affects the dependent variable throughout its
treatments. The indicators from this variable are:
a. Give a task to a small group of students.
b. Assign two persons as spy or pirate to see the answers of
other students and share with group.
c. Group assigns two persons from their group to stay
behind and share product or ideas with others who visit
their poster or station.
d. Discussing. The class discusses, first in groups and then
as a whole class. All of the groups in the class give an
interesting presentation of the topics studied.
e. Evaluation. In cases where groups pursued different
aspects of the same topic. Pupils and teacher evaluated
each group’s contribution to the work of the class as a
whole. Evaluation included either individual or group
assessment, or both.
2. Dependent Variable (Y)
Dependent variable is variable which is influenced or
became effect of the independent variable.8 Dependent
variable in this study is students’ understanding on narrative
reading rext. The researcher can measure it based on students’
score from the test, and the indicators are:
a. Identifying the definition of narrative text
8Sugiyono, Metode Penelitian Pendidikan (Pendekatan Kuantitatif,
Kualitatif dan R & D), (Bandung: Alfabeta, 2009), p.61

41
b. Identifying social function, generic structure, language
feature.
E. Methods of Data Collection
To get the accurate data, in this study the writer used two
ways to collect data, they are follows:
1. Test
Test is an instrument to collect the data that gives
response about the question in the instrument, and the students
have to show their ability.9 In another word, test means a
question which is used to measure competence, knowledge,
intelligence, and ability of talent which is possessed by
individual or group to collect data.10
The writer gathered the data by analyzing the test
based on the material of narrative reading text. He gave the
test twice (pre-test and post-test) in both experimental and
control class.
a. Pre-Test
Before the teacher explained material by using
cooperative leaning type of Two Stay Two Stray
technique, the teacher gave pre-test to experimental and
9 Purwanto, Evaluasi Hasil Belajar, (Yokyakarta: Pustaka Belajar,
2009), p. 65.
10 M. Chabib Thoha, Teknik Evaluasi Pendidikan (Jakarta: PT Raja
Grafindo Persada, 2001), p. 43.
42
control class in same way. It was given before the
experiment was run.
b. Post-Test
Post-test was given to the experimental class and
the controlled class. It was given in order to know
students’ understanding and score on degrees of
comparison after they were taught using cooperative
learning type of Two Stay Two Stray technique
(experimental class) and conventional method (control
class).
The score of students’ achievement can be
calculated by using this following formula:11
%100xquestionsofnumberThe
answerrightofnumberTheScore
2. Documentation
Besides data from result of the test, the documentation
is needed to help the researcher conducted research.
According to Arikunto, the documentation method is used to
look for the data concerning matters or the variable that took
the form of the note, transcript, book, newspaper, magazine,
inscription, notes of a meeting, agenda, etc.12
11
Suharsimi Arikunto, Prosedur Penelitian Suatu Pendekatan
Praktek, (Jakarta: PT Rineka Cipta, 2006), p.235.
12Suharsimi Arikunto, Prosedur Penelitian Suatu Pendekatan
Praktek, (Jakarta: PT Rineka Cipta, 2006), p.274
43
The researcher used the documents related to the
object of research such as students’ name list, the number of
students, lesson plan, English subject schedule, etc.
F. Data Analysis Technique
The data analysis method which used in this research is
quantitative analysis. Quantitative is concerned with the amount
or number.
1. Try-Out Instrument
Try out test analysis is meant to get the validity,
reliability, index difficulty and discriminating power. The try
out test was given to VII A of the students of SMPN 23
Semarang. After finishing the test, the answer sheets were
collected in order to be scored. From 30 items test of tryout,
some items were chosen as the instrument of the test. The
choosing of the instrument had been done by considering:
validity, reliability, the degree of test difficulty and
discriminating power as follows:
a. Validity
The validity is an important quality of any test. It
is a condition in which a test can measure what is
supposed to be measured. According to Arikunto, “A test
is valid if it measures what it purpose to be measured”.13
13
Suharsimi Arikunto, Prosedur Penelitian Suatu Pendekatan
Praktek, (Jakarta: PT Rineka Cipta, 2006), p. 65.

44
The validity of an item can be known by doing item
analysis. It is counted using product – moment correlation
formula:
rxy =
2222 yyNxxN
yxxyN
Where:
rxy = the correlation of the scores on two halves of
the test
N = the number of students in group
X = the score of each component of test
Y = the total score of correct answers
X = the sum of total X score in each group
Y = the sum of total score from each student in the
group
XY = the sum of multiple score from each student
with the total score 2X = the sum of the square score in each
component of test 2Y
= the sum square of total score from each
student in the group.
Calculation result of rxy is compared with r table of
product moment by 5% degree of significance. If rxy is
higher than r table , the item of question is valid.14
14
Suharsimi Arikunto, Dasar-Dasar Evaluasi Pendidikan (Jakarta:
Bumi Aksara, 2007) 7th Ed, p. 78.
45
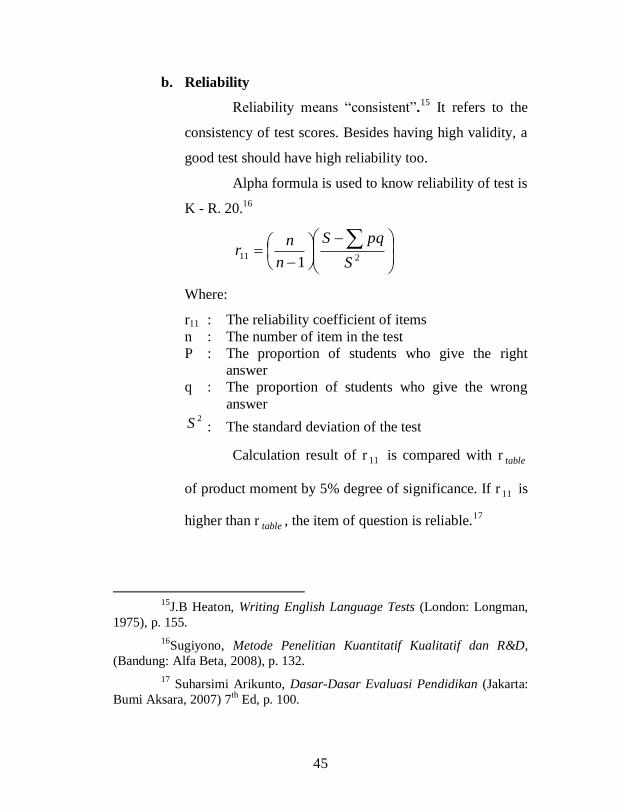
b. Reliability
Reliability means “consistent”.15
It refers to the
consistency of test scores. Besides having high validity, a
good test should have high reliability too.
Alpha formula is used to know reliability of test is
K - R. 20.16
211
1 S
pqS
n
nr
Where:
r11 : The reliability coefficient of items
n : The number of item in the test
P : The proportion of students who give the right
answer
q : The proportion of students who give the wrong
answer 2S : The standard deviation of the test
Calculation result of r 11 is compared with r table
of product moment by 5% degree of significance. If r 11 is
higher than r table , the item of question is reliable.17
15
J.B Heaton, Writing English Language Tests (London: Longman,
1975), p. 155.
16Sugiyono, Metode Penelitian Kuantitatif Kualitatif dan R&D,
(Bandung: Alfa Beta, 2008), p. 132.
17 Suharsimi Arikunto, Dasar-Dasar Evaluasi Pendidikan (Jakarta:
Bumi Aksara, 2007) 7th Ed, p. 100.

46
c. Index Difficulty
According to Arikunto, good question is not very
easy and is not very difficult. The easy question will not
stimulate the students to heighten their power in solve
problem. Conversely, the difficult question will make the
students be giving easily up and have not spirit try to
solve that problem on the question. Because they think
that the question is beyond the reach of their brain.18
Item analysis is carried out to find out the
effectiveness of the items. It means to check whether each
item meet the requirement of good test item or not.
To know the item difficulty, the writer used the
formula:
JS
BP
Where:
P = index of difficulty
B = the number of students who answer an item
correctly
JS = the total number of students
18
Suharsimi Arikunto, Dasar-Dasar Evaluasi Pendidikan (Jakarta:
Bumi Aksara, 2007) 7th Ed, p. 208.

47
The index of difficulty level can be classified as follows:19
0.00 < P 0.30 is difficult
0.30 < P 0.70 is medium
0.70 P 1.00 is easy
d. Discrimination Power
Item of discrimination power tells how well the
item performs in separating the better students from the
poorer students. If the good students tend to do well on an
item and the poor students do badly on the same item,
then the item is a good one because it distinguishes the
good students from the bad students. To calculate the
index of discriminating power, the writer used the
formula: 20
BA
B
B
A
A PPJ
B
J
BD
Where:
AJ = Number of all students in the upper group
BJ = Number of all students in the lower group
AB = Number of students in the upper group who
answered the item correctly
BB = Number of students in the lower group who
answered the item correctly
19
Suharsimi Arikunto, Dasar-Dasar Evaluasi Pendidikan (Jakarta:
Bumi Aksara, 2007) 7th Ed, p. 210.
20 Suharsimi Arikunto, Dasar-Dasar Evaluasi Pendidikan (Jakarta:
Bumi Aksara, 2007) 7th Ed, p. 213.
48
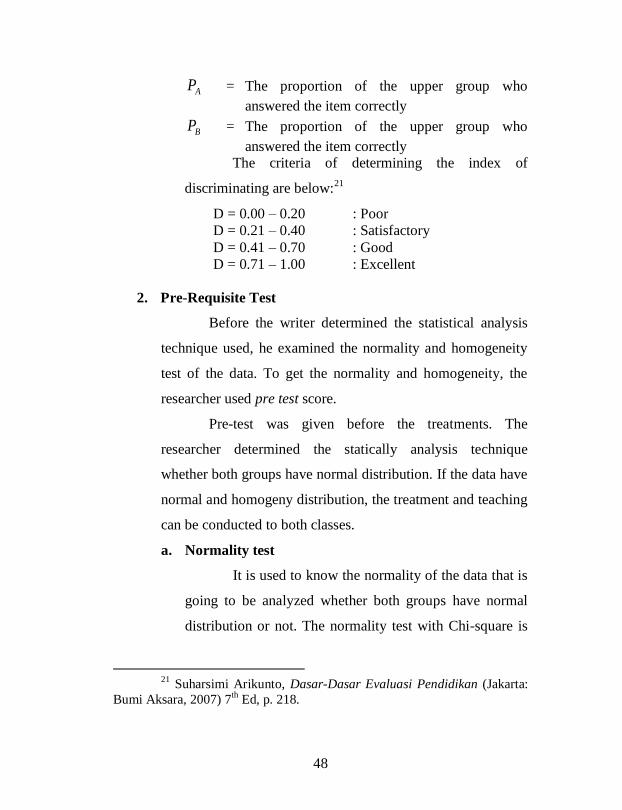
AP = The proportion of the upper group who
answered the item correctly
BP = The proportion of the upper group who
answered the item correctly The criteria of determining the index of
discriminating are below:21
D = 0.00 – 0.20 : Poor
D = 0.21 – 0.40 : Satisfactory
D = 0.41 – 0.70 : Good
D = 0.71 – 1.00 : Excellent
2. Pre-Requisite Test
Before the writer determined the statistical analysis
technique used, he examined the normality and homogeneity
test of the data. To get the normality and homogeneity, the
researcher used pre test score.
Pre-test was given before the treatments. The
researcher determined the statically analysis technique
whether both groups have normal distribution. If the data have
normal and homogeny distribution, the treatment and teaching
can be conducted to both classes.
a. Normality test
It is used to know the normality of the data that is
going to be analyzed whether both groups have normal
distribution or not. The normality test with Chi-square is
21
Suharsimi Arikunto, Dasar-Dasar Evaluasi Pendidikan (Jakarta:
Bumi Aksara, 2007) 7th Ed, p. 218.
49
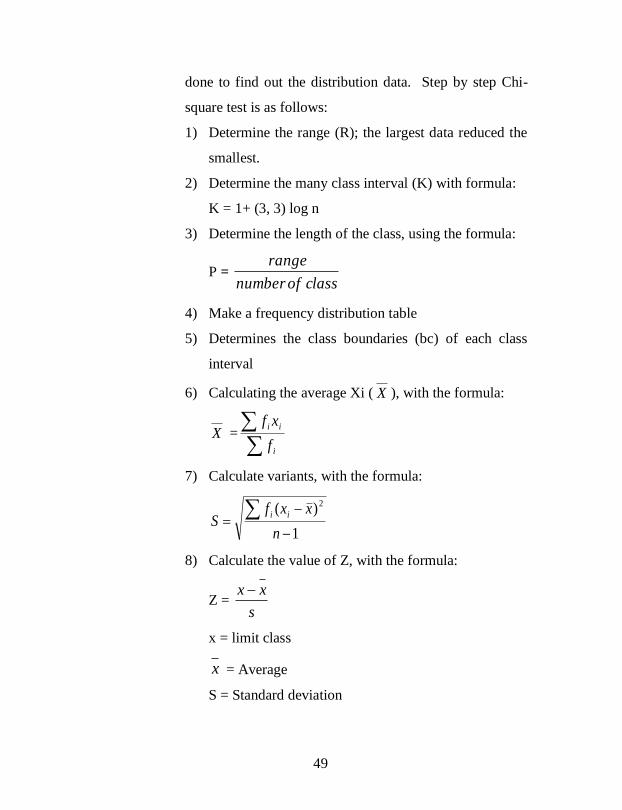
done to find out the distribution data. Step by step Chi-
square test is as follows:
1) Determine the range (R); the largest data reduced the
smallest.
2) Determine the many class interval (K) with formula:
K = 1+ (3, 3) log n
3) Determine the length of the class, using the formula:
P = classofnumber
range
4) Make a frequency distribution table
5) Determines the class boundaries (bc) of each class
interval
6) Calculating the average Xi ( X ), with the formula:
X =
i
ii
f
xf
7) Calculate variants, with the formula:
1
)( 2
n
xxfS
ii
8) Calculate the value of Z, with the formula:
Z = s
xx
x = limit class
x = Average
S = Standard deviation
50
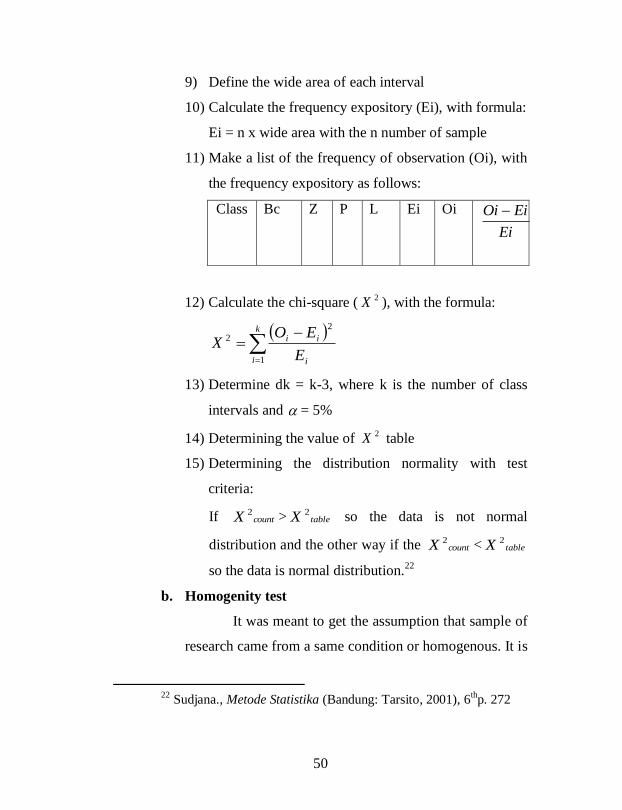
9) Define the wide area of each interval
10) Calculate the frequency expository (Ei), with formula:
Ei = n x wide area with the n number of sample
11) Make a list of the frequency of observation (Oi), with
the frequency expository as follows:
Class Bc Z P L Ei Oi
Ei
EiOi
12) Calculate the chi-square ( 2X ), with the formula:
k
i i
ii
E
EOX
1
2
2
13) Determine dk = k-3, where k is the number of class
intervals and = 5%
14) Determining the value of 2X table
15) Determining the distribution normality with test
criteria:
If countX 2 > tableX 2 so the data is not normal
distribution and the other way if the countX 2 < tableX 2
so the data is normal distribution.22
b. Homogenity test
It was meant to get the assumption that sample of
research came from a same condition or homogenous. It is
22
Sudjana., Metode Statistika (Bandung: Tarsito, 2001), 6thp. 272
51
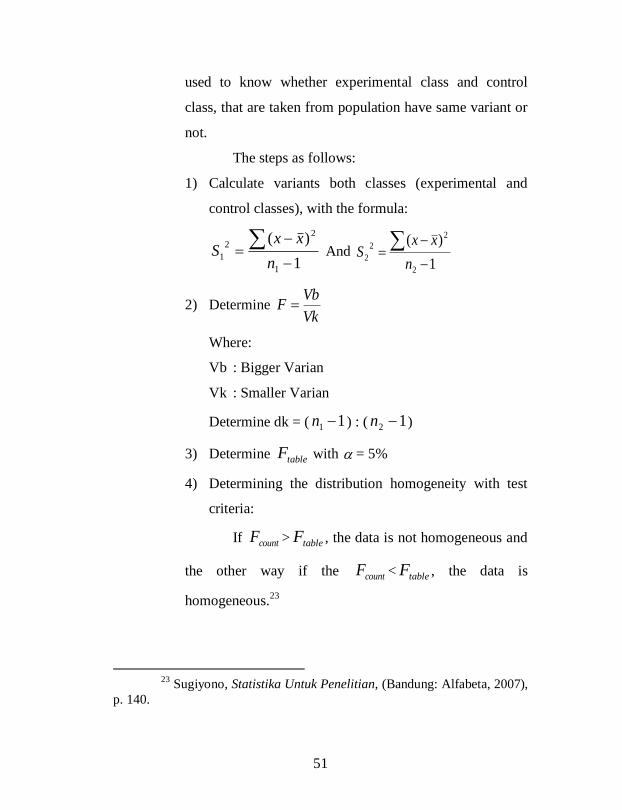
used to know whether experimental class and control
class, that are taken from population have same variant or
not.
The steps as follows:
1) Calculate variants both classes (experimental and
control classes), with the formula:
1
)(
1
2
2
1
n
xxS And
1
)(
2
2
2
2
n
xxS
2) Determine Vk
VbF
Where:
Vb : Bigger Varian
Vk : Smaller Varian
Determine dk = ( 11 n ) : ( 12 n )
3) Determine tableF with = 5%
4) Determining the distribution homogeneity with test
criteria:
If countF > tableF , the data is not homogeneous and
the other way if the countF < tableF , the data is
homogeneous.23
23
Sugiyono, Statistika Untuk Penelitian, (Bandung: Alfabeta, 2007),
p. 140.

52
c. Test of the Average
It is used to examine average whether
experimental group and control group have been decided
having different average. 24
T-test is used to analyze the data of this research.
A t-test would be measured you would use to compare the
mean scores of the two groups.25
If 12 = 2
2 (has same variant), the formula is:
21
21
11
nnS
XXt
With
2
)1()1(
21
2
22
2
11
nn
SnSnS
Where:
1X : The mean score of the experimental group
2X : The mean of the control group
n1 : The number of experimental group
n2 : The number of control group
S12 : The standard deviation of experimental group
S22 : The standard deviation of both groups
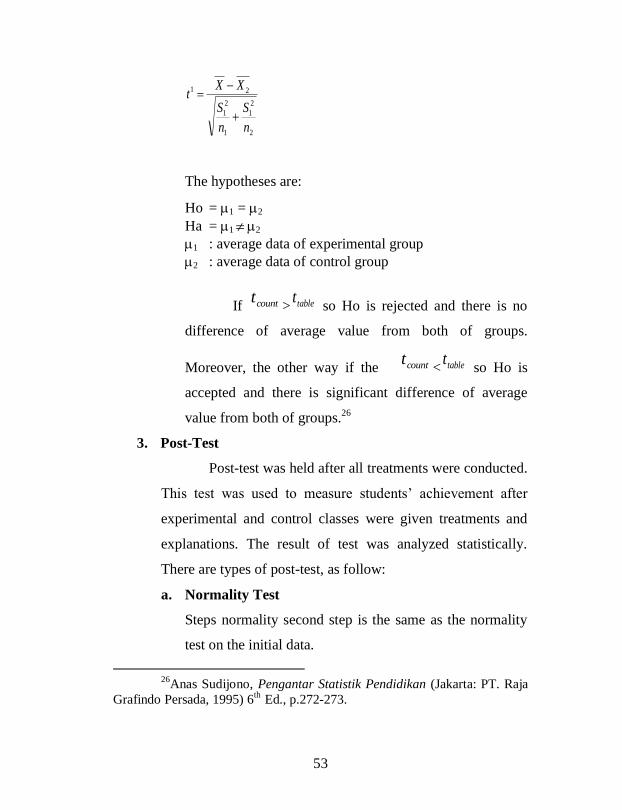
If = 122
2 (has no same variant) the formula is:
24
Anas Sudijono, Pengantar Statistik Pendidikan (Jakarta: PT. Raja
Grafindo Persada, 1995) 6th
Ed., p. 326-327.
25H. Douglas Brown, Language Assessment: Principles and
Classroom Practices, (San Fransisco: Longman, 2004), p. 205.
53
2
2
1
1
2
1
21
n
S
n
S
XXt
The hypotheses are:
Ho = 1 = 2
Ha = 1 2
1 : average data of experimental group
2 : average data of control group
If countt> tablet
so Ho is rejected and there is no
difference of average value from both of groups.
Moreover, the other way if the countt< tablet
so Ho is
accepted and there is significant difference of average
value from both of groups.26
3. Post-Test
Post-test was held after all treatments were conducted.
This test was used to measure students’ achievement after
experimental and control classes were given treatments and
explanations. The result of test was analyzed statistically.
There are types of post-test, as follow:
a. Normality Test
Steps normality second step is the same as the normality
test on the initial data.
26
Anas Sudijono, Pengantar Statistik Pendidikan (Jakarta: PT. Raja
Grafindo Persada, 1995) 6th
Ed., p.272-273.
54
b. Homogenity Test
Steps homogenity second step is the same as the
homogeneity test on the initial data.
c. Test Average (Right-hand Test)
This test proposed that hypothesis test in average
similarity with the right test as the steps right-hand test the
initial data.
G. Statistical Hypothesis
This study has a hypothesis, those are :
Ho: There is no differentiaton on average of students study
result taught by Two Stay Two Stray technique as
Cooperative Learning, with students study result taught
by Direct Method as Conventional Method.
Ha: There is differe ntiaton on average of students study
result taught by Two Stay Two Stray technique
Cooperative Learning, with students study result taught
by Direct Method Conventional Method.