chapter iii method of research a. research designeprints.walisongo.ac.id/6696/4/chapter iii.pdf ·...
TRANSCRIPT
29
CHAPTER III
METHOD OF RESEARCH
A. Research Design
In this research, the researcher focused on teaching students’
speaking skill in descriptive text. Considering the purpose of the
research and the nature of the problems, this research is a
quantitative one. According to Michael J. Wallace, states,
“Quantitative is broadly used to describe what can be counted or
measures and can therefore be consider objective.”1Also use the
experimental research to identify this research.
According to Arikunto, experiment is the way to look for the
cause of causal relationship between experimental class and control
class.2 It is to know the aims from using think pair share in
teaching speaking skill. The experimental research divided into
two groups; control group and experimental group. An
experimental group receive a new treatment and control group
receive a usual treatment.
According to Nunan, experiment is designed to collect data
such a way that treats to the reliability and validity of the research
is minimized.3 In this study also use pre-test and post-test.
1 Michael J. Wallace, Action Research for Language Teacher..,, p.
38 2 Suharsimi Arikunto, Prosedur Penelitian Suatu Pendekatan
Praktik, (Jakarta: Rineka Cipta, 2010), p. 9 3 David Nunan, Research Method in Language Learning,
(Cambridge: Cambridge University Press, 1992), p. 47

30
Table 3.1
Table of Pre-test and Post test
Group Pre-test Dependent
Variable Post-test
E O1 X O2
C O3 - O4
It is adopted from Juliansah Noor.4
Where:
E : the symbol for experimental class
C : the symbol for controlal class
O1 : pre-test for experimental class
O2 : post-test for experimental class
O3 : pre-test for control class
O4 : post-test for control class
X : Treatment for experimental class.
Based on the design above, subjects of the research can be
classified into an experimental group (top line) and control group
(bottom line). The quality of subjects can be checked by pre-testing
(01 and 03). Then, the experimental treatment (was taught by using
think pair share technique) was applied into the experimental
group. The treatment is symbolized as “X”. While, the control
group was teach without using TPS technique. The test was held in
the form of speaking. The results of post-test (02 and 04) was
computed statistically.
4Juliansah Noor, Metodologi Penelitian,(Jakarta: Kencana, 2011),
p.117.

31
B. Research Setting
a. Place of the Research
This study was conducted at MA Sunan Kalijaga
Bawang Batang. The subject of this study is the students of
tenth grade of MA Sunan Kalijaga Bawang in the academic
year of 2015/2016. This research was conducted in second
semester. To limitation of time, the researcher did not take all
students as the subjects of the study, but draw a sample.
b. Time of the Research
The researcher conducted this research on second
semester. It was begun on March 28th, 2016 until April 30
th,
2016.
C. The Subject of the Research
This study was conducted in MA Sunan Kalijaga Bawang
located at Jl. Sunan Kalijaga Bawang Batang 51274. The subjects
of this study are the tenth grade students of MA Sunan Kalijaga
Bawang Batang in the academic year 2015/2016. This study was
conducted in second semester. To limitation of time, the researcher
do not took all students as the subjects of the study, but draw a
sample.
a. Population
The population of this research is the tenth grade students
of MA Sunan Kalijaga Bawang Batang in the academic year
of 2015/2016. The total population are 120 students divided
into X 1, 2, 3 and 4. Every class consists of 30 students.

32
b. Sample
Sample means apart of population that will be observed.
It is called sample research when we want to generalize the
sample research result.5 In this study, the researcher is
selected two groups of students from the population as sample
of research. There are two classes as sample, experimental
class and control class.
c. Sampling
Technique in taking over sample is called sampling.6In
this research, the object of the research was taken by using
simple random sampling. It is equal chance to be chosen for
each individual or unit in whole populations.
In this school, the students of the tenth grade are
divided into 4 classes where each class consists of about 30
students. Therefore, the total number of the population is
about 120 students. They were experimental class and control
class as the participants of this study. The researcher took two
classes, X.1 and X.2 as the sample. The two classes have been
given the same material but with different way. X.1 as the
experimental class has been taught by using Think Pair Share
(TPS) Technique and X.2 as control class has been taught
5 Suharsimi Arikunto, Prosedur Penelitian: Suatu Pendekatan
Praktik..,,p. 174 6Sugiyono, Metode Penelitian Pendidikan (Pendekatan Kuantitatif,
Kualitatif dan R&D),(Bandung: Alfa Beta, 2008), p.118

33
without using Think Pair Share (TPS) Technique or using
lecturing method.
D. Research Variables
Brown states that “a variable is something that may vary or
differ. There are dependent, independent, moderator, control and
intervening variable.”7 This research considers two types of
variables; they are dependent and independent variable. According
to Brown, “a dependent variable is the variable of focus or the
central variable on which other variables will act if there is any
relationship. The independent variable is the variable selected by
the researcher to determine the relationship with the dependent
variable.”8
In this research, the variables are:
a. The independent variable (X)
Independent variable is variable has the influence or the
cause of change or make the existences of dependent variable.
So, the independent variable in this research is use of Think
Pair Share technique in teaching speaking skill.
The indicators as follows:
a. The teacher uses think pair share technique
7J.D. Brown, Understanding Research in Second Language
Learning: A Teacher’s Guide to Statistics and Research Design, (Cambridge:
Cambridge University Press, 1988), p. 7 8J.D. Brown, Understanding Research in Second Language
Learning: A Teacher’s Guide to Statistics and Research Design..,, p. 10
34
b. The teacher explains the objective of the learning.
c. The teacher explains the role of think pair share
technique.
d. The teachers ask students to do the task by think pair
share technique
b. The dependent variable (Y)
Dependent variable is variable which is influenced or
became effect of the independent variable.9 Dependent
variable in this research is students’ speaking skill. The
researcher can measure it based on students’ score from the
test and the indicators are:
1) Students’ pronunciation
2) Students’ grammar
3) Students’ fluency
4) Students’ vocabulary
5) Students’ comprehension.
E. Technique of Collecting Data
Method of data collection is very important in a research.
According to Arikunto data source in a research is basically source
of which a researcher gets data, depends on the necessary and kind
of information which is needed.10
9 Sugiyono, Metode Penelitian Pendidikan (Kuantitatif, Kualitatif
dan R&D)..,, p. 61 10
Suharsimi Arikunto, Prosedur Penelitian: Suatu Pendekatan
Praktik..,, p. 193

35
a. Test
In this research the researcher did the test because it can
to know how much are students’ ability. Test is an instrument
to collect the data response about the question in the
instrument and the students has to their ability.11
In another
word, test means a question which used to measure
competence, knowledge, intelligence and ability to talent
which is possesses by individual or group to collect data.12
The researcher was gathered the data by analyzing the
test. The researcher was gave the twice test (pre-test and post-
test) in both experimental and control class. Also gave a test
that consisted of oral test.
1) Pre-test
Before the teacher taught speaking by using Think
Pair Share technique, students was given pre-test to
experimental and control class in same way. It has given
before the experiment was run. It held on March 28th
2016 (experimental class) and March 29th 2016 (control
class).
2) Post-test
Post test was given to the experimental class and the
control class. The test has been given in order to know
11
Purwanto, Evaluasi Hasil Belajar, (Yogyakarta: Pustaka Belajar,
2009), p. 65 12
M. Chabib Thoha, Teknik Evaluasi Pendidikan, (Jakarta: PT. Raja
Grafindo Persada, 2001), p. 43

36
students’ understanding and score on speaking after they
will be taught using Think Pair Share technique
(experimental class on April 11th 2016) and without using
think pair share technique (control class on April 14th
2016).
b. Scoring Technique
The researcher was given speaking test to the students to
analyze their scores on pronunciation, grammar, vocabulary,
fluency and comprehension. In giving scores to the students,
the researcher uses analytic scale which categorized by some
categories and the researcher follows and each item criteria
for each category. This analytic score has five items and each
item scores five. So, the maximum score is 25. But it was
multiplied with 4, so the final maximum score be 100.
Table 3.2
Analytic Scoring of Speaking
Aspects Score Description
Pronunciation
5 Have few traces of foreign accent.
4 Always intelligible, though one is
conscious of a definite accent.
3 Pronunciation problem necessitate
concentrated listening and
occasionally lead to
misunderstanding.
2 Very hard to understand because of

37
pronunciation problems, must
frequently be asked to repeat.
1 Pronunciation problems so severe as
to make speech virtually
unintelligible.
Grammar
5 Makes few (if any) noticeable errors
of grammar and word order.
4 Occasionally makes grammatical
and/or word order errors which do
not, however obscure the meaning.
3 Make frequent errors of grammar and
word order which occasionally
obscure meaning.
2 Grammar and word order errors make
comprehension difficult. Must often
rephrase sentences and/or restrict
himself to basic patterns.
1 Errors in grammar and word order so,
severe as to make speech virtually
unintelligible.
Vocabulary
5 Use of vocabulary and idiom is
virtually that of a native speaker.
4 Sometime uses inappropriate terms
and/or must rephrase the idea because
of lexical inadequate.

38
3 Frequently uses the wrong words;
conversation somewhat limited
because of inadequate vocabulary.
2 Misuse of word and very limited
vocabulary make comprehension
quite difficult.
1 Vocabulary limitations so extreme as
to make conversation virtually
impossible.
Fluency
5 Speed as fluent and effortless as that
of a native speaker.
4 Speed of the speech seems to be
slightly affected by language
problem.
3 Speed and fluency are rather strongly
affected by language problems.
2 Usually hesitant; often forced into
silent by language limitations.
1 Speech is so halting and fragmentary
as to make conversation.
Comprehension 5 Appears to understand everything
without difficulty.
4 Understand nearly everything at
normal speed, although occasionally

39
repetition may be necessary.
3 Understand most of what is said at
slower than normal speed with
repetition.
2 Has great difficulty following what is
said. Can comprehend only “social
conversation” spoken slowly with
frequently repetitions.
1 Can’t be said to understand even
simple conversation virtually
impossible.
Based on “Testing English as Second Language”13
F. Technique of Data Analysis
There were two kinds of test that held in experimental
research, they were pre-request test, and hypothesis test. So there
could be two process of analyzing the data collected from test.
a. Pre-request Test (Pre-test)
Before the researcher determined the statistical analysis
technique used, the researcher examined the normality and
homogeneity test of the data.
a) Normality test
Normality test used to know the normality of the data that
is going to be analyzed whether both groups have normal
13
David P. Haris, Testing English as a Second Language..,, p. 84

40
distribution or not. The Normality test with Chi-square is
done to find out the distribution data. Step by step Chi-
square test is as follows:14
Figure 3.1
Formula of Normality Test
Where:
2
= Chi-kuadrat
iO
= Frequency that was obtained from data
iE
= Frequency that was hoped
Calculation result of ² is compared withtable by 5%
degree of significance, If ²count>²table the data is not
normal distribution and if ²count²table. So, the distribution
list is normal.15
b) Homogeneity Test
Homogeneity test is used to know whether
experimental class and control class, that are taken from
population have same variant or not. According to Nunan,
a test should be given to both classes of students before the
14
Sudjana, Metode Statistika, (Bandung: Tarsito, 2005), p.273
15Sudjana, Metode Statistika..., p. 273.
k
i i
ii
E
EO
1
2
2 )(
41
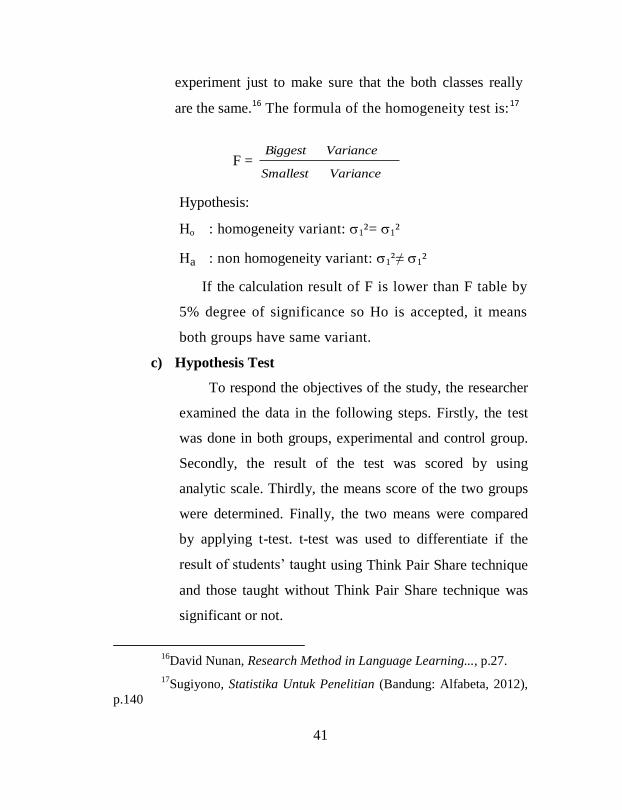
experiment just to make sure that the both classes really
are the same.16
The formula of the homogeneity test is:17
F = VarianceSmallest
VarianceBiggest
Hypothesis:
Ho : homogeneity variant: 1²= 1²
Ha : non homogeneity variant: 1²≠ 1²
If the calculation result of F is lower than F table by
5% degree of significance so Ho is accepted, it means
both groups have same variant.
c) Hypothesis Test
To respond the objectives of the study, the researcher
examined the data in the following steps. Firstly, the test
was done in both groups, experimental and control group.
Secondly, the result of the test was scored by using
analytic scale. Thirdly, the means score of the two groups
were determined. Finally, the two means were compared
by applying t-test. t-test was used to differentiate if the
result of students’ taught using Think Pair Share technique
and those taught without Think Pair Share technique was
significant or not.
16
David Nunan, Research Method in Language Learning..., p.27.
17Sugiyono, Statistika Untuk Penelitian (Bandung: Alfabeta, 2012),
p.140
42
t-test is used to examine average whether
experimental group and control group have been decided
having different average.18
t-test is used to analyze the data
of this research. It is used to measure or to compare the
mean scores of the two groups.19
Proposed hypothetical test in average similarity as follows:
Ho : µ1 = µ2
Ha : µ1 ≠ µ2
If 1² = 2² (has same variant), the formula is:
In measuring the research data, each experimental
design has its own formula to analyze the data. In order to
measure its significance, t-test was used.
When analyzing both result of control and
experimental groups through their mean, the formula used
is follows:20
18
Suharsimi Arikunto, Prosedur Penelitian Suatu Pendekatan
Praktik...,, p.311
19Suharsimi Arikunto, Prosedur Penelitian Suatu Pendekatan
Praktik...,, p.205
20 Suharsimi Arikunto, Prosedur Penelitian: Suatu Pendekatan
Praktik..,, p. 274

43
Figure 3.2
Formula of t-test
√
Where:
Figure 3.3
Formula of Standard Deviation
√( )
( )
Where:
s = standard deviation both of groups
x1 = the mean score of the experimental group
x2 = the mean of the control group
n1 = the number of experimental group students
n2 = the number of control group students
= the standard deviation of experimental group
= The standard deviation of control groups
Then, the result concluded, If-t table ≤ t count ≤ t table,
so that Ho accepted and Both Experimental class and
Control class had same average.21
21
Sudjana, Metode Statistika..,, p.239
44
b. Analyzing Phase End (Post-test)
To analysis post test score was used to test the truth which
stated that the average of student who taught speaking
descriptive text by using think pair share technique higher than
the average of student who taught speaking descriptive text by
using think pair share technique
The data analysis was the score of post-test speaking
descriptive text of experimental and control class. The steps to
examine the hypothesis are:
a) Normality Test
Normality test used to know the normality of the data
that is going to be analyzed whether both groups have
normal distribution or not after getting treatment. The step
was same as the normality test on the initial data.
b) Homogeneity Test
Homogeneity test is used to know whether
experimental class and control class, that are taken from
population have same variant or not after getting treatment.
The steps of homogeneity test are the same as the
homogeneity test on the initial data.
c) Hypothesis Test (Right-hand Test)
Hypothetical test in average similarity with the right
test (independent t-test) is as follows:
Ho : µ1< µ2
Ha : µ1 > µ2

45
µ1 : average data of experimental group
µ2 : average data of control group
If 1² = 2² (has same variant), the formula is:22
21
21
11
nns
xxt
Where:
2
)1()1(
21
2
22
2
11
nn
snsns
Where:
s = standard deviation both of groups
x1 = the mean score of the experimental group
x2 = the mean of the control group
n1 = the number of experimental group students
n2 = the number of control group students
= the standard deviation of experimental group
= The standard deviation of control groups
Testing criteria that apply Ho is accepted if >
With determinate df = ( ) and the significant
α = 5% (1-α).
22
Sudjana, Metode Statistika..,, p. 239