chapter ii the pervasiveness of non-tariff measures in ... - chapter ii. the... · 27 chapter ii...
TRANSCRIPT
27
Chapter II
The pervasiveness of non-tariff measures in ASEAN – evidences
from the inventory approach23
By Mitsuyo Ando24 and Ayako Obashi
Introduction
It is widely recognized that non-tariff measures (NTMs) are more economically
harmful to the world trading system and individual countries than tariffs (Bosworth, 1999).
While tariffs have been reduced through multilateral trade negotiations, NTMs have emerged
as alternative measures to protect domestic industries, particularly in the 1970s and 1980s in
response to the drastic tariff reductions in developed countries. Tariff reduction/elimination
would become no doubt worthless if alternative trade impeding measures prevent trade
liberalization and deteriorate social welfare.
As tariffs basically take the form of ad valorem duties, which is said to indicate the
degree of protection, it is relatively easy to negotiate their reduction. On the other hand,
NTMs should include any measures other than tariffs that distort international trade or raise
the welfare cost, regardless of whether they are border or internal types of measures. Even
government policies with legitimacy under multilateral trading rules could doubtlessly
become disguised trade restrictions if they are intentionally implemented to protect domestic
industries. Moreover, the degree of protection induced by NTMs cannot be easily captured;
for instance, the degree of price increase is ambiguous in most cases, at least at a glance.
Such diversity and the non-transparent nature of NTMs make it very difficult to monitor and
control them, and at the same time, attract governments and industries seeking the protection
of domestic producers.
In the case of developing countries including the Association of Southeast Asian Nations
(ASEAN) member States, the existence of NTMs per se has not been sufficiently recognized.
Various non-tariff barriers (NTBs) to trade, however, seem to exist; they may include a few
trade-distorting measures such as impediments due to arbitrary interpretation or ad hoc
implementation of regulations without explicit rules and those, as a result, of insufficient
administrative ability.
This paper attempts to investigate the incidence of NTMs in ASEAN by industries as
well as by types of NTMs, employing one of the inventory approaches, the frequency ratio
measure. More specifically, the paper attempts to identify which types of NTMs are
implemented, how pervasively they are applied, and which industries are more widely
protected than others. The diversity and non-transparent nature of NTMs do cause inevitable
23
The authors would like to thank participants in the Asia-Pacific Trade Economists‘
Conference ―Trade-led Growth in Times of Crisis‖ Celebrating the 5th
Anniversary of
ARTNeT held on 2-3 November 2009 in Bangkok for helpful comments. 24
Corresponding author: Mitsuyo Ando, Faculty of Business and Commerce, Keio
University, 2-15-45 Mita, Minato-ku, Tokyo 108-8345, Japan; tel: +81-3-3453-4511 (ext.
23174), fax: +81-3-5427-1578; E-mail: m-ando‖at‖fbc.keio.ac.jp

28
difficulties in identifying them and assessing their effects as discussed above. It is, however,
essential to capture their pervasiveness for a better understanding of the current incidence of
broadly defined NTMs as well as for a promotion of trade liberalization and facilitation in the
region. Trade liberalization and facilitation is particularly important for ASEAN countries to
further develop international production/distribution networks that have been rapidly formed
in East Asia, including ASEAN, since the 1990s.
The rest of the paper is organized as follows: the next section discusses the range and
data of NTMs and lists measures actually implemented in each ASEAN country. Using the
data explained in section A, section B examines the pervasiveness of NTMs in ASEAN.
Section C in turn briefly introduces ASEAN‘s efforts to establish the ASEAN Economic
Community (AEC), focusing on issues on NTMs, trade and investment facilitation, followed
by conclusion in section D.
A. The range and data of NTMs
1. Definition
Despite increasing concerns on NTM issues becoming a serious impediment to
international trade, there is no consensus on a definition of the explicit range of NTMs.
NTMs are composed of whichever measures other than tariffs that distort international trade,
regardless of whether they are border or internal types of measures. As mentioned in the
previous section, even government policies, the implementation of which is legitimate under
multilateral trading rules or can be justified with certain rational reasons, could become
disguised trade restrictions when they are intentionally implemented to impede trade or
protect domestic industries.
There is no unique classification, reflecting their diversity and non-transparent nature;
classifications of NTMs include those developed by the United Nations Conference on Trade
and Development (UNCTAD) and several scholars (e.g. Baldwin, 1970; Deardorff and
Stern, 1998) as well as in the GATT/WTO agreement and bilateral/regional agreements.25
The range of NTMs also varies among them: while the UNCTAD classification focuses only
on import-distorting measures, the classifications proposed by the above scholars cover not
only import-related measures, but also export-related measures and domestic policies that
may result in distorting international trade.26
2. Classification
Given the nature of NTMs as well as data deficiency, how to measure the incidence of
by-type NTMs depends on how to identify their range and how to classify them into the
corresponding types of measures. The classification of NTMs in this paper is based on the
UNCTAD Trade Analysis and Information System (TRAINS) Trade Control Measures
Classification because some ASEAN countries report information on NTMs to the ASEAN
25 See Ando (2005) for a comparison of the coverage of NTMs among different
classifications and multilateral/bilateral/regional trade agreements, and a frequency-ratio-
based analysis of the pervasiveness of NTMs in APEC member countries. 26 Given the nature of NTMs, their range would further expand if a government implements
any new measure aimed at protecting domestic industries from foreign competition (see
Bosworth, 1999; and PECC, 2000).
29
Secretariat according to the UNCTAD classification code number. UNCTAD classifies trade
control measures into eight categories: tariff measures; para-tariff measures; price control
measures; finance control measures; automatic licensing measures; quantity control
measures; monopolistic measures; and technical measures.27 All measures except tariff
measures are, by definition, NTMs. Out of seven categories, according to the UNCTAD
classification, price control measures, finance control measures, and quantity control
measures are defined as core NTMs, and the remainder are as non-core NTMs.28 While core
NTMs can be unambiguously identified as trade barriers, non-core NTMs are potentially
import-distorting measures in the sense that a government can implement them to
intentionally and indirectly protect domestic industries.
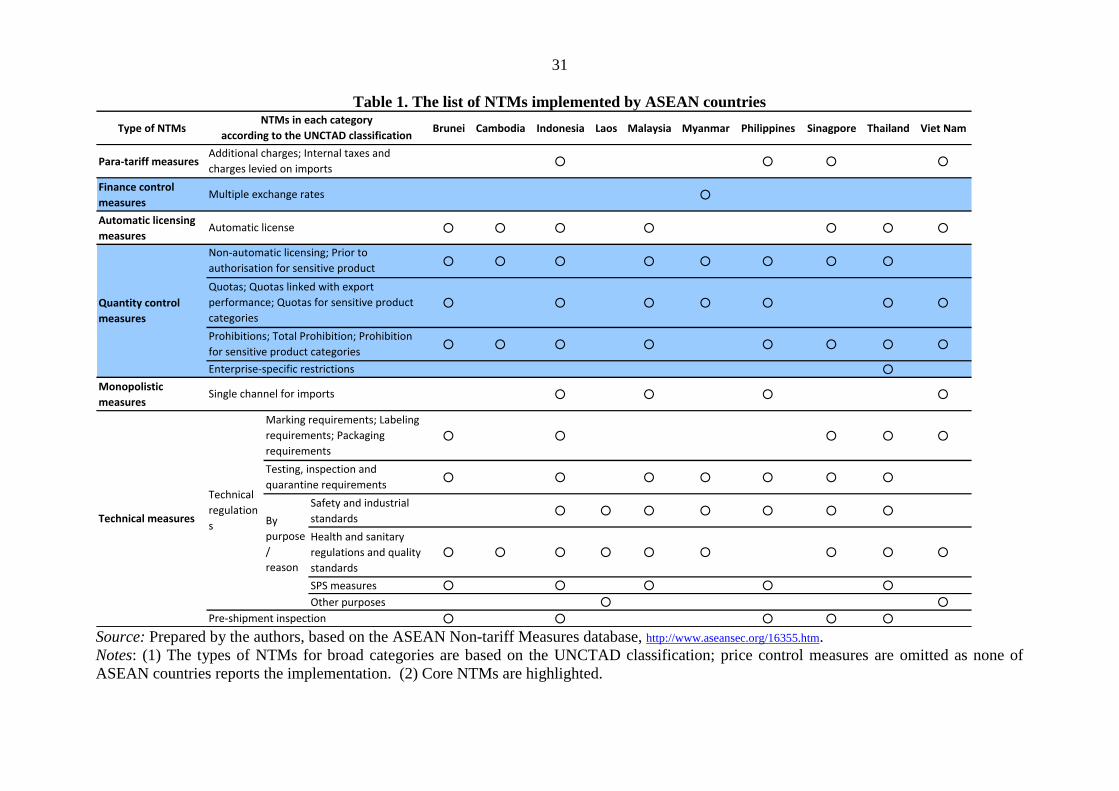
Table 1 reports the types of NTMs actually implemented by each ASEAN country,
based on the database to be explained in section A.3. As none of the ASEAN countries
reported the application of price control measures, this paper examines the pervasiveness of
six types of NTMs in the table. Among them, quantity control measures and technical
measures are further classified into more detailed sub-categories according to the
characteristics of measures. In particular, technical measures are divided into two sub-
categories, namely, technical regulations and pre-shipment inspection, and the former sub-
category is classified into more disaggregated groups according to the purpose/reason as well
as the type.29 Consequently, the set of NTMs is composed of five broad categories and 14
different types of NTMs at the most disaggregated classification in this paper (see Appendix
A for the detailed methodology of classification).30
3. Data description
ASEAN countries report a list of tariff lines subject to NTMs to the ASEAN
Secretariat, according to the ASEAN Harmonized Tariff Nomenclature (AHTN) codes that
10 ASEAN member countries have adopted in principle since 2004.31 For the analysis, we
construct the NTM dataset as follows: first, we categorize the list of NTMs that varies across
countries into our common classification. Then, we convert the data of the tariff lines subject
to NTMs based on our common classification into those at the Harmonized System (HS) six-
digit level, which is the internationally comparable and most disaggregated level. It is to be
27 For a description of measures as well as a list of measures classified into each category, see
the website of UNCTAD,
http://www.unctad.org/Templates/Page.asp?intItemID=2188&lang=1. 28 Unlike the UNCTAD classification, OECD (1997) defines price control measures and
quantity control measures as core NTMs. 29 Since the availability of the detailed information on purposes/reasons and/or the type of
technical regulations is different across countries, table 1 reports NTMs at the disaggregated
level only when such information is available. In addition, table 1 identifies ―inspection and
quarantine requirements for sanitary reasons‖ as both ―testing, inspection and quarantine
requirements‖ and ―health and sanitary regulations and quality standards‖. 30 Strictly speaking, we have 6 broad categories with 15 different types of NTMs. Financial
measures, however, are implemented only by Myanmar, which does not report information
on tariff lines subject to these measures, are basically omitted from our analyses in the next
section. 31 The data on NTMs are available from the website of ASEAN,
http://www.aseansec.org/16355.htm.

30
noted that information on NTMs are reported at several digit levels of commodity
classification (two, four, six, or eight digit levels), depending on the products.32
The most recent data available from the ASEAN Secretariat are those for 2007
according to the HS 2002 classification; exceptions are Singapore with data for 2006 and
Myanmar with the HS 1996 classification.33 There exist 5,224 tariff lines at the six-digit
level of the HS 2002 classification, and our interest is to uncover how many of them are
subject to NTMs by industries and by types of NTMs.
Note that the above-described information submitted by ASEAN countries to the
ASEAN Secretariat is on the voluntary notification basis. In other words, NTMs listed in
table 1 do not necessarily capture all the existing measures. While some countries provide
information on NTMs with detailed description of their procedures and purposes/reasons,
others may not fully recognize them as NTMs, may not sufficiently capture the actual
implementation, or may not be willing to report them; for instance, when the number of
reported NTMs is extremely limited such as the cases for Cambodia, Lao People‘s
Democratic Republic and Myanmar, only a little information on the implemented NTMs does
not necessarily indicate that the degree of trade protection is actually low.34 This kind of
analysis, however, is indispensable as the first step to uncover the existing NTMs.
As for the industry classification, 97 industries at the HS two-digit level are
aggregated into 21 industries, and for some analysis, they are further aggregated into six
industries as shown in the next section (see Appendix B for a more detailed description). The
aggregated six industries consist of animals, plants and foods (HS1-24), chemicals and
chemical products (HS28-40), light manufactured goods (HS41-71), metals and metal
products (HS72-83), machineries (HS84-92) and other products (HS25-27; HS93-97).
32 The AHTN is an eight-digit-commodity classification, based on the six-digit level of the
HS classification. This paper employs the HS classification since versions of AHTN seem to
be inconsistent among 10 ASEAN countries. 33 The data in the HS 1996 classification for Myanmar are converted into those in the HS
2002 classification. 34
In general, developing countries at the earlier stage of development are more likely to
employ tariffs rather than NTMs as a tool for protecting domestic industries. As will be
introduced in section C, tariffs for Cambodia and the Lao People‘s Democratic Republic are
higher than other ASEAN countries. Tariffs for Myanmar are not so high, but the country
implements trade distorting measures that severely prevent trade as discussed later.
31
Table 1. The list of NTMs implemented by ASEAN countries
Type of NTMs Brunei Cambodia Indonesia Laos Malaysia Myanmar Philippines Sinagpore Thailand Viet Nam
Para-tariff measures ○ ○ ○ ○
Finance control
measures○
Automatic licensing
measures○ ○ ○ ○ ○ ○ ○
○ ○ ○ ○ ○ ○ ○ ○
○ ○ ○ ○ ○ ○ ○
○ ○ ○ ○ ○ ○ ○ ○
○
Monopolistic
measures○ ○ ○ ○
○ ○ ○ ○ ○
○ ○ ○ ○ ○ ○ ○
Safety and industrial
standards○ ○ ○ ○ ○ ○ ○
Health and sanitary
regulations and quality
standards
○ ○ ○ ○ ○ ○ ○ ○ ○
SPS measures ○ ○ ○ ○ ○
Other purposes ○ ○
○ ○ ○ ○ ○
Quantity control
measures
Technical measures
Enterprise-specific restrictions
Single channel for imports
Technical
regulation
s By
purpose
/
reason
Marking requirements; Labeling
requirements; Packaging
requirements
Testing, inspection and
quarantine requirements
Non-automatic licensing; Prior to
authorisation for sensitive product
categoriesQuotas; Quotas linked with export
performance; Quotas for sensitive product
categories
Prohibitions; Total Prohibition; Prohibition
for sensitive product categories
Pre-shipment inspection
NTMs in each category
according to the UNCTAD classification
Additional charges; Internal taxes and
charges levied on imports
Multiple exchange rates
Automatic license
Source: Prepared by the authors, based on the ASEAN Non-tariff Measures database, http://www.aseansec.org/16355.htm.
Notes: (1) The types of NTMs for broad categories are based on the UNCTAD classification; price control measures are omitted as none of
ASEAN countries reports the implementation. (2) Core NTMs are highlighted.
32
B. The incidence of NTMs
This section analyses the pervasiveness of NTMs in ASEAN countries to identify
what sorts of NTMs are implemented, how pervasively they are applied, and which industries
are more widely protected than others. The section first introduces the methodology and then
discusses the current incidence of NTMs in ASEAN by type, industry and country.
1. Methodology
To assess the pervasiveness of NTMs, this paper employs the frequency ratio
measure, which is one of the inventory approaches, following previous studies in the
literature.35 Frequency ratio Fji for type j of NTM in industry i is calculated as follows:
Fji (per cent) = Tji / Ti・100,
where Tji and Ti are the number of tariff lines subject to type j of NTM in industry i and the
total number of tariff lines in industry i, respectively. Note that the ratio simply reflects the
pervasiveness of NTMs, regardless of whether and how much commodities are actually
imported, and does not suggest their impacts on prices, trade or welfare.36 Moreover, the
degree of import-distorting effects and protection effects, which would vary across measures,
cannot be taken into consideration. This inventory approach, however, is one of the most
useful and effective methods to capture the pervasiveness of NTMs.
2. By-type features
Table 2 presents frequency ratios, based on the HS six-digit classification, of by-type
NTMs for each ASEAN country as well as ASEAN as a whole, and those by six industries
for ASEAN as a whole. The table also shows the ratios for core NTMs and non-core NTMs.
The frequency ratio of 100 per cent in the table indicates that a country applies the
corresponding measure to all products (tariff lines). On the other hand, missing data (which
is represented as ‖..‖ ) in the table, indicates that a country does not report (implement) the
corresponding measure as an NTM.
The frequency ratios reported in table 2 provide three interesting insights.37 First, almost half
of the tariff lines (49 per cent) are, on average, subject to some type of NTMs, including
potentially disguised trade restrictions, suggesting that various direct and indirect trade
barriers do exist in ASEAN. Although the ratios for individual countries vary from 6 per cent
for Cambodia to 100 per cent for Indonesia, Myanmar and the Philippines, where at least one
35 See, for example, Laird and Yeats (1990), OECD (1997), PECC (2000) and Ando (2005).
As an alternative approach, some studies such as OECD (2003) exploit business surveys and
examine which types of NTMs are more serious impediments to the exporter than others. 36 To consider whether and how much concerned commodities are imported, some studies
employ import-weighted frequency measures (e.g. Bacchetta and Bora, 2001). Since we
cannot easily identify whether imports are zero or negligible due to low demand or serious
trade restrictions induced by NTMs, we may underestimate the incidence of NTMs in the
latter case when import-weighted measures are employed. 37 Strictly speaking, the data does not allow rigorous comparison across countries because of
the nature of original data. It is, however, valuable to some extent to sum up the information
for all ASEAN countries in order to capture the features of the incidence of NTMs in the
region.
33
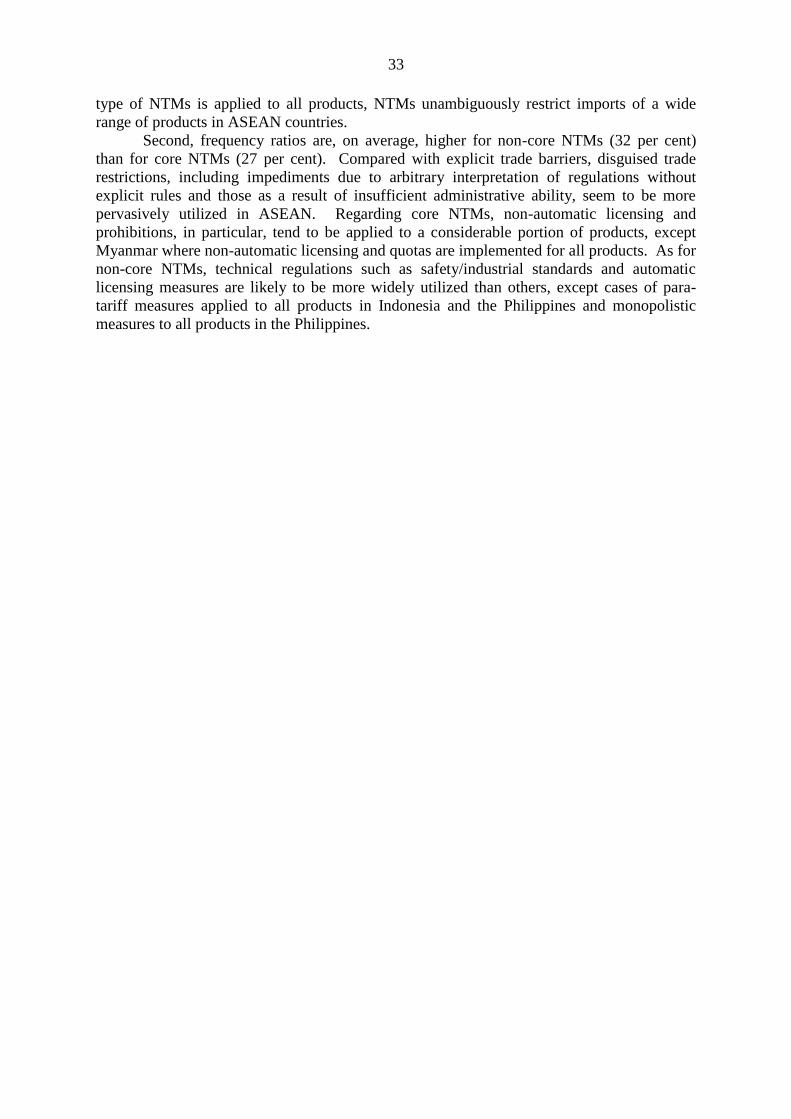
type of NTMs is applied to all products, NTMs unambiguously restrict imports of a wide
range of products in ASEAN countries.
Second, frequency ratios are, on average, higher for non-core NTMs (32 per cent)
than for core NTMs (27 per cent). Compared with explicit trade barriers, disguised trade
restrictions, including impediments due to arbitrary interpretation of regulations without
explicit rules and those as a result of insufficient administrative ability, seem to be more
pervasively utilized in ASEAN. Regarding core NTMs, non-automatic licensing and
prohibitions, in particular, tend to be applied to a considerable portion of products, except
Myanmar where non-automatic licensing and quotas are implemented for all products. As for
non-core NTMs, technical regulations such as safety/industrial standards and automatic
licensing measures are likely to be more widely utilized than others, except cases of para-
tariff measures applied to all products in Indonesia and the Philippines and monopolistic
measures to all products in the Philippines.

34
Table 2. The pervasiveness of NTMs in ASEAN: frequency ratio (per cent)
MLP TIQ SI HS SPS Oths.
ASEAN10, all industries
49 27 32 20 6 27 20 12 8 0 10 13 11 1 2 4 4 2 0 3
All industries: by country
Brunei 46 29 32 .. 24 29 18 13 2 .. .. 9 9 1 2 .. 4 5 .. 6
Cambodia 6 4 4 .. 0 4 4 .. 1 .. .. 3 3 .. .. .. 3 .. .. ..
Indonesia 100 45 100 100 15 45 28 7 34 .. 1 30 14 5 10 1 8 8 .. 21
Laos 20 .. 20 .. .. .. .. .. .. .. .. 20 20 .. .. 11 5 .. 4 ..
Malaysia 43 36 21 .. 1 36 34 0 3 .. 0 20 20 .. 3 2 15 8 .. ..
Myanmar 100 100 8 .. .. 100 100 100 .. .. .. 8 8 .. 2 5 0 .. .. ..
Philippines 100 5 100 100 .. 5 3 2 0 .. 100 19 17 .. 1 17 .. 0 .. 1
Singapore 27 21 14 2 6 21 7 .. 19 .. .. 9 8 7 0 7 0 .. .. 0
Thailand 11 4 9 .. 4 4 1 1 1 1 .. 4 4 0 3 1 3 0 .. 1
Viet Nam 34 22 14 1 7 22 .. 1 21 .. 1 7 7 0 .. .. 6 .. 0 ..
ASEAN10: by industry
Foods 63 29 51 20 5 29 26 13 1 1 10 36 35 3 9 0 27 14 0 9
Chemicals 59 39 36 20 8 39 27 14 16 . 10 9 9 1 2 5 2 0 1 0
Light mfg. 39 18 23 20 7 18 12 11 6 . 10 1 1 . 0 0 0 0 0 .
Metals 37 15 25 20 0 15 14 10 1 . 10 15 15 . 3 12 0 . . .
Machineries 48 30 33 21 7 30 20 14 12 . 10 17 10 3 1 9 . . 1 7
Others 48 24 28 21 2 24 19 10 5 . 12 5 5 0 2 2 2 1 2 .
Lic. Quota Proh. Ent.-
sp.
Overall
NTMs
Core
NTMs
Non-
core
NTMs
Para
-tar.
meas.
Tech. meas.
Tech. reg. PSI
Auto.
lic.
meas.
Mono.Quant. contr. meas.
Source: Authors‘ calculation based on the data obtained from the ASEAN Non-tariff Measures database, http://www.aseansec.org/16355.htm.
Note: Frequency ratios are calculated, using our original dataset at the six-digit level of the HS 2002 classification.

35
Third, some products are more likely to be highly protected than others through a
complicated manner by applying multiple NTMs. Both core and non-core NTMs are applied
to around 10 per cent of products on average, which is suggested by the fact that frequency
ratios are 49 per cent for overall NTMs, 27 per cent for core NTMs, and 32 per cent for non-
core NTMs, and the sum of the ratios for core and non-core NTMs exceeds the ratio for
overall NTMs. Individual countries, except Lao People‘s Democratic Republic, reveal a
similar trend or have a certain range of products subject to both core and non-core NTMs; for
instance, the corresponding overlaps are 45 per cent for Indonesia, 15 per cent for Brunei
Darussalam and 14 per cent for Malaysia. A non-negligible portion of products is highly
protected by implementing a combination of core and non-core NTMs. Moreover, some
products are subject to two or more measures within the same category of core/non-core
NTMs simultaneously. These imply a complicated structure of protection for some sensitive
products.
3. By-industry features
Tables 2 and 3 report frequency ratios by six industries for ASEAN as a whole and for
each country, respectively. The major findings on industrial characteristics include the
following two points: first, non-core NTMs, particularly health and sanitary regulations,
quality standards, and sanitary and phytosanitary (SPS) measures are widely applied mainly
to the industry of animals, plants and food. Second, several types of NTMs are
simultaneously utilized to protect industries of animals, plants and food, chemicals and
chemical products, and machineries, suggested by the fact that the sum of frequency ratios for
core and non-core NTMs significantly exceeds the ratio for overall NTMs in these industries.
Frequency ratios for non-core NTMs are outstandingly high in the industry of animals, plants
and food (51 per cent on average); for instance, by-country ratios are 100 per cent for
Indonesia and the Philippines, 92 per cent for Malaysia, and 57 per cent for Brunei
Darussalam. Moreover, both core and non-core NTMs are applied to more than half of the
products in Malaysia (59 per cent). Among non-core NTMs, a variety of technical
regulations are dominant in this industry, such as health/sanitary regulations and quality
standards in Malaysia (92 per cent) and Indonesia (52 per cent), testing/inspection/quarantine
in Indonesia (66 per cent), and SPS measures in Indonesia (55 per cent).
In the industry of chemicals and chemical products, frequency ratios for core NTMs
are significantly higher than those in other industries, particularly in Myanmar (100 per cent)
and Indonesia (92 per cent), followed by Malaysia (75 per cent), Singapore (58 per cent), and
Brunei Darussalam (56 per cent). In addition, a wide range of products in this industry are
subject to both core and non-core NTMs in Indonesia (92 per cent) and Brunei Darussalam
(56 per cent). Among core NTMs, quantity control measures (39 per cent on average),
mainly non-automatic licensing (27 per cent) and prohibitions (16 per cent), are typical.
Frequency ratios are particularly high for non-automatic licensing in Malaysia (67 per cent)
and Brunei Darussalam (55 per cent) and for prohibitions in Indonesia (80 per cent) and
Singapore (57 per cent).
The machinery industry appears to be highly protected in Indonesia and Brunei
Darussalam. In the case of Indonesia, 76 per cent of products in this industry are subject to
core NTMs, and 68 per cent are subject to both non-automatic licensing and prohibitions. As
for non-core NTMs, in addition to para-tariff measures covering all products, Indonesia
applies pre-shipment inspection (one of technical measures) to almost 70 per cent of the

36
products in this industry, resulting in a complicated structure of protection. While Brunei
Darussalam also has a notably high frequency ratio for overall NTMs (75 per cent), the way
of implementing NTMs is rather simple; almost half of the products are subject to core
NTMs, mostly quotas, and 31 per cent of the products are subject to automatic licensing
measures, which are part of non-core NTMs.
Table 3. The pervasiveness of NTMs by six industries: frequency ratio (per cent)
MLP TIQ SI HS SPS Oths.Brunei
Foods 75 31 57 .. .. 31 28 7 4 .. .. 57 57 .. 5 .. 23 35 .. 44Chemicals 79 56 79 .. 79 56 55 5 3 .. .. 3 3 3 3 .. 3 .. .. ..Light mfg. 7 7 5 .. 5 7 7 5 1 .. .. .. .. .. .. .. .. .. .. ..Metals 1 1 .. .. .. 1 .. .. 1 .. .. .. .. .. .. .. .. .. .. ..Machineries 75 49 31 .. 31 49 6 44 .. .. .. 2 2 .. 2 .. .. .. .. ..Others 14 13 7 .. 7 13 8 0 12 .. .. .. .. .. .. .. .. .. .. ..
Cambodia .. .. .. .. .. .. .. .. .. .. .. .. .. .. .. ..Foods 24 11 24 .. .. 11 11 .. .. .. .. 24 24 .. .. .. 24 .. .. ..Chemicals 7 7 .. .. .. 7 7 .. 3 .. .. .. .. .. .. .. .. .. .. ..Light mfg. 1 .. 1 .. 1 .. .. .. .. .. .. .. .. .. .. .. .. .. .. ..Metals .. .. .. .. .. .. .. .. .. .. .. .. .. .. .. .. .. .. .. ..Machineries 3 3 .. .. .. 3 3 .. .. .. .. .. .. .. .. .. .. .. .. ..Others 7 7 .. .. .. 7 7 .. .. .. .. .. .. .. .. .. .. .. .. ..
Indonesia .. .. .. .. .. .. .. .. .. .. .. .. .. .. .. ..Foods 100 46 100 100 5 46 46 3 2 .. 3 85 85 27 66 .. 52 55 .. 34Chemicals 100 92 100 100 .. 92 19 33 80 .. 1 9 9 6 6 3 3 .. .. 3Light mfg. 100 9 100 100 43 9 .. .. 9 .. .. 1 1 .. .. 1 .. .. .. ..Metals 100 1 100 100 1 1 1 .. .. .. .. .. .. .. .. .. .. .. .. ..Machineries 100 76 100 100 12 76 76 .. 68 .. .. 70 2 .. .. 2 .. .. .. 68Others 100 14 100 100 5 14 14 0 .. .. 14 .. .. .. .. .. .. .. .. ..
Laos .. .. .. .. .. .. .. .. .. .. .. .. .. .. .. ..Foods 34 .. 34 .. .. .. .. .. .. .. .. 34 34 .. .. .. 34 .. 1 ..Chemicals 52 .. 52 .. .. .. .. .. .. .. .. 52 52 .. .. 46 0 .. 6 ..Light mfg. 1 .. 1 .. .. .. .. .. .. .. .. 1 1 .. .. .. .. .. 1 ..Metals 15 .. 15 .. .. .. .. .. .. .. .. 15 15 .. .. 15 .. .. .. ..Machineries 8 .. 8 .. .. .. .. .. .. .. .. 8 8 .. .. .. .. .. 8 ..Others 21 .. 21 .. .. .. .. .. .. .. .. 21 21 .. .. 3 1 .. 17 ..
Malaysia .. .. .. .. .. .. .. .. .. .. .. .. .. .. .. ..Foods 93 60 92 .. 0 60 60 1 1 .. 1 92 92 .. .. 0 92 42 .. ..Chemicals 78 75 6 .. .. 75 67 .. 12 .. .. 6 6 .. .. 2 4 0 .. ..Light mfg. 17 16 4 .. 1 16 16 .. .. .. .. 3 3 .. .. 0 3 3 .. ..Metals 37 36 30 .. .. 36 36 .. .. .. .. 30 30 .. 29 1 .. .. .. ..Machineries 19 12 8 .. 3 12 11 .. 1 .. .. 5 5 .. .. 5 .. .. .. ..Others 34 32 17 .. .. 32 28 .. 3 .. .. 17 17 .. .. 2 15 14 .. ..
Myanmar .. .. .. .. .. .. .. .. .. .. .. .. .. .. .. ..Foods 100 100 3 .. .. 100 100 100 .. .. .. 3 3 .. .. .. 3 .. .. ..Chemicals 100 100 10 .. .. 100 100 100 .. .. .. 10 10 .. 10 .. .. .. .. ..Light mfg. 100 100 .. .. .. 100 100 100 .. .. .. .. .. .. .. .. .. .. .. ..Metals 100 100 .. .. .. 100 100 100 .. .. .. .. .. .. .. .. .. .. .. ..Machineries 100 100 24 .. .. 100 100 100 .. .. .. 24 24 .. .. 24 .. .. .. ..Others 100 100 .. .. .. 100 100 100 .. .. .. .. .. .. .. .. .. .. .. ..
Philippines .. .. .. .. .. .. .. .. .. .. .. .. .. .. .. ..Foods 100 21 100 100 .. 21 10 11 .. .. 100 14 4 .. 4 .. .. 4 .. 10Chemicals 100 .. 100 100 .. .. .. .. .. .. 100 .. .. .. .. .. .. .. .. ..Light mfg. 100 2 100 100 .. 2 .. .. 2 .. 100 0 0 .. 0 0 .. .. .. ..Metals 100 .. 100 100 .. .. .. .. .. .. 100 100 100 .. 3 100 .. .. .. ..Machineries 100 7 100 100 .. 7 7 .. .. .. 100 24 24 .. 1 24 .. .. .. ..Others 100 .. 100 100 .. .. .. .. .. .. 100 2 2 .. 2 2 .. .. .. ..
Singapore .. .. .. .. .. .. .. .. .. .. .. .. .. .. .. ..Foods 45 7 43 1 42 7 7 .. 1 .. .. 4 4 3 1 .. 1 .. .. 0Chemicals 58 58 4 .. 0 58 21 .. 57 .. .. 3 3 3 .. .. .. .. .. ..Light mfg. 0 0 .. .. .. 0 0 .. .. .. .. .. .. .. .. .. .. .. .. ..Metals 0 0 .. .. .. 0 0 .. .. .. .. .. .. .. .. .. .. .. .. ..Machineries 33 31 33 6 1 31 0 .. 31 .. .. 33 33 26 .. 33 .. .. .. ..Others 35 34 1 1 .. 34 32 .. 2 .. .. .. .. .. .. .. .. .. .. ..
Thailand .. .. .. .. .. .. .. .. .. .. .. .. .. .. .. ..Foods 25 13 21 .. .. 13 1 6 .. 6 .. 21 21 0 11 1 19 3 .. 5Chemicals 3 3 0 .. .. 3 2 .. 1 .. .. 0 0 0 0 .. 0 .. .. ..Light mfg. 15 1 14 .. 14 1 1 0 .. .. .. .. .. .. .. .. .. .. .. ..Metals 1 1 .. .. .. 1 .. .. 1 .. .. .. .. .. .. .. .. .. .. ..Machineries 4 2 3 .. 1 2 1 .. 0 .. .. 2 2 1 2 .. .. .. .. ..Others 27 9 18 .. 4 9 2 .. 7 .. .. 15 15 1 15 14 .. .. .. ..
Viet Nam .. .. .. .. .. .. .. .. .. .. .. .. .. .. .. ..Foods 32 1 31 2 3 1 .. 1 0 .. 1 27 27 .. .. .. 27 .. .. ..Chemicals 14 5 10 0 1 5 .. 2 2 .. 0 9 9 1 .. .. 9 .. 0 ..Light mfg. 52 49 3 .. 2 49 .. .. 49 .. 0 1 1 .. .. .. 1 .. .. ..Metals 13 6 7 .. 1 6 .. .. 6 .. 1 5 5 .. .. .. 5 .. .. ..Machineries 40 22 24 1 22 22 .. .. 22 .. 2 .. .. .. .. .. .. .. .. ..Others 38 29 11 4 3 29 .. 0 29 .. 4 5 5 .. .. .. 0 .. 5 ..
PSI
Auto.
lic.
meas.
Quant. contr. meas. Mono. Tech. meas.
Lic. Quota Proh. Ent.-
sp.
Tech. reg.
Overall
NTMs
Core
NTMs
Non-
core
NTMs
Para
-tar.
meas.
Source: Authors‘ calculation based on the data obtained from the ASEAN Non-tariff
Measures database, http://www.aseansec.org/16355.htm.
37
Note: Frequency ratios are calculated by six industries (broad category of industry), using our
original dataset at the six-digit level of the HS 2002 classification. See Appendix B for the
industry classification.
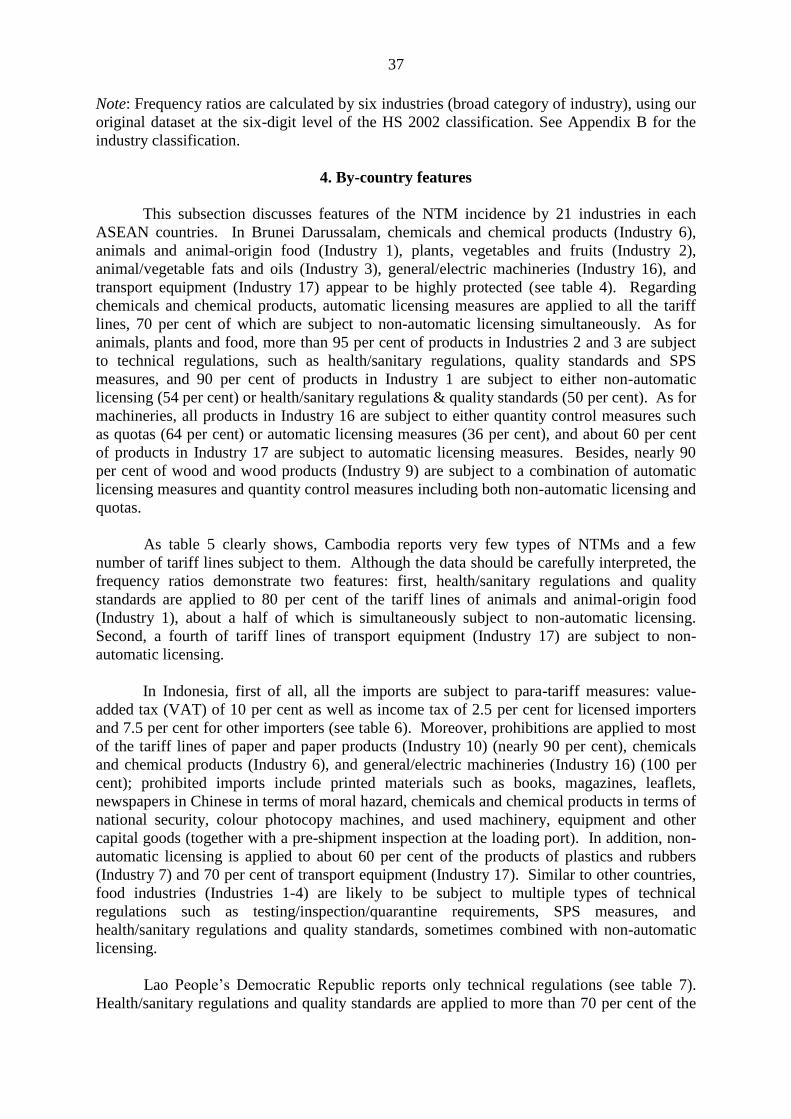
4. By-country features
This subsection discusses features of the NTM incidence by 21 industries in each
ASEAN countries. In Brunei Darussalam, chemicals and chemical products (Industry 6),
animals and animal-origin food (Industry 1), plants, vegetables and fruits (Industry 2),
animal/vegetable fats and oils (Industry 3), general/electric machineries (Industry 16), and
transport equipment (Industry 17) appear to be highly protected (see table 4). Regarding
chemicals and chemical products, automatic licensing measures are applied to all the tariff
lines, 70 per cent of which are subject to non-automatic licensing simultaneously. As for
animals, plants and food, more than 95 per cent of products in Industries 2 and 3 are subject
to technical regulations, such as health/sanitary regulations, quality standards and SPS
measures, and 90 per cent of products in Industry 1 are subject to either non-automatic
licensing (54 per cent) or health/sanitary regulations & quality standards (50 per cent). As for
machineries, all products in Industry 16 are subject to either quantity control measures such
as quotas (64 per cent) or automatic licensing measures (36 per cent), and about 60 per cent
of products in Industry 17 are subject to automatic licensing measures. Besides, nearly 90
per cent of wood and wood products (Industry 9) are subject to a combination of automatic
licensing measures and quantity control measures including both non-automatic licensing and
quotas.
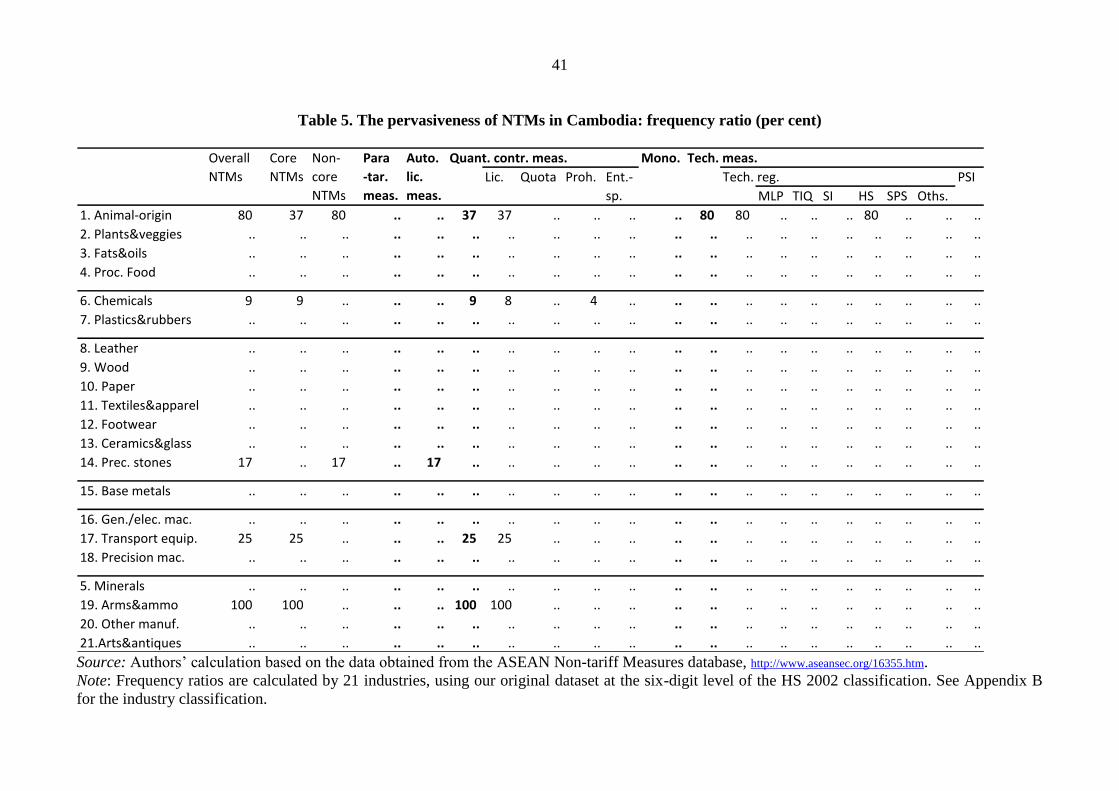
As table 5 clearly shows, Cambodia reports very few types of NTMs and a few
number of tariff lines subject to them. Although the data should be carefully interpreted, the
frequency ratios demonstrate two features: first, health/sanitary regulations and quality
standards are applied to 80 per cent of the tariff lines of animals and animal-origin food
(Industry 1), about a half of which is simultaneously subject to non-automatic licensing.
Second, a fourth of tariff lines of transport equipment (Industry 17) are subject to non-
automatic licensing.
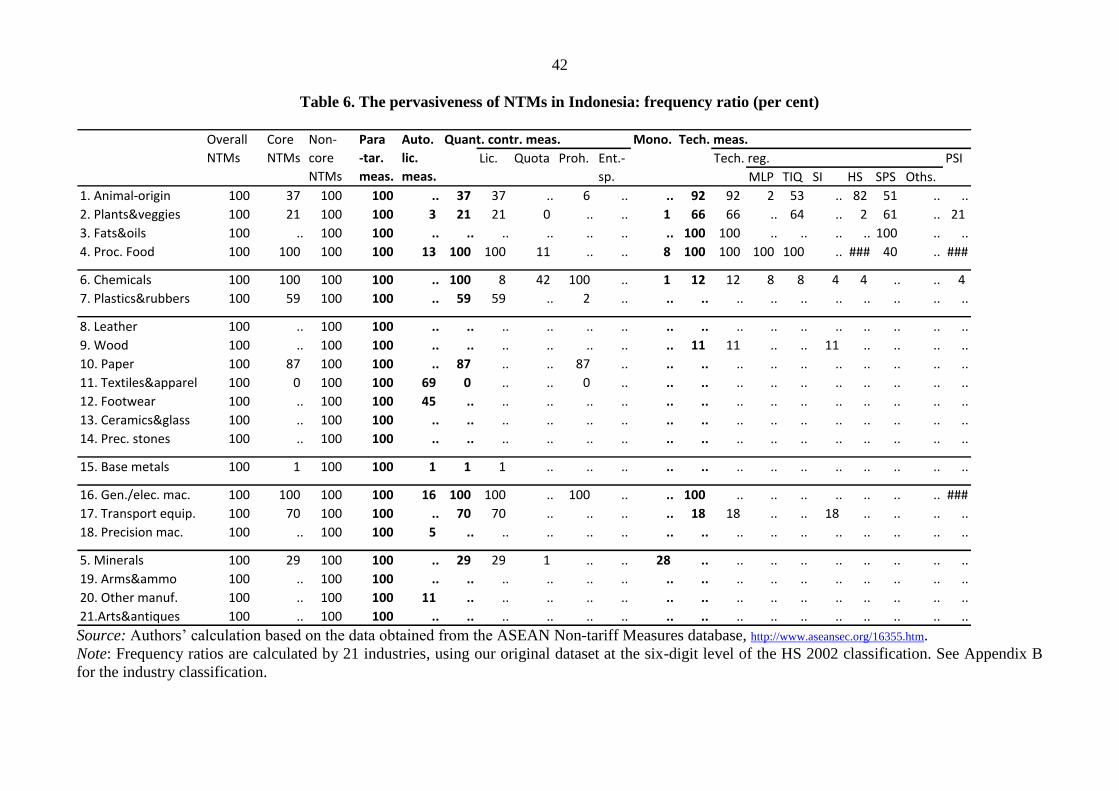
In Indonesia, first of all, all the imports are subject to para-tariff measures: value-
added tax (VAT) of 10 per cent as well as income tax of 2.5 per cent for licensed importers
and 7.5 per cent for other importers (see table 6). Moreover, prohibitions are applied to most
of the tariff lines of paper and paper products (Industry 10) (nearly 90 per cent), chemicals
and chemical products (Industry 6), and general/electric machineries (Industry 16) (100 per
cent); prohibited imports include printed materials such as books, magazines, leaflets,
newspapers in Chinese in terms of moral hazard, chemicals and chemical products in terms of
national security, colour photocopy machines, and used machinery, equipment and other
capital goods (together with a pre-shipment inspection at the loading port). In addition, non-
automatic licensing is applied to about 60 per cent of the products of plastics and rubbers
(Industry 7) and 70 per cent of transport equipment (Industry 17). Similar to other countries,
food industries (Industries 1-4) are likely to be subject to multiple types of technical
regulations such as testing/inspection/quarantine requirements, SPS measures, and
health/sanitary regulations and quality standards, sometimes combined with non-automatic
licensing.
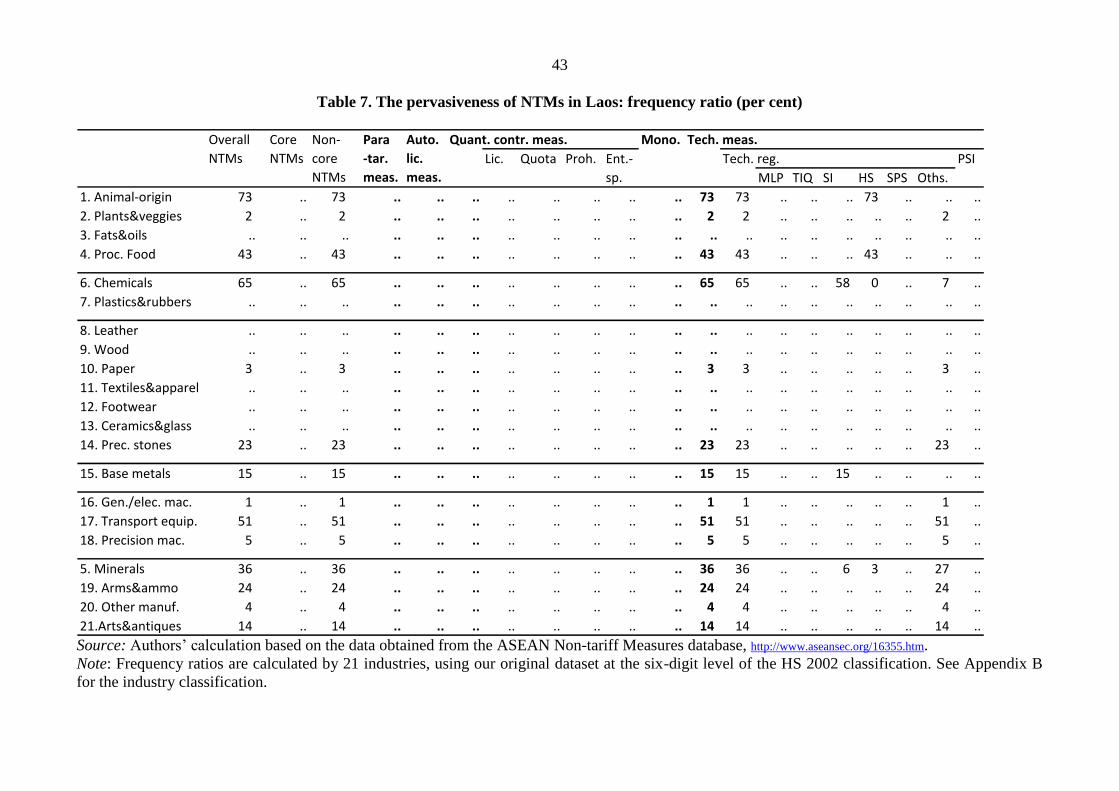
Lao People‘s Democratic Republic reports only technical regulations (see table 7).
Health/sanitary regulations and quality standards are applied to more than 70 per cent of the

38
products of animals and animal-origin foods (Industry 1), and safety/industrial standards are
applied to about 60 per cent of chemicals and chemical products (Industry 6). More than half
of tariff lines of transport equipment (Industry 17) are also subject to technical regulations,
though the purpose is unspecified.
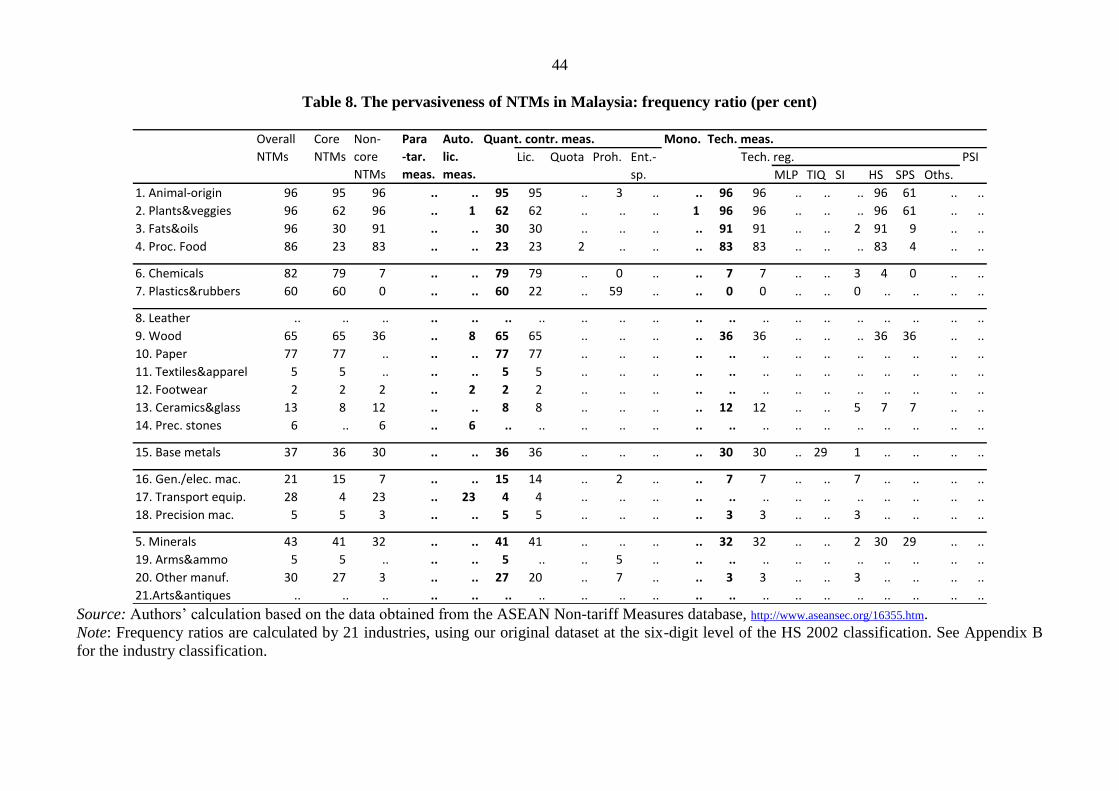
Table 8 confirms that, in Malaysia, most products in animals, plants and food
industries are subject to technical regulations such as health/sanitary regulations and quality
standards; they are applied to over 90 per cent of the tariff lines of animals and animal-origin
foods (Industry 1), plants, vegetables and fruits (Industry 2), and animal/vegetable fats and
oils (Industry 3), and more than 80 per cent of the tariff lines of processed food and beverages
(Industry 4). Among various types of measures implemented, non-automatic licensing is the
most pervasively utilized measure; the frequency ratios are particularly high, such as 95 per
cent for Industry 1, over 60 per cent for Industry 2, nearly 80 per cent for paper and paper
products (Industry 10), 65 per cent for wood and wood products (Industry 9), and about 80
per cent for chemicals and chemical products (Industry 6). Prohibition measures are applied
to around 60 per cent of the tariff lines of plastics and rubbers (Industry 7).
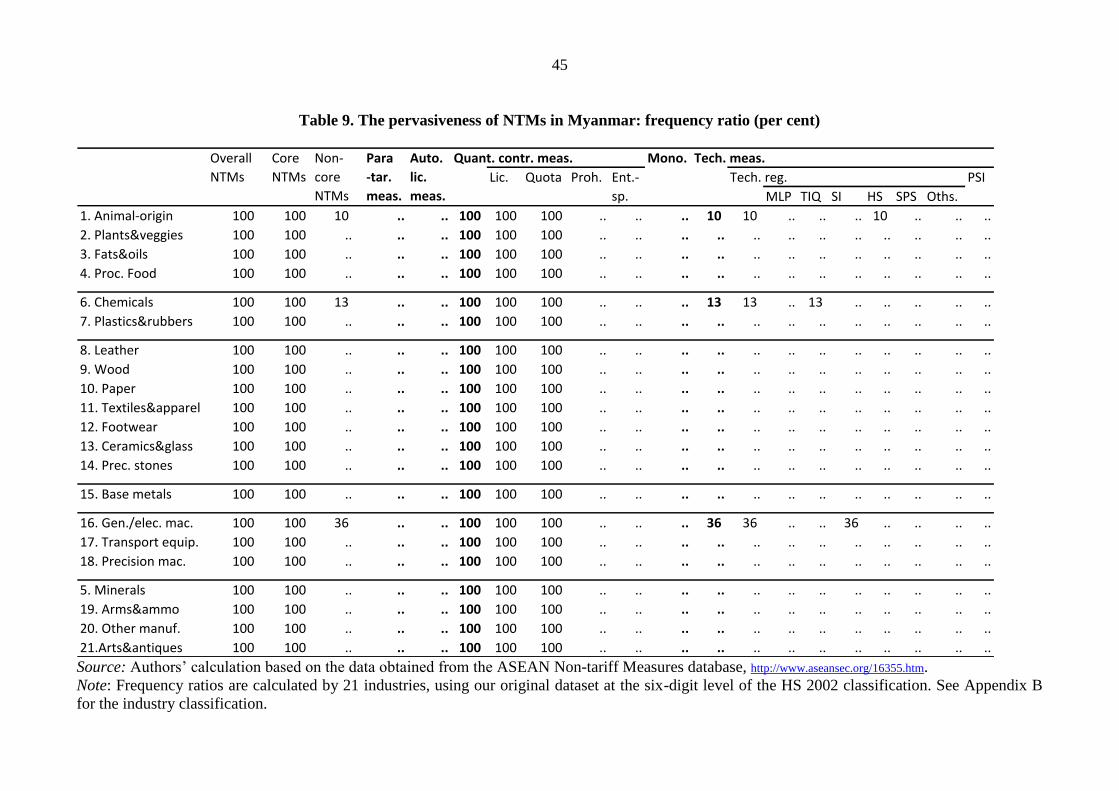
Similar to Cambodia and the Lao People‘s Democratic Republic, the information on
the implementation of NTMs in Myanmar is quite limited. Nevertheless, based on the figures
reported in table 9, multiple NTMs seem to severely impede trade in this country. Firstly, all
commercial imports are subject to non-automatic licensing as well as quotas based on export
performance. Secondly, as already mentioned, Myanmar is the only country which
implements finance control measures; this country has multiple exchange rates for imports,
depending on the product type. Although Myanmar‘s tariff of 5.6 per cent on average is not
so high, these measures make it seriously difficult to trade in this country. In addition to
these core NTMs, nearly 40 per cent of tariff lines of general/electric machineries (Industry
16) are subject to safety/industrial standards.
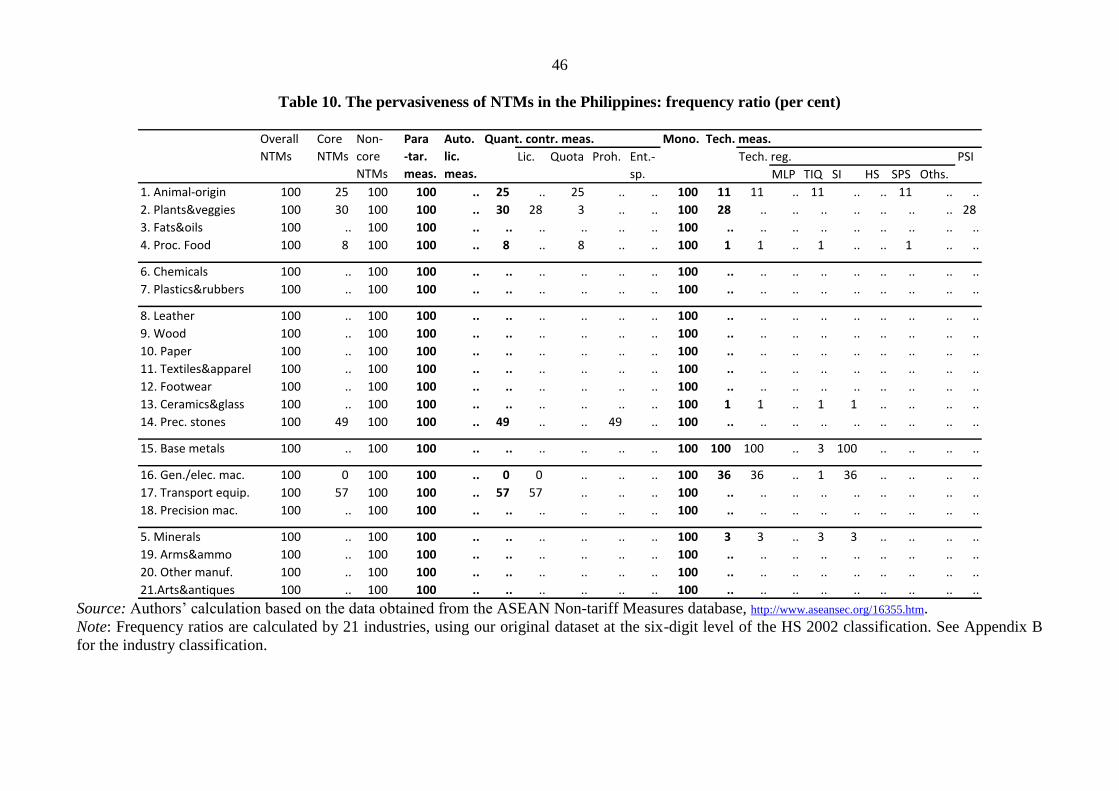
In the Philippines, as is the case of Indonesia, para-tariff measures or additional
charges are applied to all products (see table 10). Moreover, all products are subject to a
single channel for import (monopolistic measures). For example, vessels with a national flag
must be used in the case of government procurements. Besides, all imports are subject to
various charges including processing fees on ordinary claim for refund, registration fees for
participation in public auction sales, laboratory fees for service rendered by the custom
laboratory unit, and brokerage fees for licensed customs brokers. The fees themselves are
indeed small amounts such as 100-200 pesos per unit, depending on the product. However,
administrative and time costs to implement these measures, in addition to actual costs, must
not be ignored. At the industry level, frequency ratios are relatively high for non-automatic
licensing in the industry of transport equipment (Industry 17) (about 60 per cent) and
safety/industrial standards in the industry of base metals and base metal products (Industry
15) (100 per cent).
In the case of Singapore, the portion of tariff lines subject to NTMs is relatively small
(see table 11). Automatic licensing measures, however, are applied to more than 90 per cent
of tariff lines for animals and animal-origin foods (Industry 1). Moreover, Singapore
implements prohibitions for more than 70 per cent of chemicals and chemical products
(Industry 6) such as medicines/drugs and cosmetics containing prohibited
substances/additives for public health and safety reasons, chemicals known as Persistent
Organic Pollutants (in compliance with the Stockholm Convention on Persistent Organic
Pollutants), and certain ozone-depleting substances for local distribution/consumption for

39
environmental protection (in compliance with the Montreal Protocol on Substances that
Deplete the Ozone Layer). In addition, about 60 per cent of tariff lines for transport
equipment (Industry 17) are subject to prohibitions, together with technical regulations; more
specifically, imports of motor vehicles used for more than three years are prohibited for
reasons of minimizing traffic congestion and pollution as well as road safety.
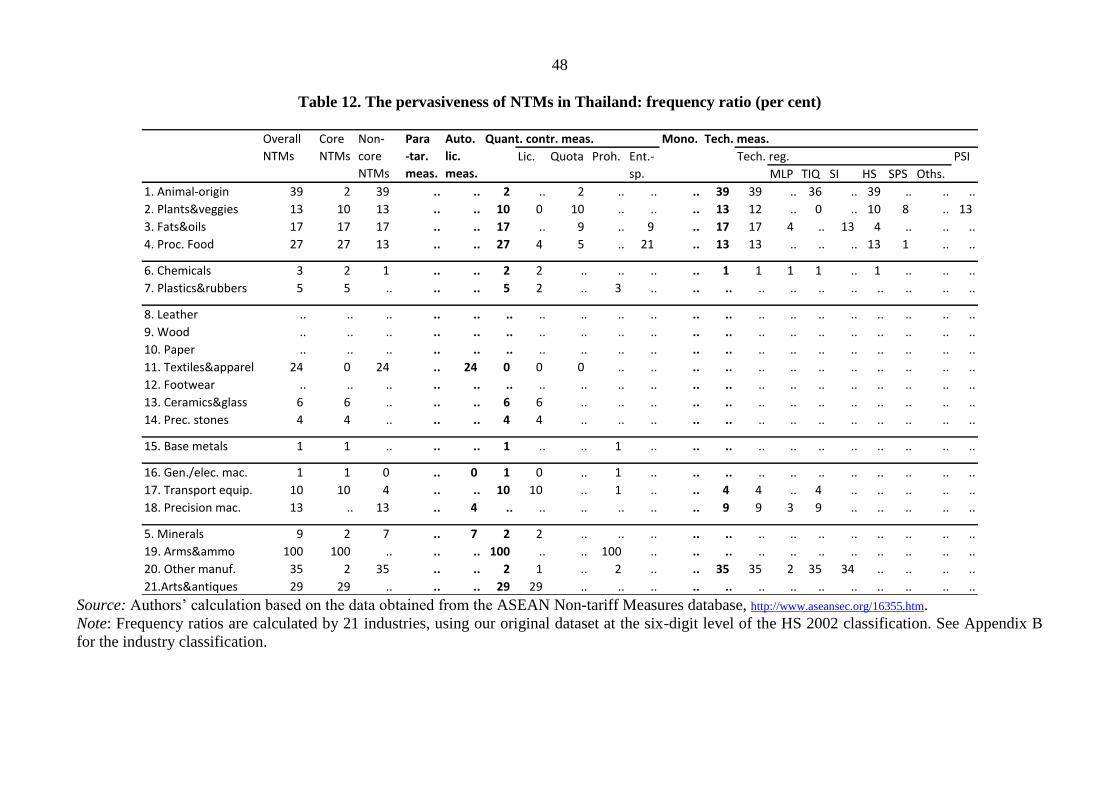
In Thailand, the range of applied NTMs is relatively limited, compared with other
ASEAN countries (see table 12). Thailand, however, is the only country that implements
enterprise-specific restrictions or quantity control measures. These types of measures are
applied to more than 20 per cent of tariff lines for processed food and beverages (Industry 4)
and about 10 per cent of animal/vegetable fats and oils (Industry 3) for a reason of quality
standards. Since this measure allows only registered importers to import as far as quality and
standard satisfy, the conditions it should be interpreted as a sort of import restrictions on a
discriminatory and no scientific basis. Food industries (Industries 1-4) tend to present higher
frequency ratios than other sectors, where import quota, enterprise-specific restrictions, or
technical regulations such as testing/inspection/quarantine requirements for reasons of
health/sanitary regulations and quality standards are implemented.
Strikingly, various industries are subject to prohibitions in Viet Nam (see table 13).
More than 80 per cent of tariff lines of textiles and apparel (Industry 11) and about 70 per
cent of footwear (Industry 12) are subject to prohibitions, which are mainly intended for used
consumer goods for health, safety, and environmental reasons. The frequency ratios for
prohibitions are 20 per cent or more for other industries including transport equipment
(Industry 17), leather and leather products (Industry 8), precision machinery (Industry 18),
and general/electric machineries (Industry 16). About 70 per cent of the tariff lines of
precision machinery (Industry 18) are subject to automatic licensing measures, and about 60
per cent of the tariff lines of plants, vegetables and fruits (Industry 2) are subject to
health/sanitary regulations and quality standards.

40
Table 4. The pervasiveness of NTMs in Brunei Darussalam: frequency ratio (per cent)
MLP TIQ SI HS SPS Oths.
1. Animal-origin 90 54 50 .. .. 54 54 .. 2 .. .. 50 50 .. 11 .. 50 .. .. 29
2. Plants&veggies 96 23 96 .. .. 23 22 6 0 .. .. 96 96 .. 4 .. 4 96 .. 96
3. Fats&oils 100 .. 100 .. .. .. .. .. .. .. .. 100 100 .. .. .. ### .. .. ..
4. Proc. Food 24 24 .. .. .. 24 13 20 11 .. .. .. .. .. .. .. .. .. .. ..
6. Chemicals 100 71 100 .. 100 71 70 6 4 .. .. 4 4 4 4 .. 4 .. .. ..
7. Plastics&rubbers .. .. .. .. .. .. .. .. .. .. .. .. .. .. .. .. .. .. .. ..
8. Leather .. .. .. .. .. .. .. .. .. .. .. .. .. .. .. .. .. .. .. ..
9. Wood 86 86 86 .. 86 86 86 86 .. .. .. .. .. .. .. .. .. .. .. ..
10. Paper 13 13 .. .. .. 13 13 .. 13 .. .. .. .. .. .. .. .. .. .. ..
11. Textiles&apparel 0 0 .. .. .. 0 0 .. .. .. .. .. .. .. .. .. .. .. .. ..
12. Footwear .. .. .. .. .. .. .. .. .. .. .. .. .. .. .. .. .. .. .. ..
13. Ceramics&glass .. .. .. .. .. .. .. .. .. .. .. .. .. .. .. .. .. .. .. ..
14. Prec. stones .. .. .. .. .. .. .. .. .. .. .. .. .. .. .. .. .. .. .. ..
15. Base metals 1 1 .. .. .. 1 .. .. 1 .. .. .. .. .. .. .. .. .. .. ..
16. Gen./elec. mac. 100 69 36 .. 36 69 5 64 .. .. .. .. .. .. .. .. .. .. .. ..
17. Transport equip. 57 20 57 .. 57 20 20 .. .. .. .. 18 18 .. 18 .. .. .. .. ..
18. Precision mac. .. .. .. .. .. .. .. .. .. .. .. .. .. .. .. .. .. .. .. ..
5. Minerals 2 2 .. .. .. 2 1 1 1 .. .. .. .. .. .. .. .. .. .. ..
19. Arms&ammo 100 100 100 .. 100 100 100 .. 100 .. .. .. .. .. .. .. .. .. .. ..
20. Other manuf. 13 13 .. .. .. 13 3 .. 10 .. .. .. .. .. .. .. .. .. .. ..
21.Arts&antiques 14 .. 14 .. 14 .. .. .. .. .. .. .. .. .. .. .. .. .. .. ..
Lic. Quota Proh. Ent.-
sp.
Tech. reg.
Overall
NTMs
Core
NTMs
Non-
core
NTMs
Para
-tar.
meas.
PSI
Auto.
lic.
meas.
Quant. contr. meas. Mono. Tech. meas.
Source: Authors‘ calculation based on the data obtained from the ASEAN Non-tariff Measures database, http://www.aseansec.org/16355.htm.
Note: Frequency ratios are calculated by 21 industries, using our original dataset at the six-digit level of the HS 2002 classification. See
Appendix B for the industry classification.
41
Table 5. The pervasiveness of NTMs in Cambodia: frequency ratio (per cent)
MLP TIQ SI HS SPS Oths.
1. Animal-origin 80 37 80 .. .. 37 37 .. .. .. .. 80 80 .. .. .. 80 .. .. ..
2. Plants&veggies .. .. .. .. .. .. .. .. .. .. .. .. .. .. .. .. .. .. .. ..
3. Fats&oils .. .. .. .. .. .. .. .. .. .. .. .. .. .. .. .. .. .. .. ..
4. Proc. Food .. .. .. .. .. .. .. .. .. .. .. .. .. .. .. .. .. .. .. ..
6. Chemicals 9 9 .. .. .. 9 8 .. 4 .. .. .. .. .. .. .. .. .. .. ..
7. Plastics&rubbers .. .. .. .. .. .. .. .. .. .. .. .. .. .. .. .. .. .. .. ..
8. Leather .. .. .. .. .. .. .. .. .. .. .. .. .. .. .. .. .. .. .. ..
9. Wood .. .. .. .. .. .. .. .. .. .. .. .. .. .. .. .. .. .. .. ..
10. Paper .. .. .. .. .. .. .. .. .. .. .. .. .. .. .. .. .. .. .. ..
11. Textiles&apparel .. .. .. .. .. .. .. .. .. .. .. .. .. .. .. .. .. .. .. ..
12. Footwear .. .. .. .. .. .. .. .. .. .. .. .. .. .. .. .. .. .. .. ..
13. Ceramics&glass .. .. .. .. .. .. .. .. .. .. .. .. .. .. .. .. .. .. .. ..
14. Prec. stones 17 .. 17 .. 17 .. .. .. .. .. .. .. .. .. .. .. .. .. .. ..
15. Base metals .. .. .. .. .. .. .. .. .. .. .. .. .. .. .. .. .. .. .. ..
16. Gen./elec. mac. .. .. .. .. .. .. .. .. .. .. .. .. .. .. .. .. .. .. .. ..
17. Transport equip. 25 25 .. .. .. 25 25 .. .. .. .. .. .. .. .. .. .. .. .. ..
18. Precision mac. .. .. .. .. .. .. .. .. .. .. .. .. .. .. .. .. .. .. .. ..
5. Minerals .. .. .. .. .. .. .. .. .. .. .. .. .. .. .. .. .. .. .. ..
19. Arms&ammo 100 100 .. .. .. 100 100 .. .. .. .. .. .. .. .. .. .. .. .. ..
20. Other manuf. .. .. .. .. .. .. .. .. .. .. .. .. .. .. .. .. .. .. .. ..
21.Arts&antiques .. .. .. .. .. .. .. .. .. .. .. .. .. .. .. .. .. .. .. ..
Lic. Quota Proh. Ent.-
sp.
Tech. reg.
Overall
NTMs
Core
NTMs
Non-
core
NTMs
Para
-tar.
meas.
PSI
Auto.
lic.
meas.
Quant. contr. meas. Mono. Tech. meas.
Source: Authors‘ calculation based on the data obtained from the ASEAN Non-tariff Measures database, http://www.aseansec.org/16355.htm.
Note: Frequency ratios are calculated by 21 industries, using our original dataset at the six-digit level of the HS 2002 classification. See Appendix B
for the industry classification.
42
Table 6. The pervasiveness of NTMs in Indonesia: frequency ratio (per cent)
MLP TIQ SI HS SPS Oths.
1. Animal-origin 100 37 100 100 .. 37 37 .. 6 .. .. 92 92 2 53 .. 82 51 .. ..
2. Plants&veggies 100 21 100 100 3 21 21 0 .. .. 1 66 66 .. 64 .. 2 61 .. 21
3. Fats&oils 100 .. 100 100 .. .. .. .. .. .. .. 100 100 .. .. .. .. 100 .. ..
4. Proc. Food 100 100 100 100 13 100 100 11 .. .. 8 100 100 100 100 .. ### 40 .. ###
6. Chemicals 100 100 100 100 .. 100 8 42 100 .. 1 12 12 8 8 4 4 .. .. 4
7. Plastics&rubbers 100 59 100 100 .. 59 59 .. 2 .. .. .. .. .. .. .. .. .. .. ..
8. Leather 100 .. 100 100 .. .. .. .. .. .. .. .. .. .. .. .. .. .. .. ..
9. Wood 100 .. 100 100 .. .. .. .. .. .. .. 11 11 .. .. 11 .. .. .. ..
10. Paper 100 87 100 100 .. 87 .. .. 87 .. .. .. .. .. .. .. .. .. .. ..
11. Textiles&apparel 100 0 100 100 69 0 .. .. 0 .. .. .. .. .. .. .. .. .. .. ..
12. Footwear 100 .. 100 100 45 .. .. .. .. .. .. .. .. .. .. .. .. .. .. ..
13. Ceramics&glass 100 .. 100 100 .. .. .. .. .. .. .. .. .. .. .. .. .. .. .. ..
14. Prec. stones 100 .. 100 100 .. .. .. .. .. .. .. .. .. .. .. .. .. .. .. ..
15. Base metals 100 1 100 100 1 1 1 .. .. .. .. .. .. .. .. .. .. .. .. ..
16. Gen./elec. mac. 100 100 100 100 16 100 100 .. 100 .. .. 100 .. .. .. .. .. .. .. ###
17. Transport equip. 100 70 100 100 .. 70 70 .. .. .. .. 18 18 .. .. 18 .. .. .. ..
18. Precision mac. 100 .. 100 100 5 .. .. .. .. .. .. .. .. .. .. .. .. .. .. ..
5. Minerals 100 29 100 100 .. 29 29 1 .. .. 28 .. .. .. .. .. .. .. .. ..
19. Arms&ammo 100 .. 100 100 .. .. .. .. .. .. .. .. .. .. .. .. .. .. .. ..
20. Other manuf. 100 .. 100 100 11 .. .. .. .. .. .. .. .. .. .. .. .. .. .. ..
21.Arts&antiques 100 .. 100 100 .. .. .. .. .. .. .. .. .. .. .. .. .. .. .. ..
PSI
Auto.
lic.
meas.
Quant. contr. meas. Mono. Tech. meas.
Lic. Quota Proh. Ent.-
sp.
Tech. reg.
Overall
NTMs
Core
NTMs
Non-
core
NTMs
Para
-tar.
meas.
Source: Authors‘ calculation based on the data obtained from the ASEAN Non-tariff Measures database, http://www.aseansec.org/16355.htm.
Note: Frequency ratios are calculated by 21 industries, using our original dataset at the six-digit level of the HS 2002 classification. See Appendix B
for the industry classification.
43
Table 7. The pervasiveness of NTMs in Laos: frequency ratio (per cent)
MLP TIQ SI HS SPS Oths.
1. Animal-origin 73 .. 73 .. .. .. .. .. .. .. .. 73 73 .. .. .. 73 .. .. ..
2. Plants&veggies 2 .. 2 .. .. .. .. .. .. .. .. 2 2 .. .. .. .. .. 2 ..
3. Fats&oils .. .. .. .. .. .. .. .. .. .. .. .. .. .. .. .. .. .. .. ..
4. Proc. Food 43 .. 43 .. .. .. .. .. .. .. .. 43 43 .. .. .. 43 .. .. ..
6. Chemicals 65 .. 65 .. .. .. .. .. .. .. .. 65 65 .. .. 58 0 .. 7 ..
7. Plastics&rubbers .. .. .. .. .. .. .. .. .. .. .. .. .. .. .. .. .. .. .. ..
8. Leather .. .. .. .. .. .. .. .. .. .. .. .. .. .. .. .. .. .. .. ..
9. Wood .. .. .. .. .. .. .. .. .. .. .. .. .. .. .. .. .. .. .. ..
10. Paper 3 .. 3 .. .. .. .. .. .. .. .. 3 3 .. .. .. .. .. 3 ..
11. Textiles&apparel .. .. .. .. .. .. .. .. .. .. .. .. .. .. .. .. .. .. .. ..
12. Footwear .. .. .. .. .. .. .. .. .. .. .. .. .. .. .. .. .. .. .. ..
13. Ceramics&glass .. .. .. .. .. .. .. .. .. .. .. .. .. .. .. .. .. .. .. ..
14. Prec. stones 23 .. 23 .. .. .. .. .. .. .. .. 23 23 .. .. .. .. .. 23 ..
15. Base metals 15 .. 15 .. .. .. .. .. .. .. .. 15 15 .. .. 15 .. .. .. ..
16. Gen./elec. mac. 1 .. 1 .. .. .. .. .. .. .. .. 1 1 .. .. .. .. .. 1 ..
17. Transport equip. 51 .. 51 .. .. .. .. .. .. .. .. 51 51 .. .. .. .. .. 51 ..
18. Precision mac. 5 .. 5 .. .. .. .. .. .. .. .. 5 5 .. .. .. .. .. 5 ..
5. Minerals 36 .. 36 .. .. .. .. .. .. .. .. 36 36 .. .. 6 3 .. 27 ..
19. Arms&ammo 24 .. 24 .. .. .. .. .. .. .. .. 24 24 .. .. .. .. .. 24 ..
20. Other manuf. 4 .. 4 .. .. .. .. .. .. .. .. 4 4 .. .. .. .. .. 4 ..
21.Arts&antiques 14 .. 14 .. .. .. .. .. .. .. .. 14 14 .. .. .. .. .. 14 ..
PSI
Auto.
lic.
meas.
Quant. contr. meas. Mono. Tech. meas.
Lic. Quota Proh. Ent.-
sp.
Tech. reg.
Overall
NTMs
Core
NTMs
Non-
core
NTMs
Para
-tar.
meas.
Source: Authors‘ calculation based on the data obtained from the ASEAN Non-tariff Measures database, http://www.aseansec.org/16355.htm.
Note: Frequency ratios are calculated by 21 industries, using our original dataset at the six-digit level of the HS 2002 classification. See Appendix B
for the industry classification.
44
Table 8. The pervasiveness of NTMs in Malaysia: frequency ratio (per cent)
MLP TIQ SI HS SPS Oths.
1. Animal-origin 96 95 96 .. .. 95 95 .. 3 .. .. 96 96 .. .. .. 96 61 .. ..
2. Plants&veggies 96 62 96 .. 1 62 62 .. .. .. 1 96 96 .. .. .. 96 61 .. ..
3. Fats&oils 96 30 91 .. .. 30 30 .. .. .. .. 91 91 .. .. 2 91 9 .. ..
4. Proc. Food 86 23 83 .. .. 23 23 2 .. .. .. 83 83 .. .. .. 83 4 .. ..
6. Chemicals 82 79 7 .. .. 79 79 .. 0 .. .. 7 7 .. .. 3 4 0 .. ..
7. Plastics&rubbers 60 60 0 .. .. 60 22 .. 59 .. .. 0 0 .. .. 0 .. .. .. ..
8. Leather .. .. .. .. .. .. .. .. .. .. .. .. .. .. .. .. .. .. .. ..
9. Wood 65 65 36 .. 8 65 65 .. .. .. .. 36 36 .. .. .. 36 36 .. ..
10. Paper 77 77 .. .. .. 77 77 .. .. .. .. .. .. .. .. .. .. .. .. ..
11. Textiles&apparel 5 5 .. .. .. 5 5 .. .. .. .. .. .. .. .. .. .. .. .. ..
12. Footwear 2 2 2 .. 2 2 2 .. .. .. .. .. .. .. .. .. .. .. .. ..
13. Ceramics&glass 13 8 12 .. .. 8 8 .. .. .. .. 12 12 .. .. 5 7 7 .. ..
14. Prec. stones 6 .. 6 .. 6 .. .. .. .. .. .. .. .. .. .. .. .. .. .. ..
15. Base metals 37 36 30 .. .. 36 36 .. .. .. .. 30 30 .. 29 1 .. .. .. ..
16. Gen./elec. mac. 21 15 7 .. .. 15 14 .. 2 .. .. 7 7 .. .. 7 .. .. .. ..
17. Transport equip. 28 4 23 .. 23 4 4 .. .. .. .. .. .. .. .. .. .. .. .. ..
18. Precision mac. 5 5 3 .. .. 5 5 .. .. .. .. 3 3 .. .. 3 .. .. .. ..
5. Minerals 43 41 32 .. .. 41 41 .. .. .. .. 32 32 .. .. 2 30 29 .. ..
19. Arms&ammo 5 5 .. .. .. 5 .. .. 5 .. .. .. .. .. .. .. .. .. .. ..
20. Other manuf. 30 27 3 .. .. 27 20 .. 7 .. .. 3 3 .. .. 3 .. .. .. ..
21.Arts&antiques .. .. .. .. .. .. .. .. .. .. .. .. .. .. .. .. .. .. .. ..
PSI
Auto.
lic.
meas.
Quant. contr. meas. Mono. Tech. meas.
Lic. Quota Proh. Ent.-
sp.
Tech. reg.
Overall
NTMs
Core
NTMs
Non-
core
NTMs
Para
-tar.
meas.
Source: Authors‘ calculation based on the data obtained from the ASEAN Non-tariff Measures database, http://www.aseansec.org/16355.htm.
Note: Frequency ratios are calculated by 21 industries, using our original dataset at the six-digit level of the HS 2002 classification. See Appendix B
for the industry classification.
45
Table 9. The pervasiveness of NTMs in Myanmar: frequency ratio (per cent)
MLP TIQ SI HS SPS Oths.
1. Animal-origin 100 100 10 .. .. 100 100 100 .. .. .. 10 10 .. .. .. 10 .. .. ..
2. Plants&veggies 100 100 .. .. .. 100 100 100 .. .. .. .. .. .. .. .. .. .. .. ..
3. Fats&oils 100 100 .. .. .. 100 100 100 .. .. .. .. .. .. .. .. .. .. .. ..
4. Proc. Food 100 100 .. .. .. 100 100 100 .. .. .. .. .. .. .. .. .. .. .. ..
6. Chemicals 100 100 13 .. .. 100 100 100 .. .. .. 13 13 .. 13 .. .. .. .. ..
7. Plastics&rubbers 100 100 .. .. .. 100 100 100 .. .. .. .. .. .. .. .. .. .. .. ..
8. Leather 100 100 .. .. .. 100 100 100 .. .. .. .. .. .. .. .. .. .. .. ..
9. Wood 100 100 .. .. .. 100 100 100 .. .. .. .. .. .. .. .. .. .. .. ..
10. Paper 100 100 .. .. .. 100 100 100 .. .. .. .. .. .. .. .. .. .. .. ..
11. Textiles&apparel 100 100 .. .. .. 100 100 100 .. .. .. .. .. .. .. .. .. .. .. ..
12. Footwear 100 100 .. .. .. 100 100 100 .. .. .. .. .. .. .. .. .. .. .. ..
13. Ceramics&glass 100 100 .. .. .. 100 100 100 .. .. .. .. .. .. .. .. .. .. .. ..
14. Prec. stones 100 100 .. .. .. 100 100 100 .. .. .. .. .. .. .. .. .. .. .. ..
15. Base metals 100 100 .. .. .. 100 100 100 .. .. .. .. .. .. .. .. .. .. .. ..
16. Gen./elec. mac. 100 100 36 .. .. 100 100 100 .. .. .. 36 36 .. .. 36 .. .. .. ..
17. Transport equip. 100 100 .. .. .. 100 100 100 .. .. .. .. .. .. .. .. .. .. .. ..
18. Precision mac. 100 100 .. .. .. 100 100 100 .. .. .. .. .. .. .. .. .. .. .. ..
5. Minerals 100 100 .. .. .. 100 100 100 .. .. .. .. .. .. .. .. .. .. .. ..
19. Arms&ammo 100 100 .. .. .. 100 100 100 .. .. .. .. .. .. .. .. .. .. .. ..
20. Other manuf. 100 100 .. .. .. 100 100 100 .. .. .. .. .. .. .. .. .. .. .. ..
21.Arts&antiques 100 100 .. .. .. 100 100 100 .. .. .. .. .. .. .. .. .. .. .. ..
Lic. Quota Proh. Ent.-
sp.
Tech. reg.
Overall
NTMs
Core
NTMs
Non-
core
NTMs
Para
-tar.
meas.
PSI
Auto.
lic.
meas.
Quant. contr. meas. Mono. Tech. meas.
Source: Authors‘ calculation based on the data obtained from the ASEAN Non-tariff Measures database, http://www.aseansec.org/16355.htm.
Note: Frequency ratios are calculated by 21 industries, using our original dataset at the six-digit level of the HS 2002 classification. See Appendix B
for the industry classification.
46
Table 10. The pervasiveness of NTMs in the Philippines: frequency ratio (per cent)
MLP TIQ SI HS SPS Oths.
1. Animal-origin 100 25 100 100 .. 25 .. 25 .. .. 100 11 11 .. 11 .. .. 11 .. ..
2. Plants&veggies 100 30 100 100 .. 30 28 3 .. .. 100 28 .. .. .. .. .. .. .. 28
3. Fats&oils 100 .. 100 100 .. .. .. .. .. .. 100 .. .. .. .. .. .. .. .. ..
4. Proc. Food 100 8 100 100 .. 8 .. 8 .. .. 100 1 1 .. 1 .. .. 1 .. ..
6. Chemicals 100 .. 100 100 .. .. .. .. .. .. 100 .. .. .. .. .. .. .. .. ..
7. Plastics&rubbers 100 .. 100 100 .. .. .. .. .. .. 100 .. .. .. .. .. .. .. .. ..
8. Leather 100 .. 100 100 .. .. .. .. .. .. 100 .. .. .. .. .. .. .. .. ..
9. Wood 100 .. 100 100 .. .. .. .. .. .. 100 .. .. .. .. .. .. .. .. ..
10. Paper 100 .. 100 100 .. .. .. .. .. .. 100 .. .. .. .. .. .. .. .. ..
11. Textiles&apparel 100 .. 100 100 .. .. .. .. .. .. 100 .. .. .. .. .. .. .. .. ..
12. Footwear 100 .. 100 100 .. .. .. .. .. .. 100 .. .. .. .. .. .. .. .. ..
13. Ceramics&glass 100 .. 100 100 .. .. .. .. .. .. 100 1 1 .. 1 1 .. .. .. ..
14. Prec. stones 100 49 100 100 .. 49 .. .. 49 .. 100 .. .. .. .. .. .. .. .. ..
15. Base metals 100 .. 100 100 .. .. .. .. .. .. 100 100 100 .. 3 100 .. .. .. ..
16. Gen./elec. mac. 100 0 100 100 .. 0 0 .. .. .. 100 36 36 .. 1 36 .. .. .. ..
17. Transport equip. 100 57 100 100 .. 57 57 .. .. .. 100 .. .. .. .. .. .. .. .. ..
18. Precision mac. 100 .. 100 100 .. .. .. .. .. .. 100 .. .. .. .. .. .. .. .. ..
5. Minerals 100 .. 100 100 .. .. .. .. .. .. 100 3 3 .. 3 3 .. .. .. ..
19. Arms&ammo 100 .. 100 100 .. .. .. .. .. .. 100 .. .. .. .. .. .. .. .. ..
20. Other manuf. 100 .. 100 100 .. .. .. .. .. .. 100 .. .. .. .. .. .. .. .. ..
21.Arts&antiques 100 .. 100 100 .. .. .. .. .. .. 100 .. .. .. .. .. .. .. .. ..
Lic. Quota Proh. Ent.-
sp.
Tech. reg.
Overall
NTMs
Core
NTMs
Non-
core
NTMs
Para
-tar.
meas.
PSI
Auto.
lic.
meas.
Quant. contr. meas. Mono. Tech. meas.
Source: Authors‘ calculation based on the data obtained from the ASEAN Non-tariff Measures database, http://www.aseansec.org/16355.htm.
Note: Frequency ratios are calculated by 21 industries, using our original dataset at the six-digit level of the HS 2002 classification. See Appendix B
for the industry classification.

47
Table 11. The pervasiveness of NTMs in Singapore: frequency ratio (per cent)
MLP TIQ SI HS SPS Oths.
1. Animal-origin 93 11 92 .. 92 11 10 .. 1 .. .. 9 9 6 3 .. .. .. .. ..
2. Plants&veggies 40 6 38 .. 38 6 6 .. .. .. .. .. .. .. .. .. .. .. .. ..
3. Fats&oils .. .. .. .. .. .. .. .. .. .. .. .. .. .. .. .. .. .. .. ..
4. Proc. Food 9 4 5 5 .. 4 4 .. 4 .. .. 5 5 5 .. .. 5 .. .. 1
6. Chemicals 73 73 5 .. 0 73 26 .. 72 .. .. 4 4 4 .. .. .. .. .. ..
7. Plastics&rubbers 0 0 .. .. .. 0 0 .. .. .. .. .. .. .. .. .. .. .. .. ..
8. Leather .. .. .. .. .. .. .. .. .. .. .. .. .. .. .. .. .. .. .. ..
9. Wood .. .. .. .. .. .. .. .. .. .. .. .. .. .. .. .. .. .. .. ..
10. Paper .. .. .. .. .. .. .. .. .. .. .. .. .. .. .. .. .. .. .. ..
11. Textiles&apparel .. .. .. .. .. .. .. .. .. .. .. .. .. .. .. .. .. .. .. ..
12. Footwear 2 2 .. .. .. 2 2 .. .. .. .. .. .. .. .. .. .. .. .. ..
13. Ceramics&glass 1 1 .. .. .. 1 1 .. .. .. .. .. .. .. .. .. .. .. .. ..
14. Prec. stones .. .. .. .. .. .. .. .. .. .. .. .. .. .. .. .. .. .. .. ..
15. Base metals 0 0 .. .. .. 0 0 .. .. .. .. .. .. .. .. .. .. .. .. ..
16. Gen./elec. mac. 38 36 38 .. 1 36 0 .. 36 .. .. 38 38 38 .. 38 .. .. .. ..
17. Transport equip. 57 57 57 57 .. 57 .. .. 57 .. .. 57 57 .. .. 57 .. .. .. ..
18. Precision mac. .. .. .. .. .. .. .. .. .. .. .. .. .. .. .. .. .. .. .. ..
5. Minerals 50 47 3 3 .. 47 47 .. 1 .. .. .. .. .. .. .. .. .. .. ..
19. Arms&ammo 100 100 .. .. .. 100 100 .. .. .. .. .. .. .. .. .. .. .. .. ..
20. Other manuf. 8 8 .. .. .. 8 4 .. 5 .. .. .. .. .. .. .. .. .. .. ..
21.Arts&antiques .. .. .. .. .. .. .. .. .. .. .. .. .. .. .. .. .. .. .. ..
PSI
Auto.
lic.
meas.
Quant. contr. meas. Mono. Tech. meas.
Lic. Quota Proh. Ent.-
sp.
Tech. reg.
Overall
NTMs
Core
NTMs
Non-
core
NTMs
Para
-tar.
meas.
Source: Authors‘ calculation based on the data obtained from the ASEAN Non-tariff Measures database, http://www.aseansec.org/16355.htm.
Note: Frequency ratios are calculated by 21 industries, using our original dataset at the six-digit level of the HS 2002 classification. See Appendix B
for the industry classification.
48
Table 12. The pervasiveness of NTMs in Thailand: frequency ratio (per cent)
MLP TIQ SI HS SPS Oths.
1. Animal-origin 39 2 39 .. .. 2 .. 2 .. .. .. 39 39 .. 36 .. 39 .. .. ..
2. Plants&veggies 13 10 13 .. .. 10 0 10 .. .. .. 13 12 .. 0 .. 10 8 .. 13
3. Fats&oils 17 17 17 .. .. 17 .. 9 .. 9 .. 17 17 4 .. 13 4 .. .. ..
4. Proc. Food 27 27 13 .. .. 27 4 5 .. 21 .. 13 13 .. .. .. 13 1 .. ..
6. Chemicals 3 2 1 .. .. 2 2 .. .. .. .. 1 1 1 1 .. 1 .. .. ..
7. Plastics&rubbers 5 5 .. .. .. 5 2 .. 3 .. .. .. .. .. .. .. .. .. .. ..
8. Leather .. .. .. .. .. .. .. .. .. .. .. .. .. .. .. .. .. .. .. ..
9. Wood .. .. .. .. .. .. .. .. .. .. .. .. .. .. .. .. .. .. .. ..
10. Paper .. .. .. .. .. .. .. .. .. .. .. .. .. .. .. .. .. .. .. ..
11. Textiles&apparel 24 0 24 .. 24 0 0 0 .. .. .. .. .. .. .. .. .. .. .. ..
12. Footwear .. .. .. .. .. .. .. .. .. .. .. .. .. .. .. .. .. .. .. ..
13. Ceramics&glass 6 6 .. .. .. 6 6 .. .. .. .. .. .. .. .. .. .. .. .. ..
14. Prec. stones 4 4 .. .. .. 4 4 .. .. .. .. .. .. .. .. .. .. .. .. ..
15. Base metals 1 1 .. .. .. 1 .. .. 1 .. .. .. .. .. .. .. .. .. .. ..
16. Gen./elec. mac. 1 1 0 .. 0 1 0 .. 1 .. .. .. .. .. .. .. .. .. .. ..
17. Transport equip. 10 10 4 .. .. 10 10 .. 1 .. .. 4 4 .. 4 .. .. .. .. ..
18. Precision mac. 13 .. 13 .. 4 .. .. .. .. .. .. 9 9 3 9 .. .. .. .. ..
5. Minerals 9 2 7 .. 7 2 2 .. .. .. .. .. .. .. .. .. .. .. .. ..
19. Arms&ammo 100 100 .. .. .. 100 .. .. 100 .. .. .. .. .. .. .. .. .. .. ..
20. Other manuf. 35 2 35 .. .. 2 1 .. 2 .. .. 35 35 2 35 34 .. .. .. ..
21.Arts&antiques 29 29 .. .. .. 29 29 .. .. .. .. .. .. .. .. .. .. .. .. ..
Lic. Quota Proh. Ent.-
sp.
Tech. reg.
Overall
NTMs
Core
NTMs
Non-
core
NTMs
Para
-tar.
meas.
PSI
Auto.
lic.
meas.
Quant. contr. meas. Mono. Tech. meas.
Source: Authors‘ calculation based on the data obtained from the ASEAN Non-tariff Measures database, http://www.aseansec.org/16355.htm.
Note: Frequency ratios are calculated by 21 industries, using our original dataset at the six-digit level of the HS 2002 classification. See Appendix B
for the industry classification.

49
Table 13. The pervasiveness of NTMs in Viet Nam: frequency ratio (per cent)
MLP TIQ SI HS SPS Oths.
1. Animal-origin 11 0 10 .. 10 0 .. 0 .. .. .. 4 4 .. .. .. 4 .. .. ..
2. Plants&veggies 60 1 59 .. .. 1 .. .. 1 .. .. 59 59 .. .. .. 59 .. .. ..
3. Fats&oils .. .. .. .. .. .. .. .. .. .. .. .. .. .. .. .. .. .. .. ..
4. Proc. Food 24 4 22 9 .. 4 .. 4 .. .. 3 13 13 .. .. .. 13 .. .. ..
6. Chemicals 14 4 10 0 2 4 .. 3 1 .. 0 10 10 1 .. .. 10 .. 0 ..
7. Plastics&rubbers 14 8 7 .. .. 8 .. .. 8 .. .. 7 7 .. .. .. 7 .. .. ..
8. Leather 28 28 .. .. .. 28 .. .. 28 .. .. .. .. .. .. .. .. .. .. ..
9. Wood 13 13 .. .. .. 13 .. .. 13 .. .. .. .. .. .. .. .. .. .. ..
10. Paper 27 9 26 .. 19 9 .. .. 9 .. 3 7 7 .. .. .. 7 .. .. ..
11. Textiles&apparel 69 68 0 .. .. 68 .. .. 68 .. .. 0 0 .. .. .. 0 .. .. ..
12. Footwear 84 84 .. .. .. 84 .. .. 84 .. .. .. .. .. .. .. .. .. .. ..
13. Ceramics&glass 12 12 .. .. .. 12 .. .. 12 .. .. .. .. .. .. .. .. .. .. ..
14. Prec. stones 13 6 8 .. .. 6 .. .. 6 .. .. 8 8 .. .. .. 8 .. .. ..
15. Base metals 13 6 7 .. 1 6 .. .. 6 .. 1 5 5 .. .. .. 5 .. .. ..
16. Gen./elec. mac. 29 20 12 1 11 20 .. .. 20 .. 2 .. .. .. .. .. .. .. .. ..
17. Transport equip. 41 34 21 8 7 34 .. .. 34 .. 7 .. .. .. .. .. .. .. .. ..
18. Precision mac. 77 23 68 .. 68 23 .. .. 23 .. .. .. .. .. .. .. .. .. .. ..
5. Minerals 17 9 8 8 .. 9 .. 1 9 .. 8 .. .. .. .. .. .. .. .. ..
19. Arms&ammo 81 81 .. .. .. 81 .. .. 81 .. .. .. .. .. .. .. .. .. .. ..
20. Other manuf. 54 42 15 .. 4 42 .. .. 42 .. .. 12 12 .. .. .. 1 .. 11 ..
21.Arts&antiques 86 71 43 .. 43 71 .. .. 71 .. .. .. .. .. .. .. .. .. .. ..
PSI
Auto.
lic.
meas.
Quant. contr. meas. Mono. Tech. meas.
Lic. Quota Proh. Ent.-
sp.
Tech. reg.
Overall
NTMs
Core
NTMs
Non-
core
NTMs
Para
-tar.
meas.
Source: Authors‘ calculation based on the data obtained from the ASEAN Non-tariff Measures database, http://www.aseansec.org/16355.htm.
Note: Frequency ratios are calculated by 21 industries, using our original dataset at the six-digit level of the HS 2002 classification. See Appendix B
for the industry classification.
50
C. NTMs and ASEAN’s efforts toward the establishment of ASEAN
Economic Community
ASEAN countries have started to make various efforts to estabilish the ASEAN
Economic Community (AEC) by 2015. According to the AEC blueprint, 38 ASEAN seems to
seriously recognize the importance of reducing/eliminating NTBs and strengthening trade and
investment facilitation, given the fact that ASEAN has achieved significant progress in tariff
liberalization.39
Regarding the elimination of NTBs, the blueprint presents five action plans: (i)
enhance transparency by abiding to the protocol on notification procedures and setting up an
effective surveillance mechanism; (ii) abide by the commitment of a standstill and rollback
on NTBs; (iii) remove all NTMs by 2010 for ASEAN5 (Brunei Darussalam, Indonesia,
Malaysia, Singapore and Thailand), by 2012 for the Philippines, and by 2015 with
flexibilities to 2018 for CLMV (Cambodia, Lao People‘s Democratic Republic, Myanmar
and Viet Nam); (iv) enhance transparency of NTMs; and (v) work towards, whenever
possible, having regional rules and regulations consistent with international best practices.40
The schedule for eliminating NTBs appears in the ASEAN Trade in Goods
Agreement (ATIGA), which has been signed basically in 2008.41 According to ATIGA,
ASEAN countries are supposed to eliminate identified NTBs in three stages: the targeted
dates for elimination, according to the stages, are 1 January of 2008, 2009 and 2010 for
ASEAN5; 1 January of 2010, 2011 and 2012 for the Philippines; and 1 January of 2013, 2014
and 2015 with flexibilities up to 2018 for CLMV.
Major actions for the realization of this schedule include setting up a classification of
three groups of NTBs, red, amber and green, as a criteria of identified (unfair and unjustified)
NTBs in 2005 and preparing the work programme to implement the elimination of NTMs that
are identified to be removed in 2006. In the process, each ASEAN country is supposed to
submit a list of identified NTBs and to review the classification that the ASEAN Secretariat
provides as the categorization of those NTMs into three groups for the verification. Then, the
range of NTBs to be removed and its timing are supposed to be considered by the
Coordinating Committee on the Implementation of the CEPT for AFTA (CCCA) and other
committees.42
38 The AEC blueprint is available from the following website,
http://www.aseansec.org/21083.pdf. 39 Average tariffs in 2007 (simple average at the HS six-digit level) are 3.6 per cent for
Brunei Darussalam, 14.2 per cent for Cambodia, 6.9 per cent for Indonesia, 9.7 per cent for
Lao People‘s Democratic Republic, 8.4 per cent for Malaysia, 5.6 per cent for Myanmar, 6.3
per cent for the Philippines, 0 for Singapore, 10.0 per cent for Thailand and 11.4 per cent for
Viet Nam (WTO, ITC, and UNCTAD, 2008). Note that average rates of tariffs actually
implemented must be much lower, considering preferential tariffs (AFTA-CEPT tariffs), duty
drawback system, and so on. 40 The terms, NTBs and NTMs, are used here exactly same as in the blueprint. 41 The agreement of ATIGA is obtained from
http://www.thaifta.com/ThaiFTA/Portals/0/atiga.pdf. 42 Whether these actions are carried out as scheduled is another question. Not all the ASEAN
countries seem to have implemented these actions as scheduled. See Ando (2009) for more
information on this and discussion on NTM-related areas in the AEC blueprint.
51
The AEC blueprint also covers the area of technical measures (standards and technical
barriers to trade), which are one of NTMs in the broadly defined categorization, to promote
greater efficiency and enhance cost effectiveness of the production of intra-regional
exports/imports. Moreover, the blueprint explicitly incorporates other areas that could distort
trade and influence efficiency of trade such as rules of origin and custom clearance for
encouragement of trade facilitation. One of the most attracting plans among them is the
realization of ASEAN single windows (ASW) for simplifying, harmonizing and
standardizing trade and customs. It should contribute to the reduction of transaction time and
costs as well as the enhancement of trade efficiency and competitiveness. According to the
blueprint, national single windows (NSW) were supposed to be formed by 2008 for ASEAN6
(ASEAN5 plus the Philippines) and by 2012 at the latest for CLMV. ASW will be
established by integrating the NSWs of individual countries. Although NSW has been fully
operated only in Singapore at the beginning of 2009, pilot studies or partial operations have
been launched in other ASEAN member countries as well.
Regardless of whether reduction/elimination of NTMs or promotion of trade
facilitation, it is not easy to carry them out in practice. How to implement these action plans
in the blueprint would be a big challenge for ASEAN. It is, however, apparent that ASEAN
has a strong recognition of the importance of their challenge for these issues.
D. Conclusion
This paper has investigated the pervasiveness of NTMs in ASEAN by industry as well
as by the type of NTMs, employing one of the inventory approaches, the frequency ratio
measure. More specifically, this paper has constructed a common dataset of NTMs across
countries and attempted to identify what sorts of NTMs are implemented, how pervasively
they are applied, and which industries are more widely protected than others in the region.
Our frequency-ratio-based analysis reveals that although how to implement NTMs
differs among countries, (i) there exist various trade impediments in ASEAN, (ii) non-core
NTMs, which can be described as trade protecting measures, are in general more pervasively
utilized than core NTMs or more direct and explicit trade barriers, and (iii) some products are
likely to be more highly protected than others in a complicated manner by applying multiple
NTMs. Our by-industry analysis also demonstrates that (i) non-core NTMs, particularly
health and sanitary regulations and quality standards and SPS measures, are widely applied
mainly to the industry of animals, plants and food, and (ii) several types of NTMs are
simultaneously utilized to protect industries such as animals, plants and food, chemicals and
chemical products, and machineries.
It is essential to reveal existing NTMs in practice, though it is not an easy task to fully
identify all the existing measures due to the non-transparent nature of NTMs. Some countries
may not recognize certain trade-distorting measures as an NTM or may not sufficiently
capture the actual implementation. All the measures examined in this paper could induce
trade restrictions and raise trade costs; even government policies, the implementation of
which is legitimate under multilateral trading rules or can be justified with certain rational
reasons, could become disguised trade restrictions when they are intentionally implemented
to impede trade or protect domestic industries. It is also crucial to seriously understand that
simultaneous implementation of various NTMs would cause not only actual (physical) costs
but also the administrative costs and time costs.

52
Enhancing trade liberalization and facilitation is particularly important for ASEAN
countries to further develop international production/distribution networks that have been
rapidly formed in East Asia since the 1990s. In the process of establishing AEC, ASEAN
countries have attempted to make efforts to reduce/eliminate NTMs and enhance trade
facilitation. Although all the action plans for trade facilitation may not be easily carried out,
we would like to expect the realization of the ASW as the first and greatest step.
53
References
Ando, M. (2005). ―Estimating tariff equivalents of core and non-core non-tariff measures in
the APEC member economies‖, in P. Dee and M. Ferrantino, eds., Quantitative
Methods for Assessing the Effects of Non-tariff Measures and Trade Facilitation
(Singapore, APEC Secretariat), pp. 235-287.
Ando, M. (2009), ―Non-tariff measures and trade and investment facilitation in ASEAN –
evaluation from the economic perspective‖, Mita Shogaku Kenkyu, vol. 52 (in
Japanese).
Bacchetta, M. and B. Bora (2001). ―Post-Uruguay round market access barriers for industrial
products,‖ UNCTAD Policy Issues in International Trade and Commodities, Study
Series No. 12, UNCTAD/ITCD/TAB/13 (Geneva).
Baldwin, R. E. (1970). Nontariff Distortions of International Trade (Washington, D.C., the
Brookings Institution).
Bosworth, M. (1999). ―Non-tariff measures as trade barriers – yesterday‘s problem or what?‖,
paper presented at the OECD Workshop with Non-Member Economies on Barriers to
Trade in Goods and Services in the Post-Uruguay Round Context, Paris, 27-28
September.
Deardorff, A.V. and R.M. Stern (1998). Measurement of Nontariff Barriers (Ann Arbor,
University of Michigan Press).
Laird, S. and A. Yeats (1990). ―Trends in nontariff barriers of developed countries, 1966-
1986,‖ Review of World Economics (Weltwirtschaftliches Archiv), vol. 126, No. 2, pp.
299-325.
OECD (1997). Indicators of Tariff and Non-tariff Trade Barriers (Paris).
_____ (2003). Overview of Non-tariff Barriers: Findings from Existing Business Surveys,
OECD Trade Committee (Paris).
Pacific Economic Cooperation Council (2000). Non-tariff Measures in Goods and Services
Trade (Singapore).
WTO, ITC and UNCTAD (2008). World Tariff Profiles 2008, available from
http://www.wto.org/english/res_e/reser_e/tariff_profiles_e.htm.

54
Appendix A
Method for categorizing NTMs
NTMs are classified into 15 different types at the most disaggregated level, based on
the information voluntarily reported by each of ASEAN countries. Since description of the
application of NTMs varies across countries, the following criteria are employed to determine
the types of NTMs that are reported by each country and to develop our dataset based on the
common classification.
An NTM is identified as ―non-automatic licensing‖ / ‖prior to authorization for
sensitive product categories‖ under the category of quantity control measures if the
description of the NTM refers the requirement of product registration not aiming at quality
control, including the case when the NTM is originally reported as licensing measures.
An NTM is identified as ―testing, inspection and quarantine requirements‖ under the
subcategory of technical regulations if the following words, ―testing‖, ―quarantine‖, and/or
―inspection‖, appear in the description of the NTM.
For manufactured products and materials, an NTM is regarded as ―safety and industrial
standards‖ under the subcategory of technical regulations (i) if the description of the NTM
refers to the standard that is required to be satisfied by the exported product, or (ii) if the
description of the NTM refers to the requirement of product registration aiming at quality
control.
For food and processed food, and chemicals and chemical products, an NTM is
regarded as ―health and sanitary regulations, and quality standards‖ if the description of the
NTM includes the requirement of certificate or product registration aiming at quality control.
For live animals and animal-origin products and plants, an NTM is regarded as ―health and
sanitary regulations and quality standards‖ under the subcategory of technical regulations
when the NTM is not originally listed as SPS measures and (i) if the description of an NTM
refers to the requirement of certificate, or (ii) if the NTM is subject to rules of origin.
An NTM is regarded as ―SPS measures‖ under the subcategory of technical regulations if the
description of the NTM includes the phrase ―sanitary and phytosanitary (SPS) measures‖ or
―the SPS agreement‖.
An NTM is classified into ―pre-shipment inspection‖ under the category of technical
measures (i) if testing or inspection is required at the port of entry prior to exporting, or (ii) if
the description of the NTM refers to the requirement of certificate issued by the country of
origin.

55
Appendix B
Industry classification and the corresponding HS two-digit codes
Classification:
6 industries
Classification: 21 industries HS
codes
Number
of tariff
lines
(5,224)
Animals,
plants and
foods
(729)
1. Live animals; edible products of animal origin HS1-5 220
2. Live plants; edible vegetables and fruits; vegetable
products
HS6-14 269
3. Animal or vegetable fats and oils HS15 46
4. Edible preparations; beverages; tobacco HS16-24 194
Chemicals and
chemical
products
(1,025)
6. Chemicals and chemical products HS28-38 813
7. Plastics and articles thereof; rubber and articles
thereof
HS39-40 212
Light
manufactured
goods
(1,404)
8. Raw hides and skins; leather and articles thereof;
fur skins and fur products
HS41-43 74
9. Wood and articles thereof; wood charcoal; cork
and articles thereof; straw and esparto products
HS44-46 84
10. Pulp, paper, and paperboard and articles thereof;
products of printing industry
HS47-49 150
11. Textile fibers; yarn; textile and woven fabrics;
articles of apparel and clothing accessories
HS50-63 848
12. Footwear; headgear; umbrellas and sticks HS64-67 55
13. Articles of stone, plaster, cement, asbestos and
mica; ceramic products; glass and glassware
HS68-70 140
14. Natural or cultured pearls, precious or semi-
precious stones
HS71 53
Metals and
metal products
(584)
15. Base metals and articles thereof HS72-83 584
Machineries
(1,172)
16. Machinery and mechanical appliances and parts
thereof; electrical machinery and equipment and
parts thereof
HS84-85 799
17. Vehicles and parts thereof; aircraft, spacecraft,
and parts thereof; ships, boats and floating structures
HS86-89 134
18. Optical, photographic, cinematographic,
measuring, checking, precision, medical instruments;
clocks and watches and parts thereof; musical
instruments and parts and accessories thereof
HS90-92 239
Other products
(310)
5. Minerals and mineral products HS25-27 152
19. Arms and ammunition and parts and accessories
thereof
HS93 21
20. Miscellaneous manufactured articles HS94-96 130
21. Works of art, collectors‘ pieces and antiques HS97 7
Notes: The figures in parentheses in the column of six industries show the total numbers of
tariff lines in respective industries.