chapter four - shodhganga : a reservoir of indian...
TRANSCRIPT
CHAPTER FOUR
DATA COLLECTION AND ANALYSIS
DATA COLLECTION AND ANALYSIS
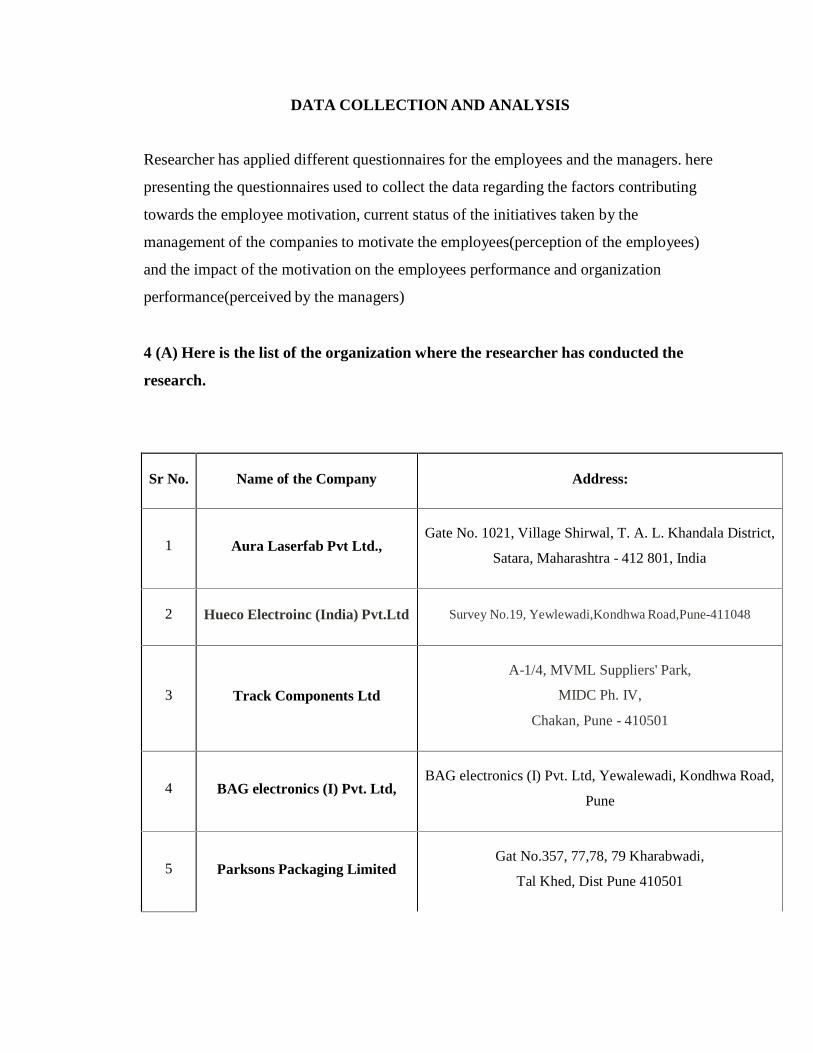
Researcher has applied different questionnaires for the employees and the managers. here
presenting the questionnaires used to collect the data regarding the factors contributing
towards the employee motivation, current status of the initiatives taken by the
management of the companies to motivate the employees(perception of the employees)
and the impact of the motivation on the employees performance and organization
performance(perceived by the managers)
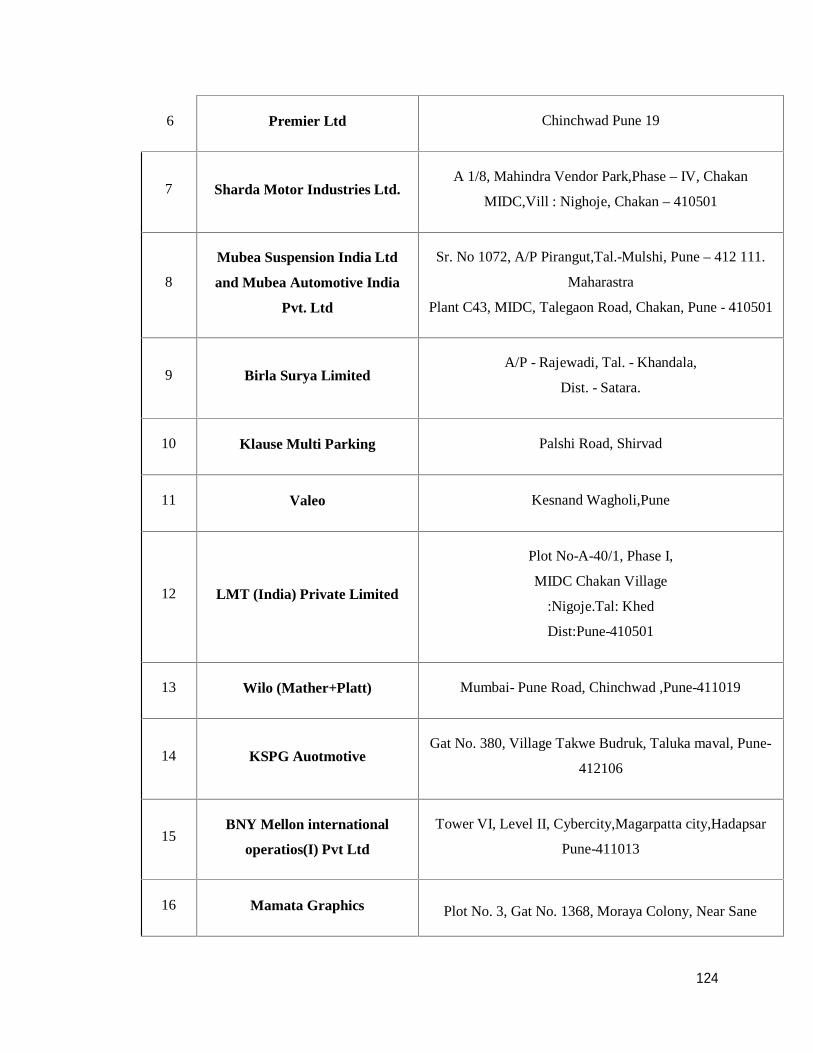
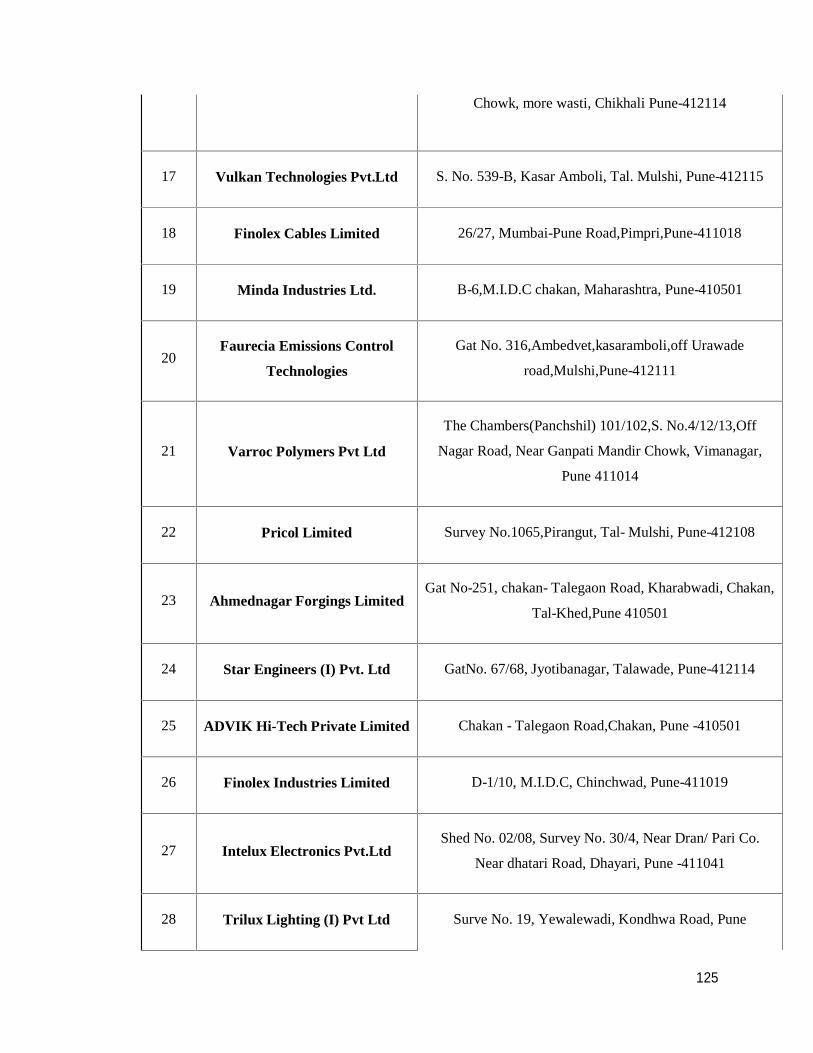
4 (A) Here is the list of the organization where the researcher has conducted the
research.
Sr No. Name of the Company Address:
1 Aura Laserfab Pvt Ltd.,Gate No. 1021, Village Shirwal, T. A. L. Khandala District,
Satara, Maharashtra - 412 801, India
2 Hueco Electroinc (India) Pvt.Ltd Survey No.19, Yewlewadi,Kondhwa Road,Pune-411048
3 Track Components Ltd
A-1/4, MVML Suppliers' Park,
MIDC Ph. IV,
Chakan, Pune - 410501
4 BAG electronics (I) Pvt. Ltd,BAG electronics (I) Pvt. Ltd, Yewalewadi, Kondhwa Road,
Pune
5 Parksons Packaging LimitedGat No.357, 77,78, 79 Kharabwadi,
Tal Khed, Dist Pune 410501
Premier Ltd Chinchwad Pune 19
7 Sharda Motor Industries Ltd.A 1/8, Mahindra Vendor Park,Phase – IV, Chakan
MIDC,Vill : Nighoje, Chakan – 410501
8
Mubea Suspension India Ltd
and Mubea Automotive India
Pvt. Ltd
Sr. No 1072, A/P Pirangut,Tal.-Mulshi, Pune – 412 111.
Maharastra
Plant C43, MIDC, Talegaon Road, Chakan, Pune - 410501
9 Birla Surya LimitedA/P - Rajewadi, Tal. - Khandala,
Dist. - Satara.
10 Klause Multi Parking Palshi Road, Shirvad
11 Valeo Kesnand Wagholi,Pune
12 LMT (India) Private Limited
Plot No-A-40/1, Phase I,
MIDC Chakan Village
:Nigoje.Tal: Khed
Dist:Pune-410501
13 Wilo (Mather+Platt) Mumbai- Pune Road, Chinchwad ,Pune-411019
14 KSPG AuotmotiveGat No. 380, Village Takwe Budruk, Taluka maval, Pune-
412106
15BNY Mellon international
operatios(I) Pvt Ltd
Tower VI, Level II, Cybercity,Magarpatta city,Hadapsar
Pune-411013
16 Mamata Graphics Plot No. 3, Gat No. 1368, Moraya Colony, Near Sane
6
124
Chowk, more wasti, Chikhali Pune-412114
17 Vulkan Technologies Pvt.Ltd S. No. 539-B, Kasar Amboli, Tal. Mulshi, Pune-412115
18 Finolex Cables Limited 26/27, Mumbai-Pune Road,Pimpri,Pune-411018
19 Minda Industries Ltd. B-6,M.I.D.C chakan, Maharashtra, Pune-410501
20Faurecia Emissions Control
Technologies
Gat No. 316,Ambedvet,kasaramboli,off Urawade
road,Mulshi,Pune-412111
21 Varroc Polymers Pvt Ltd
The Chambers(Panchshil) 101/102,S. No.4/12/13,Off
Nagar Road, Near Ganpati Mandir Chowk, Vimanagar,
Pune 411014
22 Pricol Limited Survey No.1065,Pirangut, Tal- Mulshi, Pune-412108
23 Ahmednagar Forgings LimitedGat No-251, chakan- Talegaon Road, Kharabwadi, Chakan,
Tal-Khed,Pune 410501
24 Star Engineers (I) Pvt. Ltd GatNo. 67/68, Jyotibanagar, Talawade, Pune-412114
25 ADVIK Hi-Tech Private Limited Chakan - Talegaon Road,Chakan, Pune -410501
26 Finolex Industries Limited D-1/10, M.I.D.C, Chinchwad, Pune-411019
27 Intelux Electronics Pvt.LtdShed No. 02/08, Survey No. 30/4, Near Dran/ Pari Co.
Near dhatari Road, Dhayari, Pune -411041
28 Trilux Lighting (I) Pvt Ltd Surve No. 19, Yewalewadi, Kondhwa Road, Pune
125
126126126
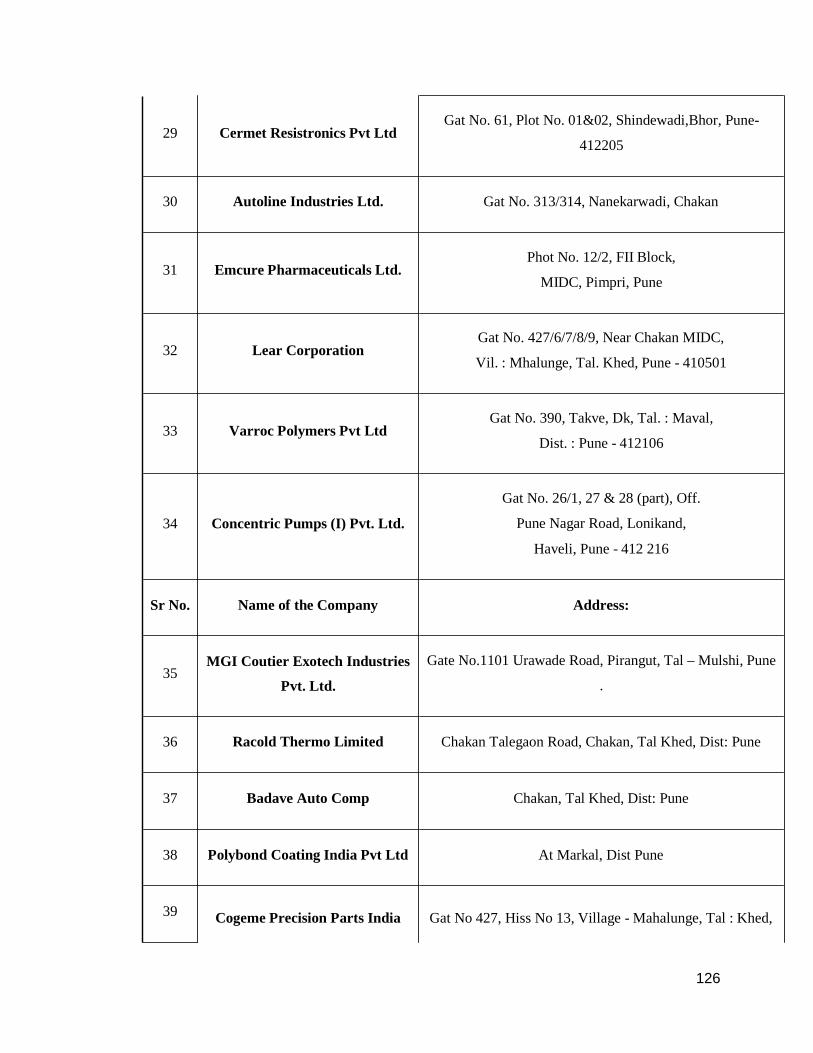
29 Cermet Resistronics Pvt LtdGat No. 61, Plot No. 01&02, Shindewadi,Bhor, Pune-
412205
30 Autoline Industries Ltd. Gat No. 313/314, Nanekarwadi, Chakan
31 Emcure Pharmaceuticals Ltd.Phot No. 12/2, FII Block,
MIDC, Pimpri, Pune
32 Lear CorporationGat No. 427/6/7/8/9, Near Chakan MIDC,
Vil. : Mhalunge, Tal. Khed, Pune - 410501
33 Varroc Polymers Pvt LtdGat No. 390, Takve, Dk, Tal. : Maval,
Dist. : Pune - 412106
34 Concentric Pumps (I) Pvt. Ltd.
Gat No. 26/1, 27 & 28 (part), Off.
Pune Nagar Road, Lonikand,
Haveli, Pune - 412 216
Sr No. Name of the Company Address:
MGI Coutier Exotech Industries35
Pvt. Ltd.
Gate No.1101 Urawade Road, Pirangut, Tal – Mulshi, Pune
.
36 Racold Thermo Limited Chakan Talegaon Road, Chakan, Tal Khed, Dist: Pune
37 Badave Auto Comp Chakan, Tal Khed, Dist: Pune
38 Polybond Coating India Pvt Ltd At Markal, Dist Pune
39 Cogeme Precision Parts India Gat No 427, Hiss No 13, Village - Mahalunge, Tal : Khed,
127127127
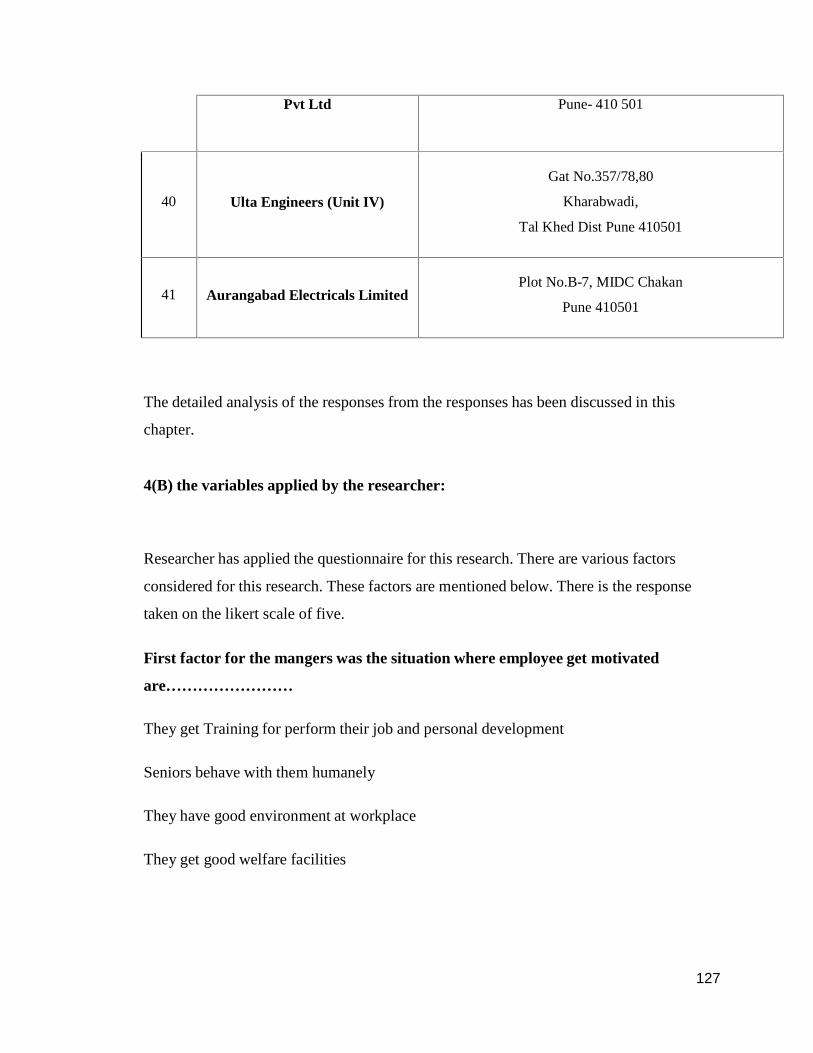
Pvt Ltd Pune- 410 501
40 Ulta Engineers (Unit IV)
Gat No.357/78,80
Kharabwadi,
Tal Khed Dist Pune 410501
41 Aurangabad Electricals LimitedPlot No.B-7, MIDC Chakan
Pune 410501
The detailed analysis of the responses from the responses has been discussed in this
chapter.
4(B) the variables applied by the researcher:
Researcher has applied the questionnaire for this research. There are various factors
considered for this research. These factors are mentioned below. There is the response
taken on the likert scale of five.
First factor for the mangers was the situation where employee get motivated
are……………………
They get Training for perform their job and personal development
Seniors behave with them humanely
They have good environment at workplace
They get good welfare facilities

128128128
They get opportunities for Career development and Promotion
They get Awards, Rewards, Appreciation, Recognition for Good Work
They have job security
They get more salary
And the impact of the motivated employees is………………………………………….
Give good Productivity, Quality & Efficiency
Helps to improve working environment
Learn and do new things
Perform multiskill jobs Improve
their carrier growth Maintain good
work life balance Improve
interpersonal relationship
Are more satisfied & enjoy their work
129129129
Are open to change their Behavior& Attitude
Are highly disciplined
There is another questionnaire applied for the employees. the factors considered for
the responses from the employees are as…………………………..
Response for the general statements is as follows:
I am satisfied with the overall support from the HR Department
The types of incentives and other benefits motivates me more
Personnel policies and other welfare measures(Canteen, Transport, Medical Inssurnace
etc) in my company are good
There are mechanisms to reward/appreciate any good work done or any contribution
made by the employees
I have good relations with my colleagues and superiors.
Safety measures at workplace are adequate
There is a strong feeling of team spirit, co-operation and good working environment in
the company
Our Management is interested in motivating the Employees
I feel secure about my continued employment at this organization
Our systems of Salary Increments are helpful to get employees motivated
130130130
We have Career development and Promotion opportunities in this Organisation
Management involves us in decision making which are related to our department/work.
Good salary paid to employees who do their jobs very well motivates them.
I am satisfied with the shift timings given in the company
I am satisfied with my current job
I receive the training I need to do my job
Motivation at work place help us to maintain good work life balance
The responses for the motivation according to the employees is found to in
…………………………..
We are provided with Training
When seniors behave with us humanely
We get good environment at workplace
We get good welfare facilities
We get opportunities for Career development and Promotion
We get Awards, Rewards, Appreciation, Recognition for Good Work
We have Job Security
We get more Salary
131131131
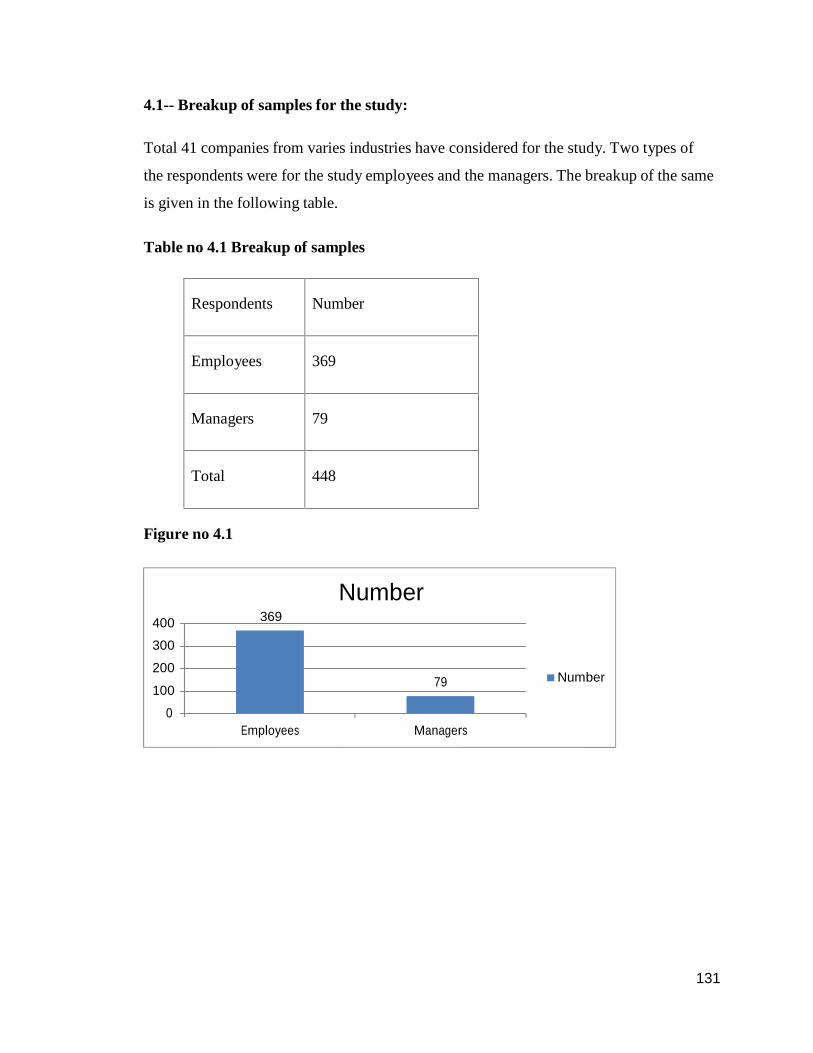
4.1-- Breakup of samples for the study:
Total 41 companies from varies industries have considered for the study. Two types of
the respondents were for the study employees and the managers. The breakup of the same
is given in the following table.
Table no 4.1 Breakup of samples
Respondents Number
Employees 369
Managers 79
Total 448
Figure no 4.1
400
300
200
100
0
369Number
79 Number
Employees Managers
132132132
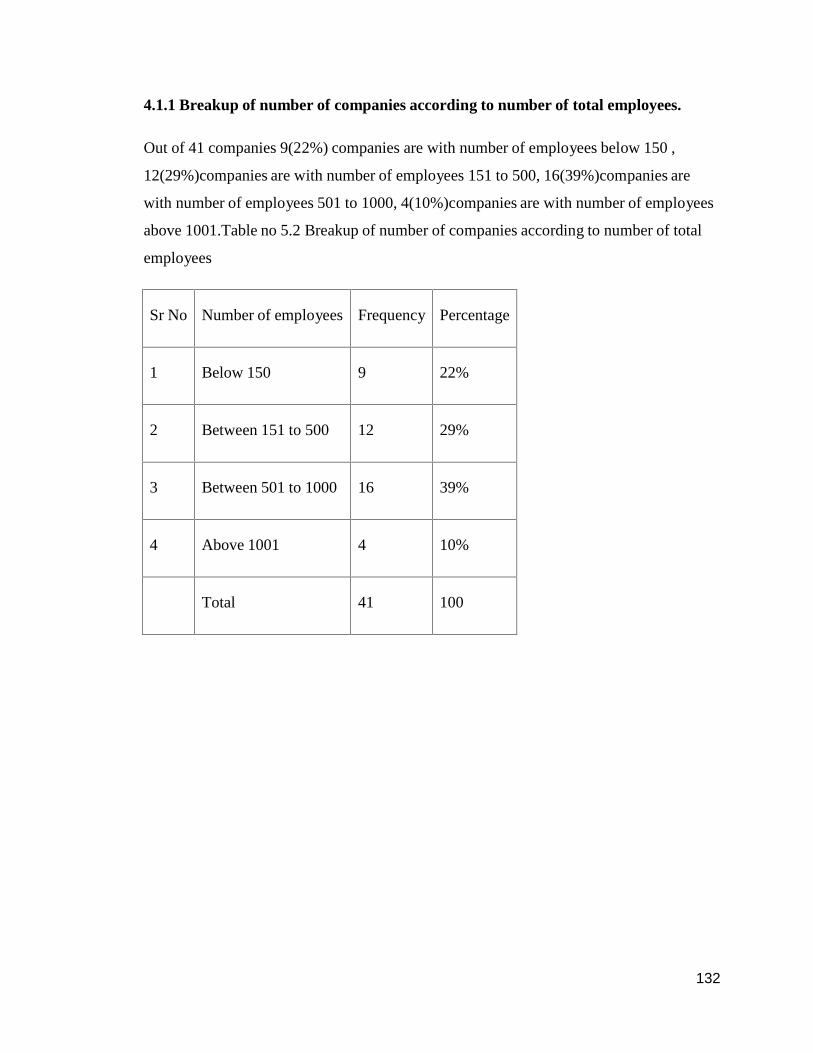
4.1.1 Breakup of number of companies according to number of total employees.
Out of 41 companies 9(22%) companies are with number of employees below 150 ,
12(29%)companies are with number of employees 151 to 500, 16(39%)companies are
with number of employees 501 to 1000, 4(10%)companies are with number of employees
above 1001.Table no 5.2 Breakup of number of companies according to number of total
employees
Sr No Number of employees Frequency Percentage
1 Below 150 9 22%
2 Between 151 to 500 12 29%
3 Between 501 to 1000 16 39%
4 Above 1001 4 10%
Total 41 100
133133133
Percentage
39%
10%22%
29%
Below 150
Between 151 to 500
Between 501 to 1000
Above 1001
Figure no 4.2
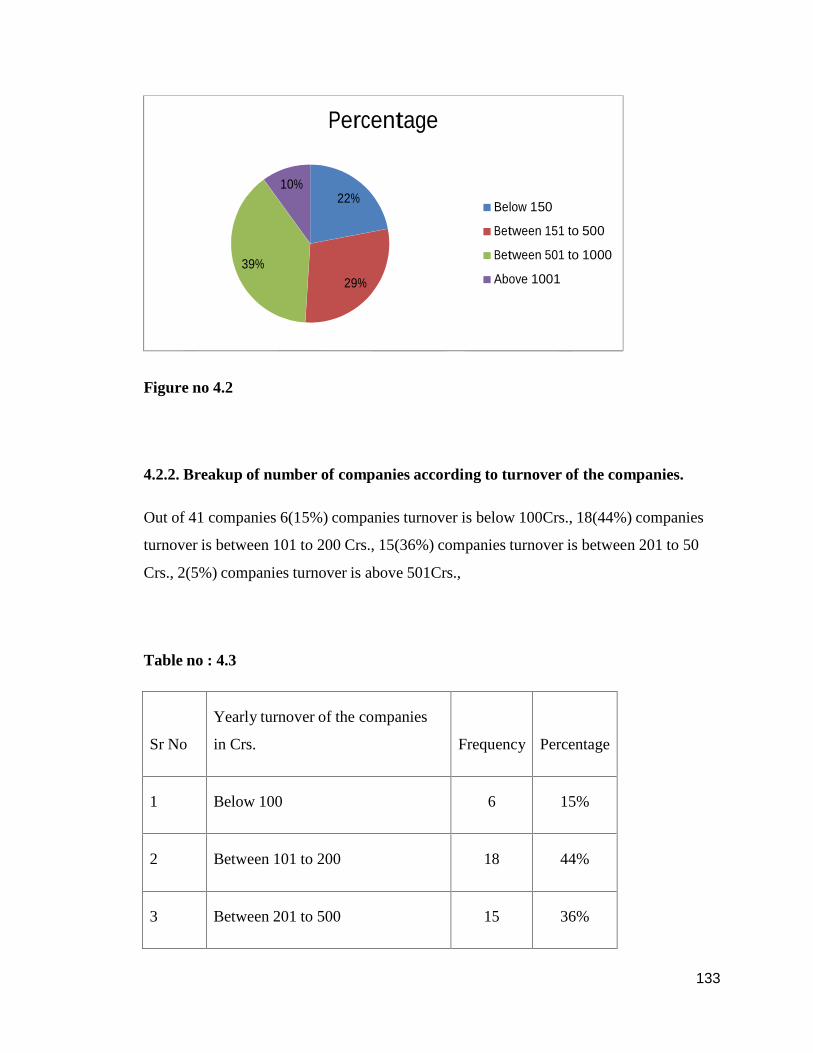
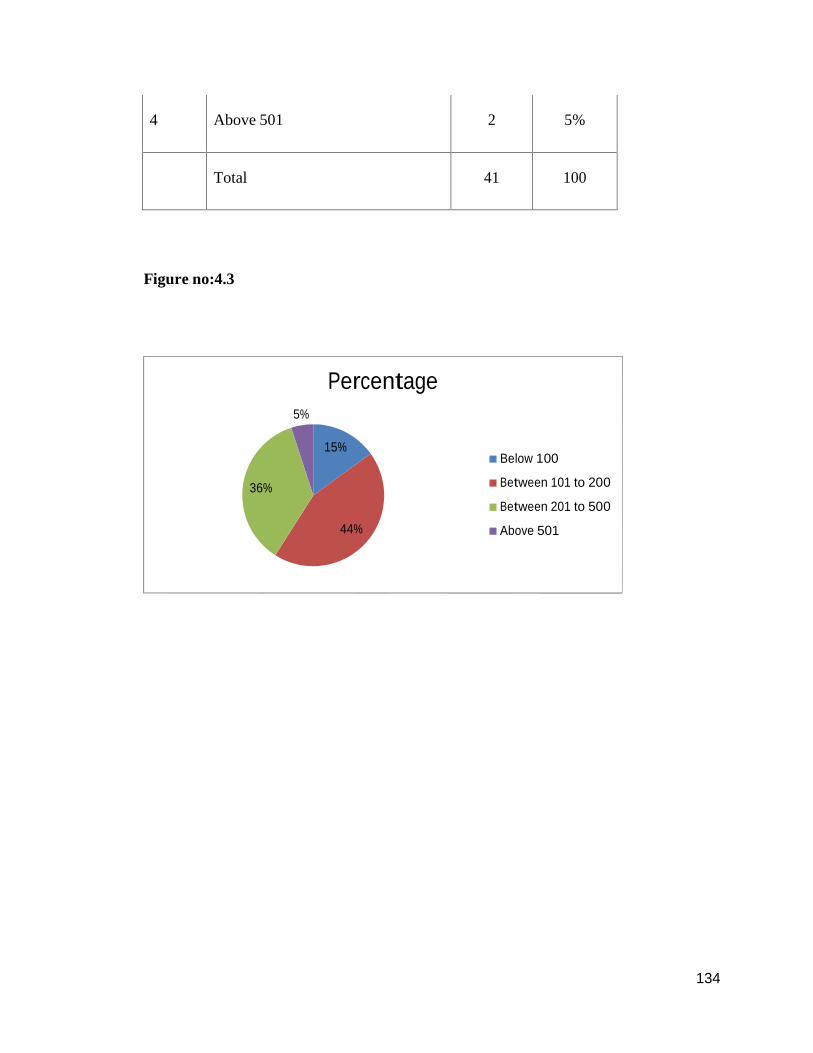
4.2.2. Breakup of number of companies according to turnover of the companies.
Out of 41 companies 6(15%) companies turnover is below 100Crs., 18(44%) companies
turnover is between 101 to 200 Crs., 15(36%) companies turnover is between 201 to 50
Crs., 2(5%) companies turnover is above 501Crs.,
Table no : 4.3
Sr No
Yearly turnover of the companies
in Crs. Frequency Percentage
1 Below 100 6 15%
2 Between 101 to 200 18 44%
3 Between 201 to 500 15 36%
134134134
4 Above 501 2 5%
Total 41 100
Figure no:4.3
Percentage5%
36%
15%
44%
Below 100
Between 101 to 200
Between 201 to 500
Above 501
135135135
4.3.1: Analysis of current status of perception of the employees towards initiatives
taken by the management at their companies.
Researcher has taken the response for the current status of the initiatives taken by the
management towards motivating the employees. Researcher has used five scale likert
scale from Fully disagree to Fully agree. Here are presented the frequency of the
agreement of the employees to the various questions.
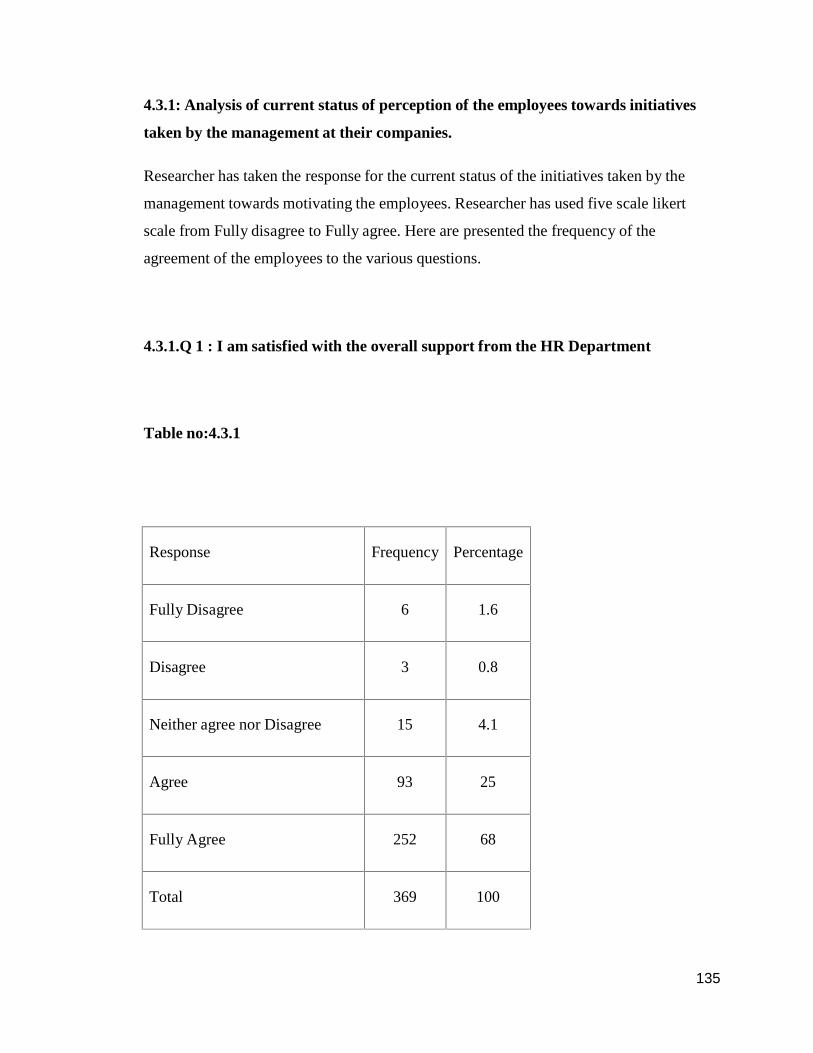
4.3.1.Q 1 : I am satisfied with the overall support from the HR Department
Table no:4.3.1
Response Frequency Percentage
Fully Disagree 6 1.6
Disagree 3 0.8
Neither agree nor Disagree 15 4.1
Agree 93 25
Fully Agree 252 68
Total 369 100
136136136
300
250
Frequency
252
200
150
100
50
0
93
6 3 15
Frequency
StronglyDisagree
Disagree Neitheragree norDisagree
Agree StronglyAgree
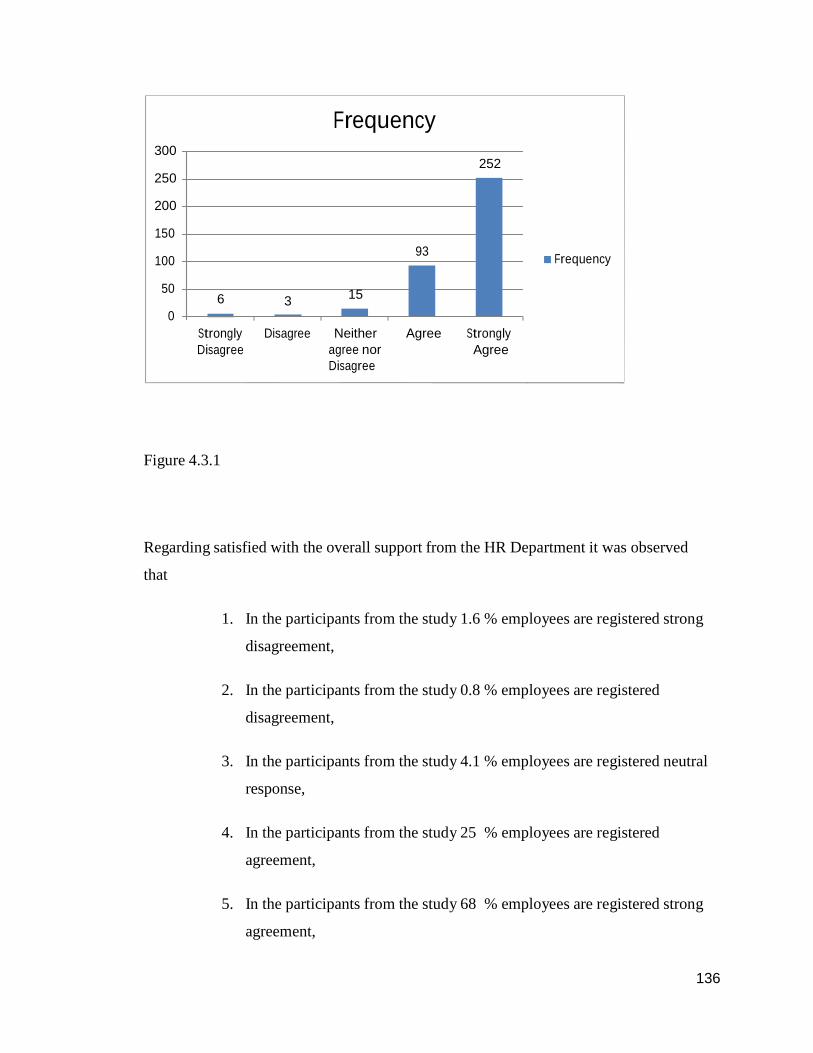
Figure 4.3.1
Regarding satisfied with the overall support from the HR Department it was observed
that
1. In the participants from the study 1.6 % employees are registered strong
disagreement,
2. In the participants from the study 0.8 % employees are registered
disagreement,
3. In the participants from the study 4.1 % employees are registered neutral
response,
4. In the participants from the study 25 % employees are registered
agreement,
5. In the participants from the study 68 % employees are registered strong
agreement,
137137137
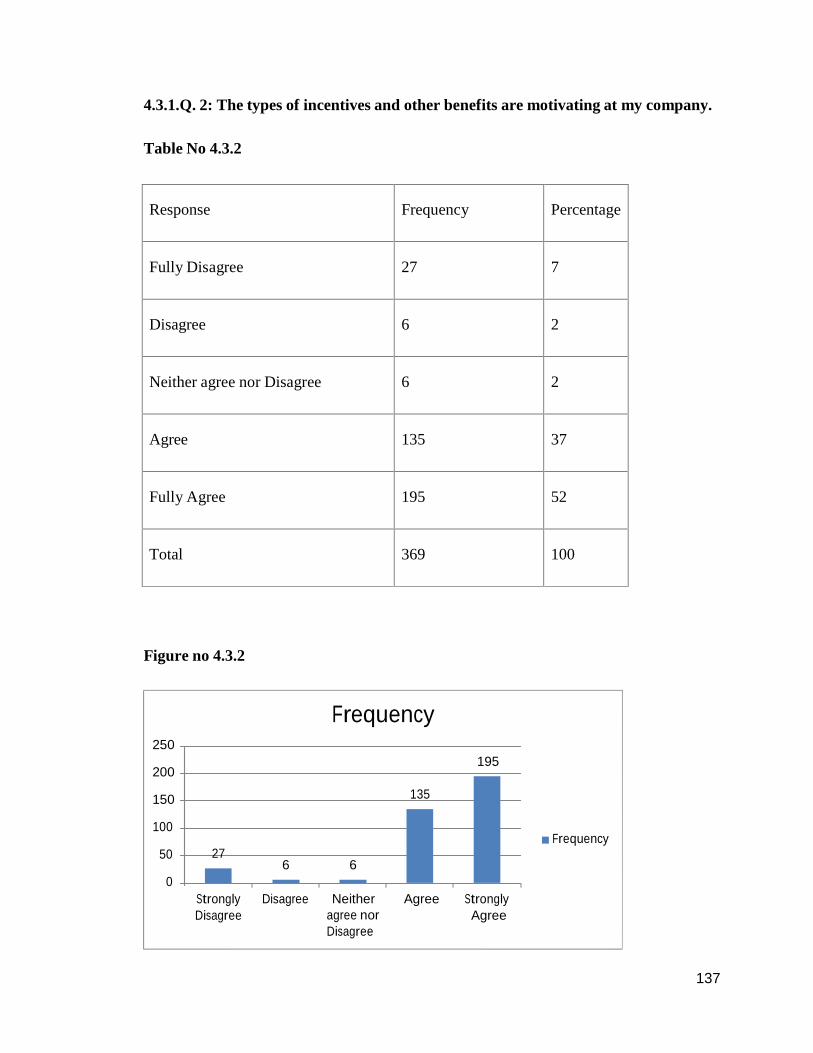
4.3.1.Q. 2: The types of incentives and other benefits are motivating at my company.
Table No 4.3.2
Response Frequency Percentage
Fully Disagree 27 7
Disagree 6 2
Neither agree nor Disagree 6 2
Agree 135 37
Fully Agree 195 52
Total 369 100
Figure no 4.3.2
250
200
150
Frequency
135
195
100
50
0
27
StronglyDisagree
6 6
Disagree Neitheragree norDisagree
Agree StronglyAgree
Frequency
138138138
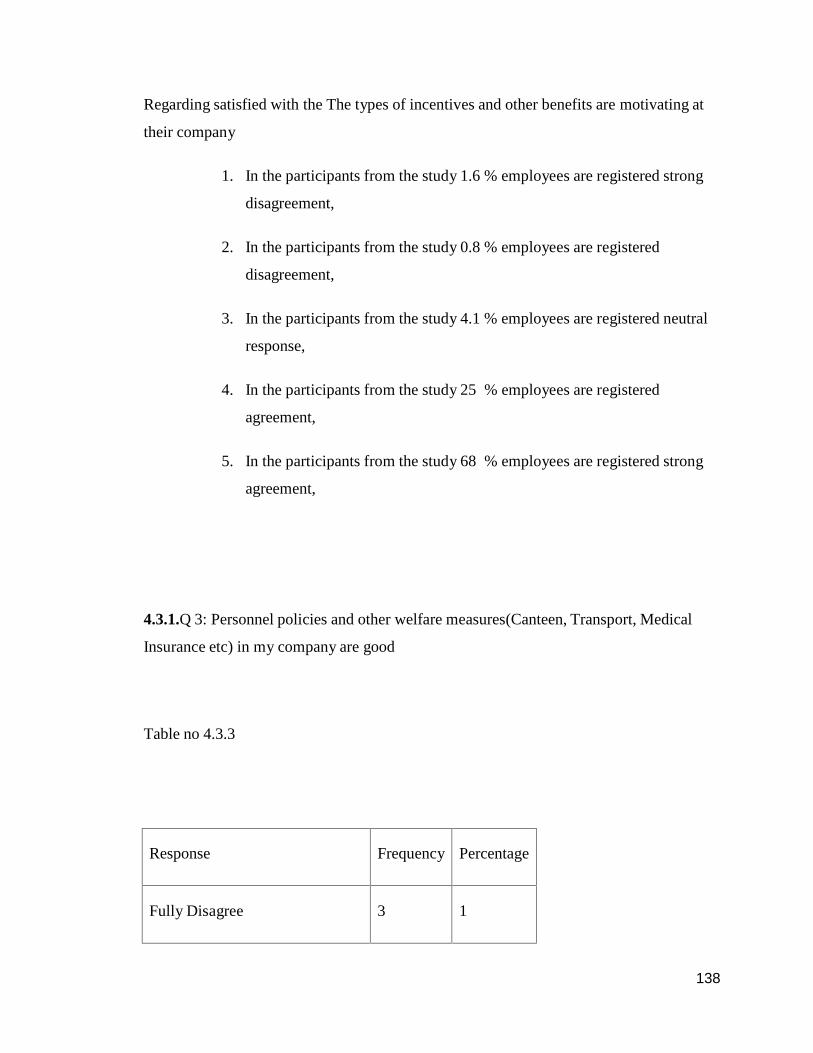
Regarding satisfied with the The types of incentives and other benefits are motivating at
their company
1. In the participants from the study 1.6 % employees are registered strong
disagreement,
2. In the participants from the study 0.8 % employees are registered
disagreement,
3. In the participants from the study 4.1 % employees are registered neutral
response,
4. In the participants from the study 25 % employees are registered
agreement,
5. In the participants from the study 68 % employees are registered strong
agreement,
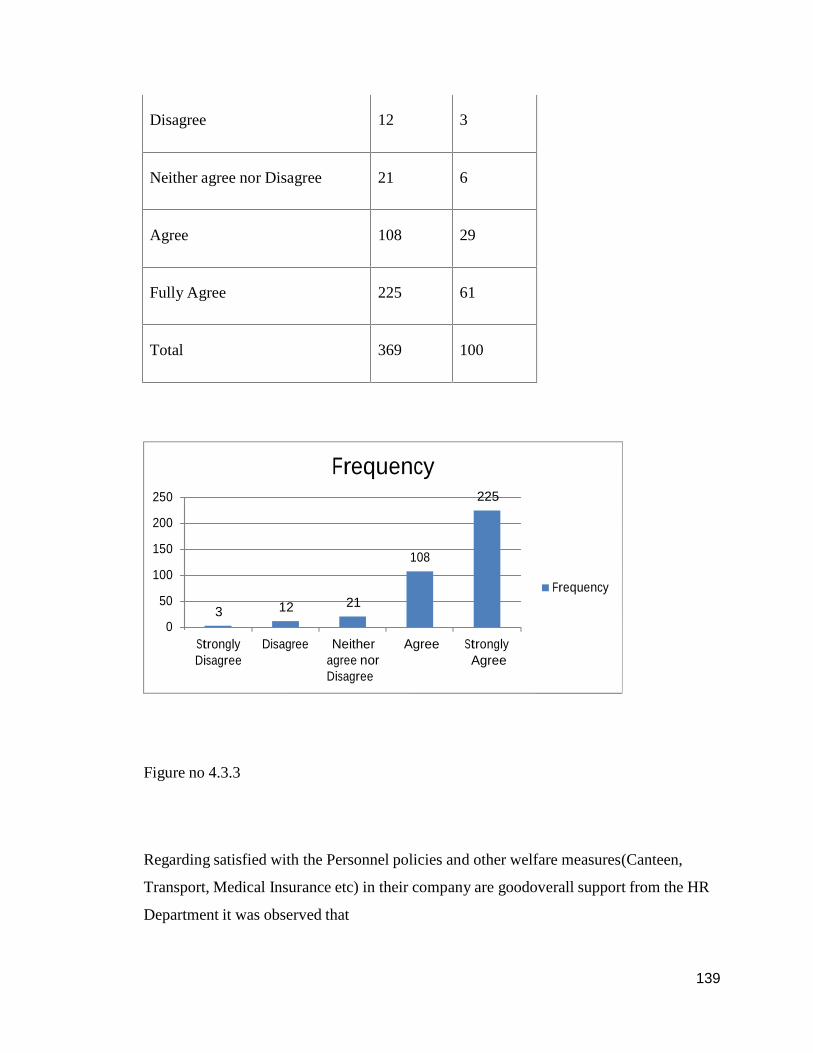
4.3.1.Q 3: Personnel policies and other welfare measures(Canteen, Transport, Medical
Insurance etc) in my company are good
Table no 4.3.3
Response Frequency Percentage
Fully Disagree 3 1
139139139
Disagree 12 3
Neither agree nor Disagree 21 6
Agree 108 29
Fully Agree 225 61
Total 369 100
250
200
150
100
50
0
Frequency
108
3 12 21
225
Frequency
StronglyDisagree
Disagree Neitheragree norDisagree
Agree StronglyAgree
Figure no 4.3.3
Regarding satisfied with the Personnel policies and other welfare measures(Canteen,
Transport, Medical Insurance etc) in their company are goodoverall support from the HR
Department it was observed that
140140140
1. In the participants from the study 1% employees are registered strong
disagreement,
2. In the participants from the study 3 % employees are registered
disagreement,
3. In the participants from the study 6 % employees are registered neutral
response,
4. In the participants from the study 29 % employees are registered
agreement,
5. In the participants from the study 61 % employees are registered strong
agreement,
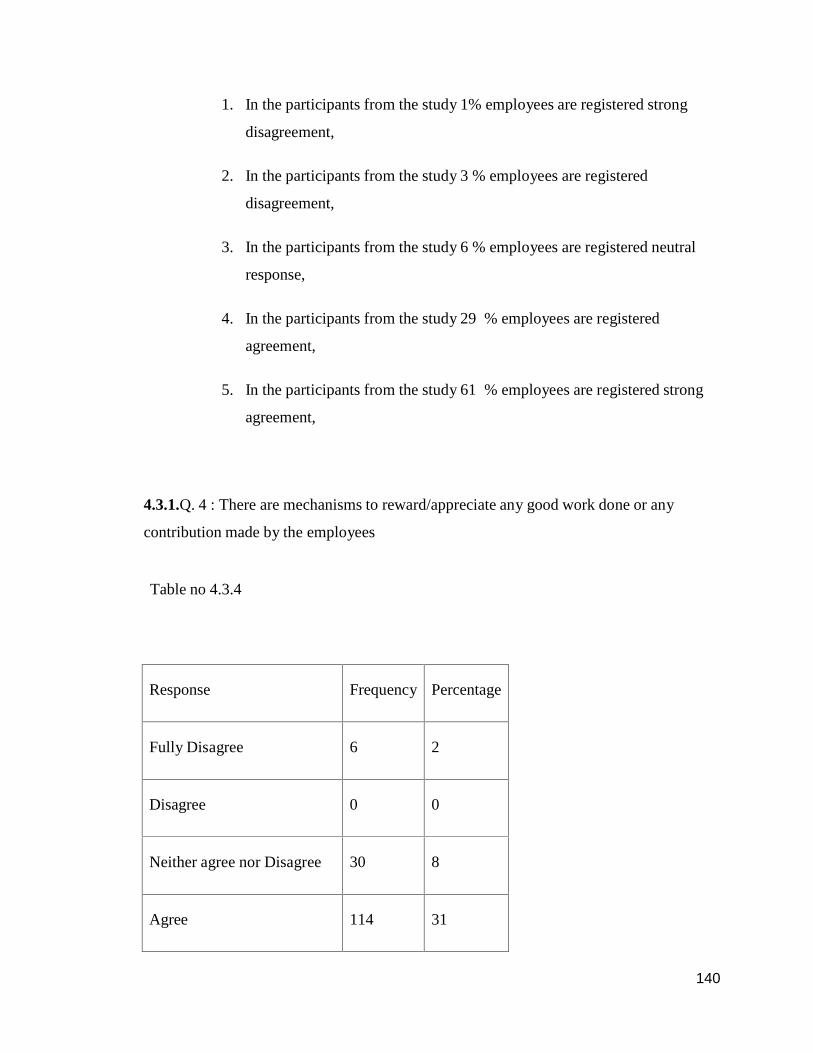
4.3.1.Q. 4 : There are mechanisms to reward/appreciate any good work done or any
contribution made by the employees
Table no 4.3.4
Response Frequency Percentage
Fully Disagree 6 2
Disagree 0 0
Neither agree nor Disagree 30 8
Agree 114 31
141141141
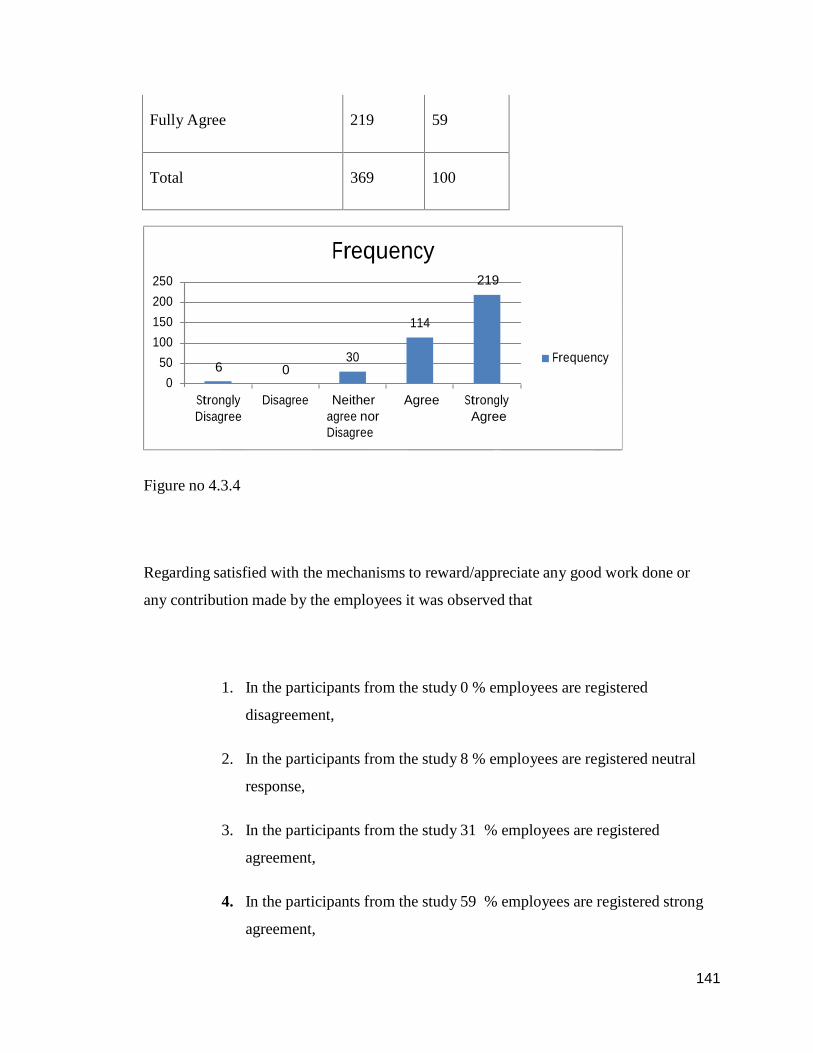
Fully Agree 219 59
Total 369 100
250200150100
500
Frequency
114
306 0
219
Frequency
StronglyDisagree
Disagree Neitheragree norDisagree
Agree StronglyAgree
Figure no 4.3.4
Regarding satisfied with the mechanisms to reward/appreciate any good work done or
any contribution made by the employees it was observed that
1. In the participants from the study 0 % employees are registered
disagreement,
2. In the participants from the study 8 % employees are registered neutral
response,
3. In the participants from the study 31 % employees are registered
agreement,
4. In the participants from the study 59 % employees are registered strong
agreement,
142142142
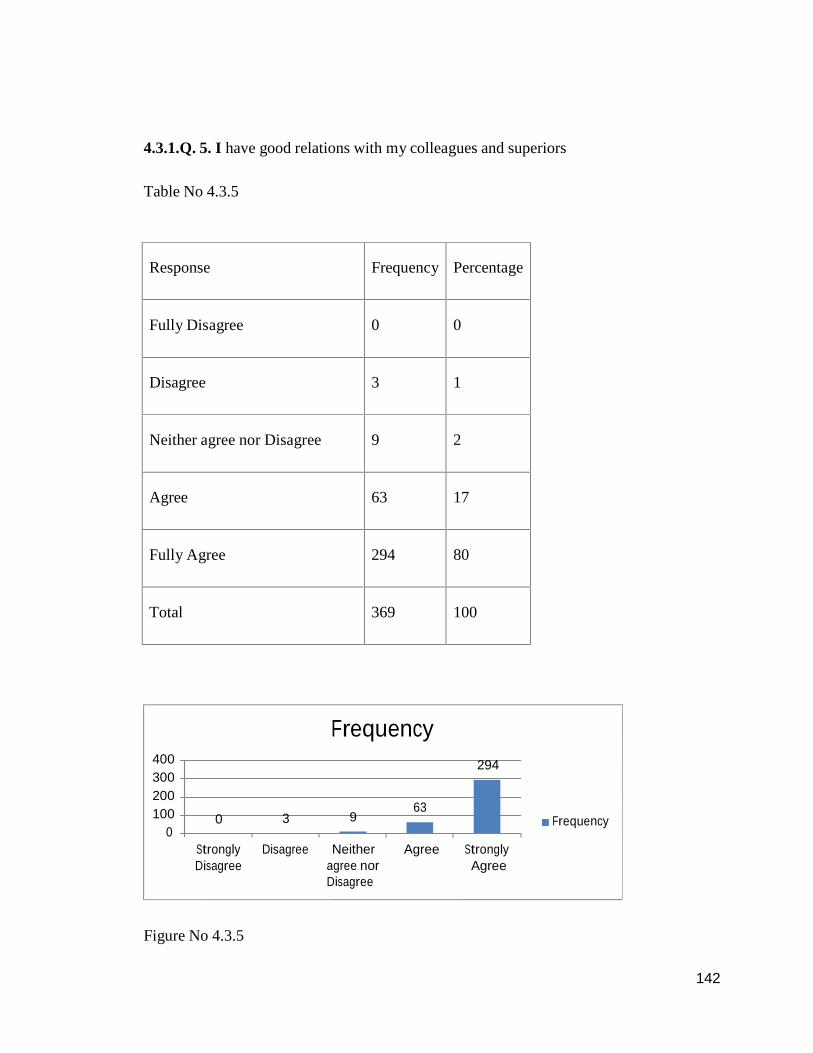
4.3.1.Q. 5. I have good relations with my colleagues and superiors
Table No 4.3.5
Response Frequency Percentage
Fully Disagree 0 0
Disagree 3 1
Neither agree nor Disagree 9 2
Agree 63 17
Fully Agree 294 80
Total 369 100
400300200100
0
Frequency
630 3 9
294
Frequency
StronglyDisagree
Disagree Neitheragree norDisagree
Agree StronglyAgree
Figure No 4.3.5
143143143
Regarding satisfied with having the good relations with their colleagues and superiors it
was observed that
1. In the participants from the study 0 % employees are registered strong
disagreement,
2. In the participants from the study 1 % employees are registered
disagreement,
3. In the participants from the study 2 % employees are registered neutral
response,
4. In the participants from the study 17 % employees are registered
agreement,
5. In the participants from the study 80 % employees are registered strong
agreement,
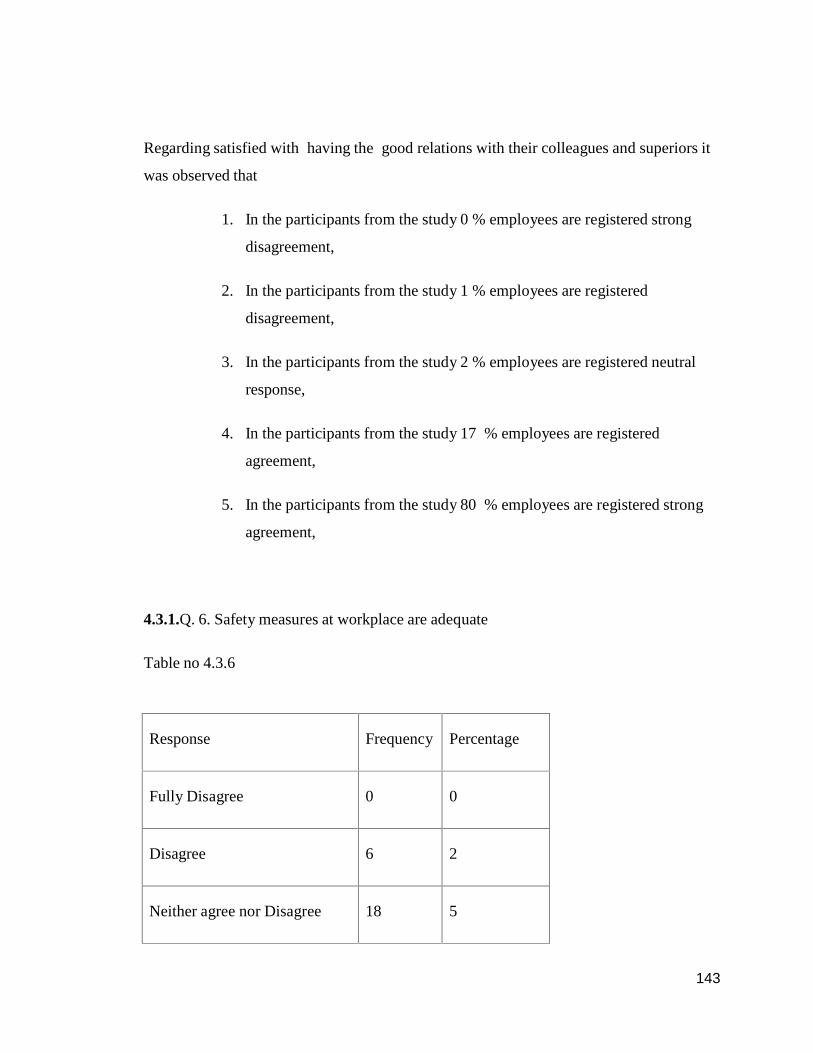
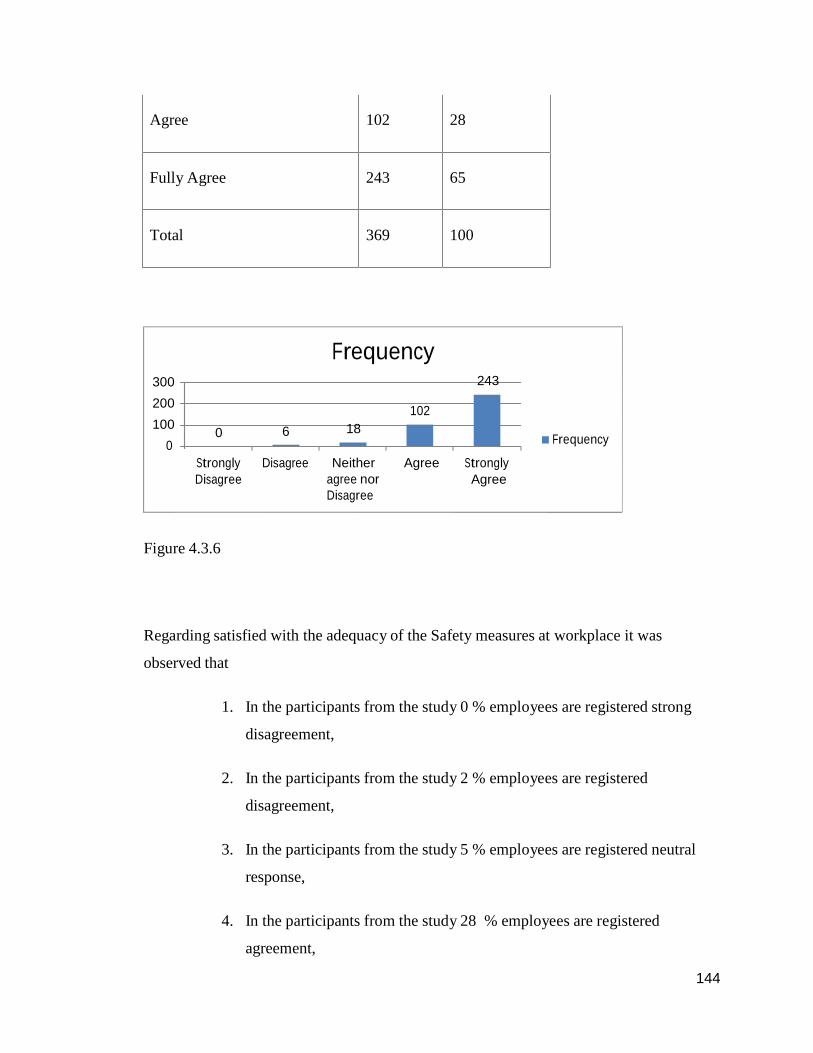
4.3.1.Q. 6. Safety measures at workplace are adequate
Table no 4.3.6
Response Frequency Percentage
Fully Disagree 0 0
Disagree 6 2
Neither agree nor Disagree 18 5
144144144
Agree 102 28
Fully Agree 243 65
Total 369 100
300200100
0
Frequency
102
0 6 18
243
Frequency
StronglyDisagree
Disagree Neitheragree norDisagree
Agree StronglyAgree
Figure 4.3.6
Regarding satisfied with the adequacy of the Safety measures at workplace it was
observed that
1. In the participants from the study 0 % employees are registered strong
disagreement,
2. In the participants from the study 2 % employees are registered
disagreement,
3. In the participants from the study 5 % employees are registered neutral
response,
4. In the participants from the study 28 % employees are registered
agreement,
145145145
5. In the participants from the study 65 % employees are registered strong
agreement,
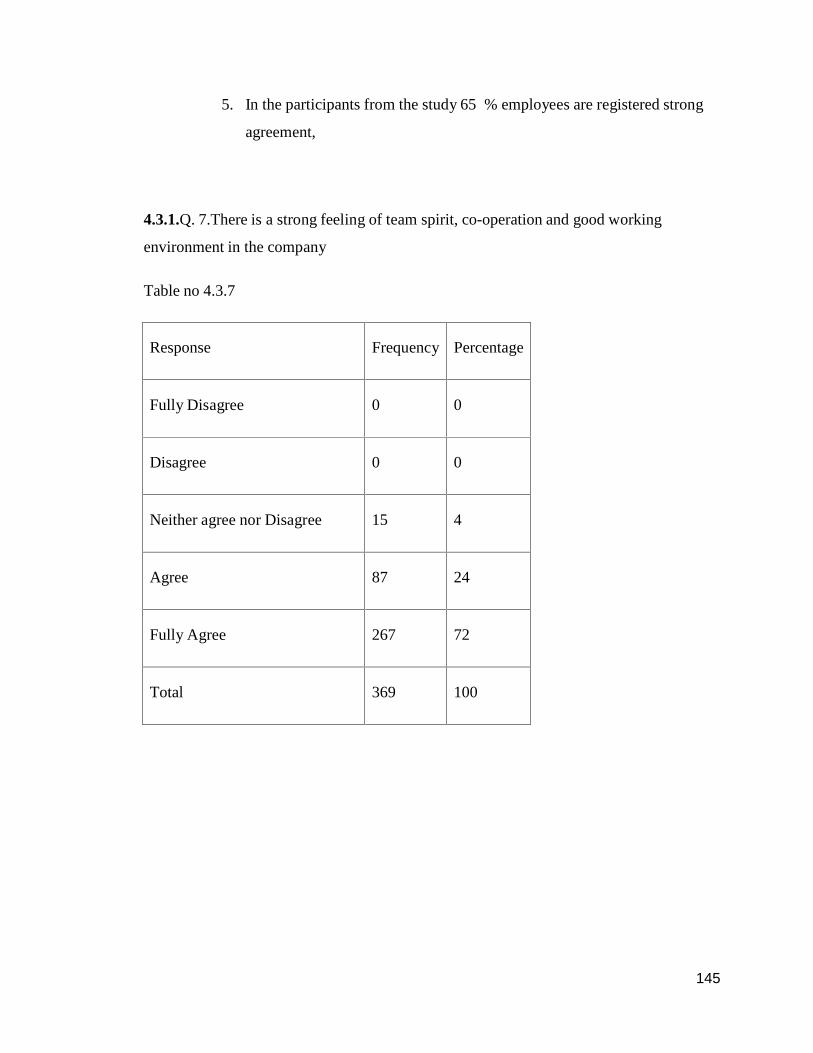
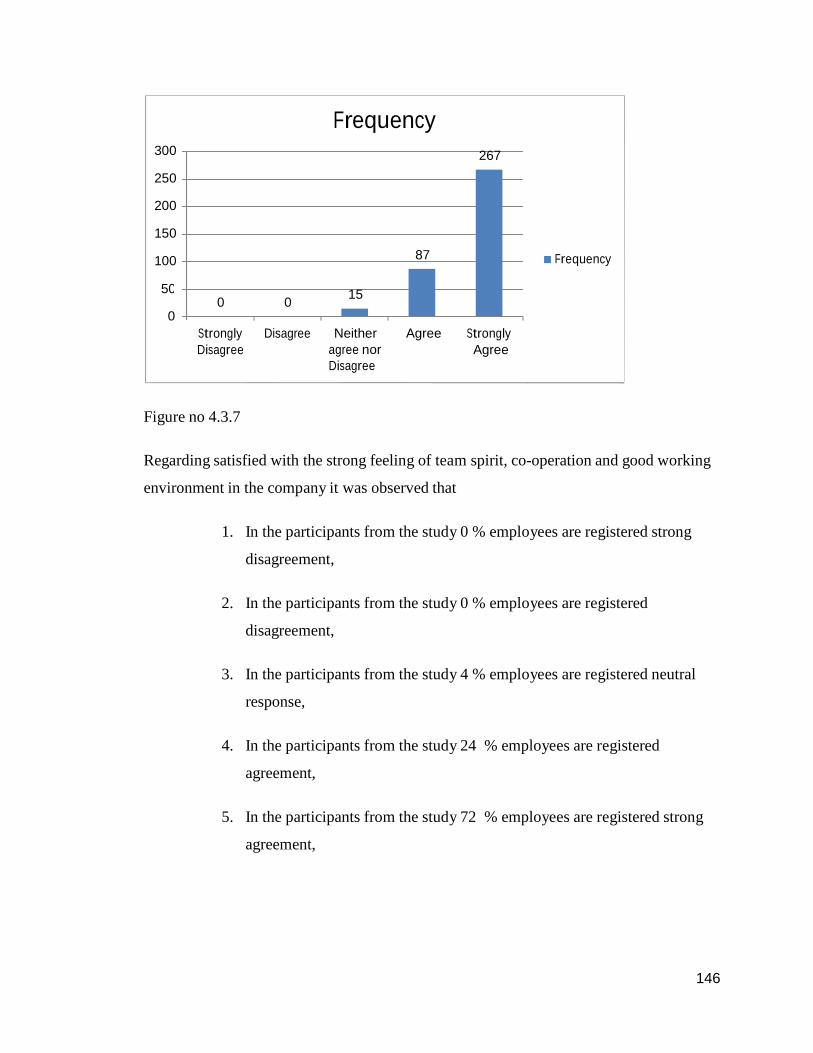
4.3.1.Q. 7.There is a strong feeling of team spirit, co-operation and good working
environment in the company
Table no 4.3.7
Response Frequency Percentage
Fully Disagree 0 0
Disagree 0 0
Neither agree nor Disagree 15 4
Agree 87 24
Fully Agree 267 72
Total 369 100
146146146
50
300
250
Frequency267
200
150
100 87 Frequency
0 0 150
StronglyDisagree
Disagree Neitheragree norDisagree
Agree StronglyAgree
Figure no 4.3.7
Regarding satisfied with the strong feeling of team spirit, co-operation and good working
environment in the company it was observed that
1. In the participants from the study 0 % employees are registered strong
disagreement,
2. In the participants from the study 0 % employees are registered
disagreement,
3. In the participants from the study 4 % employees are registered neutral
response,
4. In the participants from the study 24 % employees are registered
agreement,
5. In the participants from the study 72 % employees are registered strong
agreement,
147147147
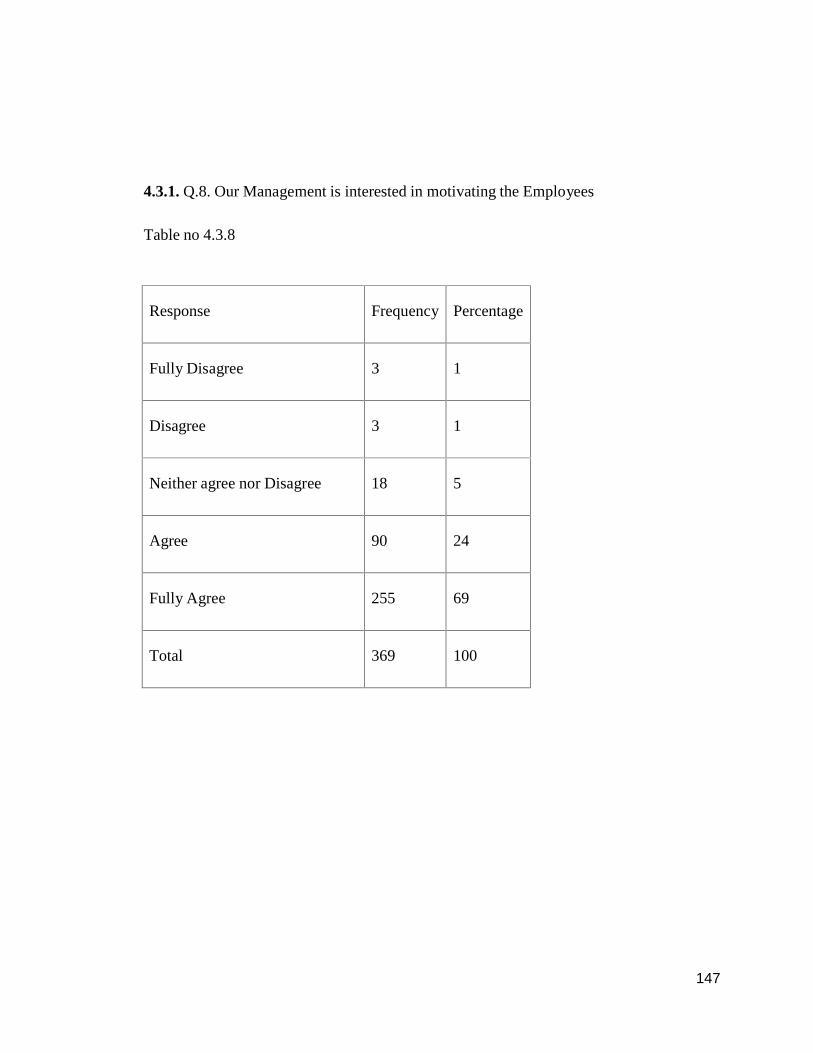
4.3.1. Q.8. Our Management is interested in motivating the Employees
Table no 4.3.8
Response Frequency Percentage
Fully Disagree 3 1
Disagree 3 1
Neither agree nor Disagree 18 5
Agree 90 24
Fully Agree 255 69
Total 369 100
148148148
300
250
Frequency255
200
150
100
50
0
90
3 3 18
Frequency
StronglyDisagree
Disagree Neitheragree norDisagree
Agree StronglyAgree
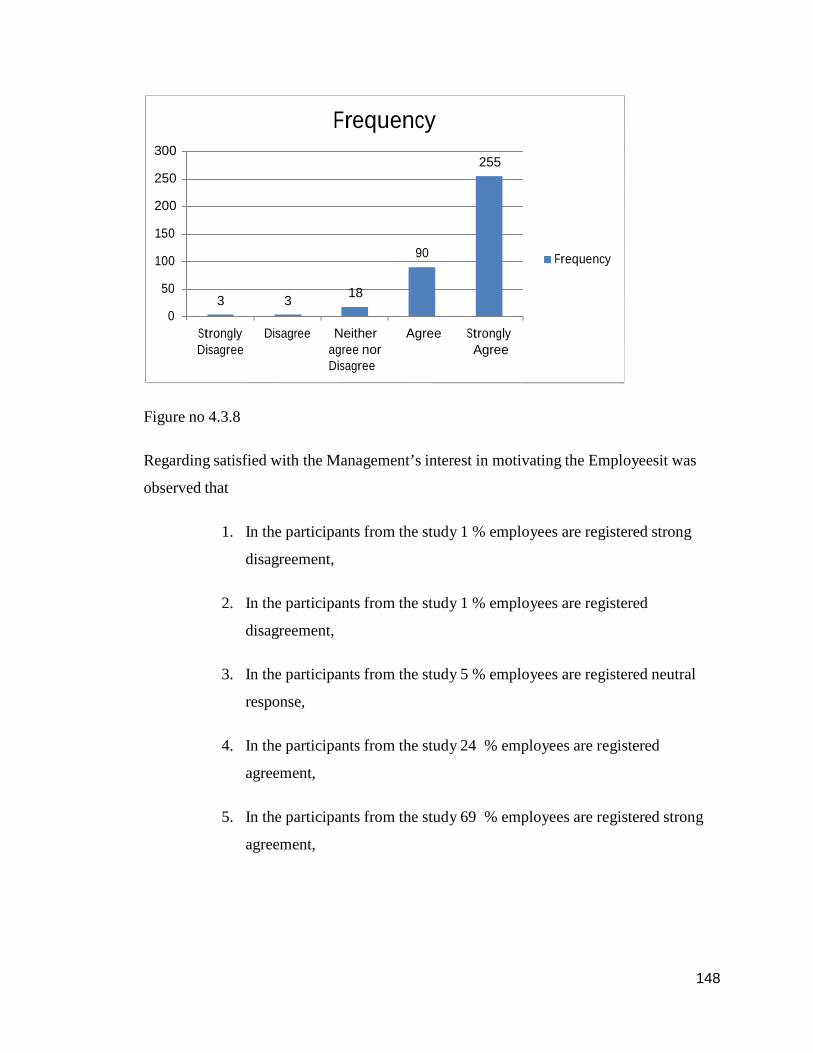
Figure no 4.3.8
Regarding satisfied with the Management’s interest in motivating the Employeesit was
observed that
1. In the participants from the study 1 % employees are registered strong
disagreement,
2. In the participants from the study 1 % employees are registered
disagreement,
3. In the participants from the study 5 % employees are registered neutral
response,
4. In the participants from the study 24 % employees are registered
agreement,
5. In the participants from the study 69 % employees are registered strong
agreement,

149149149
4.3.1.Q .9 :I feel secure about my continued employment at this organization
Table no 4.3.9
Response Frequency Percentage
Fully Disagree 6 2
Disagree 3 1
Neither agree nor Disagree 9 2
Agree 102 28
Fully Agree 249 67
Total 369 100
300
250
Frequency
249
200
150
100102
Frequency
506 3 9
0StronglyDisagree
Disagree Neitheragree norDisagree
Agree StronglyAgree

150150150
Figure no 4.3.9
Regarding satisfied with feeling secure about their continued employment at this
organization it was observed that
1. In the participants from the study 2 % employees are registered strong
disagreement,
2. In the participants from the study 1 % employees are registered
disagreement,
3. In the participants from the study 2 % employees are registered neutral
response,
4. In the participants from the study 28 % employees are registered
agreement,
5. In the participants from the study 67 % employees are registered strong
agreement,
151151151
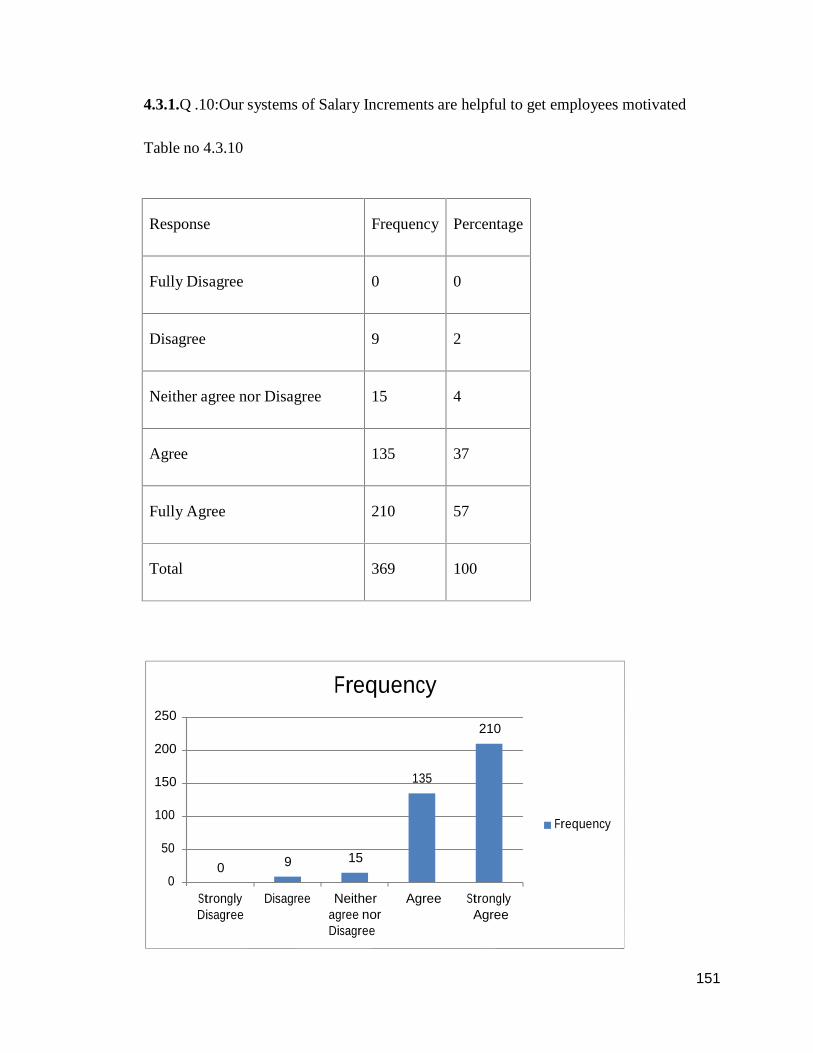
4.3.1.Q .10:Our systems of Salary Increments are helpful to get employees motivated
Table no 4.3.10
Response Frequency Percentage
Fully Disagree 0 0
Disagree 9 2
Neither agree nor Disagree 15 4
Agree 135 37
Fully Agree 210 57
Total 369 100
250
200
150
Frequency
135
210
100
50
00 9 15
Frequency
StronglyDisagree
Disagree Neitheragree norDisagree
Agree StronglyAgree
152152152
Figure 4.3.10
Regarding satisfied with the systems of Salary Increments are helpful to get employees
motivated it was observed that
1. In the participants from the study 0 % employees are registered strong
disagreement,
2. In the participants from the study 2 % employees are registered
disagreement,
3. In the participants from the study 4 % employees are registered neutral
response,
4. In the participants from the study 37 % employees are registered
agreement,
5. In the participants from the study 57 % employees are registered strong
agreement,
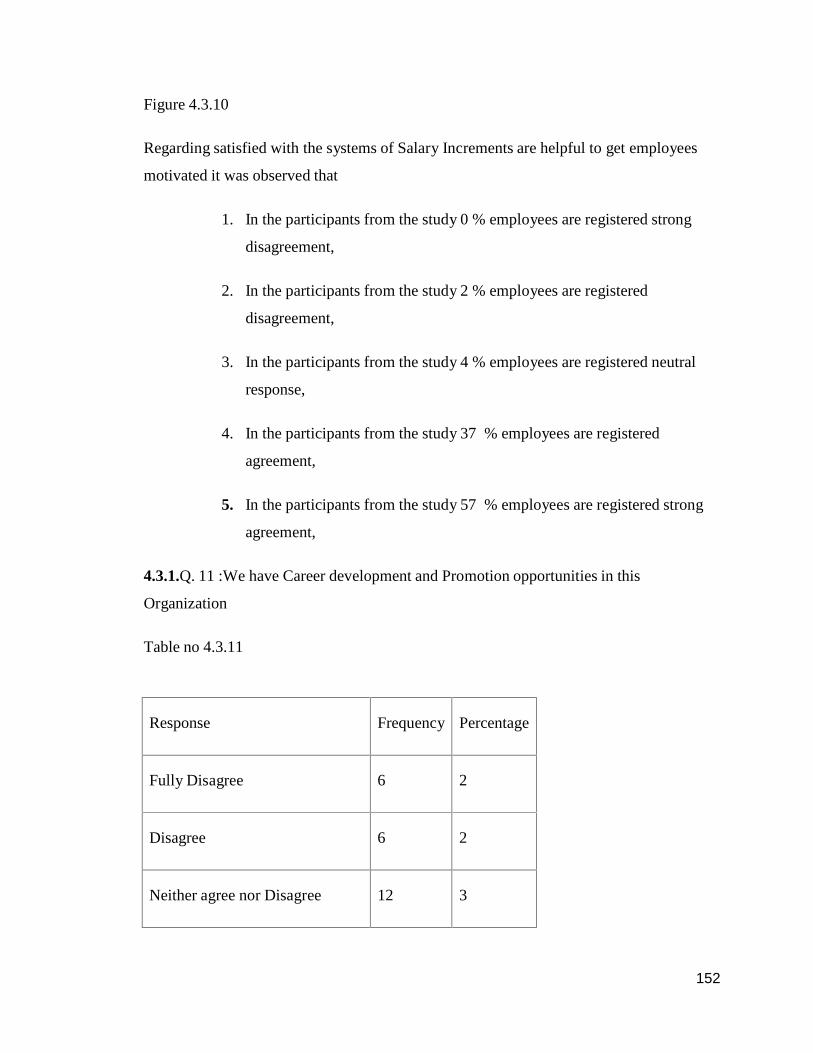
4.3.1.Q. 11 :We have Career development and Promotion opportunities in this
Organization
Table no 4.3.11
Response Frequency Percentage
Fully Disagree 6 2
Disagree 6 2
Neither agree nor Disagree 12 3
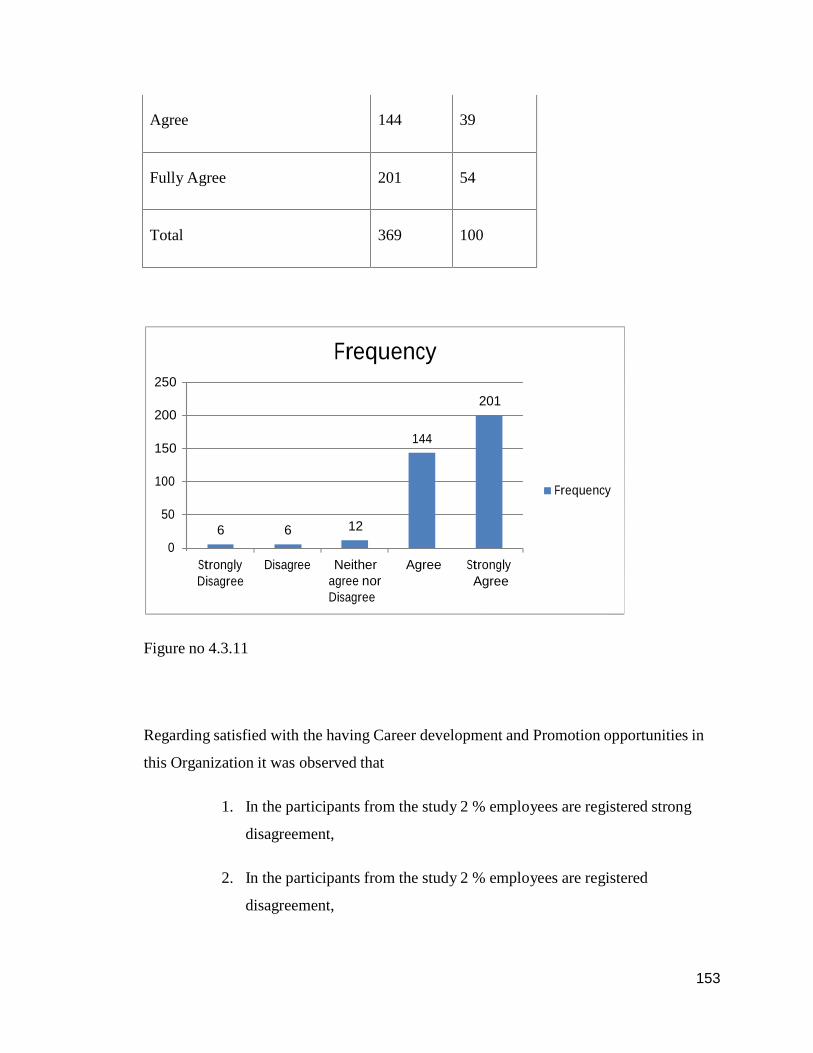
153153153
Agree 144 39
Fully Agree 201 54
Total 369 100
250
200
150
Frequency
144
201
100
50
06 6 12
Frequency
StronglyDisagree
Disagree Neitheragree norDisagree
Agree StronglyAgree
Figure no 4.3.11
Regarding satisfied with the having Career development and Promotion opportunities in
this Organization it was observed that
1. In the participants from the study 2 % employees are registered strong
disagreement,
2. In the participants from the study 2 % employees are registered
disagreement,
154154154
3. In the participants from the study 3 % employees are registered neutral
response,
4. In the participants from the study 39 % employees are registered
agreement,
5. In the participants from the study 54 % employees are registered strong
agreement,
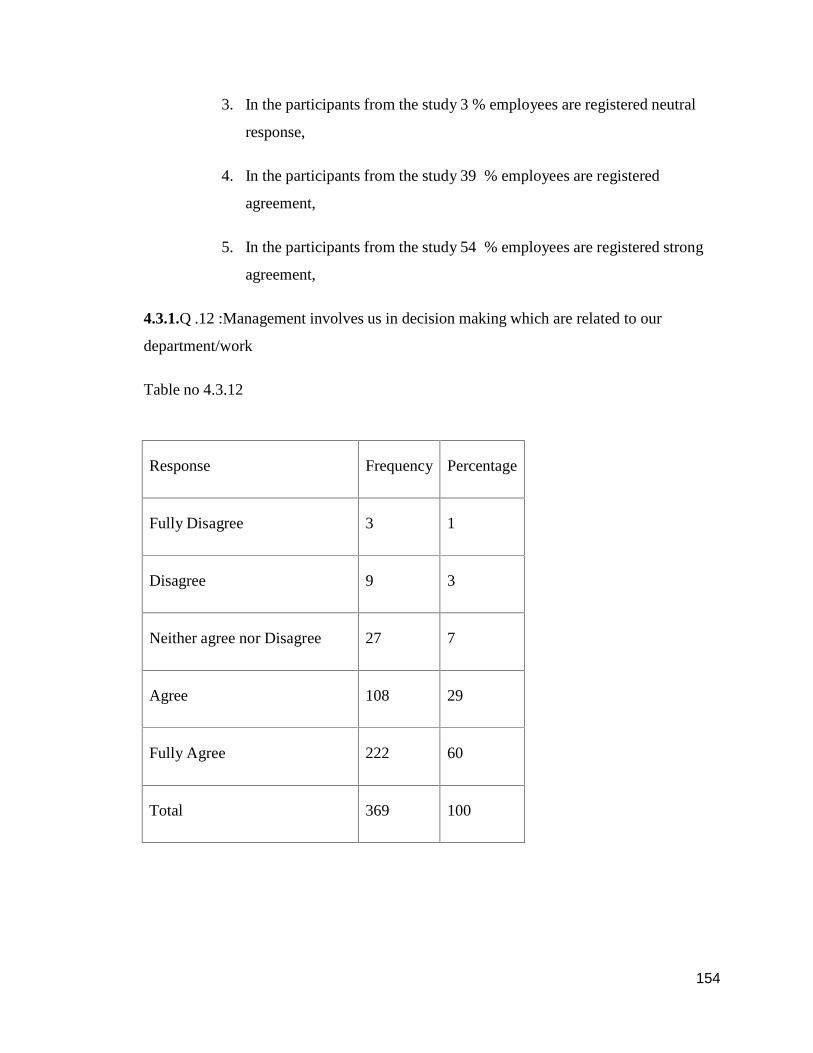
4.3.1.Q .12 :Management involves us in decision making which are related to our
department/work
Table no 4.3.12
Response Frequency Percentage
Fully Disagree 3 1
Disagree 9 3
Neither agree nor Disagree 27 7
Agree 108 29
Fully Agree 222 60
Total 369 100
155155155
250
Frequency222
200
150
100
503 9
0
108
27
Frequency
StronglyDisagree
Disagree Neitheragree norDisagree
Agree StronglyAgree
Figure 4.3.12
Regarding satisfied with the Management involves us in decision making which are
related to their department/work it was observed that
1. In the participants from the study 1 % employees are registered strong
disagreement,
2. In the participants from the study 3 % employees are registered
disagreement,
3. In the participants from the study 7 % employees are registered neutral
response,
4. In the participants from the study 29 % employees are registered
agreement,
5. In the participants from the study 60 % employees are registered strong
agreement,
156156156
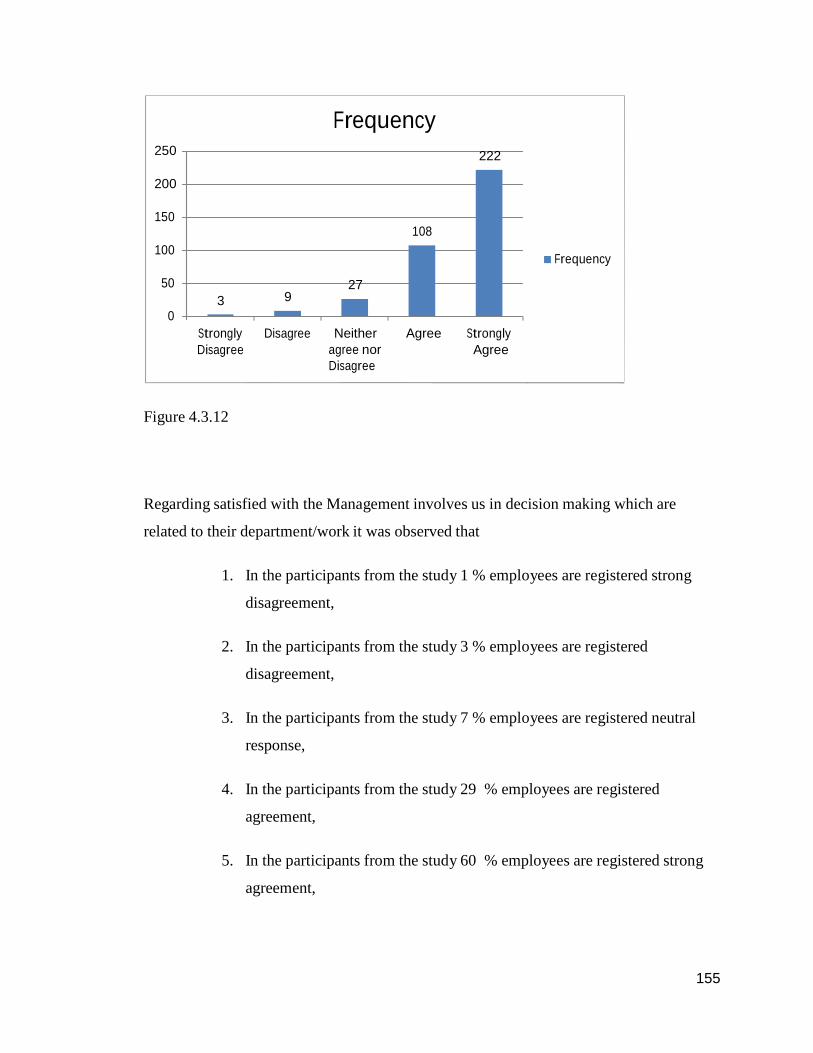
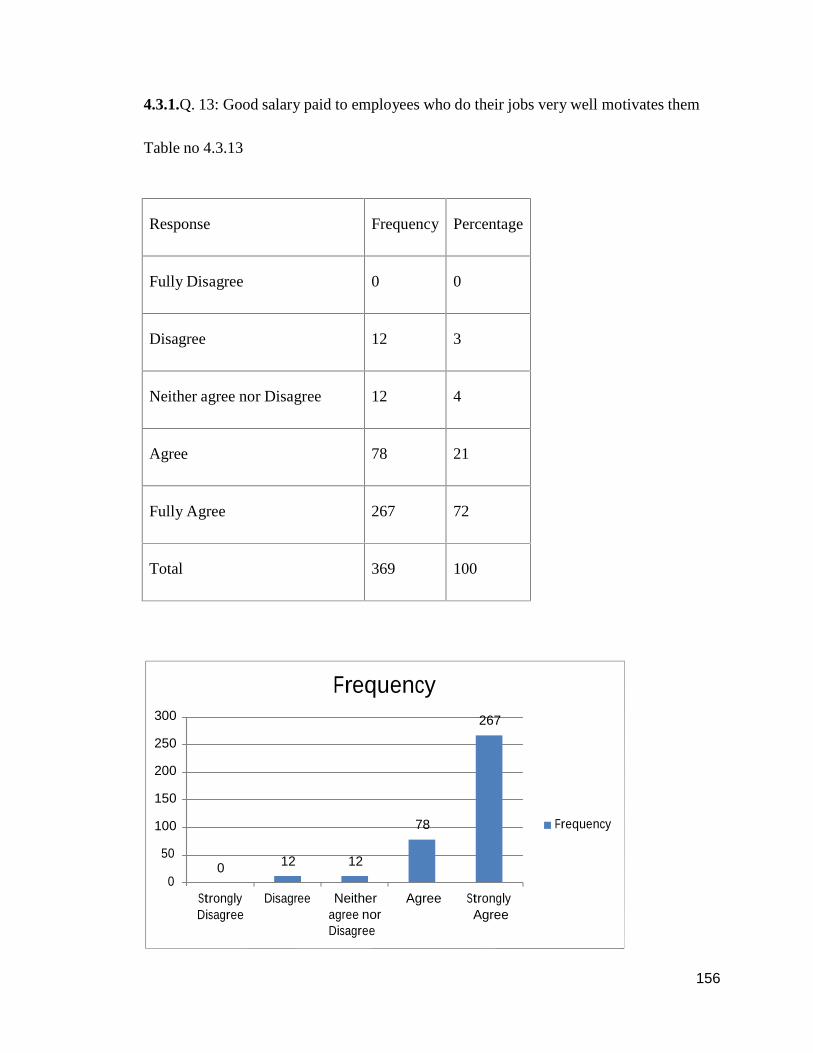
4.3.1.Q. 13: Good salary paid to employees who do their jobs very well motivates them
Table no 4.3.13
Response Frequency Percentage
Fully Disagree 0 0
Disagree 12 3
Neither agree nor Disagree 12 4
Agree 78 21
Fully Agree 267 72
Total 369 100
300
250
Frequency267
200
150
100 78 Frequency
500 12 12
0StronglyDisagree
Disagree Neitheragree norDisagree
Agree StronglyAgree
157157157
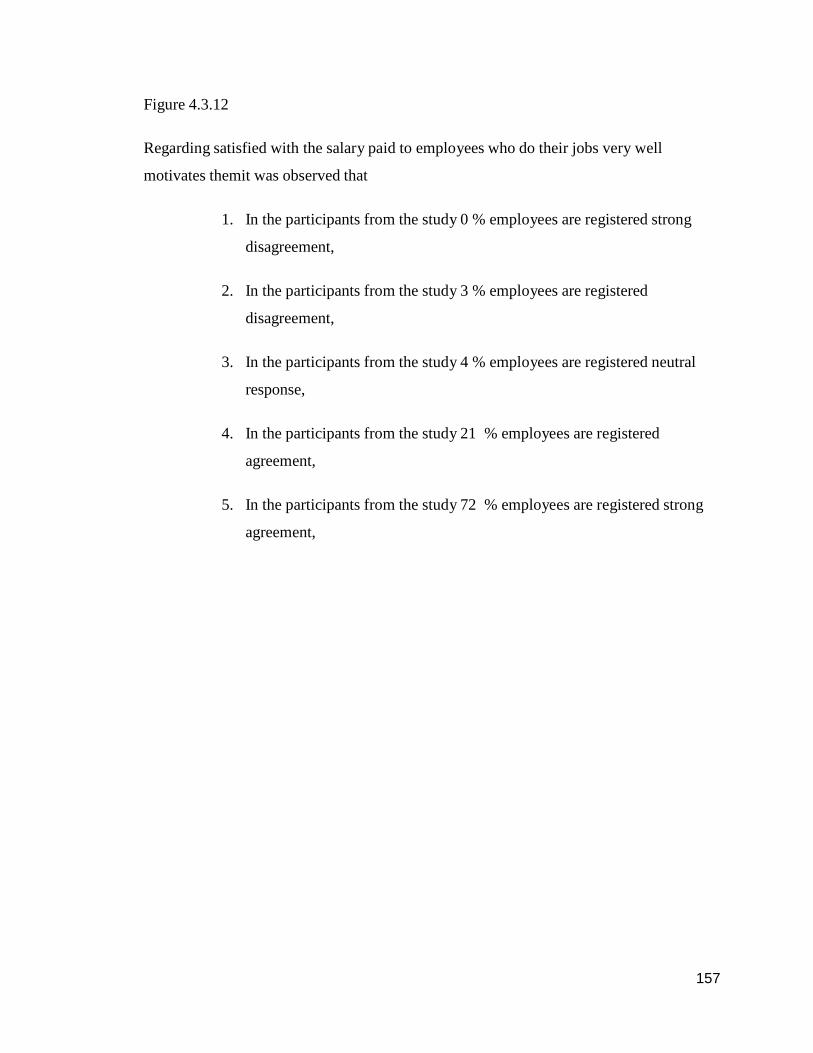
Figure 4.3.12
Regarding satisfied with the salary paid to employees who do their jobs very well
motivates themit was observed that
1. In the participants from the study 0 % employees are registered strong
disagreement,
2. In the participants from the study 3 % employees are registered
disagreement,
3. In the participants from the study 4 % employees are registered neutral
response,
4. In the participants from the study 21 % employees are registered
agreement,
5. In the participants from the study 72 % employees are registered strong
agreement,
158158158
6 6 9
Strongly Disagree Neither Agree StronglyDisagree agree nor
DisagreeAgree
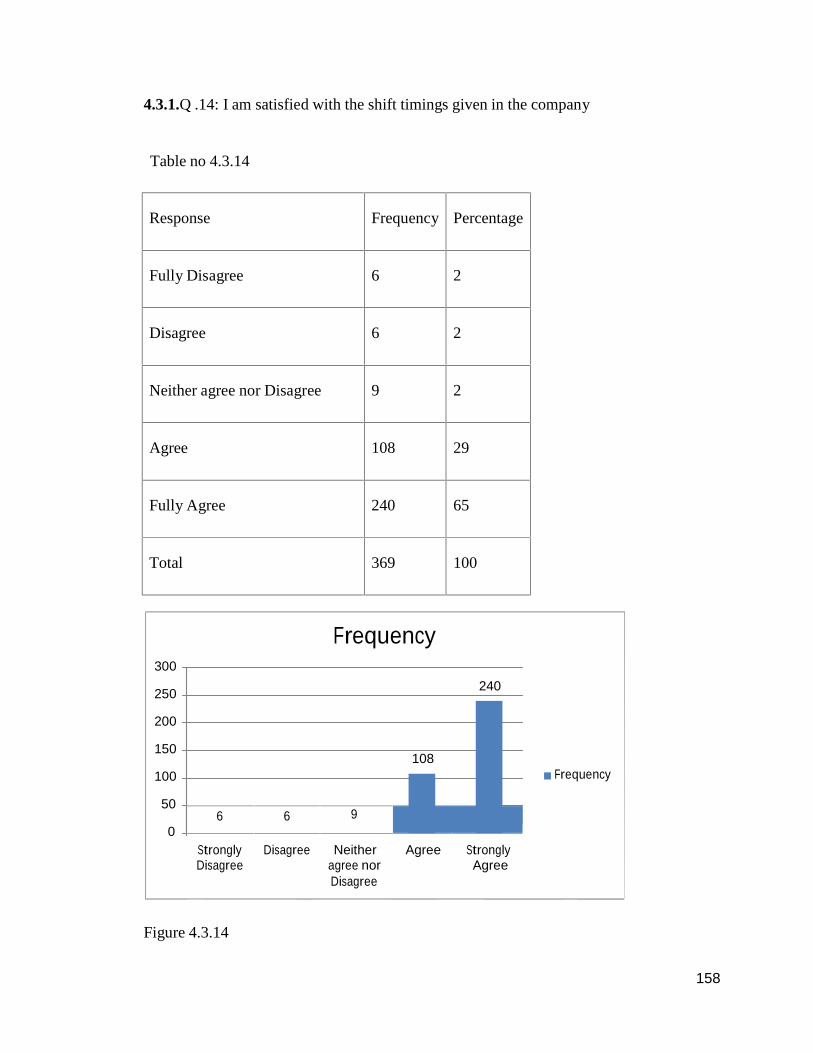
4.3.1.Q .14: I am satisfied with the shift timings given in the company
Table no 4.3.14
Response Frequency Percentage
Fully Disagree 6 2
Disagree 6 2
Neither agree nor Disagree 9 2
Agree 108 29
Fully Agree 240 65
Total 369 100
300
250
Frequency
240
200
150
100108
Frequency
50
0
Figure 4.3.14

159159159
Regarding satisfied with the overall shift timings given in the company
it was observed that
1. In the participants from the study 2 % employees are registered strong
disagreement,
2. In the participants from the study 2 % employees are registered
disagreement,
3. In the participants from the study 3 % employees are registered neutral
response,
4. In the participants from the study 29 % employees are registered
agreement,
5. In the participants from the study 65 % employees are registered strong
agreement,
160160160
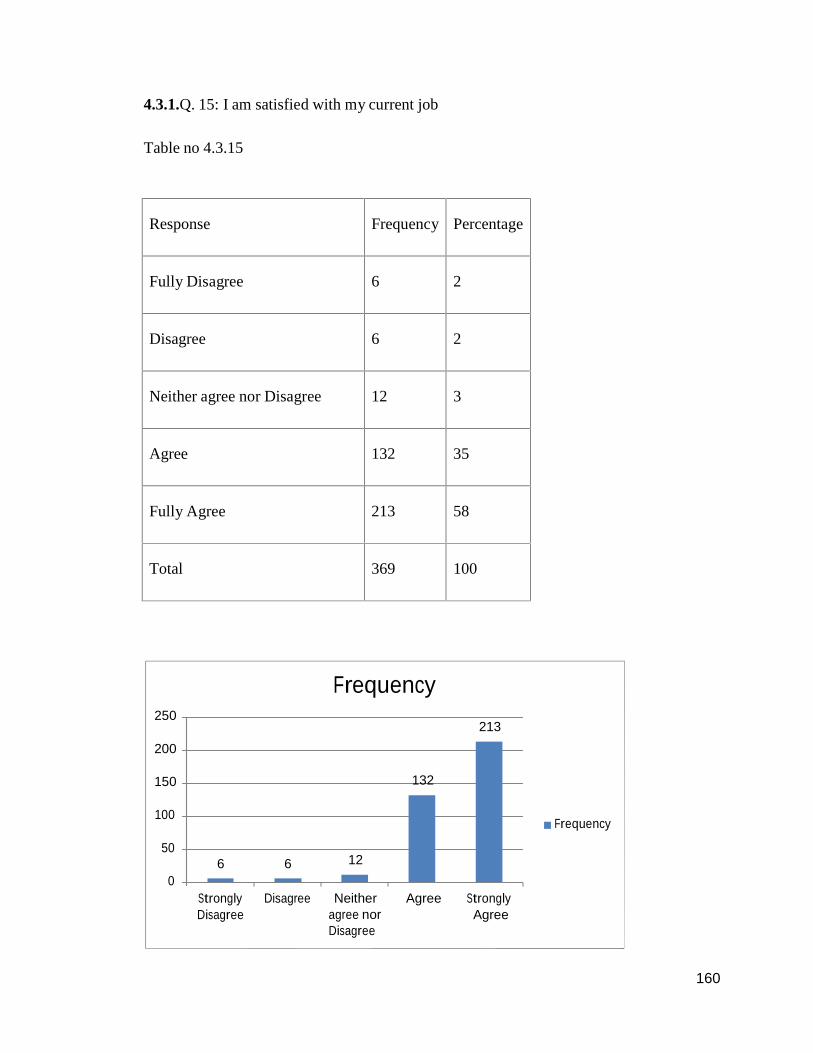
4.3.1.Q. 15: I am satisfied with my current job
Table no 4.3.15
Response Frequency Percentage
Fully Disagree 6 2
Disagree 6 2
Neither agree nor Disagree 12 3
Agree 132 35
Fully Agree 213 58
Total 369 100
250
200
Frequency213
150 132
100
50
06 6 12
Frequency
StronglyDisagree
Disagree Neitheragree norDisagree
Agree StronglyAgree
161161161
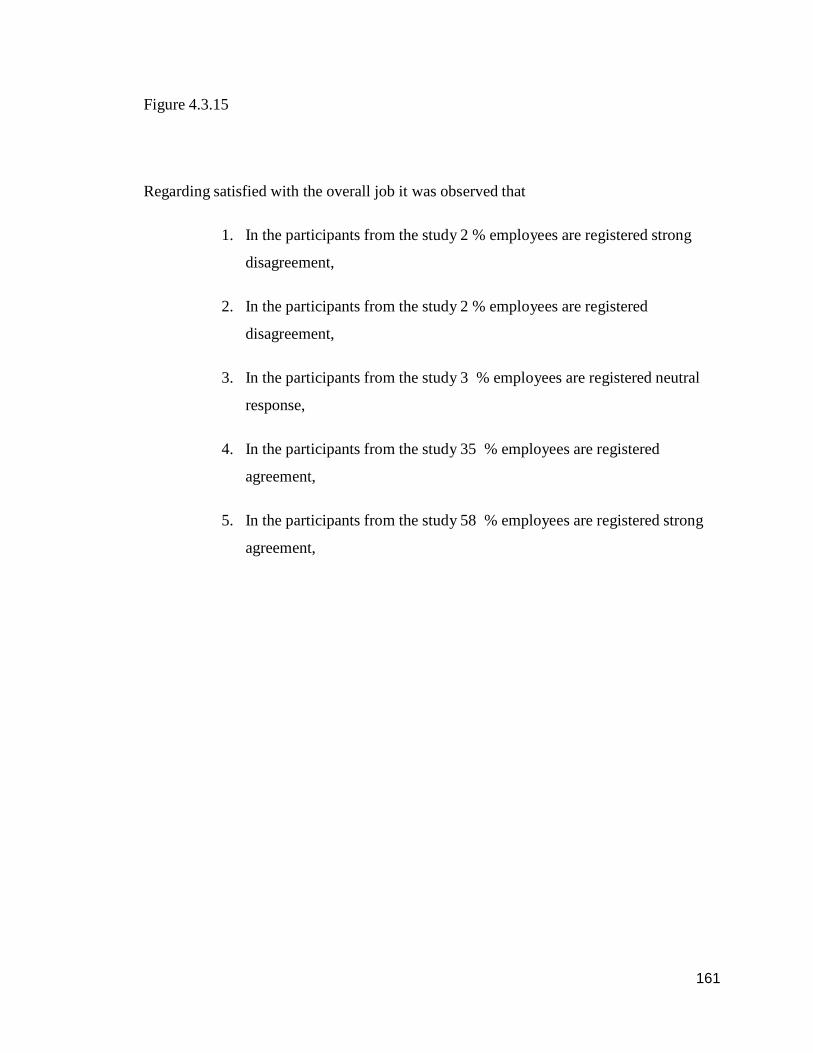
Figure 4.3.15
Regarding satisfied with the overall job it was observed that
1. In the participants from the study 2 % employees are registered strong
disagreement,
2. In the participants from the study 2 % employees are registered
disagreement,
3. In the participants from the study 3 % employees are registered neutral
response,
4. In the participants from the study 35 % employees are registered
agreement,
5. In the participants from the study 58 % employees are registered strong
agreement,
162162162
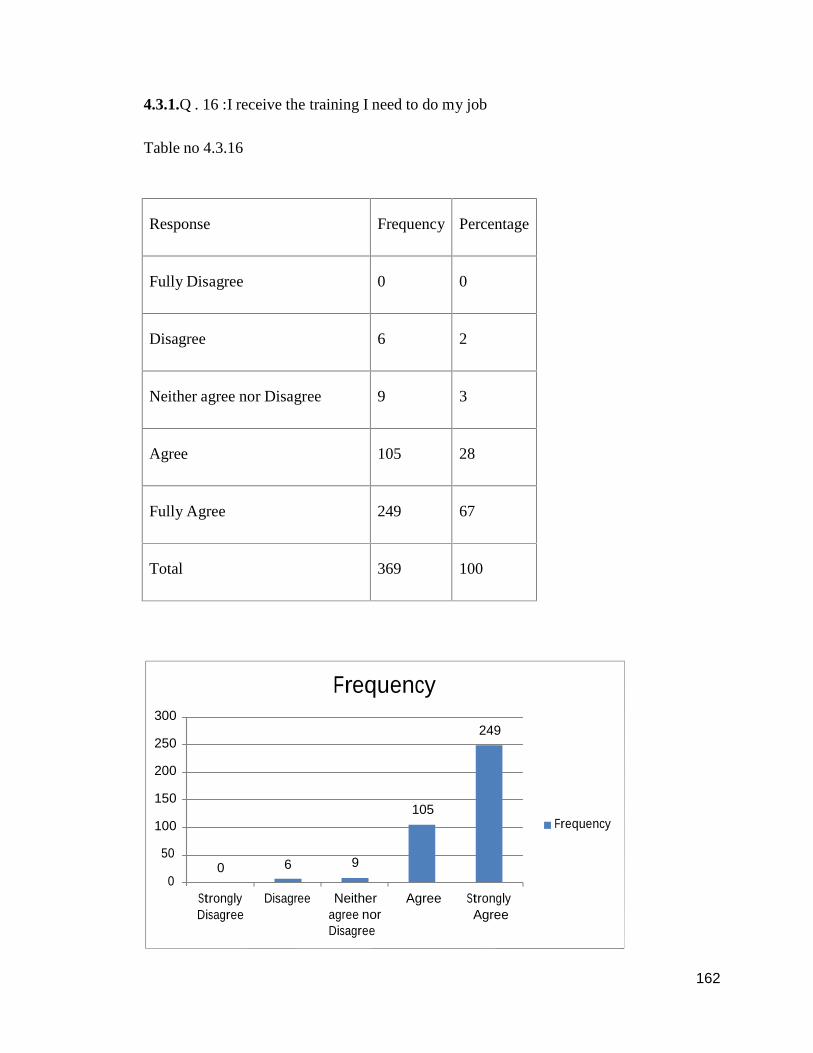
4.3.1.Q . 16 :I receive the training I need to do my job
Table no 4.3.16
Response Frequency Percentage
Fully Disagree 0 0
Disagree 6 2
Neither agree nor Disagree 9 3
Agree 105 28
Fully Agree 249 67
Total 369 100
300
250
Frequency
249
200
150
100105
Frequency
500 6 9
0StronglyDisagree
Disagree Neitheragree norDisagree
Agree StronglyAgree
163163163
Figure 4.3.16
Regarding satisfied with the training received to perform their job it was observed that
1. In the participants from the study 0 % employees are registered strong
disagreement,
2. In the participants from the study 2 % employees are registered
disagreement,
3. In the participants from the study 3 % employees are registered neutral
response,
4. In the participants from the study 28 % employees are registered
agreement,
5. In the participants from the study 67 % employees are registered strong
agreement,
164164164
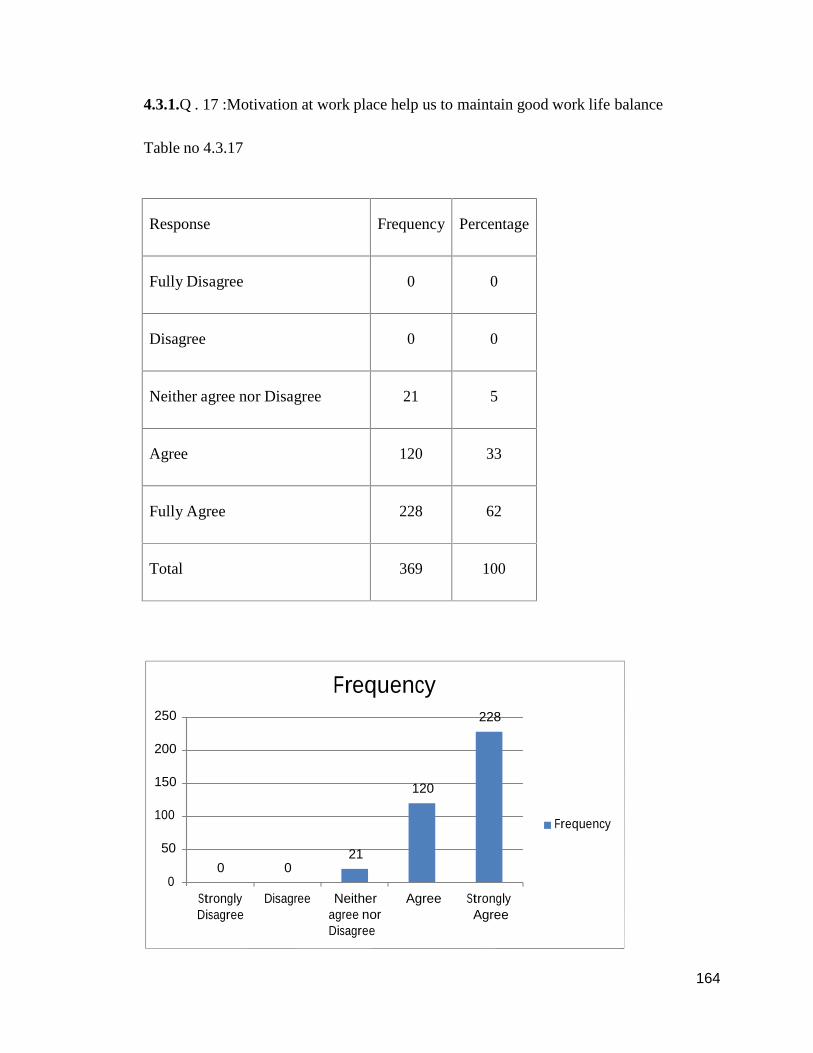
4.3.1.Q . 17 :Motivation at work place help us to maintain good work life balance
Table no 4.3.17
Response Frequency Percentage
Fully Disagree 0 0
Disagree 0 0
Neither agree nor Disagree 21 5
Agree 120 33
Fully Agree 228 62
Total 369 100
250
Frequency228
200
150 120
100
50 210 0
0
Frequency
StronglyDisagree
Disagree Neitheragree norDisagree
Agree StronglyAgree
165165165
Figure 4.3.17
Regarding satisfied with the facilities to maintain good work life balance it was observed
that
1. In the participants from the study 0 % employees are registered strong
disagreement,
2. In the participants from the study 0 % employees are registered
disagreement,
3. In the participants from the study 5 % employees are registered neutral
response,
4. In the participants from the study 33 % employees are registered
agreement,
5. In the participants from the study 62 % employees are registered strong
agreement,
166166166
4.4: Factors contributing to the employees motivation (employee’s perception.)
Researcher wanted to explore the factors contributing towards the employee motivation.
Through the discussions with the managers at various levels from the different companies
researcher has taken eight factors that contributes to the employee’s motivation. These
factors are as follows:
1. we are provided with Training
2. when Seniors behave with us humanely
3. we get good environment at workplace
4. we get good welfare facilities
5. we get opportunities for Career development and Promotion
6. we get Awards, Rewards, Appreciation, Recognition for Good Work
7. we have job security
8. we get more salary
Here is the agreement level of the employees towards these factors which are
contributing towards employee’s motivation.
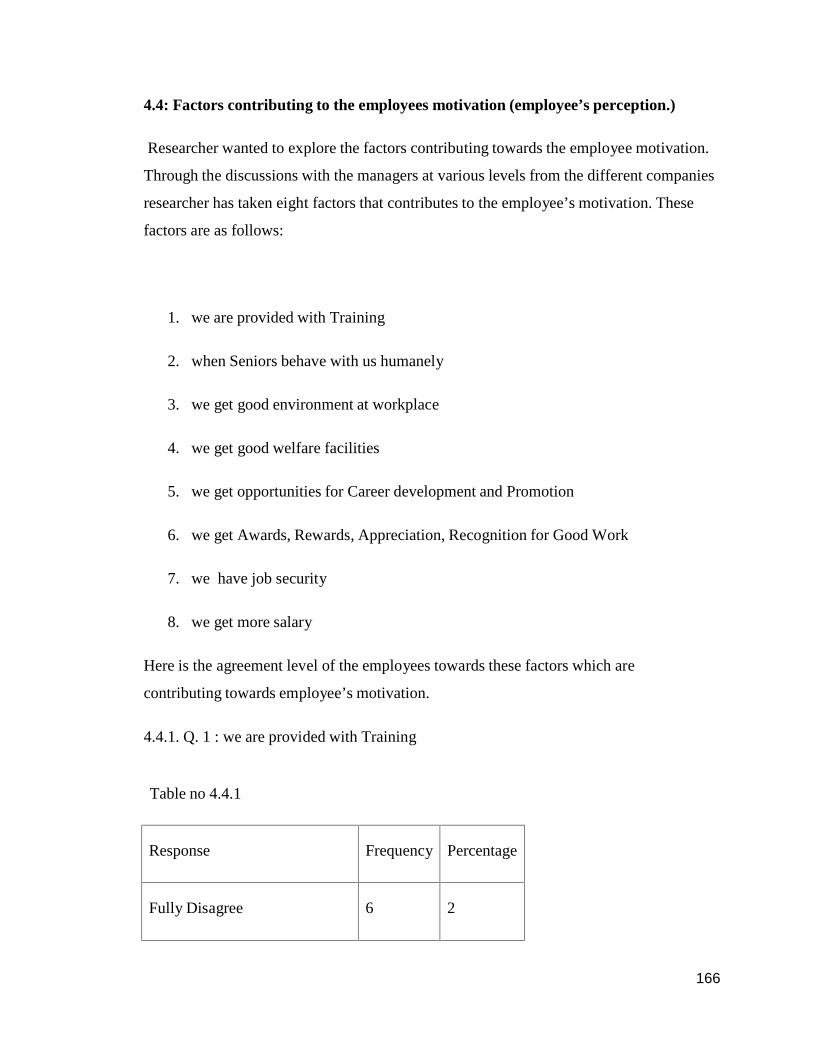
4.4.1. Q. 1 : we are provided with Training
Table no 4.4.1
Response Frequency Percentage
Fully Disagree 6 2
167167167
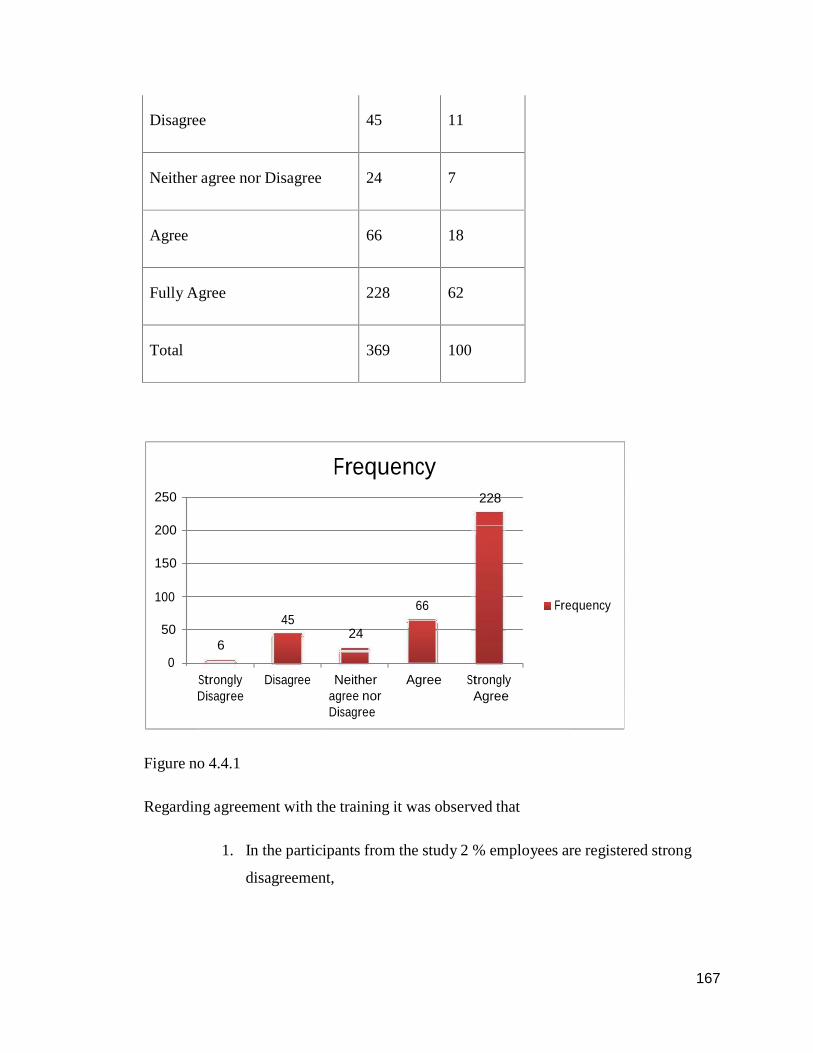
Disagree 45 11
Neither agree nor Disagree 24 7
Agree 66 18
Fully Agree 228 62
Total 369 100
250
Frequency228
200
150
100 6645
50 246
0
Frequency
StronglyDisagree
Disagree Neitheragree norDisagree
Agree StronglyAgree
Figure no 4.4.1
Regarding agreement with the training it was observed that
1. In the participants from the study 2 % employees are registered strong
disagreement,
168168168
2. In the participants from the study 11 % employees are registered
disagreement,
3. In the participants from the study 7 % employees are registered neutral
response,
4. In the participants from the study 18 % employees are registered
agreement,
5. In the participants from the study 62 % employees are registered strong
agreement,
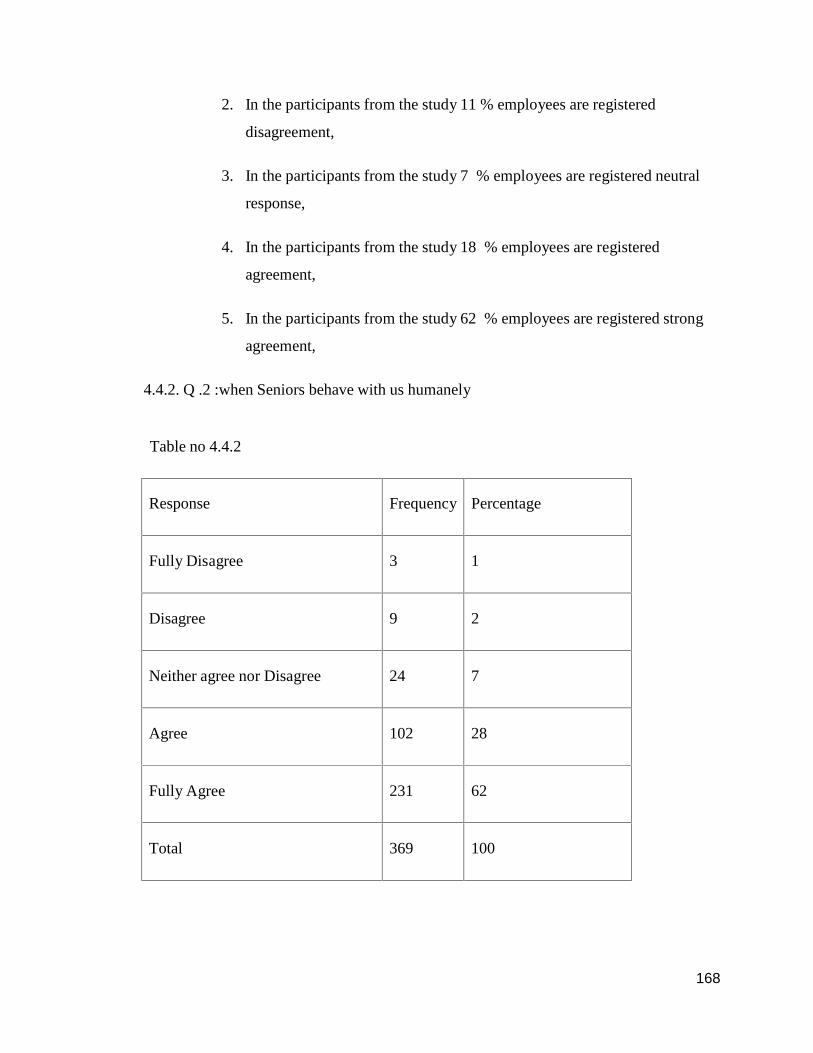
4.4.2. Q .2 :when Seniors behave with us humanely
Table no 4.4.2
Response Frequency Percentage
Fully Disagree 3 1
Disagree 9 2
Neither agree nor Disagree 24 7
Agree 102 28
Fully Agree 231 62
Total 369 100
169169169
250
Frequency231
200
150
100
503 9
0
102
24
Frequency
StronglyDisagree
Disagree Neitheragree norDisagree
Agree StronglyAgree
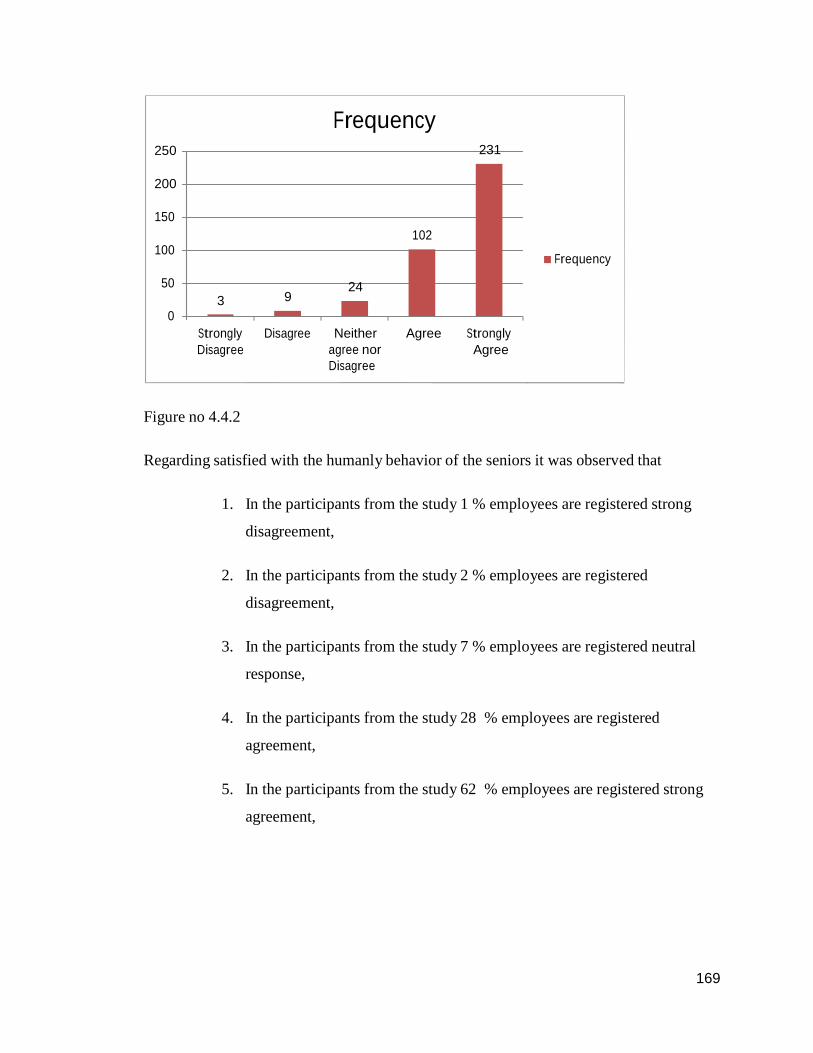
Figure no 4.4.2
Regarding satisfied with the humanly behavior of the seniors it was observed that
1. In the participants from the study 1 % employees are registered strong
disagreement,
2. In the participants from the study 2 % employees are registered
disagreement,
3. In the participants from the study 7 % employees are registered neutral
response,
4. In the participants from the study 28 % employees are registered
agreement,
5. In the participants from the study 62 % employees are registered strong
agreement,
170170170
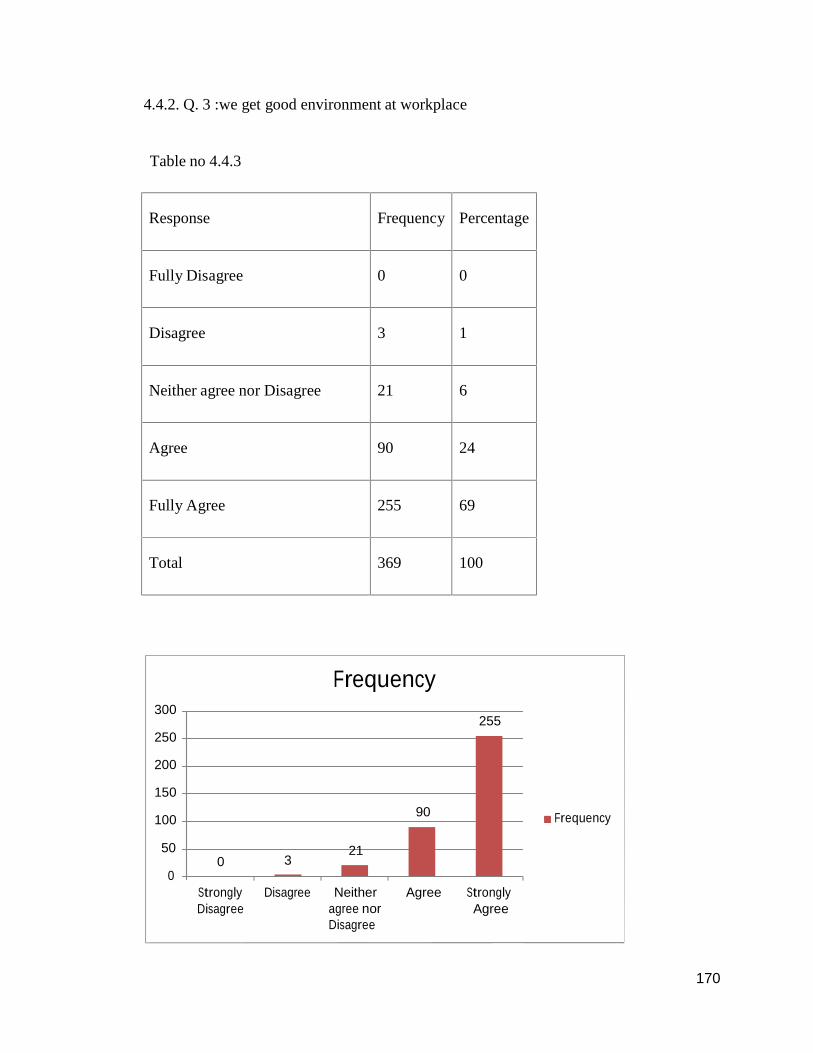
4.4.2. Q. 3 :we get good environment at workplace
Table no 4.4.3
Response Frequency Percentage
Fully Disagree 0 0
Disagree 3 1
Neither agree nor Disagree 21 6
Agree 90 24
Fully Agree 255 69
Total 369 100
300
250
Frequency255
200
150
100 90
50 210 3
0
Frequency
StronglyDisagree
Disagree Neitheragree norDisagree
Agree StronglyAgree
171171171
Figure no 4.4.3
Regarding satisfied with the environment at the workplace it was observed that
1. In the participants from the study 0 % employees are registered strong
disagreement,
2. In the participants from the study 1 % employees are registered
disagreement,
3. In the participants from the study 6 % employees are registered neutral
response,
4. In the participants from the study 24 % employees are registered
agreement,
5. In the participants from the study 69 % employees are registered strong
agreement,
172172172
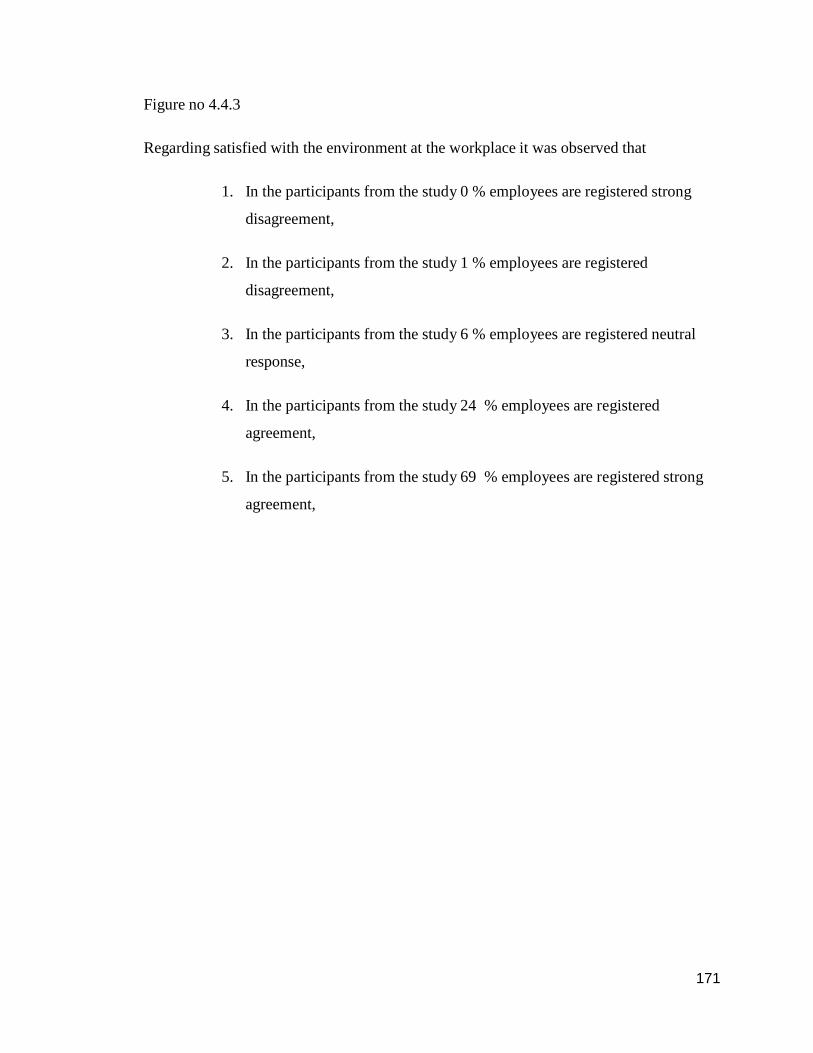
4.4.2. Q.4 :we get good welfare facilities
Table no 4.4.4
Response Frequency Percentage
Fully Disagree 0 0
Disagree 6 2
Neither agree nor Disagree 21 6
Agree 75 20
Fully Agree 267 72
Total 369 100
300
250
Frequency267
200
150
100 75
50 210 6
0
Frequency
StronglyDisagree
Disagree Neitheragree norDisagree
Agree StronglyAgree
Figure no 4.4.4

173173173
Regarding satisfied with the welfare facilities it was observed that
1. In the participants from the study 0 % employees are registered strong
disagreement,
2. In the participants from the study 2 % employees are registered
disagreement,
3. In the participants from the study 4 % employees are registered neutral
response,
4. In the participants from the study 24 % employees are registered
agreement,
5. In the participants from the study 72 % employees are registered strong
agreement,
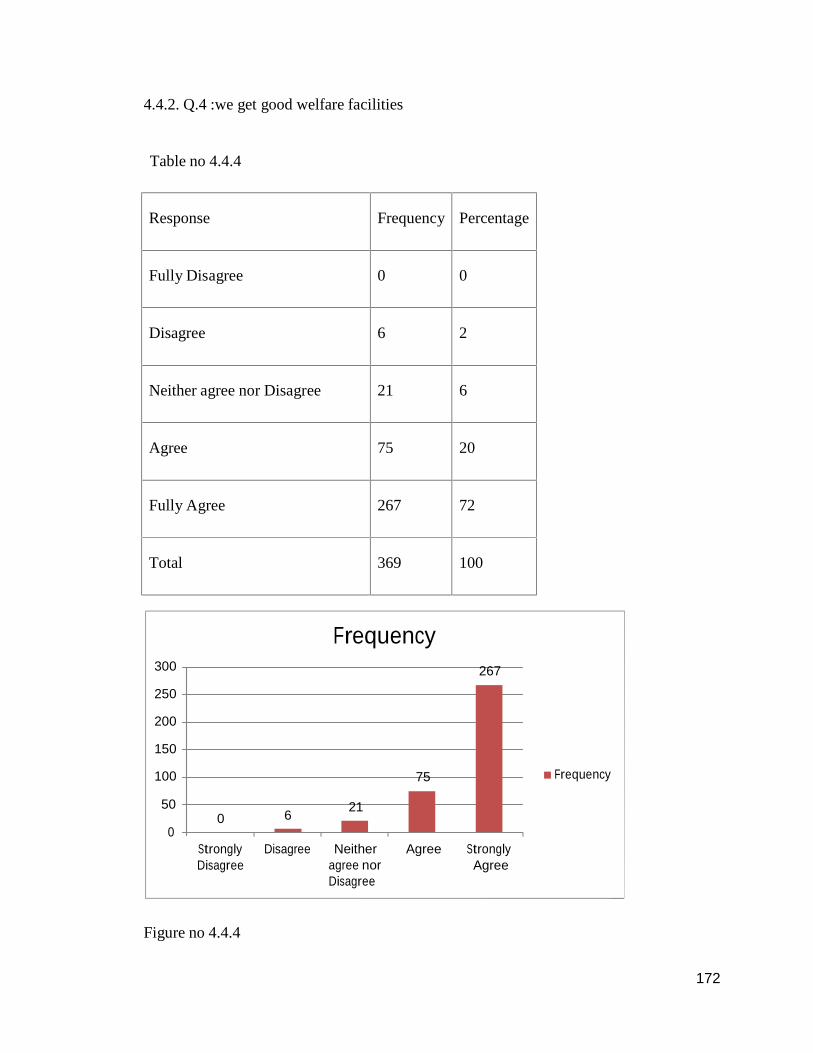
4.4.2. Q 5 :we get opportunities for Career development
and PromotionTable no 4.4.5
Response Frequency Percentage
Fully Disagree 0 0
Disagree 3 1
Neither agree nor Disagree 33 9
Agree 63 17
Fully Agree 270 73
174174174
Total 369 100
300
250
Frequency270
200
150
100 6350 33
0 30
Frequency
StronglyDisagree
Disagree Neitheragree norDisagree
Agree StronglyAgree
Figure no 4.4.5
Regarding satisfied with the opportunities for Career development and Promotion it was
observed that
1. In the participants from the study 0 % employees are registered strong
disagreement,
2. In the participants from the study 1 % employees are registered
disagreement,
3. In the participants from the study 9 % employees are registered neutral
response,
4. In the participants from the study 17 % employees are registered
agreement,
175175175
5. In the participants from the study 73 % employees are registered strong
agreement,
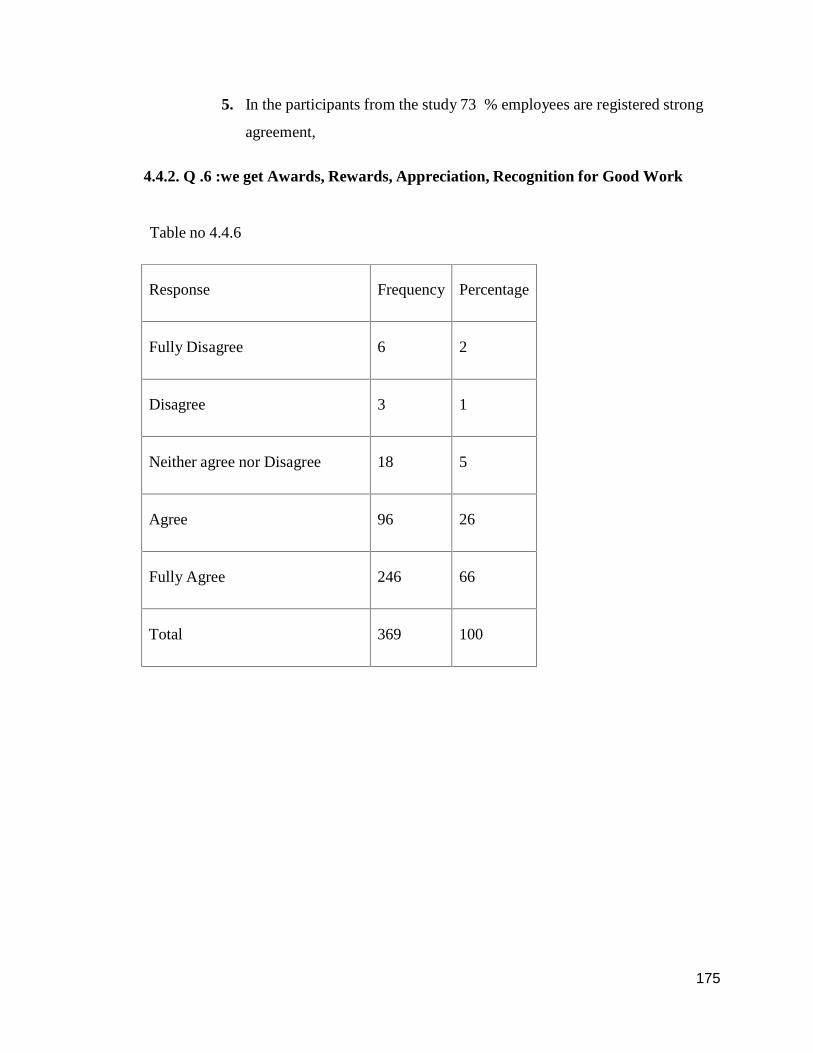
4.4.2. Q .6 :we get Awards, Rewards, Appreciation, Recognition for Good Work
Table no 4.4.6
Response Frequency Percentage
Fully Disagree 6 2
Disagree 3 1
Neither agree nor Disagree 18 5
Agree 96 26
Fully Agree 246 66
Total 369 100
176176176
300
250
Frequency
246
200
150
100
50
0
96
6 3 18
Frequency
StronglyDisagree
Disagree Neitheragree norDisagree
Agree StronglyAgree
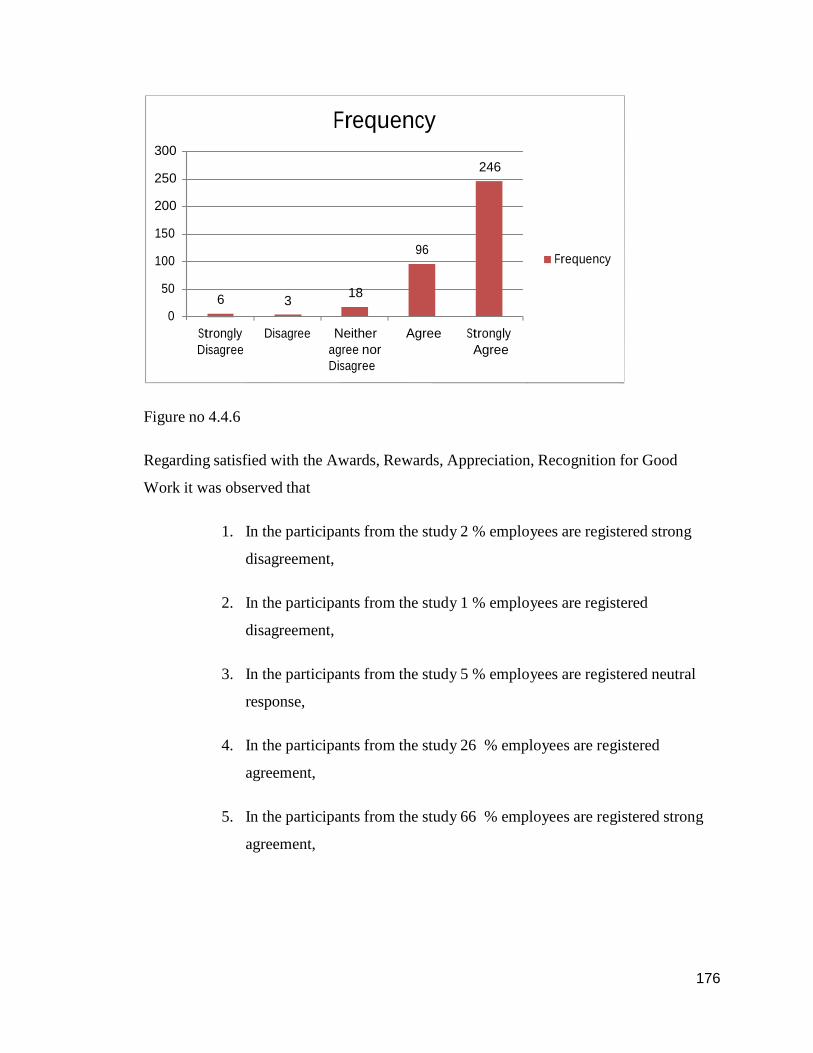
Figure no 4.4.6
Regarding satisfied with the Awards, Rewards, Appreciation, Recognition for Good
Work it was observed that
1. In the participants from the study 2 % employees are registered strong
disagreement,
2. In the participants from the study 1 % employees are registered
disagreement,
3. In the participants from the study 5 % employees are registered neutral
response,
4. In the participants from the study 26 % employees are registered
agreement,
5. In the participants from the study 66 % employees are registered strong
agreement,
177177177
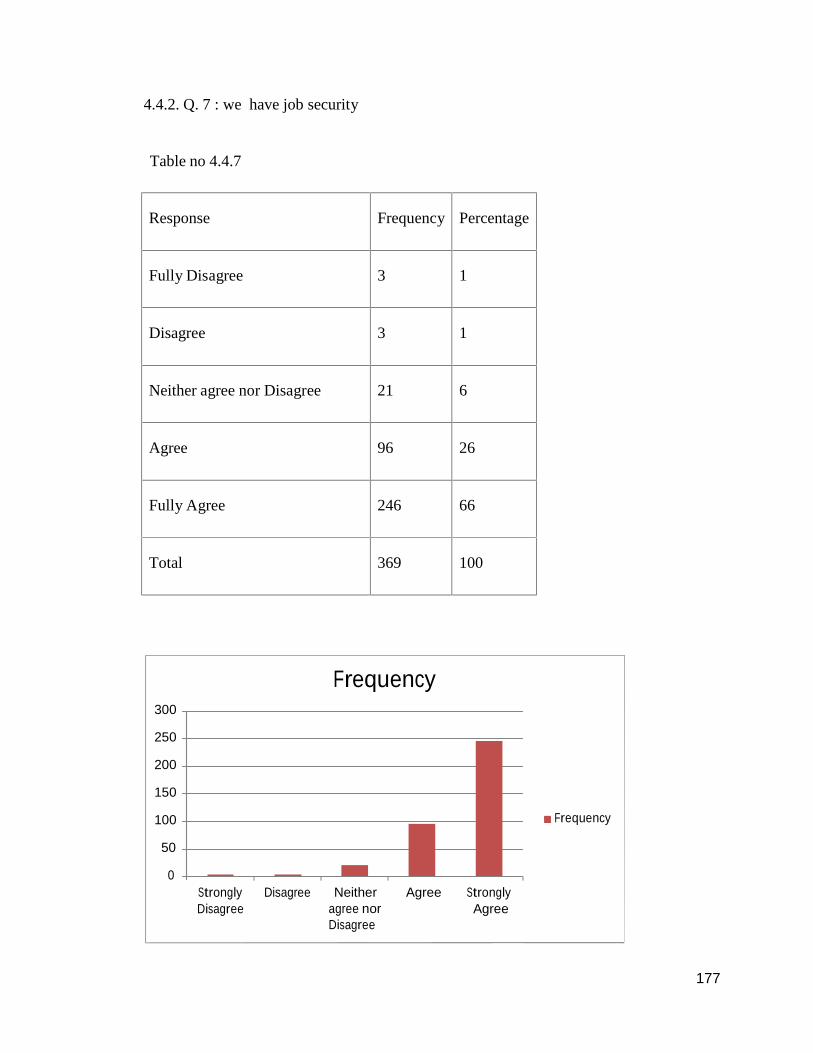
4.4.2. Q. 7 : we have job security
Table no 4.4.7
Response Frequency Percentage
Fully Disagree 3 1
Disagree 3 1
Neither agree nor Disagree 21 6
Agree 96 26
Fully Agree 246 66
Total 369 100
300
Frequency
250
200
150
100 Frequency
50
0StronglyDisagree
Disagree Neitheragree norDisagree
Agree StronglyAgree
178178178
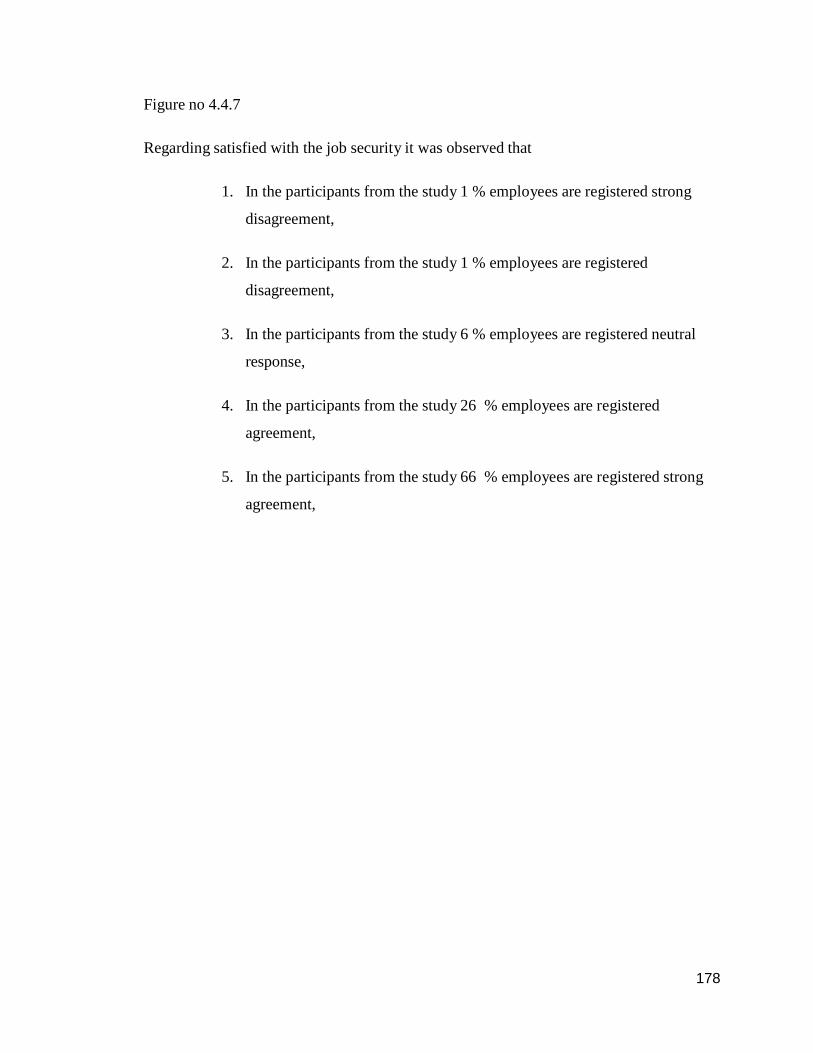
Figure no 4.4.7
Regarding satisfied with the job security it was observed that
1. In the participants from the study 1 % employees are registered strong
disagreement,
2. In the participants from the study 1 % employees are registered
disagreement,
3. In the participants from the study 6 % employees are registered neutral
response,
4. In the participants from the study 26 % employees are registered
agreement,
5. In the participants from the study 66 % employees are registered strong
agreement,
179179179
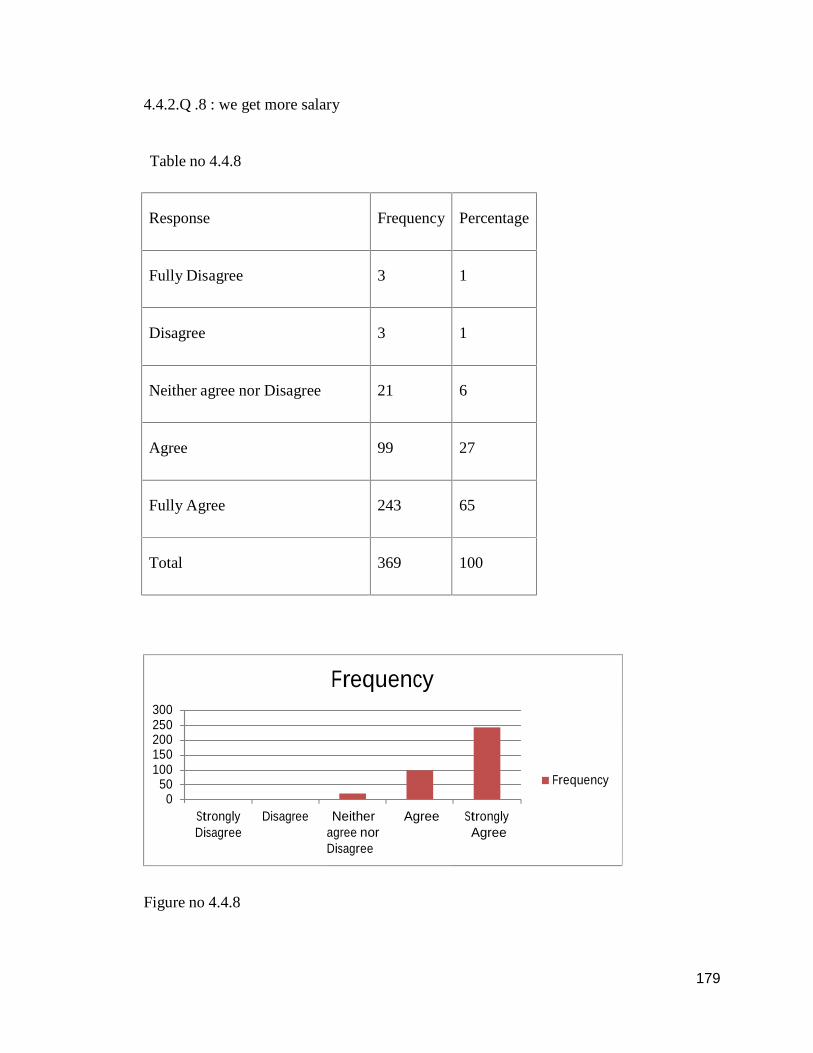
4.4.2.Q .8 : we get more salary
Table no 4.4.8
Response Frequency Percentage
Fully Disagree 3 1
Disagree 3 1
Neither agree nor Disagree 21 6
Agree 99 27
Fully Agree 243 65
Total 369 100
300250200150100
500
Frequency
Frequency
StronglyDisagree
Disagree Neitheragree norDisagree
Agree StronglyAgree
Figure no 4.4.8

180180180
Regarding satisfied with the good salary it was observed that
1. In the participants from the study 1 % employees are registered strong
disagreement,
2. In the participants from the study 1 % employees are registered
disagreement,
3. In the participants from the study 6 % employees are registered neutral
response,
4. In the participants from the study 27 % employees are registered
agreement,
5. In the participants from the study 65 % employees are registered strong
agreement,
181181181
4.5.1: Factors contributing to the employee’s motivation (Manager’s perception.)
Researcher wanted to explore the factors contributing towards the employee motivation
as perceived by the managers of the companies. Through the discussions with the
managers at various levels from the different companies researcher has taken eight
factors that contributes to the employee’s motivation. These factors are as follows:
1. we are provided with Training
2. when Seniors behave with us humanely
3. we get good environment at workplace
4. we get good welfare facilities
5. we get opportunities for Career development and Promotion
6. we get Awards, Rewards, Appreciation, Recognition for Good Work
7. we have job security
8. we get more salary
Here is the analysis of the factors contributing towards employee motivation perceived by
the managers.
182182182
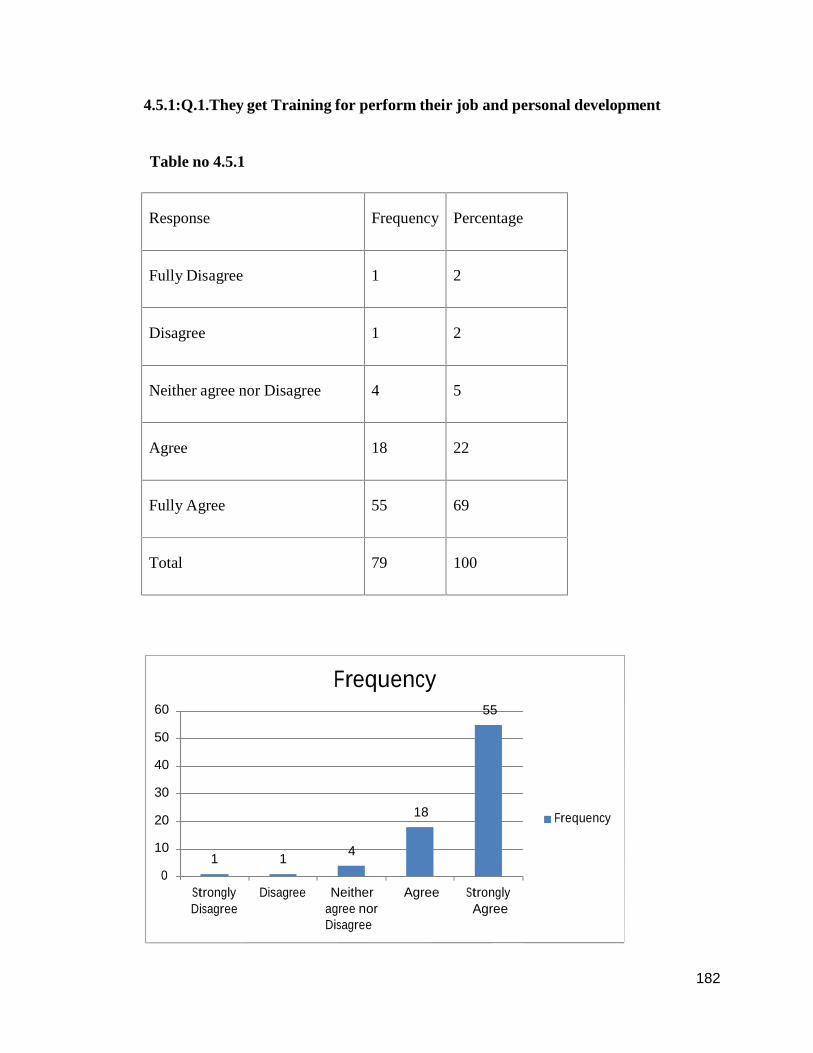
4.5.1:Q.1.They get Training for perform their job and personal development
Table no 4.5.1
Response Frequency Percentage
Fully Disagree 1 2
Disagree 1 2
Neither agree nor Disagree 4 5
Agree 18 22
Fully Agree 55 69
Total 79 100
Frequency60 55
50
40
30
20 18
101 1 4
0
Frequency
StronglyDisagree
Disagree Neitheragree norDisagree
Agree StronglyAgree
183183183
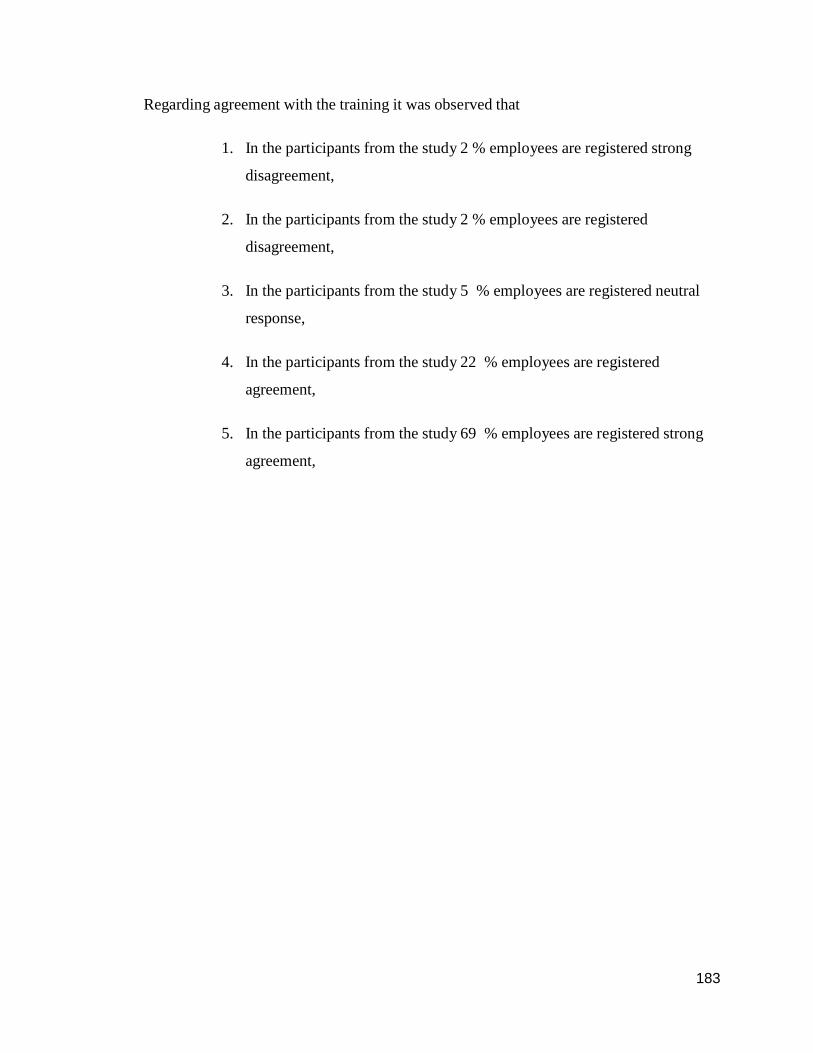
Regarding agreement with the training it was observed that
1. In the participants from the study 2 % employees are registered strong
disagreement,
2. In the participants from the study 2 % employees are registered
disagreement,
3. In the participants from the study 5 % employees are registered neutral
response,
4. In the participants from the study 22 % employees are registered
agreement,
5. In the participants from the study 69 % employees are registered strong
agreement,
184184184
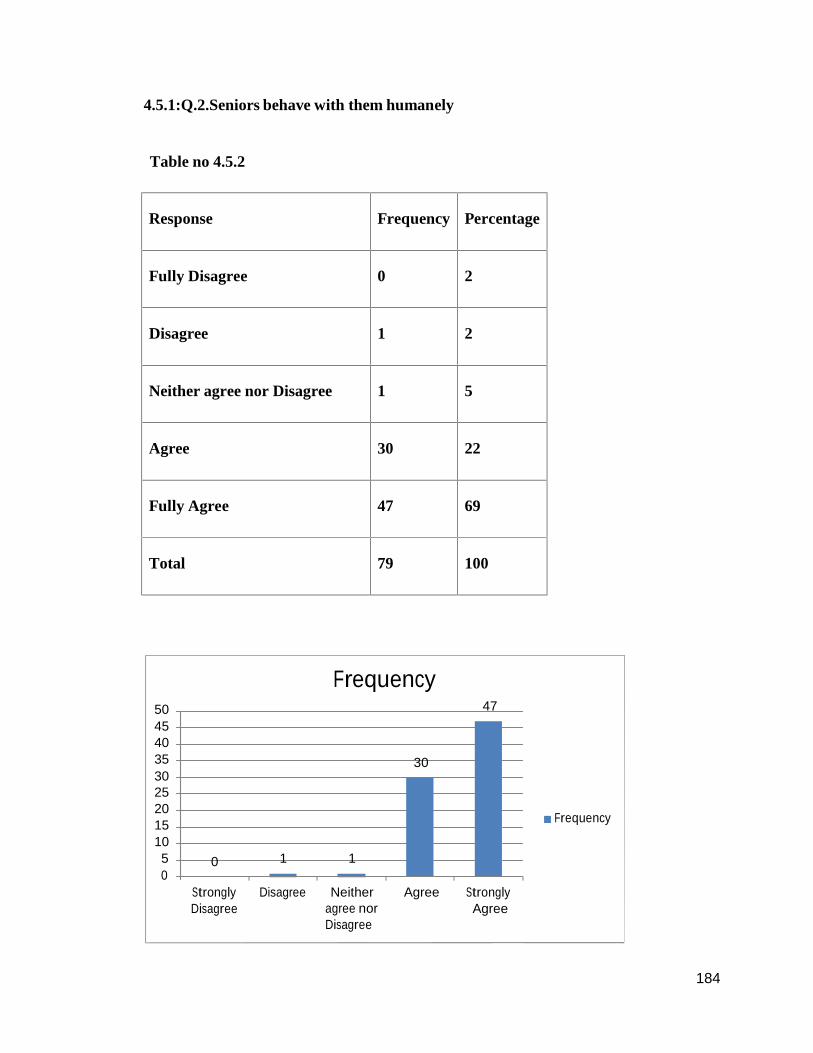
4.5.1:Q.2.Seniors behave with them humanely
Table no 4.5.2
Response Frequency Percentage
Fully Disagree 0 2
Disagree 1 2
Neither agree nor Disagree 1 5
Agree 30 22
Fully Agree 47 69
Total 79 100
Frequency50 47454035 3030252015105 0 1 10
Frequency
StronglyDisagree
Disagree Neitheragree norDisagree
Agree StronglyAgree
185185185
Figure No 4.5.2
Regarding agreement with the senior’s behavior it was observed that
1. In the participants from the study 2 % employees are registered strong
disagreement,
2. In the participants from the study 2 % employees are registered
disagreement,
3. In the participants from the study 5 % employees are registered neutral
response,
4. In the participants from the study 22 % employees are registered
agreement,
5. In the participants from the study 69 % employees are registered strong
agreement,
186186186
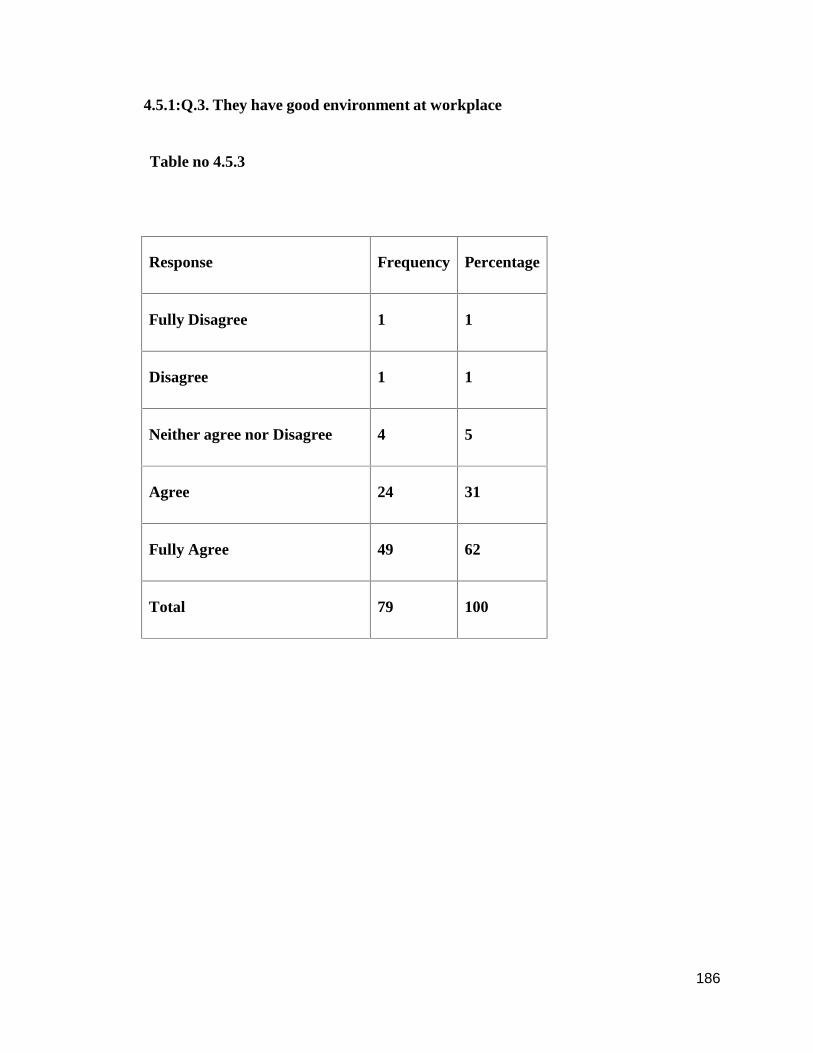
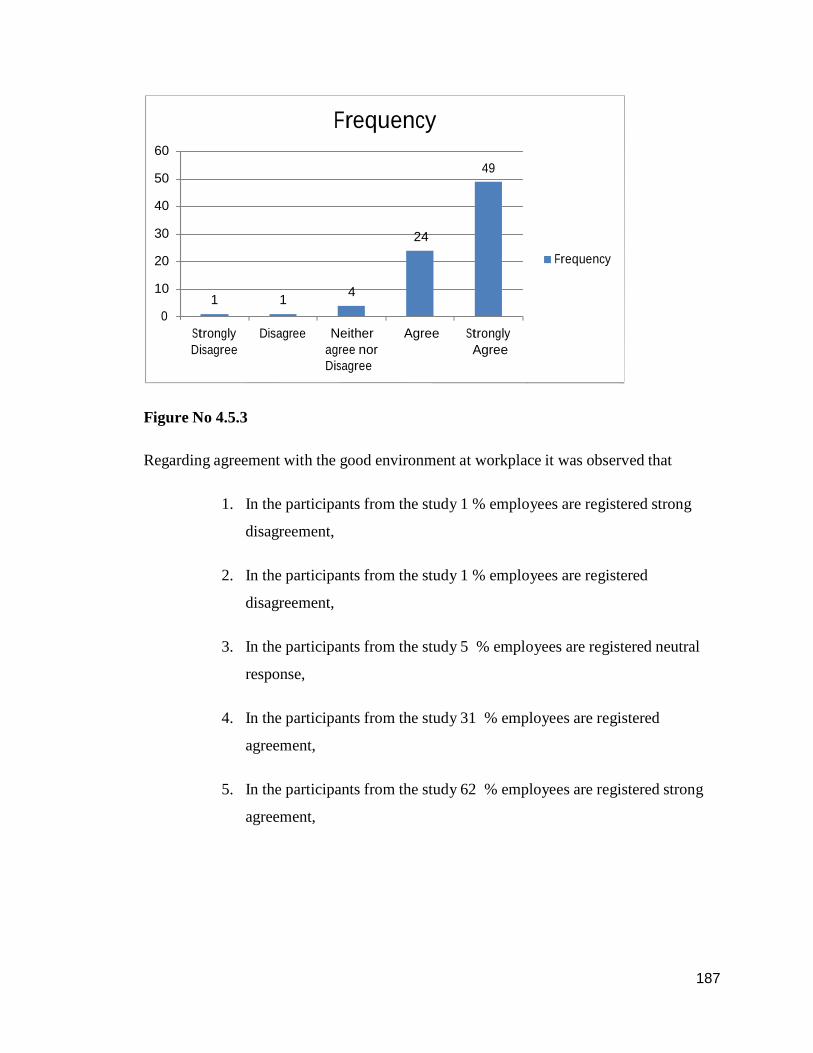
4.5.1:Q.3. They have good environment at workplace
Table no 4.5.3
Response Frequency Percentage
Fully Disagree 1 1
Disagree 1 1
Neither agree nor Disagree 4 5
Agree 24 31
Fully Agree 49 62
Total 79 100
187187187
Frequency60
4950
40
30 24
20
101 1 4
0
Frequency
StronglyDisagree
Disagree Neitheragree norDisagree
Agree StronglyAgree
Figure No 4.5.3
Regarding agreement with the good environment at workplace it was observed that
1. In the participants from the study 1 % employees are registered strong
disagreement,
2. In the participants from the study 1 % employees are registered
disagreement,
3. In the participants from the study 5 % employees are registered neutral
response,
4. In the participants from the study 31 % employees are registered
agreement,
5. In the participants from the study 62 % employees are registered strong
agreement,
188188188
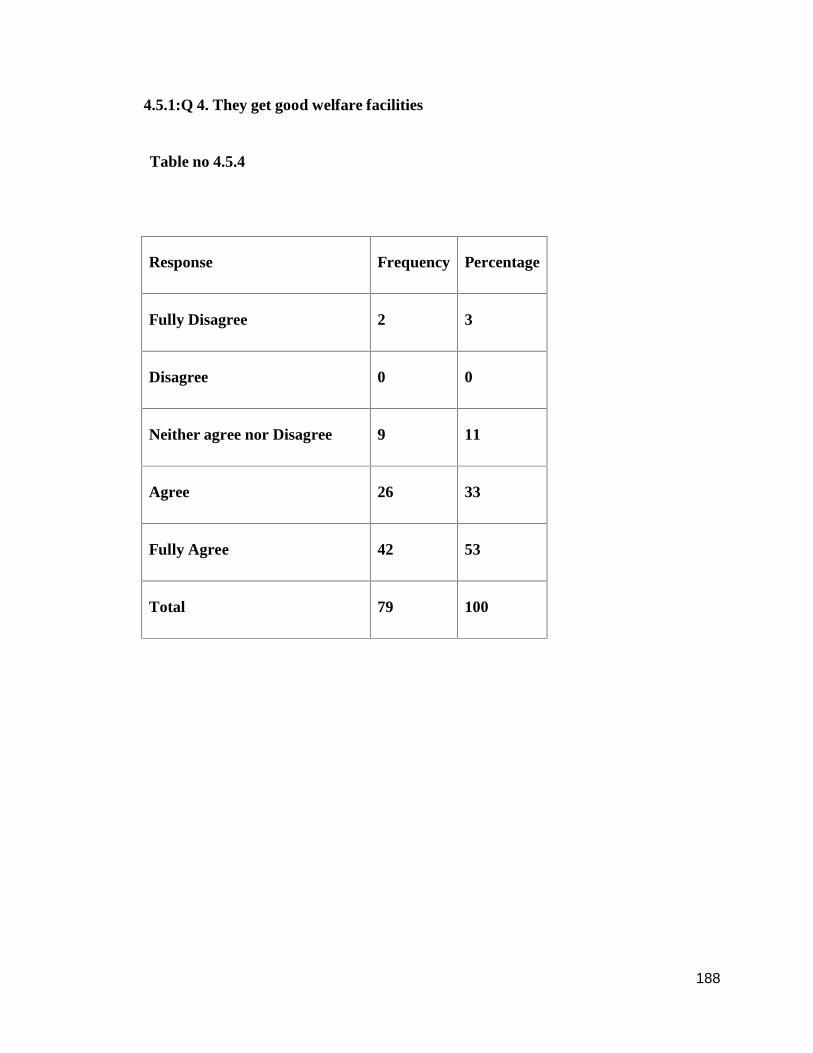
4.5.1:Q 4. They get good welfare facilities
Table no 4.5.4
Response Frequency Percentage
Fully Disagree 2 3
Disagree 0 0
Neither agree nor Disagree 9 11
Agree 26 33
Fully Agree 42 53
Total 79 100
189189189
45403530252015105 2 00
Frequency42
26
9Frequency
StronglyDisagree
Disagree Neitheragree norDisagree
Agree StronglyAgree
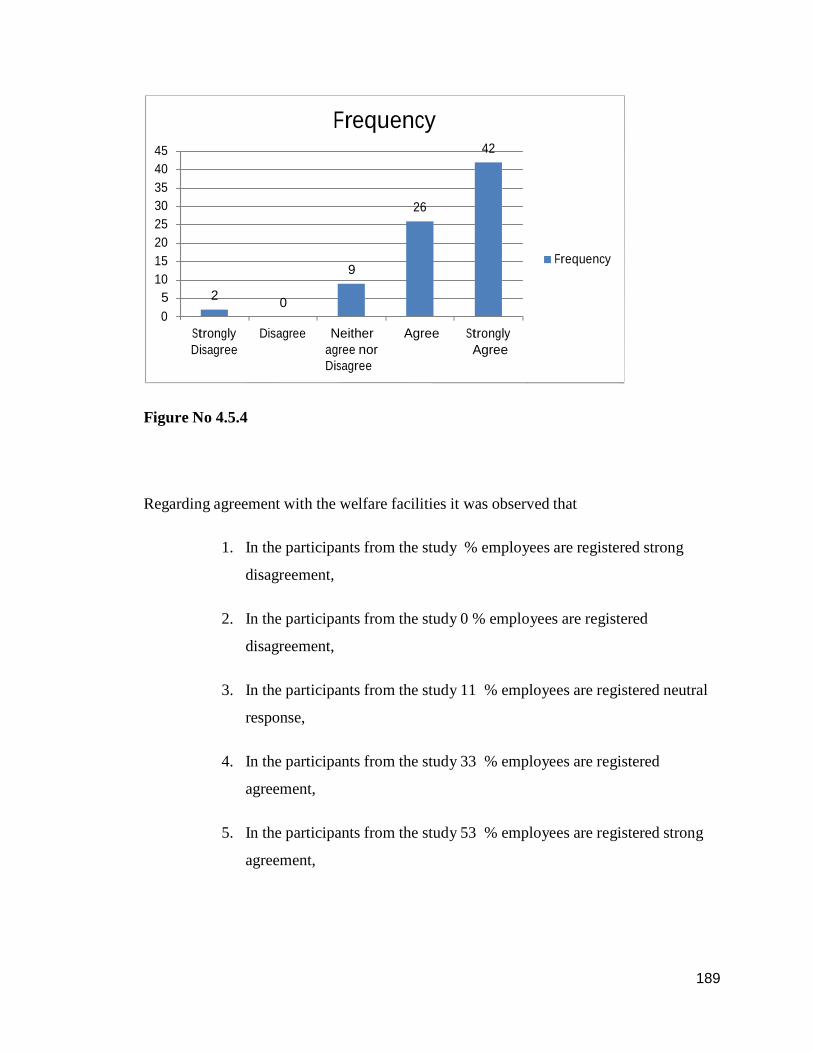
Figure No 4.5.4
Regarding agreement with the welfare facilities it was observed that
1. In the participants from the study % employees are registered strong
disagreement,
2. In the participants from the study 0 % employees are registered
disagreement,
3. In the participants from the study 11 % employees are registered neutral
response,
4. In the participants from the study 33 % employees are registered
agreement,
5. In the participants from the study 53 % employees are registered strong
agreement,
190190190
3
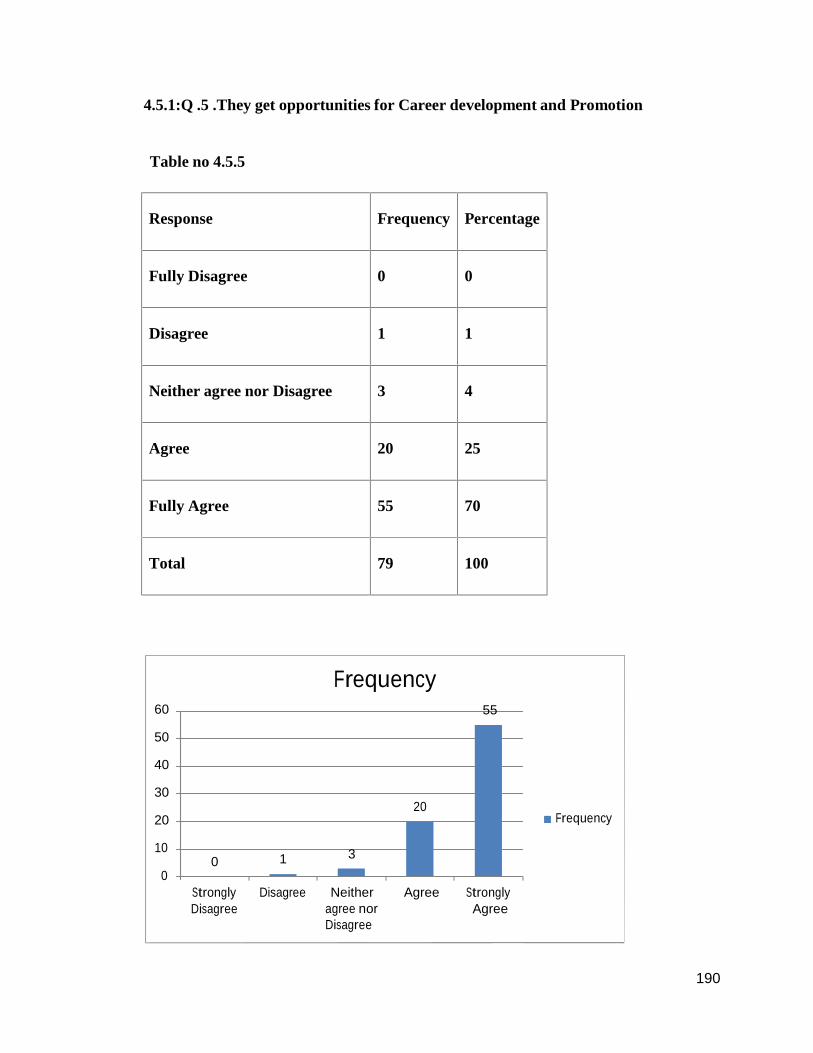
4.5.1:Q .5 .They get opportunities for Career development and Promotion
Table no 4.5.5
Response Frequency Percentage
Fully Disagree 0 0
Disagree 1 1
Neither agree nor Disagree 3 4
Agree 20 25
Fully Agree 55 70
Total 79 100
Frequency60 55
50
40
3020
20 Frequency
100 1
0StronglyDisagree
Disagree Neitheragree norDisagree
Agree StronglyAgree
191191191
Figure No 4.5.5
Regarding agreement with the opportunities for career development and promotion it was
observed that
1. In the participants from the study 0 % employees are registered strong
disagreement,
2. In the participants from the study 1 % employees are registered
disagreement,
3. In the participants from the study 4 % employees are registered neutral
response,
4. In the participants from the study 25 % employees are registered
agreement,
5. In the participants from the study 70 % employees are registered strong
agreement,

192192192
4.5.1:Q. 6 .They get Awards, Rewards, Appreciation, Recognition for Good Work
Table no 4.5.6
Response Frequency Percentage
Fully Disagree 0 0
Disagree 1 1
Neither agree nor Disagree 4 5
Agree 22 29
Fully Agree 52 65
Total 79 100
Frequency60 5250
40
30 2220
100 1 4
0
Frequency
StronglyDisagree
Disagree Neitheragree norDisagree
Agree StronglyAgree
193193193
Figure No 4.5.6
Regarding agreement with the Awards, Rewards, Appreciation, Recognition for Good
Work it was observed that
1. In the participants from the study 0 % employees are registered strong
disagreement,
2. In the participants from the study 1 % employees are registered
disagreement,
3. In the participants from the study 5 % employees are registered neutral
response,
4. In the participants from the study 29 % employees are registered
agreement,
5. In the participants from the study 65 % employees are registered strong
agreement,
194194194
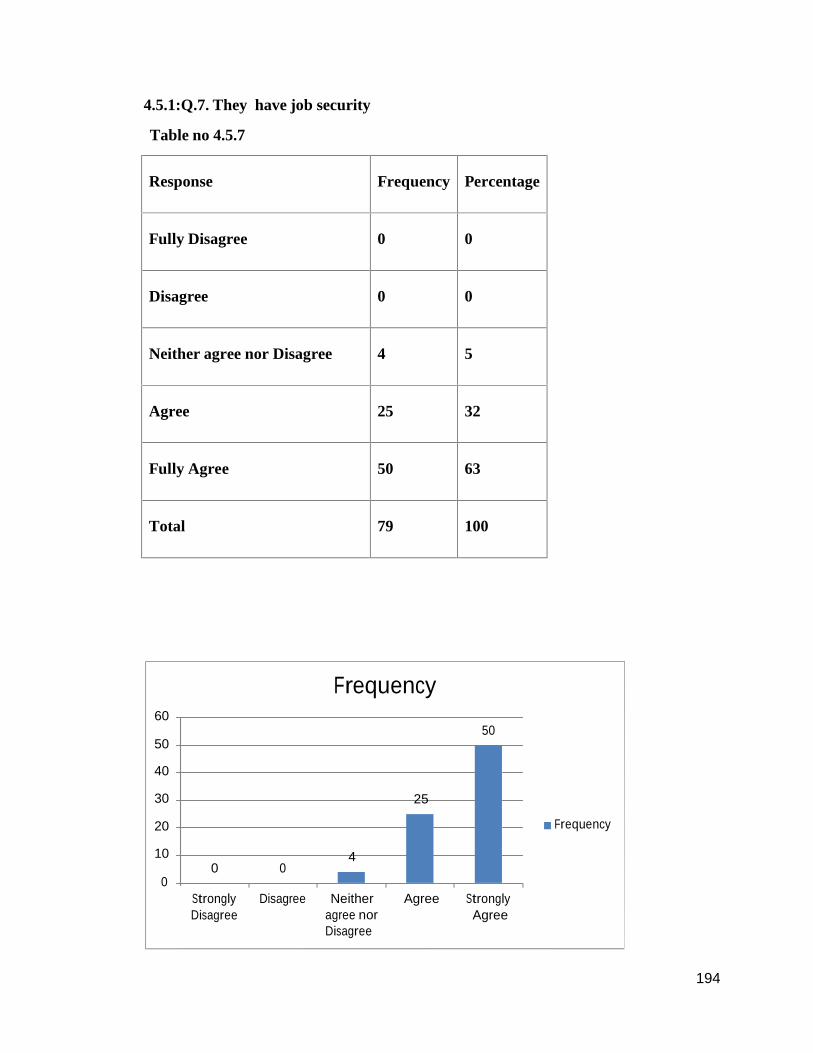
4.5.1:Q.7. They have job security
Table no 4.5.7
Response Frequency Percentage
Fully Disagree 0 0
Disagree 0 0
Neither agree nor Disagree 4 5
Agree 25 32
Fully Agree 50 63
Total 79 100
Frequency60
5050
40
30 25
20
10 40 0
0
Frequency
StronglyDisagree
Disagree Neitheragree norDisagree
Agree StronglyAgree
195195195
Figure No 4.5.7
Regarding agreement with the job security it was observed that
1. In the participants from the study 0 % employees are registered strong
disagreement,
2. In the participants from the study 0 % employees are registered
disagreement,
3. In the participants from the study 5 % employees are registered neutral
response,
4. In the participants from the study 32 % employees are registered
agreement,
5. In the participants from the study 63 % employees are registered strong
agreement,
196196196
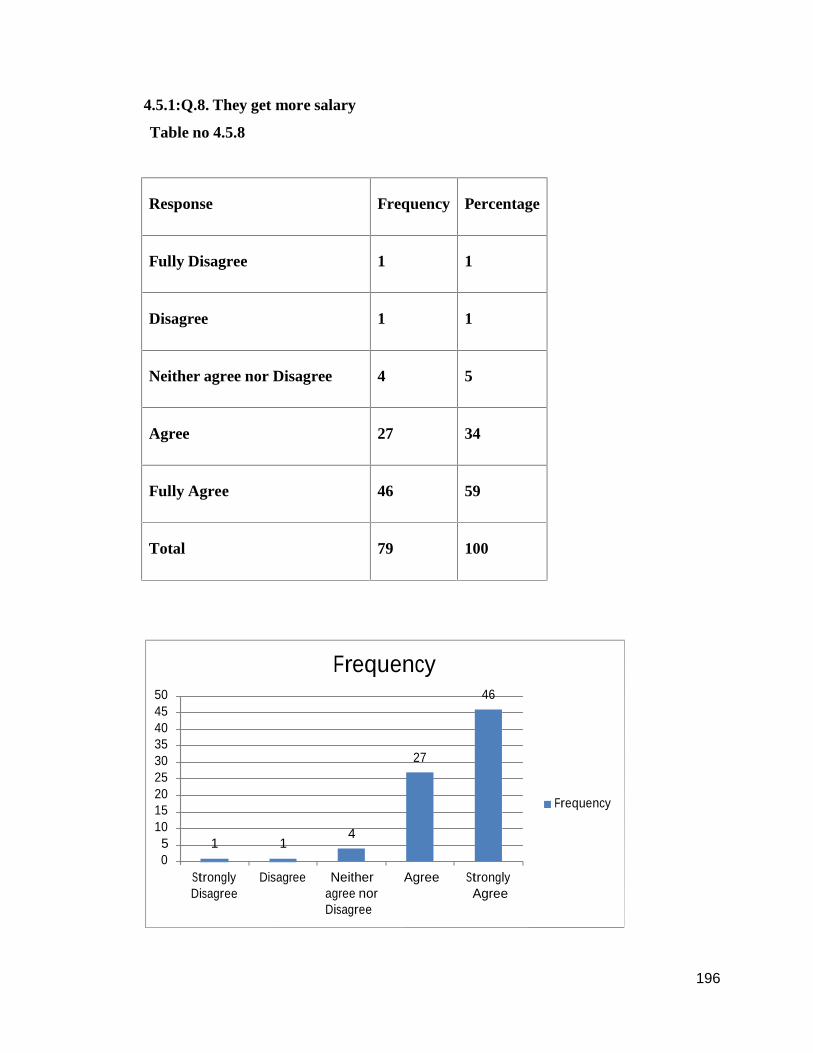
4.5.1:Q.8. They get more salary
Table no 4.5.8
Response Frequency Percentage
Fully Disagree 1 1
Disagree 1 1
Neither agree nor Disagree 4 5
Agree 27 34
Fully Agree 46 59
Total 79 100
5045403530252015105 1 10
Frequency46
27
4
Frequency
StronglyDisagree
Disagree Neitheragree norDisagree
Agree StronglyAgree
197197197
Figure No 4.5.8
Regarding agreement with the more salary it was observed that
1. In the participants from the study 1 % employees are registered strong
disagreement,
2. In the participants from the study 1 % employees are registered
disagreement,
3. In the participants from the study 5 % employees are registered neutral
response,
4. In the participants from the study 34 % employees are registered
agreement,
5. In the participants from the study 59 % employees are registered strong
agreement,
198198198
4.6 : Analysis of impact of motivation on performance of employees (perceived by
Managers)
Researcher has asked the questions regarding impact of motivation on the performance of
the employees as perceived by the managers. Researcher has taken 10 parameters to
judge the impact of motivation on the employee’s performance. Here the questions were
asked what the response is when employees are motivated. The responses were taken of
the five scale likert scale of agreement from Fully disagree to Fully agree.
Here is analysis of the factors which shows the impact of the motivation on the
employees.
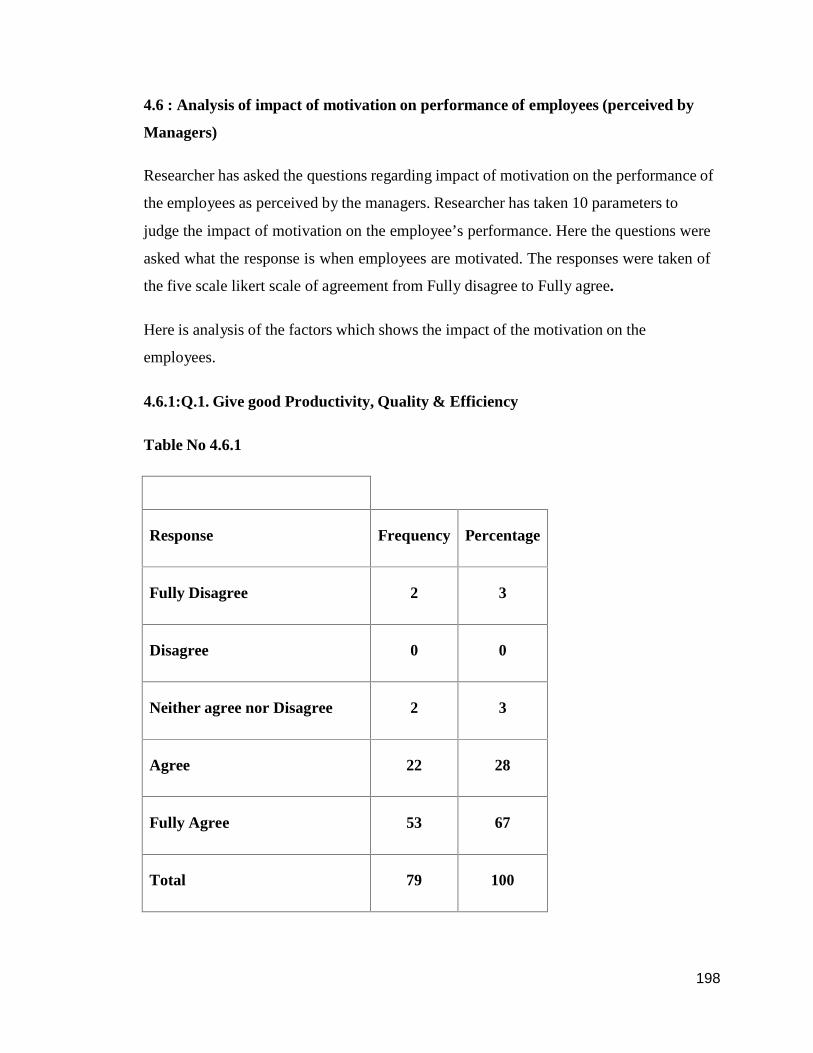
4.6.1:Q.1. Give good Productivity, Quality & Efficiency
Table No 4.6.1
Response Frequency Percentage
Fully Disagree 2 3
Disagree 0 0
Neither agree nor Disagree 2 3
Agree 22 28
Fully Agree 53 67
Total 79 100
199199199
Frequency60
50
40
30
20 Frequency
10
0StronglyDisagree
Disagree Neitheragree norDisagree
Agree StronglyAgree
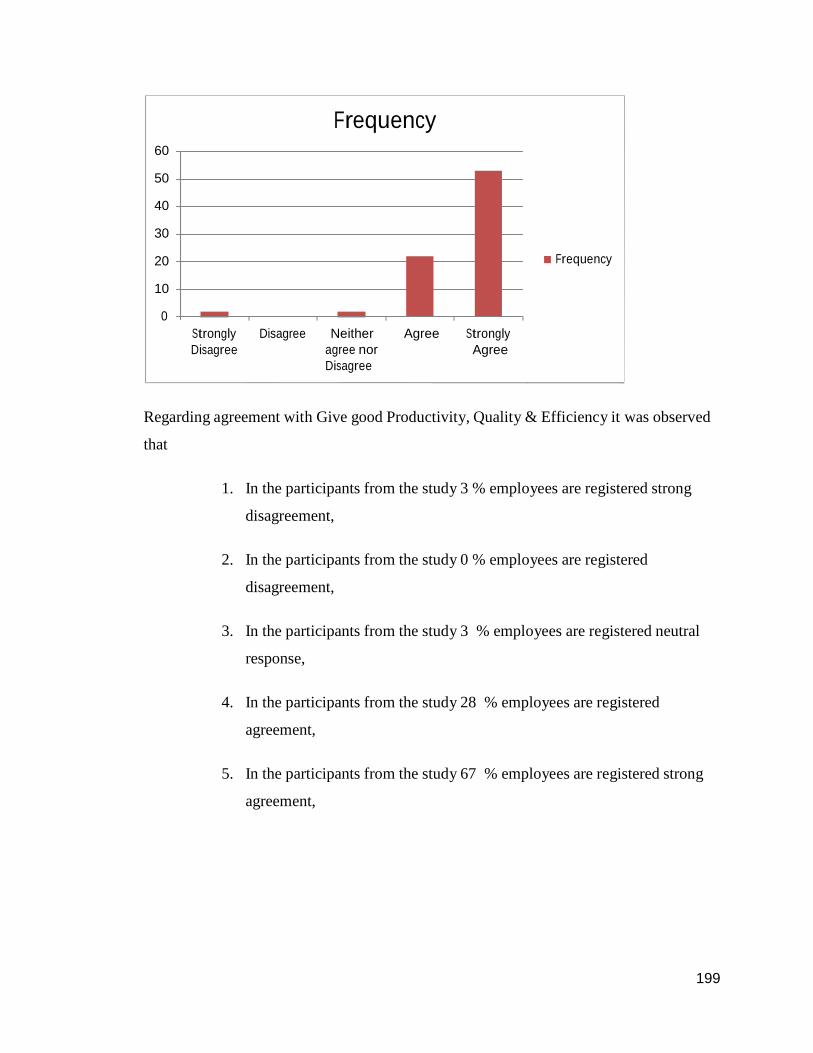
Regarding agreement with Give good Productivity, Quality & Efficiency it was observed
that
1. In the participants from the study 3 % employees are registered strong
disagreement,
2. In the participants from the study 0 % employees are registered
disagreement,
3. In the participants from the study 3 % employees are registered neutral
response,
4. In the participants from the study 28 % employees are registered
agreement,
5. In the participants from the study 67 % employees are registered strong
agreement,

200200200
4.6..2:Q.2. Helps to improve working environment
Response Frequency Percentage
Fully Disagree 0 0
Disagree 3 4
Neither agree nor Disagree 4 5
Agree 23 29
Fully Agree 49 62
Total 79 100
Frequency60
50
40
30
20 Frequency
10
0StronglyDisagree
Disagree Neitheragree norDisagree
Agree StronglyAgree
201201201
Regarding agreement with the factor motivation helps to improve working environment it
was observed that
1. In the participants from the study 0 % employees are registered strong
disagreement,
2. In the participants from the study 4 % employees are registered
disagreement,
3. In the participants from the study 5 % employees are registered neutral
response,
4. In the participants from the study 29 % employees are registered
agreement,
5. In the participants from the study 62 % employees are registered strong
agreement,

202202202
4.6..2:Q.3. Learn and do new things
Response Frequency Percentage
Fully Disagree 2 3
Disagree 2 3
Neither agree nor Disagree 3 4
Agree 24 30
Fully Agree 48 61
Total 79 100
Frequency60
50
40
30
20 Frequency
10
0StronglyDisagree
Disagree Neitheragree norDisagree
Agree StronglyAgree
203203203
Regarding agreement with the learning and doing new things it was observed that
1. In the participants from the study 3 % employees are registered strong
disagreement,
2. In the participants from the study 3 % employees are registered
disagreement,
3. In the participants from the study 4 % employees are registered neutral
response,
4. In the participants from the study 30 % employees are registered
agreement,
5. In the participants from the study 61 % employees are registered strong
agreement,
204204204
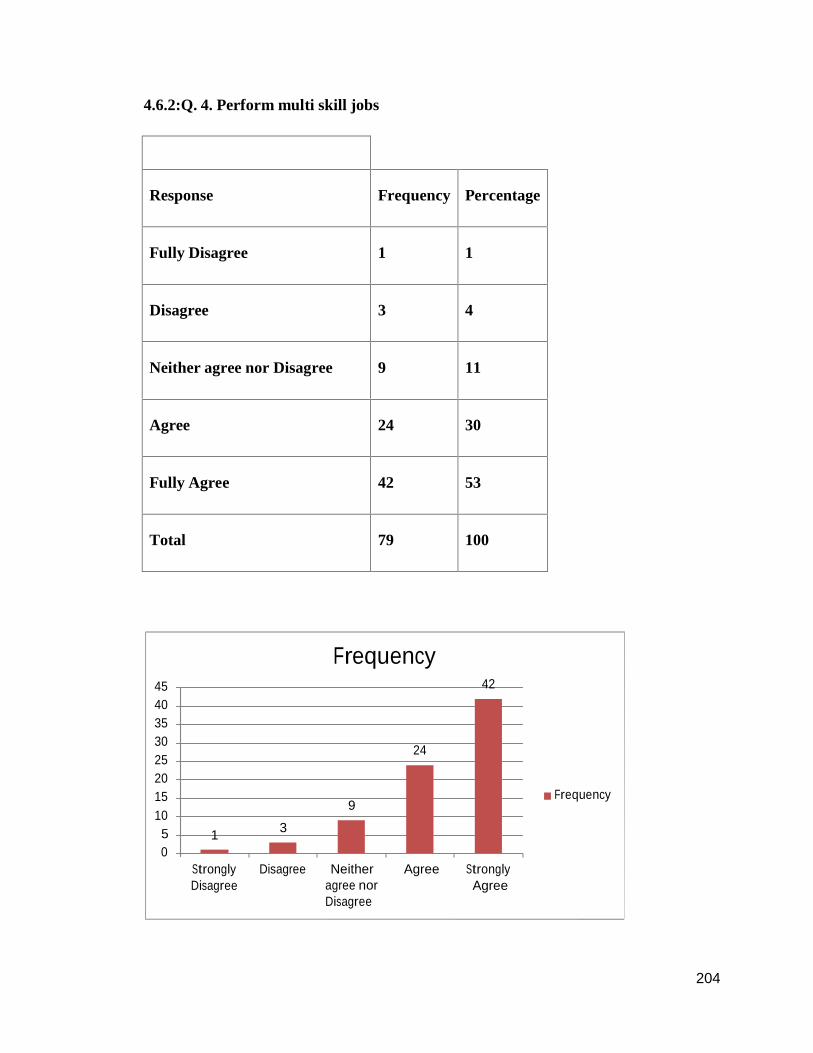
4.6.2:Q. 4. Perform multi skill jobs
Response Frequency Percentage
Fully Disagree 1 1
Disagree 3 4
Neither agree nor Disagree 9 11
Agree 24 30
Fully Agree 42 53
Total 79 100
45403530252015105 1 3
0
Frequency42
24
9Frequency
StronglyDisagree
Disagree Neitheragree norDisagree
Agree StronglyAgree
205205205
Regarding agreement with the performing multi skill jobs it was observed that
1. In the participants from the study 1 % employees are registered strong
disagreement,
2. In the participants from the study 4 % employees are registered
disagreement,
3. In the participants from the study 11 % employees are registered neutral
response,
4. In the participants from the study 30 % employees are registered
agreement,
5. In the participants from the study 53 % employees are registered strong
agreement,
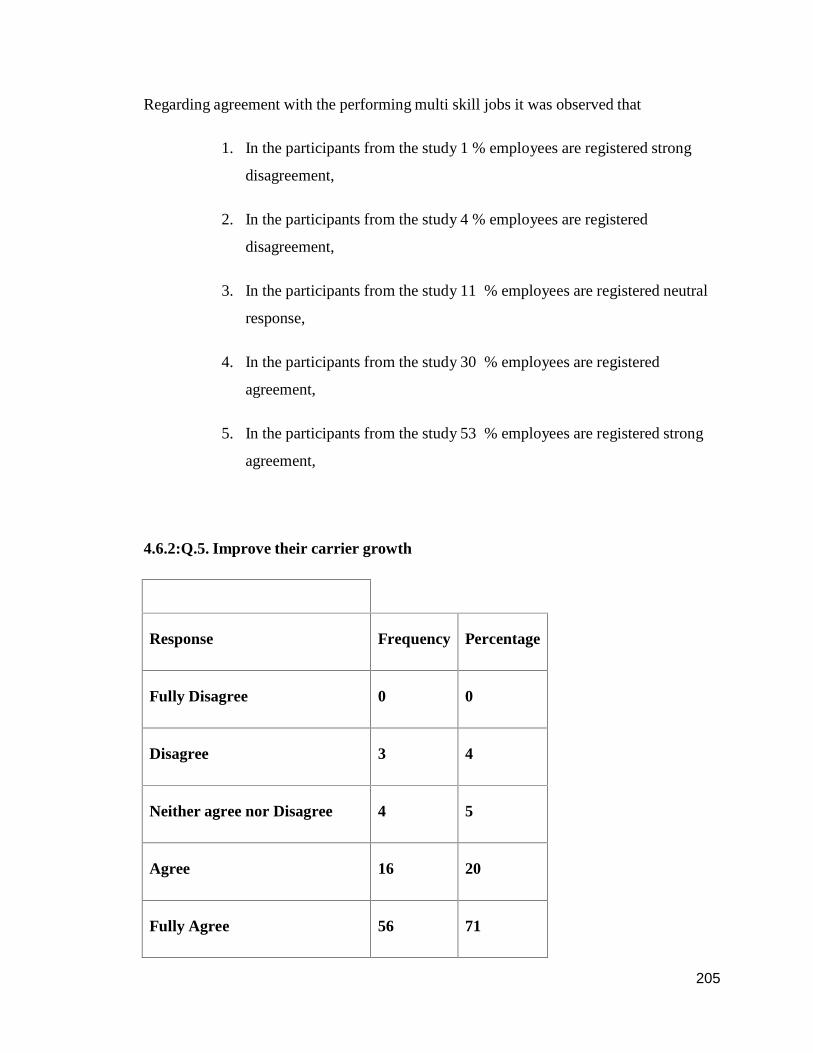
4.6.2:Q.5. Improve their carrier growth
Response Frequency Percentage
Fully Disagree 0 0
Disagree 3 4
Neither agree nor Disagree 4 5
Agree 16 20
Fully Agree 56 71
206206206
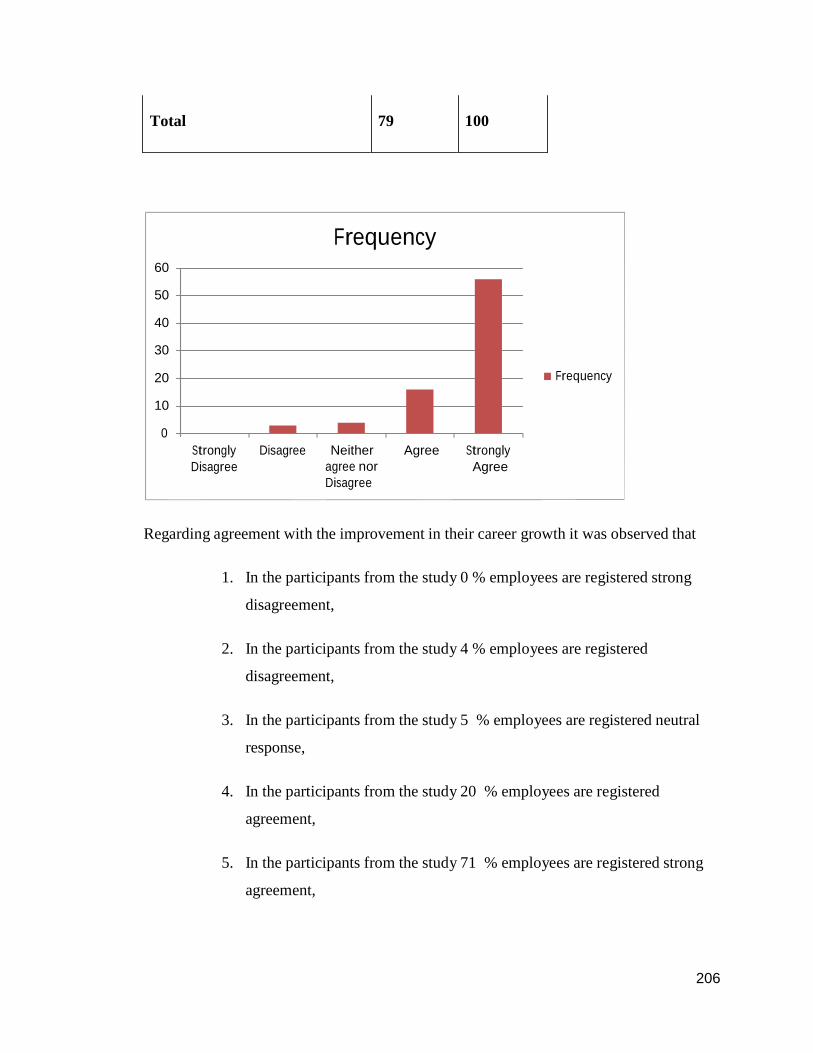
Total 79 100
Frequency60
50
40
30
20 Frequency
10
0StronglyDisagree
Disagree Neitheragree norDisagree
Agree StronglyAgree
Regarding agreement with the improvement in their career growth it was observed that
1. In the participants from the study 0 % employees are registered strong
disagreement,
2. In the participants from the study 4 % employees are registered
disagreement,
3. In the participants from the study 5 % employees are registered neutral
response,
4. In the participants from the study 20 % employees are registered
agreement,
5. In the participants from the study 71 % employees are registered strong
agreement,

4.6.2:Q.6. Maintain good work life balance
Maintain good work life
balance
Response Frequency Percentage
Fully Disagree 2 3
Disagree 1 1
Neither agree nor Disagree 2 3
Agree 26 33
Fully Agree 48 61
Total 79 100
207
208208208
Frequency60
50
40
30
20 Frequency
10
0StronglyDisagree
Disagree Neitheragree norDisagree
Agree StronglyAgree
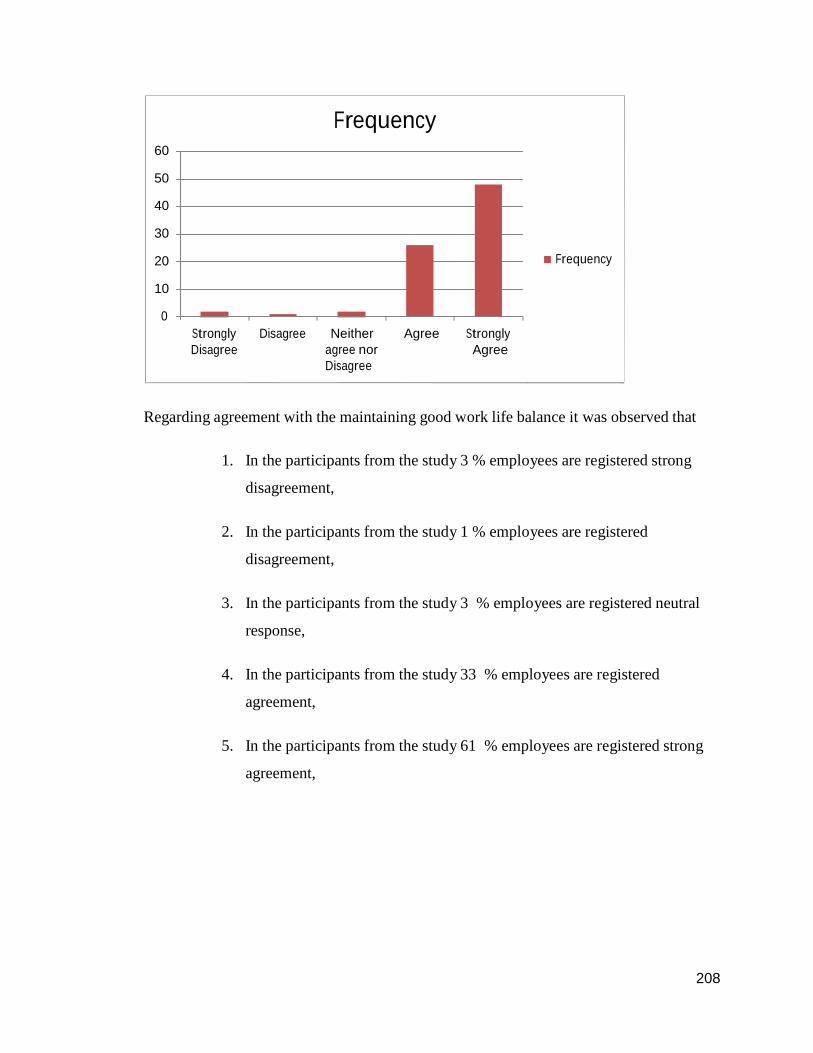
Regarding agreement with the maintaining good work life balance it was observed that
1. In the participants from the study 3 % employees are registered strong
disagreement,
2. In the participants from the study 1 % employees are registered
disagreement,
3. In the participants from the study 3 % employees are registered neutral
response,
4. In the participants from the study 33 % employees are registered
agreement,
5. In the participants from the study 61 % employees are registered strong
agreement,
209209209
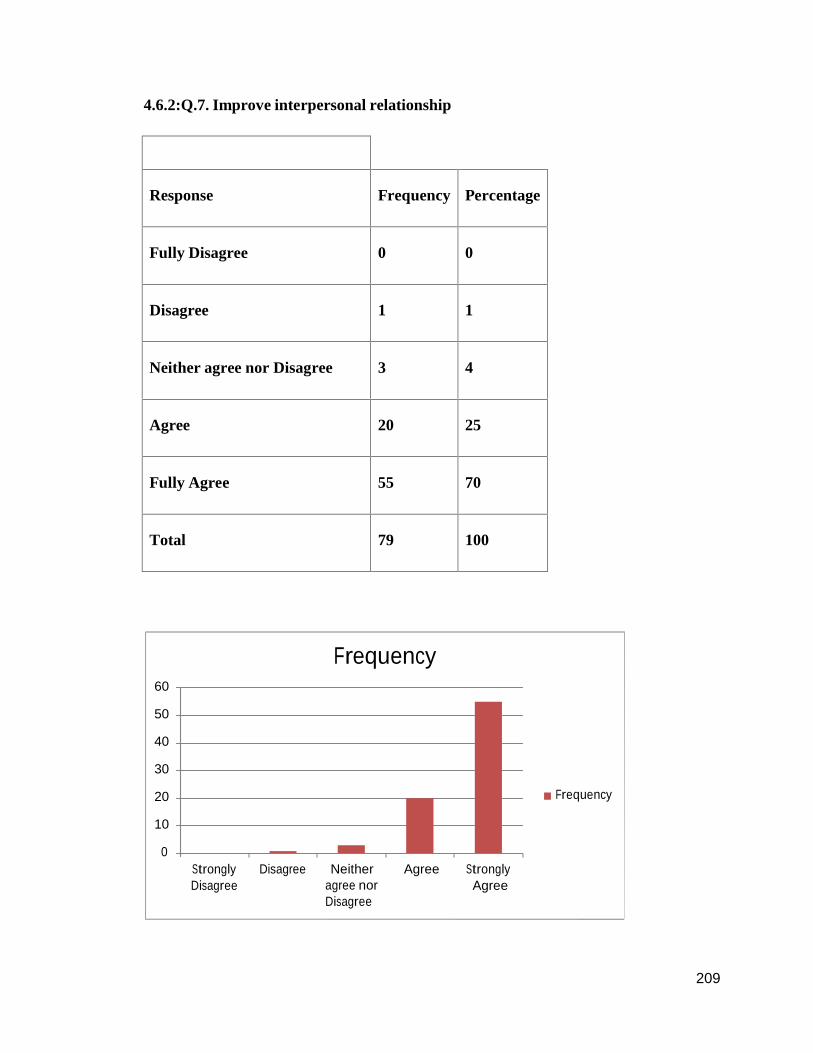
4.6.2:Q.7. Improve interpersonal relationship
Response Frequency Percentage
Fully Disagree 0 0
Disagree 1 1
Neither agree nor Disagree 3 4
Agree 20 25
Fully Agree 55 70
Total 79 100
Frequency60
50
40
30
20 Frequency
10
0StronglyDisagree
Disagree Neitheragree norDisagree
Agree StronglyAgree
210210210
Regarding agreement with the improving interpersonal relationship it was observed that
1. In the participants from the study 0 % employees are registered strong
disagreement,
2. In the participants from the study 1 % employees are registered
disagreement,
3. In the participants from the study 4 % employees are registered neutral
response,
4. In the participants from the study 25 % employees are registered
agreement,
5. In the participants from the study 70 % employees are registered strong
agreement,

211211211
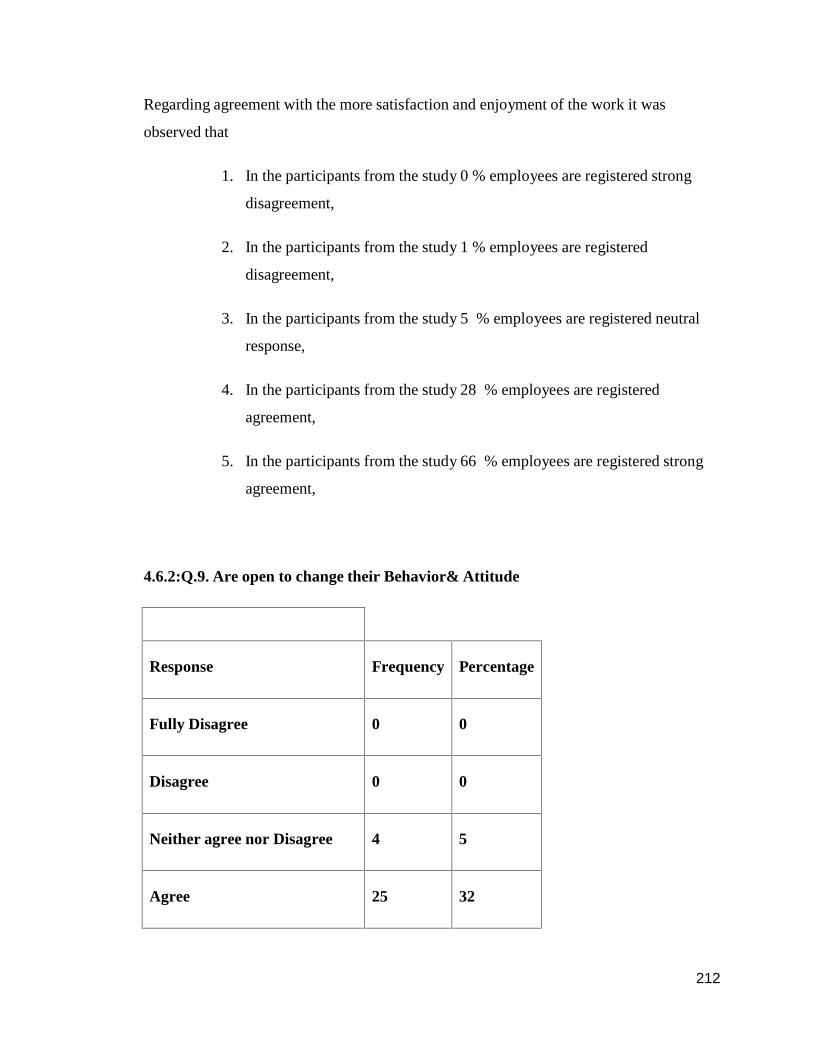
4.6.2:Q.8. Are more satisfied & enjoy their work
Response Frequency Percentage
Fully Disagree 0 0
Disagree 1 1
Neither agree nor Disagree 4 5
Agree 22 28
Fully Agree 52 66
Total 79 100
Frequency60
50
40
30
20 Frequency
10
0StronglyDisagree
Disagree Neitheragree norDisagree
Agree StronglyAgree
212212212
Regarding agreement with the more satisfaction and enjoyment of the work it was
observed that
1. In the participants from the study 0 % employees are registered strong
disagreement,
2. In the participants from the study 1 % employees are registered
disagreement,
3. In the participants from the study 5 % employees are registered neutral
response,
4. In the participants from the study 28 % employees are registered
agreement,
5. In the participants from the study 66 % employees are registered strong
agreement,
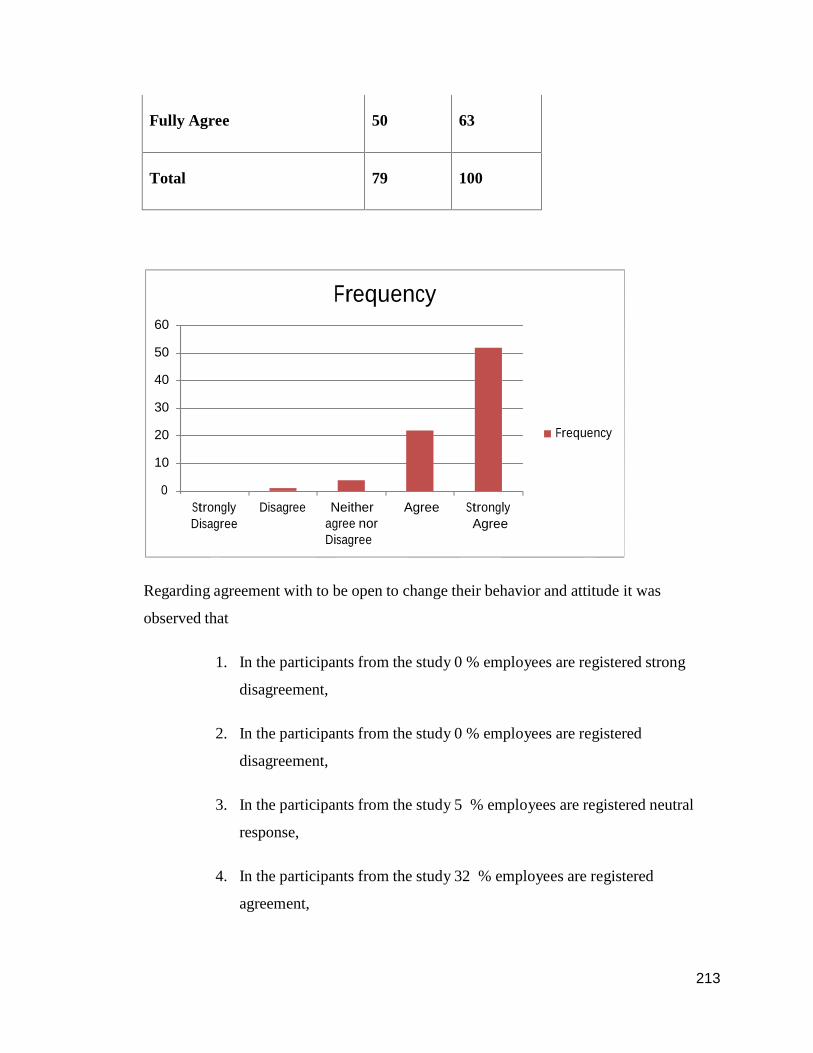
4.6.2:Q.9. Are open to change their Behavior& Attitude
Response Frequency Percentage
Fully Disagree 0 0
Disagree 0 0
Neither agree nor Disagree 4 5
Agree 25 32
213213213
Fully Agree 50 63
Total 79 100
Frequency60
50
40
30
20 Frequency
10
0StronglyDisagree
Disagree Neitheragree norDisagree
Agree StronglyAgree
Regarding agreement with to be open to change their behavior and attitude it was
observed that
1. In the participants from the study 0 % employees are registered strong
disagreement,
2. In the participants from the study 0 % employees are registered
disagreement,
3. In the participants from the study 5 % employees are registered neutral
response,
4. In the participants from the study 32 % employees are registered
agreement,
214214214
5. In the participants from the study 63 % employees are registered strong
agreement,
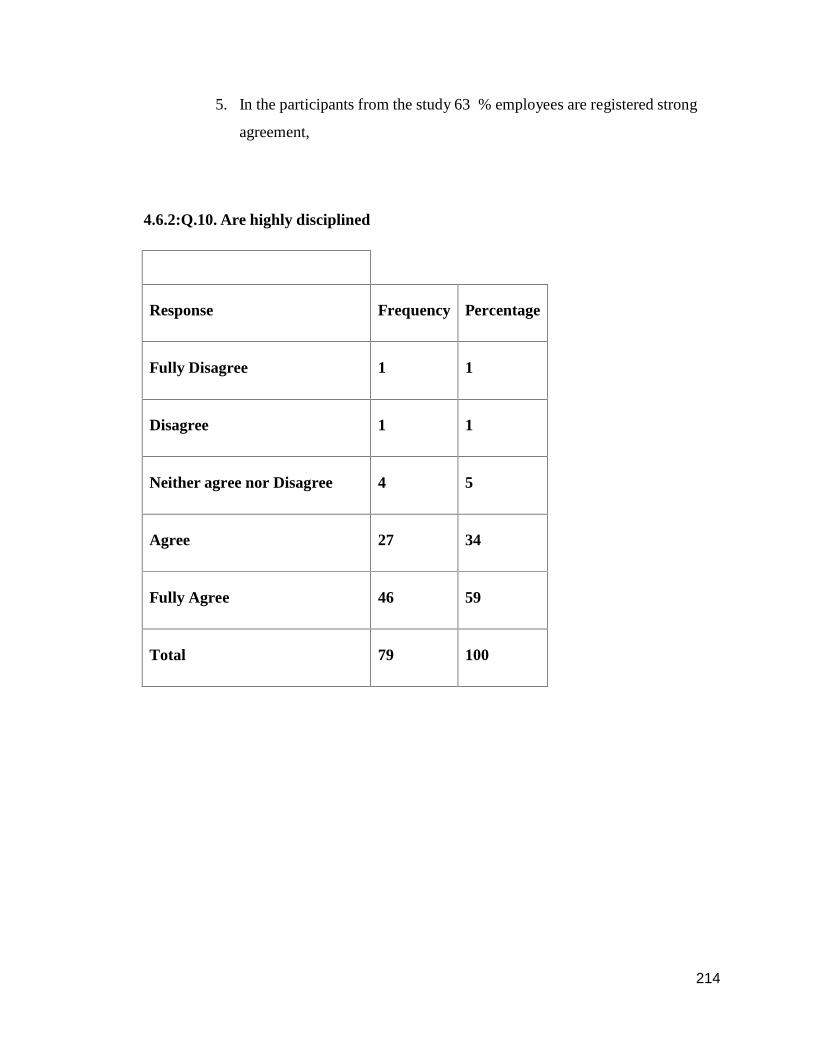
4.6.2:Q.10. Are highly disciplined
Response Frequency Percentage
Fully Disagree 1 1
Disagree 1 1
Neither agree nor Disagree 4 5
Agree 27 34
Fully Agree 46 59
Total 79 100

215215215
Frequency50454035302520151050
Frequency
StronglyDisagree
Disagree Neitheragree norDisagree
Agree StronglyAgree
Regarding agreement with boosting the discipline it was observed that
1. In the participants from the study 1 % employees are registered strong
disagreement,
2. In the participants from the study 1 % employees are registered
disagreement,
3. In the participants from the study 5 % employees are registered neutral
response,
4. In the participants from the study 34 % employees are registered
agreement,
5. In the participants from the study 59 % employees are registered strong
agreement,
216216216
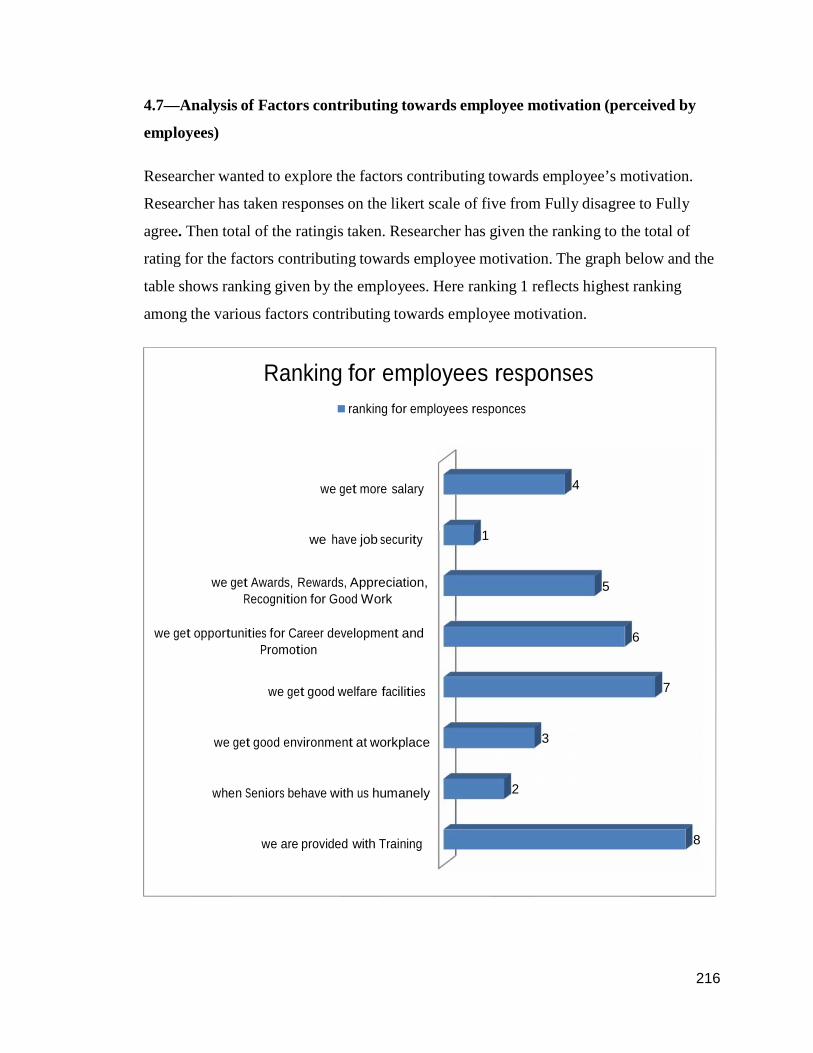
4.7—Analysis of Factors contributing towards employee motivation (perceived by
employees)
Researcher wanted to explore the factors contributing towards employee’s motivation.
Researcher has taken responses on the likert scale of five from Fully disagree to Fully
agree. Then total of the ratingis taken. Researcher has given the ranking to the total of
rating for the factors contributing towards employee motivation. The graph below and the
table shows ranking given by the employees. Here ranking 1 reflects highest ranking
among the various factors contributing towards employee motivation.
Ranking for employees responsesranking for employees responces
we get more salary 4
we have job security 1
we get Awards, Rewards, Appreciation, 5Recognition for Good Work
we get opportunities for Career development and 6Promotion
we get good welfare facilities 7
we get good environment at workplace 3
when Seniors behave with us humanely 2
we are provided with Training 8

217217217
Factors contributing towards employees
motivation
ranking for employees
Responses
we are provided with Training 8
when Seniors behave with us humanely 2
we get good environment at workplace 3
we get good welfare facilities 7
we get opportunities for Career development and
Promotion 6
we get Awards, Rewards, Appreciation,
Recognition for Good Work 5
we have job security 1
we get more salary 4
Above table and graph shows that there is highest agreement is given to the job security
as factor contributing towards employee motivation followed by senior’s behavior with
the employees humanely. The least agreement is for getting welfare facilities and training
facilities to the employees.

218218218
4.8—Analysis of current status of initiatives taken by the company management
towards employee’s motivation (perceived by employees)
Researcher wanted to explore the current status of the initiatives taken by the company
management towards employee motivation. Researcher has taken responses for the
questions below on the five point likert scale of 5 (Fully disagree to Fully agree).
It was observed that there is highest agreement towards the level of incentives followed
by carrier development and promotion opportunities. The least agreement towards
relations with colleagues and supervisors followed by team spirit and working conditions
at workplace.
RankRank
Q-2-17 9
Q-2-16 14
Q-2-15 6
Q-2-14 8
Q-2-13 15
Q-2-12 3
Q-2-11 2
Q-2-10 7
Q-2-9 12
Q-2-8 13
Q-2-7 16
Q-2-6 11
Q-2-5 17
Q-2-4 5
Q-2-3 4
Q-2-2 1
Q-2-1 10
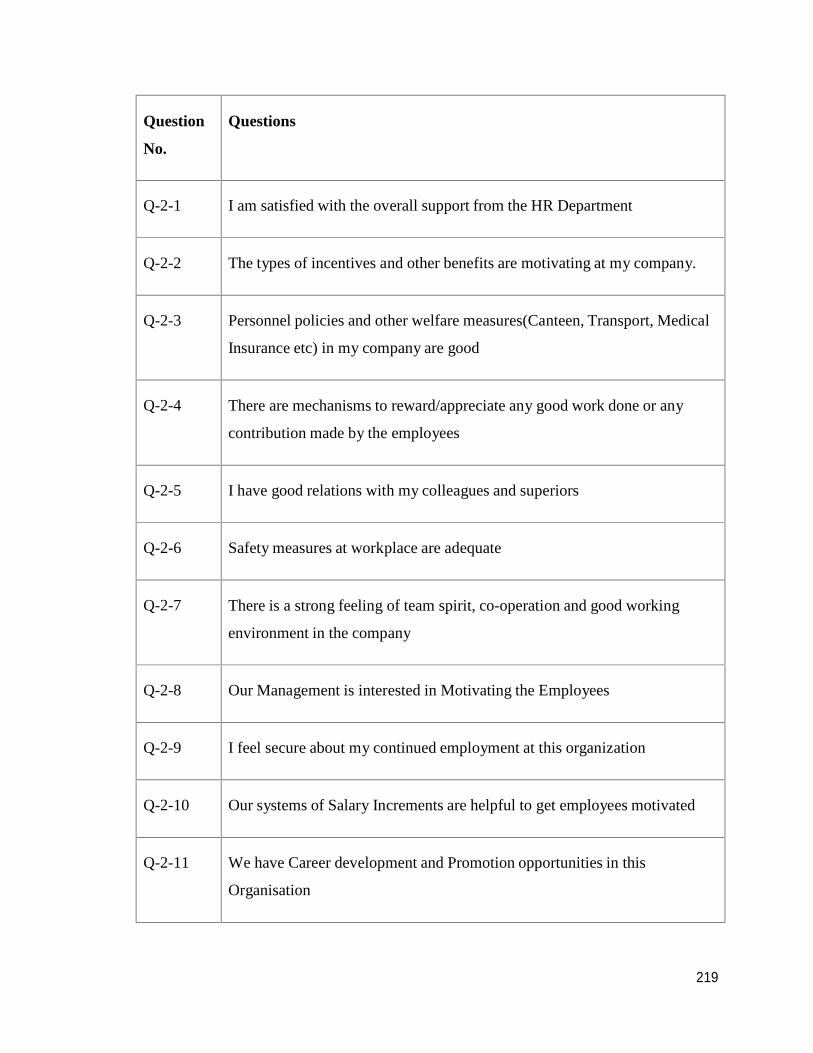
Question
No.
Questions
Q-2-1 I am satisfied with the overall support from the HR Department
Q-2-2 The types of incentives and other benefits are motivating at my company.
Q-2-3 Personnel policies and other welfare measures(Canteen, Transport, Medical
Insurance etc) in my company are good
Q-2-4 There are mechanisms to reward/appreciate any good work done or any
contribution made by the employees
Q-2-5 I have good relations with my colleagues and superiors
Q-2-6 Safety measures at workplace are adequate
Q-2-7 There is a strong feeling of team spirit, co-operation and good working
environment in the company
Q-2-8 Our Management is interested in Motivating the Employees
Q-2-9 I feel secure about my continued employment at this organization
Q-2-10 Our systems of Salary Increments are helpful to get employees motivated
Q-2-11 We have Career development and Promotion opportunities in this
Organisation
219
220220220
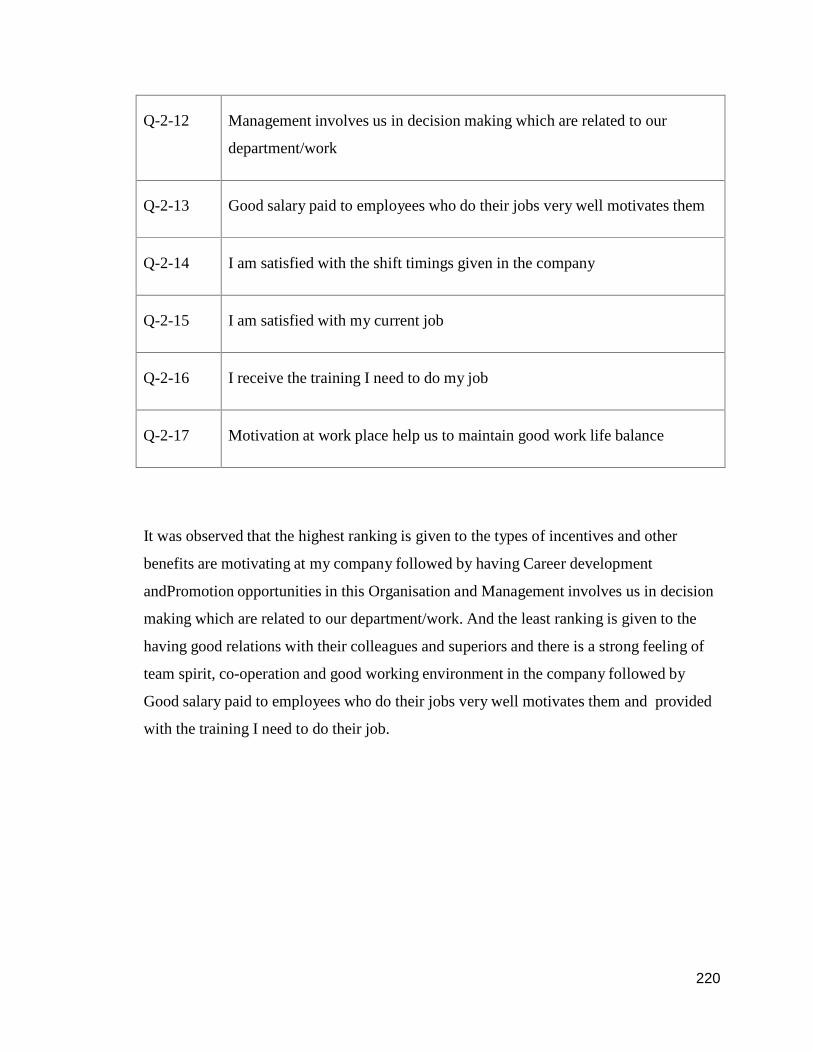
Q-2-12 Management involves us in decision making which are related to our
department/work
Q-2-13 Good salary paid to employees who do their jobs very well motivates them
Q-2-14 I am satisfied with the shift timings given in the company
Q-2-15 I am satisfied with my current job
Q-2-16 I receive the training I need to do my job
Q-2-17 Motivation at work place help us to maintain good work life balance
It was observed that the highest ranking is given to the types of incentives and other
benefits are motivating at my company followed by having Career development
andPromotion opportunities in this Organisation and Management involves us in decision
making which are related to our department/work. And the least ranking is given to the
having good relations with their colleagues and superiors and there is a strong feeling of
team spirit, co-operation and good working environment in the company followed by
Good salary paid to employees who do their jobs very well motivates them and provided
with the training I need to do their job.
221221221
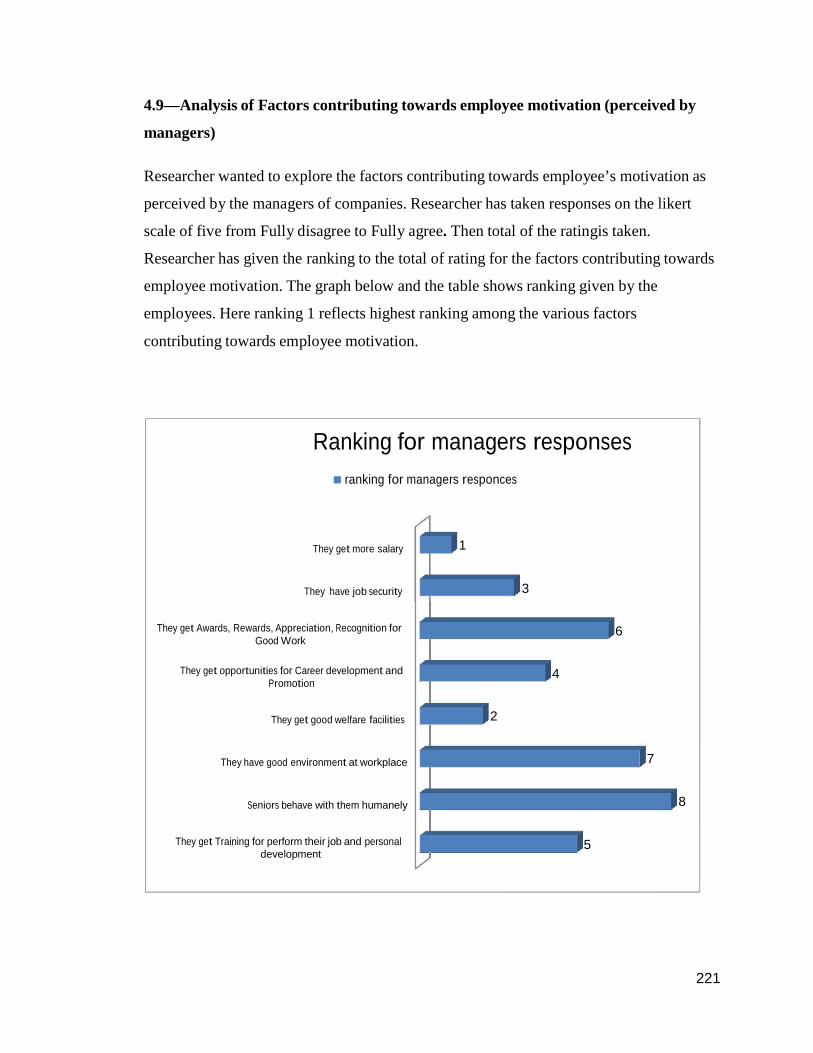
4.9—Analysis of Factors contributing towards employee motivation (perceived by
managers)
Researcher wanted to explore the factors contributing towards employee’s motivation as
perceived by the managers of companies. Researcher has taken responses on the likert
scale of five from Fully disagree to Fully agree. Then total of the ratingis taken.
Researcher has given the ranking to the total of rating for the factors contributing towards
employee motivation. The graph below and the table shows ranking given by the
employees. Here ranking 1 reflects highest ranking among the various factors
contributing towards employee motivation.
Ranking for managers responsesranking for managers responces
They get more salary 1
They have job security 3
They get Awards, Rewards, Appreciation, Recognition for 6Good Work
They get opportunities for Career development and 4Promotion
They get good welfare facilities 2
They have good environment at workplace 7
Seniors behave with them humanely 8
They get Training for perform their job and personal 5development
222222222
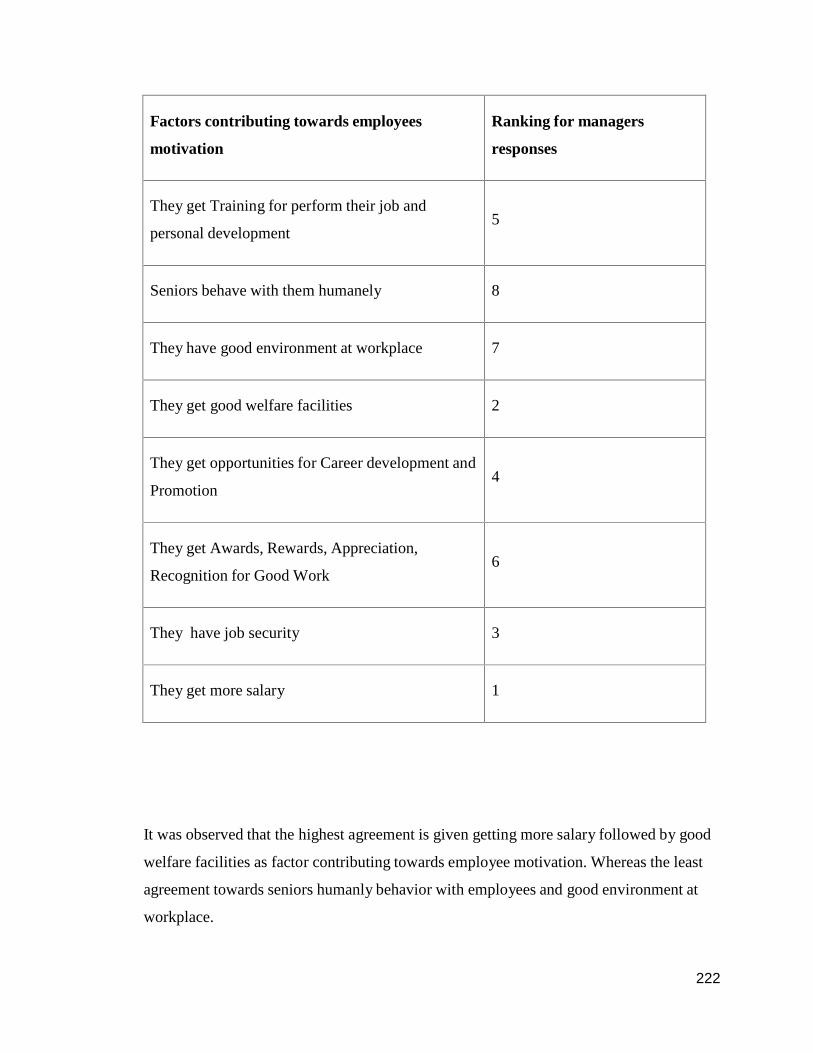
Factors contributing towards employees
motivation
Ranking for managers
responses
They get Training for perform their job and
personal development5
Seniors behave with them humanely 8
They have good environment at workplace 7
They get good welfare facilities 2
They get opportunities for Career development and
Promotion4
They get Awards, Rewards, Appreciation,
Recognition for Good Work6
They have job security 3
They get more salary 1
It was observed that the highest agreement is given getting more salary followed by good
welfare facilities as factor contributing towards employee motivation. Whereas the least
agreement towards seniors humanly behavior with employees and good environment at
workplace.
223223223
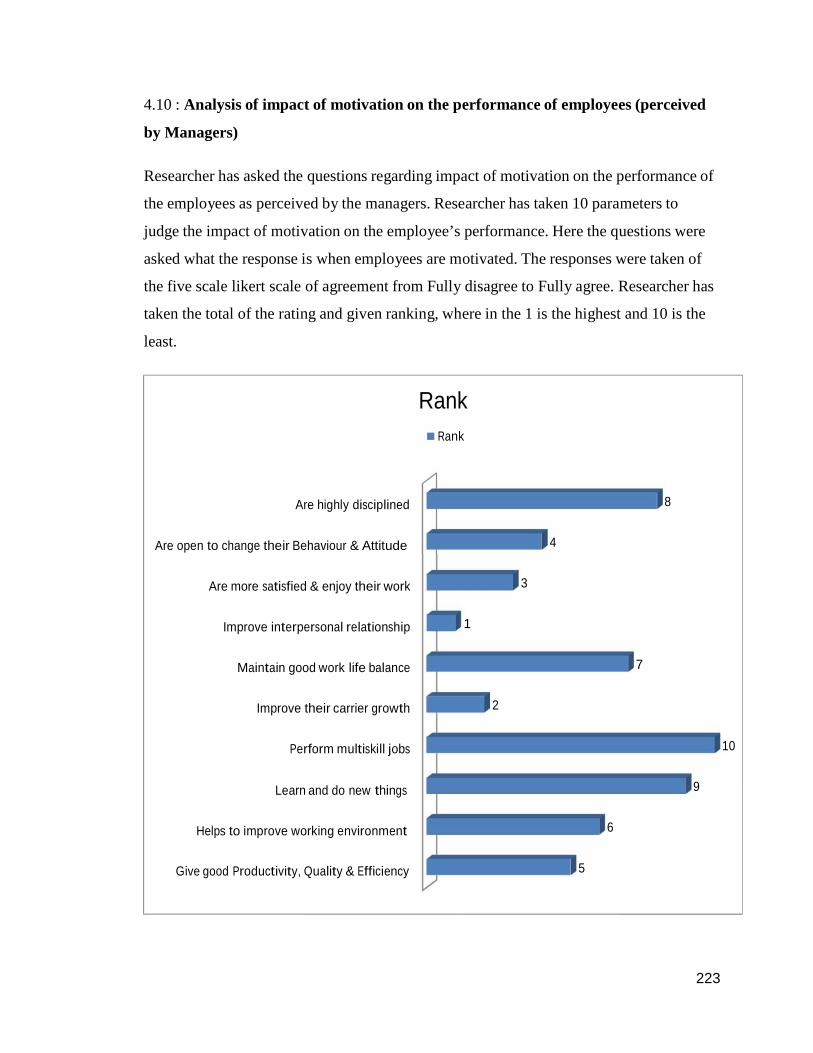
4.10 : Analysis of impact of motivation on the performance of employees (perceived
by Managers)
Researcher has asked the questions regarding impact of motivation on the performance of
the employees as perceived by the managers. Researcher has taken 10 parameters to
judge the impact of motivation on the employee’s performance. Here the questions were
asked what the response is when employees are motivated. The responses were taken of
the five scale likert scale of agreement from Fully disagree to Fully agree. Researcher has
taken the total of the rating and given ranking, where in the 1 is the highest and 10 is the
least.
RankRank
Are highly disciplined
Are open to change their Behaviour & Attitude 4
8
Are more satisfied & enjoy their work
Improve interpersonal relationship
Maintain good work life balance
Improve their carrier growth
Perform multiskill jobs
Learn and do new things
Helps to improve working environment
1
2
3
6
7
10
9
Give good Productivity, Quality & Efficiency 5

224224224
Sr no Impact of motivation Rank
1 Give good Productivity, Quality & Efficiency 5
2 Helps to improve working environment 6
3 Learn and do new things 9
4 Perform multiskill jobs 10
5 Improve their carrier growth 2
6 Maintain good work life balance 7
7 Improve interpersonal relationship 1
8 Are more satisfied & enjoy their work 3
9 Are open to change their Behavior & Attitude 4
10 Are highly disciplined 8
It was observed that highest ranking is given to the improvement in the interpersonal
relationship, followed by improvement in their carrier growth. Whereas the least ranking
is given for learning and doing new things followed by performing multi skill jobs.
225225225
4.11: COMPARATIVE ANALYSIS OF THE RESPONCES FROM MANAGERS
AND EMPLOYEES
Researcher wanted to explore the difference of opinion about factors contributing
towards the employee motivation. Through the discussions with the managers at various
levels from the different companies researcher has taken eight factors that contributes to
the employee’s motivation. These factors are as follows:
1. we are provided with Training
2. when Seniors behave with us humanely
3. we get good environment at workplace
4. we get good welfare facilities
5. we get opportunities for Career development and Promotion
6. we get Awards, Rewards, Appreciation, Recognition for Good Work
7. we have job security
8. we get more salary
Researcher has taken responses on the likert scale of five from Fully disagree to Fully
agree. Then total of the ratingis taken. Researcher has given the ranking to the total of
rating for the factors contributing towards employee motivation. The graph below and the
table shows ranking given by the employees. Here ranking 1 reflects highest rating
among the various factors contributing towards employee motivation. Ranking 8 reflects
the least rating among the various factors contributing towards employee motivation.
226226226
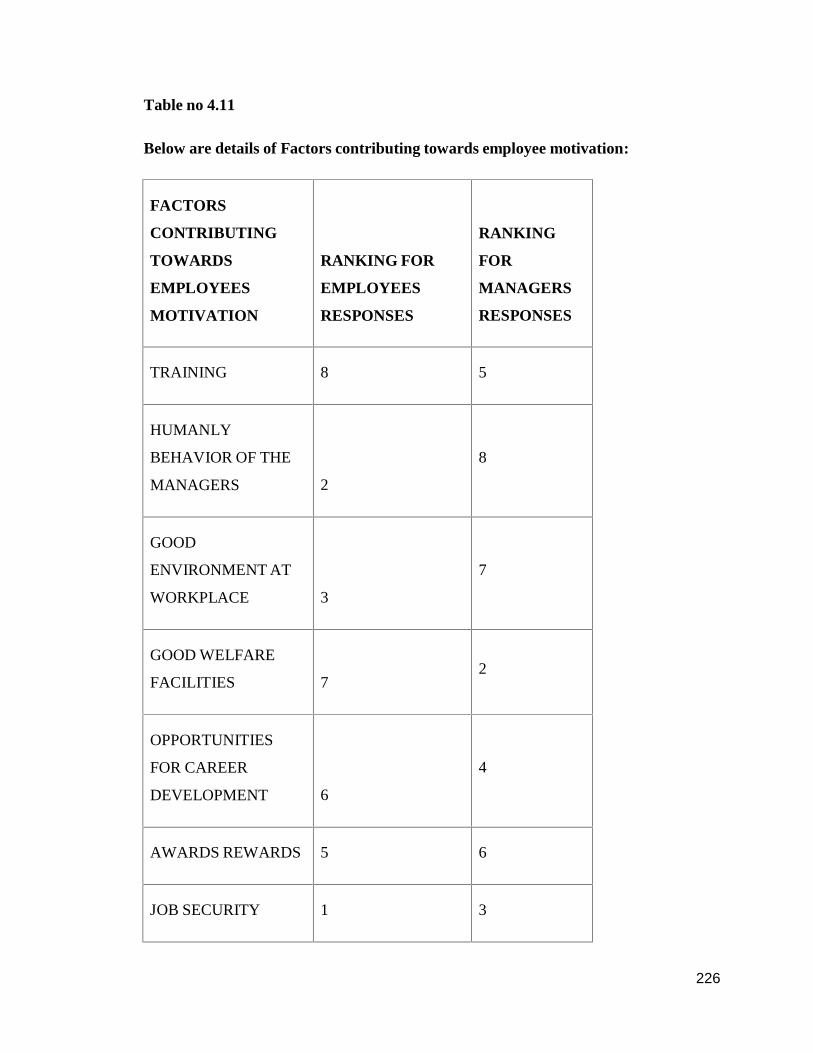
Table no 4.11
Below are details of Factors contributing towards employee motivation:
FACTORS
CONTRIBUTING
TOWARDS
EMPLOYEES
MOTIVATION
RANKING FOR
EMPLOYEES
RESPONSES
RANKING
FOR
MANAGERS
RESPONSES
TRAINING 8 5
HUMANLY
BEHAVIOR OF THE
MANAGERS 2
8
GOOD
ENVIRONMENT AT
WORKPLACE 3
7
GOOD WELFARE
FACILITIES 72
OPPORTUNITIES
FOR CAREER
DEVELOPMENT 6
4
AWARDS REWARDS 5 6
JOB SECURITY 1 3
227227227
8 87 7
6 65 5
4 43 3
2 21 1
MORE SALARY 4 1
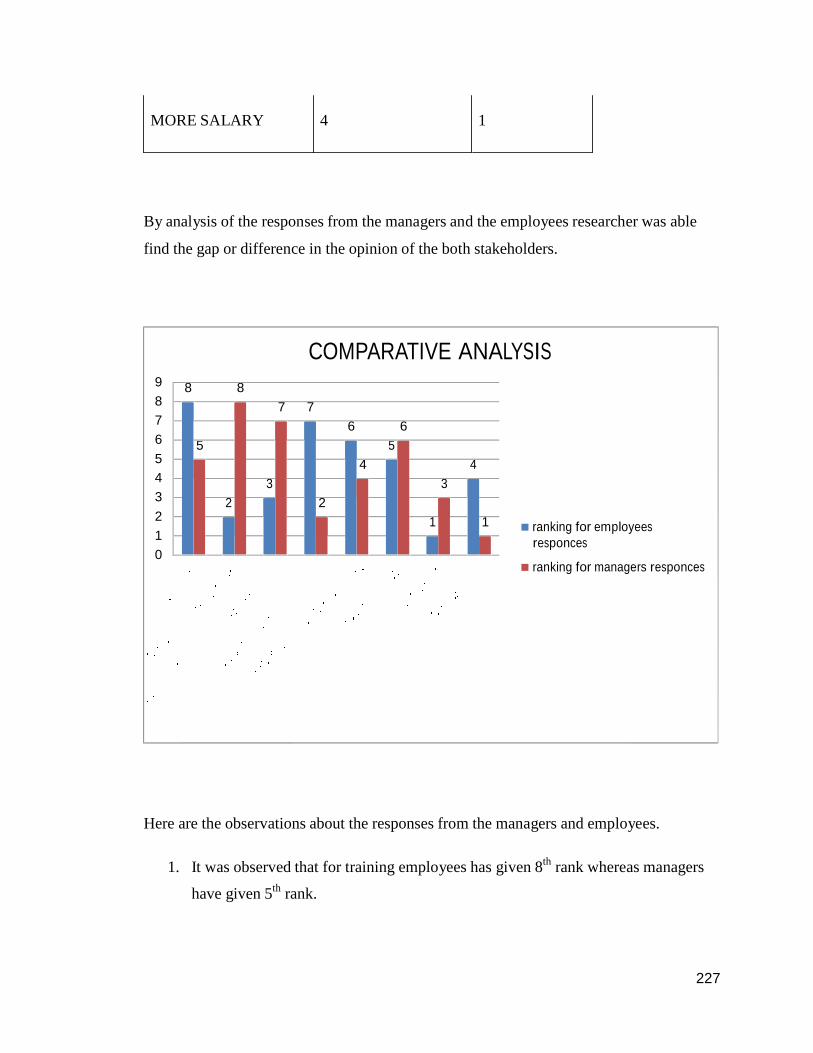
By analysis of the responses from the managers and the employees researcher was able
find the gap or difference in the opinion of the both stakeholders.
COMPARATIVE ANALYSIS98765432
ranking for employees1 responces0
ranking for managers responces
Here are the observations about the responses from the managers and employees.
1. It was observed that for training employees has given 8th rank whereas managers
have given 5th rank.
228228228
2. It was observed that for the humanly behaviour of the managers employees has
given 2nd rank whereas managers has given 8th rank.
3. It was observed that for good environment at workplace employees has given 3rd
rank whereas managers have given 7th rank.
4. It was observed that for good welfare facilitiesemployees have given 7th rank
whereas managers have given 2nd rank.
5. It was observed that foropportunities for career developmentemployees have
given 6th rank whereas managers have given 4th rank.
6. It was observed that the awards and rewardsemployees have given 5th rank
whereas managers have given 6th rank.
7. It was observed that for the job security training employees has given 1strank
whereas managers has given 3rd rank.
8. It was observed that for the salary employees has given 4th rank whereas
managers has given 1st rank.
4.11: Hypothesis Testing:
229229229
H1: “There is significant correlation between factors contributing to employee
motivation and the impact of motivation on employees as perceived by the
managers.”
Researcher wanted to explore the relationship between the factors contributing towards
employee motivation and the impact of motivation on employee’s performance as
perceived by the managers. Researcher has taken responses from the managers regarding
8 factors contributing towards their employee’s motivation on the five point Likert scale,
Fully disagree to Fully agree. Researcher has taken the total of the rating given by the
managers.
Also researcher has collected the responses for the impact of motivation on the
performance of the employees on the five point likert scale, Fully disagree to Fully agree.
Researcher has taken the total of the rating given by the managers.
It was observed that the mean of factors contributing towards motivation of the
employees is 36.25 and the mean of impact of the motivation on the employees is 45.14.
Correlations
Descriptive Statistics

Mean
Std.
Deviation N
Factors contributing employee motivation 36.25 3.521 79
Impact of employee motivation 45.14 4.463 79
Correlations
Factors
contributing
employee
motivation
Impact of
employee
motivation
Factors contributing employee Pearson
motivation Correlation
Sig. (2-tailed)
N
1 0.860**
0.000
79 79
Impact of employee
motivation
Pearson
Correlation0.860** 1
230
231231231
Sig. (2-tailed)
N
0.000
79 79
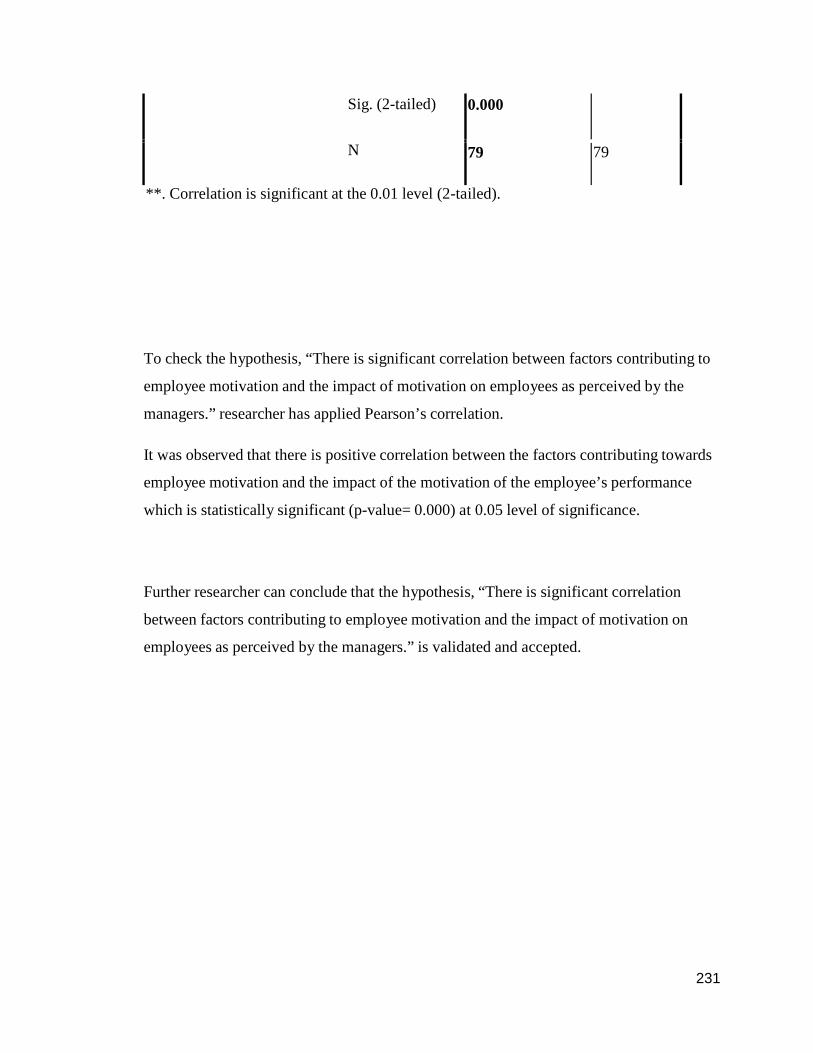
**. Correlation is significant at the 0.01 level (2-tailed).
To check the hypothesis, “There is significant correlation between factors contributing to
employee motivation and the impact of motivation on employees as perceived by the
managers.” researcher has applied Pearson’s correlation.
It was observed that there is positive correlation between the factors contributing towards
employee motivation and the impact of the motivation of the employee’s performance
which is statistically significant (p-value= 0.000) at 0.05 level of significance.
Further researcher can conclude that the hypothesis, “There is significant correlation
between factors contributing to employee motivation and the impact of motivation on
employees as perceived by the managers.” is validated and accepted.

232232232
H 2: “There is difference of opinion of the employees and managers about factors
contributing towards motivation.”
Researcher wanted to explore the level of the agreement and disagreement towards the
factors contributing to the employee motivation. Researcher has taken the responses from
employees and respective managers of the companies through questionnaire. the
responses were taken on the five point likert scale. Further the total of the rating is taken.
It was observed that the mean for the contribution of factors toward employees
motivation as perceived by the employees is 36.31 whereas that perceived by the
managers is 36.25.
T-Test
Group Statistics
Group N Mean Std. Deviation
Total Employees
Managers
369 36.31 4.469
79 36.25 3.521
Independent Samples Test
233233233
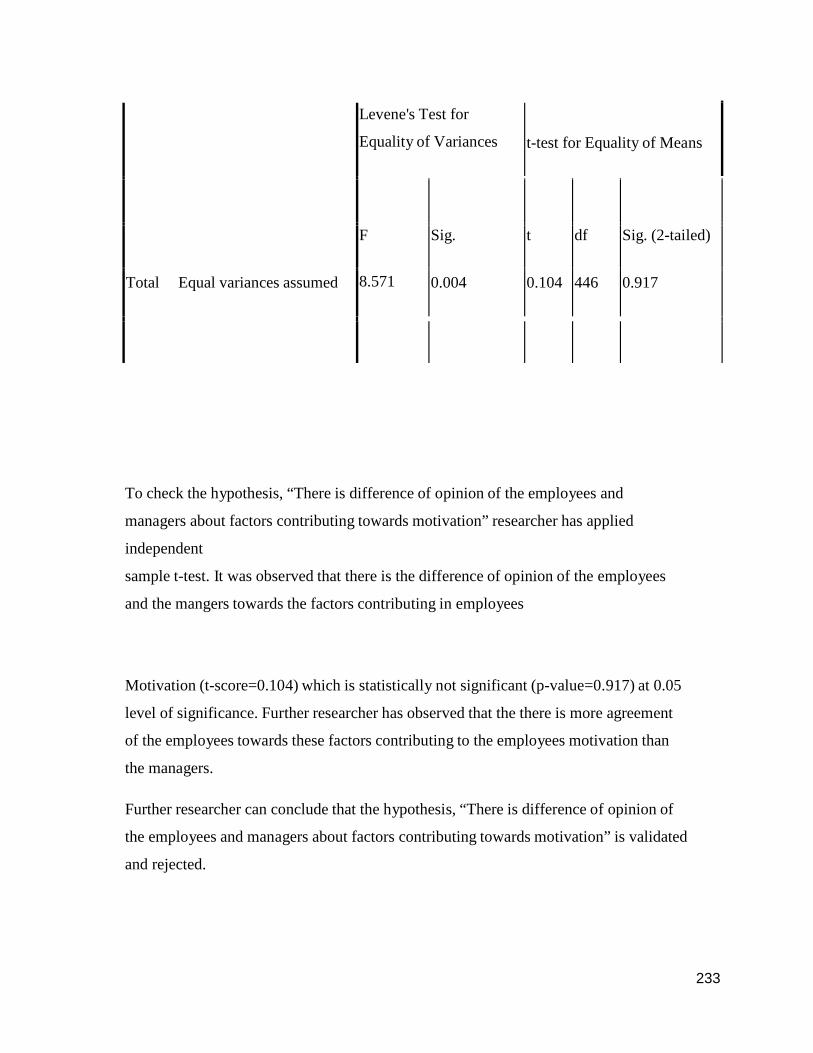
Levene's Test for
Equality of Variances t-test for Equality of Means
F Sig. t df Sig. (2-tailed)
Total Equal variances assumed 8.571 0.004 0.104 446 0.917
To check the hypothesis, “There is difference of opinion of the employees and
managers about factors contributing towards motivation” researcher has applied
independent
sample t-test. It was observed that there is the difference of opinion of the employees
and the mangers towards the factors contributing in employees
Motivation (t-score=0.104) which is statistically not significant (p-value=0.917) at 0.05
level of significance. Further researcher has observed that the there is more agreement
of the employees towards these factors contributing to the employees motivation than
the managers.
Further researcher can conclude that the hypothesis, “There is difference of opinion of
the employees and managers about factors contributing towards motivation” is validated
and rejected.