chapter 9 economic and financial evaluation
TRANSCRIPT

9-1
CHAPTER 9 ECONOMIC AND FINANCIAL EVALUATION
9.1 Economic Evaluation
9.1.1 Specifications for Economic Evaluation
An economic evaluation on the project proposed in the Chapters 5 and 6 is carried out in this chapterfrom the viewpoint of the effect of increased water supply by the project based on the specifications aspresented in Table 9.1.
Table 9.1 Specifications for Economic EvaluationProject Component Project Costs Project Benefit
Two improvement plans:1) Irbid2) Ramtha
1. Construction and procurement2. Incremental operation andmaintenance3. Disi, Western and Eastern waterpurchase
Incremental values generated bythe project
<Concept and Assumptions>1. Evaluation Measure Economic Internal Rate of Return (EIRR)2. Opportunity Cost of Capital 10 % (Referring to the “Water Resources Management Master Plan
of the Hashemite Kingdom of Jordan, JICA, 2001”)3. Evaluation Period 30 years from the operation start year of the project4. Economic Life of Facilities &Equipment
30 years from the construction and installation year
5. Replacement Costs Disregarded due to the above 3 and 46. Economic Conversion Factor 0.9 (Estimated by JICA Study Team based on the external trade of
the country, DOS)Source: JICA Study Team
9.1.2 Project Benefits
The project benefits are defined as follows.
Benefits = Incremental number of customers of the project (X) Affordability-to-pay (JD/customer)
The above number of customers includes both residential and non-residential. And the aboveaffordability-to-pay is estimated on the basis of manners presented in Table 9.2.
Table 9.2 Manners to Estimate Affordability-to-pay for WaterCustomers Items Estimates & Assumptions Sources
Residential 1. Number of persons/household
5.44 persons DOS: population and number ofhousehold of Jordan in 2012
2. Household income Urban: 500 JD/monthRural: 90 % of the urban
DOS: average wage of male in2011 adjusted with the CPI up to2014
3. Affordability-to-payfor water based onhousehold income
3 % of household income- Urban: 15.0 JD/month- Rural: 13.5 JD/month
Assumed by the JICA Study Teambased on the affordability-to-paymethod applying the maximumpercentage
Sources: DOS and JICA Study Team
9.1.3 Project Costs
The project costs comprise three items 1) construction and procurement costs (herein after referred toas “investment costs”), 2) operation and maintenance costs (herein after referred to as “O&M costs”)and 3) water costs to be purchased from the Disi, Western and Eastern development. Incidentally, itshould be carefully noted that the economic cost contain only the incremental costs generated by theproject.
In the economic evaluation, the project cost is classified as an “economic cost”. The economic cost is

9-2
calculated by subtracting taxes from the ordinary project costs (namely, the financial costs) andmultiplying the local portion costs by the economic conversion factor (0.9 for this project as given inTable 9.1). Price escalation due to inflation is not included. The item-by-item economic costs arepresented below.
Investment Costs(1)Table 9.3 summarizes the investment costs of the project.
Table 9.3 Investment Costs (JD million)
Project CostsPhase-1 Phase-2 Phase-3 Phase-4
Total2016-2020 2021-2025 2026-2030 2030-2035
Irbid Economic cost 49.5 14.9 11.5 11.5 87.4(Ref: Financial cost) 61.9 18.9 14.9 14.9 110.6
Ramtha Economic cost 13.9 3.1 2.9 2.9 22.8(Ref: Financial cost) 17.3 3.9 3.7 3.7 28.6
Total Economic cost 63.4 18.0 14.4 14.4 110.2(Ref: Financial cost) 79.2 22.8 18.6 18.6 139.2
Note: The financial cost includes taxes.
Source: JICA Study Team
O&M Costs(2)The economic O&M costs comprise two items as discussed in the Chapter 8: 1) electricity costs and 2)other miscellaneous costs such as repair/maintenance and chemical. The personnel costs of the projectare disregarded in the project because of none of incremental workers as discussed in the Chapter 8.Table 9.4 summarizes the O&M costs of the project.
Table 9.4 O&M Costs(JD million)
Project Costs Phase-1 Phase-2 Phase-3 Phase-4 2036-2047 Total2016-2020 2012-2025 2026-2030 2030-2035
Irbid Economic cost 0.6 2.0 2.3 2.6 5.4 12.9(Ref: Financial cost) 0.7 2.2 2.5 2.9 6.1 14.4
Ramtha Economic cost 0.3 0.5 0.5 0.6 1.3 3.2(Ref: Financial cost) 0.4 0.5 0.6 0.7 1.4 3.6
Total Economic cost 0.9 2.5 2.8 3.2 6.7 16.1(Ref: Financial cost) 1.1 2.7 3.1 3.6 7.5 18.0
Source: JICA Study Team
Water Purchase Costs(3)The water purchase prices of Disi, Western and Eastern development are assumed as presented inTable 9.5.
The price includes only the O&M costs, excluding the investment costs of the developments becauseof the following considerations:
Disi water: the investment costs are regarded as “sunk costs due to mostly utilization of theexisting facilities.
Other water: the investment costs are not counted due to indefiniteness at present; however,these costs should be taken into account in the feasibility study of the project.
Table 9.5 Assumed Water Purchase PriceDevelopments Prices Sources
Disi Water 0.4 JD/m3 WAJ: to apply the same price selling to Amman, namely to the JWCM
Western Water 0.6 JD/m3 WAJ: to take the high-elevation conveyance cost into accountEastern Water 0.2 JD/m3 JICA Study Team based on the YWC electricity costs and other miscellaneous cost
Source: Compiled by JICA Study Team

9-3
The water purchase costs are estimated by applying the above figures and illustrated in Table 9.6.
Table 9.6 Water Purchase Costs(JD million)
Project CostsPhase-1 Phase-2 Phase-3 Phase-4
2036-2047 Total2016-2020 2012-2025 2026-2030 2030-2035Irbid Economic cost 15.3 25.0 32.2 40.0 87.1 199.6
(Ref: Financial cost) 17.0 27.8 35.8 44.4 96.8 221.8Ramtha Economic cost 3.9 5.3 5.8 6.3 13.1 34.3
(Ref: Financial cost) 4.3 5.8 6.4 7.0 14.5 38.0Total Economic cost 19.2 30.3 38.0 46.3 100.2 234.0
(Ref: Financial cost) 21.3 33.6 42.2 51.4 111.3 259.8
Source: JICA Study Team
9.1.4 Results of Economic Evaluation
The economic evaluation is carried out based on the above benefits and costs. It reveals that the EIRRsof the project exceed 10 % of the opportunity cost of capital (see Table 9.1) as described below. As aresult, the project is concluded to be economically feasible.
< Sensitivity analysis >Tables 9.7 and 9.8 show the sensitivity analysis results of the project. As shown in these tables, thebenefits are with higher sensibility than the investment costs. On the other hand, the investment costshave also a big impact on the EIRR. If the costs reduce by 5 %, the EIRRs result in 13.5 % for theIrbid and 10.7 % for the Ramtha. Incidentally, it must be also remarked that the EIRR of the Irbidwould maintain a relevant value of 10.3 % even if the costs increase by 10 %.
Table 9.7 Sensitivity Analysis of Irbid
ItemsBenefits
+10 % +5 % base case -5 % -10 %Capital Investmentcosts
-10 % 20.5 % 17.5 % 14.8 % 12.4 % 10.0 %-5 % 18.5 % 15.9 % 13.5 % 11.2 % 9.1 %
base case 16.8 % 14.5 % 12.3 % 10.2 % 8.2 %+5 % 15.4 % 13.3 % 11.2 % 9.3 % 7.5 %+10 % 14.2 % 12.2 % 10.3 % 8.6 % 6.8 %
Note: Shaded cells represent the EIRRs that exceed the opportunity cost of capital, 10 %.
Source: JICA Study Team
Table 9.8 Sensitivity Analysis of Ramtha
ItemsBenefit
+10 % +5 % base case -5 % -10 %CapitalInvestmentCost
-10 % 14.3 % 12.9 % 11.5 % 10.1 % 8.8 %-5 % 13.4 % 12.0 % 10.7 % 9.4 % 8.2 %
base case 12.5 % 11.2 % 10.0 % 8.8 % 7.6 %+5 % 11.7 % 10.5 % 9.4 % 8.2 % 7.1 %+10 % 11.0 % 9.9 % 8.8 % 7.7 % 6.6 %
Note: Shaded cells present the EIRRs that exceed the opportunity cost of capital, 10 %.Source: JICA Study Team
EIRR of Irbid : 12.3 %
EIRR of Ramtha : 10.0 %
Consolidated EIRR : 11.7 %

9-4
9.2 Financial Evaluation
A financial evaluation of the project proposed in the Chapters 5 and 6 is carried out in this chapterbased on the specifications as presented in Table 9.9.
Table 9.9 Specifications for Financial EvaluationProject Component Costs Revenues
Two plans as presented inSection 9.1
1. Investment2. Incremental operation and maintenance
Incremental revenues generatedby the project
<Concept and Assumptions>1. Evaluation Measure Financial Internal Rate of Return (FIRR)2. Opportunity Cost of Capital 6 %: real interest rate as of September 2014
= 9 % of long-term interest rate (-) 3 % of Consumer Price Index3. Evaluation Period 30 years from the operation start year of the project4. Economic Life of Facilities &Equipment
30 years from the construction/installation year
5. Replacement Costs Disregarded due to the above 3 and 4Source: JICA Study Team
9.2.1 Incremental Revenues
The revenues are estimated as follows.
Revenues = Incremental consumption with project (X) Present water tariff (JD/m3)
The YWC issues the bills and collects the fees from the customers quarterly. The bill is a combinationof 3 categories of tariffs: 1) fixed tariff, 2) variable tariff of water and 3) variable tariff of sewage: so,the total water tariff is unclear because the fixed tariff contains both water and sewerage tariffs. Forthis, the total water tariff is estimated by the JICA Study Team on the basis of the 2013 financialstatement of the YWC as follows:
Combined YWC tariff of 2013 : 0.578 JD/m3
-Water : 0.524 (90 %)
-Sewerage : 0.054 (10 %)
(Incidentally, the YWC will make an accounting of the water and sewerage tariff more clearly from the2014 financial statement.)Thus, a tariff of 0.524 JD/m3 is applied for this financial evaluation (for reference: this tariff is likelyto cover only 50 % to 60 % of the entire water costs including the indirect costs such as administration,according to the examination by the JICA Study Team).
9.2.2 Financial Costs
The financial costs of the project are already presented in the Section 9.1.3. It should be noted that thefinancial cost contain only the incremental costs generated by the project.
9.2.3 Results of Financial Evaluation
The financial evaluation is carried out based on the above revenues and costs. It reveals that theproject is financially unfeasible because the FIRRs are lower than 6 % of the opportunity cost ofcapital (see Table 9.9) as described below.
FIRR of Irbid : 3.0 %
FIRR of Ramtha : -3.1 %
Consolidated FIRR : 1.4 %

9-5
<Sensitivity analysis>It is obvious that the low level of present tariff is a major factor for the low FIRRs. Table 9.10summarizes the results of sensitivity analysis by applying the conditions that raise the FIRR of theproject to the level higher than 6 %. To attain the financial feasibility, such severe measures as thesubstantial increase of the tariff and the drastic reduction of the investment cost are required; however,these measures may be hardly put in effect10. Therefore, the government grants as a part of theinvestment costs are considered as the most desirable measures to make the project viable.
Table 9.10 Summary of Sensitivity AnalysisProject Conditions to lift the FIRR higher than 6 % FIRR
Irbid 1) Tariff increase + 12 % 6.2 %2) Investment cost - 16 % 6.1 %
Ramtha 1) Tariff increase by + 58 % 6.0 %2) Investment cost -70 % 6.1 %3) Investment cost+ Tariff increase
-50 %+ 17 %
6.2 %
Source: JICA Study Team
If the subsidies of 1 JD/m3 to the water charges are reflected in the financial evaluation, as suggestedby WAJ, the FIRR in case of Irbid, Ramtha and the consolidation will be 180%, 26% and 102%,respectively.
9.2.4 Financing Consideration for Investment Costs
Government Budget1)Table 9.11 presents the budget of the Jordanian Government from 2013 to 2016. The budget of 2014totals up to 8,100 million JD; that are 6,800 million JD for current expenditures and 1,300 billion JDfor capital expenditures (herein after referred to as Capex). Meanwhile, the Capex budget allocated tothe MWI is 65 million JD, 5 % of the Government Capex budget. Only a small amount, 2 or 3 millionJD, of the Capex of the MWI will be allocated to subsidize to the WAJ starting 2014.
Table 9.11 Expenditure Budget of Government(million JD)
Organizations Expenditures 2013 2014 2015 2016Re-estimate Budget Indicative Indicative
Jordanian Government (JG) Current 6,155 6,828 7,168 7,515Capital 1,021 1,268 1,333 1,401Total 7,176 8,096 8,501 8,916
- Allocated/to be allocatedto MWI
Current 2 2 2 2Capital 63 65 55 33Total 65 67 57 35
Capital Budget of MWI to JG (%) 6 % 5 % 4 % 2 %Note: Figures of the Jordanian Government are inclusive of the MWI.Source: General Budget Department, Ministry of Economy and Finance
Budget of WAJ2)
Table 9.12 shows the total expenditure budget of the WAJ. The Capex of the WAJ amounts to 260million JD in 2014, 75 % of total expenditure budget. The YWC budget is not presented becausealmost all Capex for the development project are financed by the Government including that of theWAJ.
10 According to the YWC top management, the water and sewerage tariff change is the political issues in the country. The
cabinet committee under the prime ministry will decide the tariff un-periodically. The water companies inclusive the WAJ can
hardly intervene in it. The sewerage tariff of the YWC increases only by 15 %, meter reading basis from October 2014 and
billing basis from January 2015: however, no water tariff change is instructed in this year.

9-6
Table 9.12 Total Expenditure Budget of WAJ(million JD)
Expenditures 2013 2014 2015 2016Re-estimate Budget Indicative Indicative
Current 85 86 79 79Capital 168 260 270 270
Total 253 346 349 349Source: General Budget Department, Ministry of Economy and Finance
Capex Budget of MWI and WAJ for Water and Sewerage Sector3)Table 9.13 illustrates the sector-wise Capex budget by organization (the MWI and the WAJ) andreveals that more than 60 % of Capex goes to the water sector. The annual average Capex for the watersector over the 4 year period from 2013 up to 2016 is estimated at 177 million JD.
Table 9.13 Capital Budget by Sector Totaling MWI and WAJ(million JD)
Sectors Organizations 2013 2014 2015 2016 Averageof 4 yearsRe-estimate Budget Indicative Indicative
Water MWI 48 48 35 9WAJ 84 156 165 162
Total 132 204 200 171 176.7Sewerage MWI 15 17 20 24
WAJ 72 87 88 87Total 87 104 108 111 102.1
Total MWI 63 65 55 33WAJ 155 243 252 249
Total 218 308 307 282 278.8% by Sector Water 61 % 66 % 65 % 61 % 63 %
Sewerage 39 % 34 % 35 % 39 % 37 %Note: The difference between this table and Table 9.11 and 9.12 is the indirect Capex such as administration.
Source: General Budget Department, Ministry of Economy and Finance
Financial Appropriation for Investment Costs4)Table 9.14 is a summary of the phase-wise annual average investment costs of the project calculatedbased on Table 9.3. The phase-1 costs are the largest, requiring 15.8 million JD annually in 5 years.The other phases’ costs are small compared with the phase-1 costs.
Table 9.14 Annual Average Investment Costs by Phase(million JD)
Project
Phase-1 Phase-2 Phase-3 Phase-4 Total2016-2020 2021-2025 2026-2030 2031-2035 2016-2035
EntirePhase
YearAverage
EntirePhase
YearAverage
EntirePhase
YearAverage
EntirePhase
YearAverage
EntirePhase
YearAverage
Irbid 61.9 12.3 19.0 3.8 14.9 3.0 14.9 3.0 110.7 5.5Ramtha 17.3 3.5 3.9 0.8 3.7 0.7 3.7 0.7 28.7 1.4
Total 79.2 15.8 22.9 4.6 18.6 3.7 18.6 3.7 139.4 6.9
Source: JICA Study Team
The Capex budget is analyzed from the view point of the affordability to the investment costs; up to10 % is empirically assumed to be an affordable level for one project. Table 9.15 shows thecomparison of Capex budget of the MWI and the WAJ to the project investment costs. The phase-1requires the largest costs of 15.8 JD million annually. The amount indicates less than 10 % of theCapex budget combined with the MWI and the WAJ (177 million JD). And the other phases’ costs areonly around 2 %. Accordingly, the investment costs of the project could be appropriated entirely by theMWI and the WAJ, assuming that the MWI and the WAJ could secure continuously the present levelof Capex budget.

9-7
Table 9.15 Comparison of Capex Budget to Investment Costs
ItemsPhase-1 Phase-2 Phase-3 Phase-4
2016-2020 2021-2025 2016-2030 2031-20351. Annual Capex Budget: totaling MWI and WAJ (see Table 9.13) 176.7 176.7 176.7 176.72. Annual Average Project Investment Costs (see Table 9.14) 15.8 4.6 3.7 3.7
% of the project investment costs (=2/1) 8.7 % 2.6 % 2.1 % 2.1 %
Source: JICA Study Team
Table 9.16 shows the sources of funds for the water sector Capex. It reveals that more than half of theentire Jordanian water project costs are derived from the WAJ domestic funding inclusive the ownrevenues and debts. And 20 % from the MWI budget, 16 % from the foreign soft loans of theinternational donors and 12 % from the foreign grants follow it. Apparently, the Government guaranteeenables and secures the WAJ to raise funds from the foreign and domestic loans including bond issues.Accordingly, the investment costs of the project are expected to be covered in the same way.
Table 9.16 Sources of Funds for Water Sector Capital Expenditures(million JD)
Sources of Funds2013 2014 2015 2016 Average
Re-estimate Budget Indicative Indicative of 4 years %1.MWI Budget 48 48 35 9 35 20 %2. WAJ 78 154 162 161 139 80 %1) Domestic Funds 49 106 103 103 90 52 %2) Foreign Loans 11 34 36 31 28 16 %3) Foreign Grants 18 14 23 27 21 12 %
Total 126 202 197 170 174 100 %
Note: The difference from Table 9.13 is the government subsidies to the WAJ which is disregarded because it is already
contained in the Government budget.
Source: General Budget Department, Ministry of Economy and Finance


10-1
CHAPTER 10 ENVIRONMENTAL AND SOCIAL CONSIDERATIONS
10.1 Outline of the Project Components
Outline of the concept of the Project(1)The goal of the MP Project is to formulate a comprehensive plan for sustainable water supplycorresponding to the population growth including the influx of Syrian refugees in the NorthernGovernorates. To achieve this goal, the MP has been prepared considering key factors such asequitable distribution, energy efficiency, leakage reduction with appropriate supply pressure, andsaving of operation and maintenance costs particularly the electricity cost. In addition, the MP has alsoconsidered to correspond to the “National Resilience Plan 2014-2016” as an existing upper level plan.Furthermore, coordination with other international donors such as KfW, UNICEF, USAID, EIB, etc.,has also been made while preparing the MP.
Areas most affected by the increase in Syrian refugees, that is, Irbid, Ramtha, and Mafraq, are selectedas the target areas of the MP, for which water demand–supply imbalance need to be alleviated. Irbidand Ramtha are finally selected as target areas of the MP for water supply because the improvement ofthe water supply network system for Mafraq is being implemented by KfW.
The target year of the MP is set as 2035.
Outline of the components of the Master Plan(2)Table 10.1 shows the components of the MP subject to Environmental and Social Considerations.
Table 10.1 Components of the MP Subject to Environmental and Social ConsiderationsComponent Remarks
Restructuring of DistributionSystem (Strengthening andDMA/SCADA Creation)
Water supply through gravity flow system in the Zebdat gravity zone,Construction of transmission pipeline from Zebdat to Hofa andimprovement of the water supply system in Hofa area by distributionof water from Zebdat and gravity supply from Hofa
Rehabilitation of old water supplynetwork
Replacement of GI and Steel Pipes
10.2 Current Status of Environment and Society
Land use(1)Project area is shown in the satellite photo from Google Earth (Figure 10.1). Land use of eachsub-project is described below.
Irbid1)The central part of Irbid city is occupied by government organizations facilities, education institutionsand medical institutions and mainly commercial zones, and the peripheral parts are occupied byresidential areas. Suburban areas of Bait Ras, Hakama, Bushra, Hawwara and Sarieh are mainlyresidential with small scale commercial zones in the central part. The pipelines and water supplynetworks planned for improvement and rehabilitation are to be installed mainly along the existingregional roads in the target areas, and the pumping facility is to be installed in the existing pumpingstation area.
Ramtha2)Strengthening and rehabilitation of the main pipeline will be carried out from the branching point ofthe eastern transmission line to Ramtha, Torrah, Shajara, Emrawa and Dnaibah in the Ramtha region.The purpose is to distribute water by effectively using the water pressure from the Za’atary pumpingstation. Ramtha is a small city and there are small towns to its north. The areas between the city andtowns are farmland, rangeland and wasteland. Water supply mains and distribution pipelines are laid

10-2
along the existing trunk road and regional roads.
Natural environment(2)Reserve Area1)
Nature reserve areas in the northern governorates are shown in Table 10.2 and Figure 10.2. Naturereserves are located very far from the target areas of the MP - at a distance of more than 10 km. Hence,the implementation of the components of the MP is not expected to have any impact on the naturereserve areas.
Figure 10.1 Location of the Project Planned in the MP (Existing Land Use)
Table 10.2 Natural Conservation Area in Northern GovernoratesName of Reserve Ajloun Forest Reserve Dibeen Forest Reserve Yarmouk Nature ReserveYear of theestablishment
1988 2004 2010
Managementorganization
RSCN RSCN RSCN
Purpose ofestablishment
Forest conservation,evergreen oak forest
Forest conservation,pine-oak forest
Natural Conservation
Relevant laws National parks and naturalreserves regulation No. 29,
National parks and naturalreserves regulation No. 29,
Proposed by RSCN,unspecified

10-3
Name of Reserve Ajloun Forest Reserve Dibeen Forest Reserve Yarmouk Nature Reserve2005 2005
Relevant Ministry Ministry of Environment(MOE)
Ministry of Environment(MOE)
―
Area 13 km2 8.5 km2 20 km2
Distance from MPArea
12 km 26km 20 km
Note) RSCN: Royal Society for the Conservation of Nature, Source: JICA Study Team
Figure 10.2 Site Map of Project and Nature Reserve Areas
Conservation of the River Basin2)Watersheds exist on the eastern and western sides of the Irbid center. Wadi Al Arab Basin is located onthe western side. Wadi Shallalah Basin with Yarmouk River lies on the eastern side. Wadi Al Arabbasin with well-field area is not designated specifically as a conservation area.
Historical and cultural heritage areas(3)Table 10.3 and Figure 10.3 show the sites around the Project area where remains and relics have beenfound. According to the Antiquities Law No. 23, 2004 (Antiquities Law No. 12, revised in 1987), theDepartment of Antiquities in the Ministry of Tourism and Antiquities is responsible for excavating andinvestigating remains and relics. Remains and relics around the MP proposed areas are excavated tostudy the Old Stone Age. The sites where remains and relics have been found are located along the oldhighway from Palestine to Damascus and Baghdad.
These sites related to the MP proposed areas are mainly in Irbid, and the surroundings of Hawwara,Bait Ras, Sal, Al Yasielah and Al Turra. The site of remains in Hawwara is Ayyubid/Mamluk as shownin Table 10.3. Roman graves and ceramics were found and investigated during the installation ofpipelines in Hawwara in the past. (Ismael Melhem et al, Three Burials from Roman era at Hawwara/Irbid, ANNUAL OF THE DEPARTMENT OF ANTIQUITIES OF JORDAN, Volume 55, 2011)
Target area of the MPAjloun Forest Reserve
Dibeen Forest Reserve
Yarmouk Nature Reserve

10-4
Table 10.3 Sites around Project Area Where Remains Were Found in PastEra Irbid Hawwara Bait Ras Sal Al Yasielah Al Turra
Umayyad ○ ○ ○ ○ ○ ○ Abbasid - ○ ○ ○ ○ ○ Ayyubid/Mamluk ○ ○ ○ ○ ○ ○ Ottoman ○ - ○ ○ ○ ○ Hellenistic - - - - - -Roman ○ - ○ ○ - ○ Late Byzantine ○ - ○ - - - Middle Byzantine ○ - - ○ - - Early Byzantine ○ - - ○ - - Iron Age ○ - - ○ - ○ Late Bronze - - - - - -Middle Bronze - - - - - -
Early Bronze - - - - - -Chalcolithic - - - - - -Neolithic - - - - - -Epi-Paleolithic - - - - - -Paleolithic - - - - - -○ Sites where remains and relics have been found in the past (Source: Dar As-Saraya Museum Guide, 2007, Department of
Antiquities), Source: JICA Study Team
*Exact locations where remains and relics have been found are not clearSource: JICA Study Team
Figure 10.3 Antique Sites in and around the Project Areas of MP

10-5
10.3 Laws and Organization Related to Environmental and Social Considerations
Laws and regulations related to Environmental and Social Considerations(1)Environmental Impact Assessment (EIA) is mainly enforced by the following laws and regulations inJordan:
Environmental Protection Law No. 52 of 2006 Environmental Impact Assessment Regulations No. 37 of 2005
Projects subject to EIA are designated in Annex 2 (for comprehensive EIA) and Annex 3 (for InitialEnvironmental Examination (IEE)) of the EIA Regulations No. 37 of 2005 as shown in Table 10.4.According to the EIA Regulations, projects proposed in the MP are subject to IEE as described in theitem 6 of Annex 3, “Infrastructure projects including housing projects.” The MP was examined forEnvironmental and Social Considerations at the IEE level in accordance with the EIA Regulations andthe JICA’s Guidelines for Environmental and Social Considerations.

10-6
Table 10.4 Projects Subject to EIA and IEEProjects subject to EIA Projects subject to IEE
Items
1- Raw petroleum refining2- Electricity generating plants3- Establishments designed as permanent stores or aslandfills for the irradiant nuclear wastes4- Iron and steel factories5- Establishments for extraction, treatment, conversionof asbestos and substances in which asbestos forms partof its structure6- Integrated chemical industries such as:- Petrochemicals-Fertilizers, pesticides and peroxide industries-Chemical products, petrochemicals and petroleumstorage facilities7- Road, airport and railway construction projects8- Hazardous waste treatment plants and disposal ofthese wastes.9- Establishing industrial cities10- Extraction industries:- The excavating processes for water and the geo-thermaldigging except when digging for investigating the soil- Mining processes and relevant industries- Natural fortunes extraction11- Generating energy industries- Industrial establishments which produce electricity,vapor, hot water- Industrial establishments which convey gas, vapor, hotwater and electrical energy- Natural gas surface storage- Flammable gases storage both surface and underground- Fossil fuels surface storage12- Tanning (leather) factories13- Sugar factories14- Yeast factories15- Construction of ports16- Manufacturing ships and boats for industrial andrecreational purposes17- Reclamation of land for industrial and recreationaluses18- Glass factories19- Establishing slaughterhouses (abattoirs)
1- Agricultural Projects:- Poultry farms if the capacity exceeds30,000 birds- Cow farms if the capacity exceed 50,000cows- Sheep Farms if the capacity exceeds 1,000sheep2- Mineral treatment projects:Iron and steel works including galvanizingand varnishing factoriesEstablishments producing non-ferrousminerals using processes such asproduction, purification (washing),liquefying, demonetizing (pulling) andgalvanizing processes- Compressing bullions- Treatment of mineral surfaces andcoverings (coatings)- Boilers, cisterns, tanks, industries dealingwith minerals plates- Establishments for felting and scorching(roasting) raw mineral- Complexes industry (collecting).3- Food Industries:- Oils, animal and vegetable fats.- Bottling and packaging animal andvegetable products- Milk products industry4- Fabric, leather, wood, paper and tissueindustries5- Rubber industry6- Infrastructure projects including housingprojects7- Other projects:- Municipal landfills- Landfill for disposal of wastes.- Sports activities centers.- Junk storage establishments.8- Any additions, amendments to theprojects mentioned in this annex.
Legalbasis
Annex 2, EIA Regulations No. 37 of 2005 Annex 3, EIA Regulations No. 37 of 2005
Source: MOE
EIA is enforced according to the following procedure in Jordan:i) Project implementing organization submits the project overview document to Directorate of
Licensing & Guidance in MOE for examination.ii) MOE calls a meeting of the Central License Committee. If necessary, the committee will
confirm the current status of the construction site. Based on the review by the committee, adecision will be taken to implement the Comprehensive EIA (Holding of Public Hearings), orIEE (No Holding of Public Hearings), or no EIA. The result will be notified by the MOE tothe Project implementation organization within 45 days after submitting the document.
iii) Based on the decision of the committee, the Project implementation organization mayimplement EIA if needed, and submit the results to MOE. A committee meeting will be heldand the authorization or modified instructions will be given as applicable.

10-7
iv) The construction or the project will be permitted only after approval of the EIA (for the projectthat requires EIA), is received
v) MOE monitors and checks the parameters included in EIA during the construction period
The flow of EIA procedure is shown in Figure 10.4.
The Directorate of Licensing & Guidance in MOE and WAJ (Water Authority of Jordan) in charge ofenvironment explained that there was no standard format for Project documents to be submitted for theexamination, and requested submission of the project outline, plans and drawings for confirmingproject site, specifications and catalog of main equipment to be installed, and documents forenvironmental evaluation.
Figure 10.4 Flow of EIA Procedures
Relevant organization(2)MOE1)
Figure 10.5 shows the organization chart of MOE. The Directorate of Licensing & Guidance underMOE is responsible for supervision and EIA approval.
WAJ2)The PMU (Performance Management Unit) is responsible for EIA management in WAJ. The PMU hasa technical monitoring section, inspection department, and environmental and social experts for thispurpose. Figure 10.6 shows the organization chart of WAJ PMU.

10-8
Source: MOE
Figure 10.5 Organization of MOE and EIAApproval Organization
Source: WAJ
Figure 10.6 Organization of WAJ PMU
10.4 Examination of Development Alternatives
Examination of development alternatives at the concept level(1)Two development alternatives were examined during the examination of the MP at concept level:
Option 1:development of new water source ; and1)Option 2: rehabilitation of existing facilities and network including the required new construction.2)
Each alternative has issues such as the need for examining water allocation at the inter-governoratelevel in the option 1, and the limitations of the volume of source water in the option 2. As shown in
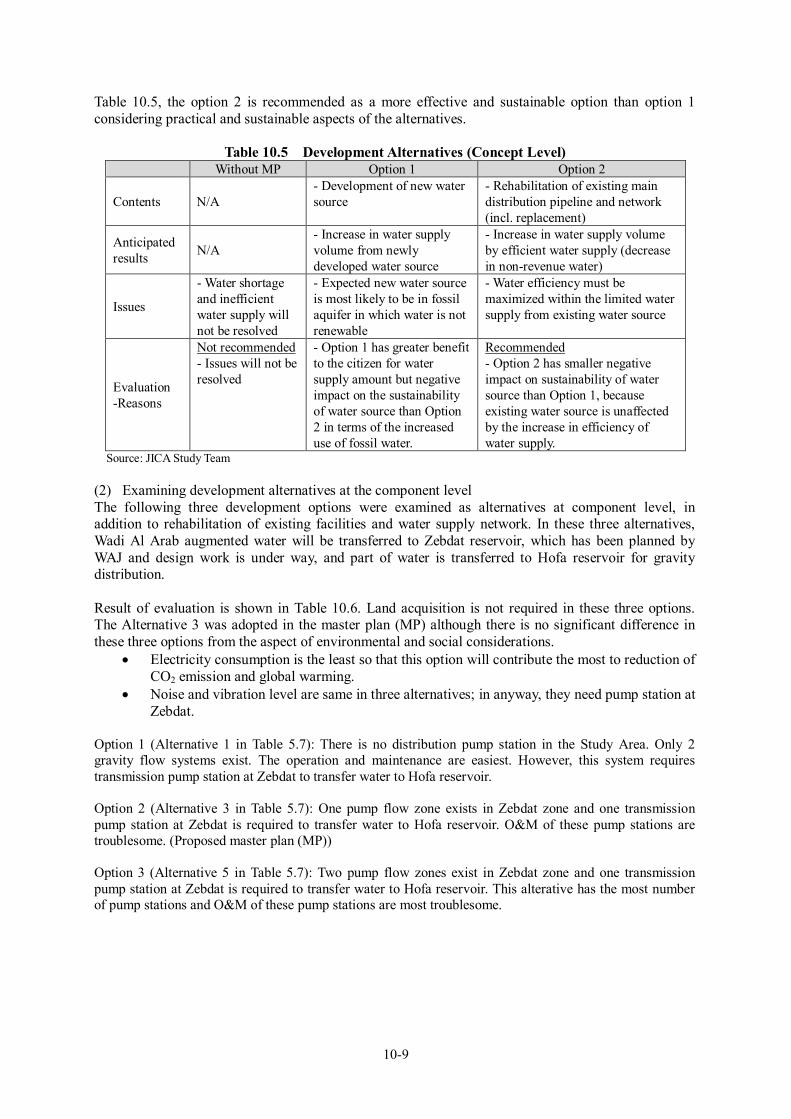
10-9
Table 10.5, the option 2 is recommended as a more effective and sustainable option than option 1considering practical and sustainable aspects of the alternatives.
Table 10.5 Development Alternatives (Concept Level)Without MP Option 1 Option 2
Contents N/A- Development of new watersource
- Rehabilitation of existing maindistribution pipeline and network(incl. replacement)
Anticipatedresults
N/A- Increase in water supplyvolume from newlydeveloped water source
- Increase in water supply volumeby efficient water supply (decreasein non-revenue water)
Issues
- Water shortageand inefficientwater supply willnot be resolved
- Expected new water sourceis most likely to be in fossilaquifer in which water is notrenewable
- Water efficiency must bemaximized within the limited watersupply from existing water source
Evaluation-Reasons
Not recommended- Issues will not beresolved
- Option 1 has greater benefitto the citizen for watersupply amount but negativeimpact on the sustainabilityof water source than Option2 in terms of the increaseduse of fossil water.
Recommended- Option 2 has smaller negativeimpact on sustainability of watersource than Option 1, becauseexisting water source is unaffectedby the increase in efficiency ofwater supply.
Source: JICA Study Team
Examining development alternatives at the component level(2)The following three development options were examined as alternatives at component level, inaddition to rehabilitation of existing facilities and water supply network. In these three alternatives,Wadi Al Arab augmented water will be transferred to Zebdat reservoir, which has been planned byWAJ and design work is under way, and part of water is transferred to Hofa reservoir for gravitydistribution.
Result of evaluation is shown in Table 10.6. Land acquisition is not required in these three options.The Alternative 3 was adopted in the master plan (MP) although there is no significant difference inthese three options from the aspect of environmental and social considerations.
Electricity consumption is the least so that this option will contribute the most to reduction ofCO2 emission and global warming.
Noise and vibration level are same in three alternatives; in anyway, they need pump station atZebdat.
Option 1 (Alternative 1 in Table 5.7): There is no distribution pump station in the Study Area. Only 2gravity flow systems exist. The operation and maintenance are easiest. However, this system requirestransmission pump station at Zebdat to transfer water to Hofa reservoir.
Option 2 (Alternative 3 in Table 5.7): One pump flow zone exists in Zebdat zone and one transmissionpump station at Zebdat is required to transfer water to Hofa reservoir. O&M of these pump stations aretroublesome. (Proposed master plan (MP))
Option 3 (Alternative 5 in Table 5.7): Two pump flow zones exist in Zebdat zone and one transmissionpump station at Zebdat is required to transfer water to Hofa reservoir. This alterative has the most numberof pump stations and O&M of these pump stations are most troublesome.

10-10
Table 10.6 Evaluation of Development Alternatives (Component Level)Development Alternatives
Without MP Option 1Option 2 (Proposed
MP)Option 3
Contents N/A
- Rehabilitation (replacement) and strengthening of water distributionnetworks
- Installation of newhigh capacitytransmission pumpand transmissionpipeline from ZebdatPS to Hofa reservoir
- Existing distributionpump station atZebdat will beabolished.
- Installation of newmedium capacitytransmission pumpand transmissionpipeline fromZebdat to Hofareservoir
- One third ofexisting pumpstation may beutilized throughupgrading pumps.
- Installation of newsmall capacitytransmission pump andtransmission pipelinefrom Zebdat PS toHofa Reservoir
- Two third of existingpump station will beutilized throughupgrading pumps.
-
Anticipatedimpact
<-> Increasedwater leakage<-> Unequalsupply of water tothe citizen andunutilizedaugmented waterfor supply
<+>Improvement of water supply condition<-> Inconvenience during construction
<-> Increase ofelectricityconsumption<+> Reduction inleakage by gravityflow system from all 3pump zones and byrehabilitation
<-> Increase ofelectricityconsumption butminimum among 3options<+> Reduction inleakage by gravityflow systemconverted from 2pump zones and byrehabilitation
<-> Increase in theimpact of noise andvibration by pumpoperation to neighboringresidents of Zebdat PS,and increase ofelectricity consumption<+> Reduction in waterleakage by rehabilitation
Source: JICA Study Team
10.5 Scoping and Terms of Reference of Environmental and Social Considerations
Table 10.7 shows the scoping of environmental and social indicators for the MP and the reasons forevaluation.

10-11
Table 10.7 Scoping (Master Plan for Water Supply)
Category No. Indicator
Evaluation
Reason for evaluationBefore andduring
constructionOperation
Environmentalconsideration-pollutioncontrol
1 Air quality B- D
Construction Stage: Temporarydeterioration in air quality isexpected by construction activity.
Operation Stage: Negative impactis not expected.
2 Water quality C- B+
Construction Stage: A large amountof water drainage may causegroundwater contamination.
Operation Stage:Quality of supply water is expectedto improve due to supply throughnew networks and decrease incontamination due to leakage.
3 Wastes B- D
Construction Stage: Small amountof wastes such as packing materialsfor construction, etc.
Operation Stage: Negative impactis not expected.
4 Soil pollution B- D
Construction Stage: Possibility ofsoil pollution by oil leaks fromconstruction machinery andvehicles.
Operation Stage: Negative impactis not expected.
5 Noise andvibration B- B-
Construction Stage: Noise isexpected from constructionmachinery during excavation work.
Operation Stage: Noise andvibration due to pump operation isexpected when no mitigationmeasures is applied.
6 Land subsidence D D Land subsidence is not expected.7 Offensive odor D D Offensive odor is not expected.
8 Substratum D D Work that affects the substratum is notincluded.
Environmentalconsideration-naturalenvironment
9 Reserve area D D Reserve areas do not exist near thetarget site of the MP.
10 Ecosystem D D
Target areas of the MP are urban areasand suburbs where people live, andareas along existing roads. These arenot inhabitable areas for protectedanimals and plants. No negativeinfluence on ecosystem is expected.
11 Hydrology D D Alteration to hydrology is notexpected in the MP.
12 Topography,geological feature D D Alteration to topography or geological
feature is not expected.
Socialconsideration
13 Resettlement D DResettlement due to theimplementation of the MP is notexpected.
14 Poor classes D B+
Construction Stage: No negativeimpact on the poor class isexpected.
Operation Stage: Residentsincluding the poor can enjoyimprovements in water supplyconditions
15Ethnic minoritiesand indigenouspeoples
D DEthnic Minorities and Indigenouspeoples do not inhabit the projectarea.
16 Refugees D B+
Construction Stage: No negativeimpact is expected.
Operation Stage: Residentsincluding refugees can enjoy theimprovements in water supplyconditions.
17 Local economy B- D
Construction Stage: Constructionmay temporarily affectoffices/shops near construction/rehabilitation sites

10-12
Category No. Indicator
Evaluation
Reason for evaluationBefore andduring
constructionOperation
Operation Stage: No negativeimpact is expected.
18 Land use and localresource use D D No negative impact on land use and
local resource use is expected.
19 Water use B- B+
Construction Stage: Water supply isinterrupted when connecting to anew network.
Operation Stage: Residents canenjoy improvements in watersupply conditions.
20Existing socialinfrastructure andsocial service
B- B+
Construction Stage: Trafficregulation, some interruptions mayoccur, and the approach tocommercial facilities may belimited during construction.
Operation Stage: Positive impactsof the improvement to water supplyon livelihood are expected.
21Social capital andsocialorganizations
D DNo negative impact on social capitaland social organizations is expected.
22 Imbalance ofprofit and damage D D No negative impact on the balance of
profit and damage is expected.
23 Local conflict D D No conflict in local community due tothe MP is expected.
24 Cultural heritage C- D
Construction Stage: Remains andrelics can be found duringexcavation.
Operation Stage: Negative impacton cultural heritage is not expected.
25 Landscape D D No negative impact on landscape isexpected.
26 Gender D DNo negative impact on gender isexpected.
27 Rights of the child D DNo negative impact on the rights ofthe child is expected.
28 Infectious diseasessuch as HIV/AIDS C- D
Construction Stage: There is apossibility of spread of infectiousdiseases due to the inflow oflaborers if there is no appropriateguidance for health and hygiene.
Operation Stage: Negative impactis not expected.
29 WorkEnvironment B- D
Construction Stage: Workingenvironment for laborers isexpected to deteriorate temporarilydue to aggravation of air quality,noise, and vibration.
Operation Stage: Negative impactis not expected.
Others 30 accident B- D
Construction Stage: Considerationsfor accidents such as trafficaccidents are necessary.
Operation Stage: Negative impactis not expected
Note) Evaluation A+/-: Significant positive / negative impact is expected.
Evaluation B+/-: Positive / negative impact is expected to some extent.
Evaluation C+/-: Positive / Negative impact is not clear. (Further examination is necessary, and level of impact becomes
clear with the progress of the examination.)
Evaluation D: No impact is expected
Source: JICA Study Team
The TOR of examination of Environmental and Social Considerations based on Scoping mentionedabove is shown in Table 10.8.

10-13
Table 10.8 TOR of Examination of Environmental and Social ConsiderationsEnvironmental
ItemItem of Examination Means of Examination
Air Quality
1) Environmental standard (Jordanstandard)2) Impact during construction
1) Existing report2) Content of construction, method, period,and site3) Confirmation of type of constructionmachinery, number of machines, working site,working period
Water Quality
1) Environmental standard (Jordanstandard)2) Conditions of water sources(Production wells)3) Impact during construction
1) Existing report2) Confirmation of water use and dischargecondition during construction period
Soil pollution1) Preventive measures against oil leaksduring construction
1) Confirmation of type of constructionmachinery and vehicles, working area andworking period
Noise andvibration
1) Environmental standard (Jordanstandard)2) Impact during construction & operation
1) Existing report2) Site investigation for confirmation
Offensive odor1) Environmental standard (Jordanstandard)2) Impact during construction & operation
1) Existing report2) Site investigation for confirmation
Local economy
1) Commercial activity at the project site2) Impact during construction
1) Site investigation for confirmation2) Procedure for traffic control and avoidanceof traffic jams during approach to commercialfacilities
Existing socialinfrastructure andsocial service
1) Change in the water supply conditionand water quality due to construction
1) Procedure for shortening duration ofinterruption in water supply2) Site investigation for confirmation
Cultural heritage
1) Existence of ruins and relics at theproject site2) Correspondence method before andduring construction
1) Existing report2) Inquiry to the related organization forconfirmation of procedure during construction
Infectiousdiseases such asHIV/AIDS
1) Guidance on health and hygiene forlabor
1) Examination of similar cases2) Site investigation for confirmation
WorkEnvironment
1) Labor safety measures 1) Examination of similar cases2) Confirmation of approach in similarexamples
Accident1) Traffic safety measures during theconstruction stage
1) Examination of similar cases2) Site investigation for confirmation
Source: JICA Study Team
10.6 Results of the Survey on Environmental and Social Considerations
Results of the examination of Environmental and Social Considerations based on scoping are shown inTable 10.9.

10-14
Table 10.9 Results of Examination of Environmental and Social ConsiderationsEnvironmental Item Results of examination
Air Quality
According to Environmental Standard of Air Quality in Jordan, the maximum emissionlevels are SO2: 0.135 ppm (1 hour), 0.130 ppm (24 hours), 0.03 ppm (1 year), CO: 26ppm (1 hour), 9 ppm (8 hours), NO2: 0.21 ppm (1 hour), 0.08 ppm (24 hours), 0.05 ppm(1 year); Total suspended particulate TSP: 75 mg/m3 (24 hours), 260 μg/m3 (1 year).(The Jordan Standard No. 1140 for ambient air quality, 1996)Air pollution is caused by exhaust gas from construction machinery and transportationvehicles; air dust is caused by machines digging ditches along road for laying pipeline ordistribution pipe networks.Mitigation measures should be examined before construction monitoring andcorrespondence based on monitoring results will be required.
Water Quality
Drinking water quality standard of Jordan is given in the Standard for Drinking WaterNo. 286, 2001 (Revised 2008). The quality of the water source is analyzed regularly byYWC and WAJ, and water quality management is carried out.Well fields near the target area of the MP are Hakama well field and Bushra well field.The aquifer is the deep part of B2/A7. Depth of Hakama well field is 510-540 m andwater table is 480-620 m. Depth of Bushra well field is 530 m and water table is 610 m.The sprinkler discharge volume to restrain air dust and washing of equipment andvehicles is small. It is expected that its influence on the water source will be small.Measures and monitoring procedures will be examined considering the level ofinfluence on production well water quality.
In the operation stage, quality of water supplied is expected to improve because of thesupply through new pipes instead of rusty old pipes and the decrease in contaminationdue to leakage at pipe breakages
Soil pollution
During the construction period, leakage of small amounts of oil may occur fromconstruction machinery and vehicles causing soil pollution.Although small, measures for oil spill prevention and soil contaminated by spilled oilshould be collected and examined.
Noise and Vibration
According to standard in Jordan, the maximum level of noise is: City township(daytime: 60 dB, night: 50dB), commercial area (daytime: 65 dB, night: 55 dB),education, hospital, mosque (daytime: 45 dB, night: 35 dB). (MOE, 1997)Load vibration limit is: residential area (daytime: 65 dB, night: 60 dB), commercial,industrial area (daytime: 70 dB, night: 65 dB) (General rules of Japanese localgovernment)Noise and vibration occur due to transportation vehicles and machinery, excavationwork for foundation of pumping station, and laying of main pipelines and distributionpipelines.Monitoring the implementation and mitigation measures during construction is required.In the operation stage, the noise and vibration during pump operation in the Zebdatpumping station is expected to cause some sort of health disturbance for neighborhoodresidents in case no mitigation measures are adopted.Monitoring of implementation measures and permanent mitigation measures inoperation stage is required.(During interviews, the residents in the neighborhood of the Zebdat pumping stationcomplained of disturbance to sleep due to noise especially at night. Some measures suchas installation of sound insulation walls will be required.)
Local economyDuring the work of laying main and distribution pipelines in urban commercial areas,traffic may be regulated, and approach to commercial facilities may be interrupted.Mitigation countermeasures such as securing small roads should be examined.
Existing socialinfrastructure andsocial service
Construction that affects existing social infrastructure and social services is not to beimplemented. Installation of pump is in existing owned area or purchased land. In pipelaying works, excavation of ditch along the road will be required, but the ground will berestored to original situation after pipe laying.Water supply may be stopped temporarily during connection work of new pipes.Measures to restore normal supply should be adopted as quickly as possible.
10-15
Environmental Item Results of examination
Cultural Heritage
Locations of remains and relics related to cultural heritage on the ground can beavoided. However, it is difficult to check these if buried underground. Roman remainsand relics may be found in Hawwara; so attention must be paid during construction.Care should be taken during excavation and if any remains or relics are observed, theDepartment of Antiquities in the Ministry of Tourism and Antiquities (MOTA) should benotified to get the relevant expert assigned for further guidance on handling such relicswhile continuing with the excavation work.
Infectious diseasessuch as HIV/AIDS
Since there is a possibility that the workers may get infectious disease including theHIV/AIDS, measures such as guidance for the health management of workers should beadopted.
Work Environment
During machine excavation, air pollution due to exhaust gas and dust, and noise andvibration may occur. These factors may pose risk to workers’ health.Measures to mitigate the impact such as the use of the dust protective masks and noisereduction appliances should be adopted.
AccidentTraffic jams and traffic accidents may occur due to traffic regulation and temporaryinterruption of traffic during construction. In a similar project, sign boards indicatingconstruction work at sites and guidance by the traffic personnel have been used.
Source: JICA Study Team
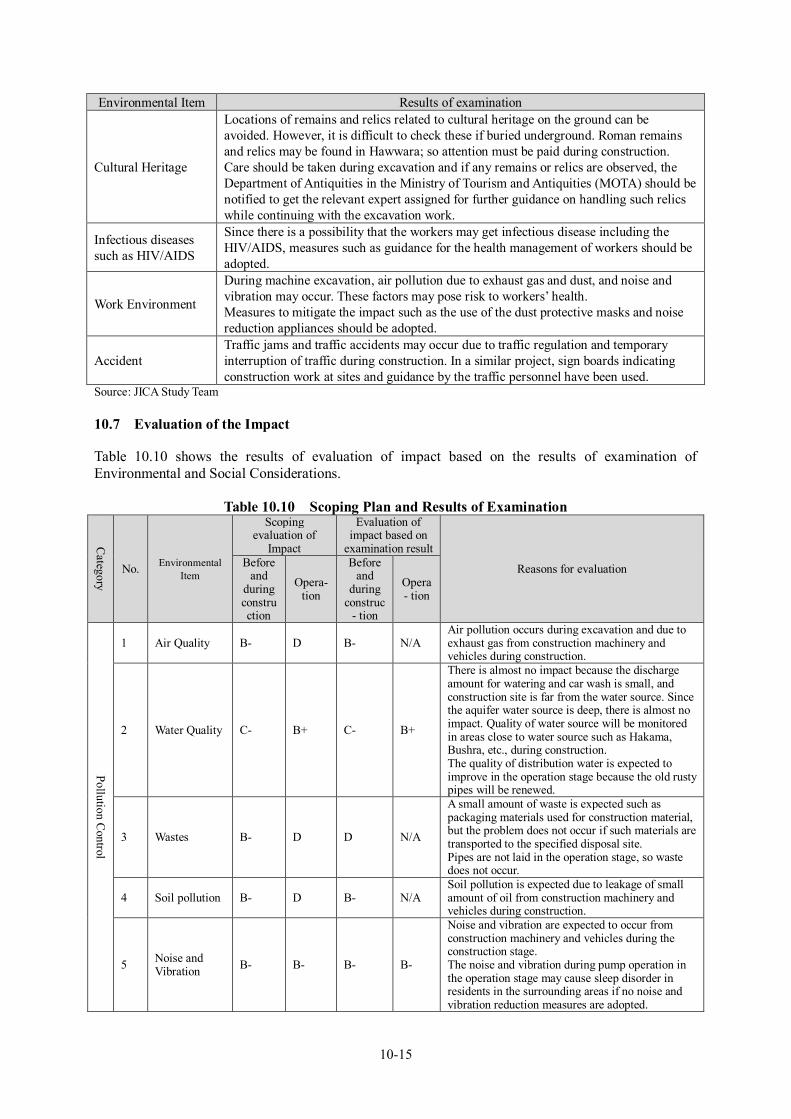
10.7 Evaluation of the Impact
Table 10.10 shows the results of evaluation of impact based on the results of examination ofEnvironmental and Social Considerations.
Table 10.10 Scoping Plan and Results of Examination
Category
No.Environmental
Item
Scopingevaluation of
Impact
Evaluation ofimpact based on
examination result
Reasons for evaluationBefore
andduringconstruction
Opera-tion
Beforeand
duringconstruc
- tion
Opera- tion
Pollution
Control
1 Air Quality B- D B- N/AAir pollution occurs during excavation and due toexhaust gas from construction machinery andvehicles during construction.
2 Water Quality C- B+ C- B+
There is almost no impact because the dischargeamount for watering and car wash is small, andconstruction site is far from the water source. Sincethe aquifer water source is deep, there is almost noimpact. Quality of water source will be monitoredin areas close to water source such as Hakama,Bushra, etc., during construction.The quality of distribution water is expected toimprove in the operation stage because the old rustypipes will be renewed.
3 Wastes B- D D N/A
A small amount of waste is expected such aspackaging materials used for construction material,but the problem does not occur if such materials aretransported to the specified disposal site.Pipes are not laid in the operation stage, so wastedoes not occur.
4 Soil pollution B- D B- N/ASoil pollution is expected due to leakage of smallamount of oil from construction machinery andvehicles during construction.
5Noise andVibration
B- B- B- B-
Noise and vibration are expected to occur fromconstruction machinery and vehicles during theconstruction stage.The noise and vibration during pump operation inthe operation stage may cause sleep disorder inresidents in the surrounding areas if no noise andvibration reduction measures are adopted.

10-16
Category
No.Environmental
Item
Scopingevaluation of
Impact
Evaluation ofimpact based on
examination result
Reasons for evaluationBeforeand
duringconstruction
Opera-tion
Beforeand
duringconstruc
- tion
Opera- tion
6 Subsidence D D N/A N/AModifications related to subsidence are not carriedout.
7Offensiveodor
D D N/A N/AElements generating an offensive odor are notpresent.
8 Substratum D D N/A N/AModifications related to substratum are not carriedout.
Natural
Environm
ent
9 Reserve Area D D N/A N/AReserve areas are over 10 km away from the targetareas.
10 Ecosystem D D D N/A
In the construction stage, modifications related toecosystem are not made because the construction isin urban and suburban residential area of and alongexisting road with traffic.No effect in the operation stage because the conduitis underground.
11 Hydrology D D N/A N/AModifications related to hydrology are not carriedout.
12Topography,geologicalfeature
D D N/A N/AModifications related to topography and geologicalfeatures are not carried out.
Social
Environm
ent
13 Resettlement D D N/A N/A Resettlement does not occur.
14 Poor classes D B+ N/A B+Residents including the poor can enjoy theimprovement in water supply conditions
15
EthnicMinorities andIndigenousPeoples
D D N/A N/A
Ethnic minorities and indigenous peoples are notresidents of the Project area.
16 Refugees D B+ N/A B+Project activities will not discriminate againstrefugees; rather water supply is expected to beimproved for all.
17Localeconomy
B- D B- N/A
During construction, traffic may be regulated andtraffic jams may occur; so approach to commercialfacilities is expected to be constrained.The network pipes are not laid in the operationstage. There is no impact on the local economy.
18Land use andlocal resourceuse
D D D DLand required for new pipe laying is narrow andwill hardly be affected.
19 Water use B- B+ D B+
Construction Stage: Major inconvenience will notoccur if water supply is interrupted for a short timewhen connecting to a new network.Operation Stage: Residents can enjoy theimprovement of water supply conditions.
20
Existingsocialinfrastructureand socialservice
D B+ D B+
Construction Stage: No negative impact on existingsocial infrastructure and social service except fortemporary inconvenience in the traffic condition.Operation Stage: Positive impacts are expectedsuch as the improvements in water supply facilitiesconsidering gravity flow system.
21Social capitaland socialorganizations
D D D B+
Construction Stage: No negative impact on socialcapital and social organizations is expected.Operation Stage: Positive impacts are expectedsuch as improvement in the water supply systemmaking leakage difficult.
22Imbalance ofprofit anddamage
D D N/A N/ANo negative impact on the balance of profit anddamage is expected.
23 Local conflict D D N/A N/ANo conflict in local community due to the MP isexpected.
24CulturalHeritage
C- D C- N/ARemains and relics may be found during excavationwork.

10-17
Category
No.Environmental
Item
Scopingevaluation of
Impact
Evaluation ofimpact based on
examination result
Reasons for evaluationBeforeand
duringconstruction
Opera-tion
Beforeand
duringconstruc
- tion
Opera- tion
25 Landscape D D N/A N/A No negative impact on landscape is expected26 Gender D D N/A N/A No negative impact on gender is expected.
27Rights of thechild
D D N/A N/ANo negative impact on the rights of the child isexpected.
28
InfectiousdiseasesincludingHIV/AIDS
C- D C- N/A
Construction Stage: Infectious diseases may spreaddue to the inflow of labor if there is no appropriatehealth and hygiene guidance.Operation Stage: Negative impact is not expected
29WorkEnvironment
B- D B- N/A
Construction activities are expected to have somenegative impact on the working environment oflaborers with regard to air quality, noise, andvibration because of the operation of constructionmachinery.O
thers 30 Accident B- D B- N/A
Construction Stage: Traffic jam and traffic accidentmay occur due to traffic regulation and interruption.Operation Stage: Negative impact is not expected
Note: N/A: Not applicableSource: JICA Study Team
10.8 Mitigation Measures and Cost
Mitigation measures and cost related to environmental items that are expected to have negative impactdue to implementation of proposed projects in the MP are shown in Table 10.11. The activities areexpected to have negative environmental impact during the construction and operation stages.
Table 10.11 Mitigation Measures and Cost
No.Environmental
ItemProposed Environmental management plan
Implement-ing Agency
Responsi-ble Agency
Cost(1,000 JD)
1 Air QualityTo suppress the scattering of dust occurringduring excavation in the construction stage,regular sprinkling of water is needed.
ContractorYWC,WAJ
115.0
2 Water Quality
During construction in the vicinity of theproduction well, the water quality of theproduction wells should be checked, anddischarge should be limited as much aspossible.
ContractorYWC,WAJ
12.8
4 Soil pollution
Construction machinery and vehicles need to bechecked regularly for oil leakage and repairscarried out if required. If leakage occurs, thesoil containing leaked oil should be collectedand disposed of appropriately.
ContractorYWC,WAJ
33.5
5Noise andVibration
The construction section moves to a differentlocation in a week to 10 days, so the noiseemitting period in each section is short and theimpact on daytime activity is small.Construction activity should be planned suchthat noise does not occur at nighttime.The noise of the pumping station close toresidential area will cause sleep disorder duringthe operation stage. Noise reduction measuressuch as fully-covered pumps in the pumpingstation building, soundproof wall or buffer
Contractor,Consultantfor Design
YWC,WAJ
712.0

10-18
No.Environmental
ItemProposed Environmental management plan
Implement-ing Agency
Responsi-ble Agency
Cost(1,000 JD)
facilities for noise reduction are requiredespecially in the Zebdat PS.
17 Local Economy
To mitigate the impact of traffic on the dailylife of people during construction, the approachside walk should be set appropriately and atraffic regulating person stationed to providedirections on site to ensure safe and smoothtraffic flow during construction work.
ContractorYWC,WAJ
Included inItem 30.Accident
24CulturalHeritage
Construction plans should be submitted toMOTA in advance requesting that a monitoringperson be assigned in case of occurrence ofremains or relics. If these are found duringexcavation, the instructions of monitoringperson should be followed for continuing theexcavation work.
MOTA MOTA -
28
InfectiousdiseasesincludingHIV/AIDS
For protection against infectious diseasesincluding HIV/AIDS, the contractor shoulddistribute brochures and other documents andprovide guidance to workers.
ContractorYWC,WAJ
22.3
29WorkEnvironment
Measures for safety of public and workers andsanitation measures should be taken during theconstruction period. Safety management rulesshould be prepared and implemented on site.Construction area indicators, protection fence,and watchmen at construction sites should beprovided to avoid occurrence of accidents. Forthe workers, dust masks, earmuffs or ear plugsagainst noise should be provided. Workers atthe construction site should wear work clothes,helmet, safety jacket, and safety shoes.
ContractorYWC,WAJ
41.3
30 Accident
It is necessary to isolate the construction sitesand implement traffic restrictions during theconstruction period. For this purpose, it isimportant to put up the construction plan onsite, indicate the construction area, installprotection fence, station watchmen, and providelighting arrangements especially at night at theconstruction site with appropriate trafficindicators to avoid accidents.
ContractorYWC,WAJ
62.3
Source: JICA Study Team
10.9 Monitoring Plan
Table 10.12 shows the monitoring plan, which is mainly required during the construction stage.

10-19
Table 10.12 Monitoring Plan
Environmental Item Item Place FrequencyResponsibleinstitution
Air Quality DustNeighborhood ofconstruction site
Once/monthContractorYWC, WAJ
Water QualityWater quality analysis for generalitems, coliform and inorganicitems
Production wellsnear constructionsection (beforecommencement,during construction,and aftercompletion)
3 times/constructionsection nearwater source
ContractorYWC, WAJ
Soil pollution
Checking oil leakage fromconstruction machinery andvehicles, and status of repairsCondition of locations where soilis affected by oil leakage
Construction site,constructionmachinery, vehiclestorage place
Once/monthContractorYWC, WAJ
Noise and Vibration Noise and vibration
Neighborhood ofconstruction siteNeighborhood of PSin the operationstage until effect ofmitigation measuresis confirmed
Once/monthContractorYWC, WAJ
Local EconomyCondition of blocking, limitedapproach to commercial facilities
Surroundings of theconstruction site
Once/weekContractorYWC, WAJ
Cultural Heritage Existence of remains and relics Construction siteMOTAcoordination
ContractorMOTA
Infectious diseasesConfirming the implementationof health management foreducating workers
Field office, workeraccommodation
4 times/yearContractorYWC, WAJ
Work Environment
Wearing working clothes, safetyshoes, masks, and other safetyrelated accessories by workers.Enforcement of safety measuresby neighbors
Construction siteArea surroundingconstruction site
Once/weekContractorYWC, WAJ
AccidentEnforcement of traffic safetymeasures. Traffic regulating workconditions
Area surroundingconstruction site
Once/weekContractorYWC, WAJ
Source: JICA Study Team
10.10 Stakeholder’s Meeting
Stakeholder’s meeting was held for explaining the MP for both water supply and wastewater servicesunder examination to participants and for collecting a wide range of opinions on environmental andsocial issues from stakeholders. The details are given below.
Date and time: 16 September 2014, 10:00 - 11:00Venue: WAJ PMU Meeting Room
Participating Organizations: Ministry of Environment, Ministry of Water and Irrigation, Organizationsof EIA Technical Committee (Ministry of Agriculture, Ministry of Industry and Trade, Ministry ofHealth, Ministry of Municipality, Ministry of Energy and Mineral Resources), Water Authority ofJordan, Yarmouk Water Company, JICA Jordan Office, and JICA Study Team.

10-20
Table 10.13 Timetable and Agenda of the Stakeholder’s MeetingNo. Title Main Contents Presenter
1 Opening Remarks 1 WAJ PMU2 Opening Remarks 2 Significance of SEA for MP MOE Directorate of
Licensing & Guidance3 Outline of draft master
plan for water supplyimprovement &rehabilitation
1) Concept of MP, 2) Population growth, 3) Unitof supply amount & water demand, 4) Watersources, 5) Water allocation, 6) Improvement &rehabilitation of WS facilities
Water supply engineer,JICA Study Team
4 Outline of draft masterplan for sewerage andsewer improvement &rehabilitation
1) Concept, 2) Unit discharge requirement &target sewer catchment area, 3) Target waterquality improvement, 4) Sewerage & sewerimprovement & rehabilitation
Wastewater engineer, JICAStudy Team
5 Pre-examination ofenvironmental andsocial considerationsfor the MP
1) Concept of SEA, 2) Examination ofdevelopment alternatives in view ofenvironmental and social considerations, 3)Anticipated environmental impacts, 4)Anticipated social impacts
Environmental & socialconsiderations expert,JICA Study Team
6 Discussion Issues & opinion on environmental & socialconsiderations
7 Closing Remarks JICA Jordan OfficeSource: JICA Study Team
There were two major opinions and comments during the discussion.
Firstly, a participant from the Ministry of Environment emphasized the importance of consideringaccident risk during construction. JICA Study Team stated that safety measures not only duringconstruction but also during operation will be proposed in the MP.
Secondly, a participant from the Ministry of Water and Irrigation asked JICA Study Team about themeasures for energy efficiency improvement and wastewater reuse. JICA Study Team responded that agravity water supply system as wide as possible would be proposed for conversion from pumpingsystem to gravity system to save energy, and treated wastewater quality would be set to meet thestandard for irrigation water in Jordan for wastewater reuse.
The meeting was concluded with the remark that all opinions and feedback from stakeholders wouldbe considered and monitored during the project.
10.11 Land Acquisition and Resettlement
No land acquisition is required for the proposed components in the water supply Master Plan.
10.12 Others
10.12.1 Draft Monitoring Form
Draft monitoring form is shown in Appendix 10A.
10.12.2 Checklist for Environmental and Social Considerations
The check list is shown in Appendix 10B.

11-1
CHAPTER 11 CONCLUSIONS AND RECOMMENDATIONS
11.1 Conclusions
WAJ has been actively implementing projects related to construction of the required facilities for“water reallocation among the governorates” nationwide after the Disi fossil groundwaterdevelopment. The transmission facilities for the northern governorates are also being implementedincluding the pipelines from Hofa reservoir to Bait Ras district under the Japan’s grant aid scheme. Allthe facilities are expected to start operation in 2017.
In 2017, water availability in the northern governorates is expected to be 91 MCM/year increasingfrom the current level of 72 MCM/year. The facilities required for water distribution to the Study Areain this case would not be many as listed below.
Some additional pipe in Irbid Pump replacement in Irbid Some additional pipe in Ramtha
In case of availability of 91 MCM/year water, the gap between water demand and supply will benarrowed to some extent. However, the available water will still not be sufficient to handle thecombined demand of Jordanian population and Syrian refugee in 2017 (considering Syrian refugeesnumber to be same as in 2013).
To overcome this situation, WAJ is planning additional 30 MCM/year of water source under the WadiAl Arab project. This will result into availability of total 121 MCM/year of water, and this amount ofwater will be able to meet the demand of Jordanian people and Syrian refugees up to 2028 consideringthat the number of Syrian refugees remains same as in 2013. The Wadi Al Arab is expected to startoperation in early 2020s. To distribute this additional available water effectively, distribution facilitiesneed to be developed in the Study Area also. In this Study, project components have been identified forstrengthening and rehabilitation of distribution networks for the above two cases and the former isselected for priority project.
The priority projects are scheduled to be completed by 2020 with the project cost of 62 million JD forIrbid and 18 million JD for Ramtha.
11.2 Recommendations
The distribution facilities are required to be implemented immediately for both the casesof water availability: 91 MCM/year and 121 MCM/year.
For even and equitable water supply of the augmented water, water distributionmanagement will be strengthened.
To reduce leakage and increase water supply, leakage control will be initiated as quicklyas possible in comprehensive NRW management.
To implement the proposed project, funding of project need to be secured immediately.

Appendix


Table of Contents
APPENDIX 1 Selection of Study Component ........................................................................................... 1
APPENDIX 2A City Master Plan and Population in Irbid............................................................................ 3
APPENDIX 2B City Master Plan and Population in Ramtha ..................................................................... 19
APPENDIX 3A Wells Yield by ROU Between 2011 and 2013................................................................... 27
APPENDIX 3B Population, Water Demand and Water Source by Sub-transmission Zone......................... 49
APPENDIX 3C Wells Table Change .......................................................................................................... 67
APPENDIX 3D Pipe Information in Irbid and Ramtha............................................................................... 71
APPENDIX 3E Complaints Record in Irbid............................................................................................... 73
APPENDIX 3F Data Loggers in Irbid........................................................................................................ 75
APPENDIX 3G Pipe Information in Ramtha.............................................................................................. 77
APPENDIX 5A Cost Comparison for Transmission and Distribution Zoning System................................ 79
APPENDIX 5B Monitoring and Control Plan (SCADA System) ............................................................... 81
APPENDIX 5C Proposed Pipe in Irbid ...................................................................................................... 89
APPENDIX 6A Proposed Pipe in Ramtha................................................................................................ 113
APPENDIX 7A Jordanian Drinking Water Standard ................................................................................ 129
APPENDIX 9A Results of Economic Evaluation..................................................................................... 131
APPENDIX 10A Monitoring Form (Example)........................................................................................... 135
APPENDIX 10B Environmental Check List (Water Supply Master Plan).................................................. 139


1
APPENDIX 1 SELECTION OF STUDY COMPONENT
In an effort to start the Project at the earliest, considering the urgent needs of water sector for thehost communities, JICA selected a consultant as soon as possible and the Consultants (JICAStudy Team) started mobilization work in Japan in late December 2013, followed by start of thefield study in Jordan on 5th January 2014.
All three components A (preparation of outline designs for the most prioritized projects), B andC (pilot activities) have been studied and discussed in parallel and intensively during Januaryand February, 2014 to select the effective measures for improvement of water supply andwastewater management services in the host communities.
January and February 2014 was a good timing in a sense to assess the effect of Syrian refugeeson water supply and wastewater management services in the northern governorates. Jordaniangovernment has already set up task forces and is intensively working for the assessment. It hasprepared “Needs Assessment” and listed up the “Priority Projects”. JICA Study Team hasparticipated in the Task Force together with JICA. In parallel, JICA Study Team together withJICA had a series of discussion with the main donors in water supply and wastewatermanagement sector including KfW, UNICEF, USAID, EIB, etc. Further, various studydocuments have been reviewed to understand the water supply and wastewater managementservices and related projects to be undertaken in the region.
As a result, the development study on the three cities of Irbid, Ramtha and Mafraq has beenproposed and agreed with WAJ under Component B. This study is in line with the priorityprojects (proposed interventions) under the National Resilience Plan 2014 – 2016 developed bythe Task Force as given in Table 1 below.
Table 1 Water Sector Proposed Interventions Related to the Northern Governorates
Specific Objective 1: Improving the Quantity, Quality and Efficiency of Water Delivery
Intervention 1.01: Western transmission system Wadi Al Arab-Irbid
Intervention 1.02: Rehabilitation of wells in different governorates
Intervention 1.03: Restructuring of transmission & main distribution systems & networkreinforcement/rehabilitation
Intervention 1.06: Supply of material & equipment to YWC
Intervention 1.07: Renewable energy supply systems for pumping
Source: Draft National Resilience Plan 2014 – 2016, Ministry of Planning and International Cooperation, January2013
The reason why “Intervention 1.03” was selected under the Component B is as follow: The influx of Syrian refugees has necessitated early implementation of “Intervention 1.01”
and “Intervention 1.02”. These are already pledged by international communities. The twointerventions are augmentation of water resources.
Augmented water resources need to be delivered effectively. The WLRP are still usefulguidance for developing transmission and distribution systems; however, they need to beupdated to reflect the recent development.
NRW and leakage is still high even though every effort has been made nationwide.
For the “Intervention 1.03”, three cities of Irbid, Ramtha and Mafraq are selected to complete asearly as possible to alleviate water demand – supply imbalance in the most affected areas.

2
At the initial stage, however, development study on Mafraq water distribution system wasdropped because KfW has shown intention to study and finance the improvement of watersupply network system in Mafraq.

3
APPENDIX 2A CITY MASTER PLAN AND POPULATION INIRBID
Table 2 Locality Population in Irbid and Suburbs and Bani Kinana District Based onDOS
Locality/Neighborhoods
Year Year2012 Population 2035 Population Note
1. Localities/Neighborhoods in Irbid and Bani Obaid Network
a. Irbid 307,024 486,360
Not adopted,Adopted
population aregiven in Table 4
Al Arabia Al Afraah 11,917 18,878Al Ateba'a 5,730 9,077
Al Mohandisin 6,300 9,980As Surayj 217 344
Zebdat 3,588 5,684Al Barha Al Ashrafeeh 2,196 3,479
Al Basaten 4,498 7,125Al Herafeyeen West 158 250
Al Marj 1,610 2,550Al Matla'a 12,990 20,578Al Saadah 7,497 11,876
Al Seha 13,147 20,826No Name 0 0
Al Hashimia Al Hashme 2,732 4,328Al Jamee 1,433 2,270
Al Mallab 3,895 6,170Al Medan 6,822 10,807Al Salam 13,977 22,141
Al Tall 1,044 1,654Al Manara Al Abrar 19,224 30,453
Al Manara 21,481 34,028Al Nadeef 8,904 14,105Al Qasela 10,212 16,177
Al Swaneh 5,191 8,223Al Nasur Al Audah 32,581 51,612
Hanena 15,617 24,739Al Herafeyeen East 486 770
Al Karama 13,256 20,999Al Naser 10,871 17,221
Al Yarmouk 4,242 6,720No Name 0 0
Al Nouzha Al Jamiah 12,025 19,049Al Nouzha 6,896 10,924
Al Hekmah 6,784 10,747Al Werud 6,525 10,336
Al Roudah Andalus 2,368 3,751Andalus 3,164 5,012
Al Baqaa 2,413 3,822Al Baiyda 2,844 4,505Al Emaan 4,982 7,892Al Rouda 5,009 7,935
Al Sahel Green 6,028 9,549

4
Locality/Neighborhoods
Year Year2012 Population 2035 Population Note
Al Sena'a 796 1,261Zahra 2,574 4,078Zahra 2,800 4,435
b. Irbid Suburbs 1Aidoon 22,767 36,065
Not adopted,Adopted
population aregiven in Table 4
Aliah 532 843Bait Ras 22,078 34,973
Bushra 13,936 22,076Hakama 9,093 14,404
Hawwara 15,622 24,746Hoson 25,093 39,749Maro 3,578 5,668
Sal 8,505 13,473Sarieh 23,532 37,276
Sub-Total 144,736 229,273Total a and b above 451,760 715,633
c. Irbid Suburbs 2Al'al 5,343 8,464
AdoptedPopulation
As'ara 1,188 1,882Fo'arah 4,062 6,435
Hariema 4,522 7,163Kharja 5,283 8,369
Kofor Jayez 3,818 6,048Mghayyer 10,625 16,831
Mokhayyam AzmiMufte
20,353 32,241
Um El-Jadayel 1,083 1,716Teqbel 612 969
Sub-Total 56,889 90,118Total (a+b+c) 508,649 805,751
2. Localities in Bani Kinana DistrictHoor 2,432 3,852
AdoptedPopulation
Kherbit Azrit 930 1,473Soom 6,311 9,997Hatem 6,629 10,501Malka 7,784 12,330Mansoorah 4,404 6,976Saidoor 1,810 2,867Um Qais 4,811 7,621Ebder 2,838 4,496Kofor Soom 8,377 13,270Samar 3,852 6,102Saham 7,226 11,447Yebla 4,564 7,230Rfaid 2,532 4,011Hebras 4,374 6,929Hartha 4,916 7,787Aqraba 3,070 4,863Qasfah 882 1,397Khrayybeh 1,747 2,767Bareshta 214 339

5
Locality/Neighborhoods
Year Year2012 Population 2035 Population Note
Yarmook 1,034 1,638Sama El-Roosan 3,487 5,524Abu El-Loqas 1,549 2,454Mzaireeb 1,466 2,322Zaweh 1,047 1,659Saileh 871 1,380
Sub-Total 89,157 141,232Total 597,806 946,983
Source: JICA Study Team based on DOS data
Irbid Population
Population Distribution within IrbidAccording to the DOS estimates, population in Irbid city1 is expected to increase from 307,024in 2012 to 440,079 in 2030 and 486,360 in 2035 (Table 3). Consequently, the current (2012)population density in Irbid, which is 85 persons per hectare (pph) will increase to 135 pph in2035 as a whole. Population of various neighborhoods located in Irbid is also estimatedassuming the same growth rate of Irbid as shown in Table 3. The population thus calculated forall the neighborhoods of Irbid are presented in Table 3 below. Population densities based onpopulation of 2012 and 2035 in the neighborhoods of Irbid are presented in Figure 1 and 2,respectively.
Table 3 Population and Its Density in Irbid Neighborhoods
Area NeighborhoodArea
(1000 m2)
Population2012 (asper DOS)
Population2035 (asper DOS)
PopulationDensity in
2012(person/ha)
PopulationDensity in
2035(DOS)
(person/ha)
Irbid City Area
Al Roudah Al Sena'a 461.0 796 1,261 17 27
Al Barha Al Basaten 1,640.6 4,498 7,125 27 43
Al Manara Al Manara 1,067.8 21,481 34,028 201 319
Al Arabia Al Ateba'a 1,250.8 5,730 9,077 46 73
Al Nouzha Al Werud 1,977.4 6,525 10,336 33 52
Al Nasur Al Yarmouk 625.3 4,242 6,720 68 107
Al Hashimia Al Salam 626.2 13,977 22,141 223 354
Al Nouzha Al Jamiah 1,176.0 12,025 19,049 102 162
Al Nouzha Al Nouzha 540.2 6,896 10,924 128 202
Al Nouzha Al Hekmah 827.8 6,784 10,747 82 130
Al Arabia As Surayj 762.2 217 344 3 5
Al Arabia Zebdat 1,644.2 3,588 5,684 22 35
Al Arabia Al Mohandisin 1,858.8 6,300 9,980 34 54
Al Arabia Al Afraah 1,094.3 11,917 18,878 109 173
Al Nasur 184.3 0 0 0 0
Al Barha 3,079.7 0 0 0 0
1 Irbid city and its suburbs such as Hawwara, Sarieh and Bushra compose Greater Irbid Municipality.

6
Area NeighborhoodArea
(1000 m2)
Population2012 (asper DOS)
Population2035 (asper DOS)
PopulationDensity in
2012(person/ha)
PopulationDensity in
2035(DOS)
(person/ha)
Al Roudah Al Baqaa 963.0 2,413 3,822 25 40
Al Roudah Al Baiyda 313.7 2,844 4,505 91 144
Al Nasur Hanena 1,043.1 15,617 24,739 150 237
Al Nasur Al Karama 696.8 13,256 20,999 190 301
Al Nasur Al Herafeyeen East 172.4 486 770 28 45
Al BarhaAl HerafeyeenWest
242.5 158 250 7 10
Al Barha Al Marj 417.1 1,610 2,550 39 61
Al Barha Al Saadah 834.7 7,497 11,876 90 142
Al Barha Al Ashrafeeh 356.9 2,196 3,479 62 97
Al Barha Al Matla'a 753.0 12,990 20,578 173 273
Al Barha Al Seha 528.4 13,147 20,826 249 394
Al Manara Al Swaneh 470.1 5,191 8,223 110 175
Al Manara Al Nadeef 363.5 8,904 14,105 245 388
Al Manara Al Abrar 800.7 19,224 30,453 240 380
Al Manara Al Qasela 863.3 10,212 16,177 118 187
Al Roudah Zahra 575.9 2,574 4,078 45 71
Al Roudah Zahra 626.0 2,800 4,435 45 71
Al Roudah Andalus 592.5 2,368 3,751 40 63
Al Roudah Andalus 791.8 3,164 5,012 40 63
Al Roudah Al Rouda 1,078.0 5,009 7,935 46 74
Al Roudah Al Sahel Green 1,126.4 6,028 9,549 54 85
Al Roudah Al Emaan 387.7 4,982 7,892 128 204
Al Hashimia Al Medan 295.1 6,822 10,807 231 366
Al Hashimia Al Mallab 461.2 3,895 6,170 84 134
Al Hashimia Al Jamee 111.0 1,433 2,270 129 204
Al Hashimia Al Tall 152.7 1,044 1,654 68 108
Al Hashimia Al Hashme 259.0 2,732 4,328 105 167
Al Nasur Al Audah 833.4 32,581 51,612 391 619
Al Nasur Al Naser 1,035.4 10,871 17,221 105 166
City Total 35,961.7 307,024 486,360 85 135
Suburban Areas
Sal Sal 8,090.5 8,505 13,473 11 17
Hakama Hakama 7,848.2 9,093 14,404 12 18
Bushra Bushra 6,825.8 13,936 22,076 20 32
Hawwara Hawwara 7,039.6 15,622 24,746 22 35
Bait Ras Bait Ras 10,248.6 22,078 34,973 22 34
Maro Maro 3,214.0 3,578 5,668 11 18

7
Area NeighborhoodArea
(1000 m2)
Population2012 (asper DOS)
Population2035 (asper DOS)
PopulationDensity in
2012(person/ha)
PopulationDensity in
2035(DOS)
(person/ha)
Aidoon Aidoon 12,724.5 22,767 36,065 18 28
Sarieh Sarieh 11,010.4 23,532 37,276 21 34
Hoson Hoson 14,621.7 25,093 39,749 17 27
Aliah Aliah 2,154.9 532 843 2 4
Suburban-total 83,778.2 144,736 229,273 17 27
Total 119,739.9 451,760 715,633
According to the above estimation, population density in the central neighborhoods, which isalready over 200 pph in 2012 (refer to Table 3, and Figures 1 and 2), will increase dramaticallyto about 400 and will reach even to the level of 619 pph in the neighborhood of Al Audah (referto Table 3 and Figure 2). Very high population density is expected to result into increased loadon existing limited infrastructures and consequently lead to unhealthy living environments. Toovercome this, development based on very high density of population in the central part of Irbidshould be avoided. Therefore, in the calculation in this Study, it is considered that the centralarea of Irbid would not be able to accept additional population and hence additional people willdiffuse to suburban parts of Irbid guided by factors such as availability of infrastructure, lowerprices of land, etc.

8
Note: Number below name of Neighborhood indicate population density in persons/ha.Population density in Al Jamiah is calculated excluding large University campus area.
Figure 1 Population Density in 2012 in Neighborhoods of Irbid

9
Note: Number below name of Neighborhood indicate population density in persons/ha.Population density in Al Jamiah is calculated excluding large University campus area.
Figure 2 Population Density in 2035 in Neighborhoods of Irbid Based on DOS Estimates

10
City Master Plan for Greater IrbidIn the “Irbid 2030: Greater Irbid Area Plan” prepared by the Ministry of Municipal Affairs(hereinafter called as city master plan), future urban growth area for Irbid city and its suburbs,and planned population density has been presented considering sound living environment anddevelopment. Planned population densities for Irbid city are around 100 pph (persons perhectare) and for the suburbs corresponding figures range 30 to 50 pph. In the city master plan,population of Irbid city is not projected, however, total population of the Greater IrbidMunicipality is projected to almost double from 395,472 in 2004 to 741,276 by 2030. Thisprojected population is judged to be greater than the adopted population of 486,360 in 2035 byDOS (Table 3).
Planned population distribution presented in the city master plan is used as a guide in this Study.In the city master plan, Irbid and its suburbs are classified as follows and are presented in Figure3 below.
a) Residential StableThis category comprises lands with a mature built form where vacant lands are less than15 % and possibility of potential development within these neighborhoods is limited.
b) Residential IntensificationThis area comprises lands that are partially built-up and contain sufficient vacant lands,greater than 15 %, that are well-suited to accommodate additional population growth throughdevelopment.
c) Residential ExpansionThis category comprises lands that are primarily undeveloped or vacant and canaccommodate new development. Often this category of lands is located on the periphery of,or adjacent to, existing built-up areas
In the city master plan, development is suggested to be encouraged within designated residentialintensification areas to take advantage of existing infrastructure and services as a first priority,followed by residential expansion area that will accommodate population and employmentgrowth to 2030. The city master plan suggests avoiding additional population in residentialstable areas in order to prevent such areas from becoming very congested leading to unhealthyenvironment.
Planned population density for Irbid and its suburbs set in the city master plan is shown inFigure 4 below. Some examples of density modeling of Irbid presented in the city master Planare also shown in Figure 5.
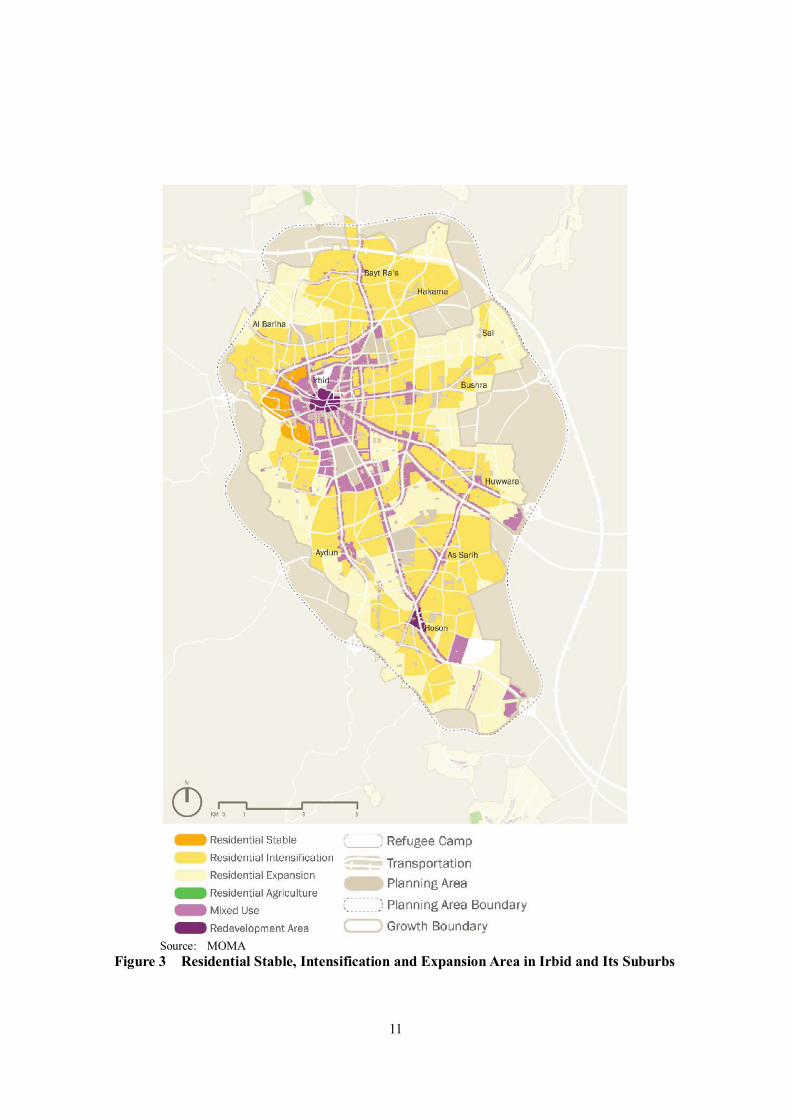
11
Source: MOMA
Figure 3 Residential Stable, Intensification and Expansion Area in Irbid and Its Suburbs

12
Source: MOMANote: PPD (persons/dunam) = 0.1 pph (persons/ha)
Figure 4 Planned (2030) Gross Population Density for Irbid and Its Suburbs

13
Al Nouzha – High density in Central Irbid, GrossDensity of 16.1 persons per dunam (ppd)
Al Afraah – High density in Central Irbid, GrossDensity of 22 ppd
Bait Ras – Low density in northern part, GrossDensity of 4.8 ppd
Al Tall: Medium Density of 9.5 ppd
Source: MOMA
Figure 5 Examples of Density Modelling in Irbid
Modified Population According to City Master Plan in IrbidTaking into consideration the above description and data available in “Irbid 2030: Greater IrbidArea Plan”, population density is calculated for 45 (number) neighborhoods of Irbid. Of these,10 neighborhoods are defined as “residential stable” areas and their population densities rangefrom 105 to 391 persons per hectare, far exceeding healthy environment. Therefore, populationgrowth in these areas is not encouraged and is assumed to be zero, consequently, futurepopulation in such neighborhoods is considered same as the existing population.
Populations in other neighborhoods are estimated using projected population density of “Irbid2030: Greater Irbid Area Plan”. The calculated population and population density for allneighborhoods of Irbid and localities in suburbs is shown in Table 4 and Figures 6 and 7. As aresult, the adopted population in Irbid in 2035 is 389,310, which is lower than DOS population.
The remaining population of the DOS estimates for 2035 is re-allocated to peri-urban orsuburban localities within Greater Irbid urban area. Therefore, the population in the suburbanlocalities is corresponding DOS population (using population growth rate of 2.0 %) plusre-allocated population from Irbid city. The calculated population and population density ofeach neighborhood in Irbid and its suburban localities are given in Table 4 and Figures 6 and 7.

14
Table 4 Adopted Population for 2035 and Corresponding Density in IrbidNeighborhoods
Area/Locality Neighborhood Area(1,000 m2)
Population(person)
Population Density(persons/ha)
1. Irbid City Area
Al Arabia
Al Afraah 1,094.3 11,917 109
Al Ateba'a 1,250.8 11,868 95
Al Mohandisin 1,858.8 9,717 52
As Surayj 762.2 4,992 65
Zebdat 1,644.2 10,561 64
Al Barha
Al Ashrafeeh 356.9 2,308 65
Al Basaten 1,640.6 11,768 72Al HerafeyeenWest 242.5 997 41
Al Marj 417.1 2,687 64
Al Matla'a 753.0 12,990 173
Al Saadah 834.7 8,446 101
Al Seha 528.4 13,147 249
No Name 3,079.7 12,453 40
Al Hashimia
Al Hashme 259.0 2,732 105
Al Jamee 111.0 1,730 156
Al Mallab 461.2 4,512 98
Al Medan 295.1 6,920 235
Al Salam 626.2 14,272 228
Al Tall 152.7 1,908 125
Al Manara
Al Abrar 800.7 19,224 240
Al Manara 1,067.8 21,481 201
Al Nadeef 363.5 8,904 245
Al Qasela 863.3 10,397 120
Al Swaneh 470.1 7,201 153
Al Nasur
Al Audah 833.4 32,581 391
Hanena 1,043.1 17,089 164
Al Herafeyeen East 172.4 648 38
Al Karama 696.8 13,814 198
Al Naser 1,035.4 10,871 105
Al Yarmouk 625.3 5,511 88
No Name 184.3 1,206 65
Al Nouzha
Al Jamiah 1,176.0 13,591 116
Al Nouzha 540.2 6,896 128
Al Hekmah 827.8 7,562 91
Al Werud 1,977.4 14,292 72
Al Roudah Andalus 592.5 4,015 68

15
Area/Locality Neighborhood Area(1,000 m2)
Population(person)
Population Density(persons/ha)
Andalus 791.8 5,643 71
Al Baqaa 963.0 6,340 66
Al Baiyda 313.7 2,943 94
Al Emaan 387.7 6,215 160
Al Rouda 1,078.0 7,684 71
Al Sahel Green 1,126.4 8,011 71
Al Sena'a 461.0 2,174 47
Zahra 575.9 3,707 64
Zahra 626.0 5,385 86
City Sub-total (1) 35,961.7 389,310 108
2. Irbid Suburbs
Sal Sal 8,090.5 24,699 31
Hakama Hakama 7,848.2 14,404 18
Bushra Bushra 6,825.8 32,175 47
Hawwara Hawwara 7,039.6 31,955 45
Bait Ras Bait Ras 10,248.6 50,036 49
Maro Maro 3,214.0 6,046 19
Aidoon Aidoon 12,724.5 48,819 38
Sarieh Sarieh 11,010.4 47,359 43
Hoson Hoson 14,621.7 65,633 45
Aliah Aliah 2,154.9 5,197 24
Irbid Suburban sub-total (2) 83,778.2 326,323 39
Total (1 and 2) 119,739.9 715,633 60
3. Other Locality of Irbid and Bani Obaid Districts
Al'al Al'al 8,464
As'ara As'ara 1,882
Fo'arah Fo'arah 6,435Hariema Hariema 7,163Kharja Kharja 8,369
Kofor Jayez Kofor Jayez 6,048Mghayyer Mghayyer 16,831MokhayyamAzmi Mufte
Mokhayyam AzmiMufte 32,241
Um El-Jadayel Um El-Jadayel 1,716
Teqbel Teqbel 969
Sub-total (3) 90,118
4. Bani Kinana District
Abu El-Loqas Abu El-Loqas 2,454
Aqraba Aqraba 4,863
Bareshta Bareshta 339

16
Area/Locality Neighborhood Area(1,000 m2)
Population(person)
Population Density(persons/ha)
Ebder Ebder 4,496
Hartha Hartha 7,787
Hatem Hatem 10,501
Hebras Hebras 6,929
Hoor Hoor 3,852
Kherbit Azrit Kherbit Azrit 1,473
Khrayybeh Khrayybeh 2,767
Kofor Soom Kofor Soom 13,270
Malka Malka 12,330
Mansoorah Mansoorah 6,976
Mzaireeb Mzaireeb 2,322
Rfaid Rfaid 4,011
Saham Saham 11,447
Saidoor Saidoor 2,867
Samar Samar 6,102
Soom Soom 9,997
Qasfah Qasfah 1,397
Saileh Saileh 1,380
Sama El-Roosan Sama El-Roosan 5,524
Um Qais Um Qais 7,621
Yarmook Yarmook 1,638
Yebla Yebla 7,230
Zaweh Zaweh 1,659
Sub-Total (4) 141,232
Total (1, 2, 3, and 4) 946,983

17
Source: JICA Study Team
Figure 6 Adopted Population Density of Irbid in 2035

18
Source: JICA Study Team
Figure 7 Population Density of Irbid and Suburbs in 2035

19
APPENDIX 2B CITY MASTER PLAN AND POPULATION IN
RAMTHA
Population in Ramtha and neighboring localities are also estimated by DOS and is given inTable 5. According to the DOS estimates, the population in Ramtha is expected to increase from87,499 in 2012 to 138,605 in 2035. The total population of Ramtha and its neighboringlocalities is expected to increase from 133,690 in 2012 to 211,775 in 2035.
Table 5 Population in Ramtha
Locality/
Year2012 2025 2030 2035
Ramtha 87,499 113,480 125,415 138,605
Torrah 18,183 23,582 26,062 28,803
Shajarah 14,115 18,306 20,231 22,359
Emrawah 4,622 5,994 6,625 7,322
Bwaidhah 6,677 8,660 9,570 10,577
Dnaibeh 2,594 3,364 3,718 4,109
Total 133,690 173,387 191,622 211,775
Source: JICA Study Team based on DOS population growth rate
Urbanization is planned southwards as per the Growth Plan on Regional Scale in “Irbid 2030:Greater Irbid Area Plan” of Ministry of Municipal Affairs and is shown in Figure 8. In the Plan,Ramtha is divided into core area of urban intensification and growth, rural intensification andgrowth, urban fringe and agricultural area.
Land use plan of Ramtha, provided by Ramtha municipality, is shown in Figure 9. Urban areaspresented in these two plans in case of Ramtha are similar. Hence, the population is planned toreside within this urban area. The central part of Ramtha is mainly occupied by the densecommercial buildings. Commercial blocks are surrounded by the residential areas. On theoutskirts lie some stretches of green residential areas.

20
Source: MOMA
Figure 8 Growth Plan in Ramtha

21
Source: Ramtha Municipality and compiled by JICA Study Team
Figure 9 Land Use Plan in Ramtha

22
The information on population distribution in Ramtha is not available from any sources. Ramthalocality comprises of several neighborhoods and each neighborhood is divided into blocks bythe Department of Statistics for preparing population data. The data on population in 2004 foreach block in Ramtha city has been obtained from DOS. Using the population density in blockswithin Ramtha locality, population density is calculated. Even though population data is old in2004, it gives us some guidance in projecting population distribution. The total population ofRamtha in 2004 was 71,433.
The calculated population and density for each neighborhoods of Ramtha for 2012 and 2035considering the DOS growth rate is presented in Table 6 and Figures 10 and 11.
Table 6 Population Projection in Ramtha Neighborhood
NeighborhoodArabic (English)
Area (m2)Population
2004
DOS PopulationPopulation
DensityAdopted
Population2035
PopulationDensity
20352012 2035 2012 2035
Aowl (1st) 1,189,075 17,920 21,950 34,771 185 292 21,950 185
Aththani (2nd) 1,050,590 6,775 8,299 13,146 79 125 10,506 100
Aththalth (3rd) 825,327 4,050 4,961 7,859 60 95 8,253 100
Arraba (4th) 890,824 1,559 1,910 3,025 21 34 3,861 43
Khames (5th) 2,490,498 1,055 1,292 2,047 5 8 2,612 10
Sades-A (6th-A) 4,264,110 5,007 6,133 9,715 14 23 12,398 29
Sades-B (6th-B) 20,602,010 4,234 5,186 8,216 3 4 10,485 5
Sabea-A (7th-A) 2,001,174 9,398 11,512 18,235 58 91 20,012 100
Sabea-B (7th-B) 10,731,127 774 948 1,502 1 1 1,917 2
Thamen (8th) 6,898,556 5,545 6,792 10,759 10 16 13,731 20
Tasea-A (9th-A) 1,301,964 7,096 8,692 13,769 67 106 13,020 100
Tasea-B (9th-B) 3,054,570 1,186 1,453 2,301 5 8 2,937 10
Aasher (10th) 2,703,315 6,834 8,371 13,260 31 49 16,923 63
Total 58,003,138 71,433 87,499 138,605 15 24 138,605 24
Source; JICA Study Team
Employing the same concept of maintaining sound living environment, as in case of Irbid, themaximum population density of 100 pph has been used for neighborhoods located in the centralRamtha, except for the neighborhood that has existing population density of over 100 pphalready in 2012. Remaining population of neighborhoods located in central part has beendistributed to peripheral neighborhoods in proportion to their projected population using DOSpopulation growth rate. Accordingly, the population to be adopted for each neighborhood hasbeen calculated for year 2035 and is presented in Table 6 and Figure 12.

23
Source; JICA Study Team
Figure 10 Population Density in 2012 in Neighborhoods of Ramtha

24
Source; JICA Study Team
Figure 11 Population Density in 2035 in Neighborhoods of Ramtha

25
Source; JICA Study Team
Figure 12 Adopted Population Density in 2035 in Neighborhoods of Ramtha

26

27
AP
PE
ND
IX3A
WE
LL
SY
IEL
DB
YR
OU
BE
TW
EE
N2011
AN
D
2013

28

29

30

31

32

33

34

35

36

37

38

39

40

41

42

43

44

45

46

47

48

49
APPENDIX 3B POPULATION, WATER DEMAND AND WATER
SOURCE BY SUB-TRANSMISSION ZONE
Figure 13 Sub-Transmission Zone

50
Source: Department of Statistics
Figure 14 Localities in Irbid Governorate

51
Source: Department of Statistics
Figure 15 Localities in Ajloun and Jerash Governorates

52
Source: Department of Statistics
Figure 16 Localities in Mafraq Governorate

53
Tab
le7
Pop
ulatio
n,
Water
Pro
du
ction
and
Average
Dem
and
inS
ub
-Tran
smissio
nZ
on
es

54

55

56

57

58

59

60

61

62

63

64

65

66