chapter 8 · computing environment (isce) processing package is undergoing further development in...
TRANSCRIPT
THE SAR HANDBOOK
To consider how the use of SAR in forest and environmental monitoring is likely to change in the future, it is useful to reflect on how SAR is currently used across a range of applications. As documented in the preceding chapters, earlier research has transitioned to applications ranging from the use of SAR for tracking deforestation to its use in estimating forest height and biomass. The applications landscape is expected to change due to the growing public avail-ability of SAR data to feed applications, with important missions like the NISAR (NASA-ISRO Synthetic Aperture Radar) and the European Space Agency’s (ESA’s) Biomass mission planned for launch within a five-year horizon from the publication of this handbook. Limitations notwithstanding, other factors expected to further accelerate the application of SAR data include the growing availability of desktop and online platforms with which to process and ana-lyze radar data, and—as evidenced by this handbook—a growing set of resources to build the user community’s capacity to apply SAR data. In support of Global Forest Observation Initiative (GFOI) and SilvaCarbon, the global network of hubs of the SERVIR program are also poised as important resource cen-ters to help strengthen capacities within their respective regions to apply SAR for forest monitoring, as well as in other environmental monitoring contexts.
ABSTRACT
8.1 SAR in the Present Forest Monitoring Context
At the close of this handbook, the reader should have acquired a series of skills that, applied, will put one well on the way to practical use of SAR data for forest monitoring. Toward that practical use, the pre-vious chapters have addressed the following topics:
• Preprocessing of raw SAR data to radiometrically terrain corrected products
• Monitoring deforestation and forest degradation• Mangrove monitoring• Forest structure estimation• Biomass estimation• Sampling design
Taking a synoptic view, this handbook has thus responded to fundamental questions that need to be addressed not only for use of radar remote sensing, but also for other techniques in general, such as:
• What are the characteristics of the data?
• Where can the data be obtained?• What can be done with the data?• What tools can be used to process this data and
where are they found?• How can specific products be generated from
the data? – Toward that end, and for the benefit of a general public who might likely not have ac-cess to commercially licensed software, this handbook’s practical exercises have general-ly shown how freeware tools such as Alaska Satellite Facility (ASF) MapReady, PolSARPro, SNAP, and Python scripts can be used for gen-erating different types of derived products.
This chapter follows those questions by addressing one last, related query:
• What can be expected in terms of future devel-opments in SAR regarding the forest and broad-er environmental monitoring contexts?
A major takeaway from the previous chapters was
that SAR provides unique capabilities for forest mon-itoring, complementing the capabilities provided by optical remote sensing systems. The preceding chap-ters have likewise reflected on how far spaceborne imaging radar has come since NASA’s SeaSat mission in 1978, the development of subsequent research missions through the 1990s and the 2000s, and the launch of the operational Sentinel-1 satellites of the European Commission’s Copernicus Programme in 2014. Nevertheless, as Meyer termed it in this book and elsewhere, today represents a “Golden Age of SAR,” and the next few years will see the launch of sat-ellite missions that may have significant implications for the science, practices, and policies of monitoring forests. (At the time of the writing of this handbook, UNAVCO maintains a register of SAR missions.) Those implications concern not only the new wavelengths covered by future missions (e.g., P-band SAR missions like Biomass), but also newer imaging techniques and capabilities like SAR tomography (Tomo-SAR).
CHAPTER 8Perspectives on the Future Application of SAR in Forest and Environmental MonitoringEmil Cherrington 1,2, Africa Flores-Anderson 1,2, Rajesh Bahadur Thapa 3, Kelsey E. Herndon 1,2, Anastasia Wahome 4, Phoebe Oduor 4, Kenneth Mubea 4, Edward Ouko 4, Nguyen Hanh Quyen 5, David Saah 6,10,Mamane Bako 7, Paul Bartel 8, Foster Mensah 9 , Stella Ofori-Ampofo 9, Eric Anderson 1,2, Emily Adams 1,2, Rebekke Muench 1,2, Amanda Markert 1,2, Andrea Nicolau 1,2, W. Lee Ellenburg 1,2, Kel Markert 1,2 , Betzy Hernandez Sandoval 1,2, Ashutosh Limaye 1, Robert Griffin 1,2, Daniel Irwin 1
1 NASA Marshall Space Flight Center / SERVIR Science Coordination Office, 2 University of Alabama in Huntsville, 3 International Centre for Integrated Mountain Development (ICIMOD) /SERVIR-Hindu Kush Himalaya, 4 Regional Centre for Mapping of Resources for Development (RCMRD) / SERVIR-Eastern & Southern Africa, 5 Asian Disaster Preparedness Center (ADPC) / SERVIR-Mekong, 6 Spatial Informatics Group (SIG) / SERVIR-Mekong, 7 Agro-meteorology, Hydrology, and Meteorology regional center (AGRHYMET) / SERVIR-West Africa, 8 Tetra Tech, Inc. / SERVIR-West Africa, 9 Centre for Remote Sensing and Geographic Information Services (CERSGIS) / SERVIR-West Africa, 10 University of San Francisco
THE SAR HANDBOOK
They are also complementary to spaceborne lidar missions like Ice, Cloud, and land Elevation Satel-lite-2 (ICESat2) and Global Ecosystem Dynamics Investigation (GEDI)—both launched in 2018. This chapter focuses on potential future applications of SAR, and particularly in relation to ongoing work across SERVIR’s global network. To a lesser extent, this handbook addresses research aspects of SAR, but to the extent possible, the focus is on proven applications.
8.2 Future SAR Developments
It is expected that future SAR missions—includ-ing the continuation of current missions under the European Union’s Copernicus Programme—will impact how forests are monitored. One barrier to countries’ regular use of SAR data for forest mon-itoring stems from a lack of archived SAR data that coincide with reference periods suggested for in-ternational agreements (e.g., 1990, 2000). More-over, historical SAR imagery tend to have variable acquisition parameters, making comparison diffi-cult. Nevertheless, if future SAR missions are able to expand the observations made under programs such as Copernicus (e.g., same polarizations, acqui-sition angles, beam modes; the influences of these factors on the SAR remote sensing of forests was also addressed in the second chapter of this hand-book), that would greatly facilitate the continued use of those data. (Copernicus’ Sentinel-1A and Sentinel-1B satellites provide for systematic obser-vation of the Earth, by which the places imaged by the twin C-band SAR instruments are acquired every 12 days, with the same beam modes, and with the same imaging angles, facilitating comparison of im-agery acquired on different days.) Taking that and other factors into context, the following subsections explore how the future SAR application landscape is likely to be impacted by:
(1) Expanded availability of data (from exist-ing and upcoming missions)
(2) Desktop and cloud computing tools with which to process radar data
(3) Capacity building efforts
8.2.1 AVAILABILITY OF SAR DATA
Some previously restricted SAR datasets are be-coming more available (e.g., the open availability of Advanced Land Observation Satellite (ALOS) Phased Array type L-band Synthetic Aperture Radar (PALSAR) data), and more SAR satellite missions have been launched (e.g., the Sentinel-1 satellites). In terms of fu-ture SAR missions, Chapter 1 has already catalogued the near-term radar satellites relevant to forest moni-toring (i.e., SAOCOM-1B, Radar Doppler Multifunction (RCM), Biomass, NISAR, TanDEM-L). In fact, of the satellite missions previously listed, since the writing of this handbook commenced, the PAZ, NovaSAR-S, and SAOCOM-1A missions have already launched (in February 2018, September 2018, and October 2018, respectively). Beyond noting that there are upcoming C-, L-, S-, and P-band missions, what is salient is that with various missions having “free and open” data policies, these will add to the already growing public archive of radar imagery of the Earth. As noted previ-ously, this provides a significant opportunity for SAR-based and SAR-enhanced monitoring of the Earth’s resources—something particularly unprecedented prior to Sentinel-1. That opportunity, however, also presents practical challenges to image analysts and their geospatial and/or data departments, specifically with regard to processing and storing large volumes of SAR data and derived products. Nevertheless, as was already covered earlier, it bears repeating that resources such as the Copernicus Open Access Hub and the ASF’s Vertex portal are crucial resources that provide access to SAR data. It is anticipated that the significance of these portals will only grow over time as “one-stop shops” for acquiring data from historical and ongoing missions. The forthcoming NISAR mis-sion is likewise poised to generate more data than any NASA Earth observing mission. Faced with signifi-cant file size and data volume challenges, an initiative “Getting Ready for NISAR” (GRFN) is part of efforts to move NASA Earth observing data and services to the commercial cloud (Blumenfield 2018).
8.2.2 PROCESSING OF SAR DATA: DESKTOP COMPUTING
There has been another welcome development re-lating to software platforms for processing SAR data.
Prior to ten years ago, radar data processing was partly the domain of commercially licensed software pack-ages. In 2008, ASF released its MapReady software platform, which allowed for the conversion of SAR data from particular Committee on Earth Observation Satel-lites (CEOS) data formats to GeoTIFF format. This low-ered the barrier to visualizing SAR imagery by allowing more users to easily visualize SAR products in GIS plat-forms, something that was already possible for optical datasets like Landsat imagery. Furthermore, around 2009, in parallel to the development of MapReady, ESA commissioned the development of the Next ESA SAR Toolbox (NEST), which was later folded into the Sen-tinel-1 Toolbox, and which itself later became a part of what is currently the Sentinel Application Platform (SNAP). As it stands, SNAP allows for preprocessing, processing, and visualizing data from a wide range of SAR missions (as well as data from non-SAR missions). In a similar vein to MapReady, SNAP allows for con-verting radar imagery to GIS-readable formats such as GeoTIFF. Overall, these tools have allowed a larger pool of GIS analysts and optical remote sensing specialists to begin to bridge over to the study of SAR data.
While MapReady and SNAP serve as key examples of what is currently available in terms of openly avail-able desktop software platforms, the evolution of such platforms may also herald what is to come in terms of additional functionalities. The shift from NEST to the Sentinel-1 Toolbox to SNAP, for instance, saw the addi-tion of application-oriented functions. Responding to the potential for wide applications of SAR data, SNAP currently allows for height estimation, change detec-tion, ocean object detection, and oil spill detection. As this chapter is being written, the InSAR Scientific Computing Environment (ISCE) processing package is undergoing further development in preparation for the forthcoming NISAR mission (Rosen et al. 2018).
8.2.3 PROCESSING OF SAR DATA: CLOUD COMPUTING
Beyond changes in how desktop applications process and manage SAR data, there has also been a significant shift in how SAR data are processed. Much of the community of users is moving away from downloading large SAR datasets from the Internet and processing them on desktop computer systems,
THE SAR HANDBOOK
and is moving toward bulk processing online, “in the cloud.” In only the last few years, a number of web-based platforms are beginning to offer SAR process-ing and analysis capabilities. These include, but are not limited to:
• ASF’s Hybrid Pluggable Processing Pipeline (HyP3): http://hyp3.asf.alaska.edu
• ESA’s Thematic Exploitation Platforms (TEPs): https://tep.eo.esa.int
– There are currently seven individual TEPs, fo-cusing on: coastal areas, food security, forest-ry, geo-hazards, hydrology, polar areas, and urban areas.
• Google Earth Engine (GEE): https://earthengine.google.com/
In the case of GEE, registered users are able to access and analyze the full and continually updated archive of Copernicus Sentinel-1 data, as well as the Japan Aerospace Exploration Agency’s (JAXA’s) Japa-nese Earth Resources Satellite 1 (JERS-1) and ALOS PALSAR global mosaics. In comparison, ASF HyP3 (pronounced “hype”) allows for more comprehen-sive processing of SAR data, including pre-processing and the automatic generation of value-added prod-ucts such as stacked and calibrated image time se-ries, as well as Interferometric SAR (InSAR) products. ASF HyP3 contrasts with GEE, which only provides radiometrically terrain corrected (RTC) amplitude or backscatter datasets, but currently does not support interferometric analyses needed for some forestry applications. Currently, the HyP3 service permits the generation of a limited number of data products per month. Users are encouraged to provide feedback on the functionality of the service and the quality of the provided products. Furthermore, with regard to the upcoming Biomass and NISAR missions, ESA and NASA are collaborating on the development of a Multi-Mission Analysis Platform (MMAP) that will also allow for online processing and analysis of SAR data (Albinet et al. 2018).
ASF HyP3, GEE, and MMAP also highlight the growing significance of the Analysis Ready Data (ARD) concept. With ARD, users are unburdened from some preprocessing and are less likely to waste resources processing extraneous data outside of the specific geographic area of interest. GEE offers, for instance,
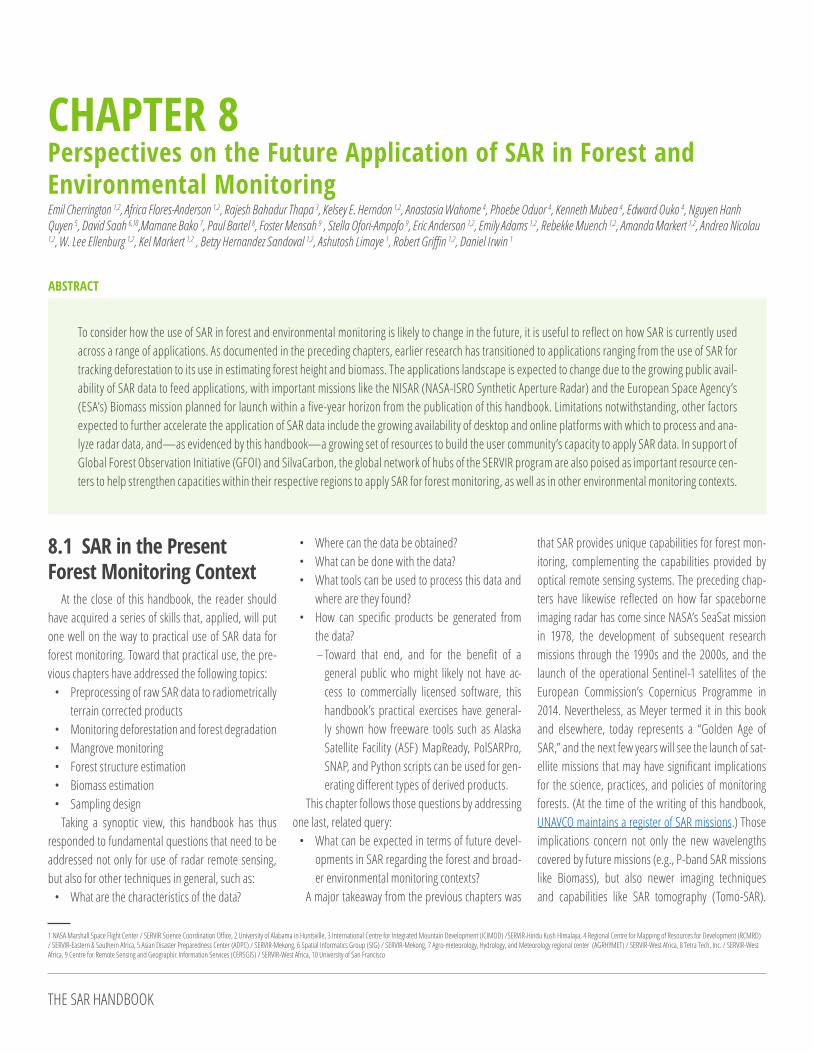
easy extraction and processing of ALOS PALSAR or Sentinel-1 imagery for specific areas of interest, with-out forcing users to download one or multiple 1-GB scenes to preprocess. It also offers simple functions to calculate time series statistics from the full 4-year archive of Sentinel-1 (S1) imagery in seconds (see Fig. 8.1). In contrast, the workflow to conduct the same process on a desktop or on-premise system (by downloading S1 data from the Copernicus Open Access Hub or from ASF’s Vertex and performing preprocessing, processing, and postprocessing on a software mentioned above), would take significantly more time and bandwidth.
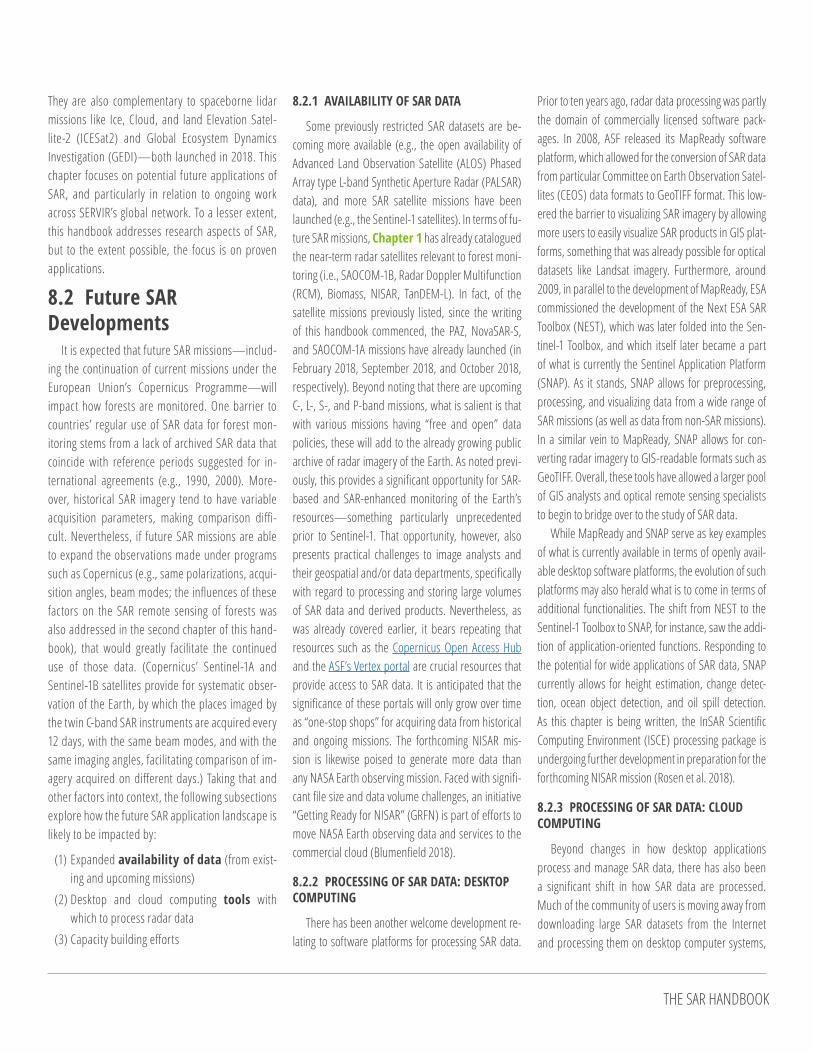
Something to mention are the pre-processing steps GEE uses for the Sentinel-1 data currently avail-able in their platform. At the time of writing this hand-book, GEE uses SNAP and, as explained in Chapter 3, there are certain tradeoffs about using SNAP for SAR processing, particularly for the displacement issue observed in Sentinel-1 data and discussed in Chapter 3. This has particular implications in time series analyses, where it can affect change detection. The following is a flowchart of the preprocessing steps GEE uses for their Sentinel-1 data.
Sentinel-1 imagery in GEE consists of Ground
Figure 8.1 Sentinel-1 backscatter time-series over a part of Belize City, extracted using GEE.
Figure 8.2 Sentinel-1 preprocessing steps used by GEE following Sentinel-1 Toolbox to derive the backscatter coefficient, σ0, in each pixel. Last updated August 15, 2018 (source: https://developers.google.com/earth-engine/sentinel1)
Apply orbit file
GRD border noise removal
Thermal noise removal
Radiometric calibration
Terrain correction
σo (dB)
SRTM DEM or ASTER DEM (high latitudes)
THE SAR HANDBOOK
Range Detected (GRD) imagery processed to back-scatter coefficient, σ0, in decibels. As implemented by the Sentinel-1 Toolbox (https://sentinel.esa.int/web/sentinel/toolboxes/sentinel-1), the steps are described as: (1) orbit metadata are updated with an orbit file, (2) low-intensity noise and invalid data on scene edges are removed, (3) additive noise in sub-swaths for scenes in multi-swath acquisition modes are removed, (4) back-scatter intensity is computed using sensor calibration parameters in the GRD metadata, and (5) takes into account terrain factor by converting to σ0, representing target backscattering area (radar cross-section) per unit ground area in decibels. GEE is in the process of repro-cessing the Sentinel-1 data to keep all floats unchanged, since the current preprocessing steps convert float32 values to 2-byte unsigned integers, keeping only the 99th percentile values.
Application-specific tradeoffs must be considered when deciding to perform analyses on-premise or on-cloud. For instance, how critical is it to control each pre-processing step, or is it acceptable to yield some choice to a free, on-cloud platform? Accuracy, precision, data volume (and bandwidth), and data latency are all con-siderations. Here, one scenario is discussed that consid-ers data volume and time-series analysis. For instance, if one wanted to look at radar backscatter patterns over Belize City, Belize, between October 26, 2014, and October 17, 2018, 84 descending mode images were acquired in relative orbit no. 128. At roughly 1 GB per GRD scene, analyzing data only over Belize City would still require downloading and subsequently analyzing about 84 GB of raw data. That would certainly be a chal-lenge using a desktop computer in a bandwidth-limited environment. Even if downloading such a volume of data were not a challenge, one can imagine how long it would take to process the 84 scenes from GRD to RTC products, and how much space would be required for the various intermediate steps. Furthermore, the hy-pothetical case provided pertains only to one scene in one particular mode, only over a 4-year period. If one were to include both ascending and descending data, and choose a study area (e.g., an entire country) that covered multiple scenes, and if the study period were extended (e.g., imagine processing S1 imagery in 2022), the data would become even more difficult to manage and process using desktop computing. This hypothetical
case merely highlights the quandary that many applica-tion-oriented users seeking to exploit SAR data will and have encountered, and how cloud computing can help circumvent that challenge. There is a growing interest in machine learning (ML) in this field, as demonstrated in many recent examples that use on-premise computing (e.g., Chen et al. 2018, Ndikumana et al. 2018, Belgiu et al. 2016). Given challenges discussed in this section, the barrier to enter into ML applications in remote sensing and environmental monitoring applications may be low-er in cloud environments (e.g., Hird et al. 2017, Shelestov et al. 2017).
8.2.3.1 System for Earth Observation Data Access, Processing and Analysis for Land Monitoring (SEPAL) and Food and Agricultural Organization (FAO) Collaboration
SEPAL is a cloud computing platform for autono-mous land monitoring using remotely sensed data. It is a combination of GEE and open source software such as ORFEO Toolbox, GDAL, R, R Studio Server, R Shiny Server, SNAP Toolkit, and OpenForis Geospatial Toolkit. It allows users to access powerful cloud-com-puting resources to query, access, and process satel-lite data quickly and efficiently for creating advanced analyses. SERVIR is working with the Food and Ag-riculture Organization (FAO) of the United Nations, who are the developers of SEPAL, to ingest the SAR processing scripts generated as part of this handbook and used during training events offered by the SAR experts authoring the main six chapters of this hand-book at SERVIR hubs in Africa and Asia.
8.2.4 CAPACITY BUILDING EFFORTS
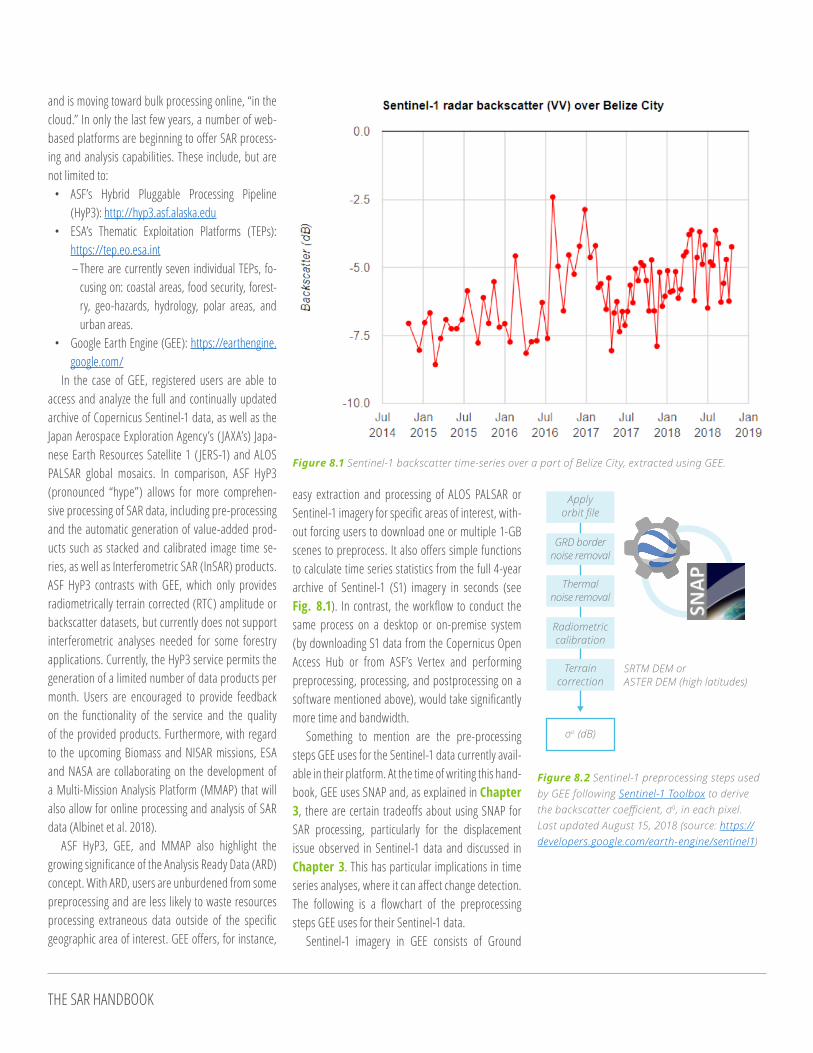
It is difficult to fully characterize the current state of various countries’ capacity to use SAR data for forestry and biomass applications, especially at a granularity relevant for creating partnerships to raise awareness, promote literacy, and develop expertise. Without ded-icated efforts to establish baselines, that task might similarly be daunting in the future. There are, neverthe-less, proxies for understanding the current and evolv-ing status of SAR capacity. One notable development is that the “club” of countries launching SAR satellites has been growing. Whereas, roughly a decade ago, the principal SAR missions (airborne and spaceborne) were mainly the fruits of Canadian, European, Japanese, and U.S. manufacture, recent and upcoming SAR missions include contributions from other nations. (Note that besides ESA’s SAR satellites, other European efforts have included the TerraSAR-X and TanDEM-X satellites of Germany, and the CosmoSkyMed satellites of Italy.) These include Argentina (the SAOCOM satellites) and In-dia (NISAR, jointly with the U.S.), and additional entries from European countries that previously did not have their own dedicated SAR missions, including the United Kingdom (the NovaSAR-S satellite), and Spain (the PAZ satellite). While a few additional countries launching SAR missions may not necessarily say much about SAR capacity, the use of SAR data and the “consumption” of capacity building opportunities may give another per-spective on capacity. For instance, in its implementation of Copernicus, the European Commission publishes annual assessments of the usage of Copernicus data,
Figure 8.3 Map of density of Sentinel-1 data downloads (source: https://scihub.copernicus.eu/twiki/pub/SciHubWebPortal/AnnualReport2017/COPE-SERCO-RP-17-0186_-_Sentinel_Data_Access_Annual_Report_2017-Final_v1.4.1.pdf).
Archive exploitation ratio
≤ 33 - 55 - 77 - 99 - 11> 11
THE SAR HANDBOOK
including from the Sentinel-1 satellites. As shown in Figure 8.3, certain regions and countries have much less data downloaded than others. Although Sentinel-1 is only one of a number of available sourc-es of radar data, this is likely an indicator of the low uptake of SAR capacity.
Regarding online opportunities to acquire skills relating to the processing of SAR data, there are a number of notable efforts open to the public, among others:
• Copernicus’ Research & User Support (RUS) webinars
• EO College’s Echoes in Space: Introduction to Radar Remote Sensing course
• NASA ARSET’s Introduction to SAR and Ad-vanced SAR courses
In addition, the University of Alaska-Fairbanks, in collaboration with the University of Alabama in Huntsville, and the NASA Jet Propulsion Laborato-ry ( JPL) is coordinating a three-year NASA-funded effort to develop a virtual capacity building center (CBC) for SAR (SAR-CBC) (Meyer et al. 2018). That effort is being piloted in three Spanish-speaking countries, and the Spanish- and English-language curricula and materials developed will be made
open to the public. The commonality among these efforts is a growing recognition that the internet has provided an opportunity for distance-based learning, open to the public. Echoes in Space, for in-stance, which launched in late 2017, is based on the premise that while there have been a number of on-line courses focused on various aspects of remote sensing, few focused on building capacity to use SAR data. Echoes in Space, in fact, built off an earlier platform, SAR-EDU, which launched in 2015. Another key resource to mention is NASA’s Applied Remote Sensing Training (ARSET) that has provided intro-ductory and advance trainings in the use of radar remote sensing. The high demand for SAR trainings has pushed ARSET to update their license to per-form webinars and host more than 200 participants at a time. This highlights not only the high demand but also the critical mass of SAR users that is starting to form. GEE also provides an Internet-based plat-form that facilitates access and processing capaci-ty of SAR data, especially in developing countries where access to proprietary software and hardware for data archiving has been a limiting factor to up-take of EO data processing for environmental and natural resource monitoring.
8.3 SAR Use in SERVIR HubsGiven the potential of SAR for forest and broader
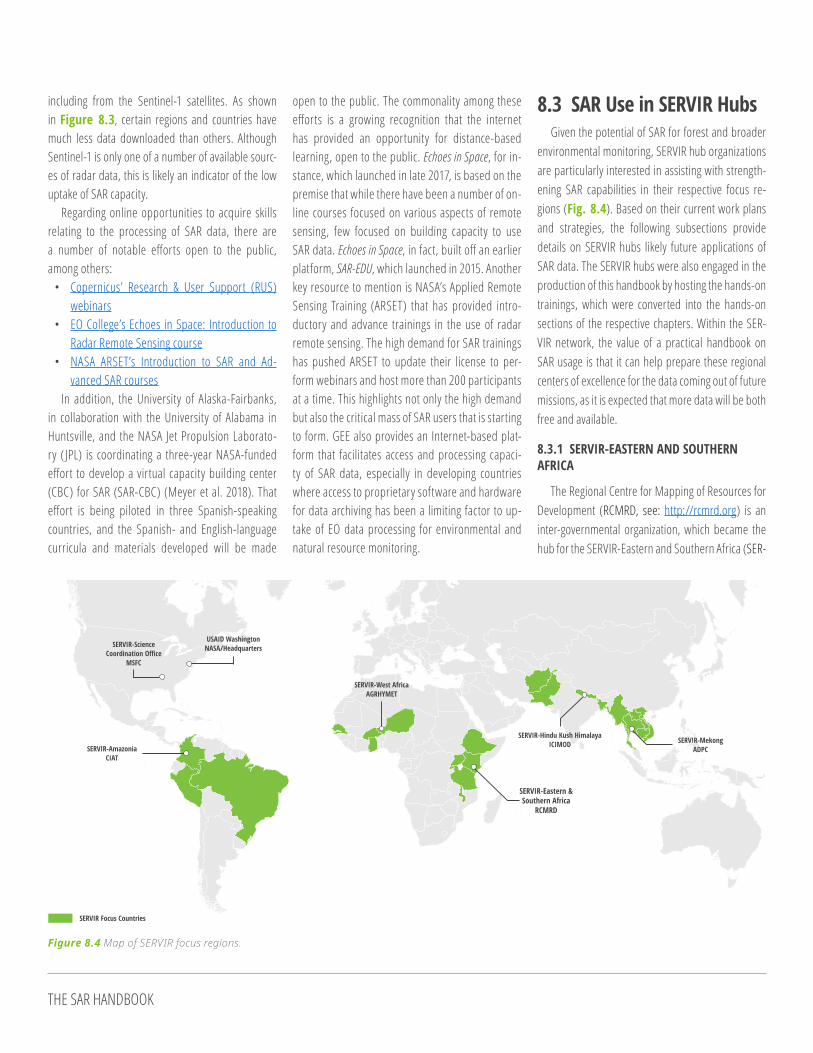
environmental monitoring, SERVIR hub organizations are particularly interested in assisting with strength-ening SAR capabilities in their respective focus re-gions (Fig. 8.4). Based on their current work plans and strategies, the following subsections provide details on SERVIR hubs likely future applications of SAR data. The SERVIR hubs were also engaged in the production of this handbook by hosting the hands-on trainings, which were converted into the hands-on sections of the respective chapters. Within the SER-VIR network, the value of a practical handbook on SAR usage is that it can help prepare these regional centers of excellence for the data coming out of future missions, as it is expected that more data will be both free and available.
8.3.1 SERVIR-EASTERN AND SOUTHERN AFRICA
The Regional Centre for Mapping of Resources for Development (RCMRD, see: http://rcmrd.org) is an inter-governmental organization, which became the hub for the SERVIR-Eastern and Southern Africa (SER-
Figure 8.4 Map of SERVIR focus regions.
SERVIR-ScienceCoordination Office
MSFC
USAID WashingtonNASA/Headquarters
SERVIR-AmazoniaCIAT
SERVIR-West AfricaAGRHYMET
SERVIR-Eastern &Southern Africa
RCMRD
SERVIR-Hindu Kush HimalayaICIMOD SERVIR-Mekong
ADPC
SERVIR Focus Countries
THE SAR HANDBOOK
VIR-E&SA, see http://servir.rcmrd.org) program in 2008. In 2018, RCMRD, hosted the trainings done by Marc Simard and Hans Andersen, focusing on SAR for mangrove monitoring and sampling design, respec-tively. Representatives of RCMRD also participated in the full range of SAR trainings under the SERVIR-Sil-vaCarbon collaboration. That included participation in training workshops on SAR data processing and the application of SAR for forest monitoring, respectively, led by Franz Meyer and Josef Kellndorfer, as well as trainings on the forest height estimation led by Paul Siqueira, and on biomass estimation, led by Sassan Saatchi. RCMRD is especially interested in using SAR for monitoring mangrove forests on the coasts of East Africa. In that context, RCMRD has already started giving training workshops to its member nations in the use of SAR. RCMRD is collaborating with the Ken-ya Forest Service (KFS) and the Kenya Forestry Re-search Institute (KEFRI) to develop their capacities in the use of SAR specifically for forest-related applica-tions. In addition, RCMRD plans to support its mem-ber States as part of its new Strategic Plan 2019–2022 in the capacity-building activities related to the use of SAR for biomass estimation (e.g., Tanzania, Uganda, and Rwanda). Furthermore, RCMRD will engage with universities as part of its Summer School program in order to build capacity in the use of SAR in research.
8.3.2 SERVIR-WEST AFRICA
Since 2016, the Agro-meteorology, Hydrology, and Meteorology regional center (AGRHYMET, see http://agrhymet.cilss.int), a technical arm of the Permanent Interstate Committee for Drought Control in the Sahel (CILSS), has been the lead organization in the SERVIR-West Africa (see http://servir.cilss.int/en/) six-member consortium. In implementing SERVIR-West Africa, AGRHYMET has partnered with the African Center of Meteorological Application for Development (ACMAD), the African Regional Institute for Geospatial Science and Technology (AFRIGIST), the Centre for Remote Sensing and Geographic In-formation Services (CERSGIS), the Centre de Suivi Ecologique (CSE), and the International Crops Re-search Institute for the Semi-Arid Tropics (ICRISAT). Even outside of the context of SERVIR, AGRHYMET has had prior experience working with SAR data.
As part of its involvement in the ESA TIGER initiative focused on monitoring water resources in Africa, AGRHYMET has collaborated with ESA researchers for using ESA SAR imagery for monitoring water bod-ies. Within the SERVIR context, in 2018, AGRHYMET hosted a joint training workshop by Franz Meyer and Josef Kellndorfer on the topics of radar data processing and using SAR to monitor deforestation and forest degradation. SERVIR-West Africa consor-tium members AFRIGIST, CERSGIS, CSE, and ICRISAT also participated in that training. In terms of future activities, and building off the earlier trainings, the SERVIR-West Africa consortium plans to integrate SAR data into its services, particularly those related to landcover change. The forested parts of West Af-rica are particularly susceptible to high cloud cover. Therefore, SAR presents an opportunity to more fre-quently monitor land-use and landcover change. Ad-ditionally, the SERVIR-West Africa consortium plans to apply the various methods of change detection to various land degradation services, such as the char-coal production monitoring service in Ghana, as well as one that focuses on understanding the community level forest changes.
8.3.3 SERVIR-HINDU KUSH HIMALAYA
The International Centre for Integrated Mountain Development (ICIMOD, see: http://www.icimod.org) is an intergovernmental organization, which, since 2010, has been the hub for the SERVIR-Hin-du Kush-Himalaya (SERVIR-HKH, see: http://servir.icimod.org) program. In 2018, ICIMOD hosted two SERVIR/SilvaCarbon-sponsored regional trainings: (1) Franz Meyer and Josef Kellndorfer on SAR for mapping of forest degradation and deforestation, and (2) Sassan Saatchi on SAR for monitoring of for-est carbon stocks and biomass estimation. ICIMOD’s SAR capacity, strengthened through these workshops and trainings, is increasing across several thematic areas. Where ICIMOD collaborates with a number of government agencies of its member countries (Af-ghanistan, Bangladesh, Bhutan, China, India, Myan-mar, Nepal, and Pakistan) in forest monitoring—in-cluding the recent establishment of a Regional Land Cover Monitoring System (RLCMS), leveraged from SERVIR-Mekong—ICIMOD plans to exploit SAR data
for national forest monitoring. While not specifically in the forest domain, ICIMOD has conducted wheat mapping activities in Afghanistan using a combined SAR/Optical approach. Going forward, ICIMOD is col-laborating with Afghanistan’s National Statistics and Information Authority (NSIA)/Central Statistics Orga-nization (CSO) for capacity building regarding appli-cation of SAR data for seasonal wheat area estimation and plan to expand these methodologies for other crops in Bangladesh through a collaboration with the Bangladesh Agriculture Research Council (BARC). Ad-ditionally, building off the successful SERVIR trainings highlighted in this handbook, ICIMOD has committed to facilitate a follow-on workshop (2019) in the re-gion, with global partners, to scope out the next steps in SAR capacity building in the HKH region related to SAR fundamentals, forest monitoring, and biomass estimation.
8.3.4 SERVIR-MEKONG
The Asian Disaster Preparedness Center (ADPC, see http://adpc.net) is an international organization, which, in 2015, became the hub for the SERVIR-Me-kong program (see https://servir.adpc.net), along with consortium members Spatial Informatics Group (SIG), Deltares, and Stockholm Environment Institute (SEI). In 2018, ADPC hosted a training workshop fo-cusing on the use of SAR for evaluating forest struc-ture, led by Paul Siqueira. Representatives of ADPC attended the training workshop hosted at ICIMOD on SAR data processing and the application of SAR for forest monitoring, respectively, led by Franz Meyer and Josef Kellndorfer. ADPC is especially interested in incorporating SAR data into its RLCMS for the Mekong region. Supported by the SilvaCarbon program, ADPC has also begun to provide trainings to its focus coun-tries in the application of SAR for forest monitoring. In FY2019, ADPC plans to explore delivering trainings on the use of SAR data for applications crop-type mapping. In addition, in the upcoming year, SAR will be used for water and water-related disaster applica-tions, SAR-focused trainings, and uptake into other SERVIR-Mekong services.
8.3.5 SERVIR-AMAZONIA
At the time of writing, the SERVIR-Amazonia hub
THE SAR HANDBOOK
was in the process of being established. It is not pos-sible to describe the capabilities or needs of the insti-tutions that will implement SERVIR-Amazonia. Never-theless, the institutions in the region have experience with using SAR data. For instance, in the 1970s, the RADAM Project (Radar of the Amazon) utilized aerial radar surveys to map approximately 8.5 million km2 of the Amazon (Carvalho 1984). That project was ex-tended to the RADMBRASIL project, and the Ministry of Mines and Energy (Geog. Serv. of Brazil) hosted the project’s output data. In more recent years, Colombia’s Institute of Hydrology, Meteorology, and Environmen-tal Studies (IDEAM, in Spanish) has piloted the use of Sentinel-1 data for monitoring changes in forest cov-er. The ongoing (2018–2021) previously mentioned NASA-funded SAR-CBC project is also working with institutions in Colombia and Ecuador to develop their SAR analysis capabilities. Depending on the outcomes of the service planning process involving SERVIR-Am-azonia, given the existing SAR capabilities in South America and cloud cover limitations over the Amazon, it is certainly possible that SERVIR-Amazonia may also focus on strengthening the use of SAR for monitoring the Amazon’s forests.
8.4 Other ConsiderationsHaving previously explored in detail both how SAR
is currently and will likely continue to be used for forest monitoring, it is also useful to reflect on how SAR’s po-tential future contributions to other application areas beyond forest monitoring. It is also useful to examine, to some extent, how SAR data can and will be integrat-ed with other types of remote sensing data, such as multispectral imagery and lidar data.
8.4.1 OTHER APPLICATION AREAS
As indicated in the previous section on the involve-ment of SERVIR hubs in SAR capacity building activities in their regions, those hubs also have interest in the use of radar data for other applications. Those applica-tions include, but are not limited to, the list presented in Table 8.1. The table addresses how the applica-tions relate to GEO’s societal benefit areas (SBAs) and the United Nations’ Sustainable SDGs. It goes without saying that via the “Earth Observations in Service of the 2030 Agenda for Sustainable Development” activity
in GEO’s 2017–2019 Work Programme—an initiative
known as EO4SDG—work is already being done to
highlight how Earth observation data, including SAR,
can be used to support countries’ implementation of
the SDGs. A 2017 report on the EO4SDG initiative like-
wise highlights the relevance of SAR to SDGs 2, 6, 11,
and 15 (GEO 2017).
8.4.2 LIMITATIONS AND INTEGRATION WITH OTHER TYPES OF REMOTELY SENSED DATA
While the preceding chapters have highlighted the potential of SAR data for forest monitoring, an important caveat is that SAR data are not necessarily suited for all forest applications. For instance, one application not highlighted in this handbook—likely
GEO SBA APPLICABLE SDG APPLICATION
Biodiversity & ecosystem sustainability
Life on land Mapping ecosystems, estimating habitat suitability and species richness by ecosystem type
Disasterresilience
Sustainable cities and communities
Estimating elevation for modeling flood susceptibility (disaster mitigation and preparedness)
Mapping flooded areas (disaster response)
Mapping historic flood extents (disaster mitigation and preparedness)
Estimating ground deformation caused by earthquakes and landslides (disaster response)
Energy & mineral resource management
Industry, innovation, and infrastructure
Mapping oil spills
Monitoring reservoir extents and levels
Food security & sustainable agriculture
Zero hunger Crop type identification based on vegetative phenological changes (and surface water for flooded rice) reflected in backscatter changes
Evaluating drought impacts by estimating changes in crop biomass
Start of Season (SoS)-based backscatter signatures of crop emergence
Sustainable urbandevelopment
Sustainable cities and communities
Mapping urban expansion
Monitoring subsidence due to development
Water resource management
Clean water and sanitation Mapping changes in water body extent over time
Table 8.1 Other uses for SAR data, and how they relate to GEO’s SBAs and the SDGs.
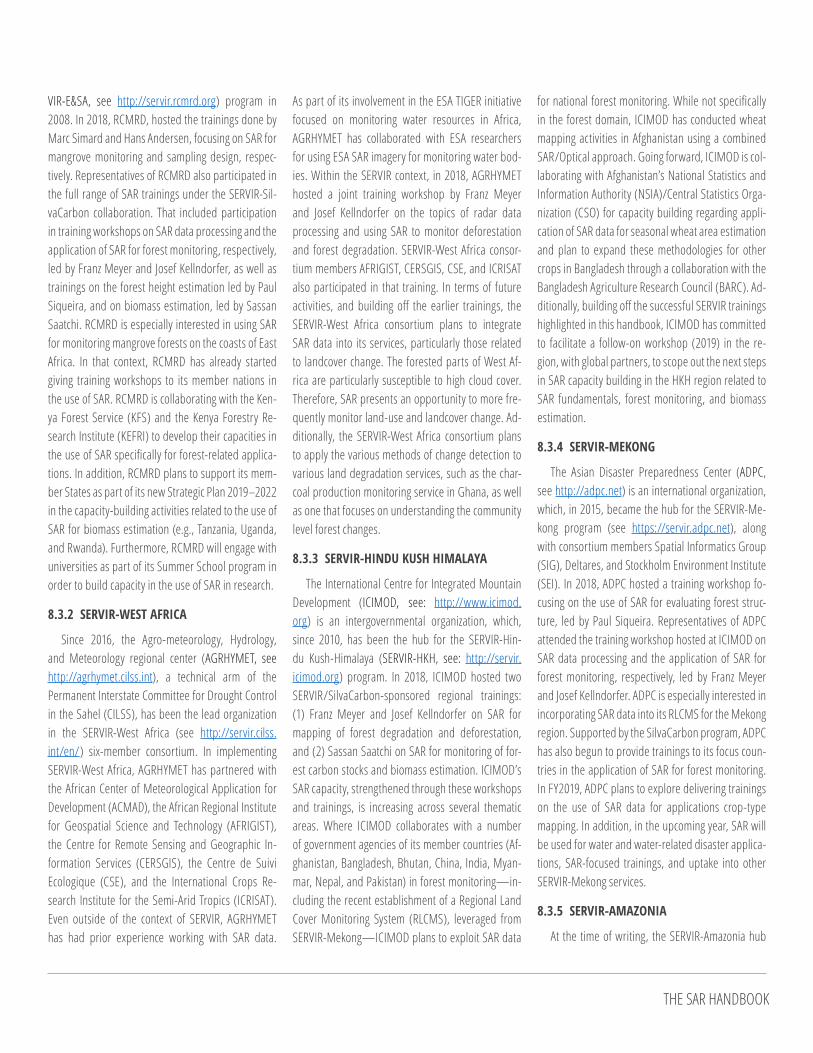
Figure 8.5 Contrast between polarimetric ALOS PALSAR data (left) and Landsat multispectral imagery (right) of French Guiana (Cherrington 2016).
THE SAR HANDBOOK
because of the level of difficulty—is the use of SAR imagery for distinguishing forest types as defined by unique tree communities. As an example, from Fig-ure 8.5, it is apparent that various forest formations (e.g., montane forests) are visible in multispectral optical data, but do not show strong contrasts with other forest types in polarimetric SAR imagery. And in recognizing that limitation, it must be recalled that while L-band SAR data (such as the data dis-played) are sensitive to ecosystem structure, the multispectral imagery, in contrast, will be sensitive to factors which vary even more greatly than struc-ture, such as variable combinations of leaf spectral properties, leaf area index, leaf angle distributions, among others (Gastellu-Etchegorry et al. 2015). This emphasizes previously raised points about the value of complementing SAR data with other data types such as optical and lidar data.
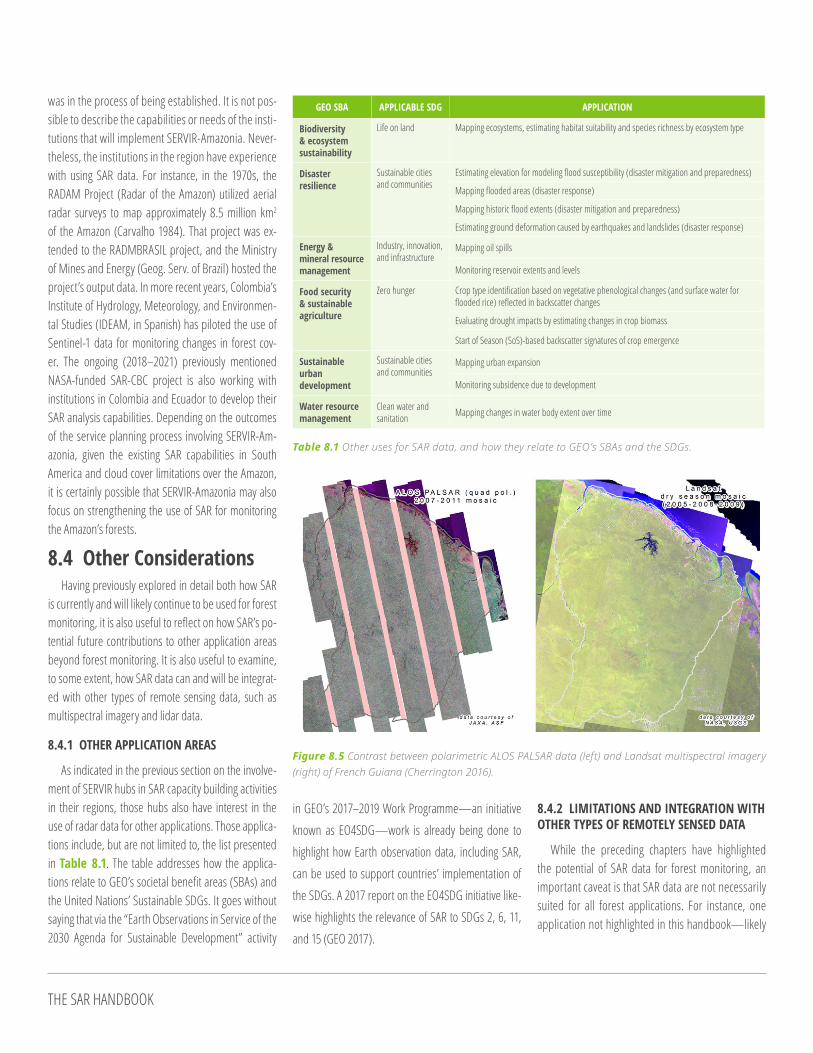
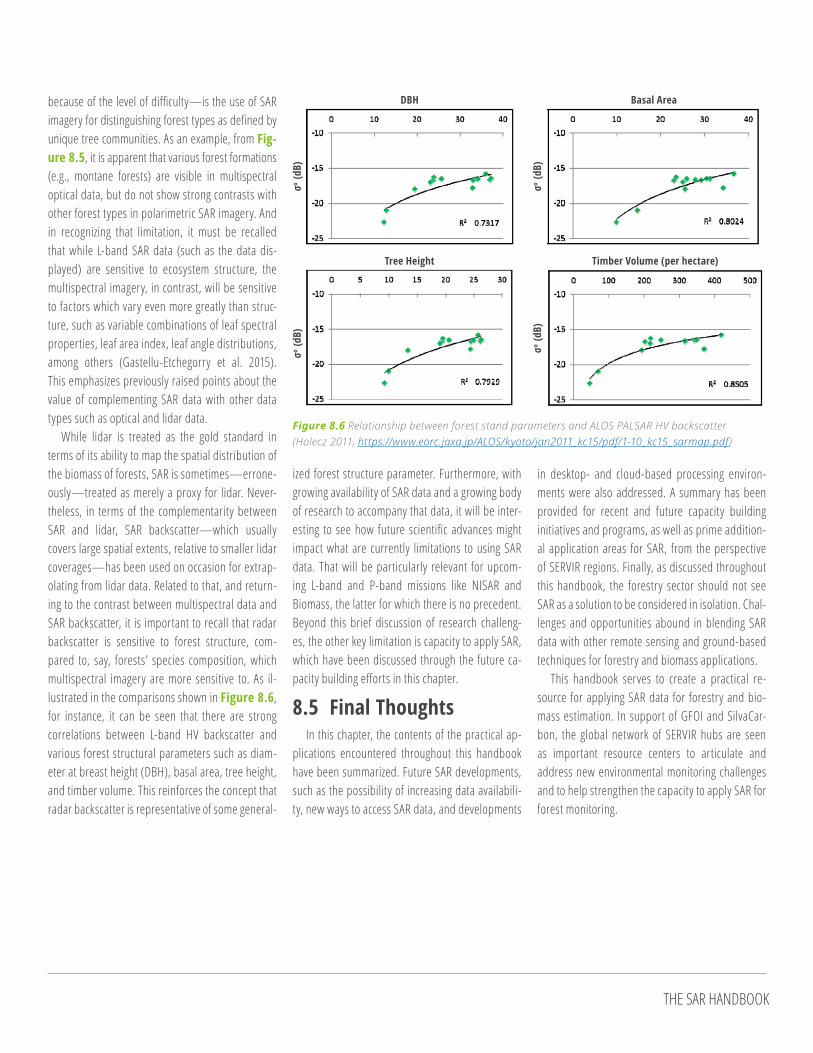
While lidar is treated as the gold standard in terms of its ability to map the spatial distribution of the biomass of forests, SAR is sometimes—errone-ously—treated as merely a proxy for lidar. Never-theless, in terms of the complementarity between SAR and lidar, SAR backscatter—which usually covers large spatial extents, relative to smaller lidar coverages—has been used on occasion for extrap-olating from lidar data. Related to that, and return-ing to the contrast between multispectral data and SAR backscatter, it is important to recall that radar backscatter is sensitive to forest structure, com-pared to, say, forests’ species composition, which multispectral imagery are more sensitive to. As il-lustrated in the comparisons shown in Figure 8.6, for instance, it can be seen that there are strong correlations between L-band HV backscatter and various forest structural parameters such as diam-eter at breast height (DBH), basal area, tree height, and timber volume. This reinforces the concept that radar backscatter is representative of some general-
ized forest structure parameter. Furthermore, with growing availability of SAR data and a growing body of research to accompany that data, it will be inter-esting to see how future scientific advances might impact what are currently limitations to using SAR data. That will be particularly relevant for upcom-ing L-band and P-band missions like NISAR and Biomass, the latter for which there is no precedent. Beyond this brief discussion of research challeng-es, the other key limitation is capacity to apply SAR, which have been discussed through the future ca-pacity building efforts in this chapter.
8.5 Final ThoughtsIn this chapter, the contents of the practical ap-
plications encountered throughout this handbook have been summarized. Future SAR developments, such as the possibility of increasing data availabili-ty, new ways to access SAR data, and developments
Figure 8.6 Relationship between forest stand parameters and ALOS PALSAR HV backscatter (Holecz 2011, https://www.eorc.jaxa.jp/ALOS/kyoto/jan2011_kc15/pdf/1-10_kc15_sarmap.pdf )
σo (d
B)σo
(dB)
DBH Basal Area
Tree Height Timber Volume (per hectare)
σo (d
B)σo
(dB)
in desktop- and cloud-based processing environ-ments were also addressed. A summary has been provided for recent and future capacity building initiatives and programs, as well as prime addition-al application areas for SAR, from the perspective of SERVIR regions. Finally, as discussed throughout this handbook, the forestry sector should not see SAR as a solution to be considered in isolation. Chal-lenges and opportunities abound in blending SAR data with other remote sensing and ground-based techniques for forestry and biomass applications.
This handbook serves to create a practical re-source for applying SAR data for forestry and bio-mass estimation. In support of GFOI and SilvaCar-bon, the global network of SERVIR hubs are seen as important resource centers to articulate and address new environmental monitoring challenges and to help strengthen the capacity to apply SAR for forest monitoring.
THE SAR HANDBOOK
8.6 ReferencesAAsian Disaster Preparedness Center (ADPC). 2018. SERVIR-Mekong Annual Work Plan, FY 2019.
Bangkok, Thailand. 59 pp.
Albinet, C., Whitehurst, A.S., Laur, H., Murphy, K.J., Frommknecht, B., Scipal, K., Mitchell, A.E., Jai, B., Ramachandran, R. and Lavalle, M., 2018. ESA-NASA multi-Mission Analysis Platform for improving global aboveground terrestrial carbon dynamics. European Geophysical Union 2018. https://meetingorganizer.copernicus.org/EGU2018/EGU2018-6626.pdf
Belgiu, M., and Dragut, L., 2016. Random forest in remote sensing: A review of applications and future directions. ISPRS Journal of Photogrammetry and Remote Sensing, 114: 24-31. http://dx.doi.org/10.1016/j.isprsjprs.2016.01.011
Blumenfield, J., 2018. “Getting Ready for NISAR—and for Managing Big Data using the Commer-cial Cloud.” NASA Earthdata / EOSDIS. Accessed 17 Dec 2018. https://earthdata.nasa.gov/getting-ready-for-nisar
Carvalho, J.C.M. 1984. The conservation of nature in the Brazilian Amazonia. In: Sioli, H. (Ed.) The Amazon: limnology and landscape ecology of a mighty tropical river and its basin. pp. 707-736. Dr. W. Junk Publishers, Dordrecht, Holland.
Chen, L., Ren, C., Zhang, B., Wang, Z., and Xi, Y., 2018. Estimation of Forest Above-Ground Bio-mass by Geographically Weighted Regression and Machine Learning with Sentinel Imagery. Remote Sensing 9(10) 582. https://doi.org/10.3390/f9100582
Cherrington, E.A. 2016. Towards ecologically consistent remote sensing mapping of tree com-munities in French Guiana: Are forest types identifiable from spatio-temporal canopy reflectance patterns? PhD dissertation. AgroParisTech / Technische Universität Dresden. 142 pp. https://tel.archives-ouvertes.fr/tel-01486533
Gastellu-Etchegorry J.P., Yin T., Lauret N., Cajgfinger T., Gregoire T., Grau E., Feret J.B. 2015. Discrete Anisotropic Radiative Transfer (DART 5) for Modeling Airborne and Satellite Spectroradiometer and LIDAR Acquisitions of Natural and Urban Landscapes. Remote Sensing, 7 (2): 1667–1701. doi:10.3390/rs70201667.
Group on Earth Observations (GEO). 2017. Earth Observations in support of the 2030 Agenda for Sustainable Development. GEO / EO4SDG initiative. 34 pp. https://www.earthobserva-tions.org/documents/publications/201703_geo_eo_for_2030_agenda.pdf
Geological Service of Brazil. http://www.cprm.gov.br. Accessed November 2018.
Gorelick N., Hancher M., Dixon M., Ilyushenko S., Thau D., Moore R. 2017. Google Earth Engine: Planetary-scale geospatial analysis for everyone. Remote Sensing of Environment, 202: 18-27.
Hird J.N., DeLancey E.R., McDermid G.J., Kariyeva J. 2017. Google Earth Engine, Open-Access Satellite Data, and Machine Learning in Support of Large-Area Probabilistic Wetland Mapping. Remote Sensing, 9: doi: 10.3390/rs9121315
Holecz, F. 2011. Product Delivery Report for K7C Phase 2. Kyoto & Carbon Initiative, Science Team Meeting # 15. PowerPoint presentation. 15 pp. https://www.eorc.jaxa.jp/ALOS/kyoto/jan2011_kc15/pdf/1-10_kc15_sarmap.pdf
International Centre for Integrated Mountain Development (ICIMOD). 2018. SERVIR-Hindu Kush Himalaya Annual Work Plan: FY 2019. Cooperative Agreement Number: AID-EGEE-IO-15-00002. Kathmandu, Nepal. 70 pp.
Lillesand T., Kiefer R., Chipman J. 2011. Remote Sensing and Image Interpretation. 6th Edition. Wiley India. ISBN-13: 978-8126532230.
Meyer, F., Anderson, E., Flores Cordova, A., Cherrington, E., Griffin, R., Rosen, P., Owen S., Arko, S., Galindo Garcia, G., Mayorga Torres, T., and Limaye, A. 2018. A Capacity Building Center for the Use of SAR in Decision Making. American Geophysical Union Fall Meeting 2018. Washington, DC.
Ndikumana E., Ho Tong Minh D., Baghdadi N., et al. 2018. Deep Recurrent Neural Network for Agricultural Classification using multitemporal SAR Sentinel-1 for Camargue, France. Remote Sensing, 10: doi: 10.3390/rs10081217.
Regional Centre of Mapping of Resources for Development (RCMRD). 2018. SERVIR-Eastern and Southern Africa Annual Work Plan: FY 2019. Cooperative Agreement Number: AID-EGEE-IO-15-00002. Nairobi, Kenya. 63 pp.
Rosen, P.A., Gurrola, E.M., Agram, P., Cohen, J., Lavalle, M., Riel, B.V., Fattahi, H., Aivazis, M.A.G., Simons, M., and Buckley, S.M. 2018. The InSAR Scientific Computing Environment 3.0: A Flexible Framework for NISAR Operational and User-Led Science Processing. In: 2018 IEEE International Geoscience and Remote Sensing Symposium (IGARSS 2018). IEEE, Piscataway, NJ, pp. 4897-4900. ISBN 978-1-5386-7150-4.http://resolver.caltech.edu/CaltechAUTHORS:20181108-155745164
SERCO. 2018. Sentinel Data Access 2017 Annual Report. Technical report to the European Space Agency. COPE-SERCO-RP-17-0186. 96 pp.
https://scihub.copernicus.eu/twiki/pub/SciHubWebPortal/AnnualReport2017/COPE-SERCO-RP-17-0186_-_Sentinel_Data_Access_Annual_Report_2017-Final_v1.4.1.pdf
Shelestov A., Lavreniuk M., Kussul N., et al. 2017. Exploring Google Earth Engine Platform for Big Data Processing: Classification of Multi-Temporal Satellite Imagery for Crop Mapping. Frontiers in Earth Science, 5:17. doi: 10.3389/feart.2017.00017
Tetra Tech. 2018. SERVIR West Africa Annual Work Plan: Fiscal Year 2019. Contract No. AID-OAA-I-13-00058, Task Order No: AID-624-TO-16-00001. Washington, DC. 112 pp.
Woodhouse, I. 2005. Introduction to Microwave Remote Sensing. Boca Raton: CRC Press. ISBN-13: 978-0415271233. 400 pp. https://doi.org/10.1201/9781315272573

THE SAR HANDBOOK
Cherrington, Emil, Africa Flores-Anderson, Rajesh Bahadur Thapa, Kelsey E. Herndon, Anastasia Wahome, Phoebe Oduor, Kenneth Mubea, Edward Ouko, Nguyen Hanh Quyen, David Saah, Mamane Bako, Paul Bartel, Foster Mensah, Stella Ofori-Ampofo, Eric Anderson, Emily Adams, Rebekke Muench, Amanda Markert, Andrea Nicolau, W. Lee Ellenburg, Kel Markert, Betzy Hernandez Sandoval, Ashutosh Limaye, Robert Griffin, Daniel Irwin. “Perspectives on the Future Application of SAR in Forest and Environmental Monitoring.” SAR Handbook: Comprehensive Methodologies for Forest Monitoring and Biomass Estimation. Eds. Flores, A., Herndon, K., Thapa, R., Cherrington, E. NASA 2019. DOI: 10.25966/p7xd-0a19
We would like to acknowledge the support of various individuals and institutions without whom this work would not have been completed. We acknowledge Dr. Nancy Searby, Program Manager for NASA’s Applied Sciences Capacity Building program, who was part of the inspiration for this work. We would also like to thank the U.S. Agency for International Development (USAID) for their support, particularly through the SilvaCarbon partnership. We would like to thank Dr. Juliann Aukema for her stewardship of SilvaCarbon activities on behalf of USAID, as well as Jenny Frankel-Reed, SERVIR Chief of Party at USAID, and Drs. Kevin Coffey and Pete Epanchin. Extreme gratitude is also owed to Sylvia Wilson, the technical lead for SilvaCarbon at the U.S. Geological Survey (USGS), who has worked to ensure that forest monitoring capacity is developed across the globe. We also extend our gratitude to the respective Chiefs-of-Party of the four SERVIR Hubs involved in this effort, namely Dr. Robinson Mugo of the Regional Centre for Mapping of Resources for Development (RCMRD), Birendra Bajracharya of the International Centre for Integrated Mountain Development (ICIMOD), Dr. Peer-anan Towashiraporn of the Asian Disaster Preparedness Center (ADPC), Marc Dawson of TetraTech/SERVIR-West Africa, and Issifou Alfari of the Agro-meteorology, Hydrology, and Meteorology Center (AGRHYMET) regional center/SERVIR-West Africa. The respective Agreement Officer Representatives and Contracts Officer Representatives for the various USAID regional offices, namely Chihenyo Kanga-ra, Karl Wurster, Dr. Gary Jahn, and Margaret McMorrow, should also be acknowledged.