chapter 7
TRANSCRIPT

Capital Asset Pricing and
Arbitrage Pricing Theory
Chapter 7

The Capital Asset Pricing Model
Equating the CML with the efficient frontier at M and solving for E(Ri) yields:
RFR)-(RRFR)E(R Mi i
For a complete derivation of the CAPM pls see:
http://e.viaminvest.com/A2MonitorSystems/AppA2MonitorSystems/A
ppBtoA2CAP_model/CAP_Model.asp#_ftn1

Assumptions
Individual investors can borrow or lend money at the
risk-free rate of return
Investors are rational mean-variance optimizers
Homogeneous expectations
Single-period investment horizon
Investments are limited to traded financial assets
Information is costless and available to all investors
No taxes, and transaction costs

Security Market Line
)E(R i
)Beta(Cov 2Mim/0.1
mR
SML
0
Negative
Beta
RFR

Plot of Estimated Returns
on SML Graph)E(R i
Beta0.1
mRSML
0 .20 .40 .60 .80 1.20 1.40 1.60 1.80-.40 -.20
.22
.20
.18
.16
.14
.12
Rm
.10
.08
.06
.04
.02
A
B
C
D
E

Inputs to the CAPM
(a) the current risk-free rate
(b) the expected return on the market
index and
(c) the beta of the asset being analyzed

Riskfree Rate & Time Horizon
For an investment to be riskfree, i.e., to have an actual return be equal to the expected return, two conditions have to be met – There has to be no default risk, which generally
implies that the security has to be issued by the government. Note, however, that not all governments can be viewed as default free.
There can be no uncertainty about reinvestment rates, which implies that it is a zero coupon security with the same maturity as the cash flow being analyzed.

http://www.ustreas.gov/offices/domestic-finance/debt-management/interest-rate/yield.shtml

Measurement of the risk premium
The risk premium is the premium that
investors demand for investing in an average
risk investment, relative to the riskfree rate.
As a general proposition, this premium should
be
greater than zero
increase with the risk aversion of the investors in
that market
increase with the riskiness of the “average” risk
investment

Estimating Risk Premiums in
Practice
Survey investors on their desired risk premiums and use the average premium from these surveys.
Assume that the actual premium delivered over long time periods is equal to the expected premium - i.e., use historical data
Estimate the implied premium in today’s asset prices.

The Survey Approach
Surveying all investors in a market place is impractical. However, you can survey a few investors (especially the larger investors) and use these results. In practice, this translates into surveys of money managers’ expectations of expected returns on stocks over the next year.
The limitations of this approach are: there are no constraints on reasonability (the survey could
produce negative risk premiums or risk premiums of 50%)
they are extremely volatile
they tend to be short term; even the longest surveys do not go beyond one year

The Historical Premium Approach
This is the default approach used by most to arrive at the premium to use in the model
In most cases, this approach does the following it defines a time period for the estimation (1926-Present, 1962-
Present....)
it calculates average returns on a stock index during the period it calculates average returns on a riskless security over the period
it calculates the difference between the two and uses it as a premium looking forward
The limitations of this approach are: it assumes that the risk aversion of investors has not changed in a
systematic way across time. (The risk aversion may change from year to year, but it reverts back to historical averages)
it assumes that the riskiness of the “risky” portfolio (stock index) has not changed in a systematic way across time.

Historical Average Premiums for the
United States
Historical period Stocks - T.Bills Stocks - T.Bonds
Arith. Geom Arith Geom
1926-2003 7.92% 5.50% 6.54% 4.82%
1962-2003 6.09% 4.85% 4.70% 3.82%
1992-2003 8.43% 6.68% 4.87% 3.57%
What is the right premium?

What about historical premiums for
other Markets?
Historical data for markets outside the United States tends to be unreliable.
Ibbotson, for instance, estimates the following premiums for major markets from 1970-1990
Country Period Stocks Bonds Risk Premium
Australia 1970-90 9.60% 7.35% 2.25%
Canada 1970-90 10.50% 7.41% 3.09%
France 1970-90 11.90% 7.68% 4.22%
Germany 1970-90 7.40% 6.81% 0.59%
Italy 1970-90 9.40% 9.06% 0.34%
Japan 1970-90 13.70% 6.96% 6.74%
Netherlands 1970-90 11.20% 6.87% 4.33%
Switzerland 1970-90 5.30% 4.10% 1.20%
UK 1970-90 14.70% 8.45% 6.25%

Implied Equity Risk Premiums
If we use a basic discounted cash flow model, we can estimate the implied risk premium from the current level of stock prices.
For instance, if stock prices are determined by the simple Gordon Growth Model:
Value = Expected Dividends next year/ (Required Returns on Stocks - Expected Growth Rate)
Plugging in the current level of the index, the dividends on the index and expected growth rate will yield a “implied” expected return on stocks.
Subtracting out the riskfree rate will yield the implied premium.
The problems with this approach are:
the discounted cash flow model used to value the stock index has to be the right one.
the inputs on dividends and expected growth have to be correct
it implicitly assumes that the market is currently correctly valued

S&P 500 Implied Equity Premium
Current level – 1052
5 yr ave dividend yield 5.48%
Dividend growth rate 4.5%
1052 = 57.65(1.045)
Ke - .045
Ke = 10.23%
Risk premium – 10.23% - 3.5% = 6.73%
http://www.wstreet.com/investing/stocks/18204_is_the_standard_and_poors_500_running_out_of_stream.html

Implied Premiums in the US

Estimating Beta
The standard procedure for estimating betas is
to regress stock returns (Rj) against market
returns (Rm) -
Rj = a + b Rm
where a is the intercept and b is the slope of the
regression.
The slope of the regression corresponds to the
beta of the stock, and measures the relative
volatility of the stock to the market.

Firm Specific and Market Risk
The R squared (R2) of the regression
provides an estimate of the proportion of
the risk (variance) of a firm that can be
attributed to market risk;
The balance (1 - R2) can be attributed to
firm specific risk.

Setting up for the Estimation
Decide on an estimation period Services use periods ranging from 2 to 5 years for the regression
Longer estimation period provides more data, but firms change.
Shorter periods can be affected more easily by significant firm-specific event that occurred during the period
Decide on a return interval - daily, weekly, monthly
Shorter intervals yield more observations, but suffer from more noise.
Noise is created by stocks not trading and biases all betas towards one.
Estimate returns (including dividends) on stock Return = (PriceEnd – PriceBeginning + DividendsPeriod)/ PriceBeginning
Included dividends only in ex-dividend month
Choose a market index, and estimate returns (inclusive of dividends) on the index for each interval for the period.

Choosing the Parameters: Disney
Period used: 5 years
Return Interval = Monthly
Market Index: S&P 500 Index.
For instance, to calculate returns on Disney Price for Disney at end of March = $ 37.87 Price for Disney at end of April = $ 36.42
Dividends during month = $0.05 (It was an ex-dividend month)
Return =($36.42 - $ 37.87 + $ 0.05)/$ 37.87=-3.69%
To estimate returns on the index in the same month Index level (including dividends) at end of March = 404.35
Index level (including dividends) at end of April = 415.53
Return =(415.53 - 404.35)/ 404.35 = 2.76%

Disney’s Historical Beta

The Regression Output
ReturnsDisney = -0.01% + 1.40 ReturnsS & P 500
(0.27)
(R squared=32.41%)
Intercept = -0.01%
Slope = 1.40

Estimating Disney’s Beta
Slope of the Regression of 1.40 is the beta
Regression parameters are always estimated with noise. The noise is captured in the standard error of the beta estimate, which in the case of Disney is 0.27.
Assume that I asked you what Disney’s true beta is, after this regression. What is your best point estimate?
What range would you give me, with 67% confidence?
What range would you give me, with 95% confidence?

Standard Errors for US Stocks

Breaking Down Disney’s Risk
R Squared = 32%
This implies that
32% of the risk at Disney comes from
market sources
68%, therefore, comes from firm-specific
sources
The firm-specific risk is diversifiable and will
not be rewarded

The Relevance of R Squared
You are a diversified investor trying to decide whether you should invest in Disney or Amgen. They both have betas of 1.35, but Disney has an R Squared of 32% while Amgen’s R squared of only 15%. Which one would you invest in:
Amgen, because it has the lower R squared
Disney, because it has the higher R squared
You would be indifferent

The Relevance of R Squared…
I would be indifferent, because they have
the same beta
I am well diversified, and thus can
eliminate all firm-specific risk. If I were
not, I would have picked Disney, since it
has less firm-specific risk.

Estimating Expected Returns
Disney’s Beta = 1.40
Riskfree Rate = 3.50% (Long term
Government Bond rate)
Risk Premium = 7% (Implied)
Expected Return = 3.5% + 1.40 (7%) =
13.3%

Use to a Potential Investor in Disney
As a potential investor in Disney, what does this expected return of 13.30% tell you? This is the return that I can expect to make in the long term on
Disney, if the stock is correctly priced and the CAPM is the right model for risk,
This is the return that I need to make on Disney in the long term to break even on my investment in the stock
Both
Assume now that you are an active investor and that your research suggests that an investment in Disney will yield 25% a year for the next 5 years. Based upon the expected return of 14.70%, you would Buy the stock
Sell the stock

Arbitrage Pricing Theory
•Developed as an alternative to the CAPM
•Reasonably intuitive
•Required limited assumptions
•Allowed for multiple dimensions of
investment risk

Arbitrage Pricing Theory
Based on the Law of One Price
Since two otherwise identical assets cannot sell at different prices, equilibrium prices adjust to eliminate all arbitrage opportunities
Arbitrage opportunity
arises if an investor can construct a zero investment portfolio with no risk, but with a positive profit
Since no investment is required, an investor can create large positions in long and short to secure large levels of profits
In an efficient market, profitable arbitrage opportunities will quickly disappear

APT Model
APT assumes returns generated by a factor model
Factor Characteristics
Each risk factor must have a pervasive influence on
stock returns
Risk factors must have nonzero prices
Risk factors must be unpredictable to the market
The expected return-risk relationship for the APT:
E(Ri) = RF + bi1 (risk premium for factor 1)
+ bi2 (risk premium for factor 2)
+ ... + bin (risk premium for factor n)

APT and CAPM Compared
APT applies to well diversified portfolios, and not
necessarily to individual stocks
With APT, it is possible for some individual stocks to
be mispriced - not lie on the SML
APT is more general in that it gets to an expected
return and beta relationship without the assumption of
the market portfolio
Unlike CAPM, APT does not assume mean-variance
decisions, riskless borrowing or lending, and
existence of a market portfolio
APT can be extended to multifactor models

Arbitrage Pricing Theory (APT)
where:
= the expected return on an asset with zero
systematic risk where
ikkiii bbbRE ...)( 22110
0
1 = the risk premium related to the common jth
factor
bij = the pricing relationship between the risk premium and asset -
that is how responsive asset i is to jth common factor
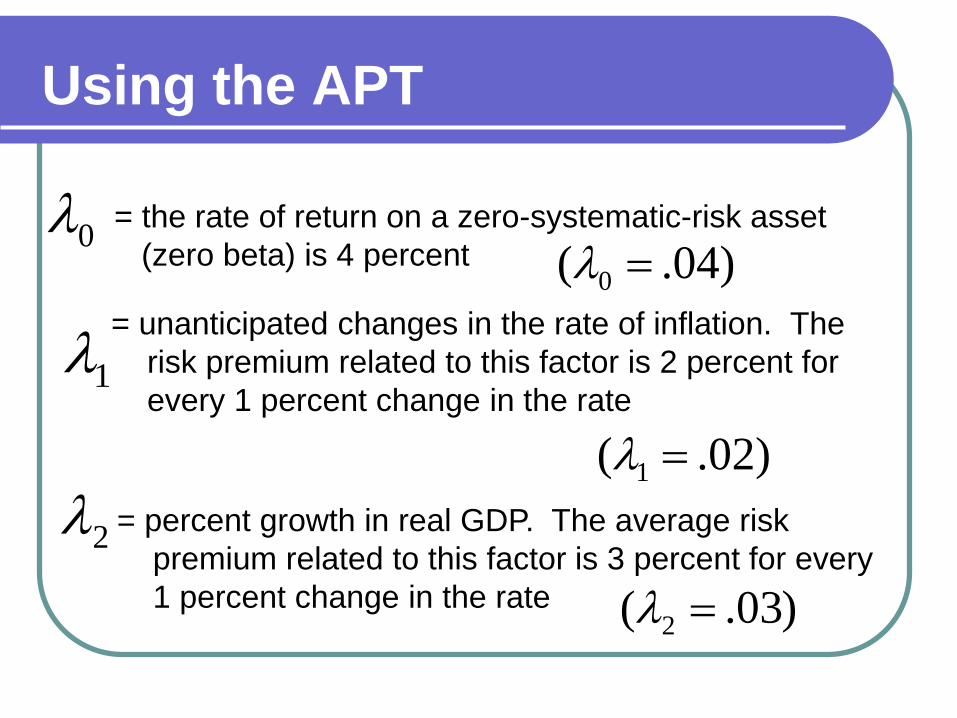
Using the APT
= unanticipated changes in the rate of inflation. The
risk premium related to this factor is 2 percent for
every 1 percent change in the rate1
)02.( 1
= percent growth in real GDP. The average risk
premium related to this factor is 3 percent for every
1 percent change in the rate
= the rate of return on a zero-systematic-risk asset
(zero beta) is 4 percent
2
)03.( 2
)04.( 0 0

Using the APT
= the response of asset X to changes in the inflation
factor is 0.501xb
)50.( 1 xb
= the response of asset Y to changes in the inflation
factor is 2.00 )00.2( 1 yb1yb
= the response of asset X to changes in the GDP
factor is 1.50
= the response of asset Y to changes in the GDP
factor is 1.75
2xb
2yb
)50.1( 2 xb
)75.1( 2 yb

Using the APT
= .04 + (.02)bi1 + (.03)bi2
E(Rx) = .04 + (.02)(0.50) + (.03)(1.50)
= .095 = 9.5%
E(Ry) = .04 + (.02)(2.00) + (.03)(1.75)
= .1325 = 13.25%
22110)( iii bbRE

Security Valuation with the APT:
An Example
Three stocks (A, B, C) and two common
systematic risk factors have the following
relationship( )0 0
21
21
21
)5.0()8.1()(
)3.1()2.0()(
)9.0()8.0()(
C
B
A
RE
RE
RE
%7.9)(
%7.5)(
%7.7)(
C
B
A
RE
RE
RE
%5 and %4 21 if
40.38$%)7.91(35$)(
00.37$%)7.51(35$)(
70.37$%)7.71(35$)(
C
B
A
PE
PE
PE
Currently priced at $35 each and will
not pay dividend
Expected prices a year from now
Your estimates a year from now (you
are sure!) E(PA) = $37.20
E(PB) = $37.80
E(PC) = $38.50

Security Valuation with the APT:
An Example
Riskless arbitrage
Requires no net wealth invested initially
Will bear no systematic or unsystematic risk but
Still earns a profit
Condition must be satisfied as follow:
1.
2
3
0i iw
0 iji ibw
0 ii iRw i.e. actual portfolio return is positive
For all K factors [i.e. no systematic risk] and w is small
for all I [ unsystematic risk is fully diversified]
i.e. no net wealth invested
Wi the percentage investment in security i

Security Valuation with the APT:
An Example
Example: Stock A is overvalued; Stock B and C are two
undervalued securities
Consider the following investment proportions WA=-1.0
WB=+0.5
WC=+0.5
These investment weight imply the creation of a portfolio that is short two shares of Stock A for each share of Stock B and one share of Stock C held long

Security Valuation with the APT:
An Example
Net Initial Investment:
Short 2 shares of A: +70
Purchase 1 share of B: -35
Purchase 1 share of C: -35
Net investment: 0
Net Exposure to Risk Factors:
Factor 1 Factor 2
Weighted exposure from Stock A: (-1.0)(0.8) (-1.0)(0.9)
Weighted exposure from Stock B: (0.5)(-0.2) (0.5)(1.3)
Weighted exposure from Stock C: (0.5)(1.8) (0.5)(0.5)
Net risk exposure 0 0
Net Profit:
Stock A Stock B Stock C
[2(35)-2(37.20)]+[37.80-35]+[38.50-35] =$1.90

Security Valuation with the APT:
An Example
The price of stock A will be bid down while the prices of stock B and C will be bid up until arbitrage trading in the current market is no long profitable.
10.35097.1/40.38$
76.35$057.1/00.37$
54.34$077.1/20.37$
C
B
A
P
P
P

Microeconomic-Based Risk
Factor Models (Fama-French)
The Fama-French Three Factor Model
ittititmtiitit eHMLbSMBbRFRRbaRFRR 321 )()(
SMB (i.e. small minus big) is the return to a portfolio of small
capitalization stocks less the return to a portfolio of large
capitalization stocks
HML (i.e. high minus low) is the return to a portfolio of stocks with
high ratios of book-to-market values less the return to a portfolio of
low book-to-market value stocks

Summary
APT model has fewer assumptions than the
CAPM and does not specifically require the
designation of a market portfolio.
The APT posits that expected security returns
are related in a linear fashion to multiple
common risk factors.
Unfortunately, the theory does not offer
guidance as to how many factors exist or what
their identifies might be

Summary
APT is difficult to put into practice in a theoretically rigorous fashion. Multifactor models of risk and return attempt to bridge the gap between the practice and theory by specifying a set of variables.
Macroeconomic variables have been successfully applied
An equally successful second approach to identifying the risk exposures in a multifactor model has focused on the characteristics of securities themselves. (Microeconomic approach)