chapter 5 - surveys - the university of north carolina at ...pmeyer/book/chapter5.doc · web...
TRANSCRIPT

Chapter 5 - SurveysSometimes your data analysis skills will be applied to data that have been
collected by others, government agencies, for example. At other times you will have to
collect it yourself. The most widely used method is survey research, more popularly
known as public opinion polling (although many applications involve special populations
rather than the general public). A survey has the following elements:
1. An information goal or set of goals.
2. A sample.
3. A questionnaire.
4. A collection method (personal interview, telephone interview, self-
administered questionnaire).
5. Coding and analysis.
Getting to an information goal was discussed in chapter 1. This chapter is about
the mechanics of getting to that goal by the survey method.
SAMPLINGGeneral principles
The kind of sample you draw depends, of course, on the method of data
collection. If you are going to do it by mail, you need a sample that includes addresses. If
by phone, you need phone numbers. If in person and at home, you can get by without
either of these, at least in the opening stages. You will probably use instead the census
count of housing units.
Regardless of the method, the basic statistical rule of sampling still applies:
Each member of the population to which you wish to generalize must have a
known chance of being included in the sample.
The simplest way to achieve this goal is to give each member of the population an
equal chance of inclusion. It needs to get more complicated than that only if you wish to
oversample some minority segment. The purpose of oversampling is to make certain that
you will have enough to allow you to generalize to that minority. For a study on race
relations, for example, you might want equal numbers of minorities and nonminorities,

even though the minorities are only 15 percent of the population. You can do that and
still generalize to the population as a whole if you weight your oversample down to its
proportionate size in the analysis. That is simpler than it sounds. Three lines of SAS or
SPSS code are all it takes to do that trick. Here's an SPSS example:
WTVAR=1.
IF (RACE NE 1) WTVAR = .3.
WEIGHT BY WTVAR.
The first line creates a weighting variable for every case and initializes it at 1. The
second causes the computer to check each case to see if it is a minority. If it is, its
WTVAR is changed to .3. The third line weights the data.
For now, however, we'll consider only equal probability samples. It is easy to
think of ways to do it in theory. If you want a representative sample of adults in your
home town, just write all their names on little pieces of paper, put the slips of paper in a
steel drum, stir them up, and draw out the needed number. If you live in a small enough
town, that might actually work. But most populations are too big and complex. So
samples are usually drawn in stages on the basis of existing records.
Telephone samplesOne of the big advantages of telephone surveys is that the existing records make it
quite convenient. Let's start with the simplest kind of telephone sample, one drawn
directly from the phone book.
1. Cut the back off a telephone book so that it becomes a stack of loose pages.
2. Prepare a piece of cardboard (the kind the laundry wraps shirts around will do
nicely) by cutting it to the size of the page and making four or five holes sized and shaped
so that each exposes one name and number.
3. Decide how many calls you need to attempt to get the desired number. Divide
the total by the number of holes in the cardboard. Call that number n, the number of
pages you will need.
4. Divide the number of pages in the phone book by n. The result is i, the interval
or number of pages you have to skip between sample pages.
5. Start at a random page between 1 and i. Slap the cardboard over it and hit the
exposed numbers with a highlighter pen. Repeat the procedure with every ith page.
What if you land on a business number? Many cities have business and residential
numbers segregated in their phone books. If yours doesn't, you will have to increase your
draw so that you can throw away the business numbers and still have enough. The total
number you draw will depend a good deal on the characteristics of your town, and so
some experience will help. But a draw of twice the number you hope to complete is a
reasonable start. Some of the people in the book will have died or moved away, some will
not be at home when you call, and some will refuse to be interviewed.
As easy as this sounds, it still includes only one stage of the sample. Drawing a
phone number gets you to a household, but more than one member of your target
population may share that number. You need a way to randomly choose a person within
the household. The equal-probability rule is still your best guide. Several methods have
been devised that require you to ask the person who answers the phone to list all the
eligible respondents, e.g., persons 18 and older, at that number. Then, using some random
device, you choose one and ask to speak to that person. A simpler way is to ask how
many persons who meet the respondent criteria specification are present and then ask in
what month their birthdays fall. With that list, you can choose the person with the next
birthday. Because birthdays occur pretty much at random (and because astrological sign
does not correlate with anything), each person in the household has an equal probability
of selection.
Right away you can think of two things that might go wrong:
1. Nobody is at home when you call.
2. The husband answers the phone, but the next-birthday person is the wife, and
she works nights or is otherwise unavailable.
The simple solution is to call another number in the first instance and interview
the husband in the second instance. But stop and think! What happens to your equal-
probability criterion if you do that? It is violated, because you will have introduced a bias
in favor of people who are easy to reach. To maintain the equal-probability standard, you
have to follow this rule:

Once a person is in the sample, you must pursue that person with relentless
dedication to get his or her response. Any substitution violates the randomness of
the sample.
For no-answers, that means calling back at different times of the day and week.
For not-at-homes, that means making an appointment to catch the respondent when he or
she is at home.
Of course, there has to be some limit on your hot pursuit. And you need to treat
all of your hard-to-get potential respondents equally. To chase some to the ends of the
earth while making only desultory attempts at others would violate the randomness
principle. So you need a formal procedure for calling back and a fixed number of
attempts. Set a level of effort that you can apply to all of your problem cases.
Your success will be measured by your response rate. The response rate is the
number of people who responded divided by the number on whom attempts were made.
If you dial a telephone and nobody ever answers, that represents one person on whom an
attempt was made–even though you may know nothing about the person.
What is a good response rate? Years ago, when the world was a gentler and more
trusting place, response rates of more than 80 percent were commonplace in personal
interview surveys, and that became more or less the standard. By the late 1980s,
researchers felt lucky to get two out of three. As the response rate falls below 50 percent,
the danger increases rapidly: the people you miss might differ in some systematic and
important way from the ones who were easier to reach.
An example will illustrate why this is so. Suppose your information goal is to
learn how many members of the National Press Club are smokers. Your mail survey has a
response rate of 80 percent. Now assume a major bias: smoking has become a mark of
low sophistication and ignorance. Smokers, loath to place themselves in such a category
by admitting their habit, are less likely to respond to your questionnaire. Their response
rate is 10 percent, compared to 50 percent for nonsmokers. The following table is based
on a fictional sample of 100. Smokers Nonsmokers Total
Respond 2 40 42Nonrespond 18 40 58Total 20 80 100

As you can see, the true value in the population is a smoking rate of 20 percent.
But among those who responded, it is only about 5 percent (2/42). That's an important
underestimate. If you go back to the nonrespondents for a second wave of data collection,
you are more likely to pull in smokers, simply because there are proportionately more of
them to be found. The fewer nonrespondents, the less room is left in which the bias can
hide.
Because every research project is subject to the first law of economics–i.e.
nobody has enough of anything to do everything–you have to consider a tradeoff in your
design between sample size and sample completeness. Follow this general rule:
A small sample with a good completion rate is better than a large sample with a
bad completion rate.
One reason for this rule is a healthy fear of the unknown. You know the effect of
shrinking the sample on your error margin. But the error introduced by systematic
nonresponse is unknowable.
A better telephone sampleThe method just described has a couple of flaws. If you choose each listed
household with equal probability of selection in the first stage and select a member from
the chosen household with equal probability in the second stage, that doesn't add up to
equal probability. Why not? Because households come in different sizes. Assume that the
first household in your sample has one adult of voting age and the second has three. Once
the second sampling stage is reached, the selection of the person in the first household is
automatic, while the people in the other household must still submit to the next-birthday
test. Therefore, the single-person household respondent has three times the probability of
being selected as any of the three persons in the second household. The best solution is to
use weights. The person you choose in the three-person household is representing three
people, so count him or her three times. (That's relatively speaking. More specific advice
on weighting will come in the analysis chapter.)
Here's another complication in telephone sampling: in this age of
telecommunications, some households have more than one telephone line. The extra one
may be for the children, a computer, a fax machine, or a home office. If both phones are

listed, the two-phone household has twice the probability of inclusion. You can correct
for that by further weighting, but first you have to know about it, and you can do that by
asking. Just make one of your interview questions, ”Is your household reachable by more
than one telephone number, or is this the only number?” If there is more than one, find
out how many and weight accordingly.
If you do all of the above, you will have a pretty good sample of people whose
households are listed in the phone book. Is that a good sample? Yes, if all you want to
generalize to is people listed in the phone book. Most of the time you will have a more
ambitious goal in mind, and a phone book sample can mean trouble. On average, across
the United States, 15 percent of the working residential numbers will be missing from the
phone book. That proportion varies widely from place to place, so check it out in your
locality. Most of the nonpublished numbers belong to people who moved in since the
phone book was published. Others are unlisted because the householder wants it that
way. Maybe he or she is dodging bill collectors and former spouses or is just unsociable.
Either way, such people are out of your sampling frame.
There is a way to get them back in. It is called random digit dialing, or RDD. You
can draw your own RDD sample from the phone book, using the listed numbers as the
seed. Follow the procedure with the holes in cardboard as before. But this time, instead of
dialing the published number, add some constant value to the last digit, say 1. If you draw
933-0605 in the phone book, the sample number becomes 933-0606. And it could be
unlisted! That method, called “spinning the last digit,” will produce a sample that comes
very close to fulfilling the rule that each household have an equal chance of being dialed.
Of course, some of those numbers will be business numbers. And some will be
nonworking. If a human voice or a recording tells you that the number belongs to a
business or is nonworking, you can pitch it out of the sample. Unfortunately, not all
nonworking numbers are connected to a recording machine. Some just ring into empty
space, like the philosopher's tree falling in the forest where no human ear can hear. That
means you really can't figure an absolute response rate (successes divided by attempts on
real people), because you don't know if there is a real person associated with the number
the interviewer hears ringing. Best bet in that case: specify some reasonable number of
attempts on different days and at different times. Then if there is no answer, chuck it out

of the base. But remember you will have to redefine your sample base, not as all possible
numbers, but as all numbers verified to be working. That is a big difference, but it is still
a rate worth calculating, because you can use it to compare your completeness from one
survey to another.
Using the telephone directory as an RDD seed is convenient, but it may not be a
completely random seed. In a larger city, the three-digit prefixes are often distributed in
some geographic pattern that might correlate with the socioeconomic characteristics of
the subscribers. As a result, certain prefixes (or NNX's, as the phone company calls them)
will have more unlisted numbers than others. An area with an unusually high proportion
of unlisted numbers is underrepresented in the book and will still be underrepresented in
any RDD sample drawn from that seed.
The best solution to this problem is to avoid the phone book altogether. Obtain
from your local telephone company a list of the three-digit prefixes and an estimate of the
number of residential telephones associated with each plus a listing of the working
ranges. Phone companies tend not to assign numbers at random but to keep them together
in limited ranges. You can save time and effort if you know those ranges and don't have
to waste time dialing in the vast empty spaces. From those data, you can estimate how
many calls you need to complete from each NNX and you can write a short program in
BASIC or SAS to generate the last four digits of each number randomly but within the
working ranges. Sound like a lot of trouble? Not really. Here is a BASIC program for
printing 99 four-digit random numbers:
10 FOR I = 1 TO 99
20 PRINT INT(RND*8000)
30 NEXT
This method works for large areas, including states, provided the number of
telephone companies is limited. Maryland is relatively easy because most of the state is
covered by one company. North Carolina is tough, having more than thirty companies to
contend with.
Telephone sampling has become such a specialized task that many survey
organizations prefer not to do it themselves and instead contract the job out to a sampling

specialist who charges by the number. A statewide sample for one-time use for a few
hundred dollars was a typical price in 1990.
Household samplingThe discussion of telephone sampling assumed that the universe of telephone
households and the universe of all households are one and the same. If you have the good
luck to be doing survey research in Sweden, that's just about true. Telephone penetration
there is 99 percent. Canada is good, too, with 97 percent. In the United States, however,
only 94 percent of households have telephones. In some states in the South, coverage is
much lower.1
For some news stories, a telephone sample won't do. You may need the
nontelephone households because you want the downscale segment represented. Or you
may have to visit the respondent in person if you want the interviewer to show an exhibit
or size up the person's appearance or walk in the house and inspect the contents of the
refrigerator. The objective of equal probability for all can be met for personal interviews,
but with some difficulty.
If you are going to do 1,500 interviews in your state or town, you will want to
cluster them to reduce field costs. Like telephone samples, personal interview samples
are based on housing units. You can even use the phone book. Draw a sample of
telephone listings in the manner already described, but with this difference: divide the
number selected by five. That gives you a sample that, after allowing for not-at-homes
and refusals, would yield 300. But those are 300 clusters, not 300 interviews.
Send an interviewer to each address with the following instructions:
1. Do not attempt an interview from the listed address.
2. Stand with your back to the listed address, turn right and take the household
next door. (If in an apartment building and there is no unit to the right, go downstairs one
flight and start with the last one on the left, then work to the right.)
3. Continue in this manner. If you come to a corner, turn right, working your way
around the block, until you have attempted five housing units.

An even better way is to send a crew out into the field to prelist the units in all of
the clusters. In that way, the interviewer doesn't have to waste time figuring out the
instructions, and you have time to resolve any ambiguities.
Because the household that forms the seed for this sample is skipped, those not
listed in the directory have an opportunity to be included. There is still a bias, however,
against neighborhoods with high proportions of unlisted numbers or no telephones at all.
Using the censusWhen your population is too scattered to be covered by one or any other
convenient number of phone books, or when you are concerned by the
no-telephone/unpublished-number bias, consider skipping phone books and working
directly from census counts.
Assume that you want a statewide survey. Draw the sample in stages. Start with a
listing of counties and their populations. If your survey is about voting, use the number of
registered voters or the turnout in the last comparable election instead of total population.
Your goal is to choose sample counties with representation proportional to
population. Divide the population by the number of clusters needed. If you plan to
attempt 1,500 interviews (and hope for 1,000 at a 67 percent response rate), you will need
300 clusters of five. Take North Carolina, for example. Its 1988 census population
estimate was 5,880,415, and it has 100 counties. Dividing the total population by 300
yields 19,601. That will be the skip interval. Now take a walk with your pencil down the
list of counties and find out in which counties each 19,601st person falls. Start with a
random number between l and 19,601. Where to get such a random number? Books like
this one used to publish long lists of computer-generated random numbers just to help out
in such cases. With personal computers and calculators so handy, that is no longer
necessary. Once you have learned BASIC, you can use its random-number generating
capability. Meanwhile, just grab your calculator and multiply two big, hairy numbers
together. Skip the first digit, and read the next five. If they form a number equal to 19601
or smaller, use it. If not, move one digit to the right and try again. If necessary, enter
another big hairy number, multiply and try again. Let's assume you get 3,207 (which is
what I just drew by following my own instructions). Call this number the random start.
To show you how this works, I am going to walk you through a lot of numbers
very quickly. But don't even think of looking at the next few paragraphs until you have
the concept. Here is another way to get it. Imagine all of North Carolina's people lined up
in a long queue, by county, in alphabetical order. The object is to find the 3,207th person
in the line, and then every 19,601st person after that. If we count them off that way we
will collect 300 people, and we will know what counties they came from. Each of those
persons represents one sampling point in his or her county. The object of this exercise is
simple: to find out how many sampling points, if any, each county gets. By basing the
selection on people, we will automatically give each county representation according to
the size of its population. Some small counties, with populations less than the 19,601 skip
interval, will be left out. But some will fall into the sample by chance, and they will
represent all of the small counties.
If you understand the concept, its okay to go ahead and look at the example. Or
you can wait until such time as you need to actually draw a sample. The example is just
to show the mechanics of it.
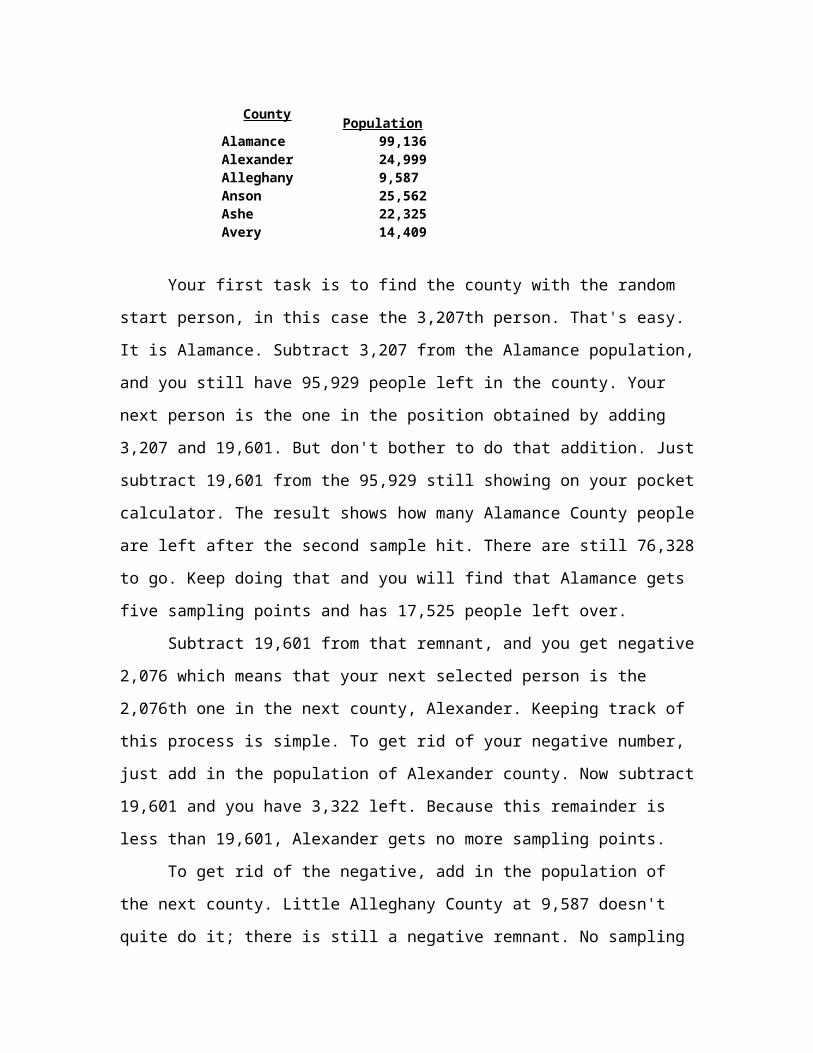
Here is the top of the list of North Carolina's 100 counties.
County PopulationAlamance 99,136 Alexander 24,999 Alleghany 9,587 Anson 25,562 Ashe 22,325 Avery 14,409
Your first task is to find the county with the random start person, in this case the
3,207th person. That's easy. It is Alamance. Subtract 3,207 from the Alamance
population, and you still have 95,929 people left in the county. Your next person is the
one in the position obtained by adding 3,207 and 19,601. But don't bother to do that
addition. Just subtract 19,601 from the 95,929 still showing on your pocket calculator.
The result shows how many Alamance County people are left after the second sample hit.
There are still 76,328 to go. Keep doing that and you will find that Alamance gets five
sampling points and has 17,525 people left over.
Subtract 19,601 from that remnant, and you get negative 2,076 which means that
your next selected person is the 2,076th one in the next county, Alexander. Keeping track

of this process is simple. To get rid of your negative number, just add in the population of
Alexander county. Now subtract 19,601 and you have 3,322 left. Because this remainder
is less than 19,601, Alexander gets no more sampling points.
To get rid of the negative, add in the population of the next county. Little
Alleghany County at 9,587 doesn't quite do it; there is still a negative remnant. No
sampling point at all for Alleghany County. Add in Anson County. It has enough
population for one hit, but with 19,140 left over it doesn't quite qualify for a second.
Subtracting the skip interval yields the negative that shows how far into the next county
our target person waits. And so on and on. If you follow this procedure all the way
through North Carolina, you would end up with exactly 300 sampling points.
For each of those chosen counties, you next need to get the detailed census maps
that show tracts. In this stage of the selection you give each tract an equal probability of
selection, regardless of its size. That makes it easy. If a county needs five sampling
points, add up the number of tracts and divide by five to get the skip interval (i). Choose a
random start. Take every ith tract or district.
In the final stage, choose blocks with probability proportional to population. It is
the same procedure used to choose the counties, only on a smaller scale. The blocks
become your sampling points.
Now you need to devise a rote procedure for choosing a starting point in each
block. You can't let the interviewer choose it, because he or she will pick the nicest
looking or the most interesting looking place. Tell her or him to find the northeast corner
of the block and then choose the second dwelling to the right. Starting with the corner
house is considered a bad idea because corner houses might be systematically different –
more valuable in some older neighborhoods, less valuable in others because of the greater
exposure to traffic. In neighborhoods without clearly defined blocks, you will have to use
some other unit such as block group. Maybe you will have to throw a dart at a map to get
a starting point. Just remember the first law of sampling: every unit gets an equal chance
to be included.
When the starting point is chosen, give the interviewer a direction, and then take
five dwellings. If you can prelist them in the field first, so much the better.

In multistage sampling it is important to alternate between selection proportional
to population and equal probability of selection. That adds up to equal probability for the
individuals finally chosen. Leslie Kish gives the arithmetic of it in his authoritative work
on the subject.2 I can explain it better with an example.
Consider two blocks of high-rise apartments. Block A has 1,000 households.
Block B has 100.
If you live in block A you have 10 times the probability of having your block
chosen.
But here is the equalizer: the same number of interviews is taken from each block.
So once the blocks are chosen, a person living in Block B has 10 times the probability of
being interviewed as a person in a selected Block A. The bottom line: equal probability
for all.
When you cluster a sample to save time and trouble in the field, the arithmetic of
sampling changes. Kish gives the mathematics for figuring it exactly. For a rough rule of
thumb, figure that clustering cuts efficiency by about a third. In other words, a cluster
sample of 1,000 would yield about the same margin of error as a pure probability sample
of 666.
Some of the efficiency that is lost in clustering is regained by stratifying. The
procedure described for North Carolina ensures that sampling points will be
geographically scattered and that no major county will be left out and that the biggest
counties will have respondents in proportion to their size. Because none of those things is
left to chance, you get some improvement over simple randomness.
Samples of limited areasFor the 1967 Detroit riot survey, John Robinson designed a sample that used
census and city directory data without clustering. Because the geographic area was so
small, there was no great advantage to clustering households. But we did cluster within
households. Teenagers as well as adults were included in the sample, so Robinson
specified that half the eligible respondents would be interviewed in each home. They
were chosen by making a numbered list, based on sex and age, and then taking all of the
odd (or even) numbers. Making participation a family activity helped boost cooperation,
although it created some difficulty in protecting privacy. A city directory was used to
obtain the addresses, and Robinson devised a procedure for getting unpublished
addresses. Each interviewer checked the house next door to the house in the sample. If
that house was not listed in the directory, interviews were taken there as well. To the
extent that unlisted houses next door to randomly chosen houses are a random sample of
all unlisted houses, that brought them in with correct representation.
Bias in telephone and home samplesThe people most difficult to reach tend to be those at the bottom of the
socioeconomic scale. Interviewers don't like to go into bad neighborhoods, and telephone
penetration is also less in those kinds of neighborhoods. Telephone surveys introduce an
additional bias against less-educated people, who are less likely to cooperate with a
telephone interviewer once they are reached on the telephone. In some kinds of surveys,
this does not make a lot of difference. If it is a marketing survey, the nonrespondents tend
to be nonbuyers as well. If it is a voting survey, they are likely to be nonvoters. But
the upper-class bias can be a serious defect for many surveys for journalistic purposes. If
the topic involves a social problem, the people most affected by the problem may be the
ones least likely to be reached by a survey.
In Miami, when Juanita Greene, George Kennedy, and I studied the black
community before any rioting had taken place there, we were surprised to find our data
telling us that two-thirds of all the blacks in Miami were female. This was the first time
we had encountered the problem of the invisible black male. How can one handle such a
profound bias in the sample? We considered several choices:
1. Weighting. We could weight up the males we did get to make them represent
the males we didn't get. Problem: chances are pretty good that the ones we didn't get are
different, maybe a lot different, from the ones who could be found.
1 Dennis Trewin and Geof Lee, “International Comparisons of Telephone Coverage,” in
Robert Groves et al. (eds.), Telephone Survey Methodology (New York: John Wiley &
Sons, 1988), pp. 9-24.2 Leslie Kish, Survey Sampling (New York: John Wiley, 1965).

2. Throw the data away. Problem: we didn't know how to collect data that would
be any better.
3. Redefine our sampling frame and generalize only to the stable, visible black
population. Problem: redefining the missing males out of the survey doesn't really make
them go away.
We chose the third option, and Greene used conventional reporting methods to
write a separate story on Miami's invisible black males and the social and political forces
that kept them out of sight. She showed with anecdotes what we could not show with
data: that the family structure and the welfare regulations forced poor males into a state
of homelessness and/or disaffiliation with families. That strategy covered that base and
left us free to write about the data from the survey with frank acknowledgment of its
limitations. And it suggests a pretty good general rule:
When writing about a social problem that involves people who are going to be
underrepresented in your survey, find some other reporting method to include
them in the story.
Knowing when a survey can't carry all of the freight will keep you from deceiving
yourself and your readers.
Sampling in mail surveysMail surveys are usually done for special populations. Getting the mailing list can
take some reportorial ingenuity. When Mike Maidenburg and I did a five-year follow-up
survey of people who had been arrested in the first major student protest of the 1960s –at
Sproul Hall on the campus of the University of California in 1964 – we worked from
alumni records. But first we had to know who had been arrested, and the courts had
expunged the records of every person who was under the age of 21 at the time of the
arrest. Fortunately, the order to expunge had taken some time, and local newspapers had
printed their names while they were still available. A search of those contemporary
newspaper accounts produced the needed list of names, which could then be compared
with the alumni list for current addresses.
USA Today needed a list of inventors for a story on the current state of American
ingenuity. It obtained a list for a mail survey by checking the U.S. Patent Office for

recent registrations. Mail surveys are commonly used to profile delegates to the major
party nominating conventions, and the names and addresses are available from party
headquarters. Surveys of occupational groups, such as policemen and airline pilots, have
been done by using lists obtained from their professional associations.
Sometimes the target group will be small enough that no sampling is needed. You
can attempt to collect data from each member of the group. But the basic rule of sampling
still applies: completion is more important than sample size. If your target population has
8,000 names and addresses, you can send a questionnaire and get perhaps 2,000 back.
That 2,000 is a sample, and not a very representative one. But if you sampled every
fourth name to begin with, sent 2,000 questionnaires and did vigorous follow-up to
complete 1,500 of them, you would have a far superior sample.
When you sample from a small population, the margin for sampling error is
reduced somewhat, though not as much as you might think. George Gallup liked to
explain it with an image of two barrels of marbles. One barrel holds 200,000 marbles, the
other 2,000. In both barrels half the marbles are black and half are white, and they are
thoroughly mixed. Scoop out a handful from either barrel and your chances of getting
close to a 50-50 mix are about the same. Each individual marble has an even chance of
being black, regardless of the size of the barrel from which it came.
But when the population is very small, the chances of sampling error are
appreciably reduced. The rule of thumb: if your sample is more than one-fifth of the
population being sampled, try the correction factor.3 The formula:
sqrt(1-n/m)
where n is the sample size and m is the population from which it is drawn. Work
it out, and you'll see that if your sample of 2,000 is drawn from a population of 8,000, the
error margin is 87 percent of what it would be if the population were of infinite size.
Possibility samplesThere are situations where scientific sampling is not possible, but there is still
some point in using some kind of random selection. Intercept or shopping mall interviews
3 This rule and the correction factor come from Hubert M. Blalock, Social Statistics (New
York: McGraw-Hill, 1960), p. 396.

are an example. There is a crowd of people and no way to get them to hold still for
sample selection. But you can pick a random point in the mall and a random number, say
4. Stand at the random point and count the people who cross an imaginary line and then
intercept the fourth one. That at least prevents the choice from being made by the
interviewer, who is likely to prefer people who look interesting, attractive, sexy, or
otherwise appealing. Since the probability of any given shopper crossing your random
point is unknown, it is not a true probability sample, but it at least eliminates interviewer
selection as a source of bias. This technique was used by Al Gollin to sample participants
in mass political demonstrations when he was with the Bureau of Social Science
Research.4 Stanley Milgram used it for assessing the helpfulness of people encountered
on city streets.
ASKING QUESTIONSThe answers you get depend on the questions you ask. In recent years, because of
an increasing awareness of the sensitivity of certain kinds of issues to the design of the
survey instrument, it is necessary to question not only the wording of survey questions
but also the order and manner in which the questions are asked. Survey questions are
carefully framed in everyday language to be understood by everyday people, and yet the
survey situation is quite different from everyday conversation. Listen to somebody else's
spontaneous conversation on an elevator or in a taxi and notice its structure. It is full of
redundancies. Its questions and answers cover the same material over and over as the
participants reduce ambiguity and converge on a narrow area where both desire some
level of precision in understanding. Consider the redundancy checks in your own
telephone conversations. Notice how a phone conversation usually ends with each party
repeating what he or she is going to do next as a result of the conversation, even though
that ground has already been well covered. Instinctively, we know how difficult oral
communication is, and we build in the redundancies as a form of error checking.
Questions in survey research are put in a much different framework. The purpose
is to measure a response to a stimulus, and so the stimulus must be formulated in a way
4 Described in Philip Meyer, Precision Journalism, Second Edition (Bloomington:
Indiana University Press, 1979), p. 306.
that can be repeated from one respondent to another so that each respondent is reacting to
exactly the same thing. The questioner cannot improvise or recast the question to fit the
existing knowledge or interest of the respondent. Each item has to be delivered just the
way it left the question factory.
That procedure pays off in precision, but it comes at the cost of creating an
unnatural situation in which the full power of oral communication is not realized. The
survey question-asking situation is so unnatural that Howard Schuman, in his 1986
presidential address to the American Association for Public Opinion Research, argued for
de-emphasizing, or even ignoring altogether, the raw frequencies or marginals in survey
results. No survey number means very much, he said, without another number to compare
it to. Knowing that 60 percent of the conference attendees liked the conference program
would be good news, he said, if the average for previous conferences had been 40
percent. But “if the average over the past years had been 80 percent, this year's organizers
might well hang their heads in shame.”5
The referendum modelSchuman's view is contrary to most journalistic practice, which is to treat polls as
an ongoing referendum in which the people instruct their representatives on how to act.
That model can lead editors, politicians, and readers alike to overestimate both the power
of the survey question and the knowledge and attentiveness of the typical citizen.
And yet the referendum model is not always invalid. If it were, polls would not
predict elections as accurately as they do. And questions on many public policy issues
would not show the robustness that they do. By robustness I mean that some questions
keep giving the same answers, no matter how you twist or tamper with them.
That leads to the first law of question writing:
Never pass up a chance to borrow or steal a question that has worked for
somebody else.
5 Howard Schuman, Ordinary Questions, Survey Questions, and Policy Questions,”
Public Opinion Quarterly, 50:3 (Fall 1986), 437.

The advantages are several. If it worked for somebody else, it is more likely to
work for you. And you already have another population and/or another time with which
to compare your population at your time.
Here is another general rule:
Do not frame a question to fit a headline that you hope to write.
Some of my best friends are newspaper editors, but I hate writing questions with
them when they are looking ahead to the kind of headline that they hope to get. An
editor's question about the public's response to the president's latest tax proposal might
read something like this:
Which of the following best describes your response to the president's tax
proposal:
1. I like it.
2. I sort of like it.
3. Drop dead!
The hope is that the headline writer can later say something like “People to Prez:
Drop Dead!”
Even if you tried such questions, you would find that most of the time
respondents will shy away from the catchy headline-grabbing response in favor of a more
conventional one. And you have hopelessly biased the question by changing its tone in
mid-thought, leaving it badly out of balance. It just does not pay to try to put catchy
phrases in your respondents' mouths.
Open-ended questionsThe other extreme, putting no phrases in the respondent's mouth by asking a
question that is open-ended, is equally impractical for most journalistic purposes. When
an open-ended question is asked, the answers have to be recorded, coded, and categorized
in some way if they are to be summarized. Just developing the coding scheme can be a
long and tedious process. You have to look at the answers produced and figure out ways
to classify them. Once a classification scheme is worked out, you then must go over each
response and decide where it fits in the scheme. In a business with daily deadlines, there
are just two situations where open-ended questions are useful:

1. When you use them to generate quotes to liven up a story. You don't need to
code or classify them in that case.
2. When the response is a number, e.g., “How many years have you lived at this
address?” Quantitative information can be entered directly into the computer, as long as
the unit is consistent.
In most other situations, open-ended questions are a poor option for journalistic
surveys. When under deadline pressure, you have to constrain the responses to categories
that can be counted and compared in the computer with a minimum of human processing.
And so the closed response categories become an important part of the question, both
leading respondents to the categories that you picked in advance and shunting them away
from all the possibilities you are not giving them. It is a big responsibility.
Non-attitudesThe chief disadvantage of the closed-end response is that the respondent with no
knowledge of the subject can pick one of the proffered choices as readily as one who is
well versed. Indeed, the social pressures of the interview situation encourage it. The
interviewer defines the roles: I give questions, you give answers. And the system forces
everyone into a category. Many journalists are disappointed when large numbers of
respondents' answers fall into the “don't know” category, and argue for question protocols
that force a respondent to decide. But all that such a practice does is contribute to self-
delusion. Lots of people really don't know, and as a journalist/researcher you should feel
that it is as important to know and count them as it is to identify the people with firm
intentions. Thus the rule:
“Don't know” is data.
Cherish it as much as the data from people who do know. More than twenty-five
years ago, Philip Converse started worrying about the measurement of what he later
called “non-attitudes” when he was a survey respondent and noticed himself hastening to
give answers to questions on topics about which he knew or cared little, just so he could
fulfill his role in the social encounter and get it over with. That led to a career-long
interest in the subject and some seminal work that has led to a greater appreciation for
“don't know” as valuable data.6 Later, two other University of Michigan researchers,

Howard Schuman and Stanley Presser, experimented with questions that contained
explicit invitations to admit to not knowing. They found that the relative proportion of
pro and con positions often remained unchanged, but the number of don't knows
increased substantially.7 How do you invite the respondent to admit not knowing? Here
is an example:
“Do you think the United Nations has been doing a good job or a poor job in
dealing with the problems it has had to face – or haven't you followed this closely enough
to have an opinion?”
To demonstrate the importance of including this escape hatch, Schuman and
Presser, along with George Bishop of the University of Cincinnati, asked people to give
their opinions on some things that don't exist, such as “The Public Affairs Act.” Almost a
third expressed an opinion. When the escape hatch was added to the question, fewer than
10 percent pretended knowledge of the nonexistent act.8
Another way to avoid the non-attitude problem is to put a don't know filter ahead
of the question. Ask a simple knowledge question first, e.g., “Have you read or heard
anything about . . .” If the answer is no, don't bother the respondent with a question on
that topic.
Interest groups that use polls to generate political support for their causes often
have extremely esoteric concerns that they try to fit to the referendum model. They do it
by drafting a very long question that explains the issue and then asks the respondent to
take a side. Not a good idea! You just can't create instant education that way and then
generalize to what the rest of the public would think if it were well informed. The
question becomes so complicated that it is almost impossible to word objectively. And
the instantly-educated respondent thus created is not representative of anybody. The
6 Philip E. Converse, “Attitudes and Non-Attitudes: Continuation of a Dialogue,” 17th
International Congress of Psychology, 1973.7 Howard Schuman and Stanley Presser, Questions and Answers in Attitude Surveys:
Experiments on Question Form, Wording and Content (New York: Academic Press,
1981).8 Cited in John P. Robinson and Robert Meadow, Polls Apart: A Call for Consistency in
Surveys of Public Opinions on World Issues (Cabin John, Md.: Seven Locks Press, 1982).

instant education makes the respondent different from other ignorant respondents without
bringing him or her up to speed with those who have studied and thought about the issue.
It is far better to identify those who are already well informed, and then ask them what
they think.
Journalists are particularly likely to fall into the trap of thinking that their
concerns and interests and knowledge are reasonably representative of the population as a
whole. They're not! If you are reading this book, that alone marks you as a peculiar, even
deviant, subset of the population of journalists and journalism students, not to mention
the population as a whole. Never generalize from yourself. For that matter, never
generalize from Chapel Hill or Manhattan, Kansas, or Milton, Florida, or any interesting
place where you happen to live. Representativeness is elusive, and it is somewhere else.
The middle-category problemWhen the Harris Survey asks for a rating of the president's performance, the
choices given are “excellent, good, fair, or poor.” When the Gallup Poll asks the
question, the choices are “approve or disapprove.” Neither has a clear middle category.
Both sets of possible responses were designed for journalistic application. Being a
journalist usually means having a low tolerance for ambiguity. Politicians and other news
sources are always trying to fuzz things up. Journalists are supposed to make things clear.
Therefore, it seems natural to frame response categories into discrete, either-or binary
choices. But the argument against this forced choice is the same as the argument for
inviting “don't knows.” Some respondents really belong neither in the pro nor in the con
but right in the middle. The Gallup and Harris questions for rating the president's
performance were written in a time when most pollsters saw it as their duty to try to force
the respondents out of the middle. The current trend is to treat the middle as a legitimate
category and include it in the response choices.
Schuman and Presser found that inclusion of the middle does not affect the
balance of pro and con, and it does not affect the size of the don't-know category. If some
people are most comfortable in the middle, our dedication to truth should compel us to
respect that instead of trying to manipulate them into a firmer position. Forcing them out
of the middle actually causes us to lose data, because it can mask a real mushiness in
attitudes that might be important to know about.9 Although inclusion of the middle
alternative need not be an absolute rule, consider it in those cases where you have reason
to suspect that the middle represents an important part of reality. On the simplest
questions, an invited “don't know” can provide a refuge for the middle. Example:
“Should the President send troops to stop the rioting in Xandu, or haven't you thought
enough about the situation to say?”
The balanced questionA balanced question presents two alternatives with similar structures. An
unbalanced question gives one side and then asks the respondent to agree or disagree (or
approve or disapprove). For a complicated issue, the balanced question might take the
“some people say” form. Example:
“Some people say the President should be doing more to balance the federal
budget. Others say he's done enough already. Which comes closest to your opinion –that
he should be doing more, or that he's done enough already?”
The unbalanced form: “Do you agree or disagree with the following statement:
The President should be doing more to balance the federal budget.”
Then there is a balanced version with a middle category: “Has the President's
action in reducing the national debt been too much, about right, or too little?”
The balanced form is generally better when you are looking for a referendum and
your main purpose is to identify a majority or plurality view. However, there are at least
two situations where the unbalanced form is justified:
1. Index construction. Some dimensions are too important to be left to one
question. You can reduce error by asking a number of questions on the same topic and
then combining them into an index. That index can give you a nice continuous measure
of whatever you are measuring and provide a check on respondent consistency. An agree-
disagree list can generate a lot of index items in a hurry.
9 Some distinguished social scientists agree with me. See Seymour Sudman and Norman
M. Bradburn, Asking Questions: A Practical Guide to Questionnaire Design (San
Francisco: Jossey-Bass, 1982), p. 141.

2. Creating a simple independent variable. Often the referendum is less important
than knowing how one attitude affects another or how an opinion affects a behavior such
as voting. In that case, the goal is not to ask an unbiased question but to ask a question in
a way that measures the target attribute and splits the population more or less evenly so
that you can use it in a cross-tabulation.
In exit polls, which use self-administered questionnaires (SAQs), an agree-
disagree list of issues creates a number of variables that can be cross-tabulated against
actual vote. In that situation, you don't care about the referendum; you just want to know
what issues helped which candidates, what the relative effects of the issues were. To do
that, you have to frame the questions to produce binary responses that will divide the
population into roughly equal categories.
Here's a rather extreme example. Once in a Florida primary, busing to achieve
school desegregation was an issue. We needed an agree-disagree question that would
serve as an independent variable in the analysis. Opposition to busing was so strong,
however, that it was hardly a variable at all, and so the question had to be loaded in a way
that would make it a variable. Agree or disagree: “If the courts require busing to integrate
schools, we might as well close the public schools.” For that extreme statement, there
was enough variance for cross-tabulation.
Response setUnbalanced questions make poor referenda because of a tendency for some
respondents to be “yea-sayers.” In a telephone interview an impatient respondent may
agree to anything just to get the interview over with. When lists of items are written for
possible index construction, the respondent may be more influenced by the form of the
question than the content. In psychological testing it is customary to reverse the polarity
for alternate questions. For example, an agree-disagree list might include both “The New
York Times is fair,” and “The New York Times is biased.” Some people will agree to both,
but at least the yea-saying is compensated for.
Even in the absence of an obvious pattern, response set can cause problems. In
1960 and 1973, different sociologists tried these two agree-disagree statements in the
same survey: “It's hardly fair to bring children into the world the way things look for the

future.” And “Children born today have a wonderful future to look forward to.” A
disquieting proportion of the people who agreed with the first also agreed with the
second.10 Schuman and Presser tried a split-sample experiment where half were asked to
agree or disagree with, “Individuals are more to blame than social conditions for crime
and lawlessness in this country.” The other half was asked for agreement or disagreement
to the reverse: “Social conditions are more to blame than individuals for crime and
lawlessness in this country.” Each version drew a solid majority of agreement.11 The
maddening thing is that the acquiescence bias, as Schuman and Presser called it, is
inconsistent. It doesn't turn up for all issues and questions in a predictable manner.
One situation where you can expect it to cause trouble is when the questions are
obviously being used to evaluate something or somebody – an institution or a political
candidate, for example. If the favorable answer is an agreeing one (or the one on the left
in a self-administered questionnaire), the respondent will expect that pattern in the
following items and interpret them with that expectation in mind. Reversing the polarity
just encourages the respondent to misinterpret the questions; keeping the polarity
constant is the safer course.12
Order of response categoriesEven when a question is balanced, the order in which the balanced response
categories are offered can make a difference. Investigators have found evidence of both
primacy effect (favoring the first choice) and recency effect (favoring the last choice).
Schuman and Presser report that recency effects are by far the more common. Stanley
Payne first noticed recency effects in some split-sample experiments he did for the
American Petroleum Institute in the 1940s.13 Schuman and Presser replicated some of
those questions more than 30 years later, and the order effects were still there. A sample:
10 Cited in Robinson and Meadow, Polls Apart, p. 124.11 Schuman and Presser, Questions and Answers in Attitude Surveys, p. 208.12 Philip Meyer, “Defining and Measuring Credibility of Newspapers: Developing an
Index,” Journalism Quarterly, 65:3 (Fall 1988).13 Stanley Payne, The Art of Asking Questions (Princeton: Princeton University Press,
1951), p. 133.

“Some people say that we will still have plenty of oil 25 years from now. Others say that
at the rate we are using our oil, it will all be used up in about 15 years. Which of these
ideas would you guess is most nearly right?” In the 1979 replication, the number
believing there was plenty of oil jumped by 13 percentage points when that choice was
given last. Schuman and Presser found such order effects in about a third of the items
they tested, but they could not discern a pattern that would give a clue to what causes
such effects or when to expect them.14
A different kind of order effect can occur when a respondent is asked to judge a
series of items in comparison with each other. If you are ever a contestant in a beauty
contest, try to avoid being the one judges see first. When USA Today screened television
pilots for test audiences in Dallas in advance of the 1989-1990 season, the viewers gave
the lowest ratings to the shows they saw first. Anticipating an order effect, USA Today
rotated the shows so that they were seen in different order by different groups. Thus
“Major Dad” was rated 7.7 on a 10-point scale by a group that saw it before it had viewed
any other shows. But a group that saw two other shows first, and therefore had something
to compare it to, gave “Major Dad” an 8.8.
Rotation is also a good strategy in a survey interview. If the respondent is asked to
rate a list of candidates or a list of issues, reverse the order for half the interviews.
Experiments at the University of Chicago, the University of Michigan, and elsewhere
have shown that unrelated questions can also be affected by what came before.
Something in the content of a previous question can sometimes start a train of thought or
set a mood that affects the response to the next. Unfortunately, nobody has found a way
to predict these effects. The careful approach, when replicating a question from another
survey, as you were advised to do at the start of this chapter, is to look for context that
needs replicating as well.
Continuous variablesMore information is collected and more sophisticated analysis is feasible if you
frame questions with response choices that fit on a continuum. But it is not easy to do,
especially on the telephone. In personal interviews or with self-administered
14 Schuman and Presser, Questions and Answers in Atitude Surveys, p. 72.

questionnaires, you can show a picture of a ladder with the steps numbered from 1 to 10
and ask the respondent to position an attitude on the ladder. Or you can show rows of
numbers, 1 through 7, with the ones and sevens headed by words of opposite meaning:
biased-unbiased, brave-timid, exciting-boring, honest-deceitful, etc. The odd-numbered
scale includes a middle point, and the respondent can mark it with a pencil or point to a
card held by the interviewer with relative ease.
Telephone interviewing can do the same if the topic is one that is easily
visualized. Using the familiar academic grading scale of A through F is helpful. USA
Today in 1989 began using it to get a more sensitive measure of presidential approval.
The question: “Using a grading scale of A, B, C, D, and F, where A is 'excellent' and F is
'very poor,' and using any of the grades in between, how would you grade the job George
Bush has done as President so far? Would you give him an A, B, C, D, or F?”
Scales of 1 to 10 can also work on the telephone if the subject matter is familiar
and the scale is given an explicit anchor. “On a scale of 1 to 10, with 10 being the best
possible performance and 1 being the worst possible, how would you rate the President's
speech on drugs last night?” Such a question would, of course, be asked only of people
who saw or heard the speech.
Yet another way to get some scaling is to loop back after a response to an agree-
disagree item and try to split it into strong or not-so-strong agreement or disagreement.
But that procedure is time consuming and induces respondent fatigue. You can get away
with it on one or two questions, but not with a long list in a telephone interview.
For a key variable, however, it is worth going to some trouble. The National
Opinion Research Center question on political party affiliation is a classic. Following a
scheme developed at the University of Michigan, it converts the simple Republican-
Democrat dichotomy into a continuous variable:
Generally speaking, do you usually think of yourself as a Republican, Democrat,
Independent, or what?
(If Republican or Democrat) Would you call yourself a strong (R or D) or not a
very strong (R or D)?
(If Independent) Do you think of yourself as closer to the Republican or
Democratic party?

The result is a seven-point continuum from strong Republican to strong
Democrat. It is a lot of trouble to ask, but worth it if you are studying changes in party
loyalty and affiliation over time.
Threatening questionsYou can ask about the darndest things in surveys: riot participation, sexual
behavior, drug use, all kinds of antisocial behavior. The telephone provides an advantage
over the personal interview because you don't have to look at the respondent. And you
can create a social situation where it seems natural and easy for the respondent to tell you
about his or her bad behavior.
One way is to deliberately load the question to elicit the admission. In the Detroit
riot study, the question assumed that everybody was a rioter, and that the interviewer was
just asking for details, e.g., “How active were you in the riot . . . ?” Then there is the
everybody-does-it gambit, reminding the respondent that the behavior asked about is
fairly common. “A lot of people yell at their spouses some of the time. Did your spouse
do anything in the last seven days to make you yell at (him/her)?” That wording also
suggests that your yelling was your spouse's fault, not yours.
Students in my advanced reporting class measured cocaine use in Orange County,
North Carolina, by asking a graded series of questions on substance use, starting with
tobacco, beer, and wine and working up through hard liquor, amphetamines or
tranquilizers (uppers or downers), marijuana, and finally cocaine and heroin. The early
questions about legal drugs set up a pattern of disclosure that could be maintained when
the illegal drugs were asked about.
For a survey to determine the incidence of date rape, another class used the
telephone to recruit respondents who would agree to fill out and return a mailed SAQ.
They were warned in advance that it contained some sexually explicit questions. In
addition to asking directly about rape, the questions asked about more detailed behavior,
including one that amounted to the legal definition of rape: “Have you ever had sexual
intercourse with a woman without her consent?” Like the cocaine question, this came at
the end of a series asking about more benign behaviors. Far more males admitted

to nonconsensual intercourse than would admit to rape when the word itself was used,
which raised some interesting issues about the social definition of rape.
Questions about prosocial behavior can be threatening if the respondent failed to
perform the approved action. To coax out admissions of nonperformance, it helps to build
some excuse into the question. “Did you happen to vote in the last election, or did
something come up to keep you from voting?” Even with that wording, past voting is
generally overreported. “Do you use a seat belt when you drive, or are you one of those
people who hate being strapped down?” can encourage an admission of nonperformance.
Even better would be asking about a specific time, i.e., “the last time you drove.” That
way the person could admit to not performing a desirable behavior just once without
seeming to be a total nonperformer. The Newspaper Advertising Bureau question on
newspaper readership asks if the respondent read “yesterday” for the same reason.
DemographicsEvery ongoing polling operation should have a standard list of demographic
categories and stick to it. Making comparisons across time is an important way of
enriching your data, and you need consistent categories to do it. Here are the
demographics you should collect as a minimum:
1. Gender. Two categories will do.
2. Race. Find out whether the respondent is black, white, or something else. The
something else could include Asian or Native American, but not Hispanic. The
designation of Hispanic refers to national origin, not race, and there are in fact Hispanics
who are white, black, Asian, and Indian. So ask about Hispanic origin as a separate
question, after you have asked about race.
3. Age. Ask for exact age. You can set the categories in the analysis. It is
important to maintain flexibility here, because the relevant age categories can depend
strongly on the news topic. There is a myth among pollsters that asking for exact age
irritates the respondent and ruins cooperation. When USA Today switched from asking
age category to asking exact age, the refusal rate went from .33 percent to 1.5 percent–an
increase of nine refusals in an 800-person survey. That's not too much to pay for the
ability to set whatever cutting points the analysis requires.15

4. Education. Asking for exact number of years in school preserves your
flexibility. But the categories you will usually end up with are these: grade school (0-8),
some high school (9-11), high school graduate (12), some college (13-15), college
graduate (16), and post-graduate (17+). In North Carolina, some older people got high
school diplomas with only 11 years of school, so a more detailed question has to be
asked.
5. Income. This one is usually saved for last, because the refusal rate is relatively
high. Because of inflation, it is impossible to set categories that will make a lot of sense
over time. A common format is to have the interviewer read a list of categories after
having asked the respondent to “stop me when I get to your category.” Usually, total
household income before taxes, not the respondent's own income, is requested.
Experiments with this question have shown that the more different kinds of income are
asked about, the more income surfaces. For many newspaper surveys, however,
education is enough of an indicator of socioeconomic status so that income is not needed
unless it is particularly relevant to the story, e.g., one on tax policy.
6. Religion. The common categories are Protestant, Catholic, Jewish, and None.
In the parts of the South where half the population is Baptist, the Protestants can be
subdivided into Baptist and other.
7. Work. To see how complicated occupation codes can get, check the codebook
for the General Social Survey.16 It would be nice if you could sort people into blue collar,
white collar, and professional categories, but too many jobs are hard to classify. You can,
however, ask whether a person is working, unemployed, retired, keeping house, or going
to school.
8. Marital status. Married, never-married, widowed, divorced, separated.
9. Region of socialization. Sometimes the kind of place in which a person grew up
is relevant to your story. For consistency, consider using the regions of the United States
as defined by the Bureau of the Census. You'll find them on the inside cover of the
Statistical Abstract of the United States.17
15 Calculated by Jim Norman on the basis of 17 surveys by Gordon Black for USA Today.16 General Social Survey, Cumulative Codebook (Roper Center, University of
Connecticut), updated annually.
Size of place
Don't ask this one. Just code it from what you already know about the
respondent's city, county, or zip code. A useful distinction is between urban and
nonurban, defined as counties that are part of Metropolitan Statistical Area and those that
are not. Even a state with no large cities, such as North Carolina, can end up with a neat
half-and-half division on that dimension.
COLLECTING THE DATAData are collected in person, by mail, and by telephone. Technology keeps
bringing new methods. Both personal and telephone interviews can be assisted by a
computer that stores both the questions and the answers. A market research firm in The
Netherlands has even automated the self-administered questionnaire. Each Friday,
members of a previously selected sample turn on their home computers and dial up a
central computer system that then asks them questions about their attitudes and their
week's purchases. It is a reverse database, and the respondents are motivated to be a part
of it because they get a free computer. For the foreseeable future, however, you will have
to cope with live interviewers most of the time.
Training interviewersWhether interviewing is done in person or by telephone, the interviewer must
know both the elements of social science data collection and the specific aims and
characteristics of the study at hand. A survey interview is a conversation, but it is an
unnatural conversation. As any reporter knows, you could take the respondent to the
corner bar, spend some time over a couple of beers, and get a better idea of the person's
attitudes.18 Such a conversation would generate insight, but not data. To produce
quantifiable data, you have to train individual differences out of the interviewer so that
the questions will produce the same responses no matter who is asking them. The
17 Statistical Abstract of the United States (Washington: U.S. Government Printing
Office). Published annually.18 The beer-hall analogy was used by Elizabeth Noelle-Neumann, “The Public Opinion
Research Correspondent,” Public Opinion Quarterly, 44:4 (Winter 1980), 591.

technical term for this consistency is reliability. Achieving it may come at some cost to
validity or the essential truth of the answers you get. But without reliability, you can't add
one interviewer's apples to another's oranges. So you train the interviewers to behave in
uniform ways that squeeze the subjectivity out of the process.
The interviewers have to be taught to read the questions exactly as read. If the
question as read does not yield an answer, the interviewer is allowed to use neutral
probes, e.g., “un-hunh,” “Could you be a little more specific?” or just an expectant pause.
Suggesting a response is not allowed. “You mean you approve of the way President Bush
is doing his job?” is not a neutral probe.
Interviewers are allowed some freedom, however, in the introductory part of the
interview. You will write a script for them that opens the conversation and requests the
respondent's cooperation, and it is okay for the interviewer to use it with improvisation.
But when the data collection part begins, he or she must stick to the script.
Some of the questions from potential respondents can be anticipated: who is
paying for this survey, will my name be published, etc. It is a good idea to make a list of
the expected questions and recommended answer for each interviewer to have at hand
during the data collection. For some excellent examples of the written instructions with
which interviews can be fortified, see Don A. Dillman's book Mail and Telephone
Surveys: The Total Design Method.19
Help your interviewer trainees to become familiar with the questionnaire by role
playing. Pick one to interview another in front of the group. Then do it again with you
acting as a particularly difficult respondent.
Reassure your trainees that most people enjoy being interviewed. It is not
necessary to act like a detective on a secret mission. If yours is a prestigious media
company, mentioning its name in the opening pitch will help convey the feeling that a
good cause is being served by participation.
CATI systems v. paper and pencilIf you have the resources, a CATI system saves time and improves accuracy.
Computer Assisted Telephone Interviewing requires a personal computer or a mainframe
19 (New York: John Wiley & Sons, 1978), pp. 260-267.

terminal at each station. In its simplest form, you program the questions on a floppy disk
and make a copy for each interviewer. The questions appear on the screen, and the
interviewer punches the answers into the computer and they are written on to the same
floppy disk. At the end of the evening, the disks are collected and the data compiled on a
master disk. If your personal computers are part of a network, the answers can be directed
to the file server as they are collected, and you can make running frequency counts. Some
mainframe and networked systems even allow for questionnaires to be revised on-line to
respond to news events that break while a survey is in progress.
If you use pencil and paper, design the form so that the answers are recorded on a
separate sheet of paper. A vertical format makes data entry easier. I prefer a three-column
answer sheet with the response spaces matched horizontally to the question sheets. That
reduces printing costs because you need one questionnaire per interviewer, not one per
respondent. And the answers will usually fit on one piece of paper, front and back, which
eliminates a lot of tiresome page turning during data entry.
Before finalizing a questionnaire and answer sheet, show the answer sheet to the
person who will be responsible for data entry to make certain that it is workable. When
data were entered on punched cards, it was standard practice to precode the answer sheets
so that the eventual column location of each item was indicated from the start. Now that
data entry folks work with direct computer input, that is not as necessary. But check it out
anyway to make sure you have not left any ambiguities.
Calling backYou will need to develop a paper trail to keep track of each interview attempted.
The more advanced CATI systems can do most of this work for you and even manage
the sample. Otherwise, you will have to keep interview attempts sorted into these
categories:
1. Completions.
2. Appointments to call back the next-birthday person.
3. Busy signals and non-answers that need to be tried again.

4. Refusals, nonworking numbers, business numbers, and other outcomes for
which substituting a number is allowed.
Naturally, you will want to keep track of all of these outcomes so that you can
spot inefficiencies in your operation and work to improve it.
How many times should you attempt a non-answer before you give up? Three
times on different days and at different times of day would be good. Journalists working
under deadline pressure can't always manage that. The Carolina Poll, conducted by the
students at the University of North Carolina at Chapel Hill, uses three call-backs spaced a
minimum of an hour apart. That usually forces one of the attempts to another day. Even
then, cleaning up the last few cases can be messy, and the Carolina Poll sometimes
switches to a quota sampling method for the last 10 or 20 percent of a project.
Quota samplingQuota sampling got a bad name when it was blamed for the bad election forecasts
made by all of the major polls in 1948. In fact, other mistakes contributed to that
spectacular error as well. Quota sampling still lives on in a less dangerous form when it is
used in combination with probability sampling for the last stage of respondent selection.
Probability sampling is used to choose a cluster: a cluster of homes or blocks in a
personal interview sample, or a cluster of telephone numbers from a single NNX in a
telephone sample. In its loosest form, the quota sampling method allows the interviewer
to select whoever is most readily available from then on, subject to loose age and sex
quotas. A simple way of setting the quota is to instruct the interviewer to speak to the
youngest male at each household. That compensates for the relative difficulty of finding
young people and males at home. If there is no young male present, the interviewer asks
for the youngest female.
In a slightly more rigorous form, call-backs are still made at the household level
to reduce the bias from non-answers and busy numbers, but the sample frame is limited to
whoever is at home once the phone is answered. Again, the youngest male is asked for
(females are more likely to answer the phone).
Sometimes the pressures of the news will limit the time available for fieldwork to
a single night, in which case quota sampling at the household level and instant
replacement of unavailable households will be necessary. The bias in favor of people who
are easy to find may or may not be important. For political topics, it often is. If you notice
instability in a series of competing pre-election polls, try dropping the one-nighters from
the comparison and see if what is left looks more consistent.
Collecting data by mailMail surveys are slow. And they can be surprisingly expensive. You have to do
more than get a list, write a questionnaire, send it out, and then wait for the postman to
bring you the results.
If you are thinking of doing one, put this book down and get the Dillman book
cited earlier. Dillman's advice comes in exquisite detail, down to what kind of envelope
to use and how to fold the questionnaire. (Some of his advice needs updating. For
example, he says it is okay to use a business-reply frank. Later research has shown that a
live stamp on the return envelope gets a better return. Apparently, potential respondents
hate to waste the stamp.)
A mail survey should not be too short. It will seem trivial and not worth bothering
about. If too long, it will seem like too much work. One sheet of 11 by 17-inch paper,
folded to make four letter-size pages, is about right. Enclose a come-on letter and a
stamped, addressed return envelope. Mark the letter or the questionnaire with a visible
code so you will know who has responded and explain the purpose of the code – along
with any assurances of confidentiality you want to give – in the come-on letter. At the
same time you prepare this material, prepare a reminder postcard, to be sent five days
after the original mailing without waiting to see who responds unprompted. (Naturally,
the card will include some apologetic language: i.e., “If you have already responded,
please accept our thanks.”) After two weeks, send a reminder letter with a fresh copy of
the questionnaire to the nonrespondents.
A personal computer database program like Paradox or PC-File is useful for
managing the mailing list and keeping track of the returns. The trick is to get a healthy
response rate of two-thirds or better. So always choose a sample small enough to leave
the time and resources for vigorous follow-up–including pleading phone calls if
necessary –to motivate nonrespondents.
Mixed-mode surveysMixing mail and telephone methods works well when you need to show an
exhibit for the respondent to judge: a sample product, a newspaper layout, or a
photograph of a blooming celebrity, for example. You can use random digit dialing
sampling for the initial contact, get the respondent to agree to accept the mailing, and
then call him or her back to ask questions about the mailed material. Again, a personal
computer is helpful in keeping track of who has agreed to do what.
The USA Today 1989 fall television evaluation project was a mixed-mode survey
in that the telephone was used for the initial contact and for asking questions to identify
frequent TV viewers. Then respondents who met the criteria were offered $40 to come to
a central location to watch the shows and evaluate them on a self-administered
questionnaire. The respondents had already passed one level of telephone screening. The
research supplier who recruited them maintained a list of thousands of people who had
expressed interest in evaluating products. With such a group it is sometimes difficult to
know to whom you can generalize: heavy TV viewers in Dallas who are interested in
product evaluation and could use $40 and aren't doing anything else that night. There is
no problem with doing that so long as readers are advised and no pretense is made that
the group represents the nation's TV watchers as a whole. They are still likely to be more
representative than your average jaded newspaper TV critic.
Make-or-buy decisionsAny news organization that does a lot of polling sooner or latter has to make what
business schools call the make-or-buy decision. Is it better to farm the polling out to a
firm that specializes in the work, or to do it yourself?
The important thing to recognize about this decision is that it is not all or nothing.
Different pieces of a project can be separated and done in-house or sent out. The general
rule to remember is this:
Doing work in-house hides costs and reveals inefficiencies. Work sent out has
visible costs and hidden inefficiency.
Sampling is a piece of a survey project that is easily severable. So is the
fieldwork. You give the supplier a sample and a questionnaire and he or she gives you
back a stack of completed questionnaires. Putting the questionnaires into computer-
readable form is readily farmed out to a data entry specialist. Analysis is not so readily
delegated. That is really a journalistic function and something that should be done by the
news organization's own people.
Doing it all yourself may look cheap, but that's because you aren't counting the
whole cost: overhead for your plant and equipment, for example, and the salaries of all
the people in your organization who will help you. The main reason for doing it yourself
is to maintain control, to restrict the journalistic functions to journalists. Survey research
is a powerful tool, and a news organization can keep it under control by keeping it in-
house.