chapter 5. reliability block diagrams (rbd) · 2018-05-02 · pt1 pt2 the example above illustrates...
TRANSCRIPT

Chapter 5.Reliability Block Diagrams (RBD)
Mary Ann Lundteigen Marvin Rausand
RAMS GroupDepartment of Mechanical and Industrial Engineering
NTNU
(Version 0.1)
Lundteigen& Rausand Chapter 5.Reliability Block Diagrams (RBD) (Version 0.1) 1 / 20

Introduction
Learning Objectives
The main learning objectives associated with these slides are to:
1. Briefly present the main properties of reliability block diagrams (RBDs)
2. Briefly present the main approach to developing structure functions
3. Present formulas for quantifying reliability based on structurefunctions, including:
4. Probality of failure
5. Mean time to failure (MTTF)
The slides include topics from Chapter 5in Reliability of Safety-CriticalSystems: Theory and Applications. DOI:10.1002/9781118776353.
Lundteigen& Rausand Chapter 5.Reliability Block Diagrams (RBD) (Version 0.1) 2 / 20

Introduction
Outline of Presentation
1 Introduction
2 RBD Basics
3 Structure Function
4 System Reliability
5 Repairable Systems
Lundteigen& Rausand Chapter 5.Reliability Block Diagrams (RBD) (Version 0.1) 3 / 20

RBD Basics
Reliability Block Diagrams (RBD)
Z RBD: A diagram that gives the relationship between component statesand the success or failure of a specified system function.
Some key a�ributes of RBDs:I Illustrates the state of a specified system with several itemsI Constitutes functional blocks depicted as rectangles or squaresI Has a success-oriented logical layout that gives the necessary
conditions for functioning as specifiedI Can be used to derive analytical formulas for reliability and availability
Lundteigen& Rausand Chapter 5.Reliability Block Diagrams (RBD) (Version 0.1) 4 / 20

RBD Basics
RBD applied to SIF
The logical layout in an RBD can be as series system, parallel system, or acombination.
Z Parallel structure (or system): A system that is functioning if at least oneof its n items is functioning.
Z Series structure (or system): A system that is functioning if and only ifall of its n items are functioning.
Lundteigen& Rausand Chapter 5.Reliability Block Diagrams (RBD) (Version 0.1) 5 / 20

RBD Basics
RBD Developed for a SIF
Each subsystem of a SIF can be represented as a functional block in theRBD, and each of these can be developed further with the relevantstructure.
Sensorsubsystem
Final elementsubsystem
Logic solversubsystem
(a) (b)Sensorsubsystem
PT1
PT2
The example above illustrates the RBD of a SIF, including the underlyingRBD for the two redundant pressure transmi�ers (PTs).
Lundteigen& Rausand Chapter 5.Reliability Block Diagrams (RBD) (Version 0.1) 6 / 20
Structure Function
Item and System State
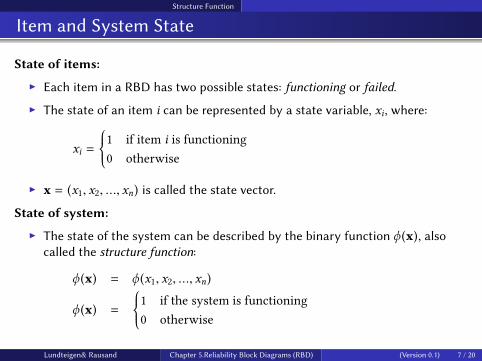
State of items:
I Each item in a RBD has two possible states: functioning or failed.
I The state of an item i can be represented by a state variable, xi, where:
xi =
1 if item i is functioning0 otherwise
I x = (x1, x2, ..., xn) is called the state vector.
State of system:
I The state of the system can be described by the binary function ϕ (x), alsocalled the structure function:
ϕ (x) = ϕ (x1, x2, ..., xn)
ϕ (x) =
1 if the system is functioning0 otherwise
Lundteigen& Rausand Chapter 5.Reliability Block Diagrams (RBD) (Version 0.1) 7 / 20

Structure Function
Series and Parallel Structures
The structure function of a series structure is:
ϕ (x) = x1 · x2 · · · xn =n∏i=1
xi
The structure function of a parallell structure is:
ϕ (x) = 1 − (1 − x1) (1 − x2) · · · (1 − xn) = 1 −n∏i=1
(1 − xi)
Lundteigen& Rausand Chapter 5.Reliability Block Diagrams (RBD) (Version 0.1) 8 / 20

Structure Function
koon Structures
A special case is the koon voted system, which is functioning if (at least) kout of n items are functioning. This means that the structure functionbecomes:
ϕ (x) =
1 if∑k
i=1 xi ≥ k0 otherwise
The most easy way to set up the structure function for a system with idi�erent items is to first determine the minimal path sets and then use thefact tha�he system is functioning if the items of at least one path set isfunctioning (or alternatively, determine the minimal cut sets, and use thefact that the system fails if the items contained in one or more of the cutsets fail).
Lundteigen& Rausand Chapter 5.Reliability Block Diagrams (RBD) (Version 0.1) 9 / 20

Structure Function
Minimal Path Sets
Z Minimal path set: A minimal path is a set of items that if functioningsecures that the system is functioning. A path set is said to be minimal if itcannot be reduced without loosing its status as a path set.
Example
Path sets are: {1,2}, {1,3}, {2,3},and {1,2,3}. The three first onesare minimal.
1
1
2
2 3
3)b()a(
Lundteigen& Rausand Chapter 5.Reliability Block Diagrams (RBD) (Version 0.1) 10 / 20

Structure Function
Minimal Cut Sets
Z Minimal cut set: A minimal cut is a set of items that by failing securesthat the system fails. A cut set is said to be minimal if it cannot be reducedwithout losing its status as a path set.
Example
Cut sets are: {1,2}, {1,3}, {2,3},and {1,2,3}. The three firstones are minimal. Note that inthis particular case, the minimalcut sets become identical to theminimal path sets.
1
1
2
2 3
3)b()a(
Lundteigen& Rausand Chapter 5.Reliability Block Diagrams (RBD) (Version 0.1) 11 / 20

Structure Function
Structure Function of a SIF
Consider a SIF with a sensor subsystem with 2oo3 voted pressuretransmi�ers (PTs), one logic solver (LS), and two 1oo2 voted shutdownvalves (SDVs).
The structure function is:
ϕ (x) = (xPT1xPT2 + xPT1xPT3 + xPT2xPT3 − 2xPT1xPT2xPT3) · xLS· (xSDV1 + xSDV2 − xSDV1xSDV2)
PT1 PT2
LSPT1 PT3
PT2 PT3
SDV1
SDV2
Lundteigen& Rausand Chapter 5.Reliability Block Diagrams (RBD) (Version 0.1) 12 / 20

System Reliability
Reliability Function
In the structure function, the state variable xi is a deterministic quantity(functioning or failed).
In system reliability analyses, we consider the state variables as random anddependent on time, denoted xi instead of Xi (t).
The randomness makes it of interest to determine the probability of being ina specific state, functioning or failed:
Pr(Xi (t) = 1) = Pr(T > t) = pi (t)
Pr(Xi (t) = 0) = Pr(T < t) = 1 − Pr(T > t) = 1 − pi (t)
Lundteigen& Rausand Chapter 5.Reliability Block Diagrams (RBD) (Version 0.1) 13 / 20

System Reliability
Reliability Function (Item Level)
We o�en refer to pi (t) as:I The survival function Ri (t) for item i, if the item is non-repairable, andI The availability function Ai (t) for item i, if the item is repairable (i.e.,
repaired upon failure)
Example
The survival function for an item where we assume exponential time tofailure is:
Ri (t) = e−λit
where λi is the constant failure rate of item i and t is the time at which thesurvival probability is calculated.
Lundteigen& Rausand Chapter 5.Reliability Block Diagrams (RBD) (Version 0.1) 14 / 20

System Reliability
Reliability Function (System Level)
For non-repairable systems, the reliability functions (ps (t)) are:
System Reliability function ps (t)
Series structure∏n
i=1 pi (t)
Parallel structure 1 −∏n
i=1 (1 − pi (t))
koon structure∑nj=k
(nj
)p(t)j (1 − p(t))n−j
(identical items)
Note that the koon here constitutes identical componentsp1 (t), p2 (t) · · · pn (t) are equal and equal to p(t).
Lundteigen& Rausand Chapter 5.Reliability Block Diagrams (RBD) (Version 0.1) 15 / 20

System Reliability
Reliability Function (System Level)
For non-repairable systems, assuming expontially distributed time tofailure, we get:
System Reliability function Rs (t)
Series structure∏n
i=1 e−λit = e−(
∑ni=1 λi )t
Parallel structure 1 −∏n
i=1 (1 − e−λit )
koon structure∑nj=k
(nj
)e−jλit (1 − e−λit )n−j
(identical items)
Lundteigen& Rausand Chapter 5.Reliability Block Diagrams (RBD) (Version 0.1) 16 / 20

System Reliability
Mean Time to Failure (MTTF)
For non-repairable systems, we may calculate the MTTF at the item leveland at the system level.
Item level:
MTTF =∫ ∞t=0
Ri (t)dt
System level:
MTTF =∫ ∞t=0
Rs (t)dt
Example
A series system of two components has MTTF equal:
MTTF =∫ ∞t=0
e−(λ1+λ2 )tdt =1
λ1 + λ2
Lundteigen& Rausand Chapter 5.Reliability Block Diagrams (RBD) (Version 0.1) 17 / 20

System Reliability
A 2oo4 system
Consider a subsystem of four identical components in a 2oo4 voted structure. Thecomponent type has a constant failure rate λ.
The survival function becomes:
Rs (t) =4∑j=2
(4j
)e−jλt (1 − e−λt )4−j
= 6e−2λt − 8e−3λt + 3e−4λt
MTTF becomes:
MTTF =62λ−
83λ+
34λ=
1312λ
Lundteigen& Rausand Chapter 5.Reliability Block Diagrams (RBD) (Version 0.1) 18 / 20

Repairable Systems
Repairable Systems
For repairable systems, we replace each survival probabilities pi (t) by itsavailability Ai (t).
O�en, we work with average availabilities (Ai) rather than the time dependentavailabilities, and more specifically average unavailabilities (Ai).
I Consider a series system of two components, with failure rates λ1 and λ2,respectively:
A1 = Pr(Comp 1 fails first|an item has failed) = Pr(T2 > T1)
=λ1
λ1 + λ2
I The same can be set up for Component 2 (A2).
Lundteigen& Rausand Chapter 5.Reliability Block Diagrams (RBD) (Version 0.1) 19 / 20
Repairable Systems
Repairable Systems
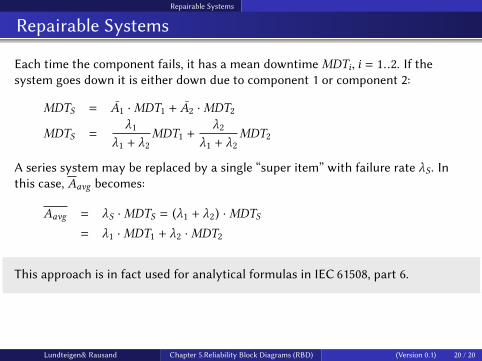
Each time the component fails, it has a mean downtime MDTi, i = 1..2. If thesystem goes down it is either down due to component 1 or component 2:
MDTS = A1 ·MDT1 + A2 ·MDT2
MDTS =λ1
λ1 + λ2MDT1 +
λ2λ1 + λ2
MDT2
A series system may be replaced by a single “super item” with failure rate λS . Inthis case, Aavg becomes:
Aavg = λS ·MDTS = (λ1 + λ2) ·MDTS= λ1 ·MDT1 + λ2 ·MDT2
This approach is in fact used for analytical formulas in IEC 61508, part 6.
Lundteigen& Rausand Chapter 5.Reliability Block Diagrams (RBD) (Version 0.1) 20 / 20