chapter 5 productive functions of forest resources · productive functions of forest resources...
TRANSCRIPT

85
Chapter 5
Productive functions of forest resources
OVERVIEW Forests, other wooded land and trees outside forests provide a wide range of wood and non-wood forest products. The productive function of forest resources is a traditional thematic element and one of the main objectives of forest resources assessments. It indicates the economic and social utility of forest resources to national economies and forest-dependent local communities and reflects the wish to maintain an ample and valuable supply of primary forest products, while at the same time ensuring that production and harvesting are sustainable and do not compromise the management options of future generations for productive or other functions of forests.
Earlier assessments were focused on timber supply, but the concept of forest production has since widened to encompass all types of wood and non-wood forest products. As part of the FRA 2010 process, information was collected on the following variables related to the productive function of forest resources16:
• area of forest designated for production;• area of planted forests;• areas of afforestation and reforestation;• removals of wood products;• removals of non-wood forest products (NWFPs). Many products are extracted from forests, ranging from wood for timber and
fuelwood to food (berries, mushrooms, edible plants, bushmeat), fodder and other NWFPs. By quantity, industrial roundwood and woodfuel are the most important products; among NWFPs, food and fodder are the most significant.
KEY FINDINGSThirty percent of the world’s forests are primarily used for production of wood and non-wood forest productsClose to 1.2 billion hectares of forest are managed primarily for the production of wood and non-wood forest products. An additional 949 million hectares (24 percent) are designated for multiple use – in most cases including the production of wood and non-wood forest products. The area designated primarily for productive functions has decreased by more than 50 million hectares since 1990, or 0.22 percent annually as forests have been designated for other purposes. The area designated for multiple use has increased by 10 million hectares in the same period.
The area of planted forest is increasing and now accounts for 7 percent of total forest areaForests and trees are planted for many purposes and make up an estimated 7 percent of the total forest area, or 264 million hectares. Five countries (China, the United
16 Not all planted forests are designated for productive functions, but since no information was solicited on the designated functions of planted forests, the information gathered on them and on afforestation and reforestation is presented in this chapter.

Global Forest Resources Assessment 201086
States of America, the Russian Federation, Japan and India) account for more than half (53 percent) of this area. Some arid zone countries and the Netherlands report that all their forests are planted. Between 2000 and 2010, the area of planted forest increased by about 5 million hectares per year. Most of this was established through afforestation (i.e. planting of areas not classified as forest) particularly in China.
The rate of establishment of planted forests has increased in the past 10 years compared with the 1990s in most regions except for Europe. Given the current trend, a further rise can be anticipated in the area of planted forest to 300 million hectares by 2020.
Three-quarters of all planted forests consist of native species The remaining quarter comprises introduced species. In sub-Saharan Africa, Oceania and South America a number of countries with a significant area of planted forests report that they almost exclusively plant introduced species. In the temperate and boreal zones of Europe and North America and in arid zone countries introduced species are used to a minor extent.
More than 10 million hectares per year are afforested or reforested each year In the 10-year period from 1998 to 2007, at the global level, altogether more than 10 million hectares per year were afforested and reforested, mostly with indigenous species. China accounts for a large proportion of this area. Introduced species are used, on average, at a rate of 29 percent in afforestation and 36 percent in reforestation.
Wood removals increased between 2000 and 2005, following a fall in the 1990s At the global level, reported wood removals in 2005 amounted to 3.4 billion cubic metres annually, similar to the volume recorded for 1990 and equivalent to 0.7 percent of the total growing stock. Considering that informally and illegally removed wood, especially woodfuel, is not usually recorded, the actual amount of wood removals is undoubtedly higher. At the global level, woodfuel accounted for about half of the removed wood. Wood removals from other wooded land amounted to 299 million cubic metres or 9 percent of total wood removals in 2005. The proportions of industrial roundwood and woodfuel did not change significantly between 1990 and 2005.
Food is the largest category of NWFP removals globallyOther important categories include exudates, other plant products, wild honey andbeeswax, and ornamental plants. Asia, and in particular China, reported the largestvolume of NWFP removals, most of which are of plant origin (camellia, oil seeds, nuts andbamboo products). The sheer size of the removals reported by China dwarfs any othercountry’s removals. Europe has the highest reported level of animal-based NWFPremovals.
KEY CONCLUSIONSMore than half of the world’s forests are designated primarily for the production of wood and NWFPs or have productive functions as part of the management objective. In addition to meeting the demands for wood and a large range on NWFPs, these forests provide income and employment to millions of people worldwide.
The decrease in the area of forest designated primarily for productive functions reflects an increased reliance on planted forests and more intensively managed natural forests for wood production and a partial shift in designation from production to multiple use in line with increasing demands for other services provided by forests.
The area of planted forests is increasing rapidly and most of the long-term growth in wood supply is occurring in countries that have established planted forests during the

Productive functions of forest resources 87
last few decades. In spite of data limitations it is evident that wood supply (particularly industrial roundwood) is shifting from natural forests to planted forests.
It is thus foreseen that planted forests will increasingly contribute to the supply of the world’s wood, fibre, fuel and NWFPs (as well as protecting soil and water resources and fulfilling other purposes) and that this shift may reduce the pressure on natural forests. The impact of this development on timber markets should be considered by policy-makers, planners and forest managers and supported by outlook studies that evaluate the future contribution of planted forests to economic, environmental and social services.
Information on NWFPs continue to be poor and efforts should be made to improve data collection and analysis given their importance in support of local livelihoods and also their substantive contribution to the national economy in some countries.
Reporting on afforestation and reforestation was introduced for the first time in FRA 2010 in an attempt to obtain better information on forest change dynamics. Although a large number of countries were able to report on these variables, significant issues still need to be resolved before a complete balance sheet of gains and losses in forest area over time can be reported by all countries.
AREAS DESIGNATED FOR PRODUCTIVE FUNCTIONS Introduction Forest areas that have been designated for productive functions bear no legal, economic or technical restrictions on wood production and serve primarily for the production of various commodities, including roundwood (industrial roundwood and woodfuel) and NWFPs. They have been designated either by legal prescription or by decision of the landowner or manager. In these forests production is reported as the ‘primary function’, which is considered to be significantly more important than other functions.
StatusBased on information from the 205 countries and areas that reported on this variable – together accounting for 99.9 percent of the total forest area – at the global level, close to 1.2 billion hectares or 30 percent of the total forest area have production designated as the main function in 2010 (see Table 5.1 and Figure 5.1).
The regional results indicate some marked differences in the perception and designation of forest functions. Europe has the highest share of forest where production is the primary function (52 percent of its forest area), while North America and South America reported only 14 percent designated for production. North America reported most of its forest area as designated for multiple use, while South America showed a fairly equal distribution across the five main forest functions (production, protection, conservation, social services and multiple use). A number of countries with forest areas above 10 million hectares designated more than 70 percent of their forest area to multiple use (the Plurinational State of Bolivia, Botswana, Canada, Central African Republic, Ethiopia, Germany, Iran, Mexico and Zimbabwe). See Table 5 in Annex 3.
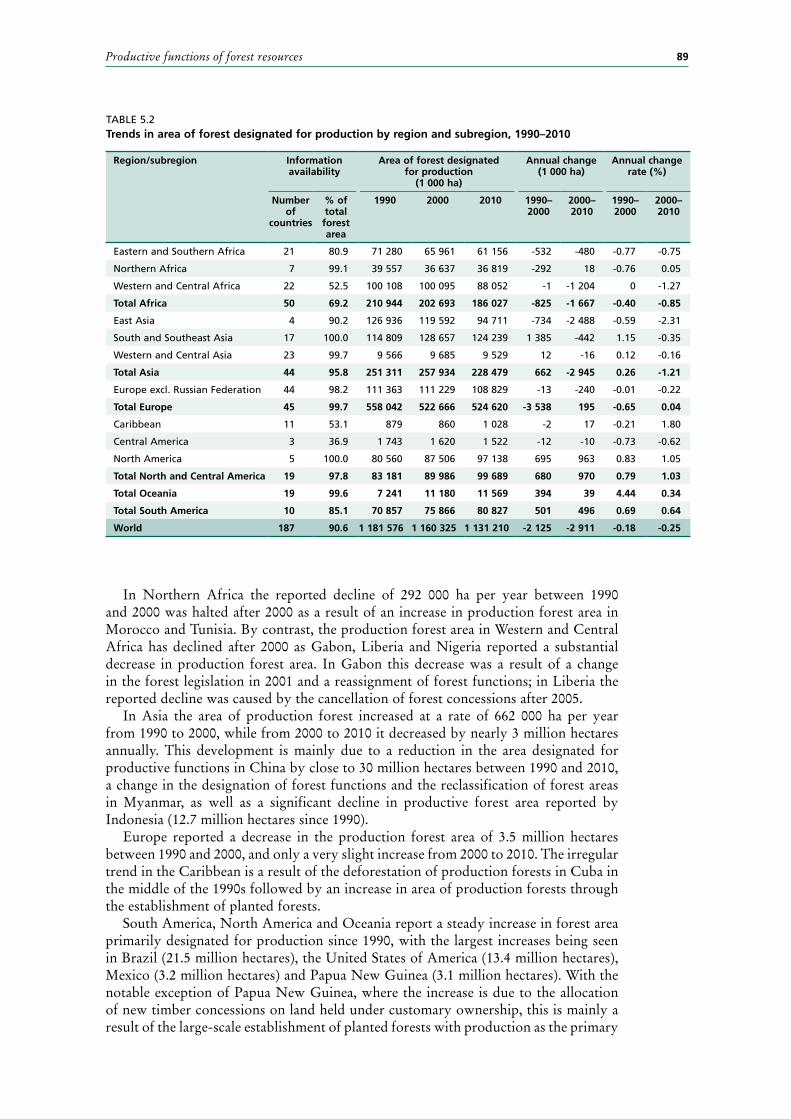
TrendsThe analysis of trends in area of forest designated primarily for production is based on the countries that reported a complete time series for 1990, 2000, 2005 and 2010 (187 countries representing 90.6 percent of the global forest area). The results are shown in Table 5.2.
Globally since 1990, there has been a slightly decreasing trend in the area of forest with production as the primary function. The decline amounts to 2.5 million hectares per year (-0.22 percent annually) for the period from 1990 to 2010. Many regions and subregions follow this global trend, while Northern Africa, Western and Central Africa, Asia, Europe and the Caribbean show an irregular pattern.

Global Forest Resources Assessment 201088
TABLE 5.1 Area of forest designated for production by region and subregion, 2010
Region/subregion Information availability Area of forest designated for production
Number of countries
% of total forest area
1 000 ha % of total forest area
Eastern and Southern Africa 23 100.0 73 077 27
Northern Africa 7 99.1 36 819 47
Western and Central Africa 24 100.0 95 141 29
Total Africa 54 99.9 205 037 30
East Asia 5 100.0 98 978 39
South and Southeast Asia 17 100.0 124 239 42
Western and Central Asia 24 100.0 9 537 22
Total Asia 46 100.0 232 754 39
Europe excl. Russian Federation 45 100.0 110 855 57
Total Europe 46 100.0 526 646 52
Caribbean 12 53.8 1 030 28
Central America 7 100.0 3 613 19
North America 5 100.0 97 138 14
Total North and Central America 24 99.5 101 781 14
Total Oceania 21 99.8 11 656 6
Total South America 14 100.0 118 295 14
World 205 99.9 1 196 168 30
FIGURE 5.1Proportion of forest area designated for production by country, 2010
(% of forest area)
0–20
20–40
40–60
80–100
No data
60–80
Productive functions of forest resources 89
In Northern Africa the reported decline of 292 000 ha per year between 1990 and 2000 was halted after 2000 as a result of an increase in production forest area in Morocco and Tunisia. By contrast, the production forest area in Western and Central Africa has declined after 2000 as Gabon, Liberia and Nigeria reported a substantial decrease in production forest area. In Gabon this decrease was a result of a change in the forest legislation in 2001 and a reassignment of forest functions; in Liberia the reported decline was caused by the cancellation of forest concessions after 2005.
In Asia the area of production forest increased at a rate of 662 000 ha per year from 1990 to 2000, while from 2000 to 2010 it decreased by nearly 3 million hectares annually. This development is mainly due to a reduction in the area designated for productive functions in China by close to 30 million hectares between 1990 and 2010, a change in the designation of forest functions and the reclassification of forest areas in Myanmar, as well as a significant decline in productive forest area reported by Indonesia (12.7 million hectares since 1990).
Europe reported a decrease in the production forest area of 3.5 million hectares between 1990 and 2000, and only a very slight increase from 2000 to 2010. The irregular trend in the Caribbean is a result of the deforestation of production forests in Cuba in the middle of the 1990s followed by an increase in area of production forests through the establishment of planted forests.
South America, North America and Oceania report a steady increase in forest area primarily designated for production since 1990, with the largest increases being seen in Brazil (21.5 million hectares), the United States of America (13.4 million hectares), Mexico (3.2 million hectares) and Papua New Guinea (3.1 million hectares). With the notable exception of Papua New Guinea, where the increase is due to the allocation of new timber concessions on land held under customary ownership, this is mainly a result of the large-scale establishment of planted forests with production as the primary
TABLE 5.2 Trends in area of forest designated for production by region and subregion, 1990–2010
Region/subregion Information availability
Area of forest designated for production
(1 000 ha)
Annual change (1 000 ha)
Annual change rate (%)
Number of
countries
% of total forest area
1990 2000 2010 1990–2000
2000–2010
1990–2000
2000–2010
Eastern and Southern Africa 21 80.9 71 280 65 961 61 156 -532 -480 -0.77 -0.75
Northern Africa 7 99.1 39 557 36 637 36 819 -292 18 -0.76 0.05
Western and Central Africa 22 52.5 100 108 100 095 88 052 -1 -1 204 0 -1.27
Total Africa 50 69.2 210 944 202 693 186 027 -825 -1 667 -0.40 -0.85
East Asia 4 90.2 126 936 119 592 94 711 -734 -2 488 -0.59 -2.31
South and Southeast Asia 17 100.0 114 809 128 657 124 239 1 385 -442 1.15 -0.35
Western and Central Asia 23 99.7 9 566 9 685 9 529 12 -16 0.12 -0.16
Total Asia 44 95.8 251 311 257 934 228 479 662 -2 945 0.26 -1.21
Europe excl. Russian Federation 44 98.2 111 363 111 229 108 829 -13 -240 -0.01 -0.22
Total Europe 45 99.7 558 042 522 666 524 620 -3 538 195 -0.65 0.04
Caribbean 11 53.1 879 860 1 028 -2 17 -0.21 1.80
Central America 3 36.9 1 743 1 620 1 522 -12 -10 -0.73 -0.62
North America 5 100.0 80 560 87 506 97 138 695 963 0.83 1.05
Total North and Central America 19 97.8 83 181 89 986 99 689 680 970 0.79 1.03
Total Oceania 19 99.6 7 241 11 180 11 569 394 39 4.44 0.34
Total South America 10 85.1 70 857 75 866 80 827 501 496 0.69 0.64
World 187 90.6 1 181 576 1 160 325 1 131 210 -2 125 -2 911 -0.18 -0.25

Global Forest Resources Assessment 201090
17 This percentage may have decreased since then, as a large proportion of the increase in planted forests has taken place in China and many of these are established for protective purposes (desertification control and protection of soil and water resources).
function. Peru reports a remarkable decrease in production forest area of 15 million hectares since 2000 due to a change in forest legislation favouring the designation of forest area for conservation and protection.
Conclusions The reported 1.2 billion hectares of forest area primarily designated for production gives an indication of the importance of this function. However, it is a considerable underestimate of the available forest resource base for the production of wood and non-wood forest products, as a substantial part of the 949 million hectares of forest area assigned to multiple use also has productive functions. Furthermore, the removal of NWFPs is often allowed in parts of areas designated for the protection of soil and water resources or the conservation of biological diversity.
The decrease over time reflects an increased reliance on planted forests and more intensively managed natural forests for wood production and a partial shift in designation from production to multiple use.
PLANTED FORESTSIntroductionPlanted forests are composed of trees established through planting and/or through deliberate seeding of native or introduced species. Establishment is either through afforestation on land that until then was not classified as forest, or by reforestation of land classified as forest, for instance after a fire or a storm or following clearfelling. The concept of planted forests is broader than the concept of forest plantations used in previous global assessments. This change was made to capture all planted forests and is in line with the recommendations of the Global Planted Forests Thematic Study 2005 (FAO, 2006d) and recent efforts to develop guidelines and best practices for the establishment and management of planted forests.
Planted forests are established for different purposes and not all of them are designated for production of wood or NWFPs. However, no information was solicited on the area of planted forests designated for productive and protective purposes for FRA 2010. Based on the results of the Global Planted Forests Thematic Study 2005, it is estimated that around 76 percent of planted forests have production as their primary function17. This should be kept in mind when interpreting the findings below, which cover all planted forests irrespective of their designated functions.
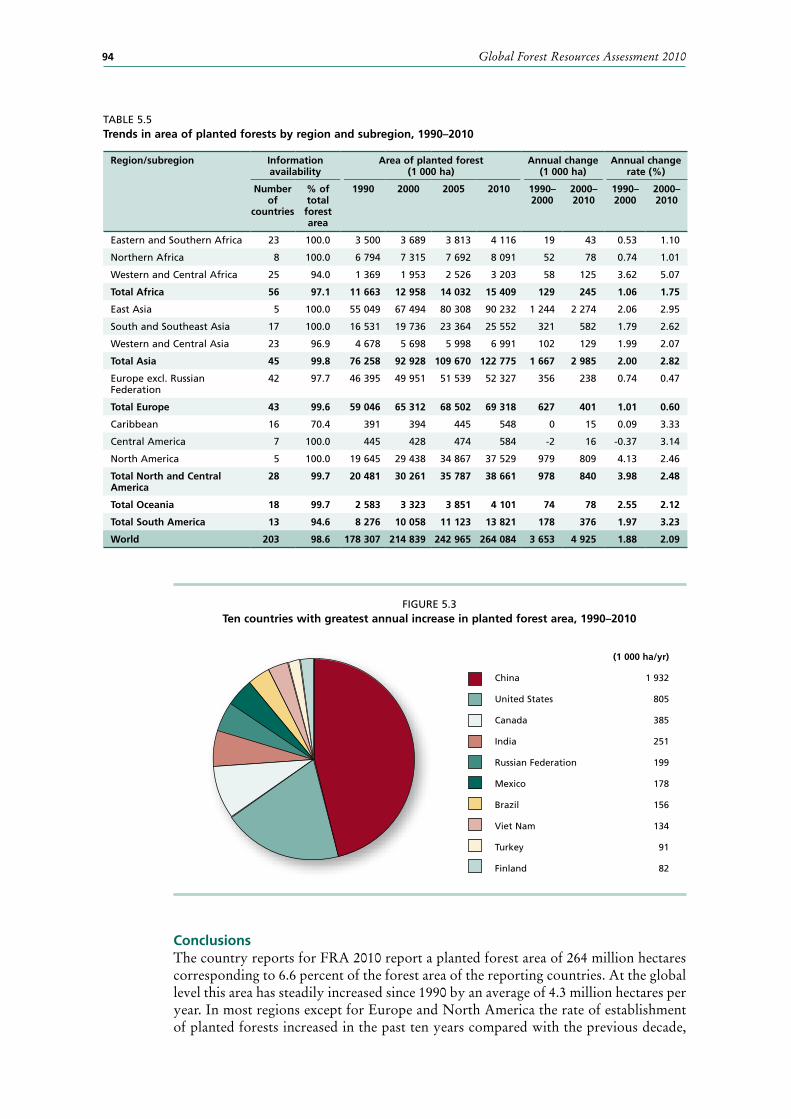
StatusA total of 203 countries and areas, representing 98.6 percent of the global forest area, reported on their area of planted forests. (Cameroon only reported for 2005. For the purpose of this analysis, this figure has been assumed to be valid for 2010 also.) The total area of planted forest as of 2010 is estimated to be 264 million hectares, corresponding to 6.6 percent of the forest area. The planted forest area by region and subregion is presented in Table 5.3.
East Asia, Europe and North America reported the greatest area of planted forests, together accounting for about 75 percent of global planted forest area. In East Asia planted forests make up 35 percent of the total forest area; most of these are found in China. The second largest area of planted forests is found in Europe, although the share of planted forests here is close to the world average. However, if the Russian Federation with its vast area of natural forest is excluded from Europe, the share of planted forests in Europe increases to 27 percent, the second highest proportion in

Productive functions of forest resources 91
the world. North America has the third largest area of planted forests with a share of 5.5 percent of the total forest area in this subregion. Subregions reporting the smallest area of planted forests are the African subregions, the Caribbean, Central America and Western and Central Asia.
In most subregions, the majority of the planted forests are found in just a few countries. For instance, in Northern Africa 75 percent of the planted forest area is located in Sudan; in East Asia, 86 percent is found in China; and in South and Southeast Asia, 90 percent is in India, Indonesia, Malaysia, Thailand and Viet Nam. Some arid zone countries (Cape Verde, Egypt, Kuwait, Libyan Arab Jamahiriya, Oman, United Arab Emirates) and the Netherlands report that all their forests have been established through planting or deliberate seeding.
In total, there are 33 countries with a planted forest area above 1 million hectares which together account for 90 percent of the global planted forest area (see Figure 5.2). Of these, China, the United States of America, the Russian Federation, Japan and India together account for more than half the world’s planted forests (53 percent).
The area of planted forest reported for FRA 2010 is lower than that reported in the Global Planted Forests Thematic Study 2005 (FAO, 2006d). A comparison of the figures recorded for 2005 in FRA 2010 with the estimates for 2005 provided in the Thematic Study reveals a difference of more than 38 million hectares, with the figures presented in FRA 2010 being 14 percent lower than the figures in the Thematic Study. The difference is mainly caused by revised estimates provided for FRA 2010 by India (down by more than 20 million hectares), China and the Republic of Korea in Asia, and by France, Germany, Portugal, Romania and Sweden in Europe, as well as missing estimates from Austria and the Bolivarian Republic of Venezuela.
In FRA 2010 countries also reported on the use of introduced species in the establishment of planted forests. Globally, of the 233 countries and areas included, 90 reported that they have planted introduced species, while 17 countries reported that they have not used introduced species in the establishment of planted forests. The remaining 116 countries and areas did not report on the use of introduced species.
TABLE 5.3 Area of planted forests by region and subregion, 2010
Region/subregion Information availability Area of planted forest
Number of countries
% of total forest area
1 000 ha % of total forest area
Eastern and Southern Africa 23 100.0 4 116 1.5
Northern Africa 8 99.1 8 091 10.3
Western and Central Africa 24 100.0 3 203 1.0
Total Africa 55 100.0 15 409 2.3
East Asia 5 100.0 90 232 35.4
South and Southeast Asia 17 100.0 25 552 8.7
Western and Central Asia 23 96.9 6 991 16.6
Total Asia 45 99.8 122 775 20.8
Europe excl. Russian Federation 42 97.7 52 327 27.3
Total Europe 43 99.6 69 318 6.9
Caribbean 16 70.4 548 11.2
Central America 7 100.0 584 3.0
North America 5 100.0 37 529 5.5
Total North and Central America 28 99.7 38 661 5.5
Total Oceania 18 99.7 4 101 2.1
Total South America 13 94.6 13 821 1.7
World 203 98.6 264 084 6.6

Global Forest Resources Assessment 201092
TABLE 5.4Use of introduced species in planted forests by region and subregion, 2010
Region/subregion Information availability
Area of planted forest Area of planted forest comprising primarily of
introduced species
Number of countries
% of total forest area
1 000 ha % of total area of
planted forest
1 000 ha % of planted forest area
Eastern and Southern Africa 13 37.1 3 012 73 3 007 99.8
Northern Africa 5 97.5 7 449 92 481 6.5
Western and Central Africa 12 26.5 1 778 56 1 251 70.4
Total Africa 30 39.0 12 239 79 4 740 38.7
East Asia 2 83.7 89 306 99 22 828 28.9
South and Southeast Asia 6 27.7 10 846 42 1 735 16.0
Western and Central Asia 12 47.0 4 445 64 162 3.6
Total Asia 20 53.2 104 596 85 24 725 26.2
Europe excl. Russian Federation 30 82.2 41 913 80 7 183 17.1
Total Europe 31 96.5 58 904 85 7 183 12.2
Caribbean 11 67.0 519 95 164 31.6
Central America 3 44.8 94 16 76 80.7
North America 3 44.8 25 364 68 435 1.7
Total North and Central America 17 45.0 25 977 67 675 2.6
Total Oceania 10 84.5 3 931 96 3 027 77.0
Total South America 9 76.0 12 375 90 12 019 97.1
World 117 66.6 218 022 83 52 369 25.2
FIGURE 5.2Area of planted forest by country, 2010
(million ha)
< 1
1–2.5
2.5–5
> 20
No data
5–20

Productive functions of forest resources 93
The results are compiled in Table 5.4. It should be noted that they refer only to those 117 countries that reported on the use of introduced species. Together, they account for 67 percent of all forests and 83 percent of all planted forests.
At the global level introduced species grow on one quarter (25 percent) of the planted forest area of the countries that reported on this variable. However, there are marked differences by region and subregion. In the tropical and subtropical regions a number of countries with a significant area of planted forest report that they almost exclusively use introduced species for the establishment of planted forests. This is particularly the case in Eastern and Southern Africa (Kenya, Madagascar, Malawi, South Africa, Uganda and Zimbabwe) and in Western and Central Africa (Burundi, Cape Verde and Niger). Planted forests are also predominantly composed of introduced species in Oceania (New Zealand) and in South America (Argentina, Bolivia, Brazil, Chile, Ecuador and Uruguay). In East Asia, China uses introduced species on around one quarter (28 percent) of the planted forest area while Japan did not report. In South and Southeast Asia a number of countries with a significant area of planted forest did not report on the use of introduced species (Indonesia, Malaysia, Thailand and Viet Nam). In Western and Central Asian countries (e.g. Turkey) the use of introduced species is very low, while other countries in this subregion did not report. In the temperate and boreal regions of Europe and North America and in the arid zone countries of Northern Africa introduced species are only used to a minor extent.
TrendsThe analysis of trends in the extent of planted forests is based on 203 countries that reported an almost complete time series from 1990 to 2010. Sixteen countries and areas did not provide a complete time series (Cameroon, Ecuador, Estonia, French Polynesia, Guyana, Honduras, Indonesia, Jordan, Lebanon, Mexico, Nicaragua, Niue, Portugal, Republic of Korea, Samoa and Saint Vincent and the Grenadines). In these cases a reasonable estimate was added to the database in order to obtain a comparable total for regions and subregions. The missing data for 1990 and 2000 were estimated to be the same as the reported numbers for 2000 and 2005 respectively. The missing figure for 2010 for Cameroon was estimated to be the same as that reported for 2005. Where a clear trend could be observed in the figures reported for 2000, 2005 and 2010 this trend was extrapolated to complement the missing year 1990. Thirty countries and areas did not report any figures from 1990 to 2010 and were excluded from the analysis. The results are shown in Table 5.5.
Since 1990 the planted forest area has steadily increased in all regions and subregions. At the global level, the planted forest area increased by more than 3.6 million hectares per year from 1990–2000, by 5.6 million hectares per year from 2000–2005, and by 4.2 million hectares per year from 2005–2010. In the last decade the planted forest area has increased by an average of almost 5 million hectares every year.
The steadily rising trend in planted forest area varies considerably among subregions. Figure 5.3 presents the trends for the ten countries with the highest annual increase in planted forest areas, with China taking the first rank in the past 20-year period, followed by the United States of America, Canada and India. These four countries together account for an average annual increase in planted forests of 3.3 million hectares over this period.
Although there was a significant increase in planted forest area on a global and regional scale, there are some countries that report a loss in planted forest area. The largest annual decrease in planted forest area over the last 20 years was reported by the Democratic People’s Republic of Korea (an average loss of 17 000 ha per year over the last 20 years).
Global Forest Resources Assessment 201094
(1 000 ha/yr)
China 1 932
United States 805
Canada 385
India 251
Russian Federation 199
Mexico 178
Brazil 156
Viet Nam 134
Turkey 91
Finland 82
FIGURE 5.3Ten countries with greatest annual increase in planted forest area, 1990–2010
TABLE 5.5Trends in area of planted forests by region and subregion, 1990–2010
Region/subregion Information availability
Area of planted forest (1 000 ha)
Annual change (1 000 ha)
Annual change rate (%)
Number of
countries
% of total forest area
1990 2000 2005 2010 1990–2000
2000–2010
1990–2000
2000–2010
Eastern and Southern Africa 23 100.0 3 500 3 689 3 813 4 116 19 43 0.53 1.10
Northern Africa 8 100.0 6 794 7 315 7 692 8 091 52 78 0.74 1.01
Western and Central Africa 25 94.0 1 369 1 953 2 526 3 203 58 125 3.62 5.07
Total Africa 56 97.1 11 663 12 958 14 032 15 409 129 245 1.06 1.75
East Asia 5 100.0 55 049 67 494 80 308 90 232 1 244 2 274 2.06 2.95
South and Southeast Asia 17 100.0 16 531 19 736 23 364 25 552 321 582 1.79 2.62
Western and Central Asia 23 96.9 4 678 5 698 5 998 6 991 102 129 1.99 2.07
Total Asia 45 99.8 76 258 92 928 109 670 122 775 1 667 2 985 2.00 2.82
Europe excl. Russian Federation
42 97.7 46 395 49 951 51 539 52 327 356 238 0.74 0.47
Total Europe 43 99.6 59 046 65 312 68 502 69 318 627 401 1.01 0.60
Caribbean 16 70.4 391 394 445 548 0 15 0.09 3.33
Central America 7 100.0 445 428 474 584 -2 16 -0.37 3.14
North America 5 100.0 19 645 29 438 34 867 37 529 979 809 4.13 2.46
Total North and Central America
28 99.7 20 481 30 261 35 787 38 661 978 840 3.98 2.48
Total Oceania 18 99.7 2 583 3 323 3 851 4 101 74 78 2.55 2.12
Total South America 13 94.6 8 276 10 058 11 123 13 821 178 376 1.97 3.23
World 203 98.6 178 307 214 839 242 965 264 084 3 653 4 925 1.88 2.09
Conclusions The country reports for FRA 2010 report a planted forest area of 264 million hectares corresponding to 6.6 percent of the forest area of the reporting countries. At the global level this area has steadily increased since 1990 by an average of 4.3 million hectares per year. In most regions except for Europe and North America the rate of establishment of planted forests increased in the past ten years compared with the previous decade,

Productive functions of forest resources 95
although it appears to have peaked during 2000–2005. Given this trend, a further rise in the planted forest area up to 300 million hectares by 2020 can be anticipated. Planted forests are therefore expected to increasingly contribute to the world’s wood, fibre, fuel and NWFPs supply, as well as providing environmental and social services at a time when demand for these resources is increasing. The impact of this development on timber markets should be considered by policy-makers, planners and forest managers and supported by outlook studies that evaluate the future contribution of planted forests to economic, environmental and social services. To supply the data needed for such analysis, it is recommended that future assessments estimate the proportion of planted forests designated for different functions.
AFFORESTATION AND REFORESTATIONIntroductionIn view of the growing significance of planted forests and to enable countries to report on progress towards the Global Objectives on Forests, the parameters ‘afforestation’ and ‘reforestation’ were included in FRA 2010.
Afforestation is the act of establishing forests through planting and/or deliberate seeding on land that is not classified as forest, while reforestation refers to the re-establishment of forest through planting and/or deliberate seeding on land classified as forest, for instance after a fire, storm or following clearfelling. No attempt was made to quantify the area of forest regenerated through natural or assisted natural regeneration in FRA 2010. Afforestation implies an increase in forest area through the conversion of land not bearing forest to forested land, while reforestation does not have an impact on the size of the total area of forest. It should be kept in mind that afforestation and reforestation are not only aimed at establishing planted forests to fulfill productive purposes. However, all afforestation and reforestation efforts are reported in this chapter regardless of their intended purpose.
From a global perspective reporting on these two parameters is fragmented (Table 5.6).
Since afforestation and reforestation activities may vary slightly between the years, countries were asked to report the average area afforested or reforested over a five-year period centred around the years 1990, 2000 and 2005. Of the 233 countries and areas covered by FRA 2010, 29 countries (12 percent) reported that they did not currently carry out any afforestation or reforestation measures and 74 countries (32 percent) did not report at all for 1990, 2000 and 2005. However, most of these countries and areas are small and would not influence the global figures in a significant way. Both afforestation and reforestation measures were reported by 60 countries
TABLE 5.6 Country reporting on afforestation and reforestation by region, 2005
Region Total number of countries
Number of countries that reported.... Number of countries that did not reportboth
afforestation and
reforestation
only afforestation
only reforestation
zero afforestation
and reforestation*
Africa 57 10 14 14 8 11
Asia 48 17 3 10 4 14
Europe 50 24 5 3 5 13
North and Central America 39 3 6 5 6 19
Oceania 25 3 2 2 2 16
South America 14 3 0 6 4 1
World 233 60 30 40 29 74
* Including also those countries which reported zero for one of the categories and no data for the other.

Global Forest Resources Assessment 201096
(26 percent), while 30 countries (13 percent) reported only afforestation and 40 countries (17 percent) only reforestation measures (see Table 5.6). Reported figures for 1990, covering the period 1988 to 1992, appear incomplete. More complete datasets were reported for 2000 (covering the period 1998 to 2002) and for 2005 (covering the period 2003 to 2007). Therefore, status and trends of afforestation and reforestation measures were analysed and interpreted for regions and subregions only for the ten-year period from 1998 to 2007.
StatusTable 5.7 gives a summary by region and subregion of the status of afforestation and reforestation in 2005, covering the period 2003 to 2007, based on information from 163 countries and areas, which account for 95 percent of the total forest area and 98 percent of the total area of planted forests.18
At the global level, an average of 5.6 million hectares per year were reported for afforestation and 5.3 million hectares per year for reforestation. Together, this area (about 11 million hectares) is more than twice the reported average annual increase in the area of planted forests during the period 2000–2010 (see Table 5.5). In part, this difference can be explained by the fact that countries were asked to report on the area planted or sown annually, not the area of forest established. Gross figures for afforestation and reforestation were therefore reported, which did not take into account the fact that survival or establishment rates can be low – particularly for afforestation aimed at desertification control such as in China and Northern Africa. Furthermore, part of the reforestation involved replanting previously existing planted forests (see below) and, therefore, did not result in an increase in the overall area of planted forests. Some countries reported that areas of planted forests had been converted to other land uses during the period. For example, in Malaysia rubber plantations have been converted to other uses – in some cases oil palm plantations.
18 The figures on reforestation from the Russian Federation include areas under natural regeneration. Based on the information on afforestation and change in area of planted forests, it is estimated that the area of reforestation amounts to 40 percent of the total area regenerated. The reforestation area has been adjusted accordingly for the purpose of this chapter.
TABLE 5.7 Afforestation and reforestation by region and subregion, 2005
Region/subregion Afforestation (ha/yr) Reforestation (ha/yr)
Eastern and Southern Africa 58 933 105 226
Northern Africa 53 250 28 024
Western and Central Africa 47 930 103 873
Total Africa 160 113 237 123
East Asia 4 385 209 361 288
South and Southeast Asia 398 053 2 067 129
Western and Central Asia 142 406 50 384
Total Asia 4 925 668 2 478 801
Total Europe 169 657 992 540
Caribbean 45 7 664
Central America 4 328 14 728
North America 199 362 853 815
Total North and Central America 203 735 876 207
Total Oceania 59 381 37 423
Total South America 103 879 722 527
World 5 622 433 5 348 017

Productive functions of forest resources 97
Since oil palm is an agricultural tree crop the area thus moved from the class ‘planted forests’ to ‘other land with tree cover’, which counterbalances some of the increase. Finally, a few countries in Europe (e.g. Belgium) noted that some planted forests had been re-established through natural regeneration in the period and these areas then moved from the category ‘planted forests’ to ‘other naturally regenerated forests’. All these factors would result in a lower net increase in the area of planted forest compared with the area of afforestation and reforestation. However, the significant difference between the gross planting rates and the net increase in planted forests warrants further analysis and points to the need for more detailed information in future assessments, including estimates of survival rates for newly planted areas.
East Asia showed a very high level of afforestation, with around 4.4 million hectares per year on average for 2005, of which more than 99 percent were reported by China. Introduced species were used for 28 percent of afforestation in East Asia which is in line with the global figure (see Table 5.8). Reforestation activities, in contrast, were greatest in South and Southeast Asia19, with 2.1 million hectares annually, and in Europe with 1.0 million hectares per year. In both regions the proportion of introduced species used in reforestation was low.
The ten countries with the highest planting rates for afforestation and reforestation in 2005 are shown in Figures 5.4 and 5.5.
Of the 100 countries that reported some reforestation, 35 reported on the proportion of this area that was previously planted. Together these countries account for just over
19 This includes afforestation efforts in India, where it was not possible to break down national figures of tree planting into afforestation and reforestation.
TABLE 5.8Use of introduced species in afforestation and reforestation, 2005
Region/ subregion
Afforestation Reforestation
Information availability Area reforested
(ha/yr)
% of introduced
species
Information availability Area reforested
(ha/yr)
% of introduced
speciesNumber of reporting countries
% of total forest area
Number of reporting countries
% of total forest area
Eastern and Southern Africa
16 75.2 52 208 100 12 35.6 101 816 99
Northern Africa 6 98.8 53 250 36 3 3.5 9 900 58
Western and Central Africa
11 22.6 15 867 69 12 32.9 77 954 85
Total Africa 33 52.3 121 325 68 27 30.6 189 670 91
East Asia 1 79.8 4 385 000 28 2 82.4 324 781 27
South and Southeast Asia
3 0.3 28 100 4 7.2 33 113 94
Western and Central Asia
10 13.8 14 170 7 10 14.9 3 674 13
Total Asia 14 34.2 4 399 198 28 16 38.9 361 568 33
Total Europe 26 93.2 121 391 19 29 94.4 1 562 659 3
Caribbean 8 17.3 35 100 8 45.9 6 864 59
Central America 2 17.4 3 141 80 0 – –
North America 1 44.6 121 532 2 0 – –
Total North and Central America
11 43.5 124 708 4 8 0.4 6 864 59
Total Oceania 9 84.6 59 381 22 7 5.9 37 423 100
Total South America
6 9.6 87 531 99 7 75.0 627 980 98
World 99 50.5 4 913 534 29 94 50.7 2 786 163 36

Global Forest Resources Assessment 201098
FIGURE 5.5Ten countries with largest area of reforestation, 2005
(ha/yr)
India* 1 480 000
United States 606 000
Brazil* 553 000
Russian Federation 422 856
China 337 000
Viet Nam 327 785
Mexico 247 600
Indonesia 153 941
Finland 133 680
Sweden 130 550
* Includes afforestation
FIGURE 5.4Ten countries with largest area of afforestation, 2005
(ha/yr)
China 4 854 800
Indonesia 250 421
Viet Nam 138 920
United States 122 000
Turkey 87 300
Mexico 69 200
Chile 64 331
Australia 50 000
Spain 30 461
Sudan 25 630
one-third of the total forest area (36 percent), 58 percent of the total area of planted forests and 38 percent of the total area reforested. In these countries, some 72 percent of all the reforestation undertaken in and around year 2005 took place on areas that were previously planted, while some 576 000 hectares of naturally regenerated forests were converted to planted forests annually. However, due to the limited information availability, this result should be treated with caution.
Reporting on the use of introduced species in afforestation and reforestation is fragmented. Of the 233 countries and areas covered by FRA 2010, only 99 countries (51 percent) reported on the use of introduced species in afforestation and 94 countries (51 percent) on the use of introduced species in reforestation. Together, they account for 87 percent of the total area afforested and 52 percent of the area reforested. Table 5.8 gives a summary by region and subregion for 2005.

Productive functions of forest resources 99
At the global level introduced species were used at a rate of 29 percent in afforestation and 36 percent in reforestation in the reporting countries. However, marked differences existed in the use of introduced species, by region and subregion.
The reporting countries of the tropical and subtropical regions almost exclusively used introduced species for afforestation and reforestation, particularly in Eastern and Southern Africa (Kenya, Madagascar, Malawi and South Africa); South and Southeast Asia (e.g. Malaysia) and the Caribbean. However a number of countries with a significant area of planted forest did not report on the use of introduced species in afforestation and reforestation (Indonesia, Thailand and Viet Nam). In Oceania (New Zealand) and South America (Argentina, Brazil and Chile) introduced species also predominated in afforestation and reforestation. In East Asia, China used introduced species on around one quarter (28 percent) of both afforested and reforested areas. Countries in the temperate regions (Western and Central Asia, Europe and North America) used introduced species for afforestation and reforestation only to a minor extent.
TrendsGlobally there has been a decreasing trend in afforestation and a slight increasing trend in reforestation during the observed ten-year period from 1998 to 2007. The rate of afforestation decreased by 1.0 percent annually and reforestation increased by 0.3 percent when comparing the average for 2000 with that for 2005 for the reporting countries (see Table 5.9). However there are marked differences between the regions and subregions.
African subregions show an increasing trend in afforestation and reforestation, except for Northern Africa. A similar trend can be observed in South and Southeast Asia and in Western and Central Asia. In East Asia (i.e. China) afforestation and reforestation trends are both decreasing, although the afforested area is still the largest in the world. In Europe and North and Central America the annually afforested and reforested areas have considerably decreased, in particular the planting of new
TABLE 5.9 Trends in afforestation and reforestation by region and subregion, 2000 –2005
Region/subregion Afforestation Reforestation
2000 (ha/yr)
2005 (ha/yr)
Annual change rate
(%)
2000 (ha/yr)
2005 (ha/yr)
Annual change rate
(%)
Eastern and Southern Africa 25 966 48 727 13.42 71 574 101 926 7.33
Northern Africa 46 327 53 250 2.82 28 908 28 024 -0.62
Western and Central Africa 47 300 47 930 0.26 81 117 107 270 5.75
Total Africa 119 593 149 907 4.62 181 599 237 220 5.49
East Asia 4 737 100 4 385 209 -1.53 694 508 361 288 -12.25
South and Southeast Asia 210 633 398 053 13.58 1 833 148 2 067 129 2.43
Western and Central Asia 62 019 142 254 18.06 45 352 48 188 1.22
Total Asia 5 009 752 4 925 516 -0.34 2 573 008 2 476 605 -0.76
Total Europe 273 812 169 250 -9.17 1 204 892 989 754 -3.86
Caribbean 41 35 -3.11 6 323 7 664 3.92
Central America 10 088 4 328 -15.57 11870 14 728 4.41
North America 250 873 199 362 -4.49 982 026 853 815 -2.76
Total North and Central America 261 002 203 725 -4.83 1 000 219 876 207 -2.61
Total Oceania 128 167 59 339 -14.27 37 277 37 054 -0.12
Total South America 93 287 87 531 -1.27 247 225 714 418 23.64
World 5 885 614 5 595 268 -1.01 5 244 219 5 331 258 0.33

Global Forest Resources Assessment 2010100
forest areas through afforestation, while in South America the rate of reforestation is increasing rapidly.
Conclusions During the period from 1998 to 2007 afforestation and reforestation have made a substantial impact on the development of forest resources. At the global level, afforestation measures, together with natural expansion of forests in some countries and regions, have helped reduce the net loss of forest area to 8.3 million hectares annually in the 1990s and to 5.2 million hectares per year in the last decade, compared with the gross rate of loss through deforestation and natural causes, estimated at 16 million hectares per year in the 1990s and 13 million hectares per year in the last decade.
Reforestation has contributed to maintaining forests on more than 5 million hectares of land per year on average from 1998 to 2007. Both afforestation and reforestation rates are reported to have increased in most of the tropical regions, which so far account for the highest loss of forests. Some large countries, in particular China and the United States of America, have slowed their afforestation and reforestation activities although both still feature among the countries with the highest rates of tree planting in the world. The large increase in the area reforested in South America is primarily due to Brazil, where more than 0.5 million hectares are being planted annually – most of this as reforestation.
Reporting on afforestation and reforestation was introduced for the first time in FRA 2010 in an attempt to obtain better information on forest area change dynamics. Although quite a large number of countries were able to report on these variables, the data analysis indicates that there are still significant data issues to be resolved before a complete balance sheet can be reported by countries displaying forest loss (through deforestation and natural causes) and forest gain (through afforestation and natural expansion of forests) over time.
REMOVALS OF WOOD PRODUCTSIntroductionWood removed from forests and other wooded land constitutes an important component of the productive function. The volume of wood removed indicates the economic and social utility of forest resources to national economies and dependent local communities. This information also contributes to monitoring the use of forest resources by comparing actual removals with the sustainable potential.
Industrial roundwood and woodfuel were reported separately for FRA 2010. For 1990, 2000 and 2005, the data reported are five-year averages for 1988–1992, 1998–2002 and 2003–2007 respectively.
As a check on the quality and consistency of the information, the reports for FRA 2010 were compared with the removals statistics published in the FAOSTAT database20 (FAO, 2009b). This detailed examination of the data revealed a number of differences between the two sources in absolute numbers, particularly for woodfuel removals. At the global level, wood removals figures reported for FRA 2010 are about 15 percent lower than those in FAOSTAT (5 percent lower for industrial roundwood and 25 percent lower for woodfuel). Lower absolute figures reported for FRA 2010 may be explained by the fact that not all countries reported removals, some reported removals from forest only and a few did not include removals from plantations. FAOSTAT includes removal estimates from all sources (i.e. forest and non-forest land), as well as woodfuel estimates generated by FAO for the countries that do not report reliable removals statistics (Whiteman, Broadhead and Bahdon, 2002). In spite of the
20 FAOSTAT wood removal figures were recalculated into 5-year average volume over bark by using the conversion ratio 1.15.
Productive functions of forest resources 101
divergence between these sources, global and regional trends for removals are similar in the two datasets.
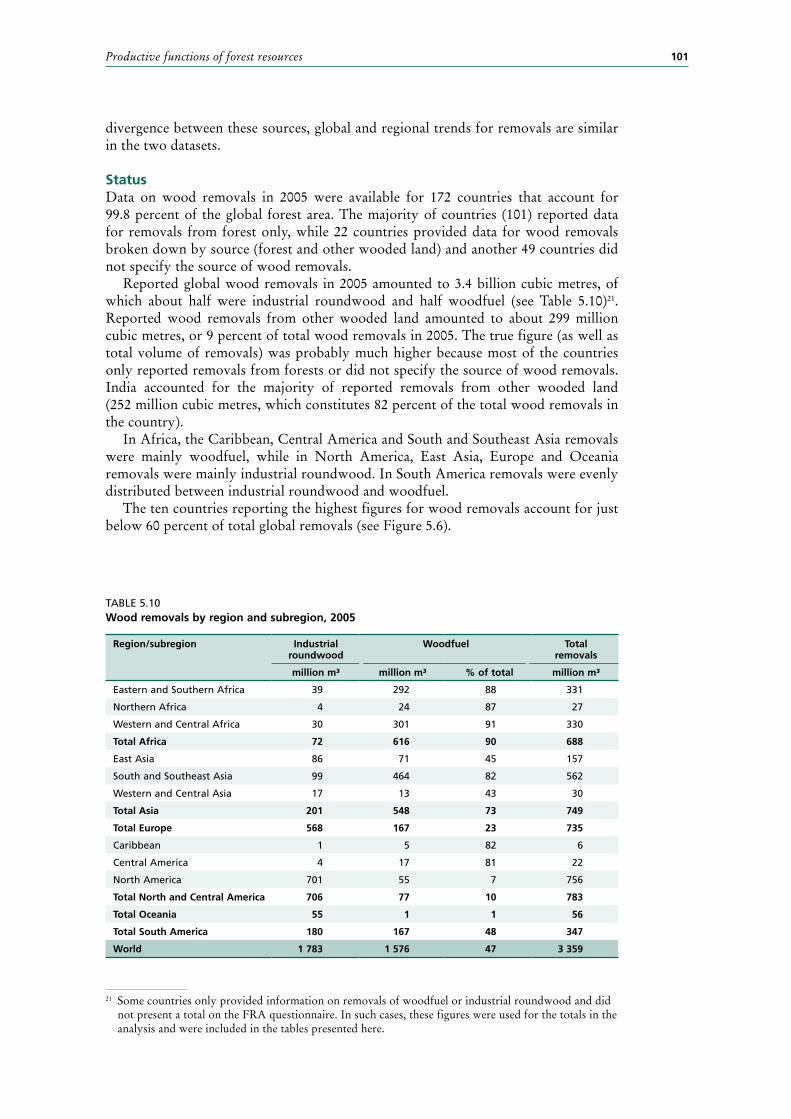
StatusData on wood removals in 2005 were available for 172 countries that account for 99.8 percent of the global forest area. The majority of countries (101) reported data for removals from forest only, while 22 countries provided data for wood removals broken down by source (forest and other wooded land) and another 49 countries did not specify the source of wood removals.
Reported global wood removals in 2005 amounted to 3.4 billion cubic metres, of which about half were industrial roundwood and half woodfuel (see Table 5.10)21. Reported wood removals from other wooded land amounted to about 299 million cubic metres, or 9 percent of total wood removals in 2005. The true figure (as well as total volume of removals) was probably much higher because most of the countries only reported removals from forests or did not specify the source of wood removals. India accounted for the majority of reported removals from other wooded land (252 million cubic metres, which constitutes 82 percent of the total wood removals in the country).
In Africa, the Caribbean, Central America and South and Southeast Asia removals were mainly woodfuel, while in North America, East Asia, Europe and Oceania removals were mainly industrial roundwood. In South America removals were evenly distributed between industrial roundwood and woodfuel.
The ten countries reporting the highest figures for wood removals account for just below 60 percent of total global removals (see Figure 5.6).
TABLE 5.10 Wood removals by region and subregion, 2005
Region/subregion Industrial roundwood
Woodfuel Total removals
million m³ million m³ % of total million m³
Eastern and Southern Africa 39 292 88 331
Northern Africa 4 24 87 27
Western and Central Africa 30 301 91 330
Total Africa 72 616 90 688
East Asia 86 71 45 157
South and Southeast Asia 99 464 82 562
Western and Central Asia 17 13 43 30
Total Asia 201 548 73 749
Total Europe 568 167 23 735
Caribbean 1 5 82 6
Central America 4 17 81 22
North America 701 55 7 756
Total North and Central America 706 77 10 783
Total Oceania 55 1 1 56
Total South America 180 167 48 347
World 1 783 1 576 47 3 359
21 Some countries only provided information on removals of woodfuel or industrial roundwood and did not present a total on the FRA questionnaire. In such cases, these figures were used for the totals in the analysis and were included in the tables presented here.

Global Forest Resources Assessment 2010102
FIGURE 5.6Ten countries with largest volume of wood removals in percent, 2005
(%)
United States 16
India 9
Brazil 7
Canada 6
Russian Federation 6
China 4
Ethiopia 3
Indonesia 3
Sudan 3
Democratic Republic of the Congo 2
Remaining countries 41
TABLE 5.11 Trends in wood removals by region and subregion, 1990–2005
Region/subregion Wood removals (million m³)
Industrial roundwood Woodfuel Total
1990 2000 2005 1990 2000 2005 1990 2000 2005
Eastern and Southern Africa 28 31 35 140 162 174 168 193 209
Northern Africa 3 3 4 21 22 24 24 25 27
Western and Central Africa 20 24 24 222 277 297 242 301 322
Total Africa 51 59 63 383 461 495 434 519 558
East Asia 98 77 86 70 83 71 168 161 157
South and Southeast Asia 123 92 99 466 459 463 589 551 561
Western and Central Asia 15 16 17 18 14 13 33 30 30
Total Asia 237 186 201 554 556 547 791 741 748
Total Europe 603 486 560 163 145 164 766 631 723
Caribbean 1 1 1 5 5 5 6 6 6
Central America 2 3 3 16 17 16 18 19 19
North America 696 715 701 105 56 55 801 771 756
Total North and Central America 699 719 705 126 77 76 825 796 781
Total Oceania 33 48 55 0 0 1 34 48 56
Total South America 153 142 178 196 164 167 349 306 344
World 1 777 1 640 1 762 1 422 1 403 1 449 3 199 3 043 3 211
TrendsTable 5.11 is based on 159 countries and areas that provided a complete time series on wood removals. Those reporting both industrial roundwood and woodfuel for all three years account for about 97 percent of the global forest area.
At the global level, total removals increased between 2000 and 2005 after a fall in the 1990s and the proportions of industrial roundwood and woodfuel did not change significantly when comparing 1990 to 2005. However, the trends varied between regions.
African countries reported steadily increasing wood removals: from 434 million cubic metres in 1990 to 558 million cubic metres in 2005. The average annual growth of 3 percent in wood removals in Africa is in line with population growth over the same period.

Productive functions of forest resources 103
East Asia reported a decline in removals, caused primarily by a significant decrease in wood removals in China as a result of a partial logging ban, as well as a continuous decline in Japan. South and Southeast Asia reported a significant decline during the 1990s, particularly for industrial roundwood caused by log export restrictions in Malaysia and Indonesia. Between 2000 and 2005, removals rose slightly in this region because of a reported increase in India and Malaysia. For Asia as a whole, total reported removals declined from 791 million cubic metres in 1990 to 748 million cubic metres in 2005. However, the figure for 2005 is an underestimate by at least 50 million cubic metres because China, Indonesia and Thailand provided only partial data and, for example, did not include wood removals from rubber plantations. Southeast Asia and China experienced a significant shift from logging in natural forests to planted forests over the two decades. The actual wood removals in Asia are now probably higher than during the 1990s.
A sharp decline in removals in the Russian Federation in the early 1990s – a result of the transition from a centrally-planned to a market-based economy – caused an overall reduction in removals in Europe of 8 percent between 1990 and 2000. However, following this decrease, removals in Europe including the Russian Federation have been moving back towards their 1990 level. Removals in Europe excluding the Russian Federation have been growing steadily, at an average annual rate of 1.5 percent over the period 1990 to 2005.
North and Central America show a very stable trend over the last 15 years: total removals decreased gradually from 825 million cubic metres in 1990 to 781 million cubic metres in 2005.
A steady increase in removals was reported for Oceania. Four countries (Australia, New Zealand, Papua New Guinea and Solomon Islands) account for most of the wood removals, which nearly doubled from 34 million cubic metres in 1990 to 56 million cubic metres in 2005 because of an increased supply of industrial roundwood from forest plantations in New Zealand and Australia.
South America reported a significant reduction, from 349 million cubic metres in 1990 to 306 million cubic metres in 2000, mainly due to reduced logging in Brazil’s natural forests. However, after 2000 removals bounced back to the level of 1990. Similar to Oceania, a growing supply of industrial roundwood from forest plantations (Brazil, Chile, Argentina and Uruguay) accounted for most of this increase in removals.
Conclusions In the long term, wood removals are gradually increasing globally in line with growing populations and income, which in turn translate into higher demand for and consumption of wood products. This trend will continue in the next decades.
Globally, wood removals account for 0.7 percent of growing stock and nearly half of this wood is used as woodfuel. However, significant differences exist between regions, with more than two thirds of wood used as woodfuel in Africa and Asia and less than 20 percent in Europe, North America and Oceania.
Most of the long-term growth in wood supply is occurring in countries that developed forest plantations over the last few decades (in Asia, Latin America and Oceania). In spite of some data limitations, it is evident that wood supply (particularly industrial roundwood) is shifting from natural forests to planted forests. This means that pressure on natural forests as a wood source is likely to diminish further in future.
REMOVALS OF NON-WOOD FOREST PRODUCTS IntroductionInformation on removals of NWFPs demonstrates their importance, both as commodities for national and international markets, and for the livelihoods of
Global Forest Resources Assessment 2010104
many local and indigenous people who depend on them. This information shows that NWFPs often deserve a higher priority in the development of national poverty alleviation policies, rural development projects and forest conservation strategies.
A wide variety of products are collected from forests, woodlands and from trees and land outside forests, and a major portion of them are consumed by households or sold locally, while some find export markets. Various products have been – or are being – domesticated. In fact, the borderline between NWFPs (counting as ‘forest sector’ outputs) and agricultural crops is increasingly blurred. Data collection on forest-based NWFP production is hampered by the inability of agricultural classification and production accounting systems to incorporate both forest and farm-based production, and the inadequacy of human and financial resources in national statistics institutions to gather and analyse NWFP data.
In FRA 2010 NWFPs are defined as ‘goods derived from forests that are tangible and physical objects of biological origin other than wood’. As such, NWFPs include all plant and animal products with the exception of ‘wood’ collected from areas defined as forests, whether natural forests or plantations. From the data provided it is not always possible to distinguish NWFPs from (sometimes the same) products collected on lands under agricultural or agroforestry production systems (for instance, mushrooms, bee products and honey, medicinal plants, nuts, cork, bamboo, hunted animals and gum arabic). The units used for reporting the quantity of NWFP removals are varied and include: number (e.g. of skins and hides), tonnes or kilograms (e.g. of nuts or resin) and cubic metres or litres (e.g. for fodder or palm wine). Sometimes different measures are applied to the same product by different countries. It is therefore not always possible to aggregate totals of NWFP removals at regional or global levels.
A multitude of NWFPs are gathered and consumed, both for subsistence and commercial use, locally and beyond. Quantitative data are difficult to obtain on national production of all NWFPs, so countries were asked to list the ten most important NWFPs in order of importance, under 16 use-based categories. Importance was based on the value (or estimated value) of the removals for the reporting year 2005. (The value of NWFP removals is discussed in Chapter 7.) Countries were asked to report the national output in terms of quantity (and value) by providing the botanical names of the key NWFP species in the following categories:
Plant products/raw material 1. Food 2. Fodder 3. Raw material for medicine and aromatic products 4. Raw material for colorants and dyes 5. Raw material for utensils, handicrafts and construction 6. Ornamental plants 7. Exudates 8. Other plant products
Animal products/raw material 9. Living animals 10. Hides, skins and trophies 11. Wild honey and beeswax 12. Wild meat 13. Raw material for medicine 14. Raw material for colorants 15. Other edible animal products 16. Other non-edible animal products

Productive functions of forest resources 105
The vast majority of country reports included the botanical names of the species from which the NWFPs were derived. This greatly facilitated follow-up work to check the relevance and consistency of the data, including the reported quantities (and values), as well as whether the reported products could really be considered as NWFPs. The aggregation of national data on the NWFP production categories into regional and global level statistics is difficult and must be treated with caution. Not only have some countries reported the same NWFP species under different categories, but also a single species often yields different categories of NWFP. The aggregation of quantitative production data at regional and global levels is more meaningful when done according to ‘species (or groups of similar species)’ rather than categories of use.
A section on the status of NWFPs was first included in FRA 2000. In FRA 2005 additional quantitative information was provided on the amount and value of NWFP removals. For FRA 2010 a total of 92 countries (representing 79 percent of the total forest area) reported data on removals of one or more categories of NWFPs, mostly for the reporting year 2005 (see Figure 5.7). However, 141 countries, representing 21 percent of the global forest area, did not report any data at all, even though it is known that NWFPs play a significant role (for example, in the Central African countries and in Papua New Guinea). Where national statistics do exist, data on removals are often limited to those NWFPs that are (inter-)nationally traded. However, many NWFPs are used and consumed non-commercially, so the figures reported are often a significant underestimate of the full range of NWFPs gathered in the country.
The major categories of NWFP removals about which countries provided the most information are (in descending order of importance):
1. Food 2. Exudates 3. Other plant products 4. Wild honey and beeswax 5. Ornamental plants 6. Raw materials for medicine and aromatic products 7. Wild meat 8. Raw materials for utensils, handicrafts and construction 9. Living animals 10. Hides, skins and trophies
FIGURE 5.7Information availability – NWFP removals, 2005
World (92)
Eastern and Southern Africa (8)
Northern Africa (6)
Western and Central Africa (7)
East Asia (3)
South and Southeast Asia (10)
Western and Central Asia (7)
Europe (31)
Caribbean (2)
Central America (3)
North America (4)
Oceania (3)
South America (8)
(% of total forest area)
100806040200
Note: Numbers in ( ) are number of reporting countries.

Global Forest Resources Assessment 2010106
There was insignificant or no reporting at all for the remaining categories. Food was by far the largest of these ten most-reported categories. Asia accounted
for the largest share of removals (by volume), almost exclusively comprising NWFPs of plant origin. Only three countries in Asia reported data for animal-derived NWFPs, and in very limited quantities. Asian removals consisted mainly of camellia, oil seeds, nuts and bamboo products. China was the largest producer by far; other countries with significant removal volumes were Republic of Korea, Japan and India. Following these, in decreasing order of importance in the food category were Europe, Oceania, North, Central and South America, and Africa, where a large majority of removals were also from plant-based NWFPs. It is interesting to note that in these regions data on animal-based NWFPs were more common than in Asia. However, the proportion of animal-based NWFP removals remained minimal, with the exception of Europe, which had the highest level of animal-based NWFP removals. The 24 European countries that reported on the animal-based product categories provided the most detailed reports on the contribution of hunting and its products (meat, trophies, skins, etc.).
Exudates were the second largest NWFP category. Sudan was the world’s major producer of exudates, with gum arabic. China was the leading producer of pine resin, tannin extract and raw lacquer.
Fodder removals were reported by only 13 countries (compared with 16 in FRA 2005). Nevertheless, some countries – particularly India, Italy, Morocco and Colombia – reported very large quantities, indicating that this was a very important product category, however severely under-reported. Raw materials for utensils, crafts and construction, such as bamboo and rattan, were reported in large quantities from countries such as India and Myanmar. Ornamental plants, palm fronds and boughs were reported in large quantities from several countries in all regions.
The majority of reporting countries (except Asia) included removals of animal products, such as live animals (birds, insects, reptiles and crabs), meat, hides, skins and trophies, as well as wild honey and beeswax. The most comprehensive figures for edible animals (hunting, game products and wild meat) were provided in the reports by the OECD countries of Europe, North America and Oceania (New Zealand and Australia). It is well known, however, that wild meat and animal products are an important source of food in many African, Asian and Latin American countries, but these reported very few figures for this removal category, which may therefore be heavily underestimated.
For the remaining categories of NWFPs, information was provided by a limited number of countries, so the calculation of global totals is not very meaningful. However, some particular subregional aspects are highlighted below.
Africa: Thirty countries, mainly from Northern and Eastern Africa, provided data on their NWFP removals. Data were more limited from Western and Central African countries despite the fact that removals of NWFPs must be important in these countries. Cork, medicinal and aromatic plants, fodder and game meat were the most important NWFP removals reported by Northern African countries. In Eastern and Southern Africa, exudates (mainly gum arabic and frankincense), medicinal plants, fruits, honey and raw materials for handicrafts and construction prevailed. Western and Central African countries reported food (sheanut butter, bushmeat, mushrooms, palm oil and wine), medicinal and aromatic plants, rattan and gums.
Asia: Three East Asian countries (China, Japan and Republic of Korea) provided very complete and comparable responses because of the similarity of their forest resources. However, the sheer size of the removals reported by China dwarfs any other country’s output. Bamboo products, mushrooms, nuts and medicinal herbs were the major NWFP removals. Reports from nine South and Southeast Asian countries were less complete but included a more diverse range of NWFP categories, reflecting the more diversified resource base in the region. Bamboo, rattan, food (fruits, nuts, spices

Productive functions of forest resources 107
and mushrooms), medicinals and essential oils were among the major NWFP removals reported by these countries. Information from seven Western and Central Asian countries was more fragmented. The key removal categories reported were honey, food (pine and pistachio nuts) and aromatic plants.
Europe: Of the 50 European countries, 31 provided rich information on their NWFP removals. Food was the largest removal category, followed by honey, ornamental plants, wild meat and medicinals. Nuts, mushrooms, berries and honey were mentioned by almost all countries among their most important NWFP removals, followed by Christmas trees (in Northern Europe), hunting, game meat, skins and trophies, and cork (by the Southwestern Mediterranean countries).
North, Central and South America and the Caribbean: Among the Caribbean countries, Cuba reported palm fronds and Trinidad and Tobago wild meat as their major removals. Three Central American countries listed exudates (pine, sweetgum, rosin, maple and balsam), honey and seeds as their key removals. In North America maple products, Christmas trees, resins, berries, furs, boughs and mushrooms were among the major removals mentioned, while resin, nuts, fruits and mushrooms were listed for South America.
Oceania: Only 3 countries (Kiribati, New Zealand and the Solomon Islands) reported on the quantity of NWFPs removed. New Zealand reported honey, sphagnum moss, Christmas trees and hunting products as the major removals, while for the reporting Pacific islands, fibre materials (mainly pandanus leaves, rattan and coconut) for thatching and artisanal works, and food (honey, fruits and juices) were the most frequently reported NWFP removal categories.
ConclusionsInformation on NWFPs continues to be poor, despite their importance locally and, in some cases, nationally and internationally.
Based on the information supplied for FRA 2010, food is the largest category of NWFPs globally. Other important categories include exudates, other plant products, wild honey and beeswax, and ornamental plants. Asia, and in particular China, reported the largest volume of NWFP removals, most of which are of plant origin (camellia oil seeds, nuts and bamboo products). The sheer size of the removals reported by China dwarfs any other country’s removals. Europe has the highest reported level of animal-based NWFP removals.
