chapter 4&5
DESCRIPTION
dfTRANSCRIPT
1
CHAPTER IV
PROTOTYPE
4.1 Sketch of Product
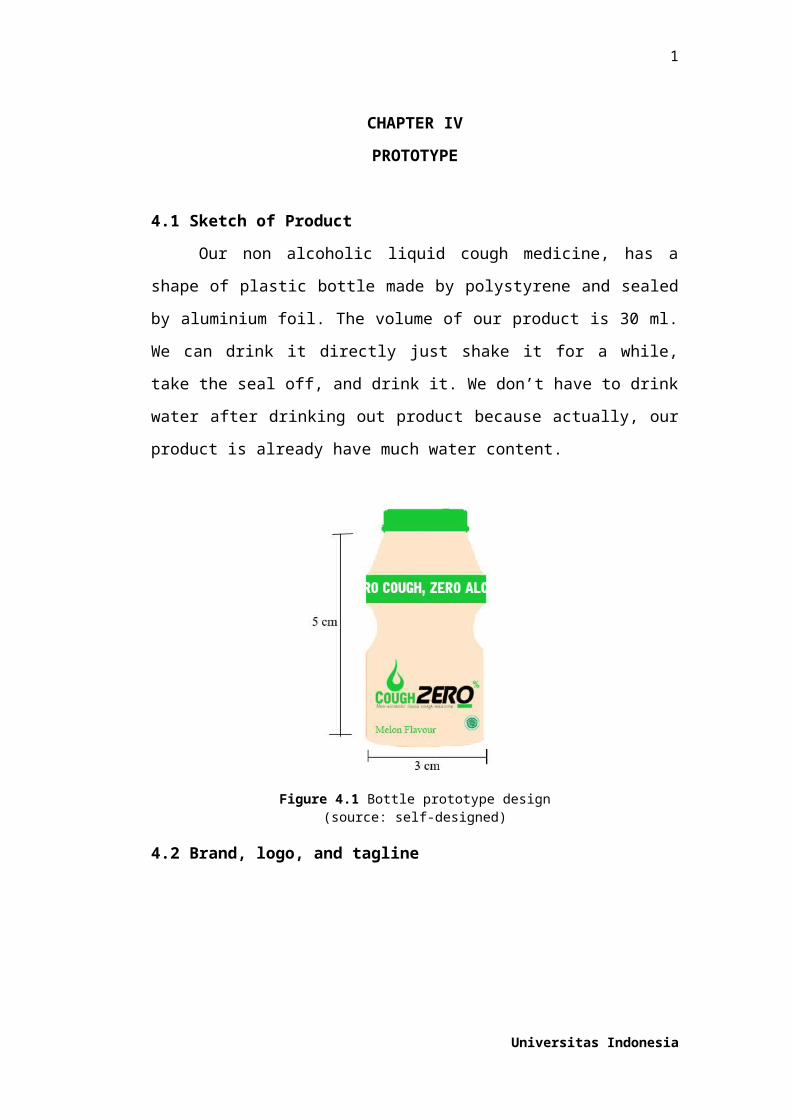
Our non alcoholic liquid cough medicine, has a shape of plastic bottle
made by polystyrene and sealed by aluminium foil. The volume of our product is
30 ml. We can drink it directly just shake it for a while, take the seal off, and
drink it. We don’t have to drink water after drinking out product because actually,
our product is already have much water content.
Figure 4.1 Bottle prototype design(source: self-designed)
4.2 Brand, logo, and tagline
Figure 4.2 Logo design(source: self-designed)
Universitas Indonesia

2
Our cough medicine will be named by Cough-ZERO. We think that the
name is a unique and easy to remember name. We also think that the name of our
product can increase the opportunity of consumer to buy our product.
We chose the Cough-ZERO name, because we make this cough medicine
with zero alcoholic content. Some of people don’t realize that cough medicine in
the market has alcohol content in there. After we do some questionnaires, finally
we know that alcohol is bad for us in the case of religion aspect, especially for
Moslems people. So, after that, we make a cough medicine product that has no
alcohol content in it. We hope that because of our product, all people can consume
cough medicine easily without concern about the effects of alcohol for the
Muslims people. Our brand is also easy to remembered and pronounced by public,
and also our cough medicine logo can be seen on the picture above.
Tagline is a phrase or catchword that becomes identified or associated with
a product. An interesting and easy-to-be-remembered tagline also has an
important role to get more attention from the consumer.
Our tagline is “No cough, No alcohol”. We chose that tagline because we
think that will be perfect if the cough medicine can cure cough and also has no
alcohol content in that. So, the tagline means that this product can be drunk by all
people and also has a good effects.
4.3 Packaging of the product
Our cough medicine product will be packaged with polystyrene plastic
bottle which equipped with aluminium foil as seal of the medicine. We use plastic
bottle because of the needs from the questionnaires we have done before and the
public chose the simple and handy storage, so we think if we use polystyrene as
the packaging, it will be easy to consume. We use aluminium foil as the seal, so
we can drink it directly from the plastic bottle. We also use cartoon box as
secondary packaging, it is for easy to storage at the sales time.
Universitas Indonesia

3
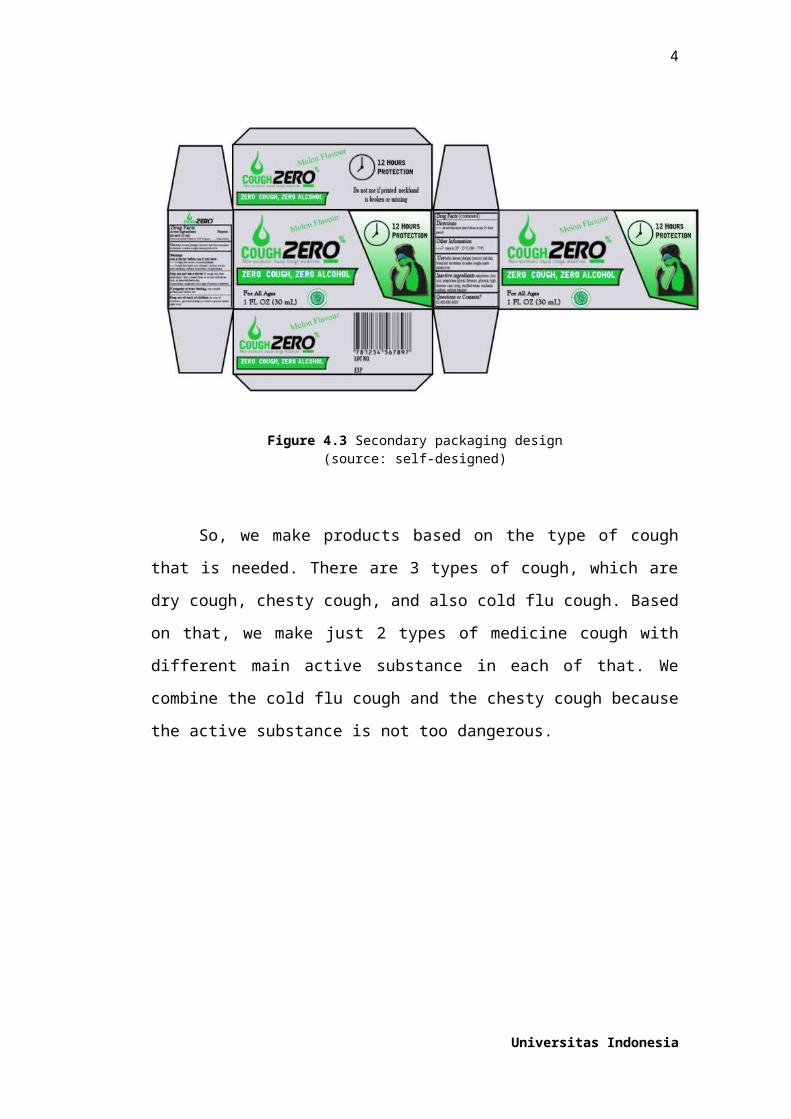
Figure 4.3 Secondary packaging design(source: self-designed)
So, we make products based on the type of cough that is needed. There are
3 types of cough, which are dry cough, chesty cough, and also cold flu cough.
Based on that, we make just 2 types of medicine cough with different main active
substance in each of that. We combine the cold flu cough and the chesty cough
because the active substance is not too dangerous.
Universitas Indonesia
CHAPTER V
PRODUCT MANUFACTURING
5.1 Market Segmentation
The main target of our consumer is segmented based on two
considerations. The first is the geographical location and the second consideration
is based on the market class segmentation (based on the income). In the first
consideration, we consider our product to be distributed only in Indonesia. The
consideration is based on some reasons. The first is Indonesia has a very high
population. Based on the data from ‘United Nations, Department of Economic and
Social Affairs, Population Division’, as on the year of 2015 the population of
Indonesia is reaching 255,708,785 and according to the same source the
population of the south east asia country in the same year is approximately 633
million people. It means that the population of Indonesia has a share of 40%
population in ASEAN that makes it a very good opportunity to be capitalized.
The other reason is the increasing amount of the Indonesian people
spending to any products related to health. Based on the data from the ‘Business
Monitor International’ the Indonesian’s people spending on health product has
reached the number of 194 trillion rupiah in 2011. The number is projected to
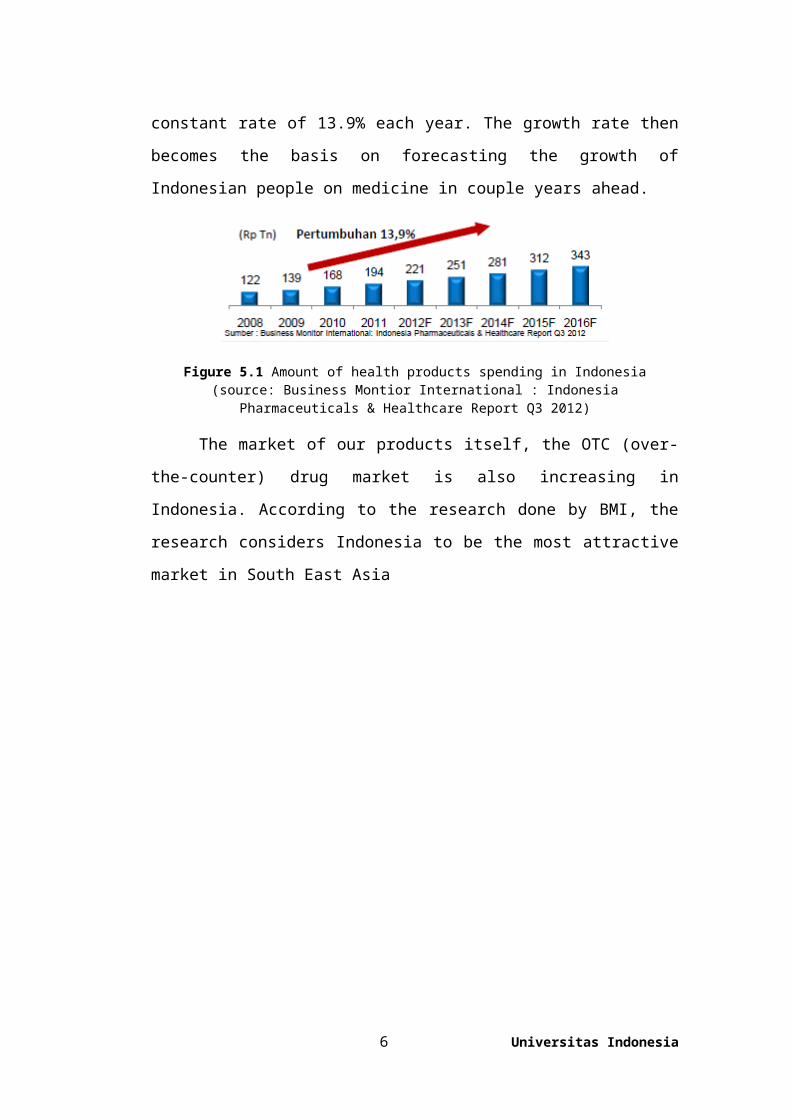
grow in a constant rate of 13.9% each year. The growth rate then becomes the
basis on forecasting the growth of Indonesian people on medicine in couple years
ahead.
Figure 5.1 Amount of health products spending in Indonesia(source: Business Montior International : Indonesia
Pharmaceuticals & Healthcare Report Q3 2012)
The market of our products itself, the OTC (over-the-counter) drug market
is also increasing in Indonesia. According to the research done by BMI, the
research considers Indonesia to be the most attractive market in South East Asia
4 Universitas Indonesia

5
(preferable to Singapore, Philippines, Indonesia, Malaysia, Vietnam and Thailand)
for companies looking to sell OTC products. OTC drugs sales in Indonesia
reached IDR24,067 billion (US$2.56 billion) in 2012, more than twice the value
of the Philippines and Thailand.
Although the OTC sales as a share of the total pharmaceutical sales is
expected to decline over the coming decade, as the government becomes
increasingly committed to provide universal healthcare for its population and as
regulations are tightened. Nevertheless, the overall value will continue to increase
at annual growth rates of around 5-6% in local currency terms.
Figure 5.2 OTC medicine market forecst 2008-2022(Source: AESGP, BMI)
The relatively low cost and easy availability of OTCs and a difficult
financial situation still preclude many from visiting doctors, instead driving them
to self-medication. Such factors are encouraging the sale of herbal medicines.
Deficient health insurance in Indonesia is also pushing the consumption of OTCs
as many patients cannot afford to pay for their prescriptions and are forced to rely
on low-cost consumer health products − although the government aims to address
Universitas Indonesia
6
this issue. Similarly, according to Kalbe Farma's statements from August 2013,
consumers in the country are purchasing healthcare products despite fears over
inflation and economic slowdown. Moreover, the activity of pharmacy chains
supports the development of the OTC market. Companies such as Apotek K-24
and Century have not only made OTC products more accessible and affordable,
but have also increased consumers' knowledge of drugs, and their confidence to
self-medicate. The growing number of new communicable diseases will further
stimulate the OTC market over the coming years, as patients seek to prevent
contracting infection by any means possible. Environmental factors, such as
severe air pollution in urban areas and contamination of water supplies, are
causing deterioration in health across the country, thus also assisting sales of
OTCs as consumers attempt to manage their ailments.
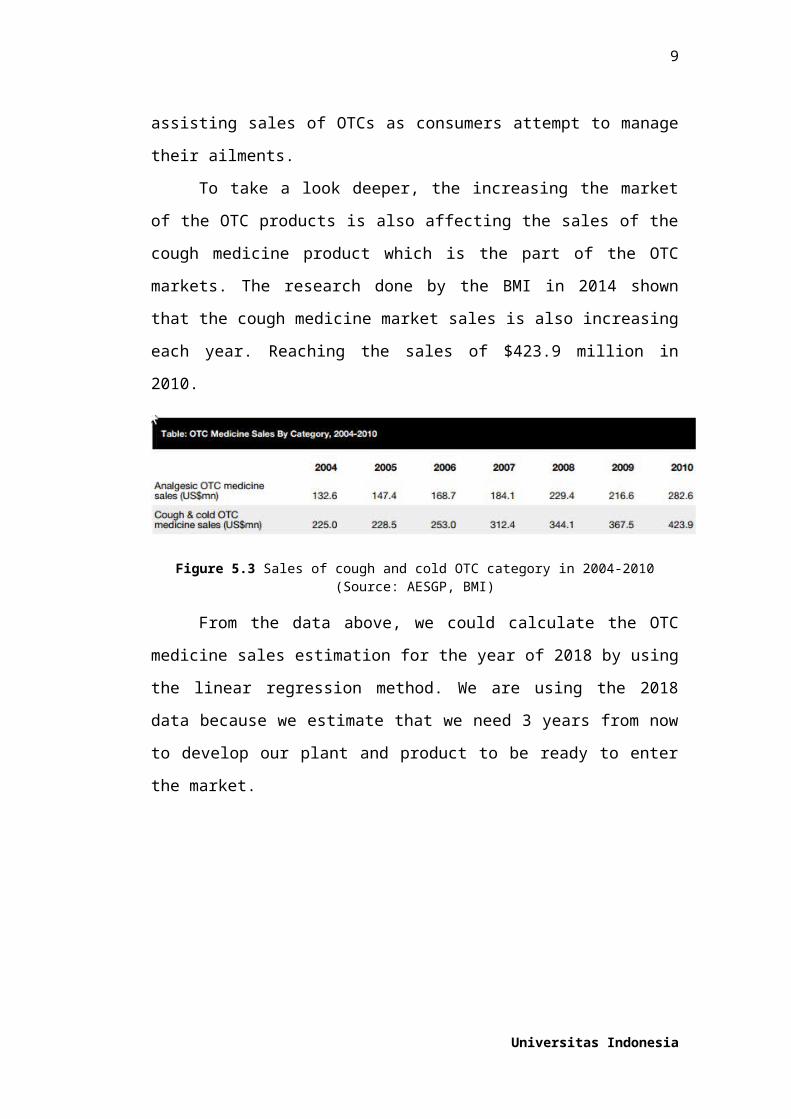
To take a look deeper, the increasing the market of the OTC products is
also affecting the sales of the cough medicine product which is the part of the
OTC markets. The research done by the BMI in 2014 shown that the cough
medicine market sales is also increasing each year. Reaching the sales of $423.9
million in 2010.
Figure 5.3 Sales of cough and cold OTC category in 2004-2010(Source: AESGP, BMI)
From the data above, we could calculate the OTC medicine sales
estimation for the year of 2018 by using the linear regression method. We are
using the 2018 data because we estimate that we need 3 years from now to
develop our plant and product to be ready to enter the market.
Universitas Indonesia

7
2003 2004 2005 2006 2007 2008 2009 2010 20110
50
100
150
200
250
300
350
400
450
f(x) = 34.4928571428571 x − 68919.3928571429R² = 0.964774689644383
Cough Medicine Sales
Year
Coug
h M
edici
ne S
ales
Figure 5.4 Cough medicine sales(Source: AESGP, BMI)
By using the trendline above ( y=34.493 x−68919¿, we can determine the
sales for cough medicine in 2018:
Sales of 2018=34.493 ×2018−68919
¿ $687.874 mn
5.2 Market Capacity
In determining the market capacity of our products, we define it based
some considerations. First is from the supply chain of cough and cold medicine in
Indonesia. The second one is based on the sales of cough and cold medicine
product
5.2.1. The Demand of Liquid Couch Medicine Syrup
One of the basis to calculate the market capacity of our product is to
calculate the demand of cough and cold medicine product in Indonesia. To
determine the demand of the cough medicine product in Indonesia, we are using
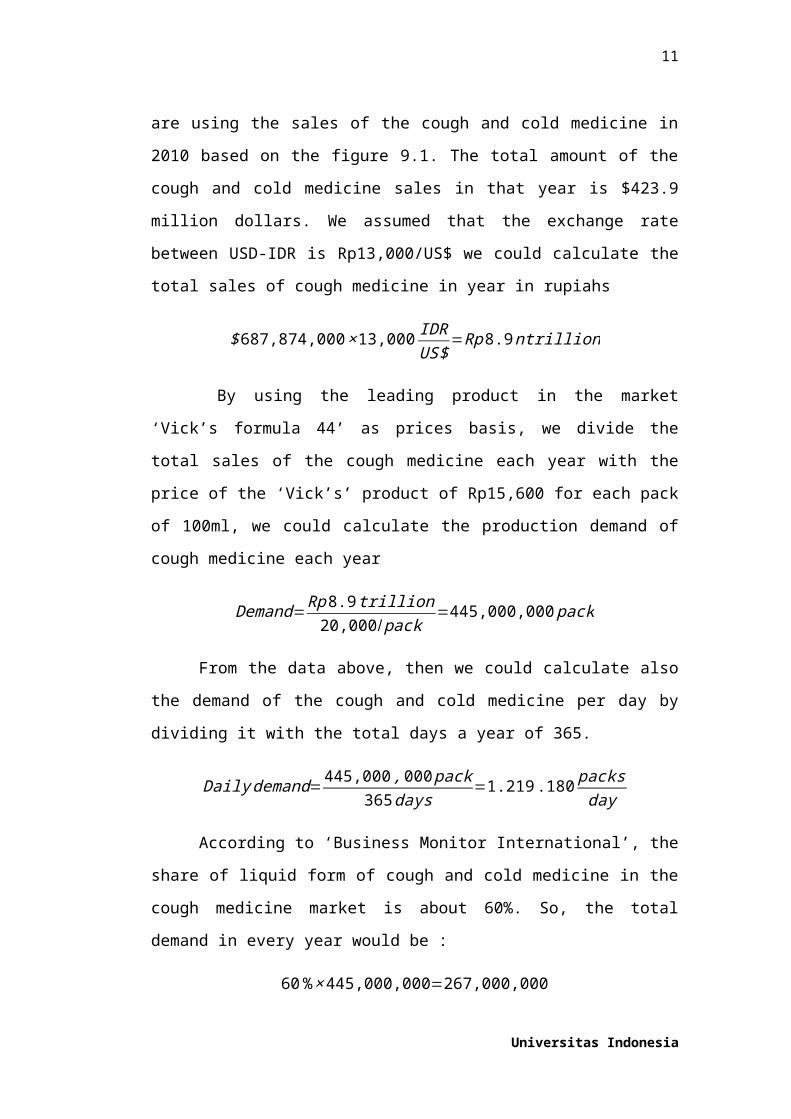
the sales of the cough and cold medicine in 2010 based on the figure 9.1. The total
amount of the cough and cold medicine sales in that year is $423.9 million dollars.
We assumed that the exchange rate between USD-IDR is Rp13,000/US$ we could
calculate the total sales of cough medicine in year in rupiahs
Universitas Indonesia

8
$ 687,874,000 ×13,000IDRUS $
=Rp 8.9 ntrillion
By using the leading product in the market ‘Vick’s formula 44’ as prices
basis, we divide the total sales of the cough medicine each year with the price of
the ‘Vick’s’ product of Rp15,600 for each pack of 100ml, we could calculate the
production demand of cough medicine each year
Demand= Rp 8.9 trillion20,000/ pack
=445,000,000 pack
From the data above, then we could calculate also the demand of the
cough and cold medicine per day by dividing it with the total days a year of 365.
Daily demand=445,000 , 000 pack365 days
=1.219 .180packsday
According to ‘Business Monitor International’, the share of liquid form of
cough and cold medicine in the cough medicine market is about 60%. So, the total
demand in every year would be :
60 %× 445,000,000=267,000,000
5.2.2. Production Supply
The next step is determining the production supply of liquid medicine in
Indonesia. The amount of supply is determined from the statistic of the total liquid
medicine produced by all of the pharmaceutical company in Indonesia. We can
determine the total supply by combining the total liquid medicine production in
Indonesia from the statistic as below
Table 5.1 Production supply for every cough medicine company
Company Production (bottles)
Darya Varia Group 800,000
Indofarma 11,000
Kalbe Farma 40,000,000
Kimia Farma 10,000,000
Pyridam Farma 1,105,920
Universitas Indonesia
9
Table 25.1 Production supply for every cough medicine company (cont’d)
Company Production (bottles)
Tempo Scan Pasific 7,200,000
Bristol Myers Squlb Indonesia 2,400,000
Bayer Indonesia 49,000,000
Dankos Laboratories 8,000,000
Total Production 118,516,920
(source: WHO)
5.3. Production Capacity
From the supply-demand calculation that is done before, we can calculate
the market opportunity of our liquid cough syrup product.
The opportunity = Demand− Supply
= 267.000 million bottles – 118.516 million bottles
= 148.484 million bottles
Then we can determine the market opportunity of our product by dividing
the opportunity by the demand of the liquid cough medicine syrup
%opportunity=148.484267
× 100 %=55.61 %
From the data above, we assumed that our product, non-alcoholic liquid
cough medicine can cover the 5% of the deficit. The value is quite small because
we consider our product as a new product and has no marketing budget as big as
our competitors. The production capacity will be 16 million bottles per year.
Table 5.2 Production capacity per year for every cough medicine company
Company Production (bottles)
Darya Varia Group 800,000
Indofarma 11,000
Kalbe Farma 40,000,000
Kimia Farma 10,000,000
Pyridam Farma 1,105,920
Universitas Indonesia

10
Tempo Scan
Pasific
7,200,000
Table 5.2 Production capacity per year for every cough medicine company (cont’d)
Company Production (bottles)
Bristol Myers Squlb Indonesia 2,400,000
Bayer Indonesia 49,000,000
Dankos Laboratories 8,000,000
Cough Zero 16,000,000
Total Production 134,516,920
(source: annual report each company)
Our market share would be
market share= 16 millions134,516 millions
=11.9 %
5.4 Raw Material
The calculation of production capacity in the previous section leads to the
discussion needs of raw materials to fulfill the daily proses production of Cough
Zero. From the final result of market share, the maximum capacity that needs to
be prepared for our manufacturing unit is 44.000 bottles per day. In cough
medicine syrup manufacture process, there will be four cycles in a day to optimize
the resources that we had. This section will be describes the details of components
needed to produce in one cycle. The needs of raw materials for Cough Zero
process production can be seen from the tables below :
Table 5.3 Calculation for raw materials composition
Basis
Yearly production (L) 480.000
Composition
Ingredients Composition (%) Needs (L)
Dextrometorphan Polistirex 0,0083 39,84
Pseudoephedrin HCl 0,0208 99,84
Chlorpheniramine Maleat 0,0001 0,48
Paracetamol 1,3889 6.666,72
Universitas Indonesia
11
Pepermint oil 0,0278 133,44
Alcohol 0 0
Table 2.3 Calculation for raw materials composition (cont’d)
Composition
Ingredients Composition (%) Needs (L)
Propylene Glycol 5 24.000
Water 57,4125 275.580
Fructose syrup 0 0
Color additives content 0,1 480
Suqqus Liquiritae 0,4639 2.226,72
Sucrose 35 168.000
Benzoic acid 0,2 960
Sodium benzoate 0,2 960
methyl-paraben, propyl-
paraben, butyl-paraben0,1 480
Sorbitol 0,05 240
Essence 0,025 120
Carboxyl Methyl Cellulose 0 0
(Source : Reproduced from Group Discussion)
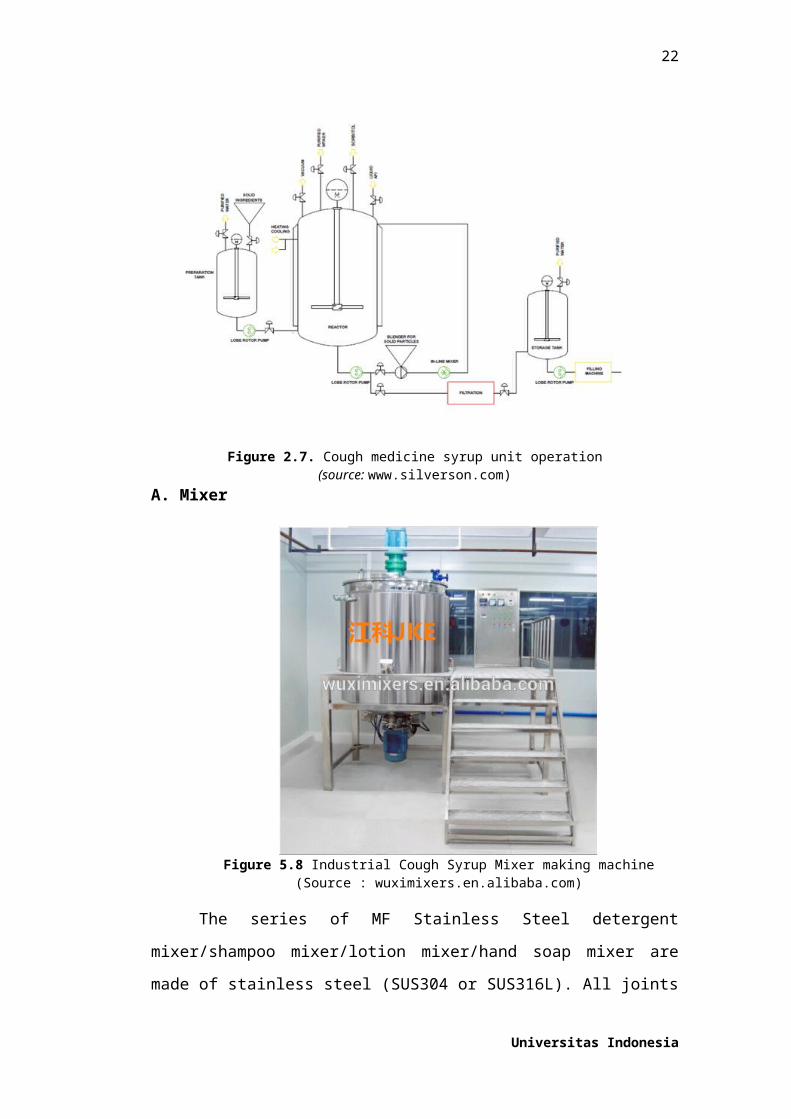
5.5 Process Description
Cough medicine syrups are produced by mixing purified water,
sweeteners, active ingredients (API), aromas, flavours and other ingredients
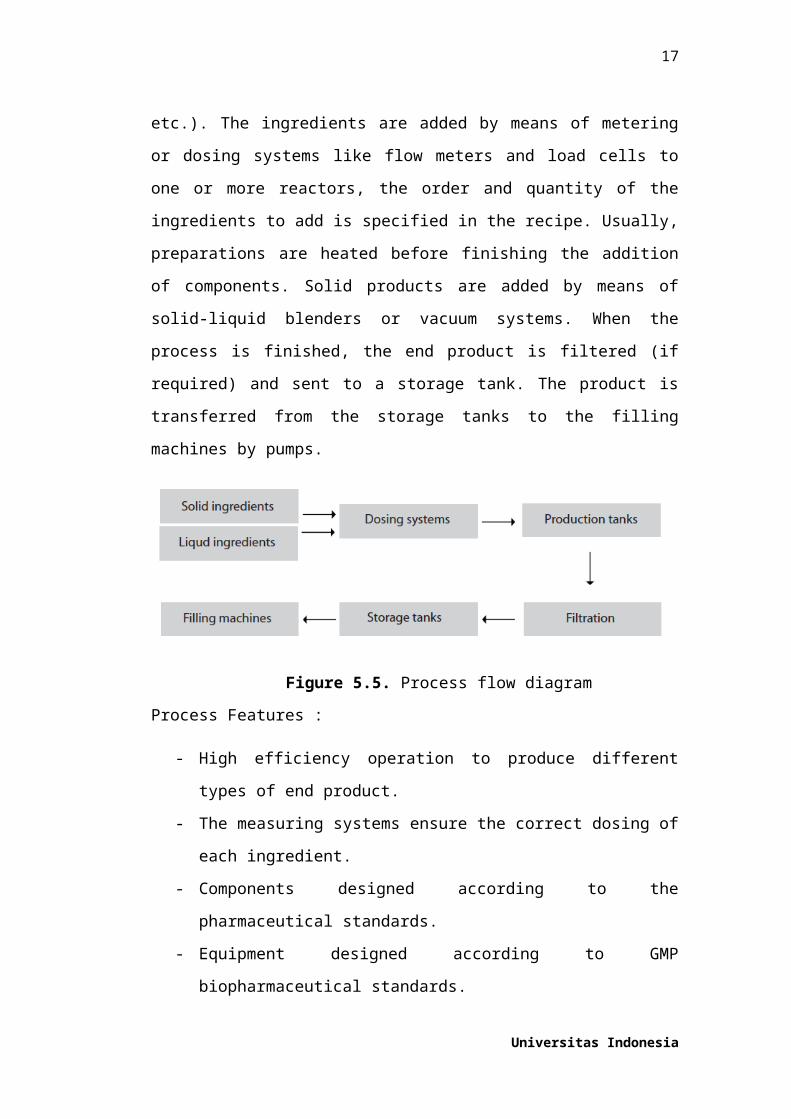
(thickeners, etc.). The ingredients are added by means of metering or dosing
systems like flow meters and load cells to one or more reactors, the order and
quantity of the ingredients to add is specified in the recipe. Usually, preparations
are heated before finishing the addition of components. Solid products are added
by means of solid-liquid blenders or vacuum systems. When the process is
finished, the end product is filtered (if required) and sent to a storage tank. The
product is transferred from the storage tanks to the filling machines by pumps.
Universitas Indonesia

12
Figure 5.5. Process flow diagram
Process Features :
- High efficiency operation to produce different types of end product.
- The measuring systems ensure the correct dosing of each ingredient.
- Components designed according to the pharmaceutical standards.
- Equipment designed according to GMP biopharmaceutical standards.
- Production lines and tanks are prepared for CIP and sanitation.
- Automatic control allows repeatability in the manufacturing process,
reducing the number
- of errors; greater flexibility of manufacturing parameters; reduction in the
number of plant operators.
- Validation protocols: design (DQ), installation (IQ) and operation (OQ).
Universitas Indonesia

13
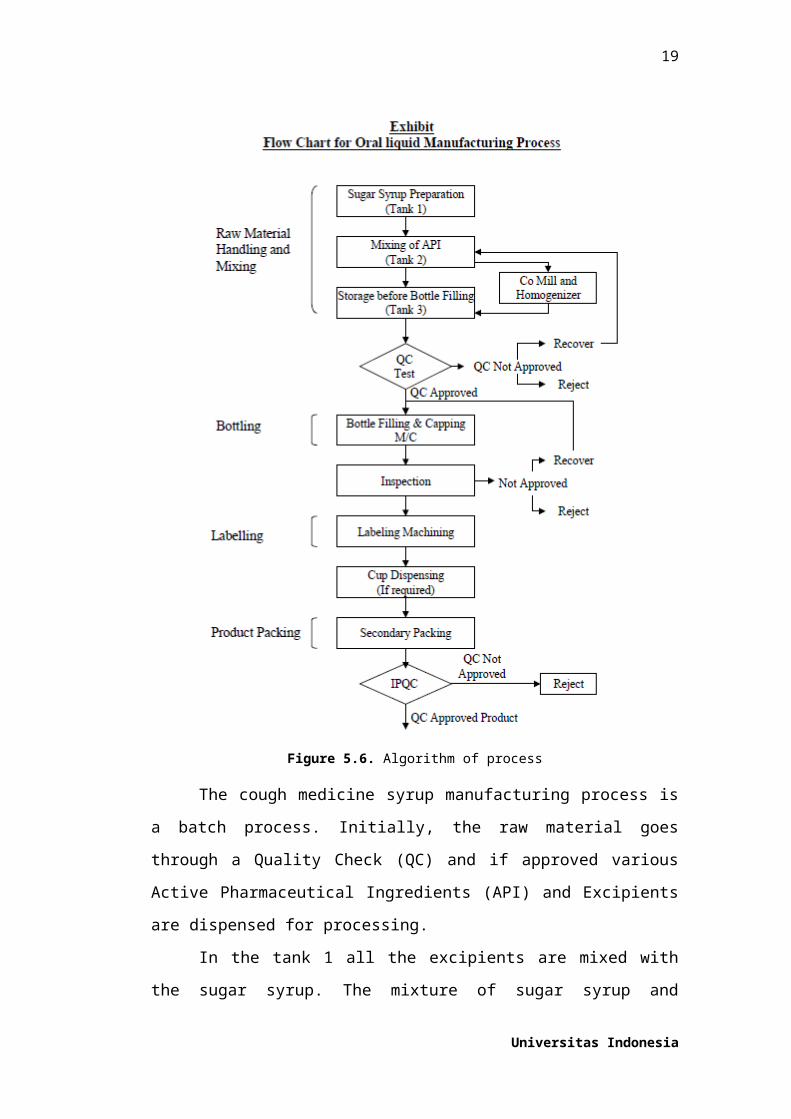
Figure 5.6. Algorithm of process
The cough medicine syrup manufacturing process is a batch process.
Initially, the raw material goes through a Quality Check (QC) and if approved
various Active Pharmaceutical Ingredients (API) and Excipients are dispensed for
processing.
In the tank 1 all the excipients are mixed with the sugar syrup. The
mixture of sugar syrup and excipients is taken to the tank 2 where Active
Pharmaceutical Ingredients (APIs) are mixed. The solution from the tank 2 is
taken to the co-mill and homogenizer where all the raw materials are mixed
Universitas Indonesia

14
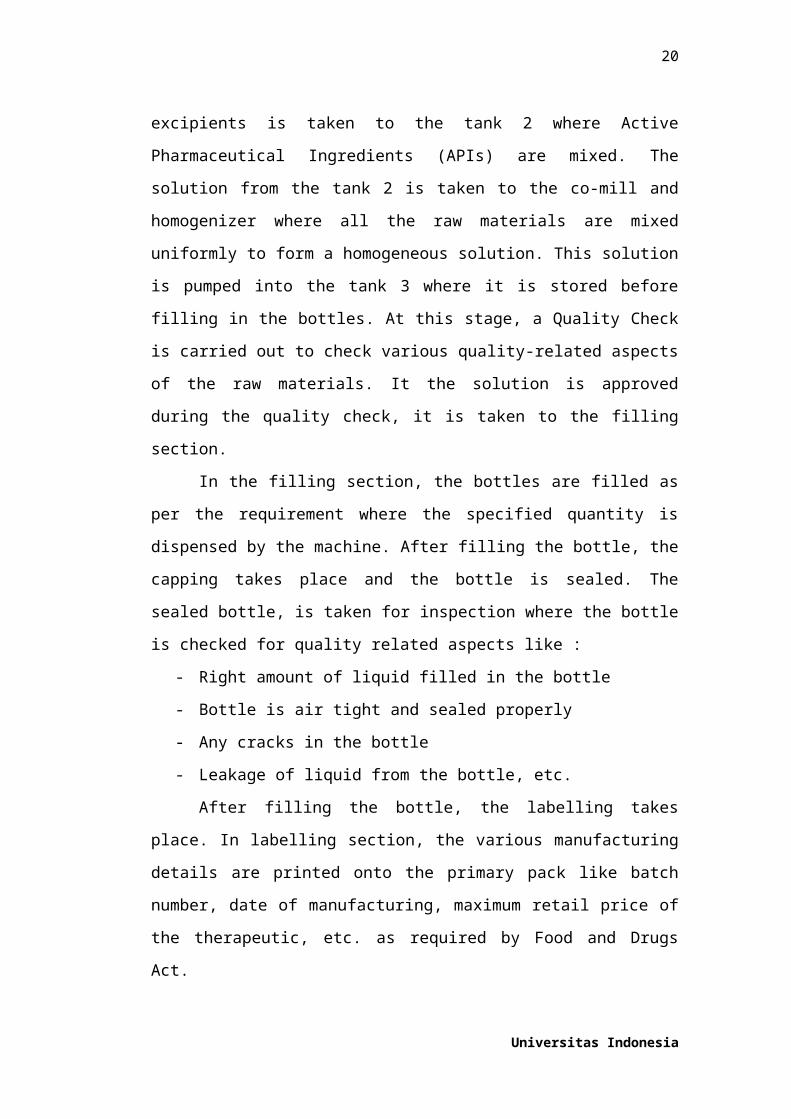
uniformly to form a homogeneous solution. This solution is pumped into the tank
3 where it is stored before filling in the bottles. At this stage, a Quality Check is
carried out to check various quality-related aspects of the raw materials. It the
solution is approved during the quality check, it is taken to the filling section.
In the filling section, the bottles are filled as per the requirement where the
specified quantity is dispensed by the machine. After filling the bottle, the capping
takes place and the bottle is sealed. The sealed bottle, is taken for inspection
where the bottle is checked for quality related aspects like :
- Right amount of liquid filled in the bottle
- Bottle is air tight and sealed properly
- Any cracks in the bottle
- Leakage of liquid from the bottle, etc.
After filling the bottle, the labelling takes place. In labelling section, the
various manufacturing details are printed onto the primary pack like batch
number, date of manufacturing, maximum retail price of the therapeutic, etc. as
required by Food and Drugs Act.
Additionally, secondary packing is done for the oral liquids in cardboard
boxes and in corrugated boxes. The packed oral liquids go through QC for final
inspection.
5.5.1 Quality, Standart and Technology
The plant should adhere to the norms laid out in standards. Additionally, if
the unit is set-up for export of pharmaceutical products then should meet the
norms of US FDA, UK MCA, WHO, etc. as required in the export markets.
It should be noted that as the proposed unit would be involved in contract
manufacturing, the manufacturing process related technology would be provided
by the principal organisation for which the contract manufacturing would be
carried out. The proposed unit would not be involved in the basic formulations
related research in the initial years.
Additionally, the manufacturing technology would not differ from other
regions as the same is not region specific. As far as the cough medicine
manufacturing equipment is concerned, the process equipment is widely available
in the country.
Universitas Indonesia

15
5.6 Unit Operation
Figure 2.7. Cough medicine syrup unit operation(source: www.silverson.com)
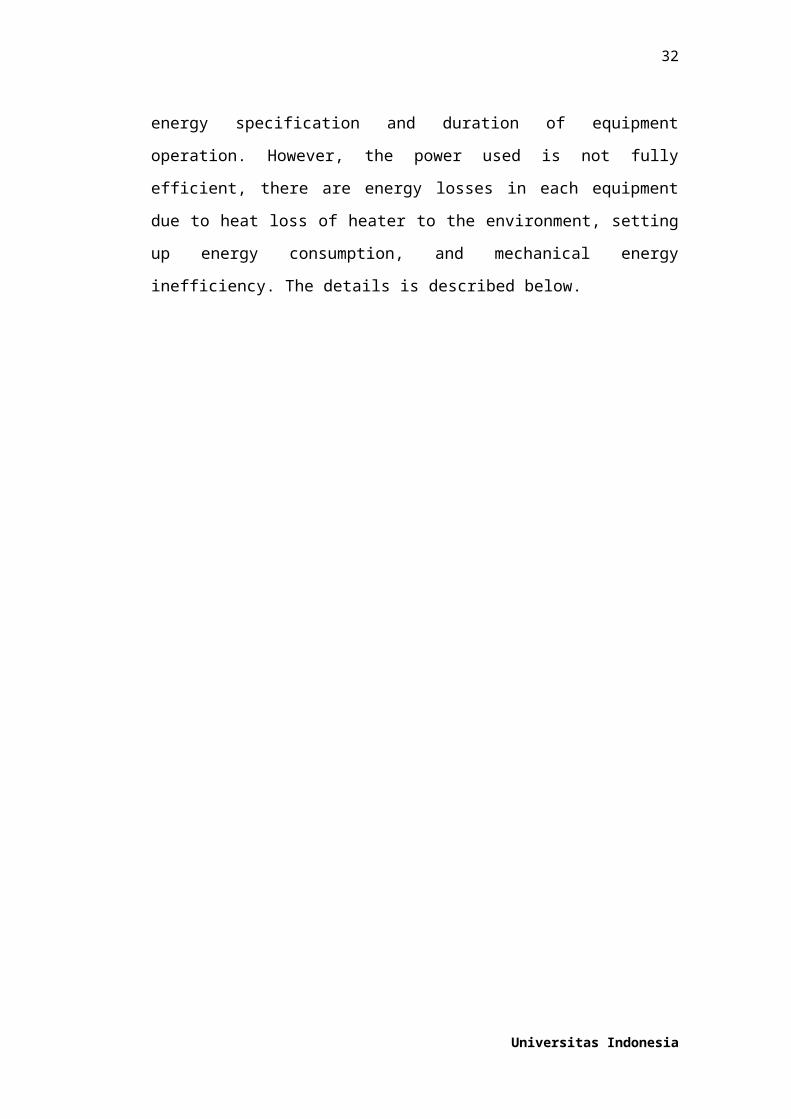
A. Mixer
Figure 5.8 Industrial Cough Syrup Mixer making machine(Source : wuximixers.en.alibaba.com)
The series of MF Stainless Steel detergent mixer/shampoo mixer/lotion
mixer/hand soap mixer are made of stainless steel (SUS304 or SUS316L). All
Universitas Indonesia

16
joints and inside is mirror finished without any dead angle and cleaned easily. It
consists of inner vessel, jacket and insulation with the configurations of agitator,
CIP hole, Manhole, sight glass, thermometer etc. The interior surface of the vessel
is subjected to mirro polishing 300EMSH (sanitary level), which is in accordance
with sanitary requirements.
Table 5.4. Unit details
Spesification Value
Application Liquid with Suspended Solids
Voltage 110V ~ 480V
Working state Vacuum / Normal Pressure
Mixer Type Agitator
Cooling system Cooling water
Heating medium Water / Oil / Steam
Heating method Electric / Steam
Price US $1,000 - 50,000 / Set
(Source : wuximixers.en.alibaba.com)
Table 5.5. Technical Parameter
(Source : wuximixers.en.alibaba.com)
Table 5.6. Spesification
Universitas Indonesia
17
(Source : wuximixers.en.alibaba.com)
B. Filling Machine
Figure 5.9. Syrup Filling and Capping Machine for Pharmaceutical(Source : wuximixers.en.alibaba.com)
Filling and Capping Machine adapt 316SS pump to fill different type of
liquid , syrup, lotion , shampoo.
Universitas Indonesia

18
Configuration and performance, features:
1. Low cost filling and capping in one machin
2. Not stable container best choice machine
3. Adopt injection pump to fill high precision, large range of adjusting dosage.
4. The pump system don’t absorb the medicament, good chemical stability, be
5. able to resist high temperature and erosion.
6. Low level liquid receiver, convenient to clean.
7. Filling system has the function of shrinking, no drop leak.
8. Apply to fill various viscosity liquid.
9. Special manipulator and guiding device are equipped on it to ensure the spray
10. cap reliably fitted on the opening of container.
11. Filling nozzle is diving bottom of bottle to fill and moving up slowly, avoid
12. foaming.
13. Magnetic moment capping system, adjust degree of tightness freely.
Main performance Parameter:
1. Name: Filling and Capping Machine
2. Model : NP-MFC
3. Applied bottle range : 20ml - 1000ml
4. Filling Nozzle : 6 and 4
5. Cap Type : Aluminum cap, Plastic cap and Ropp Cap
6. Filling speed : 2400 bottle – 3000 bottle/h
7. Power Source : 220 V,50 HZ
8. Air pressure : 0.6 Map
9. Air Consumption : 0.25m3/min
10. Dimension : 2200 mm*1300 mm*1600 mm
11. Price : US $12,000 - 12,500 / Set
C. Packaging
Universitas Indonesia
19
For packaging unit, we use manual methods (human) to packages the
cough medicine syrup in bottles to package which contain 4 bottles for each
package. In packaging unit, we split this section to two jobs. First packing jobs,
this jobs have a responbility to packages the cough medicine syrup in bottle to the
packages and the second is sealing jobs, this jobs have responbility to seal the
packages. Each jobs will be did by 5 peoples for each shift.
5.7 Mass and Energy Balance
5.7.1 Mass Balance
The calculation of production capacity in the previous section leads to the
discussion of mass balance of Cough Zero medicine production. From the final
result of market share, the maximum capacity that needs to be prepared for our
manufacturing unit is 11.000 bottles per cycle. In liquid cough medicine
manufacture process, there will be four cycles in a day to optimize the resources
that we had. In this mass balance, will be described details of components needed
to produce in one cycle. The mass balance can be seen from the tables below :
Table 5.7. Calculation for Base Capacity
Basis (mg)
Daily production 396000
IngredientsComposition
(%)
Composition
(mg)
Dextromethorphan
Polistirex
0,0083 32,868
Pseudoephedrin HCL 0,0208 82,368
Chlorpheniramine Maleat 0,0001 0,396
Paracetamol 1,3889 5500,044
Pepermint Oil 0,0278 110,088
Suqqus Liquiritae 0,4639 1837,044
Propylene Glycol 5 19800
27362,81
Table 5.7. Calculation for Base Capacity (cont’d)
Ingredients Compositio Compositio
Universitas Indonesia
20
n (%) n (mg)
Water 57,4125 227353,5
Sucrose 35 138600
Benzoic Acid 0,2 792
Sodium Benzoate 0,2 792
Paraben 0,1 396
Sorbitol 0,05 198
Essence 0,025 99
368230,5
Total
input/day395593,3
(Source : Reproduced from Group Discussion).
The calculation of mass balance will devided into five parts, which are :
pre mixing, homogenizing, tank storage, filling & capping, and packaging. These
mass balance is made based on the block flow diagram of the process and weight
basis in the begining of market demand.
Table 5.8. Calculation for the mass balance of pre mixing process
Unit Process MaterialInput
(mg)
Ouput
(mg)
MixerPre-
mixing
Active
Compound
Dextromethorphan
Polistirex32,868 32,8023
Pseudoephedrin HCL 82,368 82,2033
Chlorpheniramine
Maleat0,396 0,3952
Paracetamol 5500,044 5489,0439
Pepermint Oil 110,088 109,8678
Suqqus Liquiritae 1837,044 1833,3699
Table 5.8. Calculation for the mass balance of pre mixing process (cont’d)
Unit Process Material Input Ouput
Universitas Indonesia

21
(mg) (mg)
Propylene Glycol 19800 19760,4
27362,80
8
27308,0823
8
(Source : Reproduced from Group Discussion)
Table 5.9. Calculation for the mass balance of homogenation process
Unit Process MaterialInput
(mg)
Ouput
(mg)
Homogen
-ator
Homogen-
ation
Addition
Material
Water227353,
5
226898,7
93
Sucrose 138600 138322,8
Benzoic Acid 792 790,416
Sodium
Benzoate792 790,416
Paraben 396 395,208
Sorbitol 198 197,604
Essence 99 98,802
Intermediate
Product
27362,8
08
27308,08
238
395593,
308
394802,1
214
(Source : Reproduced from Group Discussion)
Table 5.10. Calculation for the mass balance of tank storage
Unit Process Materia Input (mg) Ouput (mg)
Universitas Indonesia
22
l
Tank Storage Storage Bulk 394802,1214 394012,5171
(Source : Reproduced from Group Discussion)
Table 5.11. Calculation for the mass balance of filing and capping ptocess
Unit ProcessMateria
lInput (mg) Ouput (Bottle)
Fille
rFilling & Capping Bulk 394012,5171 10945
(Source : Reproduced from Group Discussion)
Table 5.12. Calculation for the mass balance of pavkaging process
Unit Process MaterialInput
(mg)Ouput (Box)
Packagin
gPackaging Bottled Product 10945 2736
(Source : Reproduced from Group Discussion)
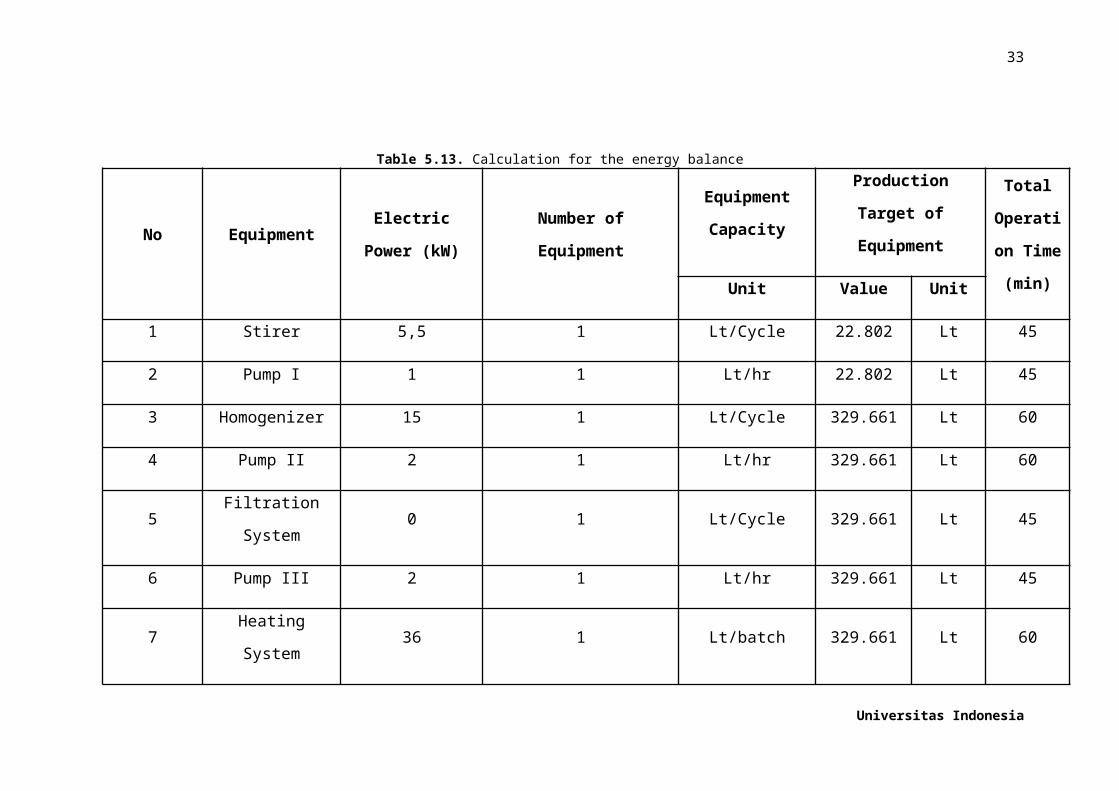
5.7.2 Energy Balance
To determine the energy balance of the production process, the power
usage in Cough Zero is obtained by summing each equipment power requirement.
The energy is supplied by PLN. The power usage is based on equipments energy
specification and duration of equipment operation. However, the power used is
not fully efficient, there are energy losses in each equipment due to heat loss of
heater to the environment, setting up energy consumption, and mechanical energy
inefficiency. The details is described below.
Universitas Indonesia

23
Table 5.13. Calculation for the energy balance
No EquipmentElectric Power
(kW)Number of Equipment
Equipment
Capacity
Production Target of
Equipment
Total
Operation
Time
(min)Unit Value Unit
1 Stirer 5,5 1 Lt/Cycle 22.802 Lt 45
2 Pump I 1 1 Lt/hr 22.802 Lt 45
3 Homogenizer 15 1 Lt/Cycle 329.661 Lt 60
4 Pump II 2 1 Lt/hr 329.661 Lt 60
5 Filtration System 0 1 Lt/Cycle 329.661 Lt 45
6 Pump III 2 1 Lt/hr 329.661 Lt 45
7 Heating System 36 1 Lt/batch 329.661 Lt 60
8 Filling 1,5 1 Bottle/hr 10.945 Bottle 120
(Source : Reproduced from Group Discussion)
Universitas Indonesia

24
Based on literature, the power loss due to table plant energy requirement is
14% of the total power usage for overall process. Therefore, the power which
PLN supplied is 114% of total power requirements each day. The details is
described below.
Table 5.14 Calculation for total power needed
No Equipment(Power supply from
PLN) kWh
(Total power /
day) kWhLoss
1 Stirer 4,7025 4,125 0,5775
2 Pump I 0,855 0,75 0,105
3 Homogenizer 17,1 15 2,1
4 Pump II 2,28 2 0,28
5 Filtration System 0 0 0
6 Pump III 1,71 1,5 0,21
7 Heating System 41,04 36 5,04
8 Filling 3,42 3 0,42
(Source : Reproduced from Group Discussion)
From the table above, we know that the energy requirement to maintain
the manufacture process/ day for Ms.Marble, marble cleanser is 71.1075 kW with
14% energy loss.
5.8 Schedulling
5.8.1 Duration of Manufacture
The production process of cough medicine occurs in batch conditions. In
order to maximize the production of cough medicine, production carried out for
14 hours per day. This is because in order to minimize losses due to the cessation
of work tools. In addition, with this production operations can maximize the
performance of the human resources available. Factory can operate for all year.
Universitas Indonesia

25
Meanwhile, experienced a period of operation of this plant and maintenance
purpose of the tool factory was supervised once in a month.
The duration of cough medicine production based on the time needed for
mixing, homogenizing, storing, filling, and packanging. Our calculation is based
on mixing in order to make the solution more homogeneous, the mixing time is a
function of Reynolds Number. The process of mixing that occurs is the process of
mixing with liquid as feed.
By using the specification tool that has been obtained, then the
calculations can be done. Here are reviews of specifications of mixing tanks are
used.
Mixer Spesification :
N = rpm of impeleer shaft = 43 rpm
d = impeller diameter = 100cm = 39.4 inch
D1 = tank 1 diameter = 1.2 m = 47.2 inch
D2 = tank 2 diameter = 1.5 m = 59 inch
MIXING
Mixing process in preparation of making marble cough medicine are
divided into two mixing: pre-mixing process and homogenation. Mixing both is
done at the time of insertion of the feed that comes from a mixture of active
compound and additive.
For the first mixing process, the process can take place by the following
equation.
ℜ=10.75N d2 S
μ=10.75
(43) (39.4 )2(0.174026)121.24
=1.03×10³
Based on graphic on ‘Chemical Process Equipment, Chapter 10’, we can
determine tmixing time.
t b N ( dD )
2.3
=1240.5
So, the mixing time required is as follows.
Universitas Indonesia

26
t b=500
N ( dD )
2.3= 1240.5
43( 39.447.2 )
2.3=44.8 minutes
Mixing process in the acid granulation takes time to reach steady state, the time
required for mixing for 44.8 minutes.
The second mixing process in the acid granulation can determine by the
following equation.
ℜ=10.75N d2 S
μ=10.75
(43) (39.4 )2(0.644709)709.53
=1.76 ×10²
Based on graphic on ‘Chemical Process Equipment, Chapter 10’, we can
determine tmixing time.
t b N ( dD )
2.3
=1022.7
So, the mixing time required is as follows.
t b=500
N ( dD )
2.3= 1022.7
43( 39.459 )
2.3=60.2 minutes
Mixing process in the acid granulation takes time to reach steady state, the
time required for mixing for 60,2 minutes.
FILTRATING
Based on our pump and filter capability, we have the capability of
filtrating and we set our intermediate products as much as 329.661 mL in 45
minutes
BOTTLING
Based on our tools capability, we have the capability of bottling machines
to bottle the products as much as 180 bottle per minute. We achieved our
production in 10945 as one cycle of the packaging. Thus, the time required is as
follows.
t= 1 minutes180 bottles
×10945 bottles
Universitas Indonesia

27
t=60.80 minutes
Based on the above calculation, the operating time required to package our
products is 60.8 minutes.
PACKAGING
Based on our human resources capability, we have the capability of
packaging using human resources to package the products as much as 45.6 packs
per minute. We achieved our production in 2736 as one cycle of the packaging.
Thus, the time required is as follows. Based on our setting, the operating time
required to package our products is 1 hour.
Universitas Indonesia

28
TIMEPROCESSheating up 15 minPre mixing 45 minpreparation 15 minHomogenizing & Filtrating 105 minFilling & Capping 120 minPackaging 60 min
heating up 15 minPre mixing 45 minpreparation 15 minHomogenizing & Filtrating 105 minFilling & Capping 120 min
heating up 15 minPre mixing 45 minpreparation 15 minHomogenizing & Filtrating 105 minFilling & Capping 120 minheating up 15 minPre mixing 45 minpreparation 15 minHomogenizing & Filtrating 105 minFilling & Capping 120 minTOTAL 1260 min
CYCLE 1
CYCLE 2
CYCLE 3
CYCLE 4
13 Hr 14 Hr 15 Hr 16 Hr 17 Hr 18 Hr7 Hr 8 Hr 9 Hr 10 Hr 11 Hr 12 Hr1 Hr 2 Hr 3 Hr 4 Hr 5 Hr 6 Hr
Figure 5.10. Time schedulling(Source : Reproduced from Group Discussion)
Universitas Indonesia

29
Based on Figure 2.9, Cough Zero production time in 1 cycle lasts for 5
hours but we can start new process cycle after preparing and filling our mixing
tank in 3 hours. Because of that we can make 4 cycles in 14 hours. We also can
know the start time and end time of a process by looking at the beginning and the
end of the boundary the rectangle when drawn vertically can be obtained starting
time and the completion of process. In table 8.1, we can identify the processes that
take place in accordance with the color.
Table 5.15. Total Time for Each Cycle
Cycle 1 2 3 4
Start
(minute)0 195 375 555
Finish
(minute)300 480 660 660
Hour/Day 5 4.75 4.75 4.75
(Source : Reproduced from Group Discussion)
Based on table 2.15, it can be seen that for a day to do the cough medicine
production for 4 cycles. The finish time at fourth cycle is 660 minutes per day or
14 hours per day. If we add an unexpected events and supervising, we can
maintain our production everyday. So, we can conclude that our estimation is still
can be accepted. The variable that can be changed in this method is the filling and
packages machine.
5.9 Utilities and Plant Maintenance
Aspects of sanitation and hygiene in the plant, especially in the production
unit is a thing that should not be ruled by us . Especially for companies that
produce medicine, as well as for the convenience of employees sanitation and
hygiene will greatly affect the product. Sanitation is planned to control the
environment, raw materials, production, equipment, and workers in order to
prevent mixing of the ingredients that are not in want into the product .
5.9.1 Plant Sanitary
In our cough medicine syrup plant, sanitation and hygiene should be
highly considered because it is directly and indirectly affect the quality of the
Universitas Indonesia

30
products. Building construction has either to protect employees, machinery , and
industrial equipment in it.The outdoor courtyard and the exterior of the building
or plant should be neat, well-maintained, and free of garbage. Maintenance always
done and that is responsible for the general section. Place of the loading and
unloading of goods, parking lots , and roads for vehicles should always be clean .
Drainage must be well maintained and ensured water flow so well that
there is no stagnant water. Trash or waste water must be sealed so as not to invite
pests and microbes. The dumpster must be well maintained and regularly
transported garbage, it has been entrusted to the janitors who do the cleaning
every day. Besides the lighting must be adequate and easy to clean. For easy
cleaning , the buildup of material at least 25 cm from the wall.
To obtain a work environment that is safe and comfortable, the building
must be equipped with sanitary facilities are made based planning meets the
requirements of engineering and hygiene. Sanitation facilities are provided by the
company, namely water supply facilities, disposal and others.
Production floor must also be designed in such a way to be able to support
its production process. Production using ceramic flooring in all areas of the plant.
The purpose is other than the use of ceramic tile is water-resistant material made
from a ceramic material would easily cleaned considering the condition of the
production process. When there are spills it will be easy to clean spills, in addition
to improving the hygiene of the floor should always be clean.
Additionally spaces in the plant should be divided into spaces that do not
require high hygienic, semi high hygiene hygienic to require workers to wear
masks, gloves, etc. to maintain hygiene.
5.9.2 Equipment Sanitation
Sanitary equipment becomes an important aspect in the industry. This is
because the equipment that we use actually direct contact with food that will be
processed. Therefore we have to apply some cleaning methods in the industry,
especially equipment, consisting of:
Universitas Indonesia

31
a. Foam or soap
Cleaning the HSA is used to clean the outer layers of the equipment. This
cleaning chemicals increase touch time with a chemical solution with mechanical
pressure and low temperature.
b. High Pressure
Increasing the mechanical pressure to help remove dirt. This cleaning method
is sometimes added detergent and increase the temperature to increase cleaning
efficiency.
c. Clean Out of Place ( COP )
Cleaning is done to the engine parts that can be separated. Cleaning is done in
containers containing chemicals are heated.
d. Clean in Place ( CIP )
Clean up for the inner surface of the tank and piping. Chemical solution put
into the tank circuit to clean the inside. Time, temperature and pressure
chemically altered as needed to achieve maximum cleaning for our equipment
such as mixer, blancher etc.
Basically, the CIP is a dry process without the need to remove the insulation
hydrodynamic (dismantling), where in the cleaning process is done with the
cleaning fluid to circulate in all channels through which the product . The cleaning
fluid can contain detergents where mechanics will lift the existing crust . CIP
process is divided into 2 types:
Single Use
The cleaning process with the use of disposable (one cycle) and sanitizer
detergent solution , and to further direct disposal (discharge). For the efficiency of
the cleaning process required flow turbulence at very high flow rates , the
consequences will be using a lot of water and effluent that great anyway . The
advantage of this process is expensive and requires a small place process .
Universitas Indonesia
32
Figure 5.11. Diagrams Work Cleaning In Place(Source: www.poubler.ibm.com)
Reuse Systems
Cleaning process that uses a cleaning fluid and would be used again at
the beginning of the cycle (subsequent) as much as possible. This process is more
expensive and requires more space to position the CIP equipment.
This method is applied to our synthetic meat plant because although
initially more expensive to buy the tools, but the process will happen
continuously, just need to control . In contrast to single use systems that are much
cheaper but the tools we have to buy on a regular basis and periodically monitor
anyway.
5.9.3 Electricity and Water Needs
a. Electricity
The power usage in Cough Zero production process is obtained by
summing each equipment power requirement. The energy is supplied by PLN.
The power usage is based on equipments energy specification and duration of
equipment operation. The energy balances is made for rough estimation of our
plant for each cycle, excluding electricity needs.
For instance, in cleaning process, it requires water pump to force the raw
material especially to make it clean with blanching.. However the power used is
not fully efficient, there are energy losses in each equipment due to heat loss of
Universitas Indonesia
33
heater to the environment, setting up energy consumption, and mechanical energy
inefficiency but in this section we assuming that the efficiency of unit operation is
100%.
After we sum the power capacity in Energy Balance Section, our plant will
need 71 kW/cycle of electrical energy, so in a day we consume electricity power
about 284 kW.
b. Water
We can see that in production process there is water that forced into
cleaning-bleaching for mixing section and forcooling system, we need to stock
300 L of water per day then carry out the waste water to the environtment because
the content of waste water from cleaning the isn’t dangerous for environtment or
to be recycle for cooling system. Water that we used come from PAM PDAM.
5.10 Plant Layout
The factory will be located in Rancaekek with ground size 200 hectare.
The price of the ground is Rp 3.000.000 / m2.
Figure 5.12 Plan Location(Source: www.googlemaps.com)
The selection of plant location is based on several factors. Such as:
The location is an Industrial Area which the land are ready to built and
the access to build it is easy.
Universitas Indonesia

34
Easy to Access from main road. Located near a toll gate.
Close to highway access, airports or harbors.
Close to public facilities such as hospitals, banks, suppliers, and
equipment technician.
Far from citizens housing
Wide Roads facilitate entry to this area, It is 5 km from the Cileunyi toll gate
and within distance to the container terminal of Gedebage which is essential for
transporting goods. Availabily of manpower as it is close to center of excellence
like Institute of Technology Bandung (ITB) and University of Padjadjaran
Bandung (UNPAD). This industrial estate is fully supported by PLN and PT
Telkom for the infrastructures. We can dispose of industrial waste into Citarik
river, so we do not need any place and special treatment for our industrial waste.
Figure 5.13 Plan Layout(Source: Group Discussion)
Universitas Indonesia

35
Universitas Indonesia