chapter 4 research design
TRANSCRIPT

185
CHAPTER 4
RESEARCH DESIGN
The appropriateness of research design is a major consideration in the testing of any
hypothesised relationships between variables. Consequently, this chapter describes the
design chosen for this study. It covers four major areas of the research process,
beginning with the definition and discussion of the sampling frame and the selection of
sample used. This is followed by an explanation of the constructs operationalised and the
development of the measurement scales used. Subsequently, the method of
administration of questionnaires, and the pilot testing associated with this, are discussed.
Finally, methods of data analysis with the key focus on the path analysis procedures are
presented.
4.1 Sampling Design
The sample selection for this study comprises executives, managers and professional
people in services, manufacturing, mining and construction companies located mainly in
the Klang Valley, Malaysia. This sample was selected for two reasons. Firstly, major
industries were selected in order to represent the major sphere of activities in Malaysia.
These industries are among the more dominant industries in Malaysia that contribute
significantly to the Gross Domestic Product (GDP) and employment. It is also believed
that the power of the theoretical framework would be increased substantially if the
predicted relationships between leadership styles, downward influence tactics,
organisational structure, satisfaction with supervision, and OCB were observed in a more
186
diverse industrial setting. Secondly, samples were drawn only from companies who
employed more than 35 employees, in order to include only organisations where a more
formalised structure and system of supervision and interactions were more likely to exist
and function (Blau & Schoeherr, 1971; Hall, 1977; Pugh, Hickson, Hinnings,
MacDonnald, Turner, & Lupton, 1963).
The companies that met the above criteria were selected from the list of companies
compiled from the Federation of Manufacturers, Malaysia, Service Directory,
Construction Industry Development Board Directory, and Malaysian Trade and
Commerce Directory published in 2008. A combination of convenient and stratified
random sampling was used in selecting the samples from the large databases, for
example, setting certain selection criteria such as the size of the company, number of
respondents per company and numbers of samples that is based on the proportion of
industry size. Effort was made to sample respondent from the three (3) major industries
that is service, manufacturing and minig and construction which play a significant role in
providing employment in Malaysia economy. The number of sample to be surveyed is
stratified based on the objective to secure adequate or proportionate representation of
these industries. The proportion of industry size was based on the data published in the
Malaysia Economic Report (2008/2009). Data from respondents were obtained through a
survey questionnaire, a sample of which appears in Appendix I. A cover letter describing
the purpose of the study was enclosed with the questionnaire together with a self-
addressed and stamped envelope. The cover letter also requested that the questionnaires
be distributed to the executive, managerial or professional staff within the company.
This indicates that the unit of analysis is individual and not organisation. It was stressed

187
that questionnaire responses were confidential, anonymity of respondents was
guaranteed, and that participation was voluntary. In addition, questionnaires were also
distributed via electronic mail to the researcher‟s acquaintances who held executive
positions in companies within the selected industries.
For this study, the method of sample selection provided certain advantages. Apart
from accessibility and minimal costs, there was the advantage of being able to pre-screen
the sample in terms of the size of the organisation within which the superior-subordinate
relationship was examined. Finally, it is stated clearly that the purpose of the research
based upon this sample was not to determine or describe the norms of organisational
members; rather, the primary intention was to discover latent relationships among
variables. Such relationships are likely to appear even if the set of subjects departs
somewhat from an accurate probability sample drawn from the entire industries‟
population. Based upon this design, the study sample closely represents firms of various
sizes and major industrial sectors classified in the region.
4.2. Construct and Measurement Scales
In this integrative study, a total of fourteen constructs were used. These constructs were
organised into five groups: (i) leadership styles; (ii) downward influence tactics; (iii)
organisation contexts (consists of structure and span of control); (iv) intervening
variables (role ambiguity and subordinates‟ competence) and (v) outcomes
(organisational citizenship behaviour and satisfaction with supervision). All data used in
the study consist of responses to questionnaire items. Measures of the relevant constructs
were adapted from previous studies with some modifications. All the scales used to
188
assess the constructs were pre-tested in the first round of the survey distributed to thirty
five (35) PhD and MBA candidates and were revised prior to the data collection.
4.2.1 Leadership Styles
There are two popularly used instruments available for measuring transformational and
transactional leadership styles. These instruments are: (i) the Bass and Avolio (1995)
Multifactor Leadership Questionnaire (MLQ, Form 5X Short) and (ii) Podsakoff et al.
(1990) Transformational Leadership Behaviour Inventory (TLI) and Leader Reward and
Punishment Behaviour (LRP). LRP is also called Transactional Leadership (Avolio,
1999; Bass, 1985b; Burns, 1978; Howell & Avolio, 1993).
4.2.1.1 Transformational Leadership
For the purpose of this study, the instrument developed by Podsakoff et al. (1990)
was used to assess leadership style. The transformational leadership style measurement
is called Transformational Leadership Behaviour Inventory (TLI). This instrument uses a
seven-point Likert-type scale to measure subordinates‟ perceptions of their superior‟s
transformational style of leadership. The TLI was designed to measure six dimensions of
transformational leadership style that have been identified in the research literature
(Bennis & Nanus, 1985; Bradford & Cohen, 1984; Conger & Kanango, 1987; Kouzes &
Poasner, 1987; MacKenzie et al., 2001; Podsakoff et al., 1996b; Podsakoff et al., 1990;
Trichy & Devanna, 1986; Wang et al., 2005). These dimensions are: articulating a
vision, providing an appropriate role model, fostering the acceptance of group goals, high
performance expectations, supportive leader behaviour, and intellectual stimulation.

189
Examples of items of each dimension include “My superior inspires me with his or her
plans for the future” (articulating a vision), “My superior leads by example” (providing
an appropriate role model), “My superior encourages me to be a team player” (fostering
the acceptance of group goals), “My superior insists on only the best performance” (high
performance expectations), “My superior considers my personal feelings before acting”
(supportive leader behaviour), and “My superior has stimulated me to rethink the way I
do some things” (intellectual stimulation).
Previous research has provided strong evidence supporting the hypothesised
factor structure, internal consistency reliability as well as concurrent and discriminant
validity of the scale (Podsakoff et al., 1996b; Podsakoff et al., 1990). Subsequently, three
dimensions (i.e. articulating a vision, providing an appropriate model, and fostering the
acceptance of group goals) were found to be highly intercorrelated and were subsumed
and modelled as indicators of a second-order construct called core transformational
leader behaviour as reported in the Podsakoff et al. (1990) study.
In this study and in the interest of parsimony, the core transformational scale was
similarly treated as representative of the description of the original instrument produced
by Podsakoff et al. (1990), involving five-items in respect of articulating a vision, three
items concerned with providing an appropriate model, and four items about facilitating
the acceptance of group goals. In addition, the core transformational scale emerged as
highly intercorrelated in this study, so the recommendation by Cohen and Cohen (1983)
to sum up the scores to form the composite core transformational values was followed.
The shortened and combined version of the scale was constructed based on the
description of second order constructs by Podsakoff et al. (1996a) that concisely capture

190
the essence of the dimension. As the three dimensions are combined through summation,
their accuracy is less influenced by the precision of individual measurement of the
dimension. Overall, the TLI were operationalised through fourteen questionnaire items.
In brief, the scale as shown in Appendix I was adapted from the scale by Podsakoff et al.
(1990) with minor modifications. The questionnaire items D1, D8 and D13 measure core
transformational leadership, D2, D10 and D17 measure high performance expectations,
D4, D6, D15 and D18 measure supportive leader behaviour and D9, D14, D19 and D21
measure intellectual stimulation. These questions were asked for each of the four TLI
factors and ascertained on a seven-point Likert scale.
A similar approach to combining subscales has been reported by previous
researchers (Bartram & Casimir, 2007; Bass & Avolio, 2000; Boerner et al., 2007; Bono
& Judge, 2003; Deluga, 1988b; Engelbrecht & Chamberlain, 2005; Hambley, Kline, &
O‟Neil, 2005; Kerlinger & Lee, 2000; Krafft, Engelbrecht, & Theron, 2004; MacKenzie
et al., 2001; Nemanich & Keller, 2006; Schlechter & Engelbrecht, 2006; Walumba,
Orwa, Wang, & Lawler, 2005; Walumbwa et al., 2004) who combined the Bass and
Avolio (1995) transformational leadership‟s subscale of charisma, inspirational
motivation, intellectual stimulation and individualised consideration into a single
transformational leadership variable. These four subscales are theoretically and
empirically related (Avolio, Bass, & Jung, 1999; Bass, 1998; Bass & Avolio, 1989; Bono
& Judge, 2003; Kark et al., 2003; Walumbwa & Lawler, 2003; Walumbwa et al., 2004).
This is also consistent with other empirical developments on transformational leadership
which have constantly proven the dimensions to be highly correlated and reflect a high-
order construct of transformational leadership (e.g. Antonakis, Avolio, &

191
Sivasubramaniam, 2003; Avolio et al., 1999; Bass, 1998). Bass (1998) has discussed this
combination confirming that it meets the needs for parsimony in research. The internal
consistency (coefficient alpha) of transformational leadership scale reported was 0.92 and
the subscales demonstrated high intercorrelations with average r = 0.83, p < 0.005 (Bass
& Avolio, 2000).
In the same vein, a study by Schlechter & Engelbrecht (2006) tested the validity
and reliability of the transformational scale developed by Bass and Avolio (1995) -
Multifactor Leadership Questionnaire (MLQ). The measurement was subjected to
confirmatory factor analysis (CFA) and exploratory factor analysis (EFA). A single
factor representing transformational leadership emerged when the data was analysed via
EFA. Their finding of a unidimensionality of transformational leadership subscales
suggested that the factors loaded satisfactorily (0.50 ≤ λ ≤ 0.86) on the four dimensions
(Engelbrecht & Chamberlain, 2005; Krafft et al., 2004; Kerlinger & Lee, 2000). This
single factor explained 60% of the variance in the sample. The reliability and predictive
validity of the transformational leadership scales were good, being established between
the range of 0.75 ≤ α ≤ 0.87. A meta-analysis of studies using the MLQ in previous
studies confirmed the reliability of the transformational, and demonstrated it to possess
strong predictive ability (Lowe, Kroeck, & Sivasubramaniam, 1996). The EFA
measurement model when testing by CFA also confirmed a satisfactory fit index with an
alpha of α = 0.97. The final conclusion of Schlechter and Engelbrecht (2006) was to use
the EFA-derived measurement model as a measure of transformational leadership instead
of the CFA-derived measurement model, because of the CFA model did not fit the data in
their study.

192
The justification for treating the leadership scale as unidimensional is the need to
achieve construct parsimony that best differentiates the leadership style. This is the
approach adopted in this study. For all items, the respondents were asked to indicate on
a seven-point Likert-type scale (1 = Strongly disagree to 7 = Strongly agree), the extent
of their superiors‟ use of a particular style of leadership. Responses were then coded,
mean scores (range 1-7) was calculated for each dimension, with high scores indicating
greater use of transformational style. The twenty one-item scale is shown in Appendix I,
Part D of the questionnaire. The order of items was randomised in the questionnaire to
avoid response bias. Additionally, some items were phrased positively and others
negatively to overcome the problems of acquiescence. The scores for the negatively
phrased items were reversed before analysis. Moreover, a number of studies have
reported an adequate test-retest and internal consistency coefficients (reliabilities) for this
instrument (Podsakoff & MacKenzie, 1989; Podsakoff et al., 1984; Schriesheim, Hinkin,
& Podsakoff, 1991).
4.2.1.2 Transactional Leadership
The transactional leadership measurement applied in this study is Leader Reward
and Punishment (LRP), a scale developed by Podsakoff et al. (1990). It consists of seven
items that employed a seven-point Likert scale to measure two dimensions of
transactional leadership called Leader Reward and Punishment (Podsakoff et al., 1984;
Podsakoff et al., 1982). Although there are other measures such as the Multifactor
Leadership Questionnaire (MLQ) developed by Bass (1985b), this measure was used
because of the LRP has demonstrated excellent psychometric properties in previous

193
studies and also because of its robustness in assessing transactional leader behaviour
(MacKenzie et al., 2001; Podsakoff et al., 1984; Podsakoff et al., 1982). The first four
items were used to measure contingent reward behaviour (Podsakoff et al. 1984;
Podsakoff & Organ, 1986). The sample items include “My superior always gives me
positive feedback when I perform well” and “My superior gives me special recognition
when I produce at a high level”. The other three items assessing the contingent
punishment are: “My superior would indicate his or her disapproval if I performed at a
low level”, “My superior lets me know about it when I perform poorly” and “My superior
points it out to me when my productivity is not up to par”. Previous research has treated
these two scales as unidimensional (Podsakoff et al., 1984; Podsakoff, MacKenzie &
Fetter, 1993; Podsakoff, Niehoff, MacKenzie & Williams, 1993).
In this study, the transactional leadership scale is again treated as unidimensional.
This is consistent with the approach that some researchers have taken by combining the
scores of all dimensions belonging to transactional leadership (MacKenzie et al., 2001;
Podsakoff, MacKenzie & Fetter, 1993; Podsakoff, Niehoff, MacKenzie & Williams,
1993; Podsakoff et al., 1984). The seven-item scale of transactional leadership as shown
in Appendix I, Part D was randomised with the transformational leadership items to avoid
direct identification of the leadership styles items.
The measurement scale used was adapted with some modifications from the
original scale. Table 4.1 shows the transactional leadership scale items re-worded to
reflect a more distinct transactional style from the original scale after a pilot test was
conducted with the assistance of thirty-five (35) PhD and Master scholars. The
respondents were directed to think about their superior‟s leadership style and indicate the

194
degree to which each of the statements characterised that individual. Two items were
modified from the original scales following this pilot test. Item 11 seems to overlap with
item 5, thus it is replaced by scale item that capture another essence of exchange
relationship. The item 20 also seems to invite similar response as item 5, thus it is
replaced with a statement that indicate a typical conditional relationships that is prevalent
in transactional style.

195
Table 4.1: Transactional Leadership Scale Items with Modifications
Item
Original Scale Item
Modified Scale Item
3.
My superior always gives me positive
feedback when I perform well.
My superior only gives me positive
feedback when I perform well.
5. My superior would indicate his or her
disapproval if I perform at a low
level.
My superior will clearly show his or her
disapproval if I perform at a low level.
7. My superior gives me special
recognition when I produce at a high
level.
My superior assures special recognition
when I produce at a high level.
11. My superior lets me know about it
when I perform poorly.
My superior tells me there is a close
agreement between what I am expected
to put into the group effort and what I can
get out of it.
12. My superior commends me when I
exceed my productivity goals.
My superior usually commends me only
if I exceed my productivity goals.
16. My superior frequently does not
acknowledge my good performance.
My superior usually does not care to
acknowledge me unless it is related to my
good performance.
20. My superior points it out to me when
my productivity is not up to par.
My superior states in a matter-of-factly
about what I can get from what I
accomplish.
196
4.2.2 Downward Influence Tactics
The researcher measured the downward influence tactics from the subordinates‟
perceptions of their superior‟s use of influence tactics on them by using the Influence
Behaviour Questionnaire (IBQ-2000) of Yukl and Falbe (1990). This influence typology
is widely used in research (Aguinis et al., 1994; Barbuto et al., 2002; Ceasar & Gardner,
2004; Charbonneau, 2004; Falbe & Yukl, 1992; Sparrowe et al., 2006; Yukl et al., 1993;
Yukl et al., 1995; Yukl & Tracey, 1992). The IBQ-2000 comprised of 44 items
measuring all directions of influence tactics, upward, lateral and downward. It was
operationalised through a multi-item scale representing nine dimensions of influence
tactics, these being: inspirational appeals, consultation, rational persuasion, ingratiation,
exchange, personal appeals, coalition, legitimating and pressure tactics. Yukl (2002)
concludes from his finding on the directional use of influence tactics that inspirational
appeals, consultation, ingratiation, exchange, legitimating and pressure tactics are more
downward than lateral and upward tactics.
Not all of the original 44 items on the influence tactics measurement scale
developed by Yukl and Falbe (1990) capturing all directions were used in this study since
the focus is confined to downward influence tactics. Only thirty (30) items were selected
based on their face validity and as a result of the factor structure in various previous
studies (Soetjipto, 2002; Sparrowe et al., 2006). These thirty (30) items represent the six
downward influence tactics used in this study. The respondents were asked to indicate on
a five-point Likert-type scale, the extent of their superiors‟ use of a particular downward
influence tactic. The measure for each style is shown in Appendix I Part E of the
questionnaire which consists of Inspirational appeals (7 items i.e. E1, E7, E8, E13, E19,

197
E25 and E30); Consultation tactics (4 items i.e. E2, E10, E15 and E22); Ingratiation
tactics (4 items i.e. E9, E17, E21 and E28); Exchange tactics (8 items i.e. E4, E5, E11,
E12, E16, E18, E24 and E27); Pressure tactics (4 items i.e. E3, E20, E26 and E29) and
Legitimating tactics (3 items i.e. E6, E14 and E23). An overall measure of the degree to
which the leaders conformed to a specific influence tactic was derived by taking the mean
score across the respective scale items defining the „style‟. The 30-item scale underwent
validity and reliability checks by means of factor analysis to estimate the number of
factors. The scale clearly differentiates the six downward influence tactics postulated in
this study framework, demonstrating their multi-dimensionality with all styles and
yielding an Alpha value greater than 0.78.
4.2.3 Organisational Structure
In this study, structure is conceptualised on a mechanistic-organic continuum. The term
„organicness‟ indicates the extent to which an organisation possesses what Burns and
Stalker (1961) would call an organic structure that is, a structure not represented by
highly specified and delimited job descriptions or highly formalised procedures.
Organisation structure was captured by a seven-item scale which measures organicity,
that being the extent to which organisations are structured as organic versus mechanistic
entities. The seven-item scale was developed by Khandwalla (1977) and later used by
Covin and Slevin (1989) and Low (2005). The respondents were asked to indicate on
seven-point Likert-type scale the position of their firms‟ organizing inclination between
two extreme ends of mechanistic and organic structure. The firms‟ mean rating on these
seven items was used as the measure of their organicity index. The higher an index
indicates the greater, the tendency towards organic structure. This scale is shown in
198
Appendix I, Part F of the questionnaire. Covin and Slevin (1989) demonstrated that the
scale has an inter-item reliability coefficient of 0.80, while Low (2005) reported a
coefficient of 0.79.
4.2.4 Span of Control
The span of control is an indication of the number of direct subordinates being supervised
by a superior. For statistical analysis the span of control is simply measured as the
number of employees reporting to the supervisor. This scale is shown in Appendix I, Part
B7 of the questionnaire.
4.2.5 Subordinates’ Competence
The Wagner and Morse (1975) 23-item self-report measure of individual sense of
competence was used to measure employees‟ competence in lieu of a more direct
measure of competency level. An example of a scale item is “I honestly believe I have
all the skills necessary to perform this task well.” All items were scaled on seven-point
agree-disagree Likert rating scale. Evidence pertaining to the reliability and predictive
validity of this measure is located in several sources (Morse, 1976; Wagner & Morse,
1975). Using this scale means that competence was assessed from the subordinate‟s own
perspective rather than manipulated directly as in the laboratory study. Although the
present assessment of competence is subject to common method variance due to the self-
report measure, it should be noted that previous research (Morse, 1976; Tharenou &
Harker, 1984; Wagner & Morse, 1975; Snyder & Bruning, 1985) has given strong
support for this measurement. For example, Steel, Mento, Davis, and Wilson (1989) who

199
explore the Wagner and Morse (1975) psychometric properties of the Sense of
Competence Questionnaire (SCQ) using data of 849 individuals, found that the construct
validation of self and supervisory ratings of competence converged on a common
evaluation. The SCQ
measures the skill
and ability, job feedback and need for
achievement and the concurrent
validation indicated that the SCQ instrument
demonstrated a moderate predictive validity (r = 0.26, p < .001).
4.2.6 Role Ambiguity
The present study employed a six-item scale developed by Rizzo et al. (1970) to measure
role ambiguity. The items were designed to “reflect certainty about duties, authority,
allocation of time and relationship with others; the clarity or existence of guides,
directives, policies and the ability to predict sanctions as outcomes of behaviour” (p.
156). Individual scale items were evaluated on a seven-point Likert-type scale (1 = very
false, 2 = false, 3 = slightly false, 4 = neither true nor false, 5 = slightly true, 6 = true, 7 =
very true). The scale was reverse coded such that higher number responses reflect greater
levels of role ambiguity. The selection of this scale was due to its frequent use in
management research to measure role ambiguity. In fact, 85% of previous studies have
applied the role ambiguity tool developed by Rizzo et al. (1970) according to Jackson and
Schuler (1985) and Tubre and Collins (2000). Secondly, it seems to have adequate
construct reliability and validity which all support the continuous use of this scale
(House, Schuler, & Levanoni, 1983; Schuler et al., 1997). The reported Cronbach
coefficient alpha levels of the Rizzo, House, and Lirtzman (RHL) scale range from 0.65
to 0.82, while Nicholson and Goh (1983) demonstrated α = 0.84 for both role conflict and

200
role ambiguity. Finally, the RHL scale is substantially shorter - that is six items versus
45 items - than some other measurement instruments that have been designed (Singh &
Rhoads, 1991).
However, the RHL scale has been criticised due to its one-dimensional nature and
its linear view of role ambiguity. According to King and King (1990), despite its
widespread use, the RHL measures have shortcomings because the scale items lack
clarity and precision, and ignore the multidimensionality of the underlying construct.
This prompted Sawyer (1992) and Singh and Rhoads (1991) to develop multidimensional
measurement tools by examining the components of role ambiguity such as expectations,
priorities, process and behaviours. Nonetheless, although the RHL scale has attracted
criticism, Jackson and Schuler (1985) strongly suggest that it should be used due to its
widespread acceptance and the validations and reliability of this instrument conducted by
many previous researchers. In this study, the researcher made the decision to use the
RHL scale that suit the purpose of this study which demands less computing effort and
analysis, even if a more precise instrument is available.
4.2.7 Organisational Citizenship Behaviour (OCB)
There are several OCB scales found in the literature. The scale that developed by Farh et
al. (1997) consists of self realisation, organisational identification, collegiality,
conscientiousness, unselfishness and interests. Podsakoff et al. (1990) produce five
dimensions of OCB on their scale, measuring altruism, conscientiousness, sportsmanship,
civic virtue and courtesy. Likewise, Organ (1988) chose the same five dimensions,
namely: courtesy, civic virtue, conscientiousness, altruism and sportsmanship. OCB is

201
considered as a global concept made up of two key dimensions called altruism and
generalised compliance, and these two dimensions were used in the earlier empirical
works of Bateman and Organ (1983), Organ (1988), Organ and Konovsky (1989) and
Smith et al. (1983).
In the present study, the researcher has decided to adopt the OCB instrument
developed by Smith et al. (1983) and measure it as a global construct. This instrument
consisted of seven items on the altruism and compliance dimension. The two-
dimensional view of OCB was chosen over the broad categories of OCB due to its
popularity in earlier studies conducted by Smith et al. (1983). In a test of the scale
produced by Smith et al. (1983) involving 58 supervisor-raters and 422 employee-ratees,
two distinct factors of altruism and compliance of OCB emerged, with alpha coefficients
of 0.88 and 0.85 respectively. Jones and Schaubroeck (2004) reported the reliabilities of
the two measures as being 0.79 (altruism) and 0.80 (compliance) for the employee-rated
measures.
The OCB scales were completed by the respondents themselves who were asked
to rate on a seven-point scale with anchors ranging from “never” (1) to “always” (7) with
which they have engaged in these citizenship behaviours. Examples of sample items for
the OCB are “I help others with their work when they have been absent even when I am
not required to do so”; “I volunteer to do things not formally required by the job”; “I take
the initiative to orient new employees to the department even though it is not part of my
job description”; “I willingly attend functions not required by the company management,
but which help its overall image”. Scores for these constructs were calculated by
202
averaging the item responses for each respective factor. This scale is shown in Appendix
I, Part G of the questionnaire.
4.2.8 Satisfaction with Supervision
Operationally, job satisfaction has been investigated as a person‟s affective state relative
to several job facets (Churchill et al., 1974; Smith, Kendall, & Hulin, 1969). There are
several measurement scales available to assess the employee satisfaction, for example,
Smith et al. (1969) measure subordinate satisfaction using the Job Descriptive Index
(JDI), which comprises five dimensions: satisfaction with job, co-workers, pay,
supervision, and career advancement. Weiss, Dawis, England, and Lofquist (1967)
developed the Minnesota Satisfaction Questionnaire (MSQ) to measure job satisfaction.
Porter and Lawler (1968) divide the job satisfaction construct into intrinsic and extrinsic
components, and global satisfaction measure, with no division into separate facets
(Bagozzi, 1980a, 1980b; Hackman & Oldham, 1975). Intrinsic satisfaction is derived
from actually performing the work and experiencing feelings of accomplishment, self-
actualisation and identity with the task. Extrinsic satisfaction is derived from the rewards
bestowed upon an individual by peers, superiors or the organisation and can take the form
of recognition, compensation and advancement. Global satisfaction has been
conceptualised as a linear aggregation of intrinsic and extrinsic satisfaction by some
(Weiss et al., 1967), as an aggregation of satisfaction with various job facets (Levin &
Stokes, 1989), or as an aggregation of a few measures of general satisfaction (Hackman
& Oldham, 1980).

203
Hackman and Oldman (1980) have segregated the facet satisfaction which
includes the five aspects of job security, pay, co-worker, supervision and opportunities
for personal growth. Although there appears to be a good deal of variety in the specific
conceptualisation of satisfaction, this study will focus on one facet of job satisfaction
called satisfaction with supervision (Warren, 1998). The satisfaction consists of three
items assessing satisfaction with supervision, method of supervision and quality of
supervision. Respondents rated their level of agreement with these items using a five-
point scale ranging from 1 “extremely unsatisfied” to 5 “extremely satisfied”. The
satisfaction with supervision is measured by averaging the scores from answers to three
items assessing the degree of agreement with various statements. Sample items are
“Overall, how satisfied are you with your supervisor?”, “How satisfied are you with the
methods of supervision used by your supervisor to get your job done?” and “How
satisfied are you with the overall quality of the supervision you receive on your work?”.
The internal consistency reliability for this scale as reported by Warren (1998) is 0.93.
The scale is shown in Appendix I, Part H of the questionnaire.
4.3 Pre-testing of Questionnaire and Questionnaire Administration
The main data collection tool used in this research is the survey questionnaire. A pre-test
by self-administration with 35 target respondents who were PhD and MBA students was
carried out before the questionnaire was revised and mailed so that unclear wording or
misleading sentences could be corrected. This step provided the real test of the
effectiveness of the questionnaire on how it performs under actual conditions of data
collection. The pre-testing was conducted by a „sit-in‟ personal interview to directly

204
observe if any of the questions seemed confusing, leading or bias inducing, or if they
caused any respondent to resist or hesitate for whatsoever reason. This step proved to be
invaluable, as some feedbacks called for further clarification and explanation and this
resulted in a more comprehensible set of questionnaire items. Most of the statements
corrected were related to leadership styles, which had a tendency to be viewed as
overlapping.
Questionnaires were mailed to the executives or managers of companies in Klang
Valley with an introductory letter (shown in Appendix I) which requested for their
participation, explained the purpose and significance of the research and at the same time
promise anonymity of the respondent. As it was expected that the lengthy questionnaire
typically demanded by an integrative study might not generate a good response (Steeh,
1981), the electronic mailing method was used to send the questionnaire to selected
respondents known to the researchers who had earlier agreed to respond to the
questionnaire. Overall, the respondents were expected to return the questionnaire using
the provided self-addressed and stamped envelopes or via electronic mail.
4.4. Data Preparation and Scale Purification
4.4.1 Data Screening and Coding
The returned questionnaires were analysed for missing data, respondent biases and
inconsistent or illogical data. Decision criteria as prescribed earlier were set for rejecting
and accepting the sample based on the size of organisation. The quality of the responses
was gauged from the pattern and consistency of the answers given. Too random or a
monotonous scoring reflects an unconsidered answer or a certain lack of interest, and in

205
these circumstances, responses must be discarded to prevent them from confounding the
overall results.
Since most of the questionnaire items were pre-coded, the data was readily
entered into the data file without the need for a coding sheet. The data file was cleaned
for final analysis. This involves the use of frequency and descriptive statistics to
determine the missing data and pinpoint the highest and lowest values that indicated an
illogical entry. The missing data when suspected to arise from act of omission only was
treated by substituting the mean response to the question. This approach tends to have a
small effect on computations such as correlations although responses with more than
three missing data were discarded.
4.4.2 Measurement Reliability
To enhance the quality of measurement, scale items were tested for reliability and
consistency in construct dimensionality. These analyses were performed on the multi-
item scale of measurement of the leadership styles, downward influence tactics,
organisational contexts, subordinates‟ competence, role ambiguity, satisfaction with
supervision and OCB. The statistical software used for this computation is the Statistical
Package for Social Science (SPSS) version XII, which is widely used in social science
research.
Foremost, the set of items used to measure construct was assessed and refined
with factor analysis. This was carried out on the multi-item measures, which were often
formulated using the taxonomic approach, the purpose being to test whether the data
being analysed were consistent with the imposed dimensionality of the construct in

206
question. Additional, this step was to determine whether items in the instrument could be
used in totality or in part to analyse the present data. This analysis was performed using
the FACTOR procedure in SPSS. The typical analysis involved three steps: (i) the
preparation of the covariance or correlation matrix, (ii) the extraction of the initial factors
– the exploration of possible data reduction, and (iii) the rotation to a terminal solution –
the search for simple and interpretable factors. The factor analytic procedure selected
was the maximum likelihood method which is quite commonly used in the implicit
testing of hypotheses about the underlying dimensions of a set of data (Joreskog, 1974).
Varimax rotation was chosen to simplify factors (Hair, Anderson, & Tatham, 1987; Hair,
Black, Babin, Anderson, & Tatham, 2006). The output of the procedure FACTOR
includes the correlation matrix, inverse of correlation matrix, communalities, eigenvalues
and proportion of common variance, rotated-factor matrix and transformation matrix,
factor-score coefficient matrix and plot of rotated factors. A more elaborate explanation
of the factor analysis can be found in many data analysis reference books (Green, Tull, &
Albaum, 1988; Hair et al., 1987; Hair et al., 2006; Harman, 1967).
The next stage was to find the mean, standard deviation and standardised
Cronbach‟s (1951) Coefficient Alpha for each subscale or scale used in the study. The
mean is useful to illustrate the central tendency for each of the measured variable while
the standard deviation provides an indication of dispersion of data about the mean of an
interval-level variable. The Cronbach Alpha will give the indication of the internal
consistency reliability of the multi-item scales. All of the basic statistics described above
were obtained from the RELIABILITY procedure in SPSS. The evaluation of the scale
207
and items was made from the item means, item variances, inter-item covariances, inter-
item correlations and the item-total statistics.
The Pearson correlation coefficient was used to measure the association among
the constructs. This allowed a preliminary interpretation of the hypothesised
relationships. Predictive validity of the construct was assessed by confirming the
anticipated direction of associations among the constructs. The Pearson correlation
coefficient was also used to assess whether any inappropriate variable could be dropped
from further analysis. The Pearson product-moment correlations (these are zero-order
correlations because no control for the influence of other variables are made) which were
computed by Pearson correlation serve two purposes. Other than their role as indicators
of the goodness of fit of the linear regression, they provide a measure of association
indicating the strength of the linear relationship between pairs of variables. This is
measured by the Pearson correlation coefficient (r). Mathematically, r is defined as the
ratio of covariation to square root of the product of the variation in x and variation in y,
where x and y symbolise the two variables.
The coefficient obtained can range from -1.0 for a perfect negative relationship to
+1.0 for a perfect positive relationship, with zero indicating absolute independence of the
two variables. Since the direction of the associations among the main variables were
anticipated in advance, the hypotheses will be rejected only for t values that are of
sufficient magnitude and in the direction specified by applying a one-tailed test. Output
from this program includes the correlation coefficients, the tests of significance, and the
number of cases, N, upon which the correlation coefficients were computed.

208
4.5 Data Analysis Techniques
In this study, the SPSS software is mainly used to process and statistically analyse the
data, since this is a versatile program with many applications, and several sub-programs
which are very useful for the analysis of the present survey data. The main impetus of
the statistical analyses was the testing of Hypothesis HI to Hypothesis H18 - a total of 18
hypotheses. Due to the theoretical and methodological rigour needed to imply causal
relations among phenomena of interest, both first and second order analyses are required
to test the hypotheses. The first order analysis involved the descriptive statistics and
correlations among the variables. The second order analysis involved a more
discriminating statistical method that seeks to evaluate the tenability of causal hypotheses
by finding the most parsimonious linkages between a theoretical model and empirical
data. A path analytic framework is an ideal way to assess the proposed recursive
relationships and the appropriate analytical method when both direct and indirect
influences are hypothesised or investigated (James, Muliak, & Brett, 1982). This
analytical method forms the main analytical tool for the hypotheses testing of the model
represented in Figure 3.1. Path analysis is a multivariate analysis used to estimate the
magnitude of linkages between variables. Although the path analysis represents an
extension of the regression model, it requires a relatively elaborate computational
technique and it is particularly sensitive to model specification. The technique discussed
highlights the computational procedures needed to achieve the maximum utility of this
method. Other procedures that involve direct application or minimal manipulations of
technique of the SPSS procedures will not be discussed here.
209
4.6 Path Analysis
The theoretical model depicted in Figure 1.1 was assessed through path analysis. Sewell
(1921, 1934 and 1960) developed path analysis as a method of analysing the direct and
indirect effects of variables hypothesised as causes of variables treated as effects. Path
analysis is actually an extension of the regression model. The regression weight is
calculated by the model and is compared by the observed correlation matrix. In order to
see the model fit, the goodness of fit statistic has to be calculated. It is important to
highlight that, being a method, as any other structural equation modelling (SEM) method,
the choice of path analysis is not to discover causes but to shed light on the tenability of
the causal model developed by a researcher based on his or her knowledge and theoretical
understandings. It is also due to the well known computational difficulties experienced
by researchers when applying software such as LISREL and AMOS on a large model that
the path analysis approach was chosen over SEM.
Additionally, it is documented that a more general SEM approach to analysis
yields a more flexible and realistic modelling process compared with path analysis using
ordinary least square (OLC) multiple regression. For example, a more general SEM
computer program allows for non-recursive paths, does not assume the variables are
measured without error, does not assume that the residuals between the variables or
between their indicators are zero and more importantly, SEM tests an entire system of
variables simultaneously (Pedhazur, 1997). The use of SEM computer program such as
LISREL and AMOS is, however, limited to a relatively simple model in which about five
to six latent variables are being investigated (Anderson & Gerbing, 1988;
Diamantopoulos 1994). Hulland, Chow, and Lam (1996) in their review of causal

210
modelling of 383 models from 1990-1994, reported that the average theoretical model
contained approximately seven constructs, suggesting moderate complexity. As the
model size and complexity increase there is no guarantee that the model is identified and
yields a meaningful result.
Due to these obvious limitations, path analysis using the ordinary least square
regression approach is used instead of LISREL or AMOS SEM software packages. This
is not expected to have a serious disadvantage as Kline and Klammer (2001) show that
the magnitude of the hypothesised path does not differ much between the two methods
and the same conclusion could be drawn regardless of whether the regression or LISREL
or AMOS approach was used. It is recognised though, that if the problem is manageable
by the software, LISREL or AMOS are superior in their assessment of the multitude of fit
indices that can provide more clues about the avenues for further research and modelling
that should be pursued.
Path modelling estimates the magnitude of linkages between variables and uses
these to supply information about the underlying causal process. As in most model
building efforts, path modelling begins with the identification of relevant variables,
which can be identified by the way they relate to other variables in the proposed general
model. Variables that have little or no relationship with the other variables can be
dropped from the model, as they will not add to its explanatory power. Initial recursive
multiple regression analysis revealed that structure, despite being the least correlated with
other variables, did play a role in the causal linkage of the model. In the current study the
variables finally included in the model were the following: leadership styles,
211
organisational contexts, downward influence tactics, subordinates‟ competence, role
ambiguity, satisfaction with supervision, and OCB.
The leadership styles constructs such as transformational leadership and
transactional leadership, together with organisational structure and span of control, are
termed exogenous because they are determined by influences which are outside the
specified model. In the path analysis, the correlations (r’s) between the exogenous
variables, represented by curved two-way arrows, will not be analysed except as checks
on the multicollinearity problem. On the other hand, the remaining variables constitute
the endogenous variables and will be explained by endogenous factors and in some cases
by each other. The influences of the explanatory variables are represented by the path
coefficients (p’s). A residual variable is introduced for each endogenous variable to
calibrate the variation not accounted for by the model (D’s). The magnitude of these
residuals is depicted by path coefficients (Pr’s). For clarity, the residuals and their path
coefficients will not be shown in the model but it is important to note their presence and
effect in every endogenous variable.
The model in Figure 3.1 specifies a set of linear, additive relationships with
(straight line) arrows going only in one direction. These indicate one-way effects and
suggest that the direction of causation runs from leadership styles to downward influence
tactics to outcomes. In this study, two-way feedback effects are not hypothesised.
Estimation of path coefficients can be accomplished through multiple regression analysis.
The path model can be written as a set of structural equations as follows:
X5 = P5,1 X1 + P5,2 X2 + P5,3 X3 + P5,4 X4 + Pr5 D5 (1)
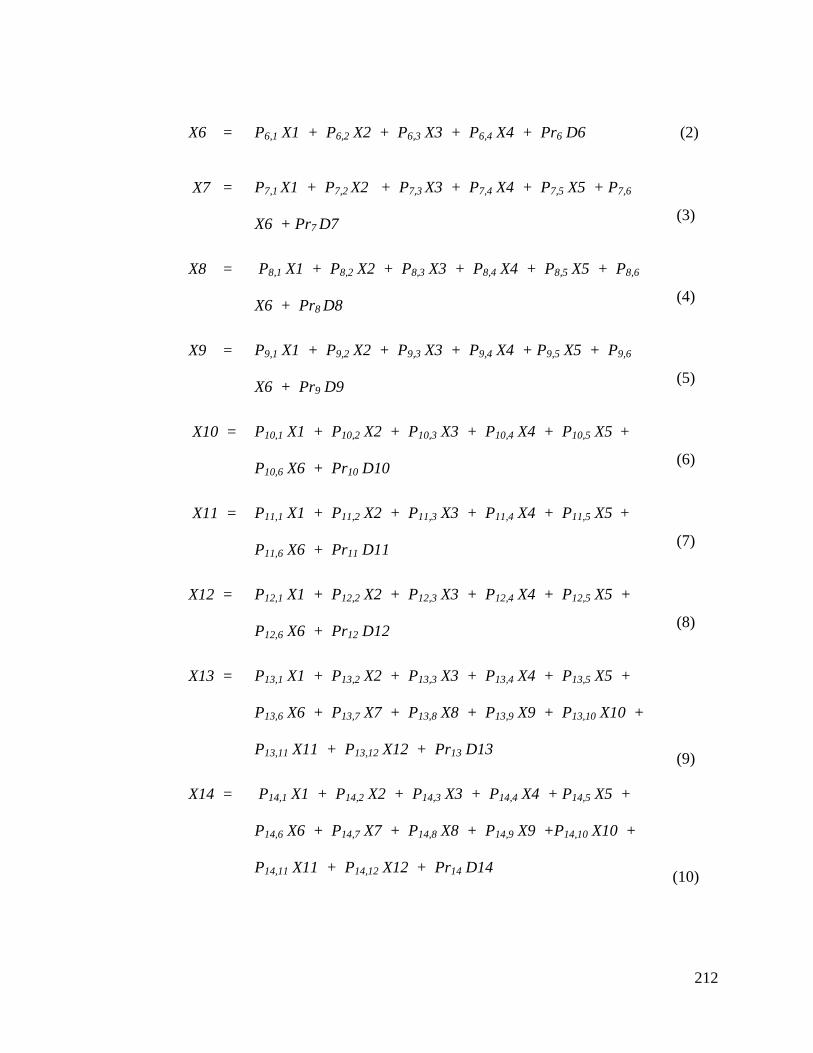
212
X6 = P6,1 X1 + P6,2 X2 + P6,3 X3 + P6,4 X4 + Pr6 D6 (2)
X7 = P7,1 X1 + P7,2 X2 + P7,3 X3 + P7,4 X4 + P7,5 X5 + P7,6
X6 + Pr7 D7
(3)
X8 = P8,1 X1 + P8,2 X2 + P8,3 X3 + P8,4 X4 + P8,5 X5 + P8,6
X6 + Pr8 D8
(4)
X9 = P9,1 X1 + P9,2 X2 + P9,3 X3 + P9,4 X4 + P9,5 X5 + P9,6
X6 + Pr9 D9
(5)
X10 = P10,1 X1 + P10,2 X2 + P10,3 X3 + P10,4 X4 + P10,5 X5 +
P10,6 X6 + Pr10 D10
(6)
X11 = P11,1 X1 + P11,2 X2 + P11,3 X3 + P11,4 X4 + P11,5 X5 +
P11,6 X6 + Pr11 D11
(7)
X12 = P12,1 X1 + P12,2 X2 + P12,3 X3 + P12,4 X4 + P12,5 X5 +
P12,6 X6 + Pr12 D12
(8)
X13 = P13,1 X1 + P13,2 X2 + P13,3 X3 + P13,4 X4 + P13,5 X5 +
P13,6 X6 + P13,7 X7 + P13,8 X8 + P13,9 X9 + P13,10 X10 +
P13,11 X11 + P13,12 X12 + Pr13 D13
(9)
X14 = P14,1 X1 + P14,2 X2 + P14,3 X3 + P14,4 X4 + P14,5 X5 +
P14,6 X6 + P14,7 X7 + P14,8 X8 + P14,9 X9 +P14,10 X10 +
P14,11 X11 + P14,12 X12 + Pr14 D14
(10)
213
These equations are subject to statistical constraints unique to this method as
described in Pedhazur (1997). It has been demonstrated that regression analysis is
generally robust in the face of departures from assumptions, except for measurement
errors and specification errors (Bohrnstedt & Carter, 1971; Hanushek & Jackson, 1977).
The implications of measurement error and specification error were discussed in
Pedhazur (1997, pp. 34-35). Hence, a path coefficient can take on the same interpretation
as a regression coefficient, and measures the proportion of dependent variable variance
accounted for by the explanatory variable when all other factors are held constant. To
weed out path coefficients with insignificant effects, the theory-trimming approach as
suggested by James et al. (1982) has to be performed in order to construct a more
parsimonious model. The residual path coefficients for a dependent variable Xi is also
obtainable from the model, that is
Pri = (1-Ri2)
where Ri2 = R
2 or the percentage of variance explained in dependent variable Xi.