chapter 4 final class - class.classmatandread.netclass.classmatandread.net/sampling.class.pdf*...
TRANSCRIPT

© 2010 Joel J. Davis All Rights Reserved All Forms of Duplication/Distribution Prohibited
4 Sampling
A sample is a group of items or individuals selected from a larger population. While all samples
are generally useful, not all samples allow a researcher to generalize findings and insights to the
broader population from which the sample was drawn. As a result, some types of samples are
more appropriate for satisfying certain informational needs than others. After reading this
chapter, you should have a better understanding of how to:
* make well-considered and appropriate sampling decisions.
* describe the role of sample definition and sample frames in the sampling process.
* explain the difference between probability and nonprobability sampling.
* identify the strengths and weaknesses of different forms of probability and nonprobability
sampling.
* determine sample size.
Primary research collects original, typically proprietary information to meet an advertiser’s or marketer’s
informational needs. Primary research is used when secondary research is either nonexistent, unreliable, or too
costly. In these circumstances, advertisers may select either qualitative or quantitative research to satisfy their
informational needs and they may use either observational, survey or physiological methods to collect the necessary
data. The remainder of this text discusses the range of primary research approaches, methods and applications.
All primary research entails some form of sampling where a researcher selects people or objects from a
population of interest for further study. The quality of research insights, and the confidence one has in generalizing
these insights to the larger population, are directly related to decisions made with regard to sampling. A superior
research design using a well constructed data collection instrument will nevertheless provide useless data if the
sample is poorly or inappropriately selected. Good research requires good sampling. As a result, this chapter
provides a detailed discussion of sampling and the sampling process.

© 2010 Joel J. Davis All Rights Reserved All Forms of Duplication/Distribution Prohibited
An Overview of Sampling
Sampling is a common process you engage in every day: when you listen to a few tracks from a new band in order
to decide if you want to learn and hear more or when you read several reviews of a movie (from among all the
movie review sites) in order to decide if you want to see it. When you sample, in these cases and in advertising
research, you select and examine members of a larger population in order to learn something new and, in most cases,
to draw conclusions about the larger population of which the sampled items are members. The things you sample
can be inanimate objects such as music, reviews, examples of competitive advertising, or more commonly, animate
objects such as people. Consider the following:
Every semester Dr. Newson teaches a class entitled “Trends in Social Media.” This semester there
are 30 students registered for her class. Both John and Mary are considering taking the class next
semester, but want to make an informed decision prior to enrolling. John shows up one day to Dr.
Newson’s class and talks with ten of the fourteen students attending that day. Only about half are
enthusiastic and John decides not to take the class next semester. Mary shows up to Dr. Newson’s
class on final exam day, the day all students in the class had to attend. Mary talks with every third
student on his or her way out (ten students in all out of the thirty registered). These students are
generally quite positive and Mary decides to take the class next semester. It turns out that the class
in the upcoming semester was a wonderful experience.
Although John and Mary interviewed equivalent numbers of students, they nevertheless obtained different
insights into Dr. Newson’s class. This was because they used different approaches to sample members of the current
class. John used a technique called convenience sampling, in which he interviewed the students who just happened
to be in class on a particular day. Mary used random sampling, on a day in which every student in the class had an
equal chance of being spoken to. John discovered that how you sample does make a difference; only random
sampling allows you to make valid generalizations about the population from which the sample was drawn.
The first part of this chapter focuses on sampling considerations and approaches for quantitative advertising
research, beginning with a discussion of random sampling. The latter portion of the chapter discusses special
considerations for sampling in qualitative research.
Random Sampling and Quantitative Research
Random sampling is most associated with quantitative research. This form of sampling (also known as probability
sampling) has a very basic definition: a random sample is one where the researcher ensures that each member of the
population of interest has an equal probability of being selected. The decisions related to random sample selection
are shown in Figure 4.1. The remainder of this section follows the flow of figure. First, we discuss how to determine

© 2010 Joel J. Davis All Rights Reserved All Forms of Duplication/Distribution Prohibited
the nature of the surveyed population, that is whether a sample or a census should be used. Next, we discuss target
population definition. This discussion is followed by an exploration of probability sampling, specifically the
selection of the sample frame, the different types of probability samples, and how to determine appropriate sample
size. The next section of the text discusses an alternative sampling method, nonprobability sampling.
Figure 4.1
© 2010 Joel J. Davis All Rights Reserved All Forms of Duplication/Distribution Prohibited
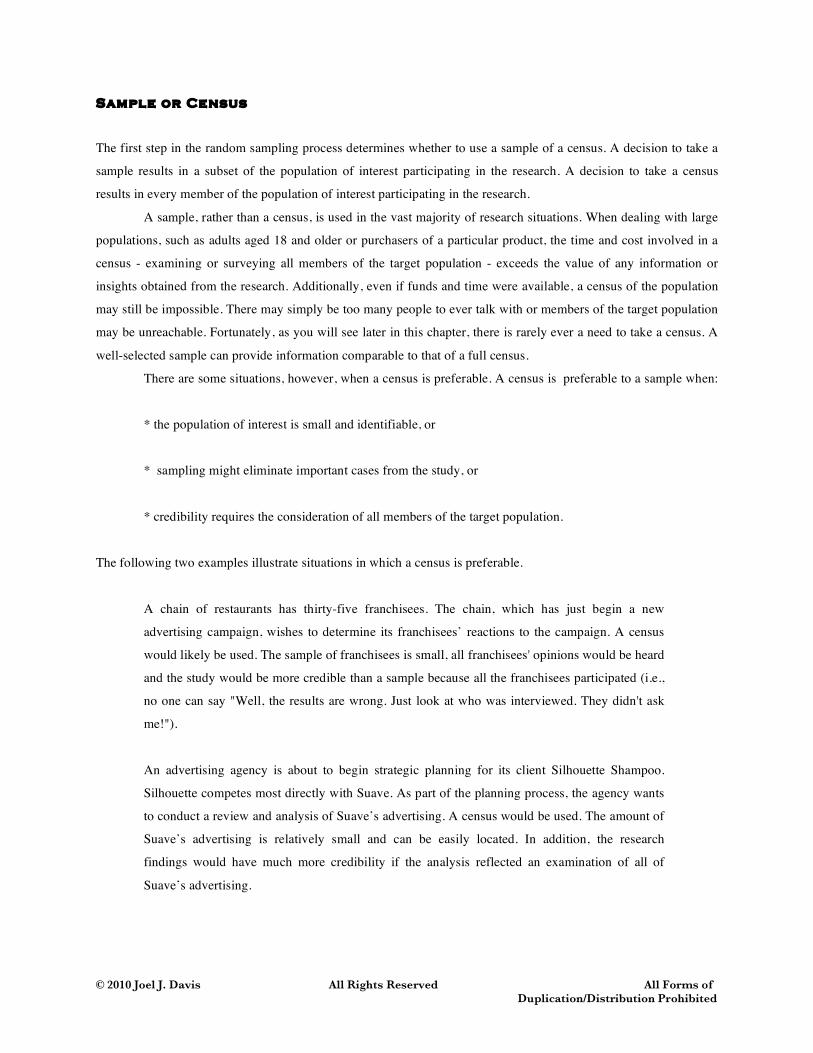
Sample or Census
The first step in the random sampling process determines whether to use a sample of a census. A decision to take a
sample results in a subset of the population of interest participating in the research. A decision to take a census
results in every member of the population of interest participating in the research.
A sample, rather than a census, is used in the vast majority of research situations. When dealing with large
populations, such as adults aged 18 and older or purchasers of a particular product, the time and cost involved in a
census - examining or surveying all members of the target population - exceeds the value of any information or
insights obtained from the research. Additionally, even if funds and time were available, a census of the population
may still be impossible. There may simply be too many people to ever talk with or members of the target population
may be unreachable. Fortunately, as you will see later in this chapter, there is rarely ever a need to take a census. A
well-selected sample can provide information comparable to that of a full census.
There are some situations, however, when a census is preferable. A census is preferable to a sample when:
* the population of interest is small and identifiable, or
* sampling might eliminate important cases from the study, or
* credibility requires the consideration of all members of the target population.
The following two examples illustrate situations in which a census is preferable.
A chain of restaurants has thirty-five franchisees. The chain, which has just begin a new
advertising campaign, wishes to determine its franchisees’ reactions to the campaign. A census
would likely be used. The sample of franchisees is small, all franchisees' opinions would be heard
and the study would be more credible than a sample because all the franchisees participated (i.e.,
no one can say "Well, the results are wrong. Just look at who was interviewed. They didn't ask
me!").
An advertising agency is about to begin strategic planning for its client Silhouette Shampoo.
Silhouette competes most directly with Suave. As part of the planning process, the agency wants
to conduct a review and analysis of Suave’s advertising. A census would be used. The amount of
Suave’s advertising is relatively small and can be easily located. In addition, the research
findings would have much more credibility if the analysis reflected an examination of all of
Suave’s advertising.

© 2010 Joel J. Davis All Rights Reserved All Forms of Duplication/Distribution Prohibited
Define Target Population
The next step in the sampling process (after it is determined whether a census or sample is most appropriate)
requires that you define the target population by explicitly specifying the characteristics of the group of individuals
or things in which you are interested. This is a critical step for all forms of advertising research and is therefore
required for all types of samples. The adequacy of a target population definition is evaluated in terms of how well
the definition (1) unambiguously describes the group of interest and (2) serves to differentiate those things or
individuals who are of interest from those who are not.
Target Definition And An Inanimate Population
Imagine a brainstorming session in which account executives and creatives are trying to identify new benefits and
competitive positionings for their client, a manufacturer of ibuprofen-based pain relievers. One of the creatives says:
"Low price is always an important benefit. Especially when we can relate it to value. So, can we make the claim that
our product is the lowest priced name brand pain reliever?" It is agreed that research will be conducted to determine
the viability of this claim. The agency researcher says that she will "obtain a random sample of the retail prices of
the leading brands of pain relievers in stores across the United States."
Ambiguity and incompleteness make this target population definition inadequate. Consider each of the key
components of the definition:
* Retail price - Does this refer to the regular selling price or a sale price? Is the retail price the
manufacturer's recommended price, perhaps as marked on the package, or the actual price at
which the outlet normally sells the product?
* Leading brands - On what basis will leading brands be identified and selected? Is "leading
brand" defined on the basis of sales, distribution, advertising expenditures, or consumer
awareness?
* Stores - What types of stores will be sampled? Any store that sells pain relievers? Drug stores
only? Drug stores and grocery stores only?
* Pain relievers - Any product designed to relieve any type of pain? Ibuprofen-based products
only? Any product containing aspirin, acetaminophen or ibuprofin? What about combination
products, for example, acetaminophen plus antihistamine?

© 2010 Joel J. Davis All Rights Reserved All Forms of Duplication/Distribution Prohibited
* Across the United States - Where across the United States? In every city? In major metropolitan
areas? In cities over or under a certain size?
Every combination of answers to the prior questions leads to a different definition of the target population.
The "right" target population definition is the one that all involved in the research agree unambiguously defines the
target population and best responds to the informational need motivating the research. In this example, the research
team might decide to refine the prior target population definition as follows:
The research will determine the average price of leading brands of pain relievers where:
* Price refers to the usual selling price as indicated on the item's shelf tag,
* Pain relievers refer to any aspirin, acetaminophen- or ibuprofen-based product specifically sold
to relieve headache or muscle pain and the product cannot contain any additional ingredients
beyond aspirin, acetaminophen or ibuprofen,
* Leading brands are defined as the five top selling brands of pain relievers (as defined
previously) based on 2010 unit sales.
* Grocery and drug stores will be the venue for research. Grocery store refers to any store whose
merchandise primarily consists of food items. This includes traditional grocery stores and includes
some warehouse stores. Drug store refers to any store not included in the prior definition that
dispenses prescription medicine.
* The research will take place in twelve cities. Twelve cities refer to four cities among the top ten
cities as measured in the 2010 population census, four cities among those ranked eleven to twenty,
and four cities among those ranked twenty-one to thirty.
Finally, prices of the following sized packages will be sampled: 100 and 250 regular tablet and
thirty tablet gelcap. These are the leading sizes based on unit sales.
As can be seen, this target population definition explicitly and unambiguously (with explanation and justification
from external sources) defines the target population.
© 2010 Joel J. Davis All Rights Reserved All Forms of Duplication/Distribution Prohibited
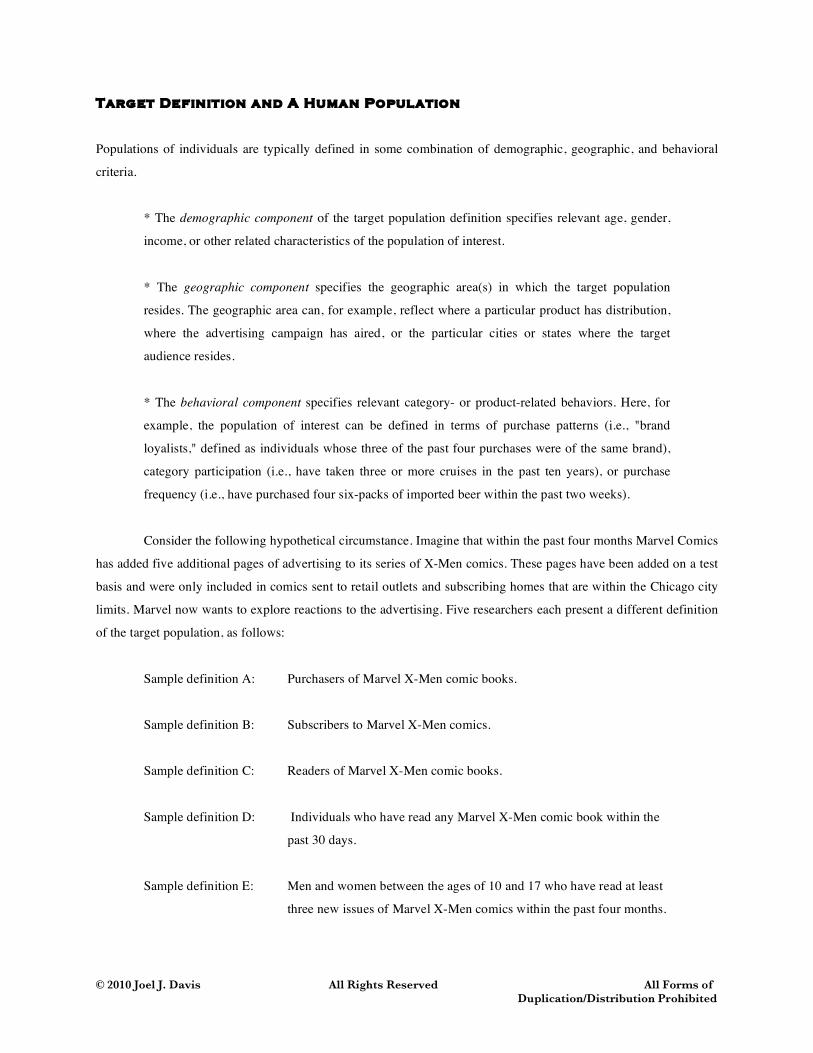
Target Definition and A Human Population
Populations of individuals are typically defined in some combination of demographic, geographic, and behavioral
criteria.
* The demographic component of the target population definition specifies relevant age, gender,
income, or other related characteristics of the population of interest.
* The geographic component specifies the geographic area(s) in which the target population
resides. The geographic area can, for example, reflect where a particular product has distribution,
where the advertising campaign has aired, or the particular cities or states where the target
audience resides.
* The behavioral component specifies relevant category- or product-related behaviors. Here, for
example, the population of interest can be defined in terms of purchase patterns (i.e., "brand
loyalists," defined as individuals whose three of the past four purchases were of the same brand),
category participation (i.e., have taken three or more cruises in the past ten years), or purchase
frequency (i.e., have purchased four six-packs of imported beer within the past two weeks).
Consider the following hypothetical circumstance. Imagine that within the past four months Marvel Comics
has added five additional pages of advertising to its series of X-Men comics. These pages have been added on a test
basis and were only included in comics sent to retail outlets and subscribing homes that are within the Chicago city
limits. Marvel now wants to explore reactions to the advertising. Five researchers each present a different definition
of the target population, as follows:
Sample definition A: Purchasers of Marvel X-Men comic books.
Sample definition B: Subscribers to Marvel X-Men comics.
Sample definition C: Readers of Marvel X-Men comic books.
Sample definition D: Individuals who have read any Marvel X-Men comic book within the
past 30 days.
Sample definition E: Men and women between the ages of 10 and 17 who have read at least
three new issues of Marvel X-Men comics within the past four months.
© 2010 Joel J. Davis All Rights Reserved All Forms of Duplication/Distribution Prohibited
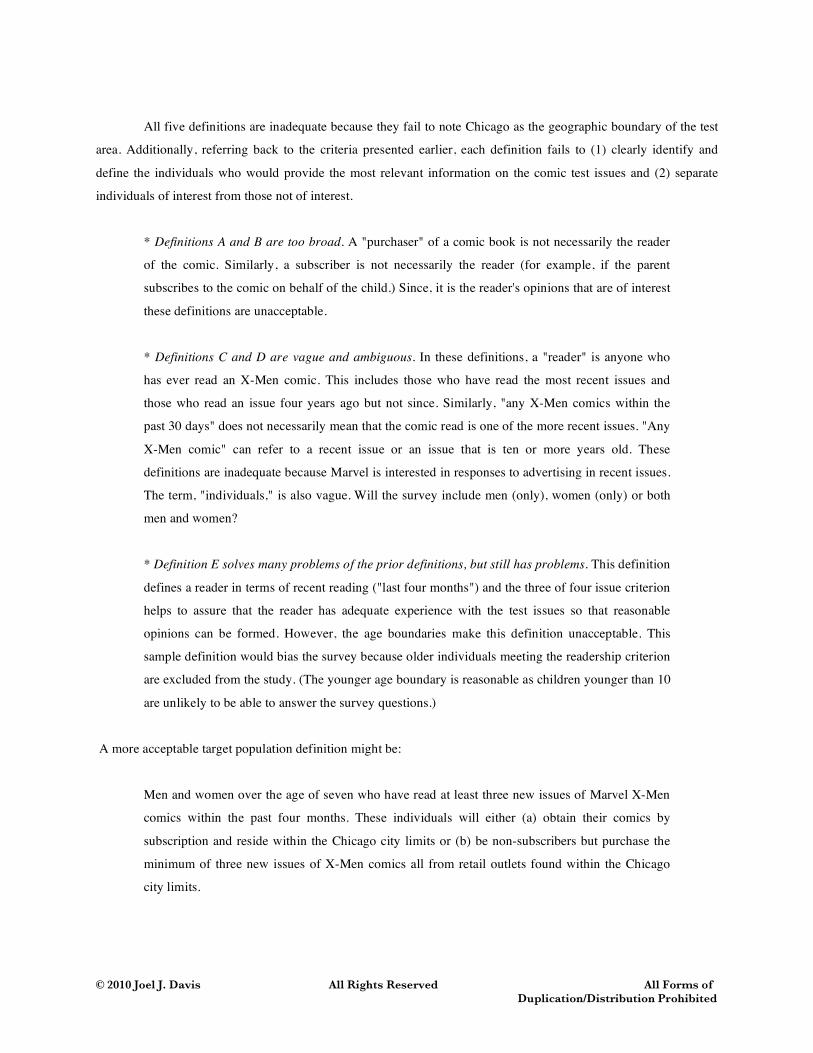
All five definitions are inadequate because they fail to note Chicago as the geographic boundary of the test
area. Additionally, referring back to the criteria presented earlier, each definition fails to (1) clearly identify and
define the individuals who would provide the most relevant information on the comic test issues and (2) separate
individuals of interest from those not of interest.
* Definitions A and B are too broad. A "purchaser" of a comic book is not necessarily the reader
of the comic. Similarly, a subscriber is not necessarily the reader (for example, if the parent
subscribes to the comic on behalf of the child.) Since, it is the reader's opinions that are of interest
these definitions are unacceptable.
* Definitions C and D are vague and ambiguous. In these definitions, a "reader" is anyone who
has ever read an X-Men comic. This includes those who have read the most recent issues and
those who read an issue four years ago but not since. Similarly, "any X-Men comics within the
past 30 days" does not necessarily mean that the comic read is one of the more recent issues. "Any
X-Men comic" can refer to a recent issue or an issue that is ten or more years old. These
definitions are inadequate because Marvel is interested in responses to advertising in recent issues.
The term, "individuals," is also vague. Will the survey include men (only), women (only) or both
men and women?
* Definition E solves many problems of the prior definitions, but still has problems. This definition
defines a reader in terms of recent reading ("last four months") and the three of four issue criterion
helps to assure that the reader has adequate experience with the test issues so that reasonable
opinions can be formed. However, the age boundaries make this definition unacceptable. This
sample definition would bias the survey because older individuals meeting the readership criterion
are excluded from the study. (The younger age boundary is reasonable as children younger than 10
are unlikely to be able to answer the survey questions.)
A more acceptable target population definition might be:
Men and women over the age of seven who have read at least three new issues of Marvel X-Men
comics within the past four months. These individuals will either (a) obtain their comics by
subscription and reside within the Chicago city limits or (b) be non-subscribers but purchase the
minimum of three new issues of X-Men comics all from retail outlets found within the Chicago
city limits.

© 2010 Joel J. Davis All Rights Reserved All Forms of Duplication/Distribution Prohibited
Target Definitions and Research Findings
The quality and validity of generalizations drawn from a research study are greatly influenced by its target
definition. After all, because different target definitions exclude and include different individuals, the data collected
from different groups of individuals is also likely to vary. Two studies designed to study the same thing, but with
different target definitions, are likely to have quite different results.
A recent study by the Pew Research Center1 provides a striking example of the relationship between target
definition and research findings. The Pew Center compared their own and Gallup’s target definitions of “Muslim”
and the resulting effect of these definitions on estimates of Muslim American demographics. The two target
definitions, which differed with respect to languages spoken and method of contact were:
Pew Research: Nationally representative probability sample; speaks English, Arabic,
Urdu, Farsi; reachable via landlines
Gallup: Nationally representative probability sample, speaks English, Spanish;
reachable by landlines and cell phones
The demographic characteristics estimated by each approach are shown in Figure 4.2. Note how variations in the
language-spoken component of the target definition result in significant differences in demographic estimates.
Select sampling method
Once the target population is defined, the next step determines which of two types of sampling methods will be used
to identify items or individuals for study inclusion. As discussed earlier, a probability sample is a sample in which
each individual, household, or item (generally called a sample element) comprising the universe from which the
sample is drawn has a known chance and equal probability of being selected for inclusion in the research. The
selection of sample elements is done purely by chance, for example, with a table of random numbers, coin flips or
through random digit dialing. When a probability sample is used, the selection of elements from the sample universe
continues until the required number of elements has been selected and observed or interviewed. A non-probability
sample is a sample of elements that is not selected strictly by chance from the universe of all individuals, but are
rather selected in some less random, more purposeful way. Here, the selection of elements for study inclusion may
be made on the basis of convenience or judgment.
1 Pew Research Center (2009). “Why Surveys of Muslim Americans Differ” at http://pewresearch.org/pubs/1144/muslim-americans-pew-research-survey-gallup.

© 2010 Joel J. Davis All Rights Reserved All Forms of Duplication/Distribution Prohibited
Demographic Characteristic Gallup (%) Pew Total (%) Pew: Interview Pew: Interview Language Language English (%) Farsi, Urdu, Arabic (%) Education HS or less 37 53 46 83 Some college 23 23 27 3 College grad 40 24 27 14 Employment Status Employed 70 57 64 25 Not employed 30 43 36 75 Race White 28 37 33 57 Black 35 24 27 8 Asian 18 20 20 19 Other 19 19 20 16 Age 18 - 29 36 30 31 20 30 - 44 37 37 37 36 45 - 64 23 28 28 34 65 and older 4 5 4 10
Figure 4.2
The choice of a sampling method is influenced by several factors: the type of generalization required, the
researcher's need to minimize sampling error, study timing, and cost. The relative advantages and disadvantages of
probability and nonprobability samples mirror each other in these areas.
* Probability samples (discussed in the remainder of this section) let a researcher estimate
sampling error, calculate reliability, statistically determine the sample size required for a specified
degree of confidence, and most importantly, confidently generalize the findings to the sample
universe. In a probability sample, each individual in the target population has an equal chance of
participating in the research.
* Nonprobability samples (discussed beginning on page xxx) are quick and inexpensive to obtain.
Research conducted among nonprobability samples is easy to design and carry out. However. a
researcher using a nonprobabilty sample cannot calculate sampling error or reliability and has very
limited confidence in generalizing the findings the sample universe.
Sample Frame
The sample frame provides the detail on where members of the target population will come from by
specifying the method you will use to identify the households, individuals, or other elements specified in the target

© 2010 Joel J. Davis All Rights Reserved All Forms of Duplication/Distribution Prohibited
population definition. You can take one of two approaches to specifying the sample frame. You can either construct
or obtain a list to represent the target population or, when lists are incomplete or unavailable, you can specify a
procedure such as random digit dialing for identifying and contacting target individuals.
The adequacy of a sample frame is evaluated in terms of how well the frame represents the target
population.
A perfect sampling frame is identical to the target population, that is, the sample frame contains every
population element once and only once and only population elements are contained in the sampling frame. As might
be expected, perfect sample frames are quite rare in actual practice. Typically, sample frames will either over-
register or under-register the target population. A sample frame that consists of all the elements in the target
population plus additional elements suffers from over-registration. An over-registered sample frame is too broad. A
sample frame that contains fewer elements than the target population suffers from under-registration. An under-
registered sample frame is too narrow and excludes elements from the target population. Examples of sample frames
having under- and over-registration as well as perfect registration are provided in Figure 4.3.
Perfect Registration A manufacturer of paper goods wishes to conduct a survey of attitudes and purchasing behaviors among his current clients. The target population is defined as companies that have purchased at least $100 worth of goods within the past three months. The names of all clients meeting these criteria are selected from the manufacturer's data base and are placed on a separate list (the sample frame) from which study participants will be selected. Over-registration: Sample Frame Larger Than Target Population You have just completed a six-month advertising test in metropolitan Atlanta and wish to determine levels of advertising and product awareness as well as brand perceptions. You decide to use random digit dialing among prefixes that are identified as "Atlanta." There are two over-registration problems. First, because of the way telephone companies assign telephone prefixes, not all telephones with an Atlanta prefix actually are in metropolitan Atlanta. Second, the research should be conducted among individuals who have lived in metropolitan Atlanta for at least six months, the time of the advertising test. Random digit dialing will not discriminate between those who have and have not resided for the required amount of time in Atlanta. A screener can be used to adjust the sample frame to better correspond with the target population. Under-registration: Sample Frame Smaller Than Target Population You want to assess teachers' reactions to corporate-sponsored educational materials. You select a list of members of the American Federation of Teachers as the sample frame. This frame suffers from under-registration because not all teachers are members of the Federation. You want to conduct a telephone survey of individuals residing in New York. One potential sample frame might be the telephone book. However, this sample frame is incomplete and suffers from under-registration because a telephone book does not contain individuals with unlisted telephone numbers.
Figure 4.3

© 2010 Joel J. Davis All Rights Reserved All Forms of Duplication/Distribution Prohibited
Neither over- nor under-registration is necessarily fatal to the integrity of an advertising research study, but if left
unaccounted for, can cause significant bias. As a result, if over-registration is believed to be the case, and the
elements that fall outside the target population can be identified, then it might be possible to eliminate the effects of
over-registration by modifying your sampling plan or by using a supplemental questionnaire (called a screener) to
eliminate individuals not in the target population. If under-registration is believed to be the case, then it might be
possible to modify the sample frame by updating or some other procedure that adds omitted units.
Types of Probability Sampling
Once you know the characteristics of the population of interest (the target population) and how the population will
be identified (the sample frame), you next need to determine the specific probability sampling procedure by which
individuals are selected for study inclusion (see Figure 4.1). The three most common forms of probability sampling
used in advertising research are: simple random, systematic random, and stratified random samples.2
Simple Random Samples
Simple random samples are frequently used in advertising research. Here, each member of the population (as
represented in the sample frame) has a known and equal chance of being selected for inclusion in the research. You
can think of random sampling as a drawing where the name of each member of the population is placed on a ticket
and then placed into a drum. Individual names are selected from the drum. Every name in the drum has an equal
chance of being selected. In practice, random number tables or random digit dialing are often used to select a
random sample. A visual representation of random sampling is shown in Figure 4.4.
2 A fourth sampling method is cluster sampling, which is primarily used for research with data collection needs that require personal, at-home interviews. Cluster sampling is appropriate to this form of data collection because it shifts data collection to groups of sampling units rather than individual sampling units. Cluster sampling works as follows: First, the universe described in the sample universe definition is divided into groups, or clusters where every element of the universe is contained in one and only one cluster. Second, clusters are examined for internal representativness. Each cluster should be a "miniuniverse," that is, the characteristics of the cluster should mirror the characteristics of the total universe. Third, clusters are examined for external comparability. Clusters should be equivalent to each other with regard to important characteristics. Fourth, one or more of the clusters is selected to represent the total universe. Fifth, simple, systematic, or stratified sampling is used to select elements within the cluster. For further discussion of cluster sampling see Stat Trek, “Statistics Tutorial: Cluster Sampling” at http://stattrek.com/Lesson6/CLS.aspx?Tutorial=Stat.

© 2010 Joel J. Davis All Rights Reserved All Forms of Duplication/Distribution Prohibited
Figure 4.4
In practice, simple random sampling works as follows: Imagine that the you are interested in estimating how much
time individuals aged 18 to 24 spend on social networking sites in a typical day, where “typical day” is defined as
“the previous 24 hours.” Assume that the entire universe of 18 to 24 year olds is shown in Figure 4.5.

© 2010 Joel J. Davis All Rights Reserved All Forms of Duplication/Distribution Prohibited
Individual Number Gender Education Average Number of Hours on Social Media 1 Male High School 3.7 2 Male High School 3.4 3 Male High School 6.0 4 Male High School 1.1 5 Male College 3.7 6 Male College 4.1 7 Male College 2.5 8 Female High School 2.5 9 Female High School 4.5 10 Female High School 1.6 11 Female High School 4.9 12 Female College 7.3 13 Female College 1.8 14 Female College 4.8 15 Female College 1.1 16 Female College 1.6 17 Female College 2.1 18 Female College 1.6 19 Female College 3.7 20 Female College 6.2
Figure 4.5
© 2010 Joel J. Davis All Rights Reserved All Forms of Duplication/Distribution Prohibited
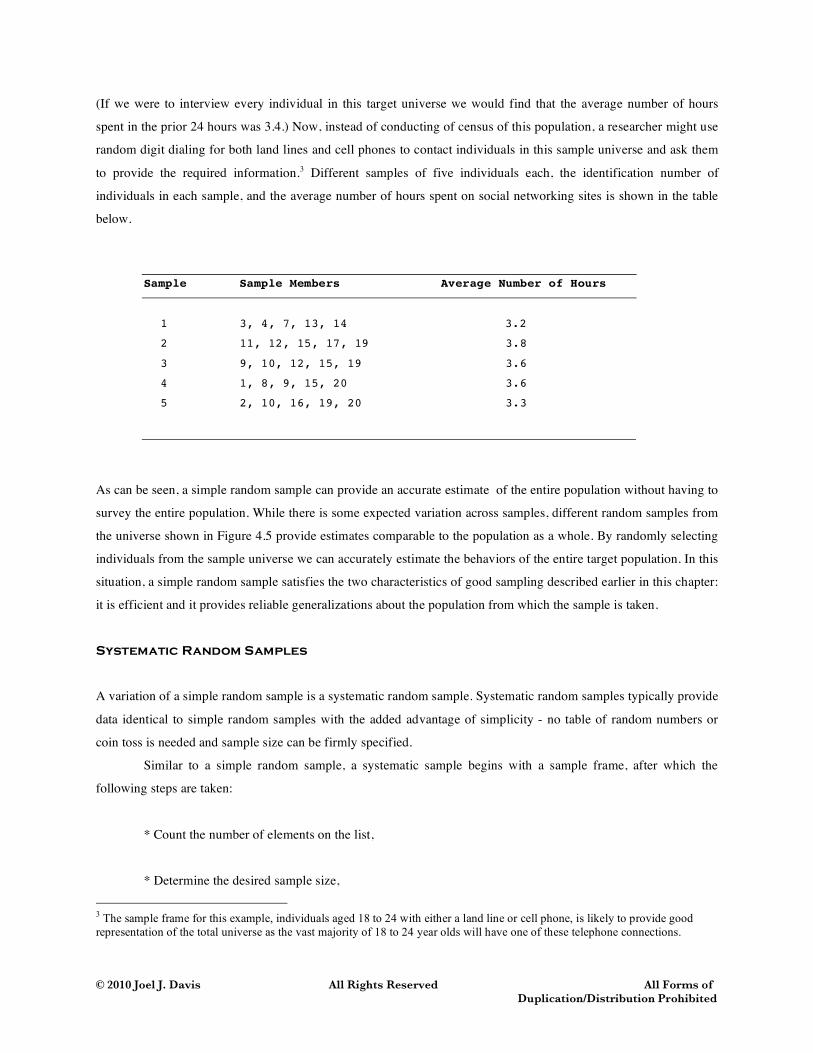
(If we were to interview every individual in this target universe we would find that the average number of hours
spent in the prior 24 hours was 3.4.) Now, instead of conducting of census of this population, a researcher might use
random digit dialing for both land lines and cell phones to contact individuals in this sample universe and ask them
to provide the required information.3 Different samples of five individuals each, the identification number of
individuals in each sample, and the average number of hours spent on social networking sites is shown in the table
below.
Sample Sample Members Average Number of Hours
1 3, 4, 7, 13, 14 3.2
2 11, 12, 15, 17, 19 3.8
3 9, 10, 12, 15, 19 3.6
4 1, 8, 9, 15, 20 3.6
5 2, 10, 16, 19, 20 3.3
As can be seen, a simple random sample can provide an accurate estimate of the entire population without having to
survey the entire population. While there is some expected variation across samples, different random samples from
the universe shown in Figure 4.5 provide estimates comparable to the population as a whole. By randomly selecting
individuals from the sample universe we can accurately estimate the behaviors of the entire target population. In this
situation, a simple random sample satisfies the two characteristics of good sampling described earlier in this chapter:
it is efficient and it provides reliable generalizations about the population from which the sample is taken.
Systematic Random Samples
A variation of a simple random sample is a systematic random sample. Systematic random samples typically provide
data identical to simple random samples with the added advantage of simplicity - no table of random numbers or
coin toss is needed and sample size can be firmly specified.
Similar to a simple random sample, a systematic sample begins with a sample frame, after which the
following steps are taken:
* Count the number of elements on the list,
* Determine the desired sample size,
3 The sample frame for this example, individuals aged 18 to 24 with either a land line or cell phone, is likely to provide good representation of the total universe as the vast majority of 18 to 24 year olds will have one of these telephone connections.

© 2010 Joel J. Davis All Rights Reserved All Forms of Duplication/Distribution Prohibited
* Compute a skip interval, * Select a random place on the list to start, * Select each element at the appropriate skip interval.
This process is illustrated in Figure 4.6.
Figure 4.6
© 2010 Joel J. Davis All Rights Reserved All Forms of Duplication/Distribution Prohibited
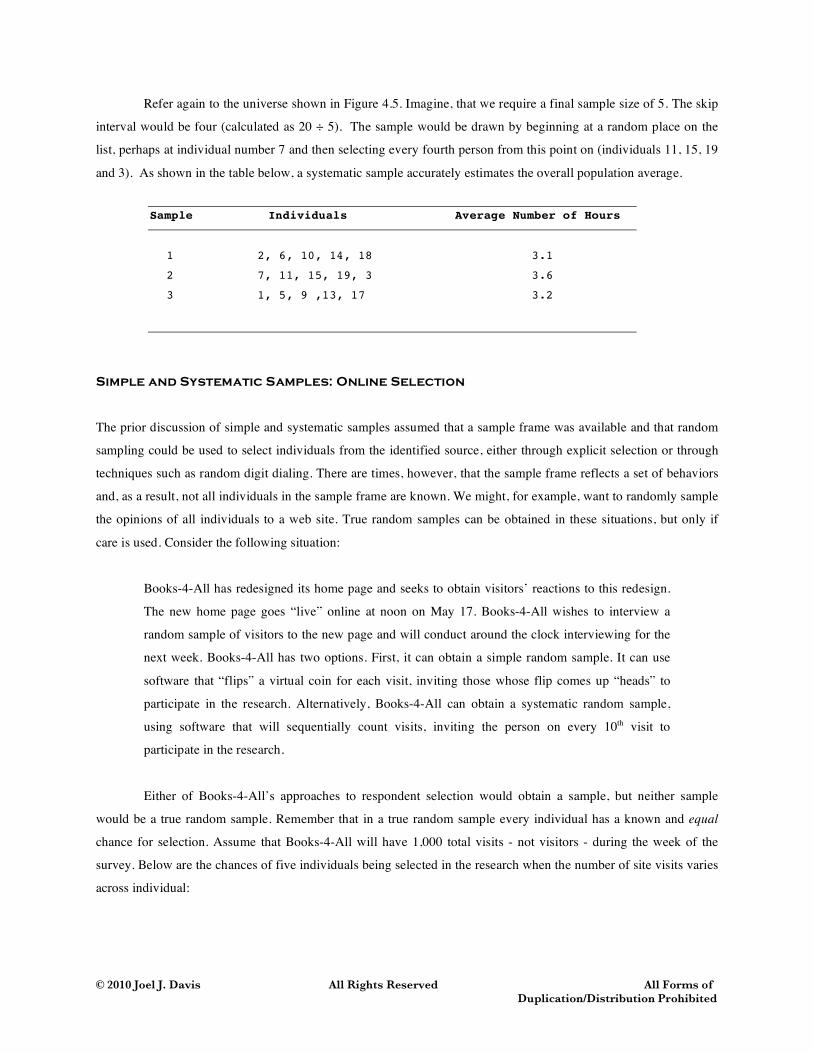
Refer again to the universe shown in Figure 4.5. Imagine, that we require a final sample size of 5. The skip
interval would be four (calculated as 20 ÷ 5). The sample would be drawn by beginning at a random place on the
list, perhaps at individual number 7 and then selecting every fourth person from this point on (individuals 11, 15, 19
and 3). As shown in the table below, a systematic sample accurately estimates the overall population average.
Sample Individuals Average Number of Hours
1 2, 6, 10, 14, 18 3.1
2 7, 11, 15, 19, 3 3.6
3 1, 5, 9 ,13, 17 3.2
Simple and Systematic Samples: Online Selection
The prior discussion of simple and systematic samples assumed that a sample frame was available and that random
sampling could be used to select individuals from the identified source, either through explicit selection or through
techniques such as random digit dialing. There are times, however, that the sample frame reflects a set of behaviors
and, as a result, not all individuals in the sample frame are known. We might, for example, want to randomly sample
the opinions of all individuals to a web site. True random samples can be obtained in these situations, but only if
care is used. Consider the following situation:
Books-4-All has redesigned its home page and seeks to obtain visitors’ reactions to this redesign.
The new home page goes “live” online at noon on May 17. Books-4-All wishes to interview a
random sample of visitors to the new page and will conduct around the clock interviewing for the
next week. Books-4-All has two options. First, it can obtain a simple random sample. It can use
software that “flips” a virtual coin for each visit, inviting those whose flip comes up “heads” to
participate in the research. Alternatively, Books-4-All can obtain a systematic random sample,
using software that will sequentially count visits, inviting the person on every 10th visit to
participate in the research.
Either of Books-4-All’s approaches to respondent selection would obtain a sample, but neither sample
would be a true random sample. Remember that in a true random sample every individual has a known and equal
chance for selection. Assume that Books-4-All will have 1,000 total visits - not visitors - during the week of the
survey. Below are the chances of five individuals being selected in the research when the number of site visits varies
across individual:

© 2010 Joel J. Davis All Rights Reserved All Forms of Duplication/Distribution Prohibited
Joan visits the site 1 time. Joan’s chance for selection is 1 ÷ 1000 or .1%.
Jeff visits the site 10 times. Jeff’s chance for selection is 10 ÷ 1000 or 1%.
Dean visits the site 50 times. Dean’s chance for selection is 50 ÷ 1000 or 5%.
The most essential component of random sampling will be violated unless something is done. Books-4-All must
devise a scheme in which the basic characteristics of random selection are not violated. The problem can be solved
by ensuring that each individual has only one chance to be selected regardless of the number of visits. Books-4-All
could, for example, place a cookie on each visitor’s computer during their first visit. The cookie would eliminate the
respondent from consideration in the study should there be subsequent visits.
In sum, sample frames based on behaviors can provide a rich and appropriate source of data. A researcher
using this approach, however, must make certain that the sampling method used to sample from this frame does not
violate the basic tenets of random sampling.
Stratified Random Samples
In the prior examples, simple and systematic random sampling techniques worked well. They were efficient and
provided reliable generalizations about the total population. However, these forms of sampling worked well only
because the universe was relatively homogeneous with respect to what was being measured. There was little
variation among subpopulations which comprised the total sample. The overall average of 3.4 hours did not
significantly vary in response to the two subgroup characteristics (gender and education) as shown in the following
table:
Sample Group Average Number of Hours
Male 3.5
Female 3.4
High School Education 3.5
College Education 3.4
Simple and systematic random samples provide fewer reliable generalizations about the total population
when significant differences among population subgroups are suspected. The data shown in Figure 4.7 shows the
amount of time spent on social networking sites for a new target universe, this time with respondents’ age noted.
(Again, assume these twenty individuals comprise the entire universe. The distribution of ages in this universe
reflects that of the overall U.S. population.) The table below shows the average time estimates for random samples

© 2010 Joel J. Davis All Rights Reserved All Forms of Duplication/Distribution Prohibited
of five drawn from this universe. As can be seen, there is now wide variation in the estimates provided, and a
researcher has little direction for deciding which one is “right.”
Sample Average Number of Hours
1 3.0
2 1.0
3 2.3
4 .7
5 2.5
Whenever you have a situation where you think there is large variation in what you are studying due to specific
respondent characteristics, stratified random sampling is a better choice versus simple and systematic random
sampling. In this example, given that you might suspect that age is related to time spent on social networking sites,
you might decide to stratify the sample, that is, divide individuals in the target universe into classes (or strata) and
then randomly sample from each strata individually. Each stratum is treated and sampled as if it were an
independent universe.

© 2010 Joel J. Davis All Rights Reserved All Forms of Duplication/Distribution Prohibited
Individual Number Age Average Number of Hours on Social Media 1 18 2.2 2 22 4.6 3 25 2.1 4 27 3.1 5 32 2.8 6 33 1.5 7 37 1.5 8 38 1.1 9 40 2.2 10 42 .8 11 43 1.0 12 47 .5 13 50 .5 14 55 2.0 15 57 1.0 16 61 .2 17 64 .0 18 73 .0 19 77 .1 20 81 .0
Figure 4.7
© 2010 Joel J. Davis All Rights Reserved All Forms of Duplication/Distribution Prohibited
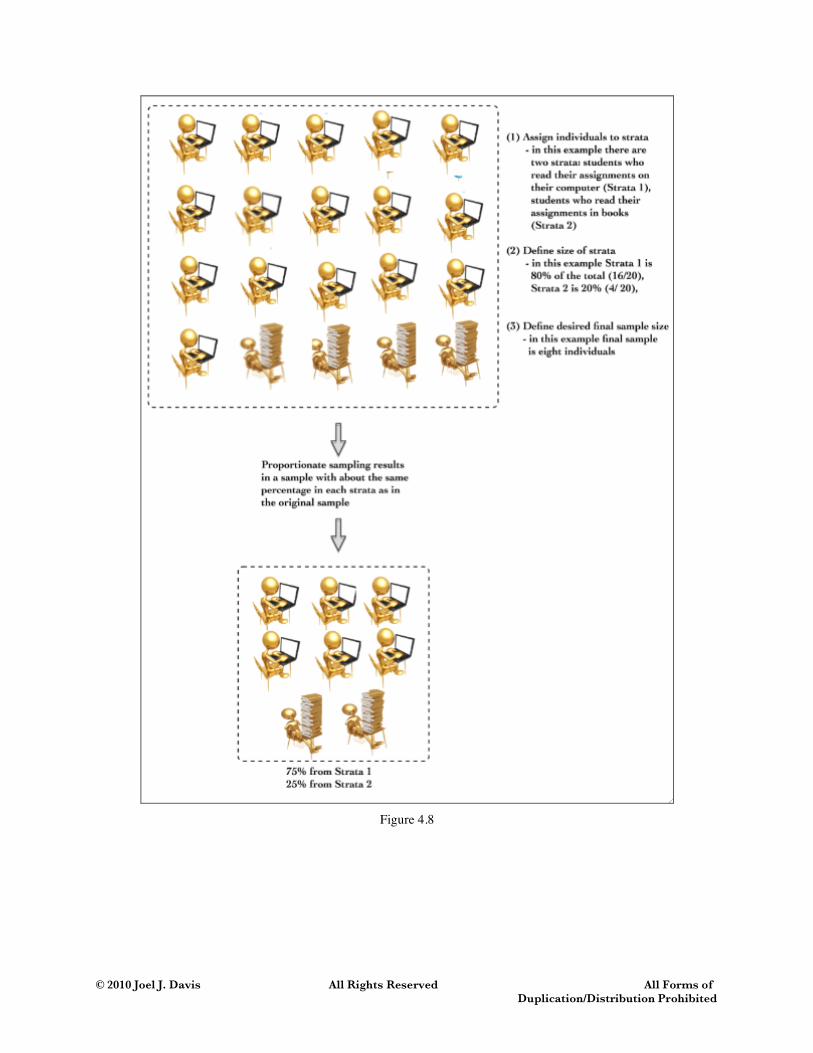
Figure 4.8

© 2010 Joel J. Davis All Rights Reserved All Forms of Duplication/Distribution Prohibited
Stratified sampling is accomplished a four-step process, as illustrated in Figure 4.8 and described below:
* First, one or more classification criteria that define the strata are identified. These classification
criteria should define independent strata that do not overlap. The classification criterion for the age
groups might be:
Strata 1 Individuals aged 18 to 24
Strata 2 Individuals aged 25 to 34
Strata 3 Individuals aged 35 to 49
Strata 4 Individuals aged 50 and older
* Second, each element in the sample frame is assigned to one and only one stratum. For example,
individuals aged 38 would be assigned to Strata 3.
* Third, the total sample size is determined. Assume for this example we want a final sample size
of 1,000.
* Fourth, independent random samples (using either simple or systematic sampling methods) are
selected from each stratum in a way that results in the total sample size being achieved.
The fourth step, sampling from each stratum in order to achieve the desired final sample size, presents two
options regarding the number of elements selected from each stratum. Either proportionate or disproportionate
sampling may be used.
Proportionate stratified sampling selects individuals in proportion to their stratum's size within the total
target population. The U.S. census provides that percentage of the adult population falling into each of the four
identified strata, as shown below:
Strata 1 Individuals aged 18 to 24 11%
Strata 2 Individuals aged 25 to 34 17%
Strata 3 Individuals aged 35 to 49 29%
Strata 4 Individuals aged 50 and older 43%
Once the proportionate size of each strata is determined, this percentage is multiplied by the desired final sample
size for the research, in this case 1,000. The result of this computation represents the number of people to sample
from each strata (now using either random or systematic random sampling). Thus, in this example, sample sizes for
each strata would be:

© 2010 Joel J. Davis All Rights Reserved All Forms of Duplication/Distribution Prohibited
Strata 1 Individuals aged 18 to 24 11% Sample size = 110 (.11 * 1,000)
Strata 2 Individuals aged 25 to 34 17% Sample size = 170 (.17 * 1,000)
Strata 3 Individuals aged 35 to 49 29% Sample size = 290 (.29 * 1,000)
Strata 4 Individuals aged 50 and older 43% Sample size = 430 (.43 * 1,000)
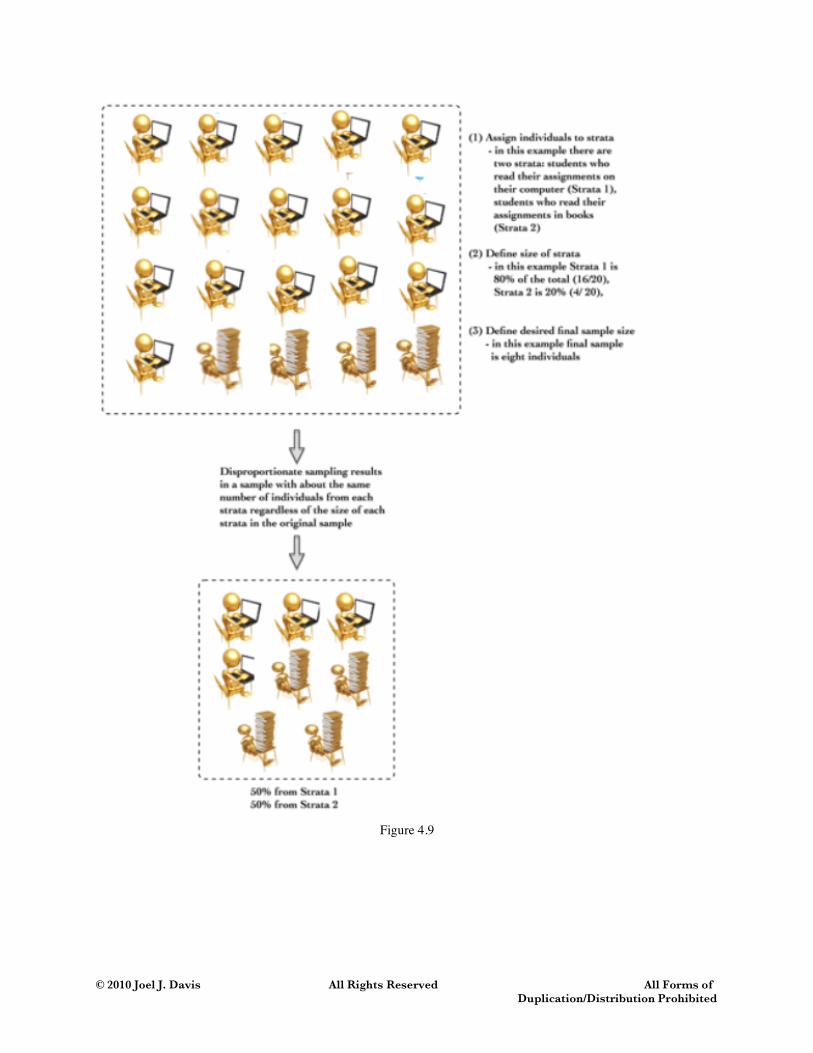
Problems arise with proportionate stratified sampling when some strata are small, and as a result, there may
not be sufficient numbers of observations or interviews in these smaller strata to permit reliable data analysis. In
these cases, disproportionate stratified sampling is used.
Disproportionate stratified sampling selects a predetermined number of elements from each stratum despite
the relative size of those strata. Selection is based on analytical considerations, that is, the sample size required for
reliable data analysis, as opposed to population considerations, that is, the size of the stratum within the total
universe. When disproportionate stratified sampling is used, the data obtained from an individual stratum must be
weighted to compensate for stratum size differentials in the actual sample universe before total sample findings are
reported. An example of disproportionate stratified sampling and the weighting of strata data to determine overall
population characteristics is shown in Figure 4.9.
Sample Size in Random Samples
Confidence in the generalizations drawn from a random sample is directly affected by sample size. Generally, larger
samples permit greater confidence in population estimates and generalizations.
The concept of confidence in sample estimates and generalizations is expressed in terms of the confidence
interval and the confidence level. A confidence interval is an estimate, plus or minus, of the value of the population
estimate; it states the range in which we believe the true population estimate lies. For example, it is common to read
that: "80% of all adults surveyed agree that there need to be major changes to the income tax code. The confidence
interval is ± 2%." This means that the true percentage of adults agreeing with the statement probably lies between
78% and 82%. The confidence level is the mathematical expression of our confidence that the population estimate
lies within the confidence interval. For example, a confidence level of 95% means that there is a 95% probability
that the population estimate from the research lies within the identified confidence interval.
Sample size is determined in light of confidence intervals and confidence levels. Greater precision in either
or both levels requires larger sample sizes. Thus, the most important step in sample size determination occurs when
you explicitly state during the planning stages of the research your desired confidence interval and confidence level.
© 2010 Joel J. Davis All Rights Reserved All Forms of Duplication/Distribution Prohibited
Figure 4.9

© 2010 Joel J. Davis All Rights Reserved All Forms of Duplication/Distribution Prohibited
The relationship between required sample size, confidence interval and confidence level is shown in Figure 4.10.
Note how sample size requirements vary when one criteria changes while the other is held constant. As can be seen,
increases in confidence do not increase in a linear, one-to-one relationship with increases in sample size. There are
diminishing returns; very large increases in sample size result in only small increases in confidence level and
decreases in the confidence interval. Notice, for example, the very large increase in sample size required to move
from a confidence interval of ± 2 to an interval of ± 1. The goal in determining sample size, therefore, is to estimate
the minimal sample size that will provide the desired degree of confidence.
Confidence Level (+ / -) Confidence Interval Sample Size 99 8 256 99 5 643 99 2 3,435 99 1 9,068 95 8 149 95 5 377 95 2 2,144 95 1 6,849 90 8 106 90 5 267 90 2 1,560 90 1 5,055
Figure 4.10
There are two approaches to using confidence interval and confidence level to determine required sample size. The
first approach is a manual calculation which uses formulae grounded in statistical theory. These formulae as well as
the underlying statistical theory are described in the addendum to this chapter. The second approach uses one of the
numerous sample size calculators available online. While all perform the similar functions, we recommend the
calculator provided by Raosoft due to its ease of use and range of information automatically provided.4
Estimate Number of Contacts
Sample size requirements identified in the prior step reflect the number of completed interviews required for a
desired confidence interval and confidence level. A research fact of life, however, is that not all individuals
contacted will agree to participate in the research and not all who agree will actually complete the survey or other
data gathering instrument. As a result, the number of people contacted is always greater than the final desired
sample size and is determined by the following formula where: where DSS is the desired final sample size, ATP
4 The Raosoft sample size calculator is located at http://www.raosoft.com/samplesize.html. Other calculators can be found typing “sample size calculator” in any search engine.

© 2010 Joel J. Davis All Rights Reserved All Forms of Duplication/Distribution Prohibited
represents an estimate of the percentage of the target population who will agree to participate, and CS represents the
percentage of those agreeing who will provide complete survey responses:
Required number of contacts = DSS ÷ (ATP * CS)
For example, if the desired final sample size is 500, the percentage agreeing to participate is estimated to be 70%
and the expected completion rate is 90%, then the total number of contacts would need to be 893 individuals,
calculated as:
Required number of contacts = 500 ÷ (.7 * .9)
= 500 ÷ (.56)
= 892.9
= 893
Sample Selection Bias in Probability Samples
The goal of probability sampling is the selection of a group of individuals or objects that represent the population
from which they were selected. Researchers need to be careful, however, that individuals or objects identified for
participation in the research are selected in a way that does not introduce bias. The elimination of bias is important,
because only without bias can a researcher confidently generalize the research results to the sampled population.
Sample bias occurs when members of the population of interest are selected in violation of the basic
principle of random sampling, that is, where each observation has a known and equal chance of being selected for
inclusion in the sample. The use of telephone books as the source of numbers for a telephone survey is, for example,
likely to lead to sample bias. Even if random sampling is used to select the names and numbers from the telephone
book, the sample is still biased because those who do not have listed numbers are systematically excluded from the
research. These individuals can never be selected. (This is the reason for random digit dialing.) Additional examples
of sample selection bias are represented in the following scenarios.
Imagine that you wish to select a random sample of students from your university. You make a
conscientious effort to interview every tenth student who enters the cafeteria. You chose the
cafeteria because most students go there at least once during the day. However, because different
types of students visit the cafeteria with different frequencies, and not all visit at least once, the
sample would be biased. It would over represent the type of student who uses the cafeteria.
Now imagine that the entire student body is gathered in the stadium to watch the championship
football game. You decide to interview a random sample of the students. However, you avoid

© 2010 Joel J. Davis All Rights Reserved All Forms of Duplication/Distribution Prohibited
interviewing those dressed in "hippie clothes" because you feel they might not take the research
seriously and you avoid interviewing those in the fraternity and sorority seats because you feel
their opinions are not indicative of the "average" student. The systematic exclusion of these
individuals violates the principle of random selection and introduces a great deal of bias into the
research.5
In sum, sample selection bias prevents the conduct of sound research and can lead to inappropriate conclusions
about a sampled population. The sampling planning process should therefore include an explicit discussion of how
sample bias might be introduced into the study and how the sampling techniques used in the research served to
eliminate identified potential sources of bias.
Bias and Telephone Sampling
Amercians, especially younger individuals, are increasingly adapting cell phones as their only form of telephone
communication. It is now estimated that about 15% of the population is now a cell phone only household with this
number even higher among certain segments: about 31% of those aged 18-24 and 20% of Hispanics are now cell
only.
Recent research demonstrates that the implications of this situation for population sampling differs across
survey topics. The Pew Center for the People & the Press notes that:
“Surveys that rely only on landline interviews are more likely to produce biased estimates if the
segment of the public unreachable on a landline differs substantially from the landline public. If
the cell-only respondents are not very different from the landline respondents, the survey estimates
will not be biased by the absence of the cell-only group. For example, the landline survey finds
that 54% of Americans favor bringing troops home from Iraq; among the cell-only respondents,
55% favor a U.S. troop withdrawal. Thus the overall survey estimate is unaffected when the cell-
only respondents are blended in. One way to consider the impact of adding cell-only interviews to
a survey is to ask the question: How different would the cell-only have to be for the total survey
estimates to be affected by their inclusion?”6
Thus, when cell phone users are believed to be similar to landline samples, adding a separate cell phone sample may
not be necessary. Pew has found, for example, that “on key political measures such as presidential approval, Iraq
5 These examples are adapted from Earl Babbie (1986). The Practice of Social Research (4th Edition) (Belmont, CA: Wadsworth Publishing Company). 6 Pew Center for the People & the Press (2008). “The Impact Of "Cell-Onlys" On Public Opinion Polling” at http://people-press.org/report/391/.
© 2010 Joel J. Davis All Rights Reserved All Forms of Duplication/Distribution Prohibited
policy, presidential primary voter preference, and party affiliation, respondents reached on cell phones hold attitudes
that are very similar to those reached on landline telephones. Analysis of two separate nationwide studies shows that
including interviews conducted by cell phone does not substantially change any key survey findings.”7
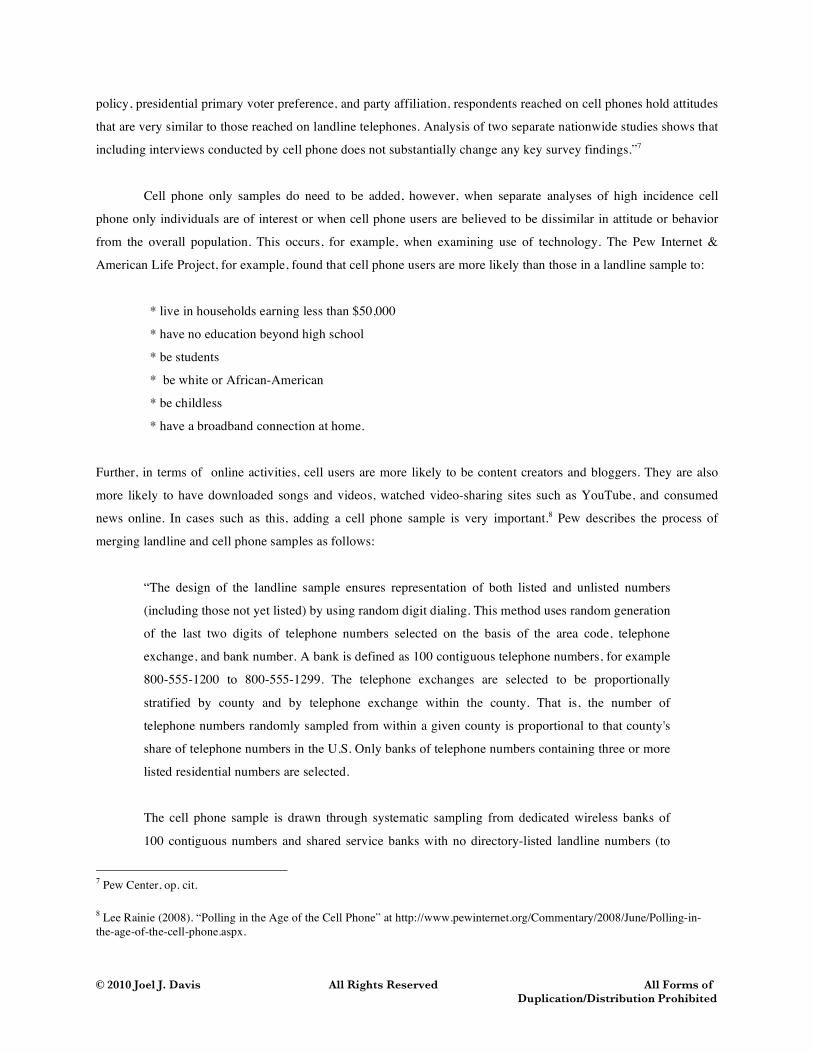
Cell phone only samples do need to be added, however, when separate analyses of high incidence cell
phone only individuals are of interest or when cell phone users are believed to be dissimilar in attitude or behavior
from the overall population. This occurs, for example, when examining use of technology. The Pew Internet &
American Life Project, for example, found that cell phone users are more likely than those in a landline sample to:
* live in households earning less than $50,000
* have no education beyond high school
* be students
* be white or African-American
* be childless
* have a broadband connection at home.
Further, in terms of online activities, cell users are more likely to be content creators and bloggers. They are also
more likely to have downloaded songs and videos, watched video-sharing sites such as YouTube, and consumed
news online. In cases such as this, adding a cell phone sample is very important.8 Pew describes the process of
merging landline and cell phone samples as follows:
“The design of the landline sample ensures representation of both listed and unlisted numbers
(including those not yet listed) by using random digit dialing. This method uses random generation
of the last two digits of telephone numbers selected on the basis of the area code, telephone
exchange, and bank number. A bank is defined as 100 contiguous telephone numbers, for example
800-555-1200 to 800-555-1299. The telephone exchanges are selected to be proportionally
stratified by county and by telephone exchange within the county. That is, the number of
telephone numbers randomly sampled from within a given county is proportional to that county's
share of telephone numbers in the U.S. Only banks of telephone numbers containing three or more
listed residential numbers are selected.
The cell phone sample is drawn through systematic sampling from dedicated wireless banks of
100 contiguous numbers and shared service banks with no directory-listed landline numbers (to
7 Pew Center, op. cit. 8 Lee Rainie (2008). “Polling in the Age of the Cell Phone” at http://www.pewinternet.org/Commentary/2008/June/Polling-in-the-age-of-the-cell-phone.aspx.

© 2010 Joel J. Davis All Rights Reserved All Forms of Duplication/Distribution Prohibited
ensure that the cell phone sample does not include banks that are also included in the landline
sample). The sample is designed to be representative both geographically and by large and small
wireless carriers.9
Bias and Online Panels
Telephone contact remains an important mode of respondent contact. Nevertheless, as the mode of data collection
shifts from mail and telephone to online, researchers are turning to online panels for their source of respondents.
When using panels, a researcher identifies target population characteristics and the desired sample size, and then the
appropriate number of individuals with the specified characteristics are randomly selected from the panel for
participation in the research. The underlying assumption of panel use is that panel characteristics mirror that of the
broader U. S. population.
Many research companies offer online panels for research.10 Not all panels provide equal data quality,
however, as panels differ with regard to how the panel is formed, the demographics of panel members and the extent
to which the research company has verified the representativeness of panel composition. E-rewards provides a set of
excellent insights for evaluating panel quality, which are adapted below:11
* Invitation only panels are preferred over “opt-in” panels because this recruitment technique
helps to reduce “self-selection” bias.
* Panels should aggressively and continuously identify “professional respondents” and
immediately expel these individuals from the panel.
* All panel members’ demographic and other defining information should be verified.
* Panel demographic composition should be verified and the panel itself should mirror the general
U.S. adult population. Researchers should not have to resort to weighting results to compensate for
the lack of panel representativeness.
9 Pew Center for People & the Press (undated). “About Our Survey Methodology in Detail” at http://people-press.org/methodology/about/. 10 See Green Book (2009) for a listing at http://www.greenbook.org/market-research-firms.cfm/online-panels. 11 E-rewards (2009). “What Defines Online Panel Quality” at http://www.e-rewardsresearch.com/downloads/WhatDefinesOnlinePanelQual.pdf. All of the points noted apply to the e-Rewards panel. In addition, Knowledge Networks provides additional insight into panel evaluation and verification at http://www.knowledgenetworks.com/ganp/reviewer-info.html.

© 2010 Joel J. Davis All Rights Reserved All Forms of Duplication/Distribution Prohibited
* Panel response rates should be monitored and be made accessible to all researchers
contemplating use of the panel. Consistently unresponsive panel members should eliminated from
the panel.
* The quality of information provided by panel members should be continuously monitored. Panel
members that consistently provide poor information (for example, by providing: the same choice
for all questions, obviously inconsistent answers or completing surveys in too short a time frame)
should be eliminated from the panel.
Nonprobability Sampling and Quantitative Research
The previous section discussed three types of probability samples: simple random, systematic random, and stratified
random. Each of these forms of sampling obtains probability samples because all elements in the defined universe
have a known and equal chance of being selected. However, in spite of its advantages, not all advertising research
uses probability sampling. Some informational needs do not require the precision and generalizability of probability
samples while other needs cannot justify the associated time and expense. In these cases, other forms of selection
labeled nonprobability sampling are selected. The major forms of nonprobability sampling in quantitative research
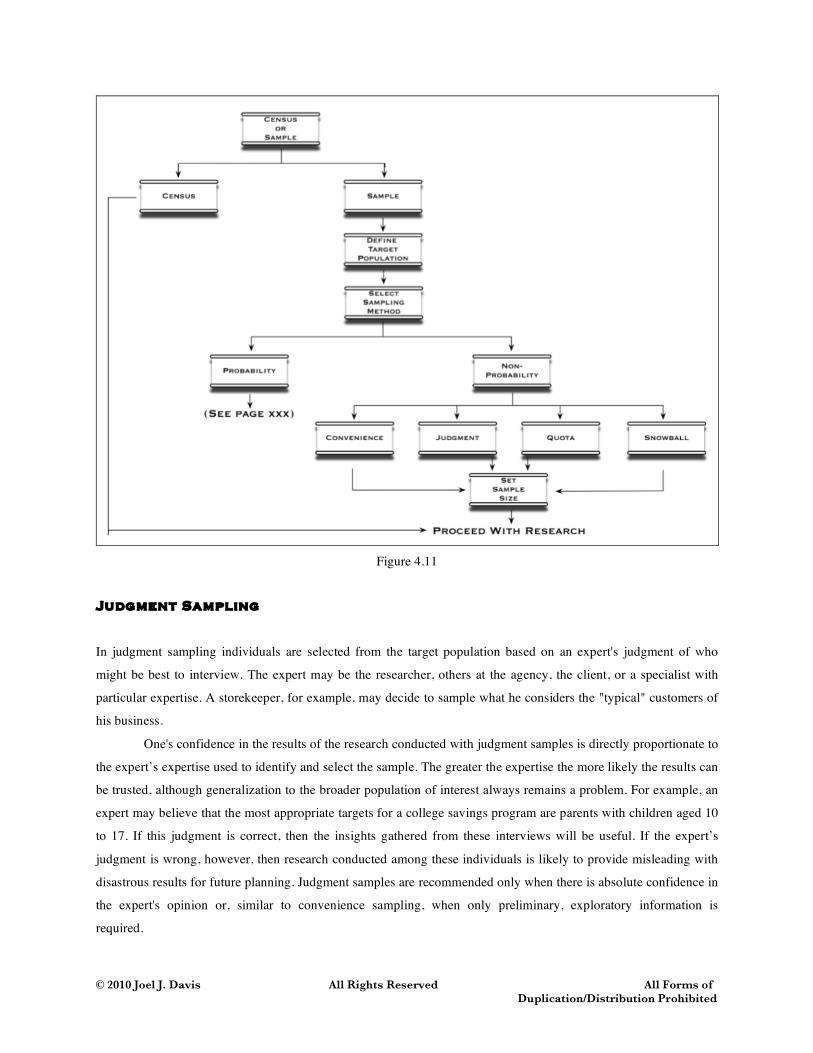
are convenience, judgment, quota, and snowball. The sampling process for nonprobability sampling is shown in
Figure 4.11.
Convenience Sampling
Convenience sampling is just what the name implies: study participants are selected because they are convenient and
accessible. Interviewing friends, associates or individuals walking down the street or through the mall are forms of
this type of sampling as are selecting individuals who participated in a store’s the last thirty transactions because the
records are handy. Convenience sampling, as might be expected, is uncomplicated, quick, and low in cost.
Convenience sampling has great potential to provide unreliable and biased information and, therefore,
should only be used when there is absolutely no need to generalize the attitudes and behaviors of the convenience
sample to the broader population. This is because there is never any assurance that the characteristics of the
convenience sample are in any way representative of the larger universe. As a result, it is only appropriate to use
convenience sampling for exploratory research or for quick, nongeneralizable information relevant to a specific
research need, such as questionnaire pretesting.
© 2010 Joel J. Davis All Rights Reserved All Forms of Duplication/Distribution Prohibited
Figure 4.11
Judgment Sampling
In judgment sampling individuals are selected from the target population based on an expert's judgment of who
might be best to interview. The expert may be the researcher, others at the agency, the client, or a specialist with
particular expertise. A storekeeper, for example, may decide to sample what he considers the "typical" customers of
his business.
One's confidence in the results of the research conducted with judgment samples is directly proportionate to
the expert’s expertise used to identify and select the sample. The greater the expertise the more likely the results can
be trusted, although generalization to the broader population of interest always remains a problem. For example, an
expert may believe that the most appropriate targets for a college savings program are parents with children aged 10
to 17. If this judgment is correct, then the insights gathered from these interviews will be useful. If the expert’s
judgment is wrong, however, then research conducted among these individuals is likely to provide misleading with
disastrous results for future planning. Judgment samples are recommended only when there is absolute confidence in
the expert's opinion or, similar to convenience sampling, when only preliminary, exploratory information is
required.
© 2010 Joel J. Davis All Rights Reserved All Forms of Duplication/Distribution Prohibited
Quota Sampling
Quota sampling is an extended form of judgment sampling. It attempts to ensure that demographic characteristics of
interest are represented in the sample in the same proportion as they are in the target population. Quota samples are
obtained through the following five steps:
1. Determine the defining characteristics of the key subgroups,
2. Determine the percent of the total population represented by each defining characteristic,
3. Determine the percent of the total population represented by each quota cell,
4. Translate the percent into a sample size,
5. Sample the population.
Figure 4.12 illustrates the outcome of following the prior steps. First, the universe was divided based on gender and
education. Second, the percent of the total population represented by each characteristic is determined and placed in
the margins of the table. Third, because the two characteristics are assumed to be independent, the percent of the
total sample represented by each cell is calculated by multiplying the appropriate marginal values. For example, the
percent of men with less than a high school education is the product of 0.21 (the percent of the total population that
has less than a high school education) and 0.48 (the percent of the total population that are men). Third, the total
sample of 400 individuals is allocated on a percentage basis. In this example, the 40 men allocated to the “Less than
High School group” is found by multiplying the .1 in this cell in the top chart by the sample size of 400. The total
sample of 400 permits sufficient size in each quota cell for subgroup analysis. Were this not the case, total sample
size would have to be increased. Finally the sample is selected so that each cell's quota is filled.

© 2010 Joel J. Davis All Rights Reserved All Forms of Duplication/Distribution Prohibited
Percent of the target population falling into each quota cell ______________________Education_______________________ Less Than High Some College and Gender High School School College Above Total % Men 10 17 11 10 48 Women 11 18 12 11 52 Total % 21 35 23 21 100 Sample size for each cell, given a total sample of 400 ______________________Education_______________________ Less Than High Some College and Gender High School School College Above Total Men 40 68 44 40 192 Women 44 72 48 44 208 Total % 84 140 92 84 400
Figure 4.12
Snowball Sampling
Snowball sampling uses current study participants to help recruit future participants from among their friends and
acquaintances. Thus the sample group grows like a rolling snowball. Snowball sampling is typically used for very
small, hard to reach, or highly specialized populations of individuals; populations where access is facilitated through
personal introductions. Because sample members are not selected from a sampling frame, snowball samples are
subject to numerous biases. For example, people who have many friends are more likely to be recruited into the
sample. In addition, since snowball sampling relies on referrals from initial participants to generate additional
participants, any biasing characteristics of initial respondents are likely to affect all future participants. This reflects
the fact that People tend to associate with others like themselves. This increases the chance of correlations and other
relationships being found in the study that do not apply to the wider population of which participants are members.
Sample Size in Nonprobability Samples
The nature of nonprobability samples precludes the use of statistical techniques to determine confidence intervals
and associated sample size. As a result, sample sizes in nonprobability research typically reflect some form of
judgment. Some forms of judgment, however, are better than others.

© 2010 Joel J. Davis All Rights Reserved All Forms of Duplication/Distribution Prohibited
Unaided judgment is the most arbitrary approach to nonprobability sample size determination. Here, the
client or researcher simply says: "A sample of fifty (or 100 or 1,000) will do. This is a good number. One that I feel
comfortable with." While the researcher or client may "feel comfortable" with sample sizes selected in this way,
there is no assurance that the sample is sufficient to satisfy informational needs. Consequently, this approach should
be avoided.
What Is the Budget? A second approach reflects budget considerations. The amount of funds available for
sampling is divided by the cost per sample unit (for example, the cost to interview one individual) and the result is
used to set the sample size. At ten dollars per interview, for example, a budget of $1,000 dictates a sample size of
100. This approach should also be avoided. Buying the largest sample size that the you can afford has a high
potential to produce samples that are either too large or too small given the research's informational needs.
Frame of reference is a more reasonable approach to nonprobability sample size determination, where
sample decisions follow the practices of others. Here, you would first determine the sample sizes others have used
for similar types of research and would then select samples of comparable size. The strength of this approach lies in
the fact that there is often merit in historical precedence. A weakness, however, is that you may not know the
validity of the rationale underlying initial decisions of sample size.
Analytical requirements is probably the best method for determining nonprobability sample size. It is
recommended that the total number of individuals or observations in major study subgroups total at least 100 while
there be a minimum of twenty to fifty individuals in minor analytical groups. These requirements are met, for
example, in the quota sample shown in Table 4.13.
Sample Selection and Qualitative Research
This chapter began by discussing the differences between quantitative and qualitative research. Given quantitative
research’s goal of generalization, it follows that sampling focuses on people. Sampling in quantitative research is
designed to maximize the chances that observations made among a sample of people are true and generalizable to
the population from which they were sampled. Qualitative research has a different goal - to provide deep insights
into a group of people. Given this goal, sampling in qualitative research focuses on information. Events, incidents,
experiences, attitudes and behaviors not people per se are the focus of qualitative sampling.12 Sampling in qualitative
research is therefore considered successful not if the results are statistically generalizable but if the sample provides
information-rich cases.13
Purposive sampling is the most common form of qualitative sampling. In this approach, a researcher starts
with a specific purpose or information-need in mind, and the sample is then selected to include only those people 12 See, for example, M. B. Miles and A. M. Huberman (1994). Qualitative Data Analysis: An Expanded Sourcebook (2nd ed.) (Thousand Oaks, CA: Sage Publications) and A. Strauss and J. Corbin (1990). Basics of Qualitative Research: Grounded Theory Procedures and Techniques (Newbury Park, CA: Sage Publications). 13 See M. Q. Patton (1990). Qualitative Evaluation and Research Methods (2nd ed.) (Newbury Park, CA: Sage Publications).
© 2010 Joel J. Davis All Rights Reserved All Forms of Duplication/Distribution Prohibited
who in the judgment of the researcher will be able to provide information relevant to satisfying the information
need. Hopefully, individuals selected will represent “information-rich cases for study in depth. Information-rich
cases are those from which one can learn a great deal about issues of central importance to the purpose of the
research.”14
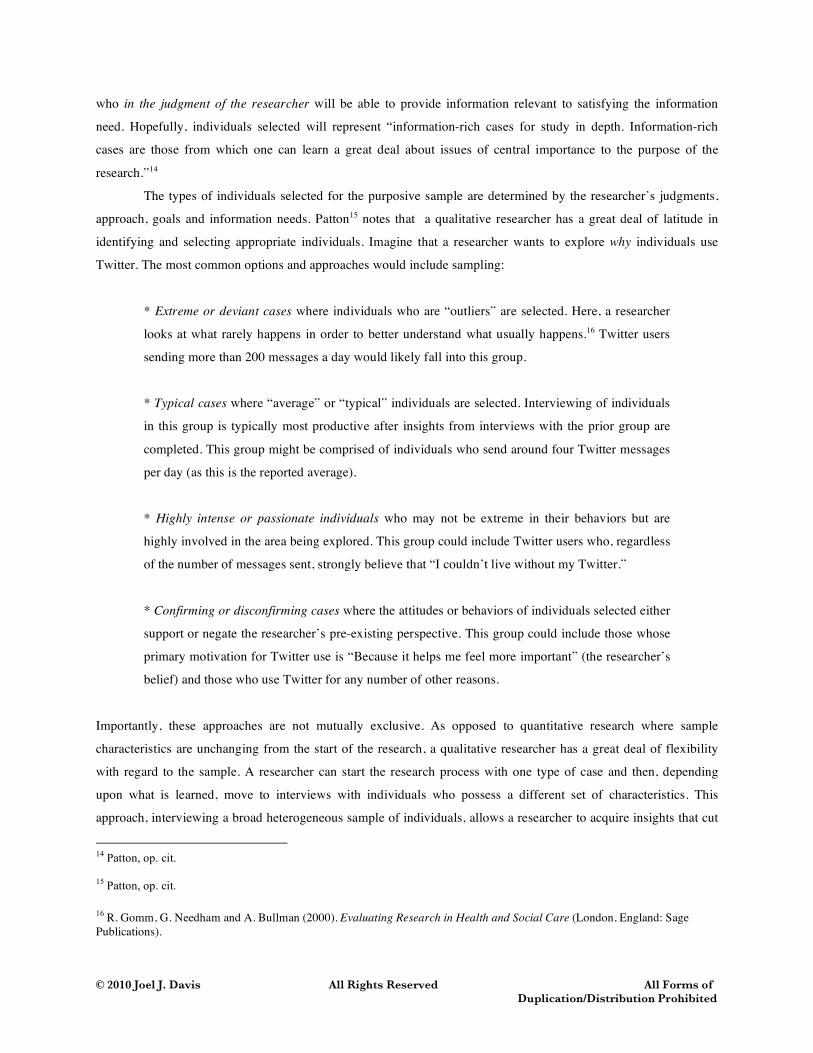
The types of individuals selected for the purposive sample are determined by the researcher’s judgments,
approach, goals and information needs. Patton15 notes that a qualitative researcher has a great deal of latitude in
identifying and selecting appropriate individuals. Imagine that a researcher wants to explore why individuals use
Twitter. The most common options and approaches would include sampling:
* Extreme or deviant cases where individuals who are “outliers” are selected. Here, a researcher
looks at what rarely happens in order to better understand what usually happens.16 Twitter users
sending more than 200 messages a day would likely fall into this group.
* Typical cases where “average” or “typical” individuals are selected. Interviewing of individuals
in this group is typically most productive after insights from interviews with the prior group are
completed. This group might be comprised of individuals who send around four Twitter messages
per day (as this is the reported average).
* Highly intense or passionate individuals who may not be extreme in their behaviors but are
highly involved in the area being explored. This group could include Twitter users who, regardless
of the number of messages sent, strongly believe that “I couldn’t live without my Twitter.”
* Confirming or disconfirming cases where the attitudes or behaviors of individuals selected either
support or negate the researcher’s pre-existing perspective. This group could include those whose
primary motivation for Twitter use is “Because it helps me feel more important” (the researcher’s
belief) and those who use Twitter for any number of other reasons.
Importantly, these approaches are not mutually exclusive. As opposed to quantitative research where sample
characteristics are unchanging from the start of the research, a qualitative researcher has a great deal of flexibility
with regard to the sample. A researcher can start the research process with one type of case and then, depending
upon what is learned, move to interviews with individuals who possess a different set of characteristics. This
approach, interviewing a broad heterogeneous sample of individuals, allows a researcher to acquire insights that cut
14 Patton, op. cit. 15 Patton, op. cit. 16 R. Gomm, G. Needham and A. Bullman (2000). Evaluating Research in Health and Social Care (London, England: Sage Publications).

© 2010 Joel J. Davis All Rights Reserved All Forms of Duplication/Distribution Prohibited
across a wide variety of individuals and that allow for maximum contrast across cases with differing characteristics.
In addition, sample characteristics may change as the research progresses as a researcher’s knowledge increases and
new insights and potential areas for exploration are uncovered.17
Sample Size
Sample size in qualitative research is estimated at the start of the research, but the actual number of participants is
guided by information gain: interviewing continues as long as the budget permits a researcher to learn new things
and gain new insights. The “adequacy of sample size in qualitative research is relative, a matter of judging a sample
neither small nor large per se, but rather too small or too large for the intended purposes of”18 what needs to be
learned. A sample of 10, for example, may be adequate if nothing new is being learned from additional interviews
while a sample of 30 may be too small if each new interview provides additional insights. Thus, “determining an
adequate sample size in qualitative research is ultimately a matter of judgment and experience in evaluating the
quality of the information collected … and the intended research outcomes.”19
Summary
The sampling process involves the selection and examination of the elements of a population for drawing
conclusions about the larger population of which these elements are members. A good sample is efficient and
provides reliable generalizations about the larger population.
All sampling begins with a definition of the target population, the group of elements about which you wish
to make inferences and draw generalizations. A well defined target population unambiguously describes the group
of interest and clearly differentiates those things or individuals who are of interest from those who are not.
A determination of the sampling method occurs next. Given the informational needs motivating the
research, and the time and financial considerations, either a probability or nonprobability sampling technique will be
selected. A probability sample is when each individual, household, or item comprising the universe from which the
sample is drawn has a known chance, or probability, of being selected for inclusion in the research. The selection of
sample elements is done purely by chance. A nonprobability sample is when the elements are not selected strictly by
chance from the universe of all individuals, but are rather selected in some less random, often more purposeful way.
17 See Imelda T. Coyne (1997). “Sampling in Qualitative Research. Purposeful and Theoretical Sampling; Merging or Clear Boundaries?” Journal of Advanced Nursing 26: 623-630. 18 Margarete Sandelowski (1995). “Sample Size in Qualitative Research,” Research in Nursing & Health 18: 179 - 183. 19 Sandelowski, op. cit.

© 2010 Joel J. Davis All Rights Reserved All Forms of Duplication/Distribution Prohibited
Probability Sampling
Probability sampling techniques require an additional three planning steps. First, a sample frame must be
determined. A sample frame specifies the method you will use to identify the households, individuals, or other
elements specified in the target population definition. You can take one of two approaches to specifying the sample
frame. You can either construct or obtain a list to represent the target population or, when a list is incomplete or
unavailable, you can specify a procedure such as random digit dialing for identifying and contacting target
individuals. Once a sample frame is selected, it is compared to the target population. A perfect sample frame is
identical to the target population, that is, the sample frame contains every population element once and only once
and only population elements are contained in the sampling frame. Typically, however, sample frames are either too
broad (over-registration) or too narrow (under-registration). In these latter instances, modifications in the sampling
plan can be made to take into account the sample frame's characteristics.
Second, a specific probability sampling technique is selected. The most common forms of probability
sampling are simple random samples, systematic random samples, and stratified random samples. Simple and
systematic random sampling work well when the target population displays little variability among demographic,
geographic, or behavioral subgroups. When wide variability is thought to exist, stratified random sampling (using
either proportionate or disporportionate sample selection) is recommended.
Third, statistical techniques are used to determine the most appropriate balance between required sample
size and confidence intervals, that is the range of measurement error.
Nonprobability Sampling
The most common forms of nonprobability sampling are convenience sampling, judgment sampling, quota
sampling, and purposive sampling. Convenience sampling should be used with great caution and it is only
appropriate to use a convenience sample for exploratory research or for quick, nongeneralizable information relevant
to a specific research need, such as questionnaire pretesting. Judgment sampling should also be used with caution,
and only when there is great confidence in the judgment of the expert making the sample recommendation. Sample
size is determined based on analytical requirements and reflects the minimum number of observations required for
each major and minor analytical subgroup.