chapter 34: tribology of rail transport -...
TRANSCRIPT
34Tribology of
Rail Transport
34.1 IntroductionHistorical Background • Wheel/Rail Interface and Axle Loads • Axle Load Increases
34.2 Wheel/Rail ContactWheel/Rail Materials • Forces at the Contact Patch • Adhesion • Repeated Contact — Plasticity, Shakedown, and Ratcheting • Consequences of Rail/Wheel Contact: Wear • Consequences of Rail/Wheel Contact: Rolling Contact Fatigue • Interaction of Wear and RCF • Grinding • Rail Corrugation
34.3 Diesel Power for Traction PurposesGeneration of Mechanical Power • Tribological Issues in the Design of Diesel Engines • Supply of Combustion Air • Transmissions and Drives • Gas Turbines
34.4 Current Collection Interfaces of TrainsEarth Brushes • Current Collection Shoe and Gear • Pantographs • Registration Arms
34.5 Axle Bearings, Dampers, and Traction Motor BearingsAxle Bearings • Dampers for Suspension Systems
34.6 New Developments and Recent Advances in the Study of Rolling Contact FatigueFriction Modifiers • Wheelset Steering and Individually Driven and Controlled Wheels • Integrated Study of Rolling Contact Fatigue
34.7 Conclusion
34.1 Introduction
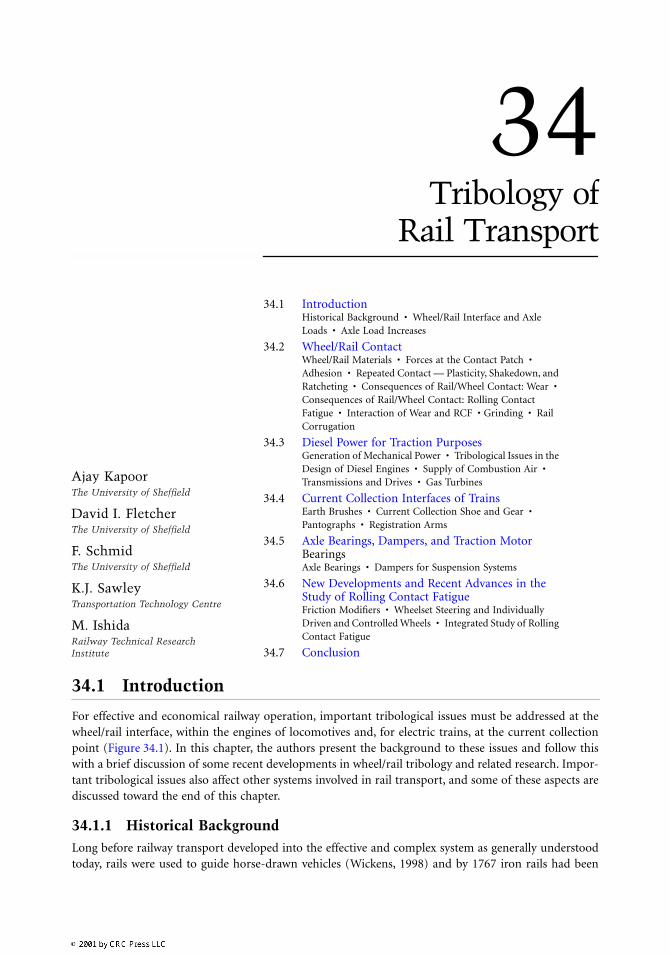
For effective and economical railway operation, important tribological issues must be addressed at thewheel/rail interface, within the engines of locomotives and, for electric trains, at the current collectionpoint (Figure 34.1). In this chapter, the authors present the background to these issues and follow thiswith a brief discussion of some recent developments in wheel/rail tribology and related research. Impor-tant tribological issues also affect other systems involved in rail transport, and some of these aspects arediscussed toward the end of this chapter.
34.1.1 Historical BackgroundLong before railway transport developed into the effective and complex system as generally understoodtoday, rails were used to guide horse-drawn vehicles (Wickens, 1998) and by 1767 iron rails had been
Ajay KapoorThe University of Sheffield
David I. FletcherThe University of Sheffield
F. SchmidThe University of Sheffield
K.J. SawleyTransportation Technology Centre
M. IshidaRailway Technical Research Institute
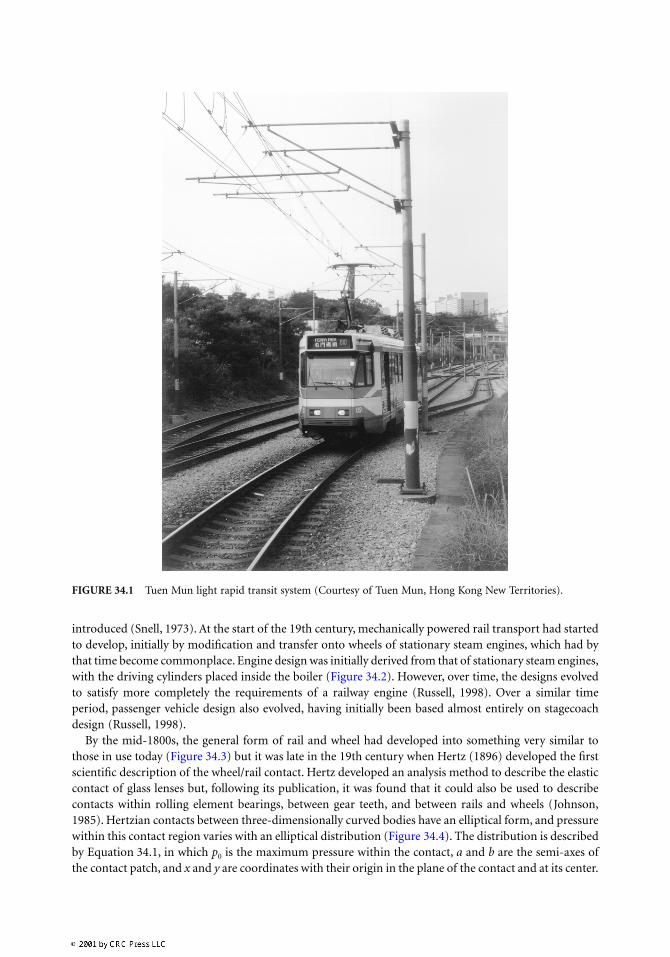
introduced (Snell, 1973). At the start of the 19th century, mechanically powered rail transport had startedto develop, initially by modification and transfer onto wheels of stationary steam engines, which had bythat time become commonplace. Engine design was initially derived from that of stationary steam engines,with the driving cylinders placed inside the boiler (Figure 34.2). However, over time, the designs evolvedto satisfy more completely the requirements of a railway engine (Russell, 1998). Over a similar timeperiod, passenger vehicle design also evolved, having initially been based almost entirely on stagecoachdesign (Russell, 1998).
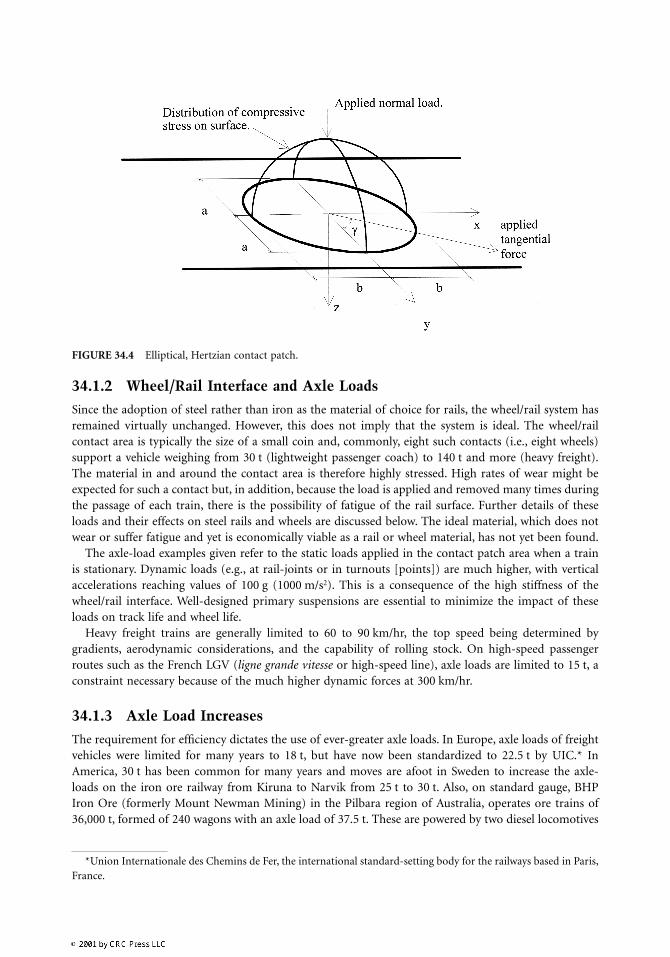
By the mid-1800s, the general form of rail and wheel had developed into something very similar tothose in use today (Figure 34.3) but it was late in the 19th century when Hertz (1896) developed the firstscientific description of the wheel/rail contact. Hertz developed an analysis method to describe the elasticcontact of glass lenses but, following its publication, it was found that it could also be used to describecontacts within rolling element bearings, between gear teeth, and between rails and wheels (Johnson,1985). Hertzian contacts between three-dimensionally curved bodies have an elliptical form, and pressurewithin this contact region varies with an elliptical distribution (Figure 34.4). The distribution is describedby Equation 34.1, in which p0 is the maximum pressure within the contact, a and b are the semi-axes ofthe contact patch, and x and y are coordinates with their origin in the plane of the contact and at its center.
FIGURE 34.1 Tuen Mun light rapid transit system (Courtesy of Tuen Mun, Hong Kong New Territories).
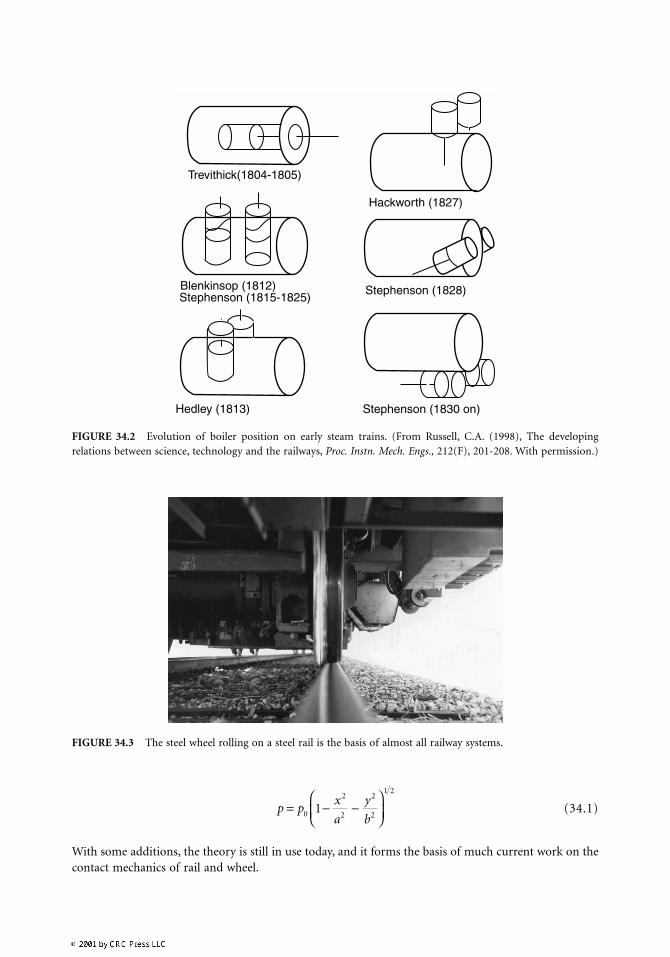
(34.1)
With some additions, the theory is still in use today, and it forms the basis of much current work on thecontact mechanics of rail and wheel.
FIGURE 34.2 Evolution of boiler position on early steam trains. (From Russell, C.A. (1998), The developingrelations between science, technology and the railways, Proc. Instn. Mech. Engs., 212(F), 201-208. With permission.)
FIGURE 34.3 The steel wheel rolling on a steel rail is the basis of almost all railway systems.
Hackworth (1827)
Stephenson (1828)
Stephenson (1830 on)
Trevithick(1804-1805)
Blenkinsop (1812)Stephenson (1815-1825)
Hedley (1813)
p px
a
y
b= − −
0
2
2
2
2
1 2
1
34.1.2 Wheel/Rail Interface and Axle Loads
Since the adoption of steel rather than iron as the material of choice for rails, the wheel/rail system hasremained virtually unchanged. However, this does not imply that the system is ideal. The wheel/railcontact area is typically the size of a small coin and, commonly, eight such contacts (i.e., eight wheels)support a vehicle weighing from 30 t (lightweight passenger coach) to 140 t and more (heavy freight).The material in and around the contact area is therefore highly stressed. High rates of wear might beexpected for such a contact but, in addition, because the load is applied and removed many times duringthe passage of each train, there is the possibility of fatigue of the rail surface. Further details of theseloads and their effects on steel rails and wheels are discussed below. The ideal material, which does notwear or suffer fatigue and yet is economically viable as a rail or wheel material, has not yet been found.
The axle-load examples given refer to the static loads applied in the contact patch area when a trainis stationary. Dynamic loads (e.g., at rail-joints or in turnouts [points]) are much higher, with verticalaccelerations reaching values of 100 g (1000 m/s2). This is a consequence of the high stiffness of thewheel/rail interface. Well-designed primary suspensions are essential to minimize the impact of theseloads on track life and wheel life.
Heavy freight trains are generally limited to 60 to 90 km/hr, the top speed being determined bygradients, aerodynamic considerations, and the capability of rolling stock. On high-speed passengerroutes such as the French LGV (ligne grande vitesse or high-speed line), axle loads are limited to 15 t, aconstraint necessary because of the much higher dynamic forces at 300 km/hr.
34.1.3 Axle Load Increases
The requirement for efficiency dictates the use of ever-greater axle loads. In Europe, axle loads of freightvehicles were limited for many years to 18 t, but have now been standardized to 22.5 t by UIC.* InAmerica, 30 t has been common for many years and moves are afoot in Sweden to increase the axle-loads on the iron ore railway from Kiruna to Narvik from 25 t to 30 t. Also, on standard gauge, BHPIron Ore (formerly Mount Newman Mining) in the Pilbara region of Australia, operates ore trains of36,000 t, formed of 240 wagons with an axle load of 37.5 t. These are powered by two diesel locomotives
FIGURE 34.4 Elliptical, Hertzian contact patch.
*Union Internationale des Chemins de Fer, the international standard-setting body for the railways based in Paris,France.
at the front and two at the rear, with a combined rating of 13,000 kW. Queensland Railways in Australiaoperates trains of similar size over hundreds of kilometers in their coal corridors, albeit on 1067-mmgauge track.
34.2 Wheel/Rail Contact
Steel wheels rolling on steel rails is the principal characteristic that distinguishes railways from otherforms of transport (Figure 34.3). Wheel and rail meet at a contact patch that is small (typically about100 mm2) and carries the full wheel load through which all steering, traction, and braking forces aretransmitted. This contact patch sees a severe working environment. Stresses normal to the plane of contactcan reach values several times the wheel or rail tensile strength, and sometimes shear stresses in the planeof contact can exceed the shear yield stress. Rapid temperature rises, caused by relative slip between thewheel and rail, can reach several hundred degrees Celsius in routine operation, and over 1000°C inextreme circumstances.
These stress and temperature conditions inevitably lead to wear, deformation, and damage to thewheels and rails; and a major goal of railroads is to arrange service conditions and maintenance proce-dures to minimize deterioration and hence extend component life. This is important because rails —and to a lesser extent wheels — constitute a large part of a railroad’s asset base. For example, there areabout 1.4 million freight vehicles and some 25,000 locomotives in service in North America, which givea total population of about 13 million wheels. North American railroads also own over 170,000 miles oftrack, which equates to about 35 million tons of steel rail. Railways have more money invested in railthan in any other asset, excepting land and perhaps bridges. Extending the life of these components, andespecially that of the rail, has a major impact on railroad profitability.
An understanding of the tribology of the wheel/rail system is essential if wheel/rail life is to be extended.This system is complex, and its behavior depends on interactions between the materials (wheel, rail, andany third body introduced, such as lubricant/debris mixtures) and the stress-temperature environment(among other things, a function of vehicle weight, vehicle/track interaction, wheel/rail profiles, wheel/railadhesion, and speed).
34.2.1 Wheel/Rail Materials
The resistance of a train to rolling has several components, including grade and acceleration resistance,aerodynamic and wind drag, bearing resistance, and wheel/rail contact resistance. Only this last resistanceis influenced by the choice of wheel and rail materials. Several factors contribute to wheel/rail contactresistance (Castelli, 1996). First, during rolling, the wheel and rail surfaces are elastically deflected suchthat relative motion can occur. Second, energy can be dissipated by plastic deformation. Third, surfaceadhesion phenomena can dissipate energy. To a first approximation, contact resistance is proportionalto the length of the contact patch and, hence, resistance is minimized if, for a given geometry, the contactarea is kept small by choosing materials with a high elastic modulus.
Of the common and inexpensive metals, steel has one of the highest values of elastic modulus. Forthis reason — and because steel is relatively inexpensive and offers a very attractive combination ofstrength, ductility, and wear resistance — almost all wheels and rails worldwide are made from plaincarbon-manganese pearlitic steel, which has a lamellar structure of iron and iron carbide. Table 34.1illustrates typical wheel and rail chemistries and hardness values. In general, passenger vehicle wheelstend to have lower carbon content and hardness than heavy axle load freight vehicles. Steel of about 300Brinell hardness is typically used for rail in straight track, while rail in the hardness range 340 to 390Brinell tends to be used for curved track where the stress environment is more severe. Although numerousstudies have examined the use of higher hardness materials, such as bainitic and martensitic steels, forwheel and rail materials (Clayton and Devanathan, 1992; De Boer et al., 1995; Hårkonen, 1985), fewmaterials can compete on wear resistance with pearlitic steel, first used for wheels and rails last century.
34.2.2 Forces at the Contact Patch
Within the wheel/rail contact patch, a force exists normal to the plane of the contact, mainly due to theload (weight) of the wheel on the rail. In addition, tractions are produced in the plane of contact by thevehicle steering forces (see below). This force system produces complex hydrostatic and shear stresses inthe rail and wheel (Johnson, 1985). Of most interest is the compressive contact stress normal to the planeof contact, which has a generally elliptical distribution and affects both wheel/rail wear and rolling contactfatigue (see Section 34.2.6). The maximum value of the contact stress p0, occurs at the center of the ellipse,and is given by (Johnson, 1985):
(34.2)
where P is the normal load, E* depends on the wheel and rail elastic moduli, F(R′/R″) is a function ofthe wheel and rail radii of curvature, and Re is the equivalent relative curvature of the wheel/rail system,defined as Re = (R′R″)1/2.
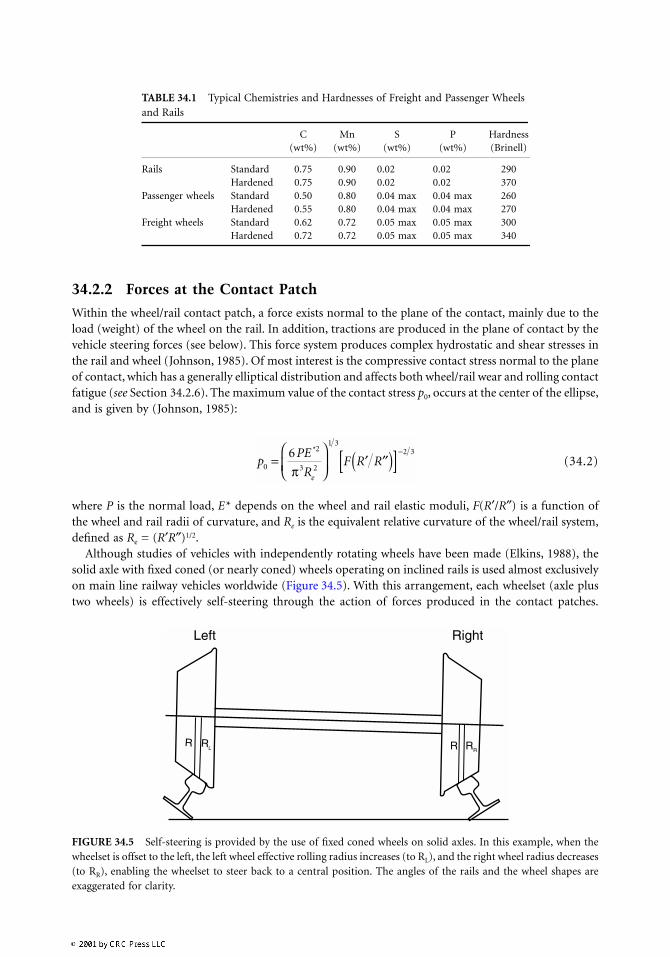
Although studies of vehicles with independently rotating wheels have been made (Elkins, 1988), thesolid axle with fixed coned (or nearly coned) wheels operating on inclined rails is used almost exclusivelyon main line railway vehicles worldwide (Figure 34.5). With this arrangement, each wheelset (axle plustwo wheels) is effectively self-steering through the action of forces produced in the contact patches.
TABLE 34.1 Typical Chemistries and Hardnesses of Freight and Passenger Wheels and Rails
C Mn S P Hardness(wt%) (wt%) (wt%) (wt%) (Brinell)
Rails Standard 0.75 0.90 0.02 0.02 290Hardened 0.75 0.90 0.02 0.02 370
Passenger wheels Standard 0.50 0.80 0.04 max 0.04 max 260Hardened 0.55 0.80 0.04 max 0.04 max 270
Freight wheels Standard 0.62 0.72 0.05 max 0.05 max 300Hardened 0.72 0.72 0.05 max 0.05 max 340
FIGURE 34.5 Self-steering is provided by the use of fixed coned wheels on solid axles. In this example, when thewheelset is offset to the left, the left wheel effective rolling radius increases (to RL), and the right wheel radius decreases(to RR), enabling the wheelset to steer back to a central position. The angles of the rails and the wheel shapes areexaggerated for clarity.
pPE
RF R R
e
0
2
3 2
1 32 36=
π
′ ′′( )[ ]−*
R RRR R
L
Left Right
Computer models are available to predict the steering forces, which depend on vehicle and track char-acteristics as well as the detailed wheel and rail profile shapes (Wilson et al., 1995). However, the theorybehind the models is complex and cannot be described here.
An understanding of how these contact patch forces arise can be gained by considering the differencein rolling radius between the left and right wheels of Figure 34.5. With the wheelset centered on straighttrack, if the left and right wheel rolling radii are equal (R), the wheelset can roll normally. However, ifthe wheelset is shifted laterally to the left, the left wheel rolling radius increases to RL while the rightwheel radius decreases to RR. Because the two wheels must rotate at the same angular velocity, thisdifference in rolling radius produces longitudinal micro-slip (termed creep) between the wheels and railswhich, in turn, leads to a longitudinal force on each wheel to steer the wheelset back to the center of thetrack. In a similar manner, lateral forces are produced on each wheel if the wheelset runs at an angle tothe track. Equal and opposite forces are produced on the rails.
Creep is a natural consequence of having fixed wheels on a solid axle, and is defined with respect tothe forward and lateral wheel and rail velocities:
(34.3)
(34.4)
where V refers to velocity; subscripts R and W refer to the wheel and rail, respectively; and superscriptsF and L refer to the forward and lateral directions. There is a further type of creep, known as spin creep,that is caused by a relative rotation of the wheel and rail around an axis normal to the plane of contact.This type of creep (Equation 34.5) is also implicated in wheel and rail damage.
(34.5)
In general, a wheelset will always be moving laterally with respect to the rail (producing lateral creepat each contact patch), and each wheel will not be moving at the forward speed of the vehicle (therebyproducing longitudinal creep at each contact patch). All three types of creep will usually be present,although one may dominate. While total creep can increase continually, the steering forces are limitedby the available adhesion between the wheels and rails, and this is discussed in detail in Section 34.2.3.Thus, the steering force on a wheel saturates at a value equal to the wheel load times the adhesioncoefficient. This saturation occurs at a resultant creep of about 0.01. Relationships between these threetypes of creep and the resultant forces and moments have been derived by Kalker (1979).
The steering forces caused by creep lead to surface and near-surface shear stresses that producedeformation in the contact patch. This deformation increases rolling resistance, and, more importantly,contributes to increased wear and rolling contact fatigue.
34.2.3 Adhesion
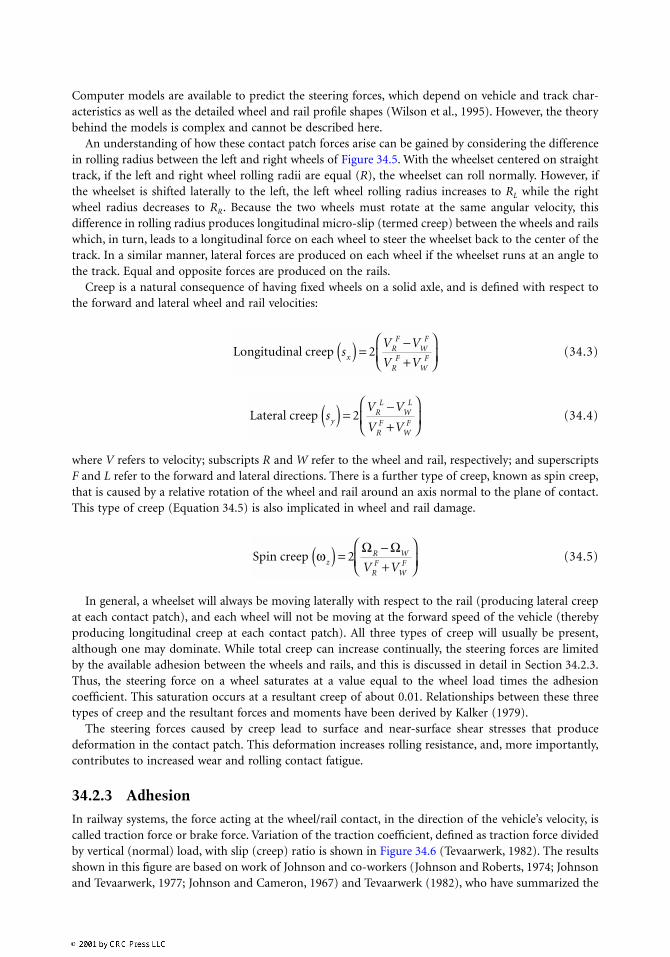
In railway systems, the force acting at the wheel/rail contact, in the direction of the vehicle’s velocity, iscalled traction force or brake force. Variation of the traction coefficient, defined as traction force dividedby vertical (normal) load, with slip (creep) ratio is shown in Figure 34.6 (Tevaarwerk, 1982). The resultsshown in this figure are based on work of Johnson and co-workers (Johnson and Roberts, 1974; Johnsonand Tevaarwerk, 1977; Johnson and Cameron, 1967) and Tevaarwerk (1982), who have summarized the
Longitudinal creep sV V
V VxR
FW
F
RF
WF( ) = −
+
2
Lateral creep sV V
V Vy
RL
WL
RF
WF( ) = −
+
2
Spin creep ωzR W
RF
WFV V
( ) = −+
2
Ω Ω
general characteristics of the traction curve. There are three regions identified on the curve and thebehavior in each of these regions can best be described by the Deborah (De) number. This number isthe ratio of the relaxation time, for a simple Maxwell viscoelastic model, to the mean transit time.
1. The linear low slip region, thought to be isothermal in nature, is caused by the shearing of a linearviscous fluid (low De) or linear elastic solid (high De); see Johnson and Cameron (1967).
2. The nonlinear region is still isothermal in nature but now the viscous element responds nonlin-early. For low De, this portion of the traction curve can be described by a suitable nonlinearviscous function alone. For high De, a linear elastic element interacts with the nonlinear viscouselement, as reported by Johnson and Tevaarwerk (1977).
3. At yet higher values of slip, the traction decreases with increasing slip and it is no longer possibleto ignore the dissipative shearing and the heat that it generates in the film. Johnson and Cameron(1967) showed that the shear plane hypothesis advanced by Smith (1965) accounted for most oftheir experimental observations in this region. More recently, Conry et al. (1979) have shown thata nonlinear viscous element, together with a simple thermal correction, can also describe thisregion.
In railways, the maximum traction coefficient is commonly called the adhesion coefficient. The adhe-sion coefficient is primarily used to estimate the brake performance of a vehicle and, accordingly, thephenomenon of adhesion between steel wheels and steel rails is a very important tribological issue forimproving the performance of the railway as a transportation system.
34.2.3.1 Characteristics of Adhesion and Traction Coefficients under Dry Conditions
Ohyama (1987) has shown the relationship between Hertzian pressure and adhesion coefficient to be afunction of surface roughness (Figure 34.7). The data vary widely but the tendency of the adhesioncoefficient to decrease with increasing Hertzian pressure can be estimated. Generally, under dry condi-tions, the friction coefficient does not depend on loading force (this is Amontons-Coulomb’s law).However, from results of experiments with carbon steels, Shaw (1960) concluded that, while Amontons-Coulomb’s law covers the case of light loading, at high loading the friction coefficient decreases. Also, areport of the Office for Research and Experiments (ORE, now known as the European Railway ResearchInstitute, ERRI, 1978) described how adhesion coefficients decreased when axle loads increased; however,the influence of surface roughness on the adhesion coefficient, under dry conditions, was not so significant.
Krause and Poll (1982) demonstrated a relationship between the initial gradients of dsx /dfx (where sx
is the longitudinal creepage and fx is the longitudinal traction coefficient), the mean roughness Rz, anda parameter Rp /Rz (the ratio of the maximum smoothing depth to the mean roughness, Figure 34.8).
FIGURE 34.6 Typical traction/slip curve. (From Tevaarwerk, J.L. (1982), Traction in lubricated contacts, Proc.Contact Mechanics and Wear of Rail/Wheel Systems, University of Waterloo Press, 121-132. With permission.)
TR
AC
TIO
N C
OE
FF
ICIE
NT
F
X/F
Z
REGION-A
LINEAR
REGION-B
NONLINEAR
REGION-C
THERMAL
SLIDE ROLL RATIO DU/U
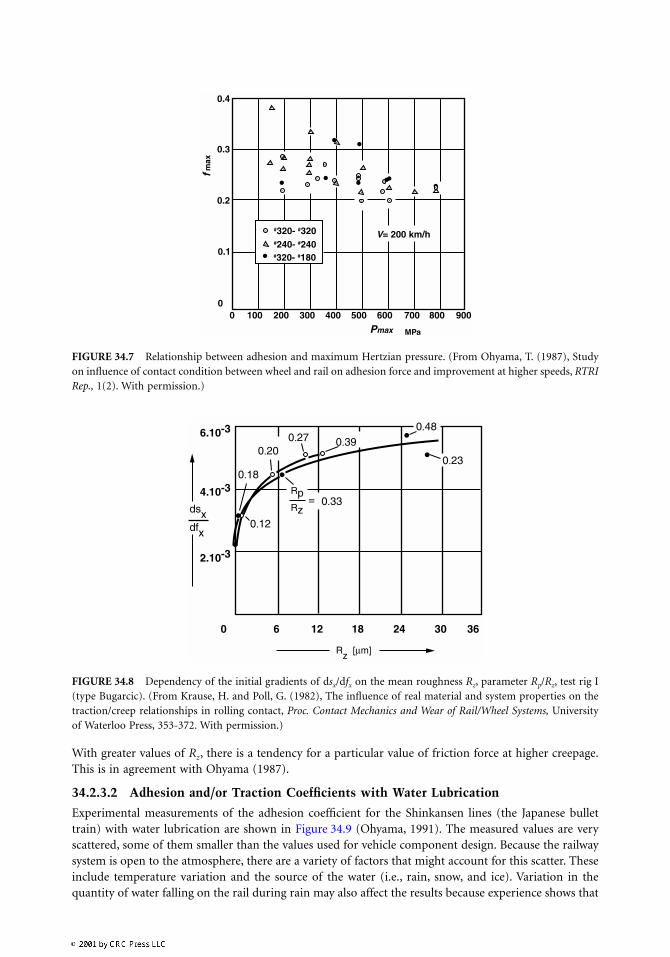
With greater values of Rz, there is a tendency for a particular value of friction force at higher creepage.This is in agreement with Ohyama (1987).
34.2.3.2 Adhesion and/or Traction Coefficients with Water Lubrication
Experimental measurements of the adhesion coefficient for the Shinkansen lines (the Japanese bullettrain) with water lubrication are shown in Figure 34.9 (Ohyama, 1991). The measured values are veryscattered, some of them smaller than the values used for vehicle component design. Because the railwaysystem is open to the atmosphere, there are a variety of factors that might account for this scatter. Theseinclude temperature variation and the source of the water (i.e., rain, snow, and ice). Variation in thequantity of water falling on the rail during rain may also affect the results because experience shows that
FIGURE 34.7 Relationship between adhesion and maximum Hertzian pressure. (From Ohyama, T. (1987), Studyon influence of contact condition between wheel and rail on adhesion force and improvement at higher speeds, RTRIRep., 1(2). With permission.)
FIGURE 34.8 Dependency of the initial gradients of dsx/dfx on the mean roughness Rz, parameter Rp/Rz, test rig I(type Bugarcic). (From Krause, H. and Poll, G. (1982), The influence of real material and system properties on thetraction/creep relationships in rolling contact, Proc. Contact Mechanics and Wear of Rail/Wheel Systems, Universityof Waterloo Press, 353-372. With permission.)
0.4
0.3
0.2
0.1
00 100 200 300 400 500 600 700 800 900
f max
Pmax MPa
V= 200 km/h#320- #320#240- #240#320- #180
6.10-3
4.10-3
2.10-3
0 6 12 18 24 30 36
Rz [µm]
RpRz
dfx
dsx
0.200.27 0.39
0.48
0.23
0.33
0.18
0.12
=
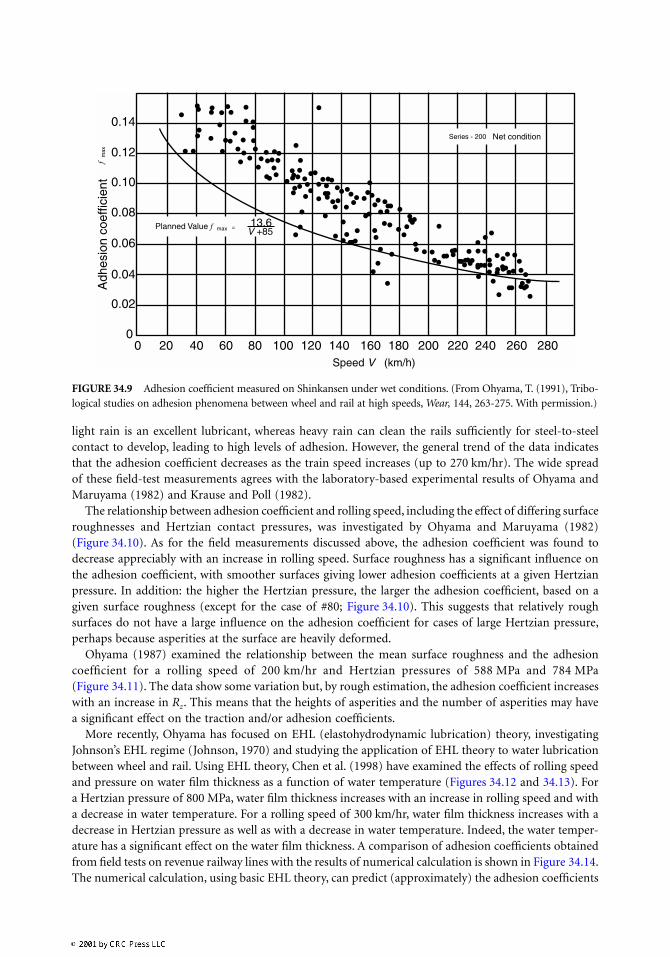
light rain is an excellent lubricant, whereas heavy rain can clean the rails sufficiently for steel-to-steelcontact to develop, leading to high levels of adhesion. However, the general trend of the data indicatesthat the adhesion coefficient decreases as the train speed increases (up to 270 km/hr). The wide spreadof these field-test measurements agrees with the laboratory-based experimental results of Ohyama andMaruyama (1982) and Krause and Poll (1982).
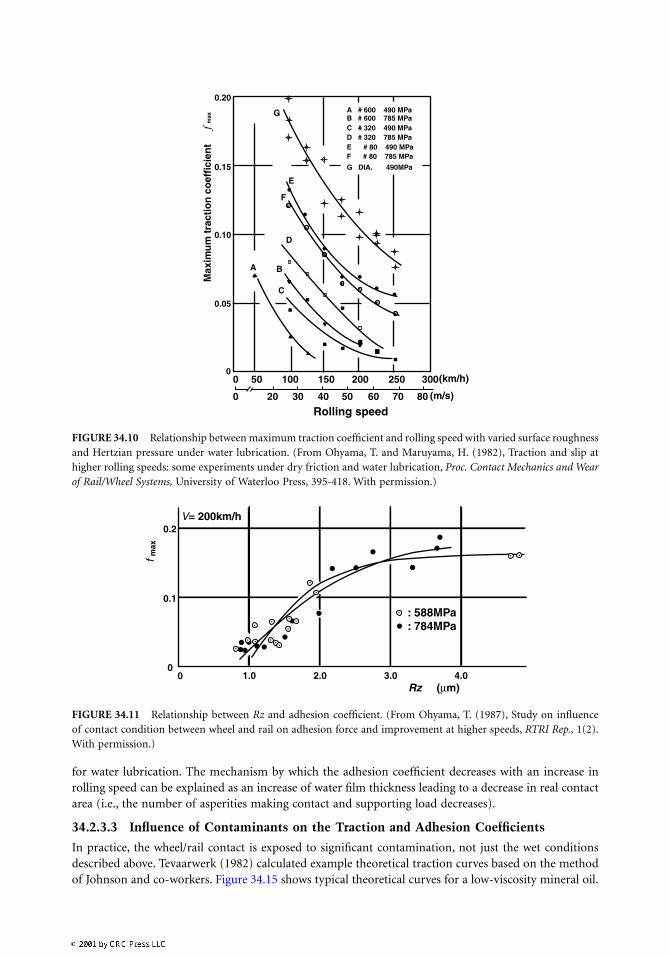
The relationship between adhesion coefficient and rolling speed, including the effect of differing surfaceroughnesses and Hertzian contact pressures, was investigated by Ohyama and Maruyama (1982)(Figure 34.10). As for the field measurements discussed above, the adhesion coefficient was found todecrease appreciably with an increase in rolling speed. Surface roughness has a significant influence onthe adhesion coefficient, with smoother surfaces giving lower adhesion coefficients at a given Hertzianpressure. In addition: the higher the Hertzian pressure, the larger the adhesion coefficient, based on agiven surface roughness (except for the case of #80; Figure 34.10). This suggests that relatively roughsurfaces do not have a large influence on the adhesion coefficient for cases of large Hertzian pressure,perhaps because asperities at the surface are heavily deformed.
Ohyama (1987) examined the relationship between the mean surface roughness and the adhesioncoefficient for a rolling speed of 200 km/hr and Hertzian pressures of 588 MPa and 784 MPa(Figure 34.11). The data show some variation but, by rough estimation, the adhesion coefficient increaseswith an increase in Rz. This means that the heights of asperities and the number of asperities may havea significant effect on the traction and/or adhesion coefficients.
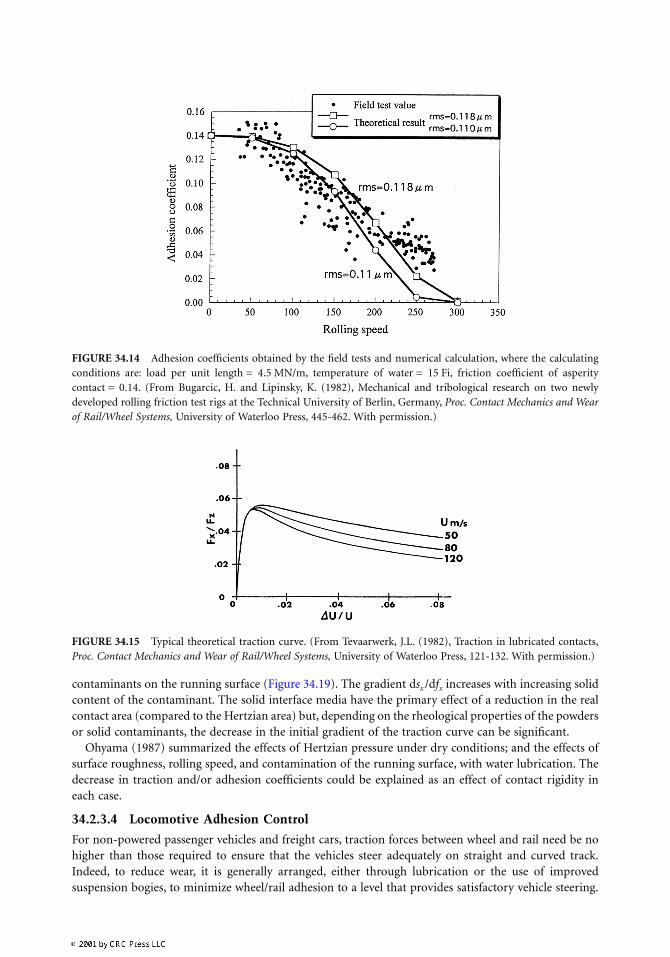
More recently, Ohyama has focused on EHL (elastohydrodynamic lubrication) theory, investigatingJohnson’s EHL regime (Johnson, 1970) and studying the application of EHL theory to water lubricationbetween wheel and rail. Using EHL theory, Chen et al. (1998) have examined the effects of rolling speedand pressure on water film thickness as a function of water temperature (Figures 34.12 and 34.13). Fora Hertzian pressure of 800 MPa, water film thickness increases with an increase in rolling speed and witha decrease in water temperature. For a rolling speed of 300 km/hr, water film thickness increases with adecrease in Hertzian pressure as well as with a decrease in water temperature. Indeed, the water temper-ature has a significant effect on the water film thickness. A comparison of adhesion coefficients obtainedfrom field tests on revenue railway lines with the results of numerical calculation is shown in Figure 34.14.The numerical calculation, using basic EHL theory, can predict (approximately) the adhesion coefficients
FIGURE 34.9 Adhesion coefficient measured on Shinkansen under wet conditions. (From Ohyama, T. (1991), Tribo-logical studies on adhesion phenomena between wheel and rail at high speeds, Wear, 144, 263-275. With permission.)
0 20 40 60 80 100 120 140 160 180 200 220 240 260 280Speed V (km/h)
0.14
0.12
0.10
0.08
0.06
0.04
0.02
0
Adh
esio
n co
effic
ient
Series - 200
Planned Value f max = 13.6
f m
ax
V +85
Net condition
for water lubrication. The mechanism by which the adhesion coefficient decreases with an increase inrolling speed can be explained as an increase of water film thickness leading to a decrease in real contactarea (i.e., the number of asperities making contact and supporting load decreases).
34.2.3.3 Influence of Contaminants on the Traction and Adhesion Coefficients
In practice, the wheel/rail contact is exposed to significant contamination, not just the wet conditionsdescribed above. Tevaarwerk (1982) calculated example theoretical traction curves based on the methodof Johnson and co-workers. Figure 34.15 shows typical theoretical curves for a low-viscosity mineral oil.
FIGURE 34.10 Relationship between maximum traction coefficient and rolling speed with varied surface roughnessand Hertzian pressure under water lubrication. (From Ohyama, T. and Maruyama, H. (1982), Traction and slip athigher rolling speeds: some experiments under dry friction and water lubrication, Proc. Contact Mechanics and Wearof Rail/Wheel Systems, University of Waterloo Press, 395-418. With permission.)
FIGURE 34.11 Relationship between Rz and adhesion coefficient. (From Ohyama, T. (1987), Study on influenceof contact condition between wheel and rail on adhesion force and improvement at higher speeds, RTRI Rep., 1(2).With permission.)
0
0 20 30 40 50 60 70 80
50 100 150 200 250 300(km/h)
(m/s)
Rolling speed
A # 600 490 MPaB # 600 785 MPaC # 320 490 MPaD # 320 785 MPaE # 80 490 MPaF # 80 785 MPa
G DIA. 490MPa
G
E
F
D
A B
C
0.20
0.15
0.10
0.05
0
Max
imu
m t
ract
ion
co
effi
cien
tf m
ax
V= 200km/h0.2
0.1
f max
00 1.0 2.0 3.0 4.0
: 588MPa: 784MPa
Rz (µm)

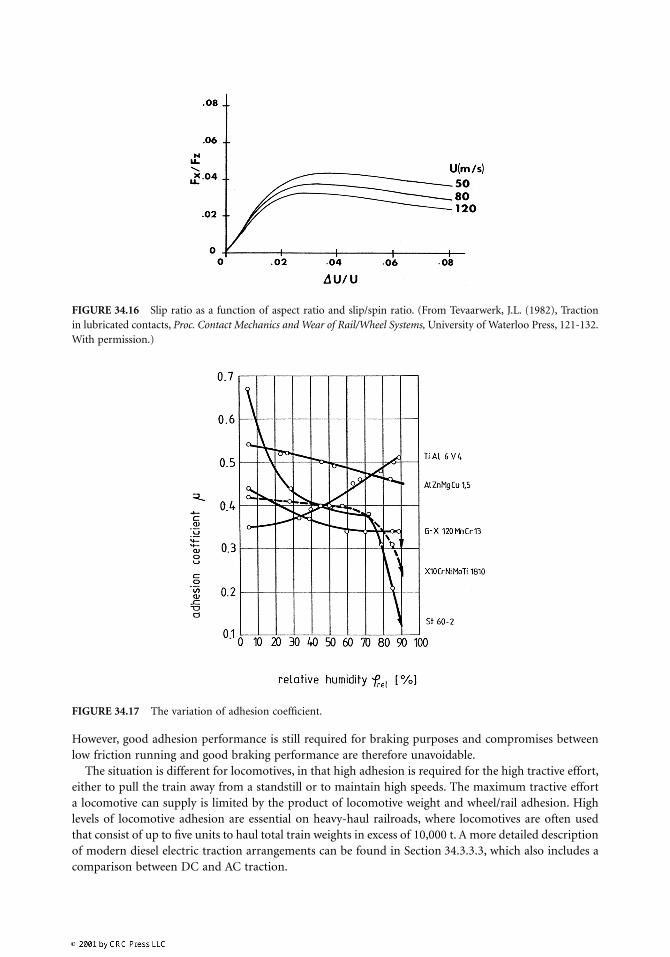
Figure 34.16 shows theoretical traction curves for the same data and oil as used in Figure 34.15, but withthe addition of 3% spin. By comparison of the two figures, the effects of rolling speed and spin on theadhesion coefficient and the initial gradient of the traction curve can be seen to be significant.
Through rolling experiments with various materials, Bugarcic and Lipinsky (1982) focused on theinfluence of the complex reaction in the physicochemical boundary layer and obtained the variation ofthe adhesion coefficient with respect to relative humidity. Figure 34.17 shows the variation of the adhesioncoefficient in clean air with 200 ppm SO2. At higher humidity levels, titanium alloy resulted in animproved adhesion coefficient in rolling experiments with various materials. This interesting effect wasa result of reactions between the metallic surface, H2O, and SO2, accompanied by hydrogen embrittlementand hardening.
Ohyama (1987) examined the effect of Hertzian pressure on the adhesion coefficient, for varyingcreepage, using paraffin lubrication (Figure 34.18). For a rolling speed of 200 km/hr, the initial gradientof the traction curve increases with an increase of Hertzian pressure, up to 0.15% creepage. Also, Krauseand Poll (1982) examined the relationship between traction coefficient and creepage for various
FIGURE 34.12 Effects of rolling speed and temperature on water film thickness. (From Chen, H., Yoshimura, A.,and Ohyama, T. (1998), Numerical analysis for the influence of water film on adhesion between rail and wheel, Proc.Inst. Mech. Engs., 212 (Part J), 359-368. With permission.)
FIGURE 34.13 Effects of pressure and temperature on water film thickness. (From Chen, H., Yoshimura, A., andOhyama, T. (1998), Numerical analysis for the influence of water film on adhesion between rail and wheel, Proc.Inst. Mech. Engs., 212 (Part J), 359-368. With permission.)
contaminants on the running surface (Figure 34.19). The gradient dsx /dfx increases with increasing solidcontent of the contaminant. The solid interface media have the primary effect of a reduction in the realcontact area (compared to the Hertzian area) but, depending on the rheological properties of the powdersor solid contaminants, the decrease in the initial gradient of the traction curve can be significant.
Ohyama (1987) summarized the effects of Hertzian pressure under dry conditions; and the effects ofsurface roughness, rolling speed, and contamination of the running surface, with water lubrication. Thedecrease in traction and/or adhesion coefficients could be explained as an effect of contact rigidity ineach case.
34.2.3.4 Locomotive Adhesion Control
For non-powered passenger vehicles and freight cars, traction forces between wheel and rail need be nohigher than those required to ensure that the vehicles steer adequately on straight and curved track.Indeed, to reduce wear, it is generally arranged, either through lubrication or the use of improvedsuspension bogies, to minimize wheel/rail adhesion to a level that provides satisfactory vehicle steering.
FIGURE 34.14 Adhesion coefficients obtained by the field tests and numerical calculation, where the calculatingconditions are: load per unit length = 4.5 MN/m, temperature of water = 15 Fi, friction coefficient of asperitycontact = 0.14. (From Bugarcic, H. and Lipinsky, K. (1982), Mechanical and tribological research on two newlydeveloped rolling friction test rigs at the Technical University of Berlin, Germany, Proc. Contact Mechanics and Wearof Rail/Wheel Systems, University of Waterloo Press, 445-462. With permission.)
FIGURE 34.15 Typical theoretical traction curve. (From Tevaarwerk, J.L. (1982), Traction in lubricated contacts,Proc. Contact Mechanics and Wear of Rail/Wheel Systems, University of Waterloo Press, 121-132. With permission.)
However, good adhesion performance is still required for braking purposes and compromises betweenlow friction running and good braking performance are therefore unavoidable.
The situation is different for locomotives, in that high adhesion is required for the high tractive effort,either to pull the train away from a standstill or to maintain high speeds. The maximum tractive efforta locomotive can supply is limited by the product of locomotive weight and wheel/rail adhesion. Highlevels of locomotive adhesion are essential on heavy-haul railroads, where locomotives are often usedthat consist of up to five units to haul total train weights in excess of 10,000 t. A more detailed descriptionof modern diesel electric traction arrangements can be found in Section 34.3.3.3, which also includes acomparison between DC and AC traction.
FIGURE 34.16 Slip ratio as a function of aspect ratio and slip/spin ratio. (From Tevaarwerk, J.L. (1982), Tractionin lubricated contacts, Proc. Contact Mechanics and Wear of Rail/Wheel Systems, University of Waterloo Press, 121-132.With permission.)
FIGURE 34.17 The variation of adhesion coefficient.
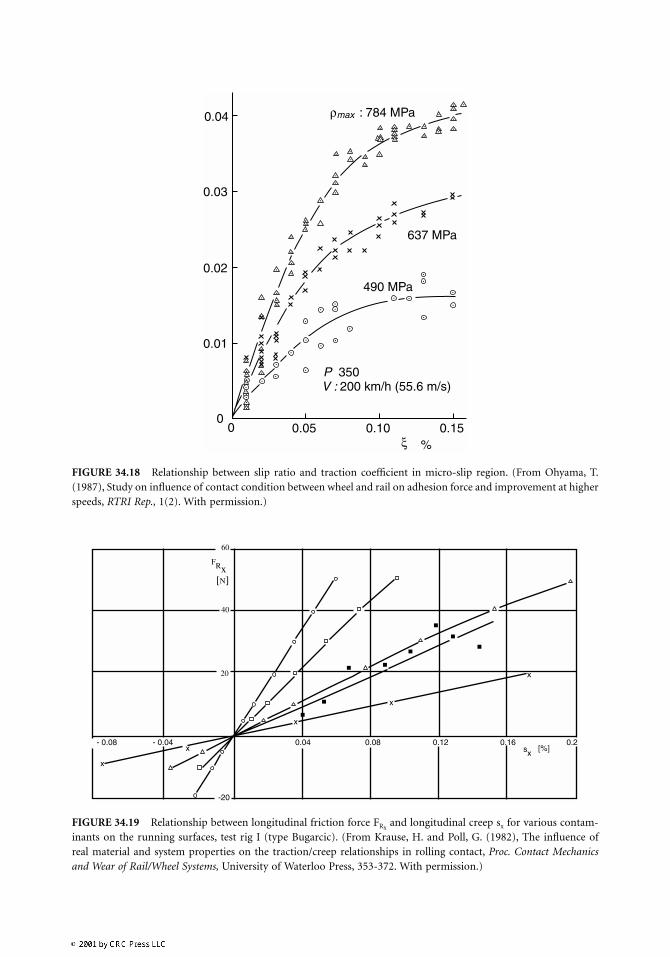
FIGURE 34.18 Relationship between slip ratio and traction coefficient in micro-slip region. (From Ohyama, T.(1987), Study on influence of contact condition between wheel and rail on adhesion force and improvement at higherspeeds, RTRI Rep., 1(2). With permission.)
FIGURE 34.19 Relationship between longitudinal friction force FRx and longitudinal creep sx for various contam-
inants on the running surfaces, test rig I (type Bugarcic). (From Krause, H. and Poll, G. (1982), The influence ofreal material and system properties on the traction/creep relationships in rolling contact, Proc. Contact Mechanicsand Wear of Rail/Wheel Systems, University of Waterloo Press, 353-372. With permission.)
0.04
0.03
0.02
0.01
00 0.05 0.10 0.15
%ξ
ρmax : 784 MPa
P 350V : 200 km/h (55.6 m/s)
637 MPa
490 MPa
60
40
20
- 0.08
x
x
x
x
x
-20
sx[%]
FRx[N]
0.04 0.08 0.12 0.16 0.2- 0.04
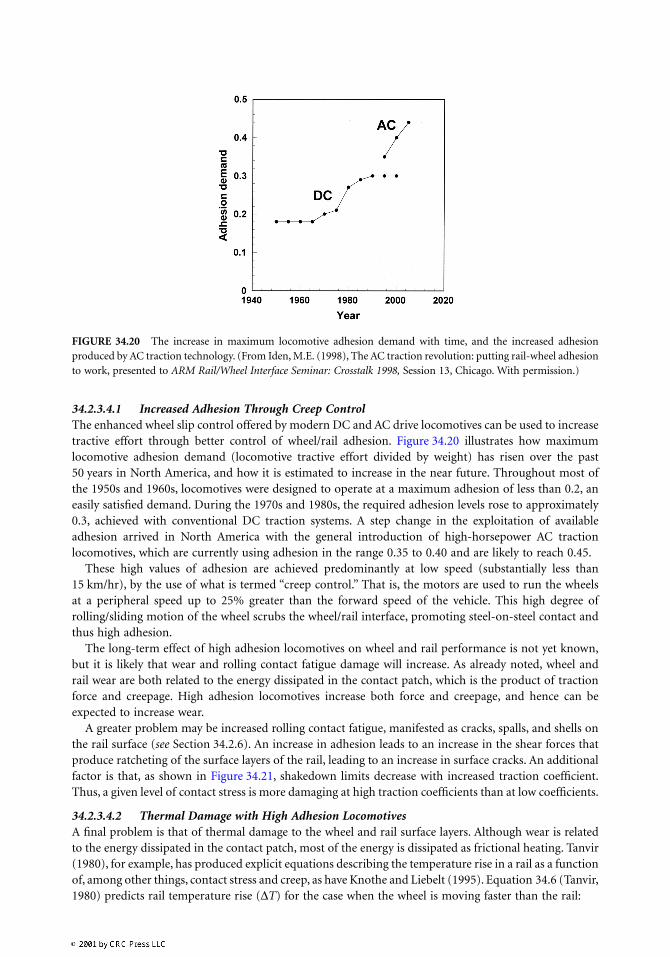
34.2.3.4.1 Increased Adhesion Through Creep ControlThe enhanced wheel slip control offered by modern DC and AC drive locomotives can be used to increasetractive effort through better control of wheel/rail adhesion. Figure 34.20 illustrates how maximumlocomotive adhesion demand (locomotive tractive effort divided by weight) has risen over the past50 years in North America, and how it is estimated to increase in the near future. Throughout most ofthe 1950s and 1960s, locomotives were designed to operate at a maximum adhesion of less than 0.2, aneasily satisfied demand. During the 1970s and 1980s, the required adhesion levels rose to approximately0.3, achieved with conventional DC traction systems. A step change in the exploitation of availableadhesion arrived in North America with the general introduction of high-horsepower AC tractionlocomotives, which are currently using adhesion in the range 0.35 to 0.40 and are likely to reach 0.45.
These high values of adhesion are achieved predominantly at low speed (substantially less than15 km/hr), by the use of what is termed “creep control.” That is, the motors are used to run the wheelsat a peripheral speed up to 25% greater than the forward speed of the vehicle. This high degree ofrolling/sliding motion of the wheel scrubs the wheel/rail interface, promoting steel-on-steel contact andthus high adhesion.
The long-term effect of high adhesion locomotives on wheel and rail performance is not yet known,but it is likely that wear and rolling contact fatigue damage will increase. As already noted, wheel andrail wear are both related to the energy dissipated in the contact patch, which is the product of tractionforce and creepage. High adhesion locomotives increase both force and creepage, and hence can beexpected to increase wear.
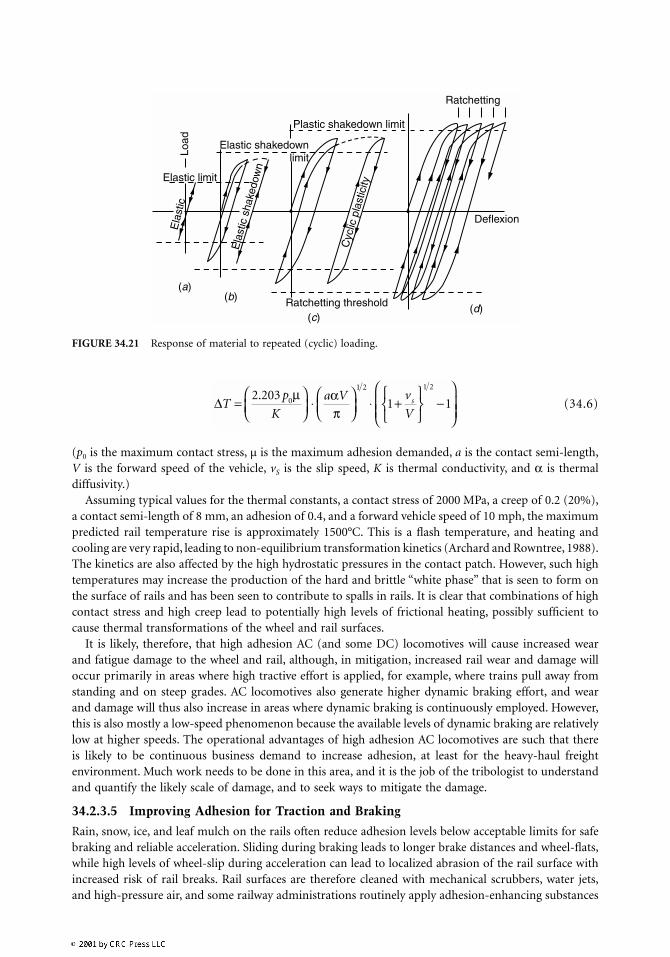
A greater problem may be increased rolling contact fatigue, manifested as cracks, spalls, and shells onthe rail surface (see Section 34.2.6). An increase in adhesion leads to an increase in the shear forces thatproduce ratcheting of the surface layers of the rail, leading to an increase in surface cracks. An additionalfactor is that, as shown in Figure 34.21, shakedown limits decrease with increased traction coefficient.Thus, a given level of contact stress is more damaging at high traction coefficients than at low coefficients.
34.2.3.4.2 Thermal Damage with High Adhesion LocomotivesA final problem is that of thermal damage to the wheel and rail surface layers. Although wear is relatedto the energy dissipated in the contact patch, most of the energy is dissipated as frictional heating. Tanvir(1980), for example, has produced explicit equations describing the temperature rise in a rail as a functionof, among other things, contact stress and creep, as have Knothe and Liebelt (1995). Equation 34.6 (Tanvir,1980) predicts rail temperature rise (∆T) for the case when the wheel is moving faster than the rail:
FIGURE 34.20 The increase in maximum locomotive adhesion demand with time, and the increased adhesionproduced by AC traction technology. (From Iden, M.E. (1998), The AC traction revolution: putting rail-wheel adhesionto work, presented to ARM Rail/Wheel Interface Seminar: Crosstalk 1998, Session 13, Chicago. With permission.)
(34.6)
(p0 is the maximum contact stress, µ is the maximum adhesion demanded, a is the contact semi-length,V is the forward speed of the vehicle, vS is the slip speed, K is thermal conductivity, and α is thermaldiffusivity.)
Assuming typical values for the thermal constants, a contact stress of 2000 MPa, a creep of 0.2 (20%),a contact semi-length of 8 mm, an adhesion of 0.4, and a forward vehicle speed of 10 mph, the maximumpredicted rail temperature rise is approximately 1500°C. This is a flash temperature, and heating andcooling are very rapid, leading to non-equilibrium transformation kinetics (Archard and Rowntree, 1988).The kinetics are also affected by the high hydrostatic pressures in the contact patch. However, such hightemperatures may increase the production of the hard and brittle “white phase” that is seen to form onthe surface of rails and has been seen to contribute to spalls in rails. It is clear that combinations of highcontact stress and high creep lead to potentially high levels of frictional heating, possibly sufficient tocause thermal transformations of the wheel and rail surfaces.
It is likely, therefore, that high adhesion AC (and some DC) locomotives will cause increased wearand fatigue damage to the wheel and rail, although, in mitigation, increased rail wear and damage willoccur primarily in areas where high tractive effort is applied, for example, where trains pull away fromstanding and on steep grades. AC locomotives also generate higher dynamic braking effort, and wearand damage will thus also increase in areas where dynamic braking is continuously employed. However,this is also mostly a low-speed phenomenon because the available levels of dynamic braking are relativelylow at higher speeds. The operational advantages of high adhesion AC locomotives are such that thereis likely to be continuous business demand to increase adhesion, at least for the heavy-haul freightenvironment. Much work needs to be done in this area, and it is the job of the tribologist to understandand quantify the likely scale of damage, and to seek ways to mitigate the damage.
34.2.3.5 Improving Adhesion for Traction and Braking
Rain, snow, ice, and leaf mulch on the rails often reduce adhesion levels below acceptable limits for safebraking and reliable acceleration. Sliding during braking leads to longer brake distances and wheel-flats,while high levels of wheel-slip during acceleration can lead to localized abrasion of the rail surface withincreased risk of rail breaks. Rail surfaces are therefore cleaned with mechanical scrubbers, water jets,and high-pressure air, and some railway administrations routinely apply adhesion-enhancing substances
FIGURE 34.21 Response of material to repeated (cyclic) loading.
Ratchetting
Deflexion
Ratchetting threshold(c)
(d)(b)
(a)
Load
Plastic shakedown limit
Elastic limitE
last
ic
Elastic shakedownlimit
Ela
stic
sha
kedo
wn
Cyc
lic p
last
icity
∆Tp
K
a V v
Vs= µ
⋅π
⋅ +
−
2 2031 10
1 2 1 2. α
such as Sandite in the U.K., during the leaf-fall season. Other railroad operators rely on substantialsanding for braking and small applications of sand to enhance adhesion during acceleration. The com-position of the sand must be monitored closely if it is not to cause damage to the wheel and rail surfaces.Light rail operations frequently rely on magnetic track brakes to guarantee stopping under adverse railsurface conditions. These devices are pressed against the rail surface using a permanent magnet or anelectromagnet, and rely on cast iron rubbing blocks to achieve high levels of friction.
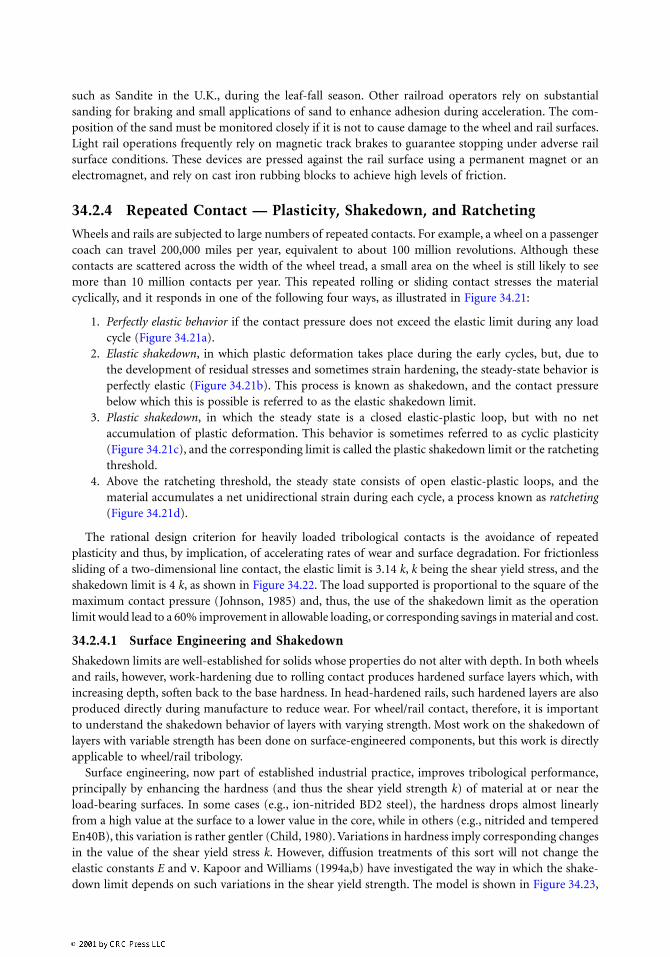
34.2.4 Repeated Contact — Plasticity, Shakedown, and Ratcheting
Wheels and rails are subjected to large numbers of repeated contacts. For example, a wheel on a passengercoach can travel 200,000 miles per year, equivalent to about 100 million revolutions. Although thesecontacts are scattered across the width of the wheel tread, a small area on the wheel is still likely to seemore than 10 million contacts per year. This repeated rolling or sliding contact stresses the materialcyclically, and it responds in one of the following four ways, as illustrated in Figure 34.21:
1. Perfectly elastic behavior if the contact pressure does not exceed the elastic limit during any loadcycle (Figure 34.21a).
2. Elastic shakedown, in which plastic deformation takes place during the early cycles, but, due tothe development of residual stresses and sometimes strain hardening, the steady-state behavior isperfectly elastic (Figure 34.21b). This process is known as shakedown, and the contact pressurebelow which this is possible is referred to as the elastic shakedown limit.
3. Plastic shakedown, in which the steady state is a closed elastic-plastic loop, but with no netaccumulation of plastic deformation. This behavior is sometimes referred to as cyclic plasticity(Figure 34.21c), and the corresponding limit is called the plastic shakedown limit or the ratchetingthreshold.
4. Above the ratcheting threshold, the steady state consists of open elastic-plastic loops, and thematerial accumulates a net unidirectional strain during each cycle, a process known as ratcheting(Figure 34.21d).
The rational design criterion for heavily loaded tribological contacts is the avoidance of repeatedplasticity and thus, by implication, of accelerating rates of wear and surface degradation. For frictionlesssliding of a two-dimensional line contact, the elastic limit is 3.14 k, k being the shear yield stress, and theshakedown limit is 4 k, as shown in Figure 34.22. The load supported is proportional to the square of themaximum contact pressure (Johnson, 1985) and, thus, the use of the shakedown limit as the operationlimit would lead to a 60% improvement in allowable loading, or corresponding savings in material and cost.
34.2.4.1 Surface Engineering and Shakedown
Shakedown limits are well-established for solids whose properties do not alter with depth. In both wheelsand rails, however, work-hardening due to rolling contact produces hardened surface layers which, withincreasing depth, soften back to the base hardness. In head-hardened rails, such hardened layers are alsoproduced directly during manufacture to reduce wear. For wheel/rail contact, therefore, it is importantto understand the shakedown behavior of layers with varying strength. Most work on the shakedown oflayers with variable strength has been done on surface-engineered components, but this work is directlyapplicable to wheel/rail tribology.
Surface engineering, now part of established industrial practice, improves tribological performance,principally by enhancing the hardness (and thus the shear yield strength k) of material at or near theload-bearing surfaces. In some cases (e.g., ion-nitrided BD2 steel), the hardness drops almost linearlyfrom a high value at the surface to a lower value in the core, while in others (e.g., nitrided and temperedEn40B), this variation is rather gentler (Child, 1980). Variations in hardness imply corresponding changesin the value of the shear yield stress k. However, diffusion treatments of this sort will not change theelastic constants E and ν. Kapoor and Williams (1994a,b) have investigated the way in which the shake-down limit depends on such variations in the shear yield strength. The model is shown in Figure 34.23,
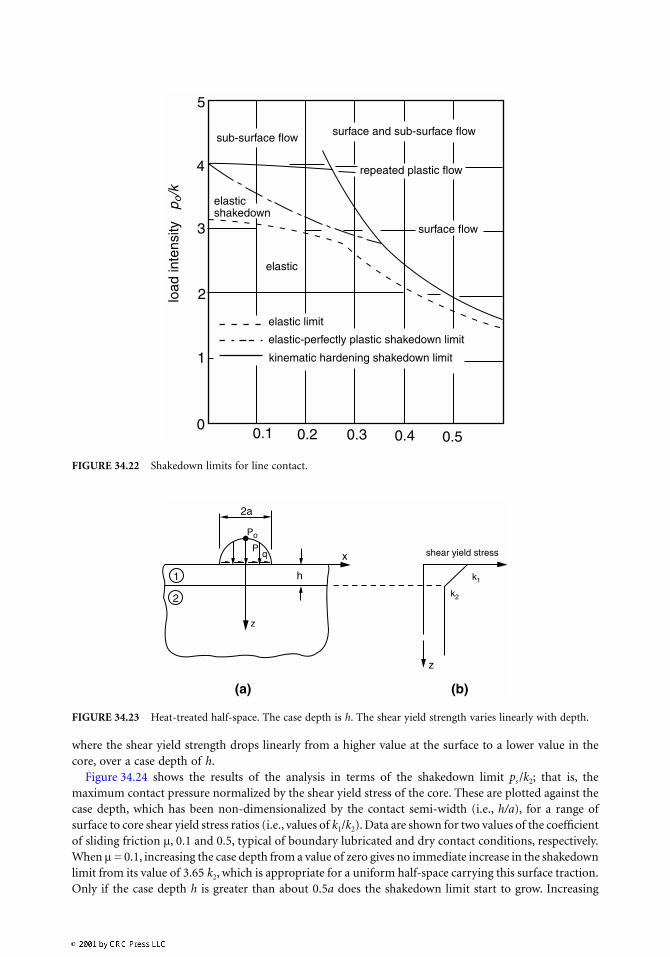
where the shear yield strength drops linearly from a higher value at the surface to a lower value in thecore, over a case depth of h.
Figure 34.24 shows the results of the analysis in terms of the shakedown limit ps /k2; that is, themaximum contact pressure normalized by the shear yield stress of the core. These are plotted against thecase depth, which has been non-dimensionalized by the contact semi-width (i.e., h/a), for a range ofsurface to core shear yield stress ratios (i.e., values of k1/k2). Data are shown for two values of the coefficientof sliding friction µ, 0.1 and 0.5, typical of boundary lubricated and dry contact conditions, respectively.When µ = 0.1, increasing the case depth from a value of zero gives no immediate increase in the shakedownlimit from its value of 3.65 k2, which is appropriate for a uniform half-space carrying this surface traction.Only if the case depth h is greater than about 0.5a does the shakedown limit start to grow. Increasing
FIGURE 34.22 Shakedown limits for line contact.
FIGURE 34.23 Heat-treated half-space. The case depth is h. The shear yield strength varies linearly with depth.
00.1 0.2 0.3 0.4 0.5
5
4
3
2
1
sub-surface flow surface and sub-surface flow
repeated plastic flow
surface flow
elastic
elastic limit
elastic-perfectly plastic shakedown limit
elasticshakedown
kinematic hardening shakedown limit
load
inte
nsity
p o
/k
1
2
h
z
x shear yield stress
z
Po
2a
Pq
k1
k2
(a) (b)
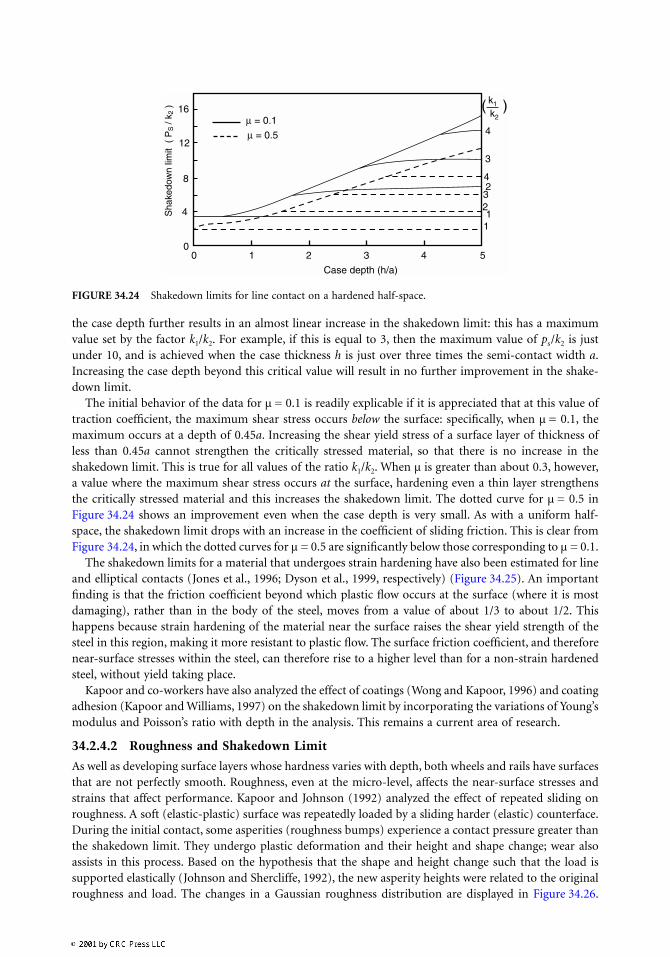
the case depth further results in an almost linear increase in the shakedown limit: this has a maximumvalue set by the factor k1/k2. For example, if this is equal to 3, then the maximum value of ps/k2 is justunder 10, and is achieved when the case thickness h is just over three times the semi-contact width a.Increasing the case depth beyond this critical value will result in no further improvement in the shake-down limit.
The initial behavior of the data for µ = 0.1 is readily explicable if it is appreciated that at this value oftraction coefficient, the maximum shear stress occurs below the surface: specifically, when µ = 0.1, themaximum occurs at a depth of 0.45a. Increasing the shear yield stress of a surface layer of thickness ofless than 0.45a cannot strengthen the critically stressed material, so that there is no increase in theshakedown limit. This is true for all values of the ratio k1/k2. When µ is greater than about 0.3, however,a value where the maximum shear stress occurs at the surface, hardening even a thin layer strengthensthe critically stressed material and this increases the shakedown limit. The dotted curve for µ = 0.5 inFigure 34.24 shows an improvement even when the case depth is very small. As with a uniform half-space, the shakedown limit drops with an increase in the coefficient of sliding friction. This is clear fromFigure 34.24, in which the dotted curves for µ = 0.5 are significantly below those corresponding to µ = 0.1.
The shakedown limits for a material that undergoes strain hardening have also been estimated for lineand elliptical contacts (Jones et al., 1996; Dyson et al., 1999, respectively) (Figure 34.25). An importantfinding is that the friction coefficient beyond which plastic flow occurs at the surface (where it is mostdamaging), rather than in the body of the steel, moves from a value of about 1/3 to about 1/2. Thishappens because strain hardening of the material near the surface raises the shear yield strength of thesteel in this region, making it more resistant to plastic flow. The surface friction coefficient, and thereforenear-surface stresses within the steel, can therefore rise to a higher level than for a non-strain hardenedsteel, without yield taking place.
Kapoor and co-workers have also analyzed the effect of coatings (Wong and Kapoor, 1996) and coatingadhesion (Kapoor and Williams, 1997) on the shakedown limit by incorporating the variations of Young’smodulus and Poisson’s ratio with depth in the analysis. This remains a current area of research.
34.2.4.2 Roughness and Shakedown Limit
As well as developing surface layers whose hardness varies with depth, both wheels and rails have surfacesthat are not perfectly smooth. Roughness, even at the micro-level, affects the near-surface stresses andstrains that affect performance. Kapoor and Johnson (1992) analyzed the effect of repeated sliding onroughness. A soft (elastic-plastic) surface was repeatedly loaded by a sliding harder (elastic) counterface.During the initial contact, some asperities (roughness bumps) experience a contact pressure greater thanthe shakedown limit. They undergo plastic deformation and their height and shape change; wear alsoassists in this process. Based on the hypothesis that the shape and height change such that the load issupported elastically (Johnson and Shercliffe, 1992), the new asperity heights were related to the originalroughness and load. The changes in a Gaussian roughness distribution are displayed in Figure 34.26.
FIGURE 34.24 Shakedown limits for line contact on a hardened half-space.
µ = 0.1
µ = 0.5
16
12
8
4
00 1 2 3 4 5
Case depth (h/a)
4
3
3
42
211
k2
k1( )
Sha
kedo
wn
limit
( P
S /
k 2 )

FIGURE 34.25 Shakedown limits for a line contact: perfectly plastic material (dashed line) strain hardening material(solid line).
FIGURE 34.26 Modification of Gaussian distribution of asperity heights.
(R1C/σ) <0.1 = 1 <0.1 =1 <0.1 =1
99.9
99
90
50
10
1
0.1
-2 0 2
Modification of asperity heightsOriginal distribution (Gaussian)Modified distribution for R1/R2 = 2
Modified distribution for R1/R2 = 0.5Modified distribution for R1/R2 = 1
(z/σ) or (y/σ)
Cu
mu
lati
ve P
rob
abili
ty D
ensi
ty
Here, σ is the rms roughness and R1 and R2 refer to the radius of curvature of asperities of the hard andsoft surfaces, respectively. The value of C is given as:
(34.7)
where E*, the equivalent elastic modulus of the two surfaces, is given as:
(34.8)
E is the Young’s modulus, υ is the Poisson’s ratio, and subscripts 1 and 2 refer to the hard and softsurfaces, respectively.
In this diagram, the un-deformed Gaussian distribution appears as a straight line. As expected, thevariance in height of the deformed asperities is much reduced and the distribution is bounded. As thenominal pressure increases, the deformed distributions move to the left, showing that more asperitiesget plastically deformed. For a particular nominal pressure, the smaller the value of (R1C/σ), the steeperthe distribution, showing formation of plateaux. This can occur because of a low value of hardness or ahigh value of E* or σ.
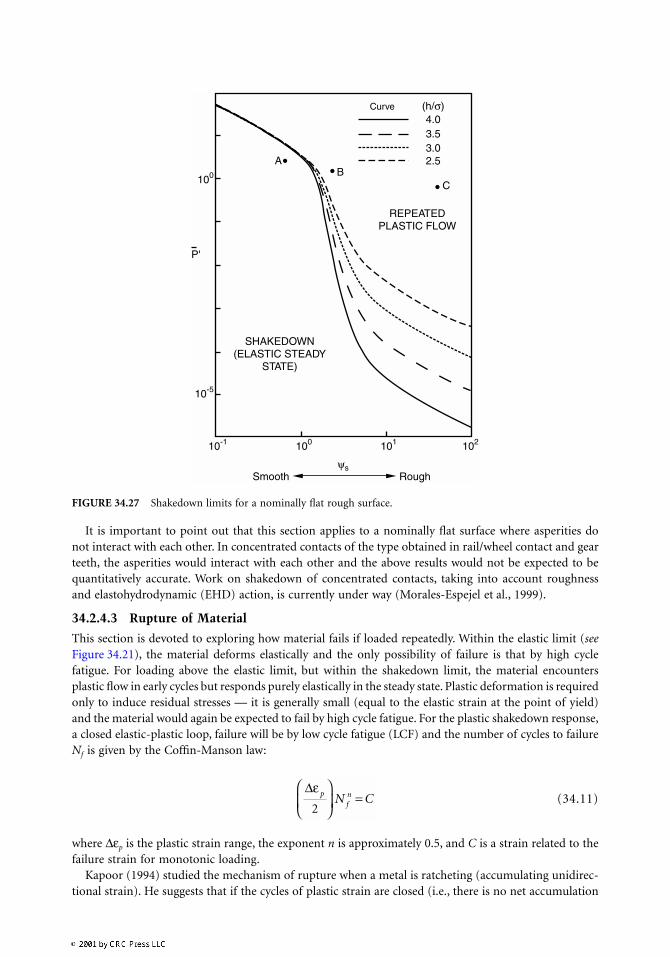
Kapoor et al. (1994) estimated the load carried in the shakedown state of a hard and a soft surface inrepeated sliding by conjecturing that the maximum load is carried when the softer surface has beencompletely flattened. The peak height distribution of the hard surface was assumed Gaussian, but limitedby a critical cut-off height. The maximum load for an elastic steady state was worked out by setting thecontact pressure at the tallest asperity to the shakedown limit, and summing the loads for all asperities.The shakedown limits for a surface having longish (two-dimensional) asperities are plotted inFigure 34.27, for many values of the cut-off limit h. The non-dimensional nominal pressure at shakedownis given as:
(34.9)
Here, Ps is the nominal pressure, ps the shakedown limit for the softer surface, N the asperity density, R1
the radius of curvature of hard asperities, and σ1 the rms roughness for the hard surface. It is a functionof the plasticity index in repeated sliding, given by:
(34.10)
Note that it is similar in form to the Greenwood and Williamson (1966) plasticity index, which is ameasure of the fraction of contacting asperities that are plastically deformed in static first loading. Theplasticity index in repeated sliding is different in two major ways. First, in the expression for ψs, theshakedown pressure replaces the indentation hardness H to account for sliding. Second, the values ofradius and rms roughness are those for the hard surface and not the combined values for both thesurfaces. This shows that it is the hardness of the softer surface and the roughness of the harder surfacethat govern the shakedown limit. An increase in the value of ψs from 1 to 10 leads to a decrease in thesafe nominal pressure by many orders of magnitude. The importance of the cut-off limit (i.e., the heightof the tallest hard asperity) for high values of ψs, is visible in the plots.
Cp
E
E
ps
s
=
−
*
ln*
2
2 4 1
EE E
* =−( )
+−( )
−1 11
2
1
22
2
1
υ υ
PP p
NRs
s s=( )( )1 1σ
ψ σs
s
E
p R=
* 1
1
It is important to point out that this section applies to a nominally flat surface where asperities donot interact with each other. In concentrated contacts of the type obtained in rail/wheel contact and gearteeth, the asperities would interact with each other and the above results would not be expected to bequantitatively accurate. Work on shakedown of concentrated contacts, taking into account roughnessand elastohydrodynamic (EHD) action, is currently under way (Morales-Espejel et al., 1999).
34.2.4.3 Rupture of Material
This section is devoted to exploring how material fails if loaded repeatedly. Within the elastic limit (seeFigure 34.21), the material deforms elastically and the only possibility of failure is that by high cyclefatigue. For loading above the elastic limit, but within the shakedown limit, the material encountersplastic flow in early cycles but responds purely elastically in the steady state. Plastic deformation is requiredonly to induce residual stresses — it is generally small (equal to the elastic strain at the point of yield)and the material would again be expected to fail by high cycle fatigue. For the plastic shakedown response,a closed elastic-plastic loop, failure will be by low cycle fatigue (LCF) and the number of cycles to failureNf is given by the Coffin-Manson law:
(34.11)
where ∆εp is the plastic strain range, the exponent n is approximately 0.5, and C is a strain related to thefailure strain for monotonic loading.
Kapoor (1994) studied the mechanism of rupture when a metal is ratcheting (accumulating unidirec-tional strain). He suggests that if the cycles of plastic strain are closed (i.e., there is no net accumulation
FIGURE 34.27 Shakedown limits for a nominally flat rough surface.
Curve (h/σ)4.03.53.02.5
100
P'
10-5
10-1 100 101 102
SHAKEDOWN(ELASTIC STEADY
STATE)
REPEATEDPLASTIC FLOW
Smooth Roughψs
AB
C
∆ε pfnN C
2
=
of strain), the material will fail by conventional low cycle fatigue. However, if the cycles of plastic strainare open, such that the material accumulates plastic deformation with each cycle, then a different typeof failure, termed “ratcheting failure,” is possible. It occurs when the accumulated strain reaches a criticalvalue, εc, which is comparable to the failure strain for monotonic loading. For a ratcheting strain percycle of ∆εr, the number of cycles to failure, Nr, is given by:
(34.12)
Kapoor also suggests that LCF and RF (ratcheting failure) are competitive such that whichever corre-sponds to earlier failure governs the life of the specimen*; that is,
(34.13)
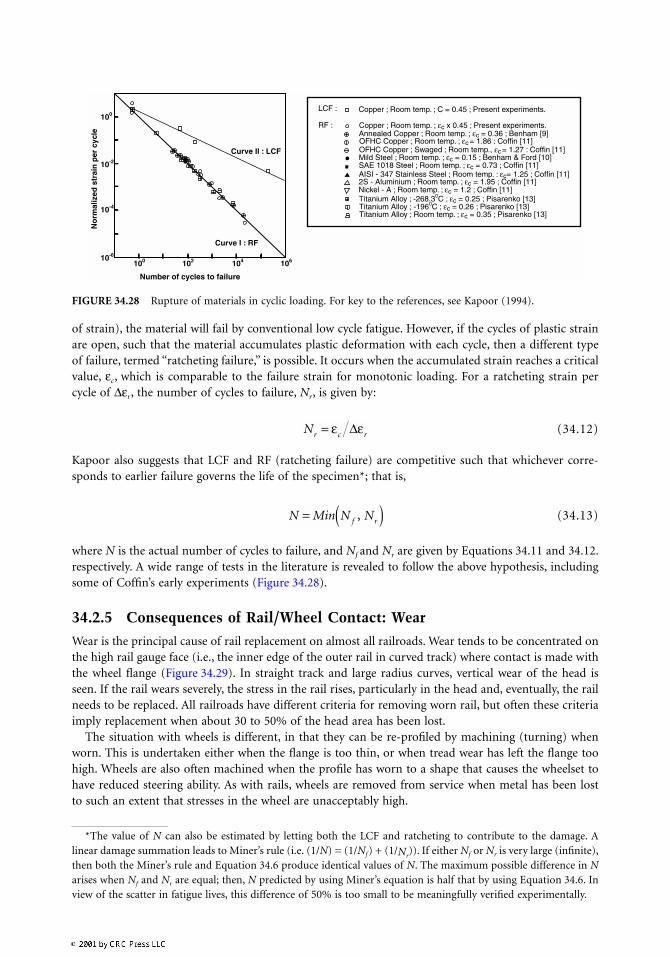
where N is the actual number of cycles to failure, and Nf and Nr are given by Equations 34.11 and 34.12.respectively. A wide range of tests in the literature is revealed to follow the above hypothesis, includingsome of Coffin’s early experiments (Figure 34.28).
34.2.5 Consequences of Rail/Wheel Contact: Wear
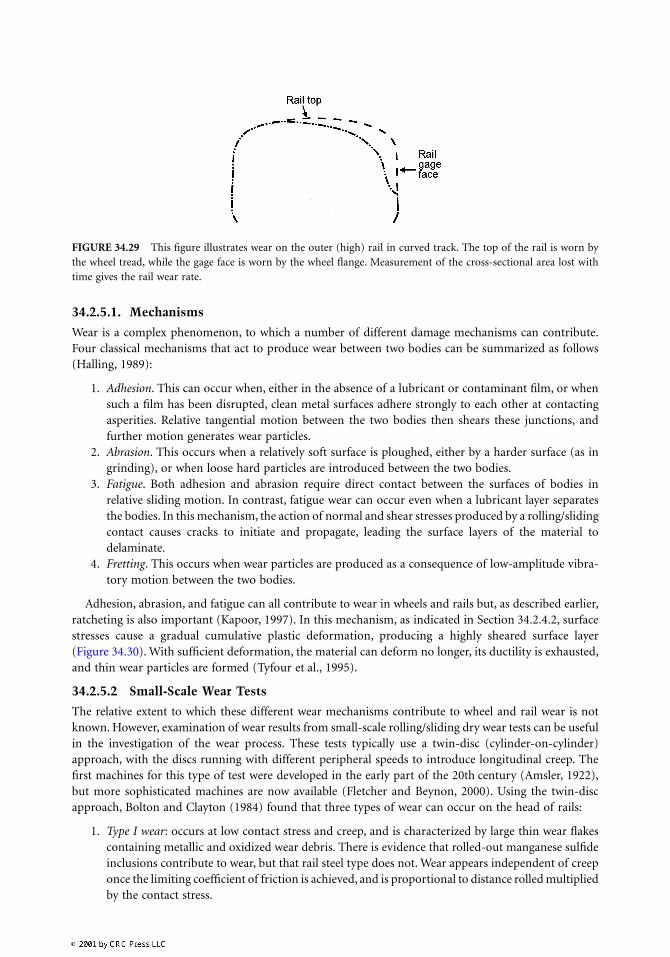
Wear is the principal cause of rail replacement on almost all railroads. Wear tends to be concentrated onthe high rail gauge face (i.e., the inner edge of the outer rail in curved track) where contact is made withthe wheel flange (Figure 34.29). In straight track and large radius curves, vertical wear of the head isseen. If the rail wears severely, the stress in the rail rises, particularly in the head and, eventually, the railneeds to be replaced. All railroads have different criteria for removing worn rail, but often these criteriaimply replacement when about 30 to 50% of the head area has been lost.
The situation with wheels is different, in that they can be re-profiled by machining (turning) whenworn. This is undertaken either when the flange is too thin, or when tread wear has left the flange toohigh. Wheels are also often machined when the profile has worn to a shape that causes the wheelset tohave reduced steering ability. As with rails, wheels are removed from service when metal has been lostto such an extent that stresses in the wheel are unacceptably high.
FIGURE 34.28 Rupture of materials in cyclic loading. For key to the references, see Kapoor (1994).
*The value of N can also be estimated by letting both the LCF and ratcheting to contribute to the damage. Alinear damage summation leads to Miner’s rule (i.e. (1/N) = (1/Nf) + (1/Nr
)). If either Nf or Nr is very large (infinite),then both the Miner’s rule and Equation 34.6 produce identical values of N. The maximum possible difference in Narises when Nf and Nr are equal; then, N predicted by using Miner’s equation is half that by using Equation 34.6. Inview of the scatter in fatigue lives, this difference of 50% is too small to be meaningfully verified experimentally.
LCF :
RF :
Copper ; Room temp. ; C = 0.45 ; Present experiments.
Copper ; Room temp. ; εc x 0.45 ; Present experiments.Annealed Copper ; Room temp. ; εc = 0.36 ; Benham [9]
Mild Steel ; Room temp. ; εc = 0.15 ; Benham & Ford [10] SAE 1018 Steel ; Room temp. ; εc = 0.73 ; Coffin [11] AISI - 347 Stainless Steel ; Room temp. : εc= 1.25 ; Coffin [11]2S - Aluminium ; Room temp. ; εc = 1.95 ; Coffin [11] Nickel - A ; Room temp. ; εc = 1.2 ; Coffin [11] Titanium Alloy ; -268.30C ; εc = 0.25 ; Pisarenko [13] Titanium Alloy ; -1960C ; εc = 0.26 ; Pisarenko [13] Titanium Alloy ; Room temp. ; εc = 0.35 ; Pisarenko [13]
10-2
10-4
10-6
100 102 104 106
100
Curve I : RF
Curve II : LCF
Number of cycles to failure
OFHC Copper ; Room temp. ; εc = 1.86 : Coffin [11]OFHC Copper ; Swaged ; Room temp., εc = 1.27 : Coffin [11]
No
rmal
ized
str
ain
per
cyc
le
Nr c r= ε ε∆
N Min N Nf r= ( ),
34.2.5.1. Mechanisms
Wear is a complex phenomenon, to which a number of different damage mechanisms can contribute.Four classical mechanisms that act to produce wear between two bodies can be summarized as follows(Halling, 1989):
1. Adhesion. This can occur when, either in the absence of a lubricant or contaminant film, or whensuch a film has been disrupted, clean metal surfaces adhere strongly to each other at contactingasperities. Relative tangential motion between the two bodies then shears these junctions, andfurther motion generates wear particles.
2. Abrasion. This occurs when a relatively soft surface is ploughed, either by a harder surface (as ingrinding), or when loose hard particles are introduced between the two bodies.
3. Fatigue. Both adhesion and abrasion require direct contact between the surfaces of bodies inrelative sliding motion. In contrast, fatigue wear can occur even when a lubricant layer separatesthe bodies. In this mechanism, the action of normal and shear stresses produced by a rolling/slidingcontact causes cracks to initiate and propagate, leading the surface layers of the material todelaminate.
4. Fretting. This occurs when wear particles are produced as a consequence of low-amplitude vibra-tory motion between the two bodies.
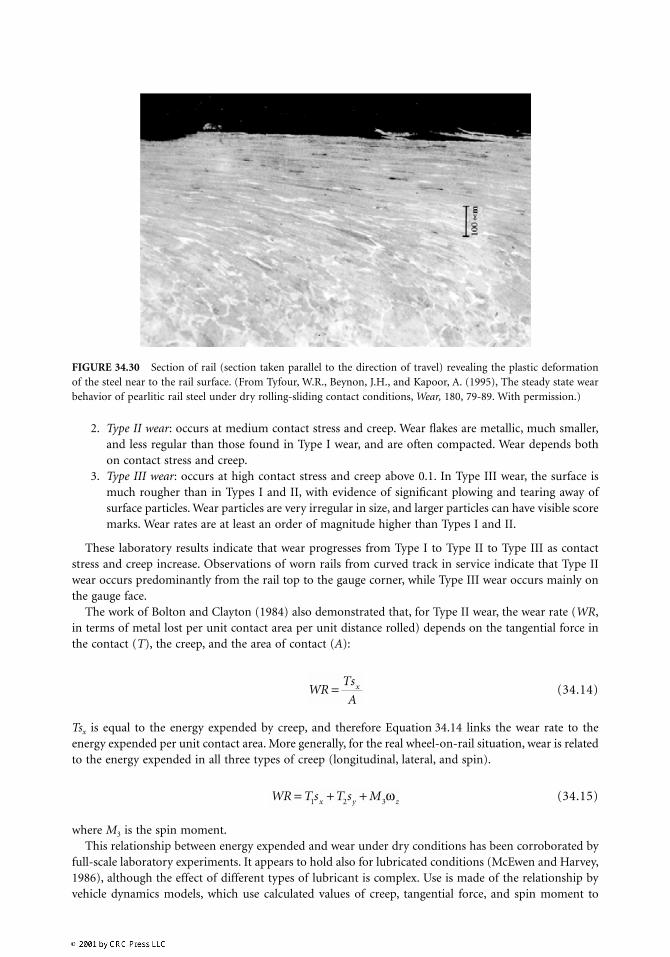
Adhesion, abrasion, and fatigue can all contribute to wear in wheels and rails but, as described earlier,ratcheting is also important (Kapoor, 1997). In this mechanism, as indicated in Section 34.2.4.2, surfacestresses cause a gradual cumulative plastic deformation, producing a highly sheared surface layer(Figure 34.30). With sufficient deformation, the material can deform no longer, its ductility is exhausted,and thin wear particles are formed (Tyfour et al., 1995).
34.2.5.2 Small-Scale Wear Tests
The relative extent to which these different wear mechanisms contribute to wheel and rail wear is notknown. However, examination of wear results from small-scale rolling/sliding dry wear tests can be usefulin the investigation of the wear process. These tests typically use a twin-disc (cylinder-on-cylinder)approach, with the discs running with different peripheral speeds to introduce longitudinal creep. Thefirst machines for this type of test were developed in the early part of the 20th century (Amsler, 1922),but more sophisticated machines are now available (Fletcher and Beynon, 2000). Using the twin-discapproach, Bolton and Clayton (1984) found that three types of wear can occur on the head of rails:
1. Type I wear: occurs at low contact stress and creep, and is characterized by large thin wear flakescontaining metallic and oxidized wear debris. There is evidence that rolled-out manganese sulfideinclusions contribute to wear, but that rail steel type does not. Wear appears independent of creeponce the limiting coefficient of friction is achieved, and is proportional to distance rolled multipliedby the contact stress.
FIGURE 34.29 This figure illustrates wear on the outer (high) rail in curved track. The top of the rail is worn bythe wheel tread, while the gage face is worn by the wheel flange. Measurement of the cross-sectional area lost withtime gives the rail wear rate.
2. Type II wear: occurs at medium contact stress and creep. Wear flakes are metallic, much smaller,and less regular than those found in Type I wear, and are often compacted. Wear depends bothon contact stress and creep.
3. Type III wear: occurs at high contact stress and creep above 0.1. In Type III wear, the surface ismuch rougher than in Types I and II, with evidence of significant plowing and tearing away ofsurface particles. Wear particles are very irregular in size, and larger particles can have visible scoremarks. Wear rates are at least an order of magnitude higher than Types I and II.
These laboratory results indicate that wear progresses from Type I to Type II to Type III as contactstress and creep increase. Observations of worn rails from curved track in service indicate that Type IIwear occurs predominantly from the rail top to the gauge corner, while Type III wear occurs mainly onthe gauge face.
The work of Bolton and Clayton (1984) also demonstrated that, for Type II wear, the wear rate (WR,in terms of metal lost per unit contact area per unit distance rolled) depends on the tangential force inthe contact (T), the creep, and the area of contact (A):
(34.14)
Tsx is equal to the energy expended by creep, and therefore Equation 34.14 links the wear rate to theenergy expended per unit contact area. More generally, for the real wheel-on-rail situation, wear is relatedto the energy expended in all three types of creep (longitudinal, lateral, and spin).
(34.15)
where M3 is the spin moment.This relationship between energy expended and wear under dry conditions has been corroborated by
full-scale laboratory experiments. It appears to hold also for lubricated conditions (McEwen and Harvey,1986), although the effect of different types of lubricant is complex. Use is made of the relationship byvehicle dynamics models, which use calculated values of creep, tangential force, and spin moment to
FIGURE 34.30 Section of rail (section taken parallel to the direction of travel) revealing the plastic deformationof the steel near to the rail surface. (From Tyfour, W.R., Beynon, J.H., and Kapoor, A. (1995), The steady state wearbehavior of pearlitic rail steel under dry rolling-sliding contact conditions, Wear, 180, 79-89. With permission.)
WRTs
Ax=
WR T s T s Mx y z= + +1 2 3ω
determine the energy expended in wheel/rail contact and thus to estimate wheel and rail wear duringvehicle-track simulation studies (Wilson et al., 1995). However, an exception to the relationship betweenenergy input to the contact and the wear rate is when wear is caused by a ratcheting mechanism (Kapoor,1997). Tyfour and Beynon (1994) found that reversing the rolling direction of the rail disc during a twin-disc contact simulation significantly reduced the wear rate of the rail steel, although the rate of energyinput to the disc was unaffected by the rolling direction reversal.*
Principal implications for the wheel/rail system found from small-scale laboratory wear tests are:
1. In dry wear, for a given hardness value, pearlitic steels offer much better wear resistance thanbainitic or martensitic steels. The reason for this is not known, but it may be related to the carbide-enriched, highly sheared hard surface layer formed on pearlitic steels during wear (refer toFigure 34.30). This layer can reach twice the hardness of the bulk material (Laufer, 1986). Bainiticand martensitic steels usually have much lower carbon contents. Although they form a highlysheared surface, they do not provide the same level of carbide enrichment nor the same hardnessincrease as pearlitic steels.
2. For pearlitic steel, increasing the carbon content, and hence increasing the hardness and the volumefraction of lamellar carbide, reduces the wear rate.
3. Refining the lamellar spacing of pearlite, either by alloying or by the more usual head-hardeningprocess (Bramfitt et al., 1994), increases hardness and reduces wear. This is possibly due to therelationship between carbide lamella thickness and brittleness (Langford, 1977). Above a thicknessof about 0.1 micron, lamellar carbides are more likely to fracture than deform, while the reverseis true at less than about 0.01 micron thickness. Thus, pearlite refinement may inhibit carbidefracture at the wear surface and hence reduce wear.
4. For all steels, liquid or dry lubrication dramatically reduces wear.5. Small-scale dry wear tests rank materials in order of their performance in service.
Thus, small-scale (generally cylinder-on-cylinder) laboratory wear tests are useful in characterizingservice wear performance. A problem, however, is that such tests rarely replicate the contact conditionsfound in service. For example, to duplicate the type of severe wear seen on a rail gauge face, small-scaletests are usually performed at relatively low contact stress (of the order of 1000 to 1500 MPa) and highcreep (above 0.1). In contrast, calculated rail contact stresses can easily reach 3000 MPa on the gaugeface, with associated creepage of about 0.01. It may be that the requirement to use such large creep valuesin small-scale tests is related to surface roughness of the specimens. Small-scale specimens tested at highcreep rapidly develop highly deformed and rough surfaces, which will give local contact stresses signif-icantly higher than the nominal contact stress. Thus, use of high values of creep may produce local stressesapproaching those seen in rail/wheel contacts in service, which would otherwise be difficult to generateon small-scale wear testing machines.
34.2.5.3 Service Wear Tests
Factors that affect the wear of wheels and rails include rail and wheel metallurgy, the fastenings used toconnect the rail to the sleepers or concrete slab, the curvature of the track, the wheel and rail profiles,the type and quantity of lubricant used, and the climate. The characteristics of the vehicles passing overthe rails are also important. Curving ability is improved when the wheelsets in the bogie are able to takeup a radial alignment in curves. Low-speed freight bogies tend to have suspensions with low axle yawstiffness. This allows the wheelsets to take up a radial position more easily, thereby reducing wheel andrail wear. In contrast, to give better high-speed performance, passenger bogies have high yaw stiffness,which leads to poorer curving performance and higher wear. Because of the difficulty in controlling allthese parameters in service experiments, in most cases measurements of wear in service are undertakento quantify performance and the effect of lubrication rather than to identify wear processes or mechanisms.
*It has not yet been possible to confirm whether rails on bi-directionally used railway track (e.g., on single trackrailways) last longer than rails on uni-directionally used tracks.
The usual method of characterizing wear is by measuring the amount of metal lost from the wheel orrail as a function of mileage or tonnage increases respectively (tonnage is expressed in units of milliongross tonnes, MGT, an accumulated total of the loads which have passed over the rail). For wheels,measurements are focused on the flange, which wears in sharp curves (less than about 500 m radius forheavy-haul traffic), and the tread (which tends to wear more in less-curved track). For rails, measurementsare made of total height loss, and loss of metal at the gauge face which, as with the wheel flange, tendsto be more pronounced at track radii less than about 500 to 1000 m radius.
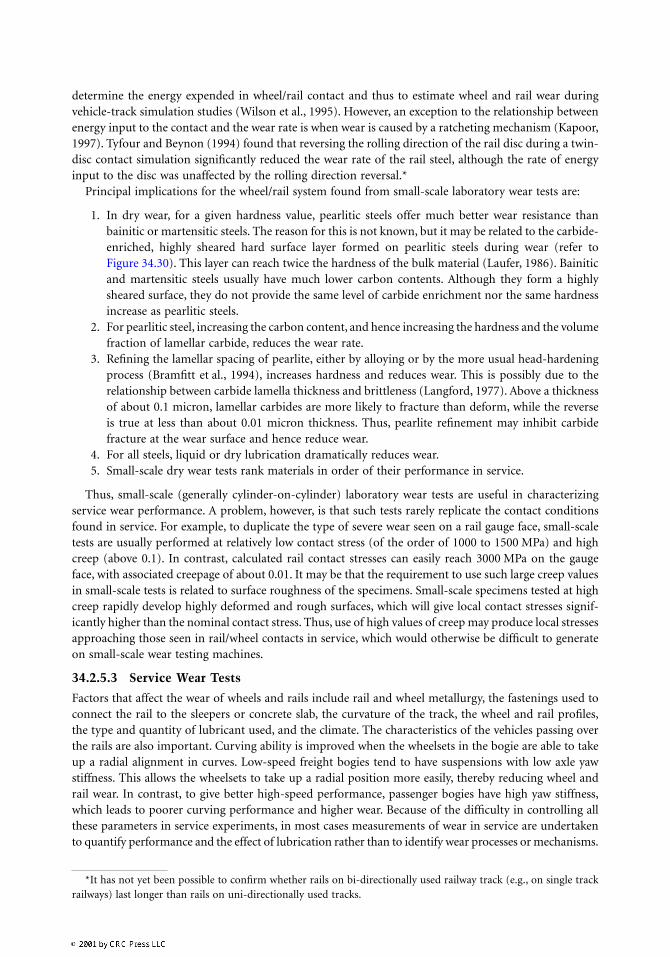
Wear can also be measured as the total loss of cross-section, using proprietary profile measuringequipment. An example of wear measurements on a rail is given in Figure 34.29, which illustrates thechange in cross-section of a rail on the high side of a curve (the high side of a curve is the outer, orlonger side). The wear on the gauge face is caused by contact with the wheel flange. Figure 34.31 givesan example of how the type of measurement shown in Figure 34.29 can be used to determine the effectof accumulated tonnage and lubrication on rail wear. The two head-hardened pearlitic rails were installedon the high side of a 350 m radius curve in the Facility for Accelerated Service Testing at the TransportationTechnology Center, Colorado, U.S. The rails had seen 205 MGT of heavy axle load (36 tonnes) traffic.Light grease lubrication was applied for the first 167 MGT to give a measured friction of 0.35 to 0.4,while the rail was run dry for the final 38 MGT at a friction level of 0.5 to 0.55. The complex effect oflubrication on wear can be seen. Moving from a friction of 0.35/0.4 to 0.5/0.55 gives a rapid increase inwear rate, but the dry wear rate decreases as wear progresses, possibly as a consequence of the alteredvehicle steering forces produced by the increase in friction.
Service measurements broadly confirm the results of small-scale tests; however, additional factors affectservice tests that are difficult to replicate in a small-scale test. The effects of the climate on wheel wearwere investigated by Kalousek et al. (1996), and a strong correlation was found between the number ofwheels removed from service due to excessive wear and the time of year. It was found that there wasinteraction between the performance and life of the brake shoes used on the train, wheel wear, andcontact fatigue of the wheel surface, and that these were linked to the variation with the seasons of thetime for which the rails were dry or wet. The underlying mechanism controlling these processes wasfound to be controlled by friction levels at the wheel/rail contact, which is partially dependent on thepresence of water on the rail and wheel surfaces.
This effect of lubrication on wheel and rail wear has been known for many years. Under dry conditions,wear is reduced by increased hardness; but when lubrication is applied, wheel and rail metallurgy havemuch less of an effect. Thus, Steele and Devine (1982) observed that while a 320 Brinell rail steel wore
FIGURE 34.31 The effect of accumulated traffic (million gross tons) on the rail cross-section caused by wear (referto Figure 34.29).
a factor of six times as fast as a 399 Brinell rail under dry conditions, when grease lubrication was appliedthe factor was only 2.
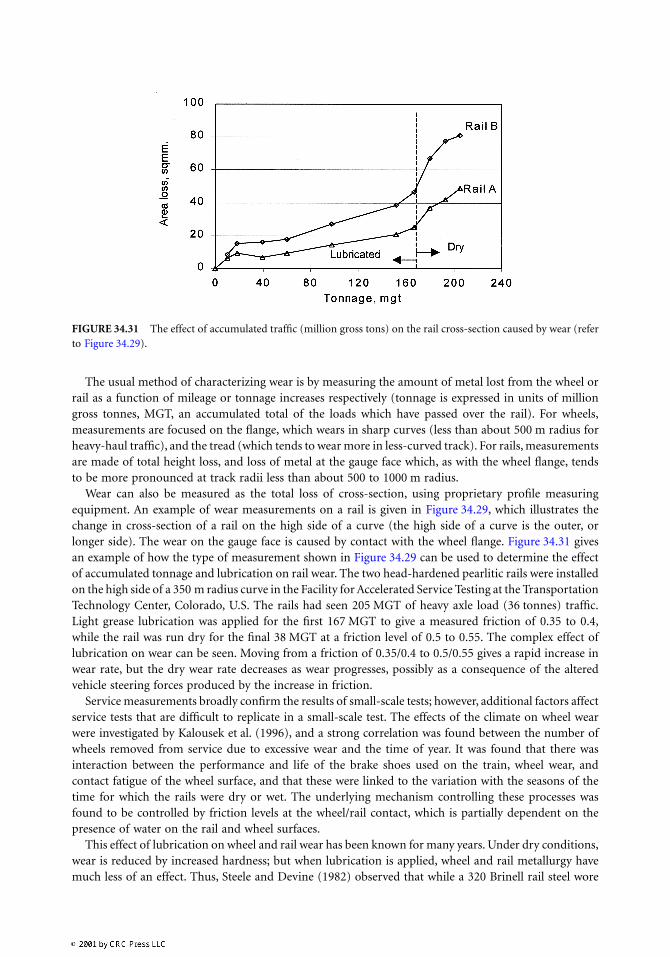
In service tests, good grease lubrication has been shown to have the potential to reduce wheel and railwear by at least a factor of 20. Attention is usually focused on lubricating the high rail gauge face in curves,because the rail gauge face is a major wear area. Lubrication applied to the gauge face also protects thewheel flange. The low rail in curves tends only to be lubricated after rail grinding, to reduce lateral forcesin curves rather than to reduce wear. While systems are available to lubricate the wheel flange directlyfrom nozzles attached to the vehicle (Figure 34.32), most railroads concentrate on lubricating the track.Methods include hand application (in unusual or difficult circumstances), vehicle-mounted lubricators,and trackside lubricators where each wheel that passes pumps grease to a spreader bar mounted at thegauge face of the high rail (Figure 34.33). This latter method is preferred, typically using grease containingmineral or synthetic oil, soap, and boundary lubricants such as graphite and molybdenum disulfide.Lubrication effectiveness, however, depends critically on the positioning and maintenance of the lubrica-tors. Reiff and Cregger (1999) summarize the North American systems approach to wheel/rail frictioncontrol, and illustrate the fuel savings also achievable by good lubrication of the wheel/rail interface.
Other methods of lubrication have been put forward recently, and these are discussed later.
34.2.6 Consequences of Rail/Wheel Contact: Rolling Contact Fatigue
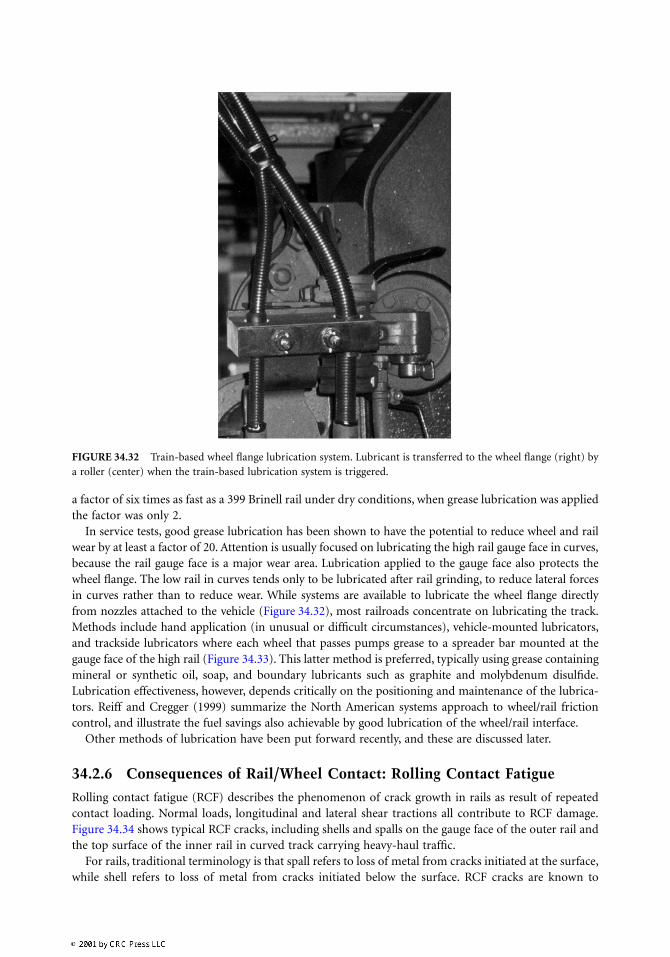
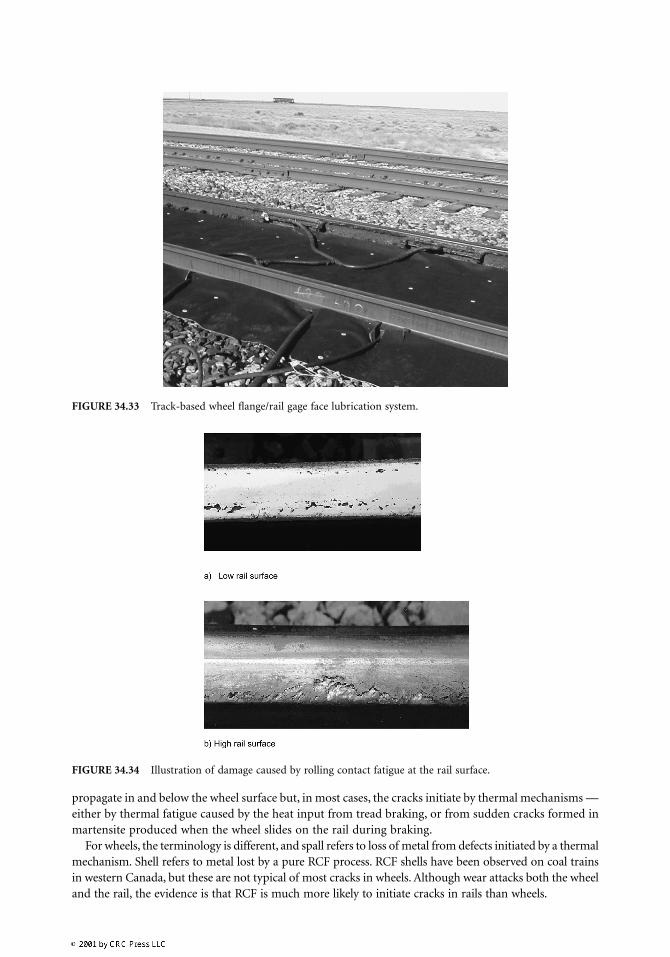
Rolling contact fatigue (RCF) describes the phenomenon of crack growth in rails as result of repeatedcontact loading. Normal loads, longitudinal and lateral shear tractions all contribute to RCF damage.Figure 34.34 shows typical RCF cracks, including shells and spalls on the gauge face of the outer rail andthe top surface of the inner rail in curved track carrying heavy-haul traffic.
For rails, traditional terminology is that spall refers to loss of metal from cracks initiated at the surface,while shell refers to loss of metal from cracks initiated below the surface. RCF cracks are known to
FIGURE 34.32 Train-based wheel flange lubrication system. Lubricant is transferred to the wheel flange (right) bya roller (center) when the train-based lubrication system is triggered.
propagate in and below the wheel surface but, in most cases, the cracks initiate by thermal mechanisms —either by thermal fatigue caused by the heat input from tread braking, or from sudden cracks formed inmartensite produced when the wheel slides on the rail during braking.
For wheels, the terminology is different, and spall refers to loss of metal from defects initiated by a thermalmechanism. Shell refers to metal lost by a pure RCF process. RCF shells have been observed on coal trainsin western Canada, but these are not typical of most cracks in wheels. Although wear attacks both the wheeland the rail, the evidence is that RCF is much more likely to initiate cracks in rails than wheels.
FIGURE 34.33 Track-based wheel flange/rail gage face lubrication system.
FIGURE 34.34 Illustration of damage caused by rolling contact fatigue at the rail surface.
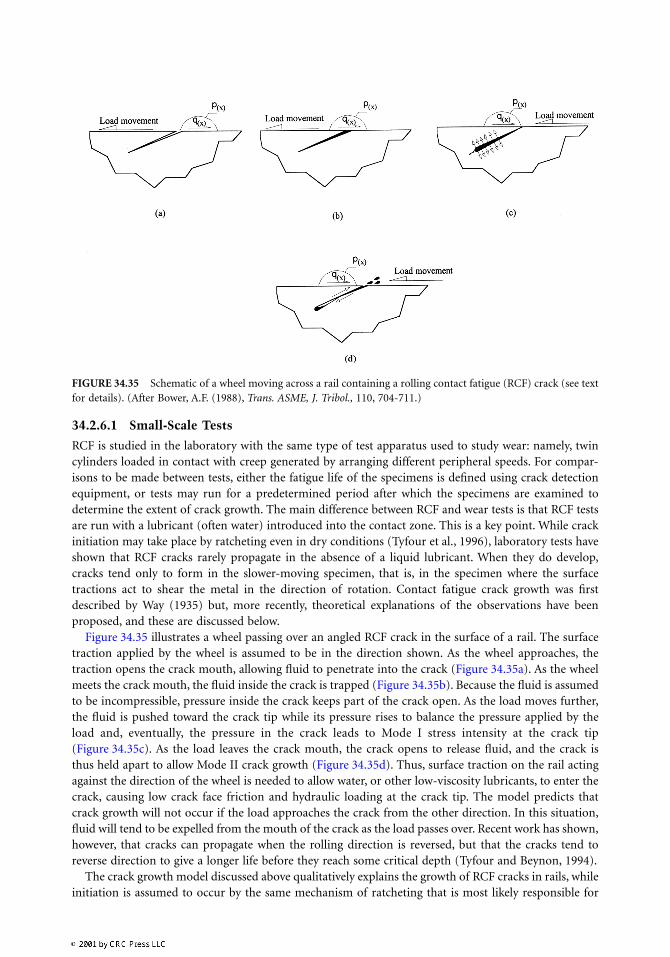
34.2.6.1 Small-Scale Tests
RCF is studied in the laboratory with the same type of test apparatus used to study wear: namely, twincylinders loaded in contact with creep generated by arranging different peripheral speeds. For compar-isons to be made between tests, either the fatigue life of the specimens is defined using crack detectionequipment, or tests may run for a predetermined period after which the specimens are examined todetermine the extent of crack growth. The main difference between RCF and wear tests is that RCF testsare run with a lubricant (often water) introduced into the contact zone. This is a key point. While crackinitiation may take place by ratcheting even in dry conditions (Tyfour et al., 1996), laboratory tests haveshown that RCF cracks rarely propagate in the absence of a liquid lubricant. When they do develop,cracks tend only to form in the slower-moving specimen, that is, in the specimen where the surfacetractions act to shear the metal in the direction of rotation. Contact fatigue crack growth was firstdescribed by Way (1935) but, more recently, theoretical explanations of the observations have beenproposed, and these are discussed below.
Figure 34.35 illustrates a wheel passing over an angled RCF crack in the surface of a rail. The surfacetraction applied by the wheel is assumed to be in the direction shown. As the wheel approaches, thetraction opens the crack mouth, allowing fluid to penetrate into the crack (Figure 34.35a). As the wheelmeets the crack mouth, the fluid inside the crack is trapped (Figure 34.35b). Because the fluid is assumedto be incompressible, pressure inside the crack keeps part of the crack open. As the load moves further,the fluid is pushed toward the crack tip while its pressure rises to balance the pressure applied by theload and, eventually, the pressure in the crack leads to Mode I stress intensity at the crack tip(Figure 34.35c). As the load leaves the crack mouth, the crack opens to release fluid, and the crack isthus held apart to allow Mode II crack growth (Figure 34.35d). Thus, surface traction on the rail actingagainst the direction of the wheel is needed to allow water, or other low-viscosity lubricants, to enter thecrack, causing low crack face friction and hydraulic loading at the crack tip. The model predicts thatcrack growth will not occur if the load approaches the crack from the other direction. In this situation,fluid will tend to be expelled from the mouth of the crack as the load passes over. Recent work has shown,however, that cracks can propagate when the rolling direction is reversed, but that the cracks tend toreverse direction to give a longer life before they reach some critical depth (Tyfour and Beynon, 1994).
The crack growth model discussed above qualitatively explains the growth of RCF cracks in rails, whileinitiation is assumed to occur by the same mechanism of ratcheting that is most likely responsible for
FIGURE 34.35 Schematic of a wheel moving across a rail containing a rolling contact fatigue (RCF) crack (see textfor details). (After Bower, A.F. (1988), Trans. ASME, J. Tribol., 110, 704-711.)

wear. Work on quantifying crack growth taking place by the mechanisms described above has been carriedout by Hearle and Johnson (1985) and Bower (1988) at Cambridge University in the U.K., Fletcher andBeynon (1999a,b) at the University of Sheffield, U.K., Sheppard et al. (1987) and Keer and Bryant (1983)in the U.S., and Murakami et al. (1994) and Makita et al. (1991) in Japan. The most important advancesstill to be made in the work lie in accounting for the effect on crack growth of the extensive plasticdeformation of the steel near the surface of rail and wheel components, which is where the early stagesof crack propagation take place.
Work is in progress to develop further quantitative descriptions of the propagation of RCF cracks inrails and, in particular, to predict the point at which the shallow-angle crack turns down into the rail tothreaten fracture (Cannon, 1999). However, rolling contact fatigue is an intricate phenomenon, and manytheoretical and practical problems need to be overcome before the growth of cracks and spalls such asthose shown in Figure 34.34 can be understood quantitatively. These problems include:
1. A highly complex rolling contact stress field, whose components depend critically on the detailedwheel and rail profile shapes and on the presence or absence of lubricants and contaminants
2. The presence of other stresses, such as those developed in manufacture (residual), and those causedby bending and thermal expansion/contraction
3. Rail material properties that vary with depth, due to the surface hardening, and which are highlyanisotropic, due to the high levels of surface shear
4. Crack morphologies that are much more complex than the idealized crack shown in Figure 34.35
34.2.6.2 Service Experience
Many railroads suffer from RCF defects. In Britain, a particularly prevalent defect is the “squat,” whichinitiates on the surface of the outer rail in high-speed curved track. A similar type of defect occurs onJapanese track, where it is termed a “black spot.” Perhaps most RCF damage occurs on heavy-haulrailroads, where axle loads are much higher than those operated by passenger railroads. Spalls and crackslike those shown in Figure 34.34 are relatively common and are traditionally dealt with by rail grinding(see below). The “shell” type of defect, mentioned earlier, is mostly seen on heavy-haul railroads. Thesedefects initiate about 10 to 15 mm below the gauge corner of the outer rail and can eventually turn downto cause rail fracture. They almost certainly initiate at alumina inclusions introduced during rail manu-facture (Steele, 1989), and there is evidence that their occurrence will reduce with the advent of modernclean steel-making practices for rails.
For reasons given earlier, unlike wear, it is difficult to predict in-service behavior from the results ofsmall-scale experiments. Limited service experience, however, tends to corroborate the idea that wateraccelerates RCF crack growth. First, in an analysis of RCF defects on the rail running surface of JapaneseShinkansen train tracks, the incidence of defects was noticeably lower in dry tunnel sections than in opensections where rain is present about 50 days per year (Ishida, 1990). The second example concerns wheelshells found on coal trains in western Canada (Blevins, 1998). Compelling evidence suggests that embry-onic cracks on the wheel tread are driven by water supplied constantly through the winter by powdersnow disturbed by the train. The first melt-freeze of spring reduces the number of wheels needingtreatment, until fresh snow restarts shelling.
Clayton (1996) and Grassie and Kalousek (1997) have summarized railroad-based research and expe-rience with rolling contact fatigue. Clayton concludes that the development of new materials for the railand wheel is the key to future improvement in the performance of these components. However, furthersignificant component performance improvement may be attainable by the better use of current lubri-cation technologies, the development of improved lubrication methods, and more extensive use ofgrinding of rails and wheels.
34.2.7 Interaction of Wear and RCF
Intuition suggests that there should be an interaction between wear and surface-initiated rolling contactfatigue. If wear of the wheel or rail is more rapid than the growth rate of RCF cracks, then cracks should
not grow to a length where they cause spalls in rails or surface shells in wheels. One way of achievingthis is to increase wheel or rail wear rate by reducing hardness. The corresponding increase in ductilitydecreases the incidences of RCF, and small RCF cracks are worn away before they can grow to compromisethe integrity of the rail. However, the rail life is inevitably reduced by the high wear rate.
The idea of removing small cracks to protect against RCF has led to the widespread use of rail grindingto control cracks, flakes, and spalls on the rail surface. (Grinding has other uses as described in Section34.2.8.) This has been adopted on many railroads, using in-track machines to grind the rail in situ, butis especially used on heavy-haul railroads where it is a commonly used rail maintenance technique.Available machines are capable of grinding both rails simultaneously, and applying desired profiles (toreduce contact stress or improve vehicle steering) at speeds in excess of 10 km/hr.
Attempts have been made to define metal removal rates and grinding intervals to give the best railsurface condition at minimum cost, with some success (Kalousek, 1989). Recent work on North Americanrailroads (Sawley, 1999), however, indicates that the balance between wear and RCF is highly site-specificand rail-type-specific. That is, the propensity for RCF cracks depends critically on parameters such asthe track radius and structure, the type of rail installed, the speed of traffic, and operating practices (suchas the presence of signaling systems that may require trains to brake and accelerate always on the samepieces of track). There seems no doubt that, properly applied, rail grinding can reduce RCF and prolongrail life.
Until recently, the academic study of wear/RCF interaction has been limited. Observations from small-scale tests (Kalousek et al., 1989; Beynon et al., 1996) have indicated that a period of dry rolling prior tothe application of water lubrication accelerates RCF cracking. This is thought to occur because surfacetractions rise with friction, giving an increased rate of ratcheting strain accumulation at the surface ofthe steel, which leads to the initiation of cracks. Recent work has examined the effect of preventivegrinding on rail surface damage using rail/wheel test discs (Ishida and Abe, 1997), with the conclusionthat a metal removal rate of 0.1mm for every 50 MGT has a significant effect on the reduction of RCFcracks.
The complex interactions between wear and RCF are of great commercial and safety significance torailroads and merit further study.
34.2.8 GrindingRolling contact fatigue (RCF) defects, such as those described in Section 34.2.4.2, are sites at whichtransverse cracks are relatively likely to initiate and thence to propagate, leading to broken rails. Thedecarburized surface material of new rails is relatively easily damaged and may be subject to rapid wear.Plastic flow can give rise to undesirable interaction between wheel and rail, decreasing the runningstability of the vehicle, and can, in addition, be a direct cause of defects. Short- and long-pitch corruga-tions can cause track irregularity and deterioration of track components, and give rise to such environ-mental issues as noise and ground vibration. Removal of these rail defects contributes considerably tothe cost of railway maintenance. Failure to remove these defects is even more costly to railroad and masstransit operators.
Regular rail grinding is one of the most effective and widely accepted measures for coping with suchrail defects, with the purpose of reducing maintenance cost, and has been for the past two decades. Thereare three broad categories of rail grinding: preparative, preventive, and curative (or corrective). These,and the subsequent surface roughness, are discussed below.
34.2.8.1 Preparative Grinding
Preparative grinding is performed for the purpose of removing the decarburized layer, the mill scale, andany construction damage to the rail materials. It is especially used to ensure the flatness of the longitudinalprofile of rails either newly installed (or in an early stage of service) as track or before installation. Theefficacy of such grinding is gauged through field tests, but cannot so far be estimated quantitatively. Onsome Japanese lines, including heavy-haul and passenger transit, the rail profile proposed by Kalouseket al. (1989) is achieved through grinding of new rails. This profile is designed to permit steering by
rolling radii differential at a contact point, which reduces the contact stresses and alleviates early dete-rioration of the rail surface. The profile is intended to maximize the total number of wheels that canpass over the rail before fatigue occurs.
34.2.8.2 Preventive Grinding
The purpose of preventive grinding is to reduce maintenance work (and costs) and to ensure the safetyof vehicles through removal of potentially hazardous rail defects. In particular, the transverse cracks thatpropagate from RCF defects can lead to broken rails. The preventive grinding approach is based on crackinitiation studies (Nishida et al., 1985; Ghonem and Kalousek, 1988; Inoue et al., 1991), which show thatcracks initiate by fatigue failure. The number of loading cycles before fatigue failure depends on thecontact stresses, and the contact stresses are functions of the contact geometry and interacting forces,such as traction at the wheel/rail interface. Preventive grinding removes “micro” cracks (10 microns long,or less). Generally, these cannot be inspected by ultrasonic (or other) detectors, let alone visually. Thebasic questions of concern for optimizing the efficiency of maintenance are: when and how often togrind; what amount (i.e., depth) to grind off; and just how grinding should be carried out. Preventivegrinding should maintain the desired rail profile as far as possible, but should not remove more metalthan is required to free the rail of fatigue cracks.
Kalousek et al. (1989) and Linn et al. (1993) reported on the preventive grinding of sharp curves ofheavy-haul railroads. This early work indicated that, in sharp curves, the high rail (the outer rail) generallyhas a greater likelihood of RCF defects than the low rail (the inner rail). It was therefore recommendedthat lubrication of high rails be carried out in order to decrease the friction coefficient between the railgauge face and the wheel flange, thus decreasing the tangential contact stresses. However, recently, withthe advent of clean, head-hardened rails made by continuous casting processes, it has been found thatthe situation is more complex, at least on heavy-haul railroads, and it is the low rail that is sufferingmore from rolling contact fatigue.
The main difference between corrective and preventive grinding is that the former requires deep cuts,while the latter requires only shallow but more frequent cuts. The relative benefits of each method arevery site and rail specific, and it has been up to now impossible to generalize about their relative merits.Experience on high-speed Japanese lines shows that the benefits of the preventive grinding method overthe corrective method are longer rail life and reduced grinding costs. Although with preventive grindingthe rail is ground more frequently, less total volume of steel is removed compared with corrective grinding.However, on heavy-haul freight lines in North America, it has recently been found that preventive grindinggives greater metal loss than corrective grinding and, in fact, some high rails that have never been groundare still in good condition after more than 400 MGT traffic. This is a much higher traffic volume thantraditionally thought possible without the use of grinding, and may be due to the use of modern, clean,continuously cast rail.
On some Japanese lines, including heavy-haul and passenger transit, the following metal removal ratesand grinding periods are recommended. To remove all the initiated cracks on the head of the rail,approximately 0.05 mm to 0.075 mm should be ground off. Preventive grinding requires higher metalremoval rates at the gauge corners of the high rail and the field side of the low rail to prevent cumulativedistortion of the rail profile through plastic flow. Depth of cut in these areas should be 0.1 mm to 0.15 mm.The recommended preventive grinding periods are: 5 to 8 MGT for curves* extending over more than3°; 10 to 16 MGT for curves equal to or less than 3°; and 15 to 24 MGT for tangent (straight) track.Again, however, the site-specific nature of grinding requirements is illustrated by practice on NorthAmerican and Australian heavy-haul lines, where there has been a move away from gauge corner grindingand toward much longer grinding intervals. This was because excessive gauge corner grinding led to two-point contact conditions on the high rail, which was found to impair the steering ability of freight trucks,leading to an increase in rolling resistance and hence greater rail wear and fuel use.
*Curve radii on high-speed railway lines are generally between 3000 and 5000 m.
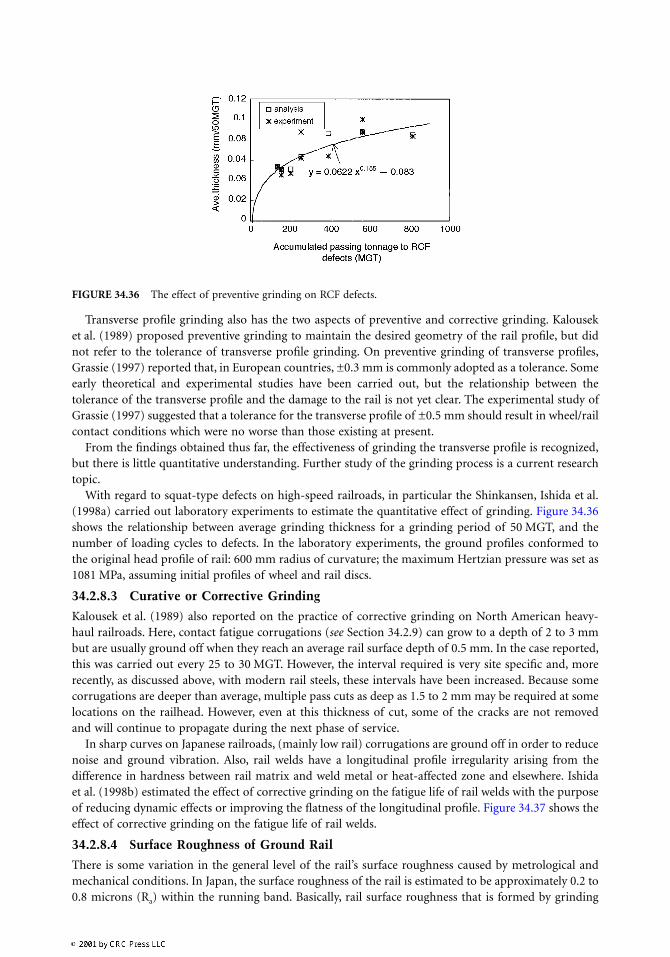
Transverse profile grinding also has the two aspects of preventive and corrective grinding. Kalouseket al. (1989) proposed preventive grinding to maintain the desired geometry of the rail profile, but didnot refer to the tolerance of transverse profile grinding. On preventive grinding of transverse profiles,Grassie (1997) reported that, in European countries, ±0.3 mm is commonly adopted as a tolerance. Someearly theoretical and experimental studies have been carried out, but the relationship between thetolerance of the transverse profile and the damage to the rail is not yet clear. The experimental study ofGrassie (1997) suggested that a tolerance for the transverse profile of ±0.5 mm should result in wheel/railcontact conditions which were no worse than those existing at present.
From the findings obtained thus far, the effectiveness of grinding the transverse profile is recognized,but there is little quantitative understanding. Further study of the grinding process is a current researchtopic.
With regard to squat-type defects on high-speed railroads, in particular the Shinkansen, Ishida et al.(1998a) carried out laboratory experiments to estimate the quantitative effect of grinding. Figure 34.36shows the relationship between average grinding thickness for a grinding period of 50 MGT, and thenumber of loading cycles to defects. In the laboratory experiments, the ground profiles conformed tothe original head profile of rail: 600 mm radius of curvature; the maximum Hertzian pressure was set as1081 MPa, assuming initial profiles of wheel and rail discs.
34.2.8.3 Curative or Corrective Grinding
Kalousek et al. (1989) also reported on the practice of corrective grinding on North American heavy-haul railroads. Here, contact fatigue corrugations (see Section 34.2.9) can grow to a depth of 2 to 3 mmbut are usually ground off when they reach an average rail surface depth of 0.5 mm. In the case reported,this was carried out every 25 to 30 MGT. However, the interval required is very site specific and, morerecently, as discussed above, with modern rail steels, these intervals have been increased. Because somecorrugations are deeper than average, multiple pass cuts as deep as 1.5 to 2 mm may be required at somelocations on the railhead. However, even at this thickness of cut, some of the cracks are not removedand will continue to propagate during the next phase of service.
In sharp curves on Japanese railroads, (mainly low rail) corrugations are ground off in order to reducenoise and ground vibration. Also, rail welds have a longitudinal profile irregularity arising from thedifference in hardness between rail matrix and weld metal or heat-affected zone and elsewhere. Ishidaet al. (1998b) estimated the effect of corrective grinding on the fatigue life of rail welds with the purposeof reducing dynamic effects or improving the flatness of the longitudinal profile. Figure 34.37 shows theeffect of corrective grinding on the fatigue life of rail welds.
34.2.8.4 Surface Roughness of Ground Rail
There is some variation in the general level of the rail’s surface roughness caused by metrological andmechanical conditions. In Japan, the surface roughness of the rail is estimated to be approximately 0.2 to0.8 microns (Ra) within the running band. Basically, rail surface roughness that is formed by grinding
FIGURE 34.36 The effect of preventive grinding on RCF defects.
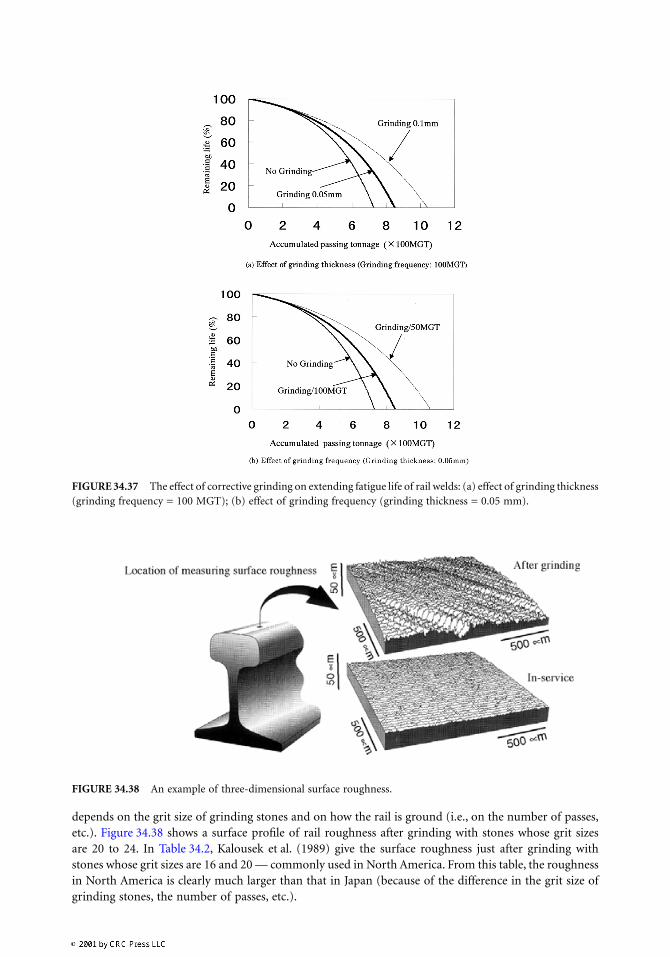
depends on the grit size of grinding stones and on how the rail is ground (i.e., on the number of passes,etc.). Figure 34.38 shows a surface profile of rail roughness after grinding with stones whose grit sizesare 20 to 24. In Table 34.2, Kalousek et al. (1989) give the surface roughness just after grinding withstones whose grit sizes are 16 and 20 — commonly used in North America. From this table, the roughnessin North America is clearly much larger than that in Japan (because of the difference in the grit size ofgrinding stones, the number of passes, etc.).
FIGURE 34.37 The effect of corrective grinding on extending fatigue life of rail welds: (a) effect of grinding thickness(grinding frequency = 100 MGT); (b) effect of grinding frequency (grinding thickness = 0.05 mm).
FIGURE 34.38 An example of three-dimensional surface roughness.
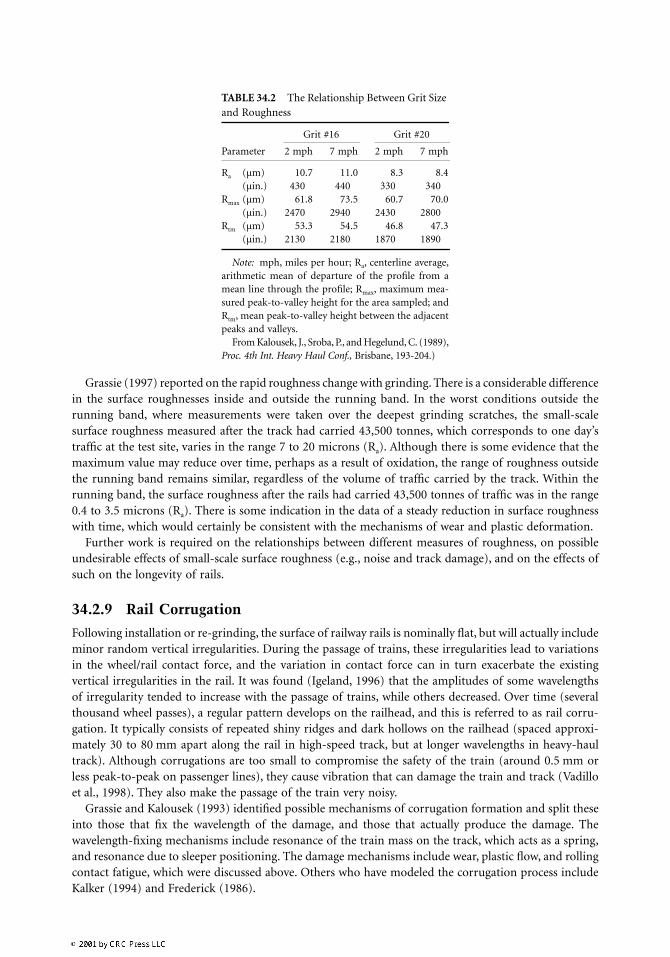
Grassie (1997) reported on the rapid roughness change with grinding. There is a considerable differencein the surface roughnesses inside and outside the running band. In the worst conditions outside therunning band, where measurements were taken over the deepest grinding scratches, the small-scalesurface roughness measured after the track had carried 43,500 tonnes, which corresponds to one day’straffic at the test site, varies in the range 7 to 20 microns (Ra). Although there is some evidence that themaximum value may reduce over time, perhaps as a result of oxidation, the range of roughness outsidethe running band remains similar, regardless of the volume of traffic carried by the track. Within therunning band, the surface roughness after the rails had carried 43,500 tonnes of traffic was in the range0.4 to 3.5 microns (Ra). There is some indication in the data of a steady reduction in surface roughnesswith time, which would certainly be consistent with the mechanisms of wear and plastic deformation.
Further work is required on the relationships between different measures of roughness, on possibleundesirable effects of small-scale surface roughness (e.g., noise and track damage), and on the effects ofsuch on the longevity of rails.
34.2.9 Rail Corrugation
Following installation or re-grinding, the surface of railway rails is nominally flat, but will actually includeminor random vertical irregularities. During the passage of trains, these irregularities lead to variationsin the wheel/rail contact force, and the variation in contact force can in turn exacerbate the existingvertical irregularities in the rail. It was found (Igeland, 1996) that the amplitudes of some wavelengthsof irregularity tended to increase with the passage of trains, while others decreased. Over time (severalthousand wheel passes), a regular pattern develops on the railhead, and this is referred to as rail corru-gation. It typically consists of repeated shiny ridges and dark hollows on the railhead (spaced approxi-mately 30 to 80 mm apart along the rail in high-speed track, but at longer wavelengths in heavy-haultrack). Although corrugations are too small to compromise the safety of the train (around 0.5 mm orless peak-to-peak on passenger lines), they cause vibration that can damage the train and track (Vadilloet al., 1998). They also make the passage of the train very noisy.
Grassie and Kalousek (1993) identified possible mechanisms of corrugation formation and split theseinto those that fix the wavelength of the damage, and those that actually produce the damage. Thewavelength-fixing mechanisms include resonance of the train mass on the track, which acts as a spring,and resonance due to sleeper positioning. The damage mechanisms include wear, plastic flow, and rollingcontact fatigue, which were discussed above. Others who have modeled the corrugation process includeKalker (1994) and Frederick (1986).
TABLE 34.2 The Relationship Between Grit Size and Roughness
Parameter
Grit #16 Grit #20
2 mph 7 mph 2 mph 7 mph
Ra (µm)(µin.)
10.7430
11.0440
8.3330
8.4340
Rmax (µm)(µin.)
61.82470
73.52940
60.72430
70.02800
Rtm (µm)(µin.)
53.32130
54.52180
46.81870
47.31890
Note: mph, miles per hour; Ra, centerline average,arithmetic mean of departure of the profile from amean line through the profile; Rmax, maximum mea-sured peak-to-valley height for the area sampled; andRtm, mean peak-to-valley height between the adjacentpeaks and valleys.
From Kalousek, J., Sroba, P., and Hegelund, C. (1989),Proc. 4th Int. Heavy Haul Conf., Brisbane, 193-204.)
Although the mechanisms by which corrugations are produced have been identified, there are con-siderable problems in preventing rail corrugation from occurring. It is found that tracks over whichsimilar types of train pass with great regularity can quickly suffer rail corrugation, especially if thesetrains repeatedly brake or accelerate in the same places.
34.3 Diesel Power for Traction Purposes
Railroad engine tribology is similar in many respects to the corresponding components in an automotivecontext, but some areas require special consideration. For information specific to locomotive engines,the reader is referred to specialty papers that focus on engine design, reliability, and emission control forlarge diesel engines (e.g., Kotlin et al., 1980; Grinstein, 1993; Uzkan and Lenz, 1999). The presentdiscussion focuses on areas that are specific to railroad traction applications.
Diesel traction on railroads has been used since the mid-1930s when experimental locomotives werebuilt in several countries. Named after its inventor, Rudolph Diesel, the compression ignition engine hasbecome the prime mover of choice for today’s railroads. Its good efficiency over a wide power rangemakes it ideal for traction applications where the demand is relatively constant over long periods,punctuated by short bursts at full power for starting and periodic idling when trains are coasting.Although electric power for railway traction is dominant in Europe and on most high-capacity urbansystems, diesel power accounts for the largest proportion of train services in the world. The U.S. was thefirst country to fully convert its railroads to diesel traction, with steam power eliminated by the late 1950s.
The fuel used accounts for the differences between diesel engines and spark ignition (SI) engines.Diesel engines use cetane (C16H34) and α-methyl-naphthalene (C11H10), while petrol is n-heptane (C7H16)and iso-octane (C8H18). In the diesel engine, high compression ratios (15:1 to 20:1) raise the temperatureof the combustion air sufficiently to ignite the fuel without the need for a spark. However, it must beinjected into the cylinder at the time combustion is required. The engine must be more robust, and henceheavier, to withstand the higher pressures that are a consequence of the high compression ratio. Railwaytraction diesel engines are subdivided into:
• High-speed engines: 1200 to 1800 rpm (20 to 30 rps)
• Medium-speed engines: 600 to 1200 rpm (10 to 20 rps)
• Low-speed engines: 60 to 600 rpm (1 to 10 rps)
Most locomotive engines belong to the medium-speed range, which offers a good compromise betweenpower density and wear performance.
Essentially, the diesel engine consumes fuel and air, and produces mechanical torque from the chemicalenergy stored in the fuel. This mechanical torque is transferred to the wheels using a variety of drivearrangements, including direct mechanical transmission, hydraulic systems and, most commonly, electrictransmission of power.
34.3.1 Generation of Mechanical Power
To convert the energy stored within the fuel into mechanical torque, the engine uses a reciprocatingpiston inside a cylinder that is closed at one end. Air is taken into the cylinder, compressed, and fuel isinjected into the cylinder. The combustion of the mixture causes a temperature rise, which increases thepressure in the cylinder and thus drives the piston, and hence, the load. This can be accomplished ineither a two-stroke or a four-stroke process, both of which are used for diesel traction. For moreinformation on diesel engines, refer to a standard thermodynamics text (e.g., Rogers and Mayhew, 1992).
34.3.1.1 Two-Stroke Engine
The two-stroke engine completes a cycle of induction, compression, power, and exhaust in only twopiston strokes. It accomplishes this using ports in the cylinder wall to control the flow of gases. Two-stroke engines have better power-to-weight ratios than four-stroke units because power is produced
during every down-stroke of the piston. The absence of valve gear makes the engine mechanically simplerthan its four-stroke counterpart. However, the need for free-flowing exhaust makes the engines noisier,and they are better suited to medium- and high-speed operation.
A typical two-stroke diesel engine for traction purposes, such as model 645 of General Motors’Electromotive Division (GM-EMD), has 8, 12, 16, or 20 cylinders with a bore of 91/16 in. (230.2 mm) anda stroke of 10 in. (254 mm). At its maximum rated full load speed of 900 rpm (15 rps), the sliding pistonseals experience a top speed of 12 m/s. With a compression ratio of 16:1 for the Roots blown version,these engines produce approximately 150 kW per cylinder.
34.3.1.2 Four-Stroke Engine
The four-stroke engine uses a separate stroke for each of the four phases: exhaust and compression onthe up-stroke, and induction and power on the down-stroke. Cam-driven valves are used to open theintake and exhaust ports at the appropriate time. Removing the exhaust gases by forcing them out withthe piston means that better silencers can be used, and the engines produce greater low speed torque.The inherently complex camshaft and valve arrangements are more expensive and require more main-tenance. However, four-stroke engines are common on multiple units where quiet and smooth operationwith good low speed performance is important.
34.3.2 Tribological Issues in the Design of Diesel Engines
While there are no generic differences between the tribological problems arising in the diesel engines oflocomotives and those occurring in the engines of trucks, ships, and cars, there are clear differences inthe operating environments, which lead to more exacting requirements for the design of diesel enginesfor railway traction. A typical railroad diesel engine is shown in Figure 34.39.
Mechanical shock loading due to poor track (see Chapter 34.1.2) is a factor in locomotive applications,but resilient mounting of engines can overcome some of the problems. Most of the tribological problemsstem from the mode of operation of the two-stroke diesel engine and the fact that the piston is alwayspushed down, leading to unidirectional wear patterns. The reason for this is that on two-stroke engines,there is no force reversal for aspiration. A more challenging issue concerns the rapid temperature changesthat locomotive engines undergo when entering and exiting tunnels. In the U.S., this problem is com-pounded by multiple traction, with up to five locomotives a relatively common occurrence. Inside atunnel, trailing locomotives ingest waste heat and exhaust of the leading locomotives. The temperatureof the intake air in the winter can range from –30°C to +120°C in less than a minute, a severe thermalshock loading of the system. Differential expansion of individual parts due to temperature differencesduring the temperature transients creates complex problems. Operation at altitudes from sea level to3000 m, a necessity on a number of railways in Latin America, also presents challenging problems dueto changes in inlet air pressure, humidity, etc.
The major manufacturers, such as GM-EMD that developed its solutions for the original 567 engine,eliminated many of the resulting problems in the 1970s. Many improvements were implemented on themodel 645, which was introduced in 1965. The top compression rings of the pistons were originallymanufactured from ductile iron and chrome plated. In later designs (post-1973), these were replaced bychrome-faced stainless steel rings that reduced side wear of the rings by 50%, thus increasing resistanceto breaking (Ephraim et al., 1976, p. 3). Oil rings were improved to enhance cooling performance underextreme load conditions and a new method of honing cylinder liners was developed (see Section 34.2.4.2for a discussion of surface roughness). This results in 2/3 plateaux and 1/3 valleys on the surface (Ephraimet al., 1976, p. 4) and offers reduced oil consumption at light load and better performance at peak load.A comparison of the two surfaces is shown in Figure 34.40. Further improvements to the cylinder linerswere achieved thanks to laser hardening of the surface areas around the inlet ports (Kotlin et al., 1980,pp. 6–8).
One of the last tribological problems encountered by GM engineers was the wrist pin bearing on highpower rated engines for which the “rocking pin” solution was developed in the late ‘70s and first used
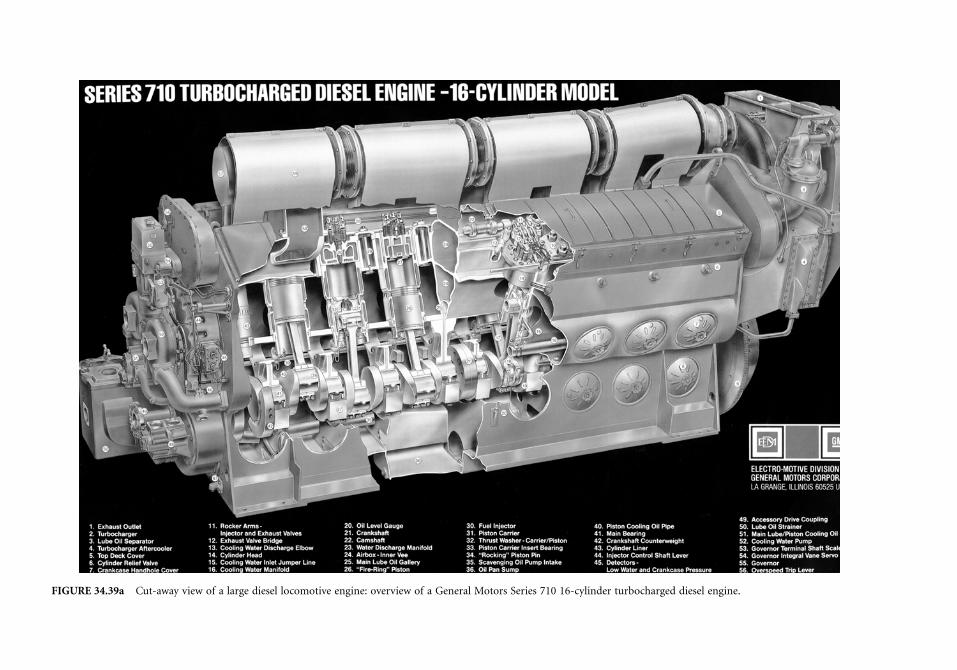
FI turbocharged diesel engine.
GURE 34.39a Cut-away view of a large diesel locomotive engine: overview of a General Motors Series 710 16-cylinder