chapter 01: surface physics in tribology in tribology -...
TRANSCRIPT
1Surface Physics
in Tribology
1.1 Introduction 1.2 Geometry of Surfaces1.3 Theoretical Considerations
Surface Theory • Friction Fundamentals
1.4 Experimental Determinations of Surface StructureLow-Energy Electron Diffraction • High-Resolution Electron Microscopy • Field Ion Microscopy
1.5 Chemical Analysis of SurfacesAuger Electron Spectroscopy • X-ray Photoelectron Spectroscopy • Secondary Ion Mass Spectroscopy • Infrared Spectroscopy • Thermal Desorption
1.6 Surface Effects in TribologyAtomic Monolayer Effects in Adhesion and Friction • Monolayer Effects due to Adsorption of Hydrocarbons • Atomic Effects in Metal-Insulator Contacts
1.7 Concluding Remarks
1.1 Introduction
Tribology, the study of the interaction between surfaces in contact, spans many disciplines, from physicsand chemistry to mechanical engineering and material science, and is of extreme technological impor-tance. In this first chapter on tribology, the key word will be surface. This chapter will be rather ambitiousin scope in that we will attempt to cover the range from microscopic to macroscopic. We will approachthis problem in steps: first considering the fundamental idea of a surface, next recognizing its atomiccharacter and the expectations of a ball model of the atomic structures present. We will then considermore realistic relaxed surfaces and then consider how the class of surface, i.e., metal, semiconductor, orinsulator, affects these considerations. Finally, we will present what is expected when a pure material isalloyed and the effects of adsorbates.
Following these more fundamental descriptions, we will give brief descriptions of some of the exper-imental techniques used to determine surface properties and their limitations. The primary objectivehere will be to provide a source for more thorough examination by the interested reader.
Finally, we will examine the relationship of tribological experiments to these more fundamentalatomistic considerations. The primary goals of this section will be to again provide sources for furtherstudy of tribological experiments and to raise critical issues concerning the relationship between basicsurface properties with regard to tribology and the ability of certain classes of experiments to reveal theunderlying interactions. We will attempt to avoid overlapping the material presented by other authorsin this publication. This chapter cannot be a complete treatment of the physics of surfaces due to space
Phillip B. AbelNASA Glenn Research Center
John FerranteCleveland State University
limitations. We recommend an excellent text by Zangwill (1988) for a more thorough treatment. Insteadwe concentrate on techniques and issues of importance to tribology on the nanoscale.
1.2 Geometry of Surfaces
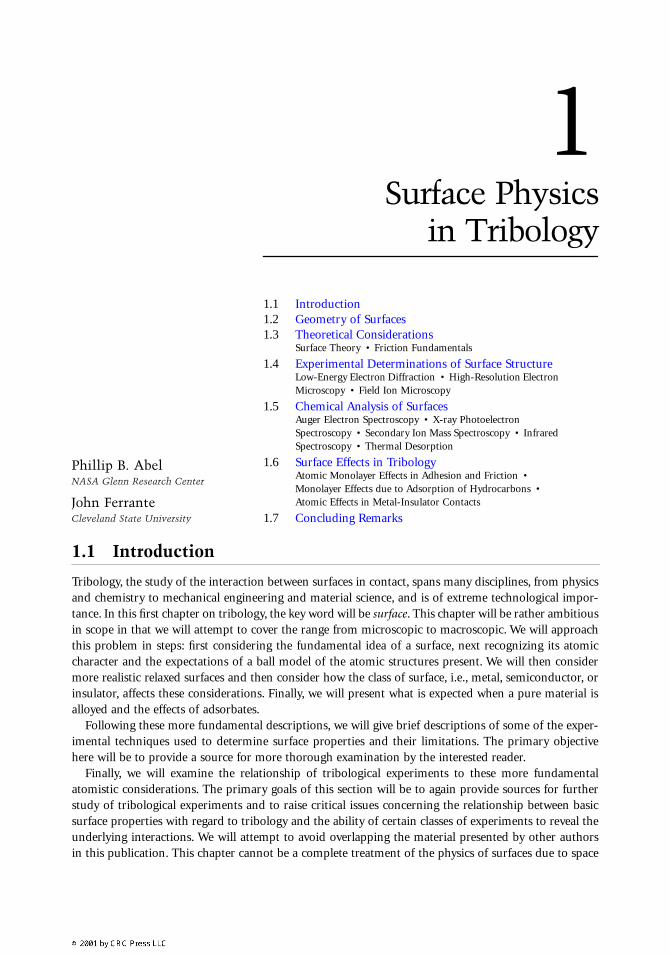
We now examine from a geometric standpoint what occurs when you create two surfaces by dividing asolid along a given plane. We limit the discussion to single crystals, since the same arguments apply topolycrystalline samples except for the existence of grains, each of which could be described by a corre-sponding argument. This discussion starts by introducing the standard notation for describing crystalsgiven in solid state texts (e.g., Ashcroft and Mermin, 1976; Kittel, 1986). It is meant to be didactic innature and will not attempt to be comprehensive. In order to establish notation and concepts we limitour discussion to two Bravais lattices, face-centered cubic (fcc) and body-centered cubic (bcc), whichare the structures often found in metals. Unit cells, i.e., the structures which most easily display thesymmetries of the crystals, are shown in Figure 1.1. The other descriptions that are frequently used arethe primitive cells, which show the simplest structures that can be repeated to create a given structure.In Figure 1.1 we also show the primitive cell basis vectors, which can be used to generate the entirestructure by the relation
(1.1)
where n1, n2, and n3 are integers, and a1, a2, and a3 are unit basis vectors.Since we are interested in describing surface properties, we want to present a standard nomenclature
for specifying a surface. The algebraic description of a surface is usually given in terms of a vector normalto the surface. This is conveniently accomplished in terms of vectors that arise naturally in solids, namelythe reciprocal lattice vectors of the Bravais lattice (Ashcroft and Mermin, 1976; Kittel, 1986). This isconvenient since these vectors are used to describe the band structure and diffraction effects in solids.They are usually given in the form
(1.2)
where h,k,l are integers. The reciprocal lattice vectors are related to the basis vectors of the direct lattice by
(1.3)
FIGURE 1.1 (a) Unit cube of face-centered cubic (fcc) crystal structure, with primitive-cell basis vectors indicated.(b) Unit cube of body-centered cubic (bcc) crystal structure, with primitive-cell basis vectors indicated.
R a a a1 2 3= + +n n n1 2 3
K b b b1 2 3= + +h k l
b a a a a ai j k i j k= π ×( ) ⋅ ×( ){ }2
a b
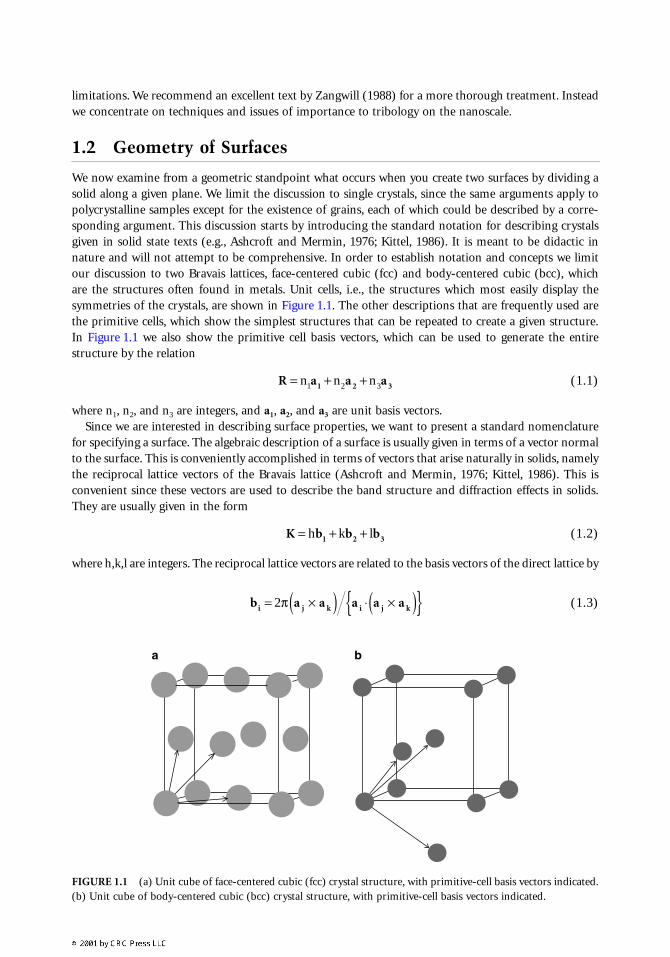
where a cyclic permutation of i,j,k is used in the definition. Typically, parentheses are used in the definitionof the plane, e.g., (h,k,l). The (100) planes for fcc and bcc lattices are shown in Figure 1.2 where dots areused to show the location of the atoms in the next plane down.
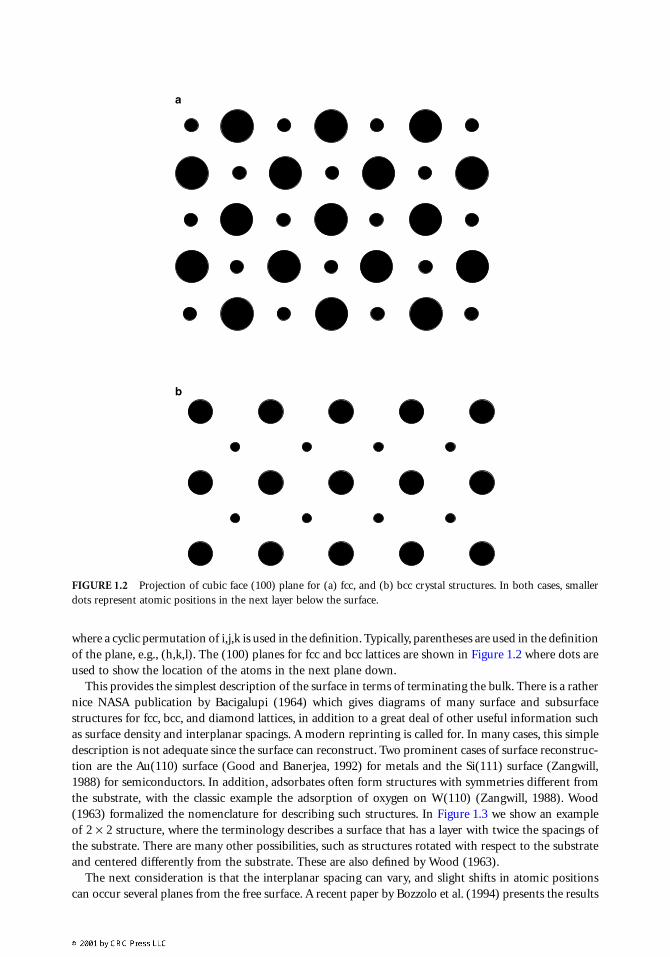
This provides the simplest description of the surface in terms of terminating the bulk. There is a rathernice NASA publication by Bacigalupi (1964) which gives diagrams of many surface and subsurfacestructures for fcc, bcc, and diamond lattices, in addition to a great deal of other useful information suchas surface density and interplanar spacings. A modern reprinting is called for. In many cases, this simpledescription is not adequate since the surface can reconstruct. Two prominent cases of surface reconstruc-tion are the Au(110) surface (Good and Banerjea, 1992) for metals and the Si(111) surface (Zangwill,1988) for semiconductors. In addition, adsorbates often form structures with symmetries different fromthe substrate, with the classic example the adsorption of oxygen on W(110) (Zangwill, 1988). Wood(1963) formalized the nomenclature for describing such structures. In Figure 1.3 we show an exampleof 2 × 2 structure, where the terminology describes a surface that has a layer with twice the spacings ofthe substrate. There are many other possibilities, such as structures rotated with respect to the substrateand centered differently from the substrate. These are also defined by Wood (1963).
The next consideration is that the interplanar spacing can vary, and slight shifts in atomic positionscan occur several planes from the free surface. A recent paper by Bozzolo et al. (1994) presents the results
FIGURE 1.2 Projection of cubic face (100) plane for (a) fcc, and (b) bcc crystal structures. In both cases, smallerdots represent atomic positions in the next layer below the surface.
a
b
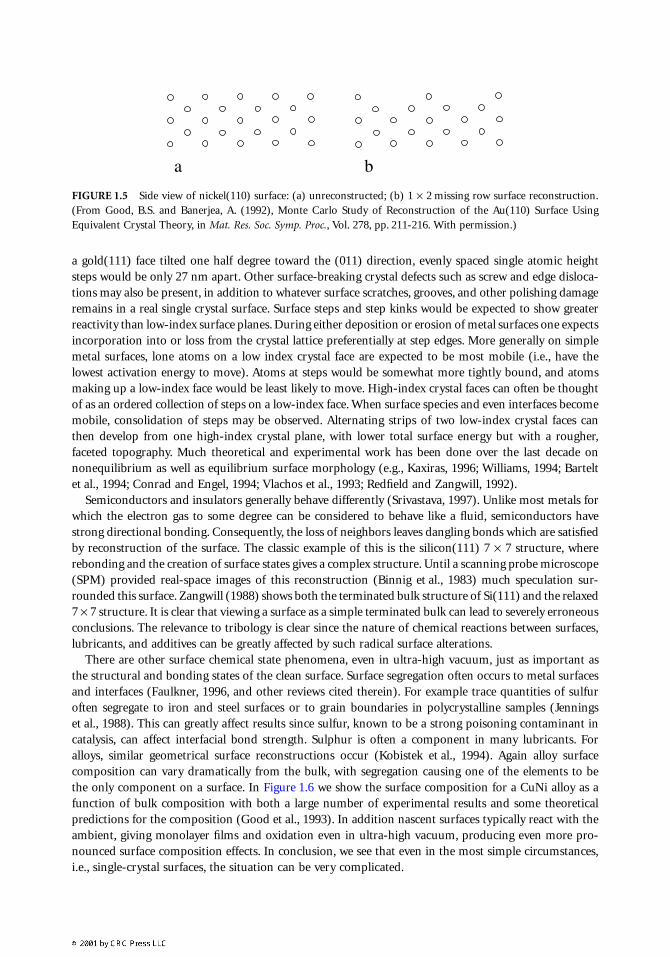
for a large number of metallic systems and serves as a good review of available publications. Figure 1.4shows some typical results for Ni(100). The percent change given represents the deviation from theequilibrium interplanar spacing. The drawing in Figure 1.4 exaggerates these typically small differencesin order to elucidate the behavior. Typically, this pattern of alternating contraction and expansiondiminishing as the bulk is approached is found in most metals. It can be understood in a simple manner(Bozzolo et al., 1994). The energy for the bulk metal is a minimum at the bulk metallic density. Theformation of the surface represents a loss of electron density because of missing neighbors for the surfaceatoms. Therefore, this loss of electron density can be partially offset by a contraction of the interplanarspacing between the first two layers. This contraction causes an electron density increase between layers2 and 3 and, thus, the energy is lowered by a slight increase in their interplanar spacing. There are someexceptions to this behavior where the interplanar spacing increases between the first two layers due tobonding effects (Needs, 1987; Feibelman, 1992). However, the pattern shown in Figure 1.4 is the usualbehavior for most metallic surfaces. There can be similar changes in position within the planes; however,these are usually small effects (Rodriguez et al., 1993; Foiles, 1987). In Figure 1.5, we show a side viewof a gold (110) surface (Good and Banerjea, 1992). Figure 1.5a shows the unreconstructed surface and1.5b shows a side view of the (2 × 1) missing row reconstruction. Such behavior indicates the complexitythat can arise even for metal surfaces and the danger of using ideas which are too simplistic, since moredetails of the bonding interactions are needed (Needs, 1987; Feibelman, 1992).
Real crystal surfaces typically are not perfectly oriented nor atomically flat. Even “on-axis” (i.e., withina fraction of a degree) single crystal low-index faces exhibit some density of crystallographic steps. For
FIGURE 1.3 Representation of fcc (110) face with an additional 2 × 2 layer, in which the species above the surfaceatoms have twice the spacing of the surface. Atomic positions in the next layer below the surface are represented bysmaller dots.
FIGURE 1.4 Side view of nickel(100) surface. On the left, the atoms are positioned as if still within a bulk fcc lattice(“unrelaxed”). On the right, the surface planes have been moved to minimize system energy (Bozzolo et al., 1994).The percent change in lattice spacing is indicated, with the spacing in the image exaggerated to illustrate the effect.
1
2
34
5
Unrelaxed ECT
-3.82%+2.48%
a gold(111) face tilted one half degree toward the (011) direction, evenly spaced single atomic heightsteps would be only 27 nm apart. Other surface-breaking crystal defects such as screw and edge disloca-tions may also be present, in addition to whatever surface scratches, grooves, and other polishing damageremains in a real single crystal surface. Surface steps and step kinks would be expected to show greaterreactivity than low-index surface planes. During either deposition or erosion of metal surfaces one expectsincorporation into or loss from the crystal lattice preferentially at step edges. More generally on simplemetal surfaces, lone atoms on a low index crystal face are expected to be most mobile (i.e., have thelowest activation energy to move). Atoms at steps would be somewhat more tightly bound, and atomsmaking up a low-index face would be least likely to move. High-index crystal faces can often be thoughtof as an ordered collection of steps on a low-index face. When surface species and even interfaces becomemobile, consolidation of steps may be observed. Alternating strips of two low-index crystal faces canthen develop from one high-index crystal plane, with lower total surface energy but with a rougher,faceted topography. Much theoretical and experimental work has been done over the last decade onnonequilibrium as well as equilibrium surface morphology (e.g., Kaxiras, 1996; Williams, 1994; Barteltet al., 1994; Conrad and Engel, 1994; Vlachos et al., 1993; Redfield and Zangwill, 1992).
Semiconductors and insulators generally behave differently (Srivastava, 1997). Unlike most metals forwhich the electron gas to some degree can be considered to behave like a fluid, semiconductors havestrong directional bonding. Consequently, the loss of neighbors leaves dangling bonds which are satisfiedby reconstruction of the surface. The classic example of this is the silicon(111) 7 × 7 structure, whererebonding and the creation of surface states gives a complex structure. Until a scanning probe microscope(SPM) provided real-space images of this reconstruction (Binnig et al., 1983) much speculation sur-rounded this surface. Zangwill (1988) shows both the terminated bulk structure of Si(111) and the relaxed7 × 7 structure. It is clear that viewing a surface as a simple terminated bulk can lead to severely erroneousconclusions. The relevance to tribology is clear since the nature of chemical reactions between surfaces,lubricants, and additives can be greatly affected by such radical surface alterations.
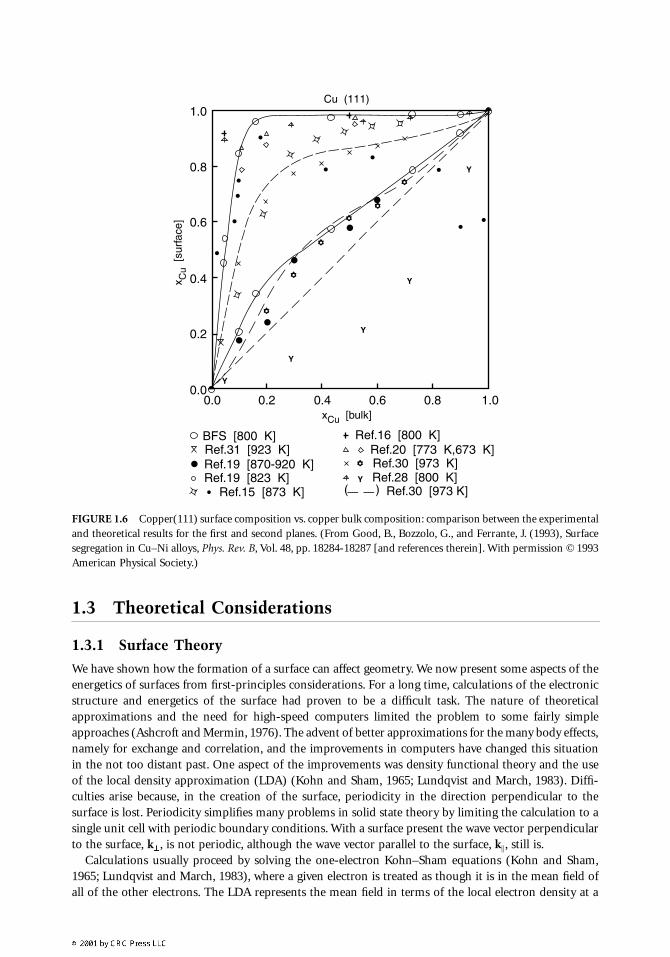
There are other surface chemical state phenomena, even in ultra-high vacuum, just as important asthe structural and bonding states of the clean surface. Surface segregation often occurs to metal surfacesand interfaces (Faulkner, 1996, and other reviews cited therein). For example trace quantities of sulfuroften segregate to iron and steel surfaces or to grain boundaries in polycrystalline samples (Jenningset al., 1988). This can greatly affect results since sulfur, known to be a strong poisoning contaminant incatalysis, can affect interfacial bond strength. Sulphur is often a component in many lubricants. Foralloys, similar geometrical surface reconstructions occur (Kobistek et al., 1994). Again alloy surfacecomposition can vary dramatically from the bulk, with segregation causing one of the elements to bethe only component on a surface. In Figure 1.6 we show the surface composition for a CuNi alloy as afunction of bulk composition with both a large number of experimental results and some theoreticalpredictions for the composition (Good et al., 1993). In addition nascent surfaces typically react with theambient, giving monolayer films and oxidation even in ultra-high vacuum, producing even more pro-nounced surface composition effects. In conclusion, we see that even in the most simple circumstances,i.e., single-crystal surfaces, the situation can be very complicated.
FIGURE 1.5 Side view of nickel(110) surface: (a) unreconstructed; (b) 1 × 2 missing row surface reconstruction.(From Good, B.S. and Banerjea, A. (1992), Monte Carlo Study of Reconstruction of the Au(110) Surface UsingEquivalent Crystal Theory, in Mat. Res. Soc. Symp. Proc., Vol. 278, pp. 211-216. With permission.)
a b
1.3 Theoretical Considerations
1.3.1 Surface Theory
We have shown how the formation of a surface can affect geometry. We now present some aspects of theenergetics of surfaces from first-principles considerations. For a long time, calculations of the electronicstructure and energetics of the surface had proven to be a difficult task. The nature of theoreticalapproximations and the need for high-speed computers limited the problem to some fairly simpleapproaches (Ashcroft and Mermin, 1976). The advent of better approximations for the many body effects,namely for exchange and correlation, and the improvements in computers have changed this situationin the not too distant past. One aspect of the improvements was density functional theory and the useof the local density approximation (LDA) (Kohn and Sham, 1965; Lundqvist and March, 1983). Diffi-culties arise because, in the creation of the surface, periodicity in the direction perpendicular to thesurface is lost. Periodicity simplifies many problems in solid state theory by limiting the calculation to asingle unit cell with periodic boundary conditions. With a surface present the wave vector perpendicularto the surface, k⊥⊥⊥⊥ , is not periodic, although the wave vector parallel to the surface, k� , still is.
Calculations usually proceed by solving the one-electron Kohn–Sham equations (Kohn and Sham,1965; Lundqvist and March, 1983), where a given electron is treated as though it is in the mean field ofall of the other electrons. The LDA represents the mean field in terms of the local electron density at a
FIGURE 1.6 Copper(111) surface composition vs. copper bulk composition: comparison between the experimentaland theoretical results for the first and second planes. (From Good, B., Bozzolo, G., and Ferrante, J. (1993), Surfacesegregation in Cu–Ni alloys, Phys. Rev. B, Vol. 48, pp. 18284-18287 [and references therein]. With permission © 1993American Physical Society.)
Y
Y
Y
Y
Y
Y
BFS [800 K]Ref.31 [923 K]Ref.19 [870-920 K]Ref.19 [823 K]
Ref.15 [873 K]
Ref.16 [800 K]Ref.20 [773 K,673 K]Ref.30 [973 K]Ref.28 [800 K]
Ref.30 [973 K]( )
0.00.0
0.2
0.4
0.6
0.8
1.0
0.2 0.4 0.6 0.8 1.0
Cu (111)
xCu [bulk]
x Cu
[sur
face
]
given location. The Kohn–Sham equations are written in the form (using normalized atomic units wherethe constants appearing in the Schroedinger equation, Planck’s constant and the electron rest mass, alongwith the electron charge and the speed of light, h = me = e = c ≡ 1).
(1.4)
where Ψi and εi are the one-electron wave function and energy, respectively, and
(1.5)
where Vxc[ρ(r)] is the exchange and correlation potential, ρ(r) is the electron density (the brackets indicatethat it is a functional of the density), and ΦΦΦΦ(r) is the electrostatic potential given by
(1.6)
in which the first term is the electron–electron interaction and the second term is the electron–ioninteraction, Zj is the ion charge and the electron density is given by
(1.7)
where occ refers to occupied states. The calculation proceeds by using some representation for the wavefunctions such as the linear muffin tin orbital approximation (LMTO), and iterating self-consistently(Ashcroft and Mermin, 1976). Self-consistency is obtained when either the output density or potentialagree to within some specified criterion with the input. These calculations are not generally performedfor the semi-infinite solid. Instead, they are performed for slabs of increasing thickness to the point wherethe interior atoms have essentially bulk properties. Usually, five planes are sufficient to give the surfaceproperties. The values of εi(k�) give the surface band structure and surface states, localized electronicstates created because of the presence of the surface.
The second piece of information needed is the total energy in terms of the electron density, as obtainedfrom density functional theory. This is represented schematically by the expression
(1.8)
where Eke is the kinetic energy contribution to the energy, Ees is the electrostatic contribution, Exc is theexchange correlation contribution, and the brackets indicate that the energy is a function of the density.Thus the energy is an extremum of the correct density. Determining the surface energy accurately fromsuch calculations can be quite difficult since the surface, or indeed any of the energies of defects ofinterest, are obtained as a difference of big numbers. For example, for the surface the energy would begiven by
(1.9)
where a is the distance between the surfaces (a = 0 to get the surface energy) and A is the cross-sectionalarea.
The initial solutions of the Kohn–Sham equations for surfaces and interfaces were accomplished byLang and Kohn (1970) for the free surface and Ferrante and Smith for interfaces (Ferrante and Smith,
− ∇ + ( )[ ] ( ) = ( ) ( )1 2 2 V i i ir k r k k rΨ � � �, ,ε Ψ
V Vxcr r r( ) = ( ) + ( )[ ]Φ ρ
Φ Σr r r r r r R j( ) = ∫ ′ ( ) − ′ − −d Zj jρ
ρ r k r( ) = ( )Σocc iΨ �,2
E E E Eke es xcρ ρ ρ ρ[ ] = [ ]+ [ ]+ [ ]
E E a E Asurface = ( ) − ∞( ){ } 2
1985; Smith and Ferrante, 1986). The calculations were simplified by using the jellium model to representthe ionic charge. In the jellium model the ionic charge is smeared into a uniform distribution. Both setsof authors introduced the effects of discreteness on the ionic contribution through perturbation theoryfor the electron–ion interaction and through lattice sums for the ion–ion interaction. The jellium modelis only expected to give reasonable results for the densest packed planes of simple metals.
In Figures 1.7 and 1.8 we show the electron distribution at a jellium surface for Na and for anAl(111)–Mg(0001) interface (Ferrante and Smith, 1985) that is separated by a small distance. In Figure 1.7we can see the characteristic decay of the electron density away from the surface. In Figure 1.8 we seethe change in electron density in going from one material to another. This characteristic tailing is anindication of the reactivity of the metal surface.
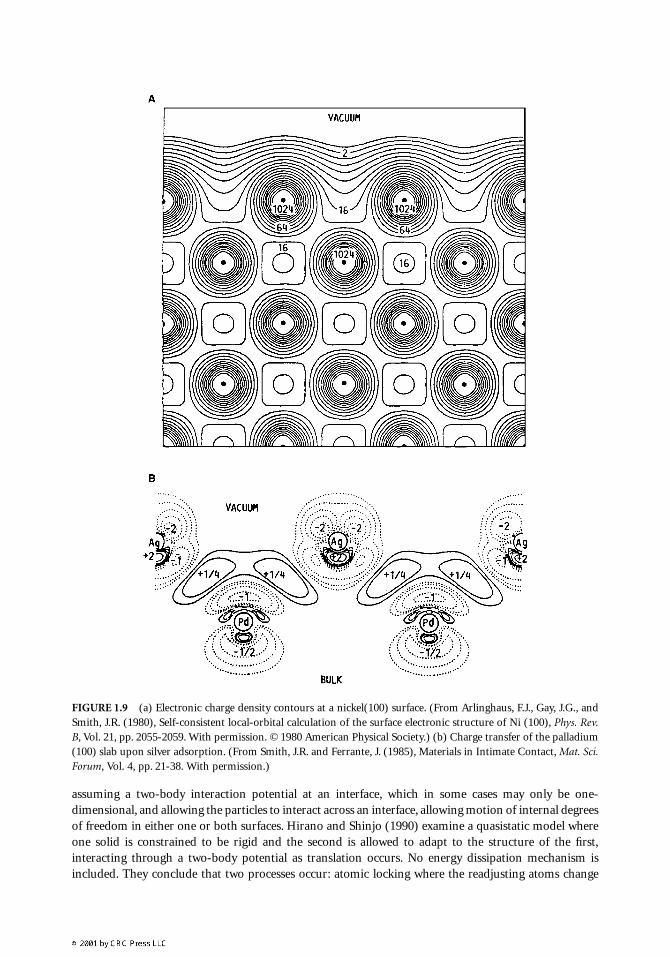
In Figure 1.9 we show the electron distribution for a nickel(100) surface for the fully three-dimensionalcalculations performed by Arlinghouse et al. (1980) and that for a silver layer adsorbed on a palla-dium(100) interface (Smith and Ferrante, 1985) using self-consistent localized orbitals (SCLO) forapproximations to the wave functions. First, we note that for the Ni surface there is a smoothing of thesurface density characteristic of metals. For the silver adsorption we can see that there are localized chargetransfers and bonding effects indicating that it is necessary to perform three-dimensional calculations inorder to determine bonding effects. Hong et al. (1995) have also examined metal ceramic interfaces andthe effects of impurities at the interface on the interfacial strength.
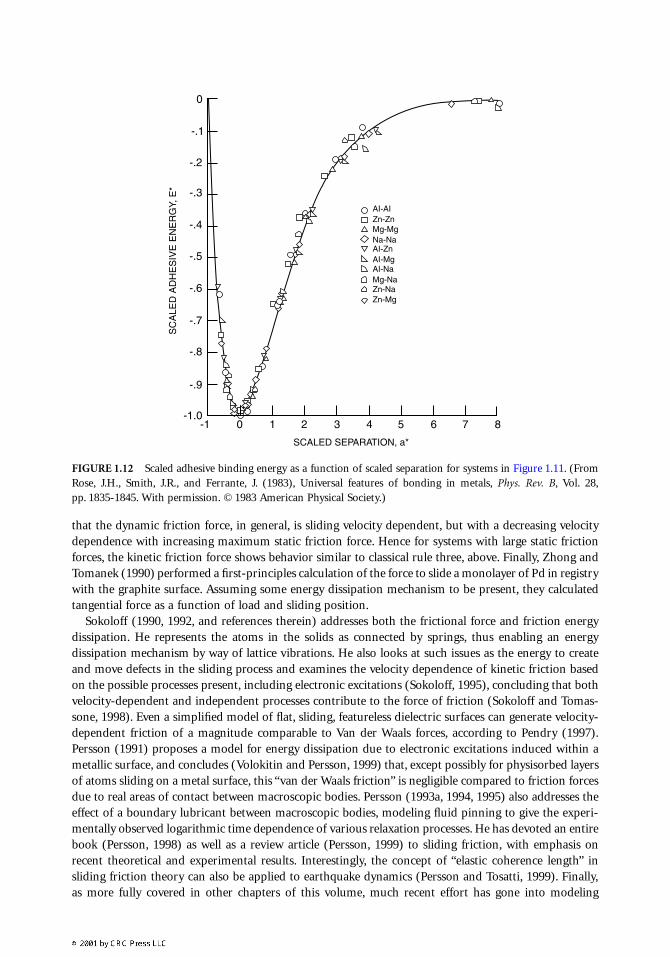
In Figure 1.10 we schematically show the results of determining the interfacial energies as a functionof separation between the surfaces with the energy in Figure 1.10a and the derivative curves giving theinterfacial strength. In Figure 1.11 we show Ferrante and Smith’s results for a number of interfaces ofjellium metals (Ferrante and Smith, 1985; Smith and Ferrante, 1986; Banerjea et al., 1991). Rose et al.(1981, 1983) found that these curves would scale onto one universal curve and indeed that this resultapplied to many other bonding situations including results of fully three-dimensional calculations. Weshow the scaled curves from Figure 1.11 in Figure 1.12. A very useful generalization of the original workcan be applied to multicomponent alloy surfaces (Bozzolo et al., 1999). Somewhat surprisingly becauseof large charge transfer, Hong et al. (1995) found that this same behavior also is applicable tometal–ceramic interfaces. Finnis (1996) gives a review of metal–ceramic interface theory.
The complexities that we described earlier with regard to surface relaxations and complex structurescan also be treated now by modern theoretical techniques. Often in these cases it is necessary to use“supercells” (Lambrecht and Segall, 1989). Since these structures are extended, it would require manyatoms to represent a defect. Instead, in order to model a defect and take advantage of the simplicities ofperiodicities, a cell is created selected at a size which will mimic the main energetics of the defects. Inconclusion, theoretical techniques have advanced substantially and are continuing to do so. They haveand will shed light on many problems of interest experimentally.
1.3.2 Friction Fundamentals
Friction, as commonly used, refers to a force resisting sliding. It is of obvious importance since it is theenergy loss mechanism in sliding processes. In spite of its importance, after many centuries frictionsurprisingly has still avoided a complete physical explanation. An excellent history of the subject is givenin a text by Dowson (1979). In this section we will outline some of the basic observations and give somerecent relevant references treating the subject at the atomic level, in keeping with the theme of this chapter,and since the whole topic is much too complicated to treat in such a small space.
There are two basic issues, the nature of the friction force and the energy dissipation mechanism.There are several commonplace observations, often considered general rules, regarding the friction forceas outlined in the classic discussions of the subject by Bowden and Tabor (1964):
1. The friction force does not depend on the apparent area of contact.2. The friction force is proportional to the normal load.3. The kinetic friction force does not depend on the velocity and is less than the static friction force.
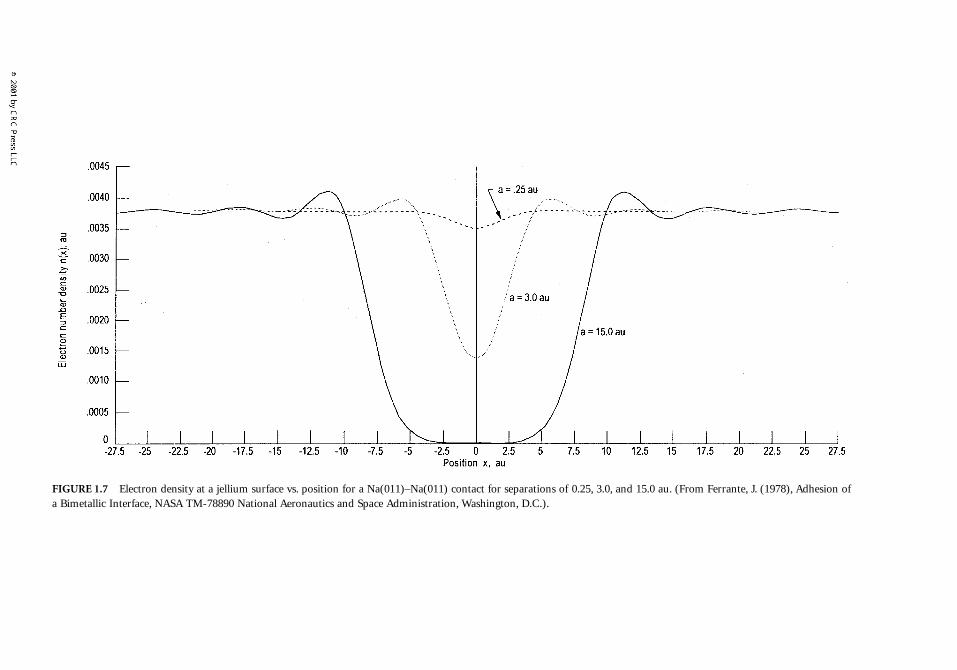
FIGURE 1.7
Electr ations of 0.25, 3.0, and 15.0 au. (From Ferrante, J. (1978), Adhesion ofa Bimetallic Interfac .C.).
on density at a jellium surface vs. position for a Na(011)–Na(011) contact for separe, NASA TM-78890 National Aeronautics and Space Administration, Washington, D
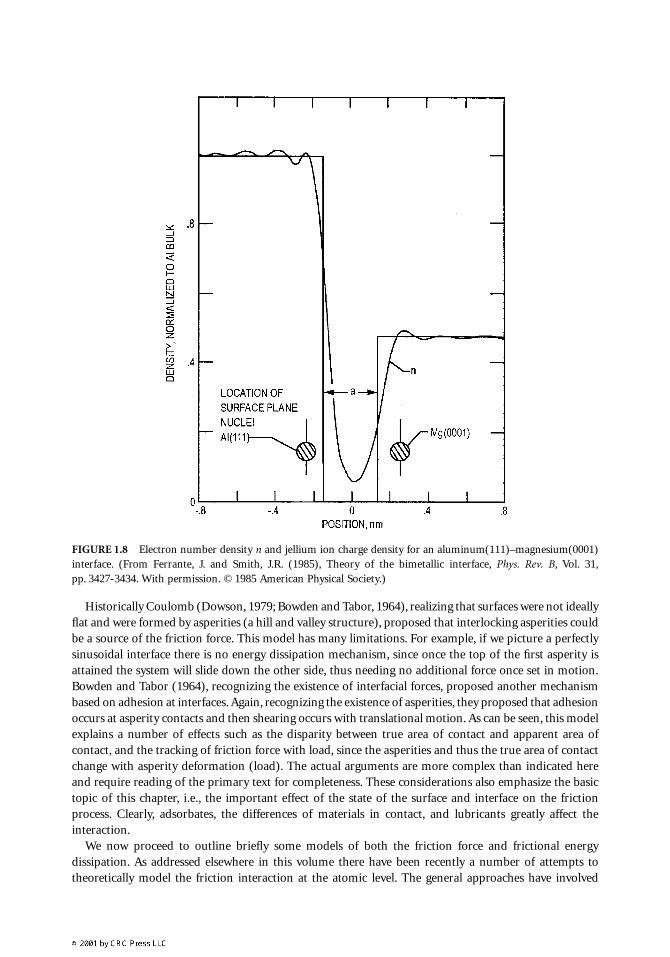
Historically Coulomb (Dowson, 1979; Bowden and Tabor, 1964), realizing that surfaces were not ideallyflat and were formed by asperities (a hill and valley structure), proposed that interlocking asperities couldbe a source of the friction force. This model has many limitations. For example, if we picture a perfectlysinusoidal interface there is no energy dissipation mechanism, since once the top of the first asperity isattained the system will slide down the other side, thus needing no additional force once set in motion.Bowden and Tabor (1964), recognizing the existence of interfacial forces, proposed another mechanismbased on adhesion at interfaces. Again, recognizing the existence of asperities, they proposed that adhesionoccurs at asperity contacts and then shearing occurs with translational motion. As can be seen, this modelexplains a number of effects such as the disparity between true area of contact and apparent area ofcontact, and the tracking of friction force with load, since the asperities and thus the true area of contactchange with asperity deformation (load). The actual arguments are more complex than indicated hereand require reading of the primary text for completeness. These considerations also emphasize the basictopic of this chapter, i.e., the important effect of the state of the surface and interface on the frictionprocess. Clearly, adsorbates, the differences of materials in contact, and lubricants greatly affect theinteraction.
We now proceed to outline briefly some models of both the friction force and frictional energydissipation. As addressed elsewhere in this volume there have been recently a number of attempts totheoretically model the friction interaction at the atomic level. The general approaches have involved
FIGURE 1.8 Electron number density n and jellium ion charge density for an aluminum(111)–magnesium(0001)interface. (From Ferrante, J. and Smith, J.R. (1985), Theory of the bimetallic interface, Phys. Rev. B, Vol. 31,pp. 3427-3434. With permission. © 1985 American Physical Society.)
assuming a two-body interaction potential at an interface, which in some cases may only be one-dimensional, and allowing the particles to interact across an interface, allowing motion of internal degreesof freedom in either one or both surfaces. Hirano and Shinjo (1990) examine a quasistatic model whereone solid is constrained to be rigid and the second is allowed to adapt to the structure of the first,interacting through a two-body potential as translation occurs. No energy dissipation mechanism isincluded. They conclude that two processes occur: atomic locking where the readjusting atoms change
FIGURE 1.9 (a) Electronic charge density contours at a nickel(100) surface. (From Arlinghaus, F.J., Gay, J.G., andSmith, J.R. (1980), Self-consistent local-orbital calculation of the surface electronic structure of Ni (100), Phys. Rev.B, Vol. 21, pp. 2055-2059. With permission. © 1980 American Physical Society.) (b) Charge transfer of the palladium(100) slab upon silver adsorption. (From Smith, J.R. and Ferrante, J. (1985), Materials in Intimate Contact, Mat. Sci.Forum, Vol. 4, pp. 21-38. With permission.)
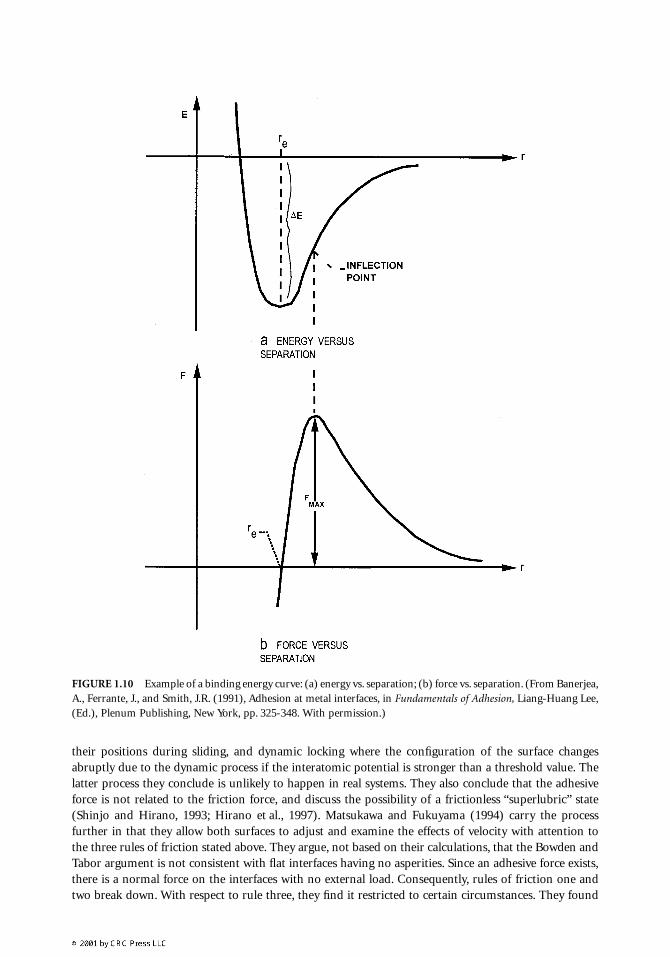
their positions during sliding, and dynamic locking where the configuration of the surface changesabruptly due to the dynamic process if the interatomic potential is stronger than a threshold value. Thelatter process they conclude is unlikely to happen in real systems. They also conclude that the adhesiveforce is not related to the friction force, and discuss the possibility of a frictionless “superlubric” state(Shinjo and Hirano, 1993; Hirano et al., 1997). Matsukawa and Fukuyama (1994) carry the processfurther in that they allow both surfaces to adjust and examine the effects of velocity with attention tothe three rules of friction stated above. They argue, not based on their calculations, that the Bowden andTabor argument is not consistent with flat interfaces having no asperities. Since an adhesive force exists,there is a normal force on the interfaces with no external load. Consequently, rules of friction one andtwo break down. With respect to rule three, they find it restricted to certain circumstances. They found
FIGURE 1.10 Example of a binding energy curve: (a) energy vs. separation; (b) force vs. separation. (From Banerjea,A., Ferrante, J., and Smith, J.R. (1991), Adhesion at metal interfaces, in Fundamentals of Adhesion, Liang-Huang Lee,(Ed.), Plenum Publishing, New York, pp. 325-348. With permission.)
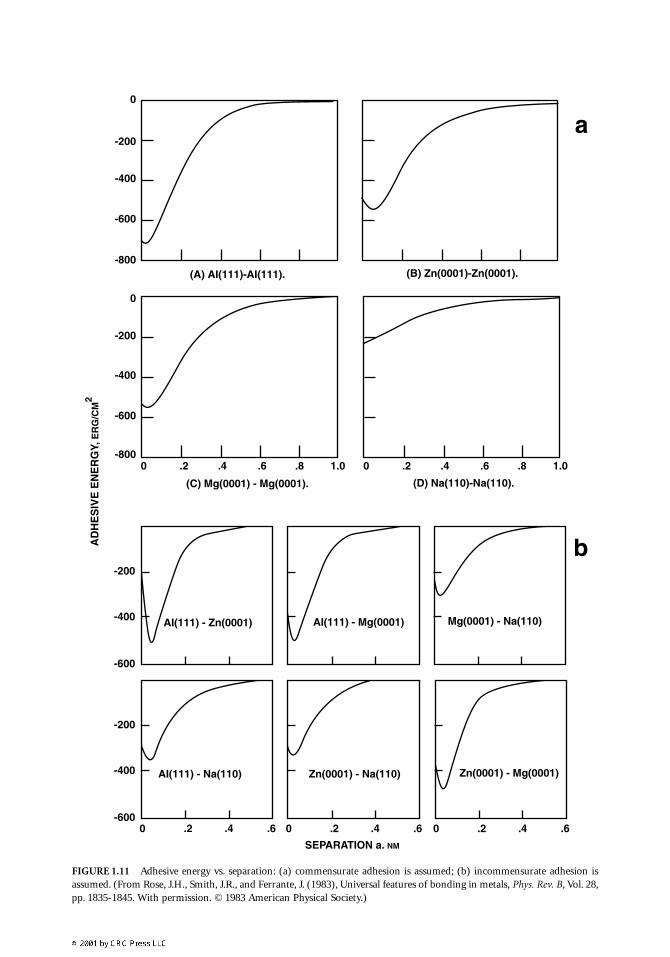
FIGURE 1.11 Adhesive energy vs. separation: (a) commensurate adhesion is assumed; (b) incommensurate adhesion isassumed. (From Rose, J.H., Smith, J.R., and Ferrante, J. (1983), Universal features of bonding in metals, Phys. Rev. B, Vol. 28,pp. 1835-1845. With permission. © 1983 American Physical Society.)
0
-200
-400
-600
-800(A) AI(111)-AI(111).
0
-200
-400
-600
-800
-200
-400
-600
(C) Mg(0001) - Mg(0001).
AD
HE
SIV
E E
NE
RG
Y, E
RG
/CM
2
AI(111) - Zn(0001)
0 .2 .4 .6 .8 1.0
(D) Na(110)-Na(110).
0 .2 .4 .6 .8 1.0
(B) Zn(0001)-Zn(0001).
a
b
AI(111) - Mg(0001) Mg(0001) - Na(110)
-200
-400
-6000 .2 .4 .6
AI(111) - Na(110)
0 .2 .4 .6
Zn(0001) - Na(110)
SEPARATION a. NM
0 .2 .4 .6
Zn(0001) - Mg(0001)
that the dynamic friction force, in general, is sliding velocity dependent, but with a decreasing velocitydependence with increasing maximum static friction force. Hence for systems with large static frictionforces, the kinetic friction force shows behavior similar to classical rule three, above. Finally, Zhong andTomanek (1990) performed a first-principles calculation of the force to slide a monolayer of Pd in registrywith the graphite surface. Assuming some energy dissipation mechanism to be present, they calculatedtangential force as a function of load and sliding position.
Sokoloff (1990, 1992, and references therein) addresses both the frictional force and friction energydissipation. He represents the atoms in the solids as connected by springs, thus enabling an energydissipation mechanism by way of lattice vibrations. He also looks at such issues as the energy to createand move defects in the sliding process and examines the velocity dependence of kinetic friction basedon the possible processes present, including electronic excitations (Sokoloff, 1995), concluding that bothvelocity-dependent and independent processes contribute to the force of friction (Sokoloff and Tomas-sone, 1998). Even a simplified model of flat, sliding, featureless dielectric surfaces can generate velocity-dependent friction of a magnitude comparable to Van der Waals forces, according to Pendry (1997).Persson (1991) proposes a model for energy dissipation due to electronic excitations induced within ametallic surface, and concludes (Volokitin and Persson, 1999) that, except possibly for physisorbed layersof atoms sliding on a metal surface, this “van der Waals friction” is negligible compared to friction forcesdue to real areas of contact between macroscopic bodies. Persson (1993a, 1994, 1995) also addresses theeffect of a boundary lubricant between macroscopic bodies, modeling fluid pinning to give the experi-mentally observed logarithmic time dependence of various relaxation processes. He has devoted an entirebook (Persson, 1998) as well as a review article (Persson, 1999) to sliding friction, with emphasis onrecent theoretical and experimental results. Interestingly, the concept of “elastic coherence length” insliding friction theory can also be applied to earthquake dynamics (Persson and Tosatti, 1999). Finally,as more fully covered in other chapters of this volume, much recent effort has gone into modeling
FIGURE 1.12 Scaled adhesive binding energy as a function of scaled separation for systems in Figure 1.11. (FromRose, J.H., Smith, J.R., and Ferrante, J. (1983), Universal features of bonding in metals, Phys. Rev. B, Vol. 28,pp. 1835-1845. With permission. © 1983 American Physical Society.)
0
-.1
-.2
-.3
-.4
-.5
-.6
-.7
-.8
-.9
-1.0-1 0 1 2 3 4 5 6 7 8
SCALED SEPARATION, a*
SC
ALE
D A
DH
ES
IVE
EN
ER
GY,
E*
AI-AI
AI-ZnAI-MgAI-NaMg-NaZn-NaZn-Mg
Zn-ZnMg-MgNa-Na
specifically the lateral force component of a probe tip interaction with a sample surface in scanning probemicroscopy (e.g., Hölscher et al., 1997; Diestler et al., 1997, and references therein; Lantz et al., 1997).
In conclusion, while these types of simulations may not reflect the full complexity of real materials,they are necessary and useful. Although limited in scope, it is necessary to break down such complexproblems into isolated phenomena which, it is hoped, can result in the eventual unification in the largerpicture. It simply is difficult to isolate the various components contributing to friction experimentally.
1.4 Experimental Determinations of Surface Structure
In this section we will discuss three techniques for determining the structure of a crystal surface, low-energy electron diffraction (LEED), high-resolution electron microscopy (HREM), and field ion micros-copy (FIM). The first, LEED, is a diffraction method for determining structure, and the latter two aremethods to view the lattices directly. There are other methods for determining structure, such as ionscattering (Niehus et al., 1993), low-energy backscattered electrons (De Crescenzi, 1995), and even sec-ondary electron holography (Chambers, 1992) which we will not discuss. Other contributors to thisvolume address scanning probe microscopy and tribology, which are also nicely covered in an extensivereview article by Carpick and Salmeron (1997).
1.4.1 Low-Energy Electron Diffraction
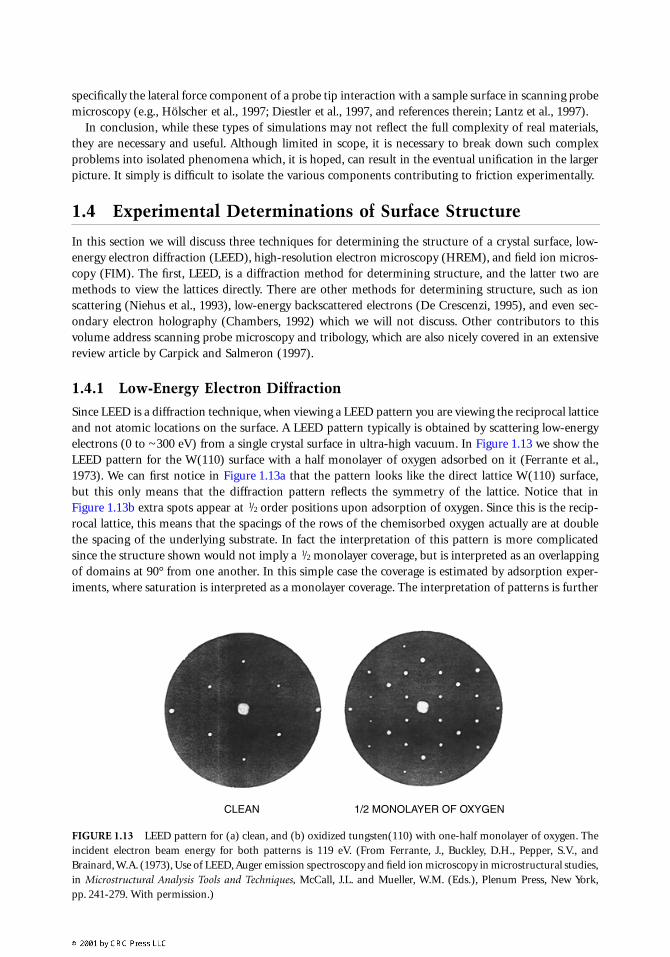
Since LEED is a diffraction technique, when viewing a LEED pattern you are viewing the reciprocal latticeand not atomic locations on the surface. A LEED pattern typically is obtained by scattering low-energyelectrons (0 to ~300 eV) from a single crystal surface in ultra-high vacuum. In Figure 1.13 we show theLEED pattern for the W(110) surface with a half monolayer of oxygen adsorbed on it (Ferrante et al.,1973). We can first notice in Figure 1.13a that the pattern looks like the direct lattice W(110) surface,but this only means that the diffraction pattern reflects the symmetry of the lattice. Notice that inFigure 1.13b extra spots appear at 1/2 order positions upon adsorption of oxygen. Since this is the recip-rocal lattice, this means that the spacings of the rows of the chemisorbed oxygen actually are at doublethe spacing of the underlying substrate. In fact the interpretation of this pattern is more complicatedsince the structure shown would not imply a 1/2 monolayer coverage, but is interpreted as an overlappingof domains at 90° from one another. In this simple case the coverage is estimated by adsorption exper-iments, where saturation is interpreted as a monolayer coverage. The interpretation of patterns is further
FIGURE 1.13 LEED pattern for (a) clean, and (b) oxidized tungsten(110) with one-half monolayer of oxygen. Theincident electron beam energy for both patterns is 119 eV. (From Ferrante, J., Buckley, D.H., Pepper, S.V., andBrainard, W.A. (1973), Use of LEED, Auger emission spectroscopy and field ion microscopy in microstructural studies,in Microstructural Analysis Tools and Techniques, McCall, J.L. and Mueller, W.M. (Eds.), Plenum Press, New York,pp. 241-279. With permission.)
CLEAN 1/2 MONOLAYER OF OXYGEN
complicated, since with complex structures such as the silicon 7 × 7 pattern, the direct lattice producingthis reciprocal lattice is not unique. Therefore it is necessary to have a method to select between possiblestructures (Rous and Pendry, 1989).
We now digress for a moment in order to discuss the diffraction process. The most familiar referencework is X-ray diffraction (Kittel, 1986). We know that for X-rays the diffraction pattern of the bulk wouldproduce what is known as a Laue pattern where the spots represent reflections from different planes.The standard diffraction condition for constructive interference of a wave reflected from successive planesis given by the Bragg equation
(1.10)
where d is an interplanar spacing, θ is the diffraction angle, λ is the wavelength of the incident radiation,and n is an integer indicating the order of diffraction. Only certain values of θ are allowed wherediffractions from different sets of parallel planes add up constructively. There is another simple methodfor picturing the diffraction process known as the Ewald sphere construction (Kittel, 1986), where it canbe easily shown that the Bragg condition is equivalent to the relationship
(1.11)
where k is the wave vector (2π/λ) of the incident beam, k′′′′ is the wave vector of the diffracted beam, andG is a reciprocal lattice vector. The magnitude of the wave vectors k = k′ are equal since momentum isconserved, i.e., we are only considering elastic scattering. Therefore a sphere of radius k can be con-structed, which when intersecting a reciprocal lattice point indicates a diffracted beam. This is equivalentto the wave vector difference being equal to a reciprocal lattice vector, with that reciprocal lattice vectornormal to the set of planes of interest, and θ the angle between the wave vectors. In complex patterns,spot intensities are used to distinguish between possible structures. The equivalent Ewald constructionfor LEED is shown in Figure 1.14. We note that the reciprocal lattice for a true two-dimensional surfacewould be a set of rods instead of a set of points. Consequently the Ewald sphere will always intersect therods and give diffraction spots resulting from interferences due to scattering between rows of surfaceatoms, with the number of spots changing with electron wavelength and incident angle. However, forLEED, complexity results from spot intensity modulation by the three-dimensional lattice structure. InX-ray diffraction the scattering is described as kinematic, which means that only single scattering eventsare considered. With LEED, multiple scattering occurs because of the low energy of the incident electrons;thus, structure determination involves solving a difficult quantum mechanics problem. Generally, variouspossible structures are constructed, and the multiple scattering problem is solved for each proposedstructure. The structure which minimizes the difference between the experimental intensity curves andthe theoretical calculations is the probable structure. There are a number of parameters involved withatomic positions and electronic properties, and the best fit parameter is denoted as the “R-factor.” Inspite of the complexity, considerable progress has been made, and computer programs for performingthe analysis are available (Van Hove et al., 1993). The LEED structures give valuable information aboutadsorbate binding which can be used in the energy calculations described previously.
1.4.2 High-Resolution Electron Microscopy
Fundamentally, materials derive their properties from their make-up and structure, even down to thelevel of the atomic ordering in alloys. In order to fully understand the behavior of materials as a functionof their composition, processing history, and structural characteristics, the highest resolution examinationtools are needed. In this section we will limit the discussion to electron microscopy techniques usingcommonly available equipment and capable of achieving atomic-scale resolution. Traditional scanningelectron microscopy (SEM), therefore, will not be discussed, though in tribology SEM has been andshould continue to prove very useful, particularly when combined with X-ray spectroscopy. Many modern
2d n⋅ =sinθ λ
k k G− ′ =

Auger electron spectrometers (discussed in the next section on surface chemical analysis) also have high-resolution scanning capabilities, and thus can perform imaging functions similar to a traditional SEM.
Another technique not discussed here is photoelectron emission microscopy (PEEM). While PEEMcan routinely image photoelectron yield (related to the work function) differences due to single atomiclayers, lateral resolution typically suffers in comparison to SEM. PEEM has been applied to tribologicalmaterials, however, with interesting results (Montei and Kordesch, 1996).
Both transmission electron microscopy (TEM) and scanning transmission electron microscopy(STEM) make use of an electron beam accelerated through a potential of, typically, up to a few hundredkilovolts. Generically, the parts of a S/TEM consist of an electron source such as a hot filament or fieldemission tip, a vacuum column down which the accelerated and collimated electrons are focused byusually magnetic lenses, and an image collection section, often comprised of a fluorescent screen or CCDcamera for immediate viewing combined with a film transport and exposure mechanism for recordingimages. The sample is inserted directly into the beam column and must be electron transparent, both ofwhich severely limit sample size. There are numerous good texts available about just TEM and STEM(e.g., Hirsch et al., 1977; Thomas and Goringe, 1979).
An advantage to probing a sample with high-energy electrons lies in the De Broglie formula relatingthe motion of a particle to its wavelength
(1.12)
where λ is the electron wavelength, h is the Planck constant, m is the particle mass, and Ek is the kineticenergy of the particle. An electron accelerated through a 100 kV potential then has a wavelength of
FIGURE 1.14 Ewald sphere construction for LEED. (From Ferrante, J., Buckley, D.H., Pepper, S.V., and Brainard,W.A. (1973), Use of LEED, Auger emission spectroscopy and field ion microscopy in microstructural studies, inMicrostructural Analysis Tools and Techniques, McCall, J.L. and Mueller, W.M. (Eds.), Plenum Press, New York,pp. 241-279. With permission.)
FluorescentScreen
1/dCrystal
1/λ = V/150
EwaldSphere
θ
ElectronGun
DiffractedElectronsnλ = d sin θ
Reciprocal NetRods
λ = ( )h mEk21 2
0.04 Ångstom, well below any diffraction limitation on atomic resolution imaging. This is in contrastwith LEED, for which electron wavelengths are typically of the same order as interatomic spacings. Asthe electron beam energy increases in S/TEM, greater sample thickness can be penetrated with usablesignal reaching the detector. Mitchell (1973) discusses the advantages of using very high acceleratingvoltages, which at the time included TEM voltages up to 3 MV. More recently, commercially availableinstruments have taken advantage of the sub-angstrom electron wavelengths with design advances allow-ing routine achievement of atomic-scale imaging, though image interpretation becomes an issue at thatscale (Smith, 1997).
As the electron beam traverses a sample, any crystalline regions illuminated will diffract the beam,forming patterns characteristic of the crystal type. Apertures in the microscope column allow the dif-fraction patterns of selected sample areas to be observed. Electron diffraction patterns combined withan ability to tilt the sample make determination of crystal symmetry and orientation relatively easy, asdiscussed in Section 1.4.1 above for X-ray Ewald sphere construction. Electrons traversing the samplecan also undergo an inelastic collision (losing energy), followed by coherent rescattering. This gives riseto cones of radiation which reveal the symmetry of the reflecting crystal planes, showing up in diffractionimages as “Kikuchi lines,” named after the discoverer of the phenomenon. The geometry of the Kikuchilines provides a convenient way of determining crystal orientation with fairly high accuracy. Anothertechnique for illuminating sample orientation uses an aperture to select one of the diffracted beams toform the image, which nicely highlights sample area from which that diffracted beam originates (“dark-field” imaging technique).
One source of TEM image contrast is the electron beam interacting with crystal defects such as variousdislocations, stacking faults, or even strain around a small inclusion. How that contrast changes withmicroscope settings can reveal information about the defect. For example, screw dislocations may “dis-appear” (lose contrast) for specific relative orientations of crystal and electron beam. An additional toolin examining extended three-dimensional structures within a sample is stereomicroscopy, where twoimages of the same area are captured tilted from one another, typically by around 10°. The two viewsare then simultaneously shown, each to one eye, to reveal image feature depth.
For sample elemental composition, an X-ray spectrometer and/or an electron energy-loss spectrometercan be added to the S/TEM. Particularly for STEM, due to minimal beam spreading during passagethrough the sample the analyzed volume for either spectrometer can be as small as tens of nanometersin diameter. X-ray and electron energy-loss spectrometers are somewhat complementary in their rangesof easily detected elements. Characteristic X-rays are more probable when exciting the heavier elements,while electron energy losses due to light element K-shell excitations are easily resolvable.
Both TEM and STEM rely on transmission of an electron beam through the sample, placing an upperlimit on specimen thickness which depends on the accelerating voltage available and on specimencomposition. Samples are often thinned to less than a micrometer, with lateral dimensions limited to afew millimeters. An inherent difficulty in S/TEM sample preparation is locating a given region of interestwithin the region of visibility in the microscope, without altering sample characteristics during anythinning process needed. For resolution at an atomic scale, columns of lighter element atoms are neededfor image contrast, so individual atoms are not “seen.” Samples also need to be somewhat vacuumcompatible, or at least stable enough in vacuum to allow examination. The electron beam itself may alterthe specimen either by heating, by breaking down compounds within the sample, or by depositing carbonon the sample surface if there are residual hydrocarbons in the microscope vacuum. In short, S/TEMspecimens should be robust under high-energy electron bombardment in vacuum.
1.4.3 Field Ion Microscopy
For many decades, field ion microscopy (FIM) has provided direct lattice images from sharp metal tips.Some early efforts to examine contact adhesion used the FIM tip as a model asperity, which was broughtinto contact with various surfaces (Mueller and Nishikawa, 1968; Nishikawa and Mueller, 1968; Brainardand Buckley, 1971, 1973; Ferrante et al., 1973). As well, FIM has been applied to the study of friction
(Tsukizoe et al., 1985), the effect of adsorbed oxygen on adhesion (Ohmae et al., 1987), and even directexamination of solid lubricants (Ohmae et al., 1990).
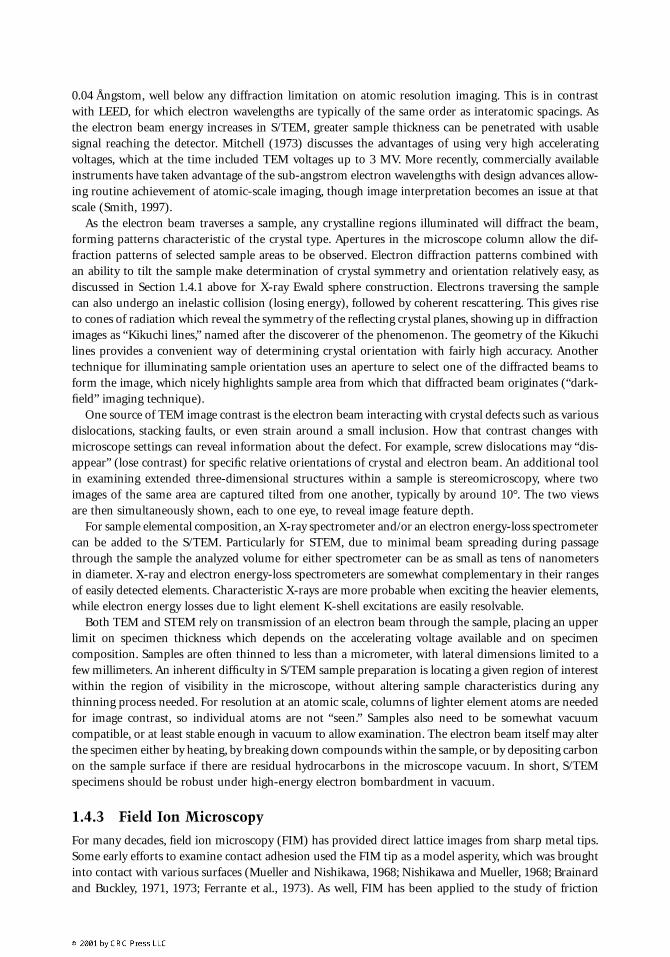
In FIM a sharp metal tip is biased to a high negative potential relative to a phosphor-coated screen inan evacuated chamber backfilled to about a millitorr with helium or other noble gas. A helium atomimpinging on the tip experiences a high electric field due to the small tip radius. This field polarizes theatom, potentially creating a helium ion. Ionization is most probable directly over atoms in the tip wherethe local radius of curvature is highest. Often, only 10 to 15% of the atoms on the tip located at the zoneedges and at kink sites are visible. The helium ions are then accelerated to a phosphorescent screen atsome distance from the tip, giving a large geometric magnification. Uncertainty in surface atom positionsis often reduced by cooling the tip to liquid helium temperature. Figure 1.15 is a FIM pattern for a cleantungsten tip oriented in the (110) direction. The small rings are various crystallographic planes thatappear on a hemispherical single crystal surface. A classic discussion of FIM pattern interpretation canbe found in Mueller (1969); a review has been published by Kellogg (1994); and a more extensivediscussion of FIM in tribology can be found in Ohmae (1993).
1.5 Chemical Analysis of Surfaces
In this section we will discuss four of the many surface chemical analytic tools which we feel have hadthe widest application in tribology, Auger electron spectroscopy (AES), X-ray photoelectron spectroscopy(XPS), secondary ion mass spectroscopy (SIMS), and infrared spectroscopy (IR). AES gives elementalanalysis of surfaces, but in some cases will give chemical compound information. XPS can give compoundinformation as well as elemental. SIMS can exhibit extreme element sensitivity as well as “fingerprint”lubricant molecules. IR can identify hydrocarbons on surfaces, which is relevant because most lubricantsare hydrocarbon based. Hantsche (1989) gives a basic comparison of some surface analytic techniques,and surface characterization advances have been reviewed every 2 years since 1977 in the journal Ana-lytical Chemistry (e.g., McGuire et al., 1999).
Before launching into this discussion we wish to present a general discussion of surface analyses. Weuse a process diagram to describe them given as
FIGURE 1.15 Field ion microscope pattern of a clean tungsten tip oriented in the (110) direction. (From Ferrante,J., Buckley, D.H., Pepper, S.V., and Brainard, W.A. (1973), Use of LEED, Auger emission spectroscopy and field ionmicroscopy in microstructural studies, in Microstructural Analysis Tools and Techniques, McCall, J.L. and Mueller,W.M. (Eds.), Plenum Press, New York, pp. 241-279. With permission.)
EXCITATION (INTERACTION)
⇓
DISPERSION
⇓
DETECTION
⇓
SPECTROGRAM
The first step, excitation in interaction, represents production of the particles or radiation to beanalyzed. In light or photon emission spectroscopy a spark causes the excitation of atoms to higher energystates, thus emitting characteristic photons. The dispersion stage could be thought of as a filtering processwhere the selected information is allowed to pass and other information is rejected. In light spectroscopythis would correspond to the use of a grating or prism, for an ion or electron it might be an electrostaticanalyzer. Next is detection of the particle which could be a photographic plate for light or an electronmultiplier for ions or electrons. And, finally, the spectrogram tells what materials are present and hopefullyhow much is there.
1.5.1 Auger Electron Spectroscopy
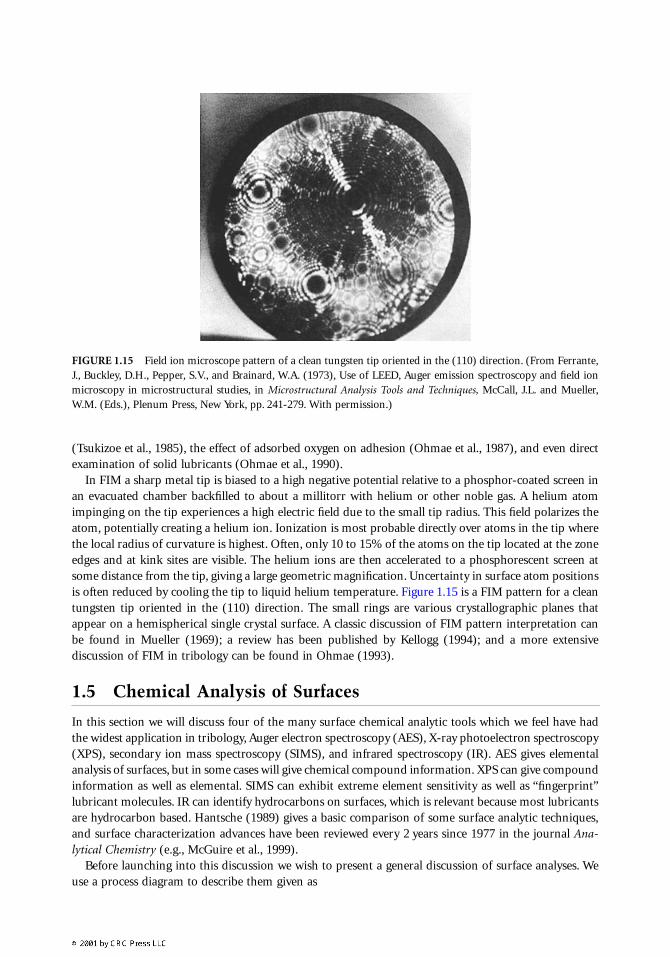
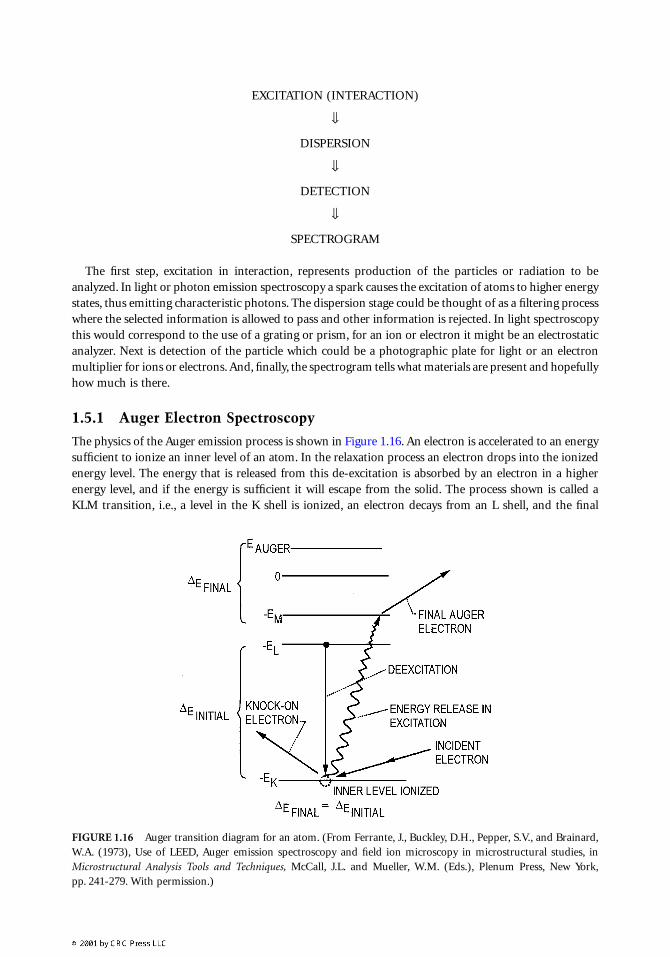
The physics of the Auger emission process is shown in Figure 1.16. An electron is accelerated to an energysufficient to ionize an inner level of an atom. In the relaxation process an electron drops into the ionizedenergy level. The energy that is released from this de-excitation is absorbed by an electron in a higherenergy level, and if the energy is sufficient it will escape from the solid. The process shown is called aKLM transition, i.e., a level in the K shell is ionized, an electron decays from an L shell, and the final
FIGURE 1.16 Auger transition diagram for an atom. (From Ferrante, J., Buckley, D.H., Pepper, S.V., and Brainard,W.A. (1973), Use of LEED, Auger emission spectroscopy and field ion microscopy in microstructural studies, inMicrostructural Analysis Tools and Techniques, McCall, J.L. and Mueller, W.M. (Eds.), Plenum Press, New York,pp. 241-279. With permission.)
electron is emitted from an M shell. Similarly, a process involving different levels will have correspondingnomenclature. The energy of the emitted electron has a simple relationship to the energies of the levelsinvolved, depending only on differences between these levels. The relationships for the process shown are
(1.13)
giving
(1.14)
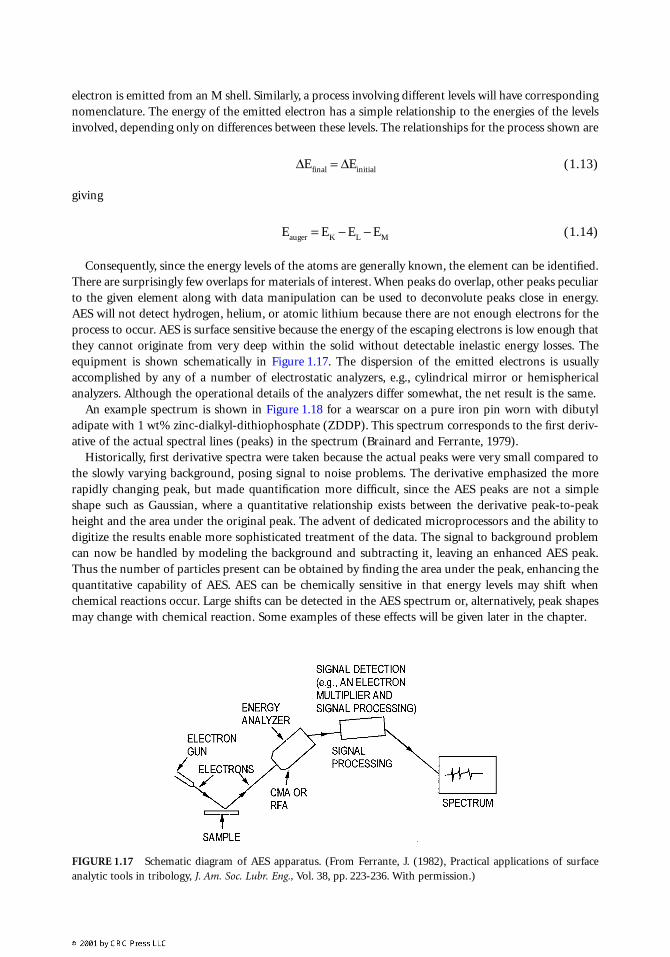
Consequently, since the energy levels of the atoms are generally known, the element can be identified.There are surprisingly few overlaps for materials of interest. When peaks do overlap, other peaks peculiarto the given element along with data manipulation can be used to deconvolute peaks close in energy.AES will not detect hydrogen, helium, or atomic lithium because there are not enough electrons for theprocess to occur. AES is surface sensitive because the energy of the escaping electrons is low enough thatthey cannot originate from very deep within the solid without detectable inelastic energy losses. Theequipment is shown schematically in Figure 1.17. The dispersion of the emitted electrons is usuallyaccomplished by any of a number of electrostatic analyzers, e.g., cylindrical mirror or hemisphericalanalyzers. Although the operational details of the analyzers differ somewhat, the net result is the same.
An example spectrum is shown in Figure 1.18 for a wearscar on a pure iron pin worn with dibutyladipate with 1 wt% zinc-dialkyl-dithiophosphate (ZDDP). This spectrum corresponds to the first deriv-ative of the actual spectral lines (peaks) in the spectrum (Brainard and Ferrante, 1979).
Historically, first derivative spectra were taken because the actual peaks were very small compared tothe slowly varying background, posing signal to noise problems. The derivative emphasized the morerapidly changing peak, but made quantification more difficult, since the AES peaks are not a simpleshape such as Gaussian, where a quantitative relationship exists between the derivative peak-to-peakheight and the area under the original peak. The advent of dedicated microprocessors and the ability todigitize the results enable more sophisticated treatment of the data. The signal to background problemcan now be handled by modeling the background and subtracting it, leaving an enhanced AES peak.Thus the number of particles present can be obtained by finding the area under the peak, enhancing thequantitative capability of AES. AES can be chemically sensitive in that energy levels may shift whenchemical reactions occur. Large shifts can be detected in the AES spectrum or, alternatively, peak shapesmay change with chemical reaction. Some examples of these effects will be given later in the chapter.
FIGURE 1.17 Schematic diagram of AES apparatus. (From Ferrante, J. (1982), Practical applications of surfaceanalytic tools in tribology, J. Am. Soc. Lubr. Eng., Vol. 38, pp. 223-236. With permission.)
∆ ∆E Efinal initial=
E E E Eauger K L M= − −
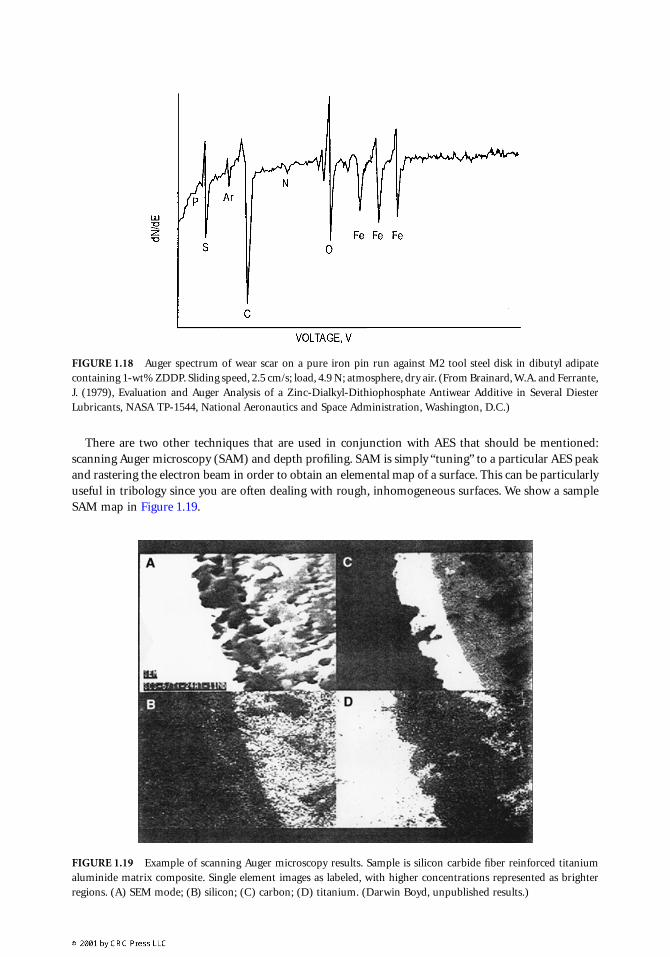
There are two other techniques that are used in conjunction with AES that should be mentioned:scanning Auger microscopy (SAM) and depth profiling. SAM is simply “tuning” to a particular AES peakand rastering the electron beam in order to obtain an elemental map of a surface. This can be particularlyuseful in tribology since you are often dealing with rough, inhomogeneous surfaces. We show a sampleSAM map in Figure 1.19.
FIGURE 1.18 Auger spectrum of wear scar on a pure iron pin run against M2 tool steel disk in dibutyl adipatecontaining 1-wt% ZDDP. Sliding speed, 2.5 cm/s; load, 4.9 N; atmosphere, dry air. (From Brainard, W.A. and Ferrante,J. (1979), Evaluation and Auger Analysis of a Zinc-Dialkyl-Dithiophosphate Antiwear Additive in Several DiesterLubricants, NASA TP-1544, National Aeronautics and Space Administration, Washington, D.C.)
FIGURE 1.19 Example of scanning Auger microscopy results. Sample is silicon carbide fiber reinforced titaniumaluminide matrix composite. Single element images as labeled, with higher concentrations represented as brighterregions. (A) SEM mode; (B) silicon; (C) carbon; (D) titanium. (Darwin Boyd, unpublished results.)
Depth profiling is the process of sputter-eroding a sample by bombarding the surface with ions whilesimultaneously obtaining AES or other spectra. This enables one to obtain the composition of reaction-formed or deposited films on a surface as a function of sputter time or depth, given proper attention tothe effects of sputtering itself (Hofman, 1998). Consequently, AES has many applications for studyingtribological and other surfaces. Some examples will be given in subsequent sections.
1.5.2 X-ray Photoelectron Spectroscopy
The physical processes involved in XPS are simpler than in AES. An X-ray photon ionizes the inner levelof an atom directly, and in this case the emitted electron from the ionization is detected, as opposed toAES where several electron energy levels are involved in the final electron production. The dispersionand detection methods are similar to AES.
Monochromatic, incoming X-ray photons are generated from an elemental target such as magnesiumor aluminum. Measurement of the energy distribution of emitted electrons from the sample permits theidentification of the ionized levels by the simple relation
(1.15)
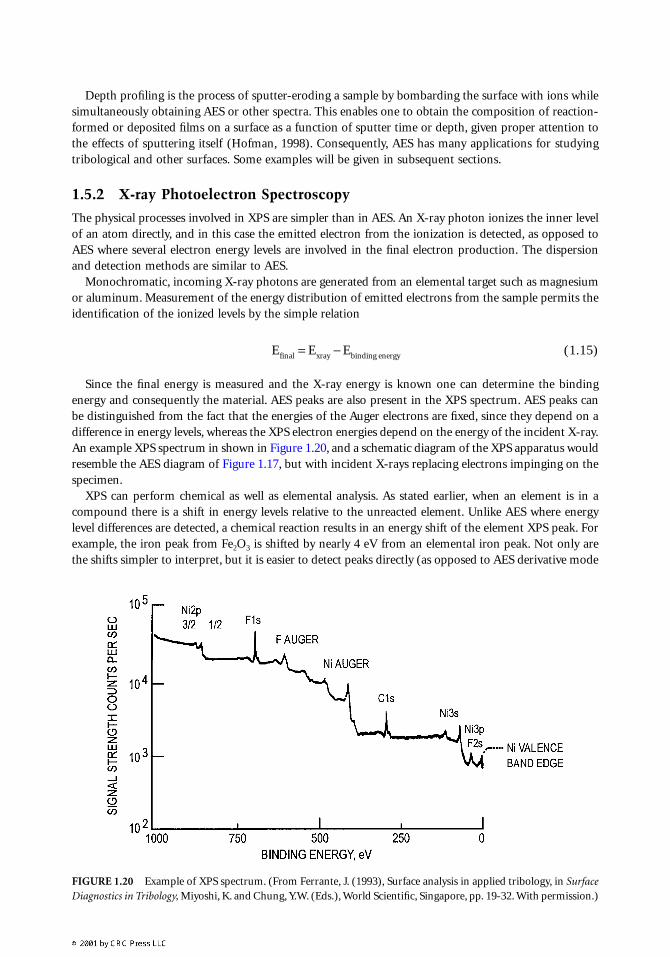
Since the final energy is measured and the X-ray energy is known one can determine the bindingenergy and consequently the material. AES peaks are also present in the XPS spectrum. AES peaks canbe distinguished from the fact that the energies of the Auger electrons are fixed, since they depend on adifference in energy levels, whereas the XPS electron energies depend on the energy of the incident X-ray.An example XPS spectrum in shown in Figure 1.20, and a schematic diagram of the XPS apparatus wouldresemble the AES diagram of Figure 1.17, but with incident X-rays replacing electrons impinging on thespecimen.
XPS can perform chemical as well as elemental analysis. As stated earlier, when an element is in acompound there is a shift in energy levels relative to the unreacted element. Unlike AES where energylevel differences are detected, a chemical reaction results in an energy shift of the element XPS peak. Forexample, the iron peak from Fe2O3 is shifted by nearly 4 eV from an elemental iron peak. Not only arethe shifts simpler to interpret, but it is easier to detect peaks directly (as opposed to AES derivative mode
FIGURE 1.20 Example of XPS spectrum. (From Ferrante, J. (1993), Surface analysis in applied tribology, in SurfaceDiagnostics in Tribology, Miyoshi, K. and Chung, Y.W. (Eds.), World Scientific, Singapore, pp. 19-32. With permission.)
E E Efinal xray= − binding energy
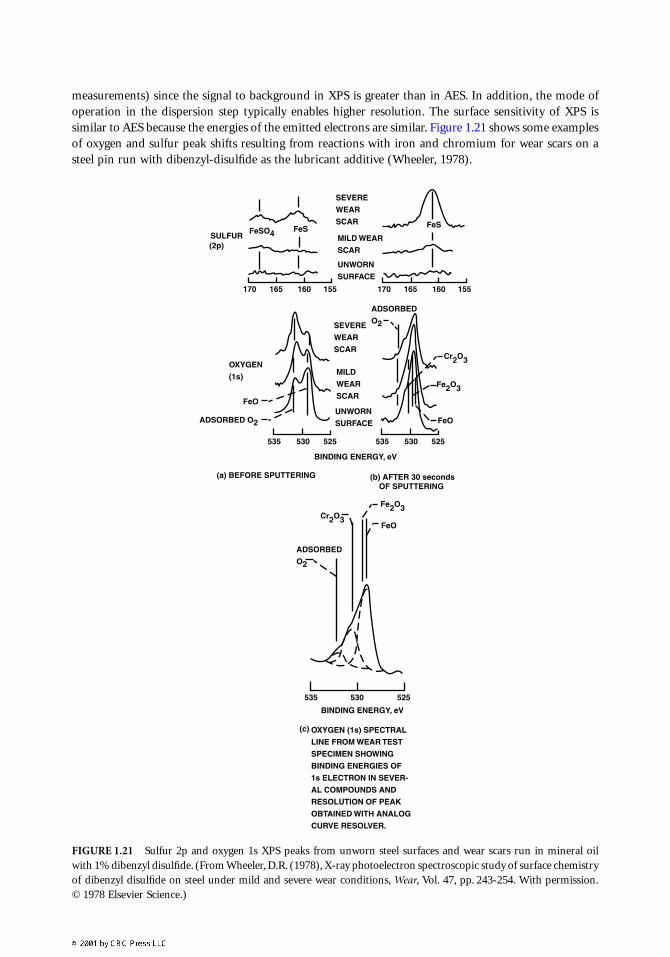
measurements) since the signal to background in XPS is greater than in AES. In addition, the mode ofoperation in the dispersion step typically enables higher resolution. The surface sensitivity of XPS issimilar to AES because the energies of the emitted electrons are similar. Figure 1.21 shows some examplesof oxygen and sulfur peak shifts resulting from reactions with iron and chromium for wear scars on asteel pin run with dibenzyl-disulfide as the lubricant additive (Wheeler, 1978).
FIGURE 1.21 Sulfur 2p and oxygen 1s XPS peaks from unworn steel surfaces and wear scars run in mineral oilwith 1% dibenzyl disulfide. (From Wheeler, D.R. (1978), X-ray photoelectron spectroscopic study of surface chemistryof dibenzyl disulfide on steel under mild and severe wear conditions, Wear, Vol. 47, pp. 243-254. With permission.© 1978 Elsevier Science.)
SULFUR(2p)
FeSO4 FeS FeS
FeO
FeO
SEVERE
WEAR
SCAR
SEVERE
WEAR
SCAR
MILD WEAR
SCAR
MILD
WEAR
SCAR
UNWORN
SURFACE
UNWORN
SURFACE
OXYGEN
(1s)
FeO
170 165 160 155 170 165 160 155
ADSORBED O2
ADSORBED
O2
ADSORBED
O2
Cr2O3
Cr2O3
Fe2O3
Fe2O3
BINDING ENERGY, eV
BINDING ENERGY, eV
(a) BEFORE SPUTTERING (b) AFTER 30 seconds OF SPUTTERING
OXYGEN (1s) SPECTRAL
LINE FROM WEAR TEST
SPECIMEN SHOWING
BINDING ENERGIES OF
1s ELECTRON IN SEVER-
AL COMPOUNDS AND
RESOLUTION OF PEAK
OBTAINED WITH ANALOG
CURVE RESOLVER.
(c)
535 530 525
535 530 525 535 530 525
1.5.3 Secondary Ion Mass Spectroscopy
The physical process involved in SIMS differs from both AES and XPS in that both the excitation sourceand detected particles are ions. Rather than illuminate the sample surface with either electrons (AES) orphotons (XPS), ions are used to bombard the sample surface and knock off (sputter) surface particles.The dispersion phase analyzes the emitted particle masses, instead of energy analyzing the emittedelectrons as in AES or XPS. Although using sputtering implies an erosion of the sample surface, acompensating advantage for SIMS is extreme sensitivity. Under advantageous conditions, as few as1012 atoms per cm3 (ppb) have been detected (Gnaser, 1997), with more typical sensitivities for mostelements in the ppm range (Wilson et al., 1989). A comprehensive discussion of the SIMS technique hasbeen published by Benninghoven et al. (1987).
The SIMS technique typically used in surface studies gives partial monolayer sensitivity using smallincident ion currents (“static” SIMS). Higher ion beam currents, often rastered, give species informationas a function of sputter depth (“dynamic” SIMS or SIMS depth profiling). SIMS instrumentation can beroughly categorized by the type of ion detector used, e.g., quadrupole, magnetic sector, or time-of-flight,with their inherent differences in sensitivity, lateral and mass resolution. As well, the incident angle,energy, and type (e.g., noble gas, cesium, or oxygen) of primary ion sputtering beam employed cangreatly affect the magnitude and character of the secondary ion yield.
SIMS has several complexities. SIMS only detects secondary ions, rather than all of the sputteredspecies, which can lead to difficulty in quantification. Large molecules on the surface such as hydrocarbonlubricants or typical additives can exhibit complex patterns of possible fragments. A knowledge of theadsorbate and cracking patterns is often needed for interpretation. As well, multiply ionized fragmentsor simply different species may overlap in the spectra, having nearly identical charge-to-mass ratios. Asa simple example, carbon monoxide (CO) and diatomic nitrogen (N2) overlap, requiring examinationof other mass fragments to distinguish between the two. As with depth profiling for either AES or XPS,depth resolution “smearing” can occur either due to ion beam mixing of near-surface species or due tothe development of surface topography after long times under the ion beam. Despite these potentiallimitations, SIMS should remain the technique of choice for many low detection limit, high surfacesensitivity studies (Zalm, 1995).
1.5.4 Infrared Spectroscopy
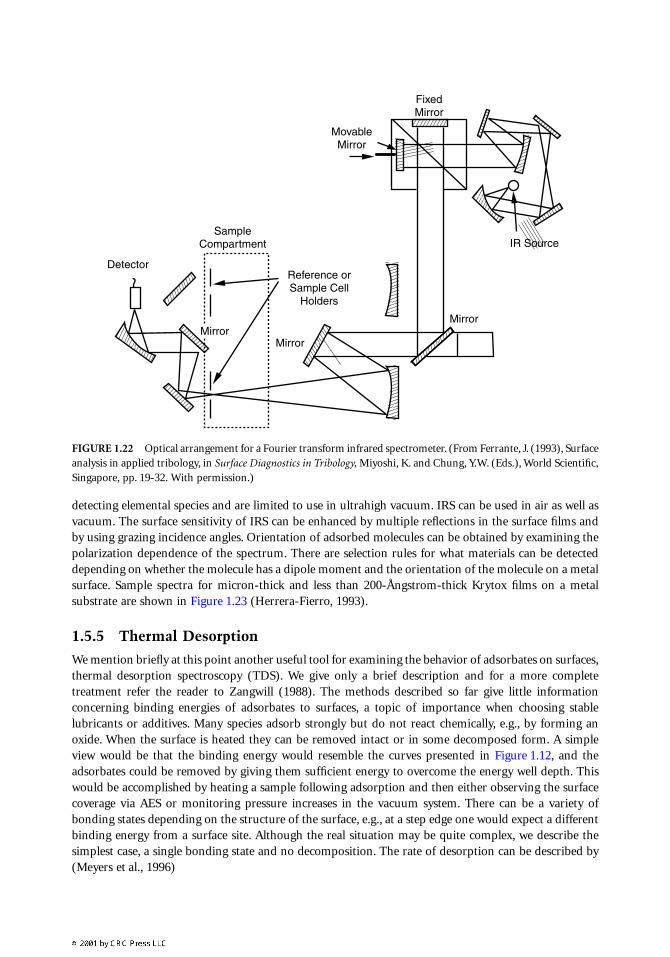
Infrared spectroscopy (IRS) is particularly useful in detecting lubricant films on surfaces. It can providebinding and chemical information for adsorbed large molecules. It has an additional advantage in thatit is nondestructive. Incident electrons in AES can cause desorption and decomposition even for alumi-num oxide, and can be very destructive for polymers. Similarly, the emitted electrons can cause destruc-tion of some films for both AES and XPS. In IRS, the specimen is illuminated with infrared light of well-defined energy. If the energy of the incident light corresponds to a transition between vibrational energylevels in the specimen, the light can be absorbed. When compared to the reference light beam that hasnot passed through a sample, the infrared light interacting with the sample will appear at reduced intensityat these vibrational excitation energies. The dispersion step is similar to dispersion in visible photonspectroscopy in that a grating or prism is used to isolate the wavelengths of interest. A variation of IRSwhich has advantages in sensitivity and resolution is called Fourier transform infrared spectroscopy(FTIR). In FTIR, the incident beams are passed through a Michelson interferometer in which one of thepaths is modulated by moving a mirror. As before, one of the modulated beams is passed through thesample and impinges directly on the detector, which is a heat-sensitive device. When nonmonochromaticradiation is used, the Fourier transform of the spatially modulated beam contains all of the informationin one signal, as opposed to the dispersion method where each beam must be analyzed separately. Aschematic diagram of the equipment is shown in Figure 1.22.
IRS can be surface sensitive and has been used in a diverse range of analytical science applications(McKelvy et al., 1998), which we will not address. A primary interest in tribology is the detection ofhydrocarbon or additive films on surfaces. AES and XPS, for contrast, would be useful primarily in
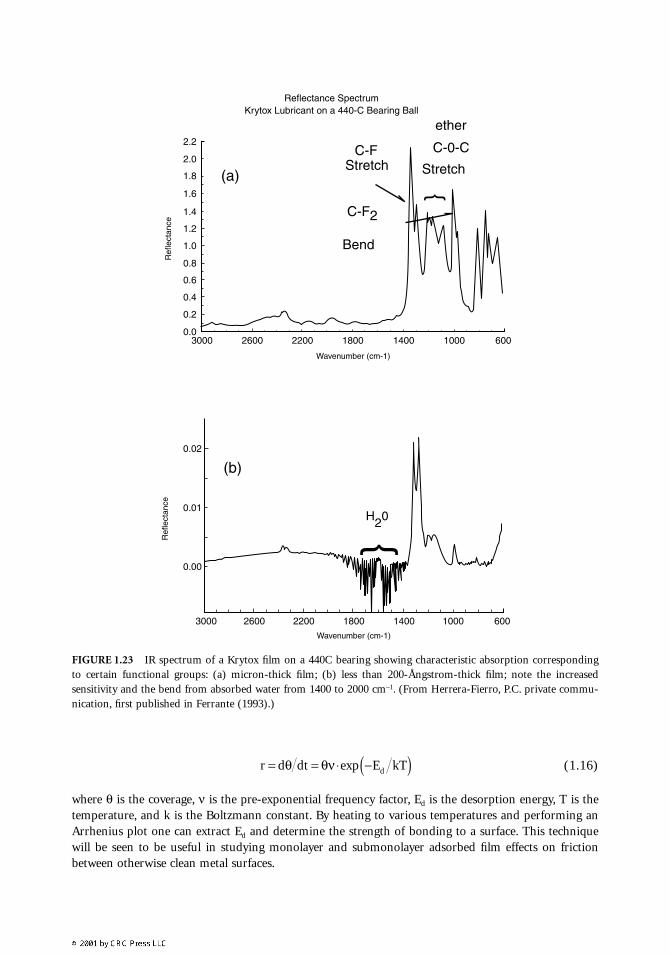
detecting elemental species and are limited to use in ultrahigh vacuum. IRS can be used in air as well asvacuum. The surface sensitivity of IRS can be enhanced by multiple reflections in the surface films andby using grazing incidence angles. Orientation of adsorbed molecules can be obtained by examining thepolarization dependence of the spectrum. There are selection rules for what materials can be detecteddepending on whether the molecule has a dipole moment and the orientation of the molecule on a metalsurface. Sample spectra for micron-thick and less than 200-Ångstrom-thick Krytox films on a metalsubstrate are shown in Figure 1.23 (Herrera-Fierro, 1993).
1.5.5 Thermal Desorption
We mention briefly at this point another useful tool for examining the behavior of adsorbates on surfaces,thermal desorption spectroscopy (TDS). We give only a brief description and for a more completetreatment refer the reader to Zangwill (1988). The methods described so far give little informationconcerning binding energies of adsorbates to surfaces, a topic of importance when choosing stablelubricants or additives. Many species adsorb strongly but do not react chemically, e.g., by forming anoxide. When the surface is heated they can be removed intact or in some decomposed form. A simpleview would be that the binding energy would resemble the curves presented in Figure 1.12, and theadsorbates could be removed by giving them sufficient energy to overcome the energy well depth. Thiswould be accomplished by heating a sample following adsorption and then either observing the surfacecoverage via AES or monitoring pressure increases in the vacuum system. There can be a variety ofbonding states depending on the structure of the surface, e.g., at a step edge one would expect a differentbinding energy from a surface site. Although the real situation may be quite complex, we describe thesimplest case, a single bonding state and no decomposition. The rate of desorption can be described by(Meyers et al., 1996)
FIGURE 1.22 Optical arrangement for a Fourier transform infrared spectrometer. (From Ferrante, J. (1993), Surfaceanalysis in applied tribology, in Surface Diagnostics in Tribology, Miyoshi, K. and Chung, Y.W. (Eds.), World Scientific,Singapore, pp. 19-32. With permission.)
Detector
SampleCompartment
Reference orSample Cell
Holders
Mirror
MirrorMirror
IR Source
FixedMirror
MovableMirror
(1.16)
where θ is the coverage, ν is the pre-exponential frequency factor, Ed is the desorption energy, T is thetemperature, and k is the Boltzmann constant. By heating to various temperatures and performing anArrhenius plot one can extract Ed and determine the strength of bonding to a surface. This techniquewill be seen to be useful in studying monolayer and submonolayer adsorbed film effects on frictionbetween otherwise clean metal surfaces.
FIGURE 1.23 IR spectrum of a Krytox film on a 440C bearing showing characteristic absorption correspondingto certain functional groups: (a) micron-thick film; (b) less than 200-Ångstrom-thick film; note the increasedsensitivity and the bend from absorbed water from 1400 to 2000 cm–1. (From Herrera-Fierro, P.C. private commu-nication, first published in Ferrante (1993).)
2.2
2.0
1.8
1.6
1.4
1.2
1.0
0.8
0.6
0.4
0.2
0.03000 2600 2200 1800 1400 1000 600
(a)
C-F
C-F2
C-0-CStretch
Bend
Stretch
ether
Reflectance SpectrumKrytox Lubricant on a 440-C Bearing Ball
Wavenumber (cm-1)
Wavenumber (cm-1)
Ref
lect
ance
(b)
Ref
lect
ance
0.02
0.01
0.00
3000 2600 2200 1800 1400 1000 600
}
}
H20
r d dt E kTd= = ⋅ −( )θ θν exp
1.6 Surface Effects in Tribology
In this section we will deal with a number of issues, analyzing evidence first for effects at the atomicmonolayer or submonolayer level in tribology. We will examine monolayer effects both from a funda-mental standpoint as well as a more practical viewpoint. This will not be a comprehensive review of theliterature, but in keeping with the objectives of this chapter, will be didactic in nature. The referencesselected, however, will refer to the relevant literature. In this chapter we are not concerned with the effectsof lubricants other than their effects of changing shear strength or adhesion at the interface. Consequentlywe are interested in issues involving boundary lubrication and interfacial properties (Ferrante and Pepper,1989; Gellman, 1992; Carpick and Salmeron, 1997; McFadden and Gellman, 1997, 1998).
There are a number of issues to address which emphasize the difficulties involved in answeringfundamental questions concerning bonding (Ferrante and Pepper, 1989). One clear difficulty is the factthat one cannot observe the interface during the interaction. It is necessary to infer what happened atthe interface by examining the states of the surfaces before and after interaction. There are often situationswhere the locus of failure is not the interface, e.g., shear or adhesive failure can occur in the bulk of oneof the materials rather than at the interface, or both effects can occur depending on the region in contact.There are uncertainties regarding the measurement of forces, though some recent efforts nicely relatelateral force sensitivity to normal force sensitivity for a commercial SPM cantilever beam, i.e., for a singleasperity contact (Ogletree et al., 1996). Clearly, there are elastic effects in any measuring apparatus andin the materials involved that make measurement of the force distribution at the interface difficult.Materials can change mechanical properties as a result of the forces applied. For example, such propertiesas hardness, ductility, defect formation, plasticity, strain hardening, and creep must be considered. Surfaceproperties may be altered just by contact with the counterface material (Carpick et al., 1996). Generally,even the true area of contact is not known in macroscopic studies due to the fact that asperities determinethe contact area on most materials.
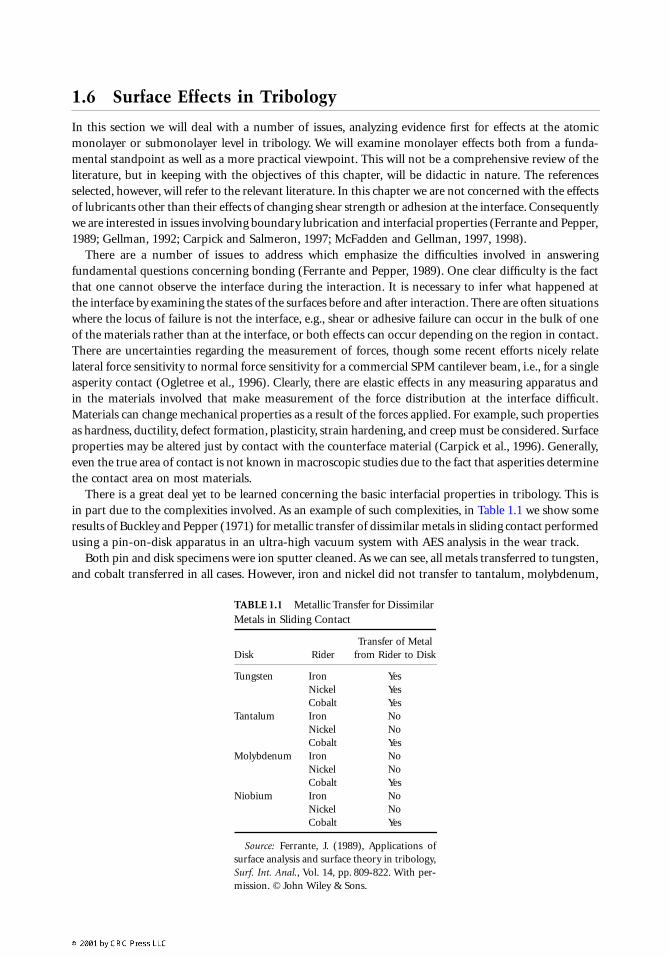
There is a great deal yet to be learned concerning the basic interfacial properties in tribology. This isin part due to the complexities involved. As an example of such complexities, in Table 1.1 we show someresults of Buckley and Pepper (1971) for metallic transfer of dissimilar metals in sliding contact performedusing a pin-on-disk apparatus in an ultra-high vacuum system with AES analysis in the wear track.
Both pin and disk specimens were ion sputter cleaned. As we can see, all metals transferred to tungsten,and cobalt transferred in all cases. However, iron and nickel did not transfer to tantalum, molybdenum,
TABLE 1.1 Metallic Transfer for Dissimilar Metals in Sliding Contact
Disk RiderTransfer of Metal
from Rider to Disk
Tungsten Iron YesNickel YesCobalt Yes
Tantalum Iron NoNickel NoCobalt Yes
Molybdenum Iron NoNickel NoCobalt Yes
Niobium Iron NoNickel NoCobalt Yes
Source: Ferrante, J. (1989), Applications ofsurface analysis and surface theory in tribology,Surf. Int. Anal., Vol. 14, pp. 809-822. With per-mission. © John Wiley & Sons.
or niobium. The surprising result is that the softer metals did not transfer to the harder in all cases.Pepper explained these results in terms of the mechanical properties of the materials. Tungsten, whichis the hardest of the materials, fits the expected pattern. However, since nickel and iron strain harden,transfer and deformation are minimized. Cobalt, which has a hexagonal, close-packed structure, has easyslip planes and thus transferred in all cases. Thus simple explanations based on cohesive and interfacialenergies can be misleading if mechanical properties are not taken into account.
We give a second example performed by Pepper (1974) demonstrating the care necessary in performingstudies of polymer films transferred from polymer pins sliding on an S-Monel disk in UHV. Figure 1.24shows the AES spectra for polytetrafluoroethylene (PTFE), polyvinyl chloride (PVC), and polychloro-trifluoroethylene (PCTFE) pins sliding on S-Monel. The PTFE spectrum shows large fluorine and carbonpeaks and large attenuation of the metal peaks. (Care had to be taken due to electron bombardmentdesorption of the fluorine.) The friction coefficient was low and smooth, suggesting slip. The combinedresults indicated that PTFE strands were transferring to the metal surface consistent with the models ofPooley and Tabor (1972). For PVC the AES spectrum shows a large chlorine peak and small attenuationof the metal peaks, suggesting decomposition and chlorine adsorption rather than polymer transfer. Thefriction coefficient, although reduced, remained large and exhibited some stick slip. For PCTFE thespectrum shows chlorine, carbon, and intermediate attenuation of the metal peaks, but with stabilityunder electron bombardment, suggesting the possibility of both decomposition and some polymertransfer. The friction coefficient was high with stick slip. Consequently, it is difficult to anticipate whatis happening, again demonstrating the need for more extensive surface characterization.
1.6.1 Atomic Monolayer Effects in Adhesion and Friction
Our primary objective in this and following sections is to explore the evidence for atomic effects onfriction. The bulk of the discussion in this section will be based on the recent high-quality experimentsof Gellman and collaborators (Gellman, 1992; McFadden and Gellman, 1995a,b, 1997, 1998; Ko et al.,1999) while we acknowledge the pioneering contributions of Buckley and the members of his group(Buckley, 1981). Gellman and collaborators have performed a number of adhesion and friction experi-ments on single crystals in contact, both for clean and adsorbate-covered interfaces, namelyNi(100)–Ni(100), Cu(111)–Cu(111), and even single-grain Al70Pd21Mn9 quasicrystals.
The contacting crystals had a slight curvature in order to prevent contact at the edges of the sampleswhere large concentrations of steps were expected, and to ensure point contact. The vacuum system wasalso vibration isolated, which is very important for reasons to be discussed below. Normally the exper-iments were repeated for 10 different points. The normals of the crystals were aligned by lasers. Theapparatus provided the ability to sputter clean both contacting surfaces, and LEED and AES could beperformed on the surfaces in order to guarantee the crystallinity and to measure contamination anddetermine concentration of adsorbates. The AES measurements were performed with LEED optics inthe old retarding field analyzer mode. Following sputter cleaning, the samples were annealed and analyzedwith LEED in order to verify the crystal structure and with AES to verify cleanliness.
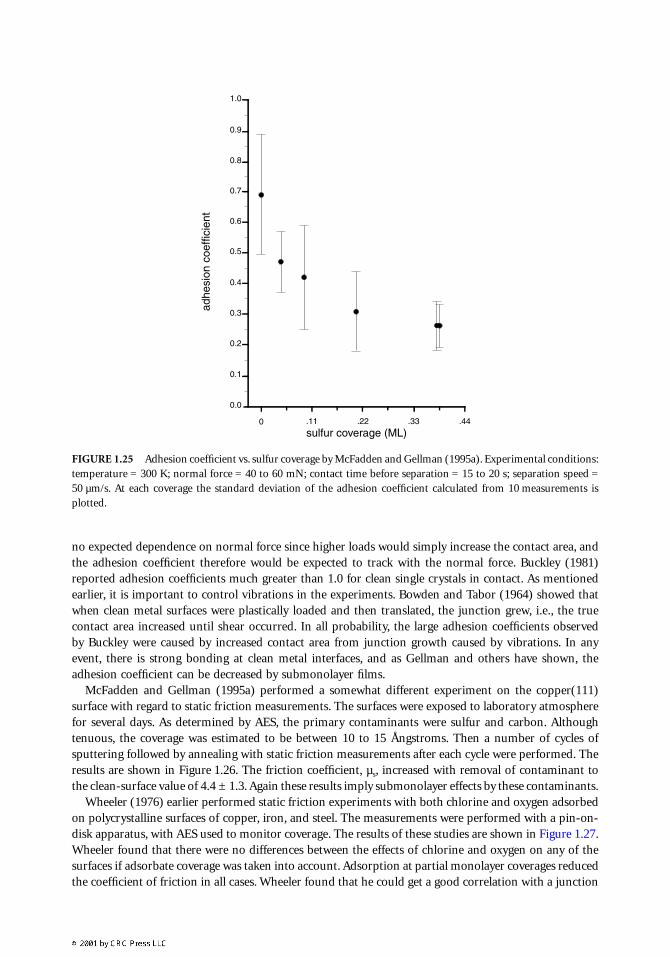
On copper (111) McFadden and Gellman (1995a) examined the effects of sulfur adsorption, sincesulfur is a common antiwear additive. It is often used along with phosphorous to prevent metal-to-metalcontact when the lubricant breaks down. Both surfaces were dosed with sulfur using hydrogen sulfide,which decomposes upon heating, desorbing the hydrogen and leaving sulfur behind on the surface. Atsaturation, sulfur forms an ordered superlattice which has a × R19 degree LEED pattern. Thiscorresponds to a close-packed monolayer of sulfide ions (S2–) on top of the copper(111) lattice with anabsolute coverage of .43 monolayers relative to the copper(111) substrate. The results of the adhesionexperiments are shown in Figure 1.25.
The adhesion coefficient, µad = Fad/FN, which is the ratio of pull-off force to normal force, was foundto be .69 ± .21. As little as .05 monolayers (11% of saturation) gave a substantial percentage reduction.The saturation value at one monolayer was .26 ± .07. They also found that there was no dependence ofthe adhesion coefficient on contact time, separation time, temperature, or normal force. There would be
7 7
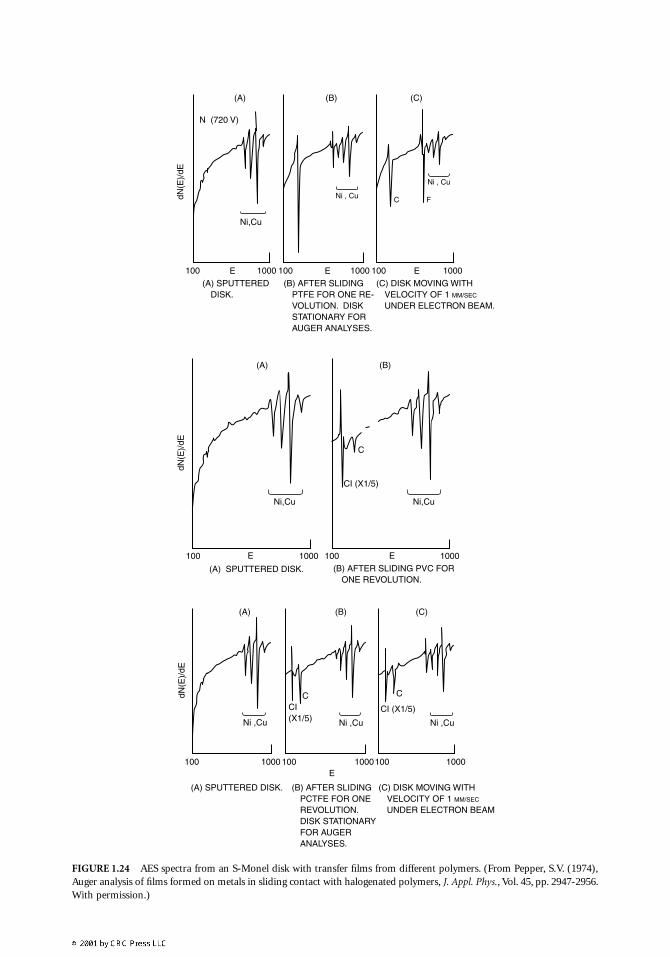
FIGURE 1.24 AES spectra from an S-Monel disk with transfer films from different polymers. (From Pepper, S.V. (1974),Auger analysis of films formed on metals in sliding contact with halogenated polymers, J. Appl. Phys., Vol. 45, pp. 2947-2956.With permission.)
100 1000E(A) SPUTTERED
DISK.
100 1000E 100 1000E
(A) SPUTTERED DISK.
dN(E
)/dE
Ni,Cu
100 1000E
Ni , Cu
Ni , Cu
100 1000E
N (720 V)
(A)
dN(E
)/dE
dN(E
)/dE
Ni,Cu Ni,Cu
(A)
(A) (B) (C)
(B)
(B) (C)
(B) AFTER SLIDINGPTFE FOR ONE RE-VOLUTION. DISKSTATIONARY FORAUGER ANALYSES.
(C) DISK MOVING WITHVELOCITY OF 1 MM/SEC
UNDER ELECTRON BEAM.
C F
CI (X1/5)
C
(B) AFTER SLIDING PVC FORONE REVOLUTION.
100 100 1001000 1000 1000E
(A) SPUTTERED DISK.
Ni ,Cu
CI (X1/5)
CI (X1/5)
C C
Ni ,Cu Ni ,Cu
(B) AFTER SLIDINGPCTFE FOR ONEREVOLUTION.DISK STATIONARYFOR AUGERANALYSES.
(C) DISK MOVING WITHVELOCITY OF 1 MM/SEC
UNDER ELECTRON BEAM
no expected dependence on normal force since higher loads would simply increase the contact area, andthe adhesion coefficient therefore would be expected to track with the normal force. Buckley (1981)reported adhesion coefficients much greater than 1.0 for clean single crystals in contact. As mentionedearlier, it is important to control vibrations in the experiments. Bowden and Tabor (1964) showed thatwhen clean metal surfaces were plastically loaded and then translated, the junction grew, i.e., the truecontact area increased until shear occurred. In all probability, the large adhesion coefficients observedby Buckley were caused by increased contact area from junction growth caused by vibrations. In anyevent, there is strong bonding at clean metal interfaces, and as Gellman and others have shown, theadhesion coefficient can be decreased by submonolayer films.
McFadden and Gellman (1995a) performed a somewhat different experiment on the copper(111)surface with regard to static friction measurements. The surfaces were exposed to laboratory atmospherefor several days. As determined by AES, the primary contaminants were sulfur and carbon. Althoughtenuous, the coverage was estimated to be between 10 to 15 Ångstroms. Then a number of cycles ofsputtering followed by annealing with static friction measurements after each cycle were performed. Theresults are shown in Figure 1.26. The friction coefficient, µs, increased with removal of contaminant tothe clean-surface value of 4.4 ± 1.3. Again these results imply submonolayer effects by these contaminants.
Wheeler (1976) earlier performed static friction experiments with both chlorine and oxygen adsorbedon polycrystalline surfaces of copper, iron, and steel. The measurements were performed with a pin-on-disk apparatus, with AES used to monitor coverage. The results of these studies are shown in Figure 1.27.Wheeler found that there were no differences between the effects of chlorine and oxygen on any of thesurfaces if adsorbate coverage was taken into account. Adsorption at partial monolayer coverages reducedthe coefficient of friction in all cases. Wheeler found that he could get a good correlation with a junction
FIGURE 1.25 Adhesion coefficient vs. sulfur coverage by McFadden and Gellman (1995a). Experimental conditions:temperature = 300 K; normal force = 40 to 60 mN; contact time before separation = 15 to 20 s; separation speed =50 µm/s. At each coverage the standard deviation of the adhesion coefficient calculated from 10 measurements isplotted.
1.0
0.9
0.8
0.7
0.6
0.5
0.4
0.3
0.2
0.1
0.0
0 .11 .22 .33 .44
sulfur coverage (ML)
adhe
sion
coe
ffici
ent
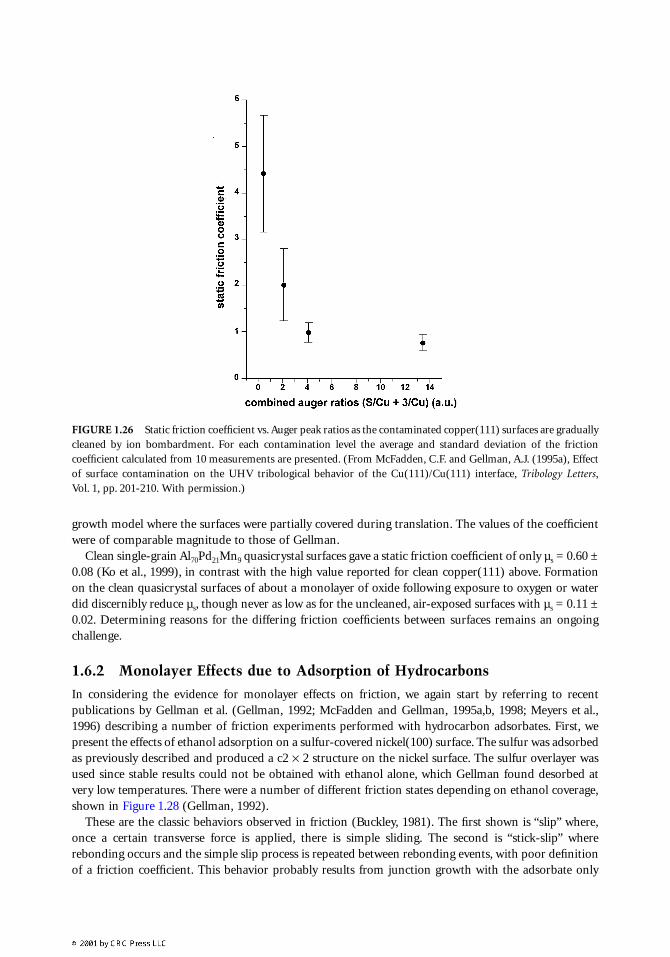
growth model where the surfaces were partially covered during translation. The values of the coefficientwere of comparable magnitude to those of Gellman.
Clean single-grain Al70Pd21Mn9 quasicrystal surfaces gave a static friction coefficient of only µs = 0.60 ±0.08 (Ko et al., 1999), in contrast with the high value reported for clean copper(111) above. Formationon the clean quasicrystal surfaces of about a monolayer of oxide following exposure to oxygen or waterdid discernibly reduce µs, though never as low as for the uncleaned, air-exposed surfaces with µs = 0.11 ±0.02. Determining reasons for the differing friction coefficients between surfaces remains an ongoingchallenge.
1.6.2 Monolayer Effects due to Adsorption of Hydrocarbons
In considering the evidence for monolayer effects on friction, we again start by referring to recentpublications by Gellman et al. (Gellman, 1992; McFadden and Gellman, 1995a,b, 1998; Meyers et al.,1996) describing a number of friction experiments performed with hydrocarbon adsorbates. First, wepresent the effects of ethanol adsorption on a sulfur-covered nickel(100) surface. The sulfur was adsorbedas previously described and produced a c2 × 2 structure on the nickel surface. The sulfur overlayer wasused since stable results could not be obtained with ethanol alone, which Gellman found desorbed atvery low temperatures. There were a number of different friction states depending on ethanol coverage,shown in Figure 1.28 (Gellman, 1992).
These are the classic behaviors observed in friction (Buckley, 1981). The first shown is “slip” where,once a certain transverse force is applied, there is simple sliding. The second is “stick-slip” whererebonding occurs and the simple slip process is repeated between rebonding events, with poor definitionof a friction coefficient. This behavior probably results from junction growth with the adsorbate only
FIGURE 1.26 Static friction coefficient vs. Auger peak ratios as the contaminated copper(111) surfaces are graduallycleaned by ion bombardment. For each contamination level the average and standard deviation of the frictioncoefficient calculated from 10 measurements are presented. (From McFadden, C.F. and Gellman, A.J. (1995a), Effectof surface contamination on the UHV tribological behavior of the Cu(111)/Cu(111) interface, Tribology Letters,Vol. 1, pp. 201-210. With permission.)
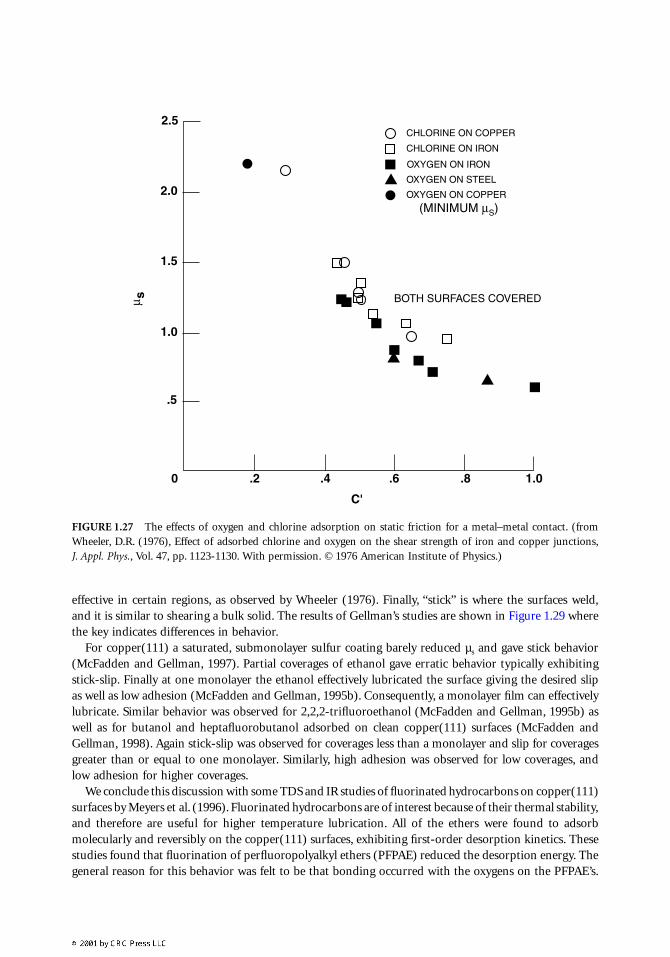
effective in certain regions, as observed by Wheeler (1976). Finally, “stick” is where the surfaces weld,and it is similar to shearing a bulk solid. The results of Gellman’s studies are shown in Figure 1.29 wherethe key indicates differences in behavior.
For copper(111) a saturated, submonolayer sulfur coating barely reduced µs and gave stick behavior(McFadden and Gellman, 1997). Partial coverages of ethanol gave erratic behavior typically exhibitingstick-slip. Finally at one monolayer the ethanol effectively lubricated the surface giving the desired slipas well as low adhesion (McFadden and Gellman, 1995b). Consequently, a monolayer film can effectivelylubricate. Similar behavior was observed for 2,2,2-trifluoroethanol (McFadden and Gellman, 1995b) aswell as for butanol and heptafluorobutanol adsorbed on clean copper(111) surfaces (McFadden andGellman, 1998). Again stick-slip was observed for coverages less than a monolayer and slip for coveragesgreater than or equal to one monolayer. Similarly, high adhesion was observed for low coverages, andlow adhesion for higher coverages.
We conclude this discussion with some TDS and IR studies of fluorinated hydrocarbons on copper(111)surfaces by Meyers et al. (1996). Fluorinated hydrocarbons are of interest because of their thermal stability,and therefore are useful for higher temperature lubrication. All of the ethers were found to adsorbmolecularly and reversibly on the copper(111) surfaces, exhibiting first-order desorption kinetics. Thesestudies found that fluorination of perfluoropolyalkyl ethers (PFPAE) reduced the desorption energy. Thegeneral reason for this behavior was felt to be that bonding occurred with the oxygens on the PFPAE’s.
FIGURE 1.27 The effects of oxygen and chlorine adsorption on static friction for a metal–metal contact. (fromWheeler, D.R. (1976), Effect of adsorbed chlorine and oxygen on the shear strength of iron and copper junctions,J. Appl. Phys., Vol. 47, pp. 1123-1130. With permission. © 1976 American Institute of Physics.)
2.5
2.0
1.5
1.0
.5
0 .2 .4 .6 .8 1.0
C'
µ sCHLORINE ON COPPER
CHLORINE ON IRON
OXYGEN ON IRON
OXYGEN ON STEEL
OXYGEN ON COPPER
(MINIMUM µS)
BOTH SURFACES COVERED
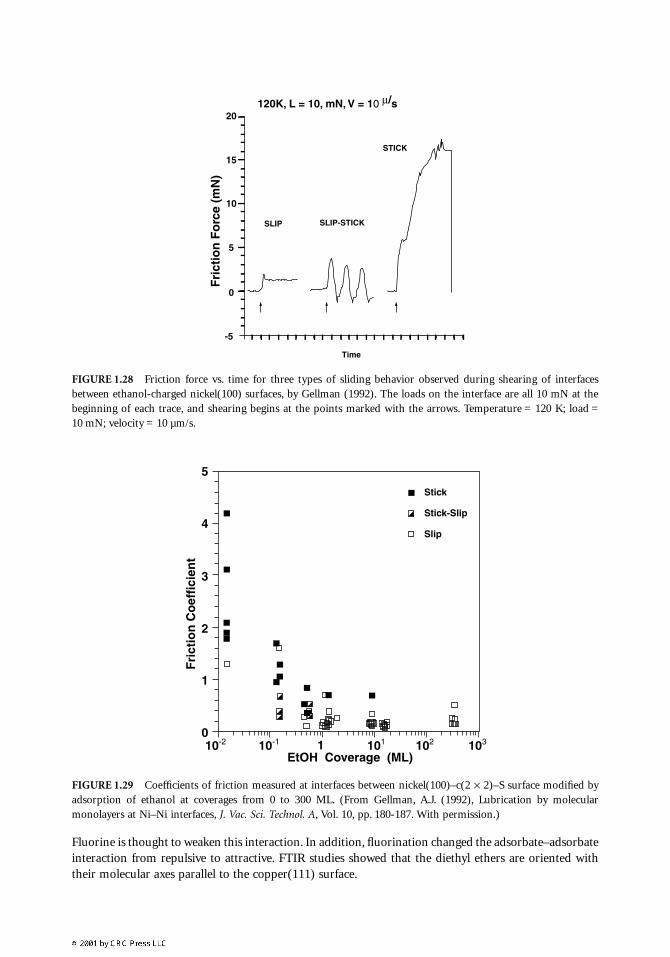
Fluorine is thought to weaken this interaction. In addition, fluorination changed the adsorbate–adsorbateinteraction from repulsive to attractive. FTIR studies showed that the diethyl ethers are oriented withtheir molecular axes parallel to the copper(111) surface.
FIGURE 1.28 Friction force vs. time for three types of sliding behavior observed during shearing of interfacesbetween ethanol-charged nickel(100) surfaces, by Gellman (1992). The loads on the interface are all 10 mN at thebeginning of each trace, and shearing begins at the points marked with the arrows. Temperature = 120 K; load =10 mN; velocity = 10 µm/s.
FIGURE 1.29 Coefficients of friction measured at interfaces between nickel(100)–c(2 × 2)–S surface modified byadsorption of ethanol at coverages from 0 to 300 ML. (From Gellman, A.J. (1992), Lubrication by molecularmonolayers at Ni–Ni interfaces, J. Vac. Sci. Technol. A, Vol. 10, pp. 180-187. With permission.)
120K, L = 10, mN, V = 10 µ/s
STICK
SLIP-STICKF
rict
ion
Fo
rce
(mN
)SLIP
20
15
10
5
-5
0
Time
10-2 10-1 101 102 1031EtOH Coverage (ML)
5
4
3
2
1
0
Fri
ctio
n C
oef
fici
ent
Stick
Stick-Slip
Slip
We conclude this section with some elegant experiments performed by Krim et al. (Daly and Krim,1996; Krim et al., 1995; Mak et al., 1994; Sokoloff et al., 1993) for which Widom and Krim (1986; alsoKrim and Widom, 1988) originally adapted an apparatus for sliding monolayer and thicker physisorbedfilms on silver substrates. The true contact area is known in these studies and there is no wear of thesurfaces, which are silver deposited with a (111) face on a quartz crystal microbalance. These experimentswere designed to investigate the nature of the friction forces. Slipping of physisorbed films, e.g., ethaneand ethylene, on the silver surfaces causes shifts in the frequency and amplitude of the quartz crystalvibrations, and film characteristic slip times are obtained from shifts in the quality factor, Q, of theoscillator circuit. Friction results from energy losses due to the interactions at an interface. Typically itis assumed that these losses occur through phonons, vibrations of the lattice which dissipate the energy(Sokoloff et al., 1993), though Persson (1991), followed by Sokoloff (1995), demonstrated that electronicexcitations could also be an energy dissipation mechanism here. In these experiments the average frictionforce per unit area is related to the slip time by
(1.17)
where Ff is the friction force, ρ and ν are the film density and velocity, respectively, and τ is the slip time.Therefore, a longer slip time implies a smaller friction force. Based on electronic effects alone (Persson,1993b) ethane on silver is expected to have a longer slip time than ethylene and thus lower friction.Krim’s results are consistent with this prediction although the ability of the theory to predict hard numbersis limited. Monolayer oxygen adsorption on the surface increases the slip time and thus lowers the frictioncoefficient substantially, consistent with the electronic excitation model. Although these experiments arenot completely definitive at this time, they open new areas of investigation for probing the little under-stood energy loss mechanisms in friction.
1.6.3 Atomic Effects in Metal-Insulator Contacts
We now discuss a number of results where monolayer effects have been observed in metal-insulatorfriction experiments performed by Pepper (1976, 1979, 1982). First, we discuss static friction experimentsperformed with a copper ball on the basal plane of a diamond flat. The diamond surface is known to beterminated by hydrogen atoms. Pepper (1982) found that the hydrogen could be removed by eitherelectron bombardment or heating in UHV. Following removal of the hydrogen, the LEED pattern forthe surface changed from a 1 × 1 to a 1 × 2 pattern. The interesting feature is shown in the static frictionresults for the two situations given in Figure 1.30. We can see that removal of the hydrogen caused anincrease in µs. Pepper found that exposing the surface to excited hydrogen could cause readsorption.Following hydrogen readsorption the static friction was again reduced, although not to its original value.Pepper also performed core level ionization energy loss spectroscopy on the diamond surface and foundchanges in the electronic structure of the valence band. Therefore, these experiments showed resultssensitive to the electronic structure of the surface.
In Figure 1.31 we show similar studies performed by Pepper (1979) for copper and nickel balls on thebasal plane of sapphire with chlorine and oxygen as adsorbates. Again the balls were cleaned by sputteringand the sapphire was cleaned by heating as verified by AES. In both cases, we see that oxygen increasedthe interfacial friction and chlorine decreased it compared to the clean metal. For the increased shearstrength case, one cannot identify the locus of failure, whether at the interface or in the bulk of one ofthe materials. Unfortunately, the wear scar area was too small to analyze. In any event, again monolayeradsorption was detectable in friction experiments. Perhaps even more surprising were effects shown inFigure 1.32. Here dynamic friction experiments were performed by Pepper (1976) with a polycrystallinesapphire pin on a polycrystalline iron disk in UHV. We see the same behavior reproduced with dynamicfriction. After removing the oxygen or chlorine atmospheres, the friction coefficients returned to theiroriginal values.
Ff = ρν τ
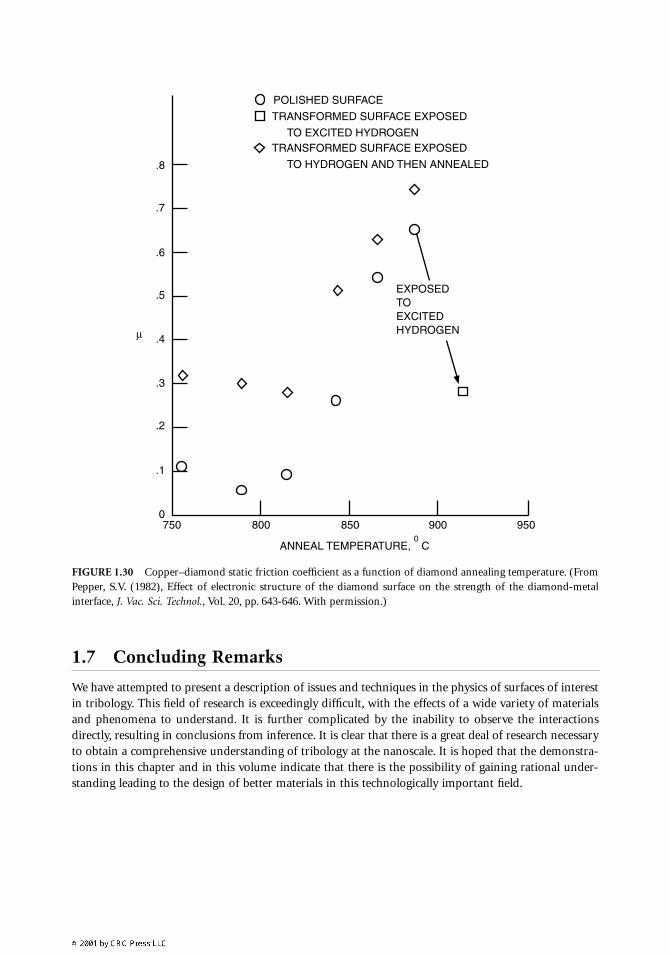
1.7 Concluding Remarks
We have attempted to present a description of issues and techniques in the physics of surfaces of interestin tribology. This field of research is exceedingly difficult, with the effects of a wide variety of materialsand phenomena to understand. It is further complicated by the inability to observe the interactionsdirectly, resulting in conclusions from inference. It is clear that there is a great deal of research necessaryto obtain a comprehensive understanding of tribology at the nanoscale. It is hoped that the demonstra-tions in this chapter and in this volume indicate that there is the possibility of gaining rational under-standing leading to the design of better materials in this technologically important field.
FIGURE 1.30 Copper–diamond static friction coefficient as a function of diamond annealing temperature. (FromPepper, S.V. (1982), Effect of electronic structure of the diamond surface on the strength of the diamond-metalinterface, J. Vac. Sci. Technol., Vol. 20, pp. 643-646. With permission.)
EXPOSEDTOEXCITEDHYDROGEN
.8
.7
.6
.5
.4µ
.3
.2
.1
750 800
ANNEAL TEMPERATURE, 0 C
POLISHED SURFACE
TRANSFORMED SURFACE EXPOSED
TO EXCITED HYDROGENTRANSFORMED SURFACE EXPOSED
TO HYDROGEN AND THEN ANNEALED
850 900 9500
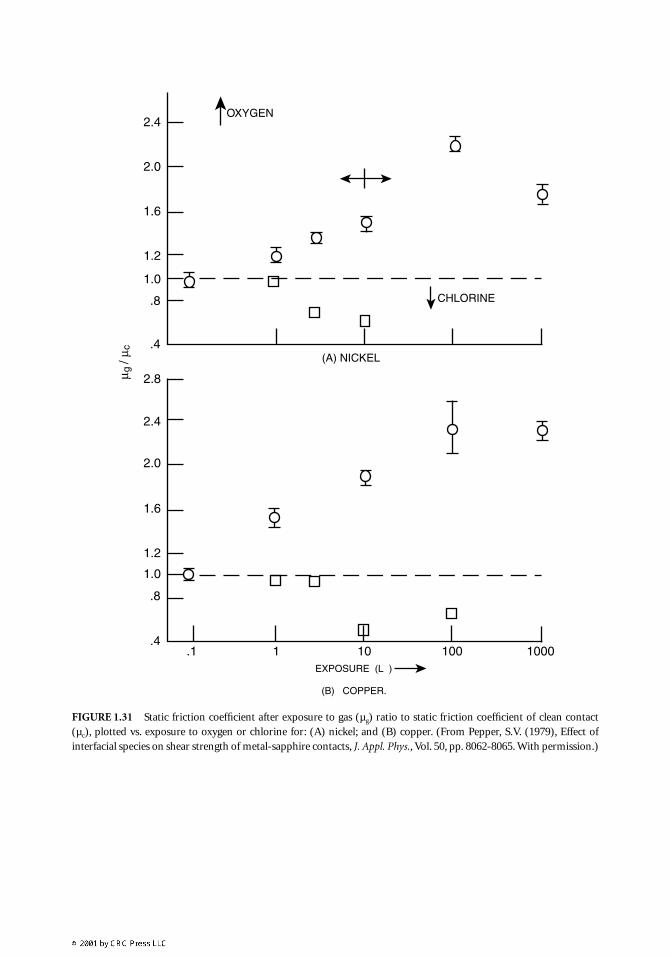
FIGURE 1.31 Static friction coefficient after exposure to gas (µg) ratio to static friction coefficient of clean contact(µc), plotted vs. exposure to oxygen or chlorine for: (A) nickel; and (B) copper. (From Pepper, S.V. (1979), Effect ofinterfacial species on shear strength of metal-sapphire contacts, J. Appl. Phys., Vol. 50, pp. 8062-8065. With permission.)
OXYGEN
CHLORINE
(A) NICKEL
2.4
2.0
1.6
1.2
1.0
2.8
2.4
2.0
1.6
1.2
1.0
.8
.4
.8
.4.1 1 10 100 1000
EXPOSURE (L )
(B) COPPER.
µ g /
µ c
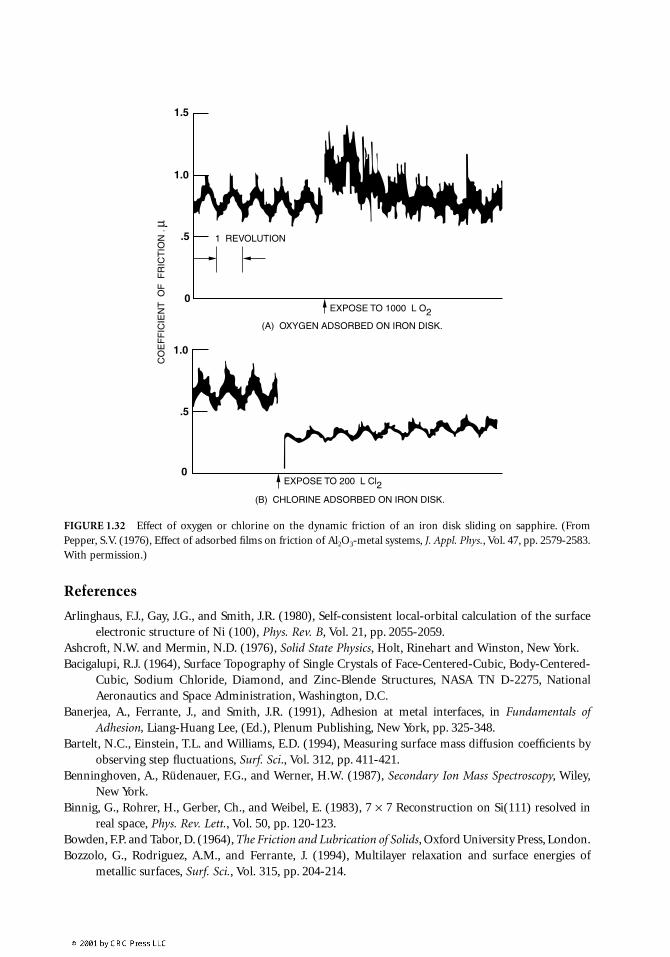
References
Arlinghaus, F.J., Gay, J.G., and Smith, J.R. (1980), Self-consistent local-orbital calculation of the surfaceelectronic structure of Ni (100), Phys. Rev. B, Vol. 21, pp. 2055-2059.
Ashcroft, N.W. and Mermin, N.D. (1976), Solid State Physics, Holt, Rinehart and Winston, New York.Bacigalupi, R.J. (1964), Surface Topography of Single Crystals of Face-Centered-Cubic, Body-Centered-
Cubic, Sodium Chloride, Diamond, and Zinc-Blende Structures, NASA TN D-2275, NationalAeronautics and Space Administration, Washington, D.C.
Banerjea, A., Ferrante, J., and Smith, J.R. (1991), Adhesion at metal interfaces, in Fundamentals ofAdhesion, Liang-Huang Lee, (Ed.), Plenum Publishing, New York, pp. 325-348.
Bartelt, N.C., Einstein, T.L. and Williams, E.D. (1994), Measuring surface mass diffusion coefficients byobserving step fluctuations, Surf. Sci., Vol. 312, pp. 411-421.
Benninghoven, A., Rüdenauer, F.G., and Werner, H.W. (1987), Secondary Ion Mass Spectroscopy, Wiley,New York.
Binnig, G., Rohrer, H., Gerber, Ch., and Weibel, E. (1983), 7 × 7 Reconstruction on Si(111) resolved inreal space, Phys. Rev. Lett., Vol. 50, pp. 120-123.
Bowden, F.P. and Tabor, D. (1964), The Friction and Lubrication of Solids, Oxford University Press, London.Bozzolo, G., Rodriguez, A.M., and Ferrante, J. (1994), Multilayer relaxation and surface energies of
metallic surfaces, Surf. Sci., Vol. 315, pp. 204-214.
FIGURE 1.32 Effect of oxygen or chlorine on the dynamic friction of an iron disk sliding on sapphire. (FromPepper, S.V. (1976), Effect of adsorbed films on friction of Al2O3-metal systems, J. Appl. Phys., Vol. 47, pp. 2579-2583.With permission.)
1.5
1.0
1.0
.5
.5
0
0
EXPOSE TO 1000 L O2
EXPOSE TO 200 L Cl2
(A) OXYGEN ADSORBED ON IRON DISK.
(B) CHLORINE ADSORBED ON IRON DISK.
1 REVOLUTION
CO
EF
FIC
IEN
T O
F F
RIC
TIO
N .
µ
Bozzolo, G., Ferrante, J., Noebe, R.D., Good, B., Honecy, F.S., and Abel, P.B. (1999), Surface segregationin multicomponent systems: modeling of surface alloys and alloy surfaces, Computational MaterialsSci., Vol. 15, pp. 169-195.
Brainard, W.A. and Buckley, D.H. (1971), Preliminary Studies by Field Ion Microscopy of Adhesion ofPlatinum and Gold to Tungsten and Iridium, NASA TN D-6492, National Aeronautics and SpaceAdministration, Washington, D.C.
Brainard, W.A. and Buckley, D.H. (1973), Adhesion and friction of PTFE in contact with metals as studiedby auger spectroscopy, field ion and scanning electron microscopy, Wear, Vol. 26, pp. 75-93.
Brainard, W.A. and Ferrante, J. (1979), Evaluation and Auger Analysis of a Zinc-Dialkyl-DithiophosphateAntiwear Additive in Several Diester Lubricants, NASA TP-1544, National Aeronautics and SpaceAdministration, Washington, D.C.
Buckley, D.H. and Pepper, S.V. (1971), Elemental Analysis of a Friction and Wear Surface during Slidingusing Auger Spectroscopy, NASA TN D-6497, National Aeronautics and Space Administration,Washington, D.C.
Buckley, D.H. (1981), Surface Effects in Adhesion, Friction, Wear, and Lubrication, Elsevier ScientificPublishing, Amsterdam.
Carpick, R.W., Agrait, N., Ogletree, D.F., and Salmeron, M. (1996), Variation of the interfacial shearstrength and adhesion of a nanometer-sized contact, Langmuir, Vol. 12, pp. 3334-3340.
Carpick, R.W. and Salmeron, M. (1997), Scratching the surface: fundamental investigations of tribologywith atomic force microscopy, Chem. Rev., Vol. 97, pp. 1163-1194.
Chambers, S.A. (1992), Elastic scattering and interference of backscattered primary, Auger and X-rayphotoelectrons at high kinetic energy: principles and applications, Surf. Sci. Reports, Vol. 16,pp. 261-331.
Conrad, E.H. and Engel, T. (1994), The equilibrium crystal shape and the roughening transition on metalsurfaces, Surf. Sci., Vol. 299/300, pp. 391-404.
Daly, C. and Krim, J. (1996), Sliding friction of solid xenon monolayers and bilayers on Ag(111), Phys.Rev. Lett., Vol. 76, pp. 803-806.
De Crescenzi, M. (1995), Structural surface investigations with low-energy backscattered electrons, Surf.Sci. Reports, Vol. 21, pp. 89-175.
Diestler, D.J., Rajasekaran, E., and Zeng, X.C. (1997), Static frictional forces at crystalline interfaces,J. Phys. Chem. B, Vol. 101, pp. 4992-4997.
Dowson, D. (1979), History of Tribology, Longman, New York.Faulkner, R.G. (1996), Segregation to boundaries and interfaces in solids, Int. Mater. Rev., Vol. 41,
pp. 198-208.Feibelman, P.J. (1992), First-principles calculation of the geometric and electronic structure of the Be
(0001) surface, Phys. Rev. B, Vol. 46, pp. 2532-2539.Ferrante, J., Buckley, D.H., Pepper, S.V., and Brainard, W.A. (1973), Use of LEED, Auger emission
spectroscopy and field ion microscopy in microstructural studies, in Microstructural Analysis Toolsand Techniques, McCall, J.L. and Mueller, W.M. (Eds.), Plenum Press, New York, pp. 241-279.
Ferrante, J. (1978), Adhesion of a Bimetallic Interface, NASA TM-78890 National Aeronautics and SpaceAdministration, Washington, D.C.
Ferrante, J. (1982), Practical applications of surface analytic tools in tribology, J. Am. Soc. Lubr. Eng.,Vol. 38, pp. 223-236.
Ferrante, J. and Smith, J.R. (1985), Theory of the bimetallic interface, Phys. Rev. B, Vol. 31, pp. 3427-3434.Ferrante, J., Bozzolo, G.H., Finley, C.W. and Banerjea, A. (1988), Interfacial adhesion: theory and exper-
iment, in Mat. Res. Soc. Symp. Proc., Vol. 118, pp. 3-16.Ferrante, J. (1989), Applications of surface analysis and surface theory in tribology, Surf. Int. Anal., Vol. 14,
pp. 809-822.Ferrante, J. and Pepper, S.V. (1989), Fundamentals of tribology at the atomic level, in Mat. Res. Soc. Symp.
Proc., Vol. 140, pp. 37-50.
Ferrante, J. (1993), Surface analysis in applied tribology, in Surface Diagnostics in Tribology, Miyoshi, K.and Chung, Y.W. (Eds.), World Scientific, Singapore, pp. 19-32.
Finnis, M.W. (1996), The theory of metal–ceramic interfaces, J. Phys.: Condens. Matter, Vol. 8,pp. 5811-5836.
Foiles, S.M. (1987), Reconstruction of fcc (110) surfaces, Surf. Sci., Vol. 191, pp. L779-L786.Gellman, A.J. (1992), Lubrication by molecular monolayers at Ni–Ni interfaces, J. Vac. Sci. Technol. A,
Vol. 10, pp. 180-187.Gnaser, H. (1997), SIMS detection in the 1012 atoms cm–3 Range, Surf. Int. Anal., Vol. 25, pp. 737-740.Good, B.S. and Banerjea, A. (1992), Monte Carlo Study of Reconstruction of the Au(110) Surface Using
Equivalent Crystal Theory, in Mat. Res. Soc. Symp. Proc., Vol. 278, pp. 211-216.Good, B., Bozzolo, G., and Ferrante, J. (1993), Surface segregation in Cu–Ni alloys, Phys. Rev. B, Vol. 48,
pp. 18284-18287.Hantsche, H. (1989), Comparison of basic principles of the surface-specific analytical methods:
AES/SAM, ESCA(XPS), SIMS, and ISS with X-ray microanalysis, and some applications in researchand industry, Scanning, Vol. 11, pp. 257-280.
Herrera-Fierro, P.C. private communication, first published in Ferrante (1993).Hirano, M. and Shinjo, K. (1990), Atomistic locking and friction, Phys. Rev. B, Vol. 41, pp. 11837-11851.Hirano, M., Shinjo, K., Kaneko, R., and Murata, Y. (1997), Observation of superlubricity by scanning
tunneling microscopy, Phys. Rev. Lett., Vol. 78, pp. 1448-1451.Hirsch, P., Howie, A., Nicholson, R.B., Pashley, D.W., and Whelan, M.J. (1977), Electron Microscopy of
Thin Crystals, Robert E. Krieger Publishing Co., Malabar, Florida.Hofmann, S. (1998), Sputter depth profile analysis of interfaces, Rep. Prog. Phys., Vol. 61, pp. 827-888.Hölscher, H., Schwarz, U.D., and Wiesendanger, R. (1997), Modeling of the scan process in lateral force
microscopy, Surf. Sci., Vol. 375, pp. 395-402.Hong, T., Smith, J.R. and Srolovitz, D.J. (1995), Theory of metal–ceramic adhesion, Acta Metall. Mater.,
Vol. 43, pp. 2721-2730.Jennings, W.D., Chottiner, G.S. and Michal, G.M. (1988), Sulphur segregation to the metal oxide interface
during the early stages in the oxidation of iron, Surf. Int. Anal., Vol. 11, pp. 377-382.Kaxiras, E. (1996), Review of atomistic simulations of surface diffusion and growth on semiconductors,
Computational Matl. Sci., Vol. 6, pp. 158-172.Kellogg, G.L. (1994), Field ion microscope studies of single-atom surface diffusion and cluster nucleation
on metal surfaces, Surf. Sci. Reports, Vol. 21, pp. 1-88.Kittel, C. (1986), Introduction to Solid State Physics, 6th ed., John Wiley & Sons, New York.Ko, J.S., Gellman, A.J., Lograsso, T.A., Jenks, C.J., and Thiel, P.A. (1999), Friction between single-grain
Al70Pd21Mn9 quasicrystal surfaces, Surf. Sci., Vol. 423, pp. 243-255.Kobistek, R.J., Bozzolo, G., Ferrante, J., and Schlosser, H. (1994), Multilayer relaxation and surface
structure of ordered alloys, Surf. Sci., Vol. 307-309, pp. 390-395.Kohn, W. and Sham, L.J. (1965), Self-consistent equations including exchange and correlation effects,
Phys. Rev., Vol. 140, pp. A1133-A1138.Krim, J. and Widom, A. (1988), Damping of a crystal oscillator by an adsorbed monolayer and its relation
to interfacial viscosity, Phys. Rev. B, Vol. 38, pp. 12184-12189.Krim, J., Daly, C., and Dayo, A. (1995), Electronic contributions to sliding friction, Tribology Letters,
Vol. 1, pp. 211-218.Lambrecht, W.R.L. and Segall, B. (1989), Efficient direct calculation method for dielectric response in
semiconductors, Phys. Rev. B, Vol. 40, pp. 7793-7801.Lang, N.D. and Kohn, W (1970), Theory of metal surfaces: charge density and surface energy, Phys. Rev.
B, Vol. 1, pp. 4555-4568.Lantz, M.A., O’Shea, S.J., Hoole, A.C.F., and Welland, M.E. (1997), Lateral stiffness of the tip and
tip–sample contact in frictional force microscopy, Appl. Phys. Lett., Vol. 70, pp. 970-972.Lundqvist, S. and March, N.H. (Eds.) (1983), Theory of the Inhomogeneous Electron Gas, Plenum Press,
New York.
Mak, C., Daly, C., and Krim, J. (1994), Atomic-scale measurements on silver and chemisorbed oxygensurfaces, Thin Solid Films, Vol. 253, pp. 190-193.
Matsukawa, H. and Fukuyama, H. (1994), Theoretical study of friction: one-dimensional clean surfaces,Phys. Rev. B, Vol. 49, pp. 17286-17292.
McFadden, C.F. and Gellman, A.J. (1995a), Effect of surface contamination on the UHV tribologicalbehavior of the Cu(111)/Cu(111) interface, Tribology Letters, Vol. 1, pp. 201-210.
McFadden, C.F. and Gellman, A.J. (1995b), Ultrahigh vacuum boundary lubrication of the Cu–Cuinterface by 2,2,2-trifluoroethanol, Langmuir, Vol. 11, pp. 273-280.
McFadden, C.F. and Gellman, A.J. (1997), Metallic friction: the influence of atomic adsorbates at sub-monolayer coverages, Surf. Sci., Vol. 391, pp. 287-299.
McFadden, C.F. and Gellman, A.J. (1998), Metallic friction: the effect of molecular adsorbates, Surf. Sci.,Vol. 409, pp. 171-182.
McGuire, G.E., Fuchs, J., Han, P., Kushmerick, J.G., Weiss, P.S., Simko, S.J., Nemanich, R.J., and Chopra,D.R. (1999), Surface characterization, Anal. Chem., Vol. 71, pp. 373R-388R.
McKelvy, M.L., Britt, T.R., Davis, B.L., Gillie, J.K., Graves, F.B., and Lentz, L.A. (1998), Infrared spec-troscopy, Anal. Chem., Vol. 70, pp. 119R-177R.
Meyers, J.M., Street, S.C., Thompson, S., and Gellman, A.J. (1996), Effect of fluorine on the bondingand orientation of perfluoroalkyl ethers on the Cu(111) Surface, Langmuir, Vol. 12, pp.1511-1519.
Mitchell, T.E. (1973), High voltage electron microscopy of microstructural analysis, in MicrostructuralAnalysis Tools and Techniques, McCall, J.L. and Mueller, W.M. (Eds.), Plenum Press, New York,pp. 125-152.
Montei, E.L. and Kordesch, M.E. (1996), Detection of tribochemical reactions using photoelectronemission microscopy, J. Vac. Sci. Technol. A, Vol. 14, pp. 1352-1356.
Mueller, E.W. and Nishikawa, O. (1968), Atomic surface structure of the common transition metals andthe effect of adhesion as seen by field ion microscopy, Adhesion or Cold Welding of Materials inSpace Environment, ASTM Special Tech. Publ. No. 431, American Society for Testing and Materials,Philadelphia, PA, pp. 67-87.
Mueller, E.W. (1969), Field Ion Microscopy, American Elsevier, New York.Needs, R.J. (1987), Calculations of the surface stress tensor at aluminum (111) and (110) surfaces, Phys.
Rev. Lett., Vol. 58, pp. 53-56.Niehus, H., Heiland, W., and Taglauer, E. (1993), Low-energy ion scattering at surfaces, Surf. Sci. Reports,
Vol. 17, pp. 213-303.Nishikawa, O. and Mueller, E.W. (1968), Field ion microscopy of contacts, Proc. of the Holm Seminar on
Electric Contact Phenomena, Ill. Inst. Technol., Chicago, IL, pp. 193-206.Ogletree, D.F., Carpick, R.W., and Salmeron, M. (1996), Calibration of frictional forces in atomic force
microscopy, Rev. Sci. Instrum., Vol. 67, pp. 3298-3306.Ohmae, N., Umeno, M., and Tsubouchi, K. (1987), Effect of oxygen adsorption on adhesion of W to Au
studied by field ion microscopy, ASLE Trans., Vol. 30, pp. 409-418.Ohmae, N., Tagawa, M., Umeno, M., and Koike, S. (1990), High voltage field ion microscopy of solid
lubricants, Proc. Jpn. Intl. Tribol. Conf., Nagoya, pp. 1827-1832.Ohmae, N. (1993), Field ion microscopy in tribology studies, in Surface Diagnostics in Tribology, Miyoshi,
K. and Chung, Y.W. (Eds.), World Scientific, Singapore, pp. 47-74.Pendry, J.B. (1997), Shearing the vacuum — quantum friction, J. Phys. C: Solid State Phys., Vol. 9,
pp. 10301-10320.Pepper, S.V. (1974), Auger analysis of films formed on metals in sliding contact with halogenated poly-
mers, J. Appl. Phys., Vol. 45, pp. 2947-2956.Pepper, S.V. (1976), Effect of adsorbed films on friction of Al2O3-metal systems, J. Appl. Phys., Vol. 47,
pp. 2579-2583.Pepper, S.V. (1979), Effect of interfacial species on shear strength of metal-sapphire contacts, J. Appl.
Phys., Vol. 50, pp. 8062-8065.
Pepper, S.V. (1982), Effect of electronic structure of the diamond surface on the strength of the diamond-metal interface, J. Vac. Sci. Technol., Vol. 20, pp. 643-646.
Persson, B.N.J. (1991), Surface resistivity and vibrational damping in adsorbed layers, Phys. Rev. B, Vol. 44,pp. 3277-3296.
Persson, B.N.J. (1993a), Theory of friction and boundary lubrication, Phys.Rev. B, Vol. 48, pp. 18140-18158.Persson, B.N.J. (1993b), Applications of surface resistivity to atomic scale friction, to the migration of
“hot” adatoms, and to electrochemistry, J. Chem. Phys., Vol. 98, pp. 1659-1672.Persson, B.N.J. (1994), Theory of friction: the role of elasticity in boundary lubrication, Phys. Rev. B,
Vol. 50, pp. 4771-4786.Persson, B.N.J. (1995), Theory of friction: stress domains, relaxation, and creep, Phys. Rev. B, Vol. 51,
pp. 13568-13585.Persson, B.N.J. (1998), Sliding Friction: Theory and Applications, Springer, Heidelberg.Persson, B.N.J. (1999), Sliding friction, Surf. Sci. Reports, Vol. 33, pp. 83-119.Persson, B.N.J. and Tosatti, E. (1999), Theory of friction: elastic coherence length and earthquake dynam-
ics, Solid State Comm., Vol. 109, pp. 739-744.Pooley, C.M. and Tabor, D. (1972), Friction and molecular structure: the behaviour of some thermo-
plastics, Proc. R. Soc., Vol. A329, pp. 251-274.Redfield, A.C. and Zangwill, A. (1992), Attractive interactions between steps, Phys. Rev. B, Vol. 46,
pp. 4289-4291.Richter, R., Gay, J.G., and Smith, J.R. (1985), Spin separation in a metal overlayer, Phys. Rev. Lett., Vol. 54,
pp. 2704-2707.Rodriguez, A.M., Bozzolo, G., and Ferrante, J. (1993), Multilayer relaxation and surface energies of fcc
and bcc metals using equivalent crystal theory, Surf. Sci., Vol. 289, pp. 100-126.Rose, J.H., Ferrante, J. and Smith, J.R. (1981), Universal binding energy curves for metals and bimetallic
interfaces, Phys. Rev. Lett., Vol. 47, pp. 675-678.Rose, J.H., Smith, J.R., and Ferrante, J. (1983), Universal features of bonding in metals, Phys. Rev. B,
Vol. 28, pp. 1835-1845.Rous, P.J. and Pendry, J.B. (1989), Applications of tensor LEED, Surf. Sci., Vol. 219, pp. 373-394.Shinjo, K. and Hirano, M. (1993), Dynamics of friction: superlubric state, Surf. Sci., Vol. 283, pp. 473-478.Smith, J.R. and Ferrante, J. (1985), Materials in Intimate Contact, Mat. Sci. Forum, Vol. 4, pp. 21-38.Smith, J.R. and Ferrante, J. (1986), Grain–boundary energies in metals from local-electron-density
distributions, Phys. Rev. B, Vol. 34, pp. 2238-2245.Smith, D.J. (1997), The realization of atomic resolution with the electron microscope, Rep. Prog. Phys.,
Vol. 60, pp. 1513-1580.Sokoloff, J.B. (1990), Theory of energy dissipation in sliding crystal surfaces, Phys. Rev. B, Vol. 42,
pp. 760-765.Sokoloff, J.B. (1992), Theory of atomic level sliding friction between ideal crystal interfaces, J. Appl. Phys.,
Vol. 72, pp. 1262-1269.Sokoloff, J.B., Krim, J., and Widom, A. (1993), Determination of an atomic-scale frictional force law
through quartz-crystal microbalance measurements, Phys. Rev. B, Vol. 48, pp. 9134-9137.Sokoloff, J.B. (1995), Theory of the contribution to sliding friction from electronic excitations in the
microbalance experiment, Phys. Rev. B, Vol. 52, pp. 5318-5322.Sokoloff, J.B. and Tomassone M.S. (1998), Effects of surface defects on friction for a thin solid film sliding
over a solid surface, Phys. Rev. B, Vol. 57, pp. 4888-4894.Srivastava, G.P. (1997), Theory of semiconductor surface reconstruction, Rep. Prog. Phys., Vol. 60,
pp. 561-613.Thomas, G. and Goringe, M.J. (1979), Transmission Electron Microscopy of Materials, John Wiley & Sons,
New York.Tsukizoe, T., Tanaka, S., Nishizaki, K., and Ohmae, N. (1985), Field ion microscopy of metallic adhesion
and friction, Proc. JSLE Intl. Tribol. Conf., Tokyo, pp. 121-126.
Van Hove, M.A., Moritz, W., Over, H., Rous, P.J., Wander, A., Barbieri, A., Materer, N., Starke, U., andSomorjai, G.A. (1993), Automated determination of complex surface structures by LEED, Surf.Sci. Reports, Vol. 19, pp. 191-229.
Vlachos, D.G., Schmidt, L.D., and Aris, R. (1993), Kinetics of faceting of crystals in growth, etching, andequilibrium, Phys. Rev. B, Vol. 47, pp. 4896-4909.
Volokitin, A.I. and Persson, B.N.J. (1999), Theory of friction: the contribution from a fluctuating elec-tromagnetic field, J. Phys.: Condens. Matter, Vol. 11, pp. 345-359.
Wheeler, D.R. (1976), Effect of adsorbed chlorine and oxygen on the shear strength of iron and copperjunctions, J. Appl. Phys., Vol. 47, pp. 1123-1130.
Wheeler, D.R. (1978), X-ray photoelectron spectroscopic study of surface chemistry of dibenzyl disulfideon steel under mild and severe wear conditions, Wear, Vol. 47, pp. 243-254.
Widom, A. and Krim, J. (1986), Q factors of quartz oscillator modes as a probe of submonolayer-filmdynamics, Phys. Rev. B, Vol. 34, pp. 1403-1404.
Williams, E.D. (1994), Surface steps and surface morphology: understanding macroscopic phenomenafrom atomic observations, Surf. Sci., Vol. 299/300, pp. 502-524.
Wilson, R.G., Stevie, F.A., and Magee, C.W. (1989), Secondary Ion Mass Spectroscopy, Wiley, New York.Wood, E.A. (1963), Vocabulary of surface crystallography, J. Appl. Phys., Vol. 35, pp. 1306-1312.Zalm, P.C. (1995), Ultra shallow doping profiling with SIMS, Rep. Prog. Phys., Vol. 58, pp. 1321-1374.Zangwill, A. (1988), Physics at Surfaces, Cambridge University Press, Cambridge, U.K.Zhong, W. and Tomanek, D. (1990), First-principles theory of atomic-scale friction, Phys. Rev. Lett.,
Vol. 64, pp. 3054-3057.Zhu, X.Y., Hermanson, J., Arlinghaus, F.J., Gay, J.G., Richter, R., and Smith, J.R. (1984), Electronic
structure and magnetism of Ni (100) films: self-consistent local-orbital calculations, Phys. Rev. B,Vol. 29, pp. 4426-4438.