chapter 3: neural processing and perception
DESCRIPTION
Chapter 3: Neural Processing and Perception. Neural Processing and Perception. Neural processing is the interaction of signals in many neurons. Figure 3-1 p54. Lateral Inhibition and Perception. Experiments with eye of Limulus Ommatidia allow recordings from a single receptor. - PowerPoint PPT PresentationTRANSCRIPT

Chapter 3: Neural Processing and
Perception

Neural Processing and Perception
• Neural processing is the interaction of signals in many neurons.

Figure 3-1 p54

Lateral Inhibition and Perception
• Experiments with eye of Limulus– Ommatidia allow recordings from a single
receptor.– Light shown into a single receptor leads to
rapid firing rate of nerve fiber.– Adding light into neighboring receptors
leads to reduced firing rate of initial nerve fiber.

Figure 3-2 p54

Figure 3-3 p55

Lateral Inhibition and Lightness Perception
• Three lightness perception phenomena explained by lateral inhibition– The Hermann Grid: Seeing spots at an
intersection– Mach Bands: Seeing borders more sharply– Simultaneous Contrast: Seeing areas of
different brightness due to adjacent areas

Hermann Grid
• People see an illusion of gray images in intersections of white areas.
• Signals from bipolar cells cause effect– Receptors responding to white corridors
send inhibiting signals to receptor at the intersection
– The lateral inhibition causes a reduced response which leads to the perception of gray.

Figure 3-4 p55

Figure 3-5 p55

Figure 3-6 p56

Figure 3-7 p56

Figure 3-8 p56

Mach Bands
• People see an illusion of enhanced lightness and darkness at borders of light and dark areas.– Actual physical intensities indicate that this
is not in the stimulus itself.– Receptors responding to low intensity
(dark) area have smallest output.– Receptors responding to high intensity
(light) area have largest output.

Figure 3-9 p57

Figure 3-10 p57

Mach Bands - continued
– All receptors are receiving lateral inhibition from neighbors
– In low and high intensity areas amount of inhibition is equal for all receptors
– Receptors on the border receive differential inhibition

Mach Bands - continued
– On the low intensity side, there is additional inhibition resulting in an enhanced dark band.
– On the high intensity side, there is less inhibition resulting in an enhanced light band.
– The resulting perception gives a boost for detecting contours of objects.

Figure 3-9 p57

Figure 3-12 p58

Figure 3-13 p58

Lateral Inhibition and Simultaneous Contrast
• People see an illusion of changed brightness or color due to effect of adjacent area– An area that is of the same physical
intensity appears:• lighter when surrounded by a dark area.• darker when surrounded by a light area.

Lateral Inhibition and Simultaneous Contrast - continued
– Receptors stimulated by bright surrounding area send a large amount of inhibition to cells in center.
– Resulting perception is of a darker area than when this stimulus is viewed alone.
– Receptors stimulated by dark surrounding area send a small amount of inhibition to cells in center.
– Resulting perception is of a lighter area than when this stimulus viewed alone.

Figure 3-14 p58

Figure 3-15 p59

A Display That Can’t Be Explained by Lateral Inhibition
• White’s Illusion– People see light and dark rectangles even
though lateral inhibition would result in the opposite effect.

Explanation of White’s Illusion
• Belongingness– An area’s appearance is affected by where
we perceive it belongs.– Effect probably occurs in cortex rather than
retina.– Exact physiological mechanism is
unknown.

Figure 3-16 p59

Figure 3-17 p59

Figure 3-18 p60

Processing From Retina to Visual Cortex and Beyond
• Area of receptors that affects firing rate of a given neuron in the circuit
• Receptive fields are determined by monitoring single cell responses.
• Research example for vision– Stimulus is presented to retina and
response of cell is measured by an electrode.

Figure 3-19 p60

Figure 3-20 p61
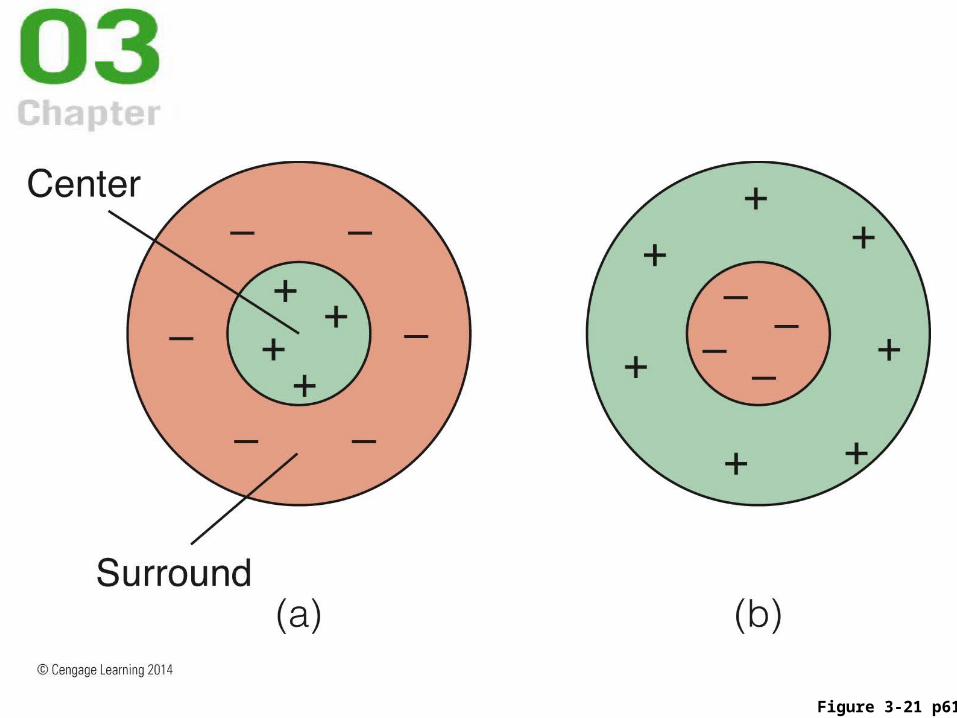
Figure 3-21 p61

Center-Surround Antagonism
• Output of center-surround receptive fields changes depending on area stimulated:– Highest response when only the excitatory
area is stimulated – Lowest response when only the inhibitory
area is stimulated– Intermediate responses when both areas
are stimulated

Figure 3-22 p62

Figure 3-23 p62

Hubel and Wiesel’s Rational for Studying Receptive Fields
• Signals from the retina travel through the optic nerve to the
– Lateral geniculate nucleus (LGN)
– Primary visual receiving area in the occipital lobe (the striate cortex or area V1)
– And then through two pathways to the temporal lobe and the parietal lobe
– Finally arriving at the frontal lobe

Figure 3-24 p63

Figure 3-25 p63

Hubel and Wiesel’s Rational for Studying Receptive Fields - continued
• LGN cells have center-surround receptive fields.
• Major function of LGN is to regulate neural information from the retina to the visual cortex.
– Signals are received from the retina, the cortex, the brain stem, and the thalamus.
– Signals are organized by eye, receptor type, and type of environmental information.

Hubel and Wiesel’s Rational for Studying Receptive Fields - continued
• Excitatory and inhibitory effects are found in receptive fields.
• Center and surround areas of receptive fields result in:– Excitatory-center-inhibitory surround– Inhibitory-center-excitatory surround

Figure 3-26 p64

Receptive Fields of Neurons in the Visual Cortex
• Neurons that fire to specific features of a stimulus
• Pathway away from retina shows neurons that fire to more complex stimuli
• Cells that are feature detectors:– Simple cortical cell– Orientation tuning curve– Complex cortical cell– End-stopped cortical cell

Figure 3-27 p65

Figure 3-28 p65

Figure 3-29 p66

Table 3-1 p66

Selective Adaptation
• Neurons tuned to specific stimuli fatigue when exposure is long.
• Fatigue or adaptation to stimulus causes– Neural firing rate to decrease– Neuron to fire less when stimulus
immediately presented again• Selective means that only those neurons that
respond to the specific stimulus adapt.

Figure 3-30 p67

Selective Adaptation - continued
• Measure sensitivity to range of one stimulus characteristic
• Adapt to that characteristic by extended exposure
• Re-measure the sensitivity to range of the stimulus characteristic

Figure 3-31 p67

Selective Adaptation - continued
• Gratings are used as stimuli– Made of alternating light and dark bars– Angle relative to vertical can be changed to
test for sensitivity to orientation– Difference in intensity can be changed to
test for sensitivity to contrast

Figure 3-32 p67

Selective Adaptation - continued
• Measure contrast threshold by decreasing intensity of grating until person can just see it.
• Calculate the contrast sensitivity by taking 1/threshold.
• If threshold is low, person has high contrast sensitivity.

Figure 3-33 p68

Selective Rearing
• Animals are reared in environments that contain only certain types of stimuli
– Neurons that respond to these stimuli will become more predominate due to neural plasticity.
– Blakemore and Cooper (1970) showed this by rearing kittens in tubes with either horizontal for vertical lines.
– Both behavioral and neural responses showed the development of neurons for the environmental stimuli.

Figure 3-34 p69

Higher Level Neurons
• Inferotemporal (IT) cortex
• Prosopagnosia
• Fusiform face area

Figure 3-35 p69

Figure 3-36 p70

The Sensory Code
• Sensory code - representation of perceived objects through neural firing
– Specificity coding - specific neurons responding to specific stimuli
• Leads to the “grandmother cell” hypothesis
• Recent research shows cells in the hippocampus that respond to concepts such as Halle Berry.

The Sensory Code continued
– Problems with specificity coding:
• Too many different stimuli to assign specific neurons
• Most neurons respond to a number of different stimuli.
• Distributed coding - pattern of firing across many neurons codes specific objects
– Large number of stimuli can be coded by a few neurons.

Figure 3-37 p70

Sensory Code The Sensory Code - continued
• How many neurons are needed for an object in distributed coding?
– Sparse coding - only a relatively small number of neurons are necessary
• This theory can be viewed as a midpoint between specificity and distributed coding.

Figure 3-38 p71

Figure 3-39 p71

Figure 3-40 p72

The Mind-body Problem
• How do physiological processes become transformed into perceptual experience?
– Easy problem of consciousness
• Neural correlate of consciousness (NCC) - how physiological responses correlate with experience
– Hard problem of consciousness
• How do physiological responses cause experience?

Figure 3-41 p73