chapter 3 mechanical and rheological …shodhganga.inflibnet.ac.in/bitstream/10603/2935/8/08_chapter...
TRANSCRIPT
Chapter 3
MECHANICAL AND RHEOLOGICAL EVALUATION OF
HDPE/LLDPE BLENDS
55
Polyethylene
56
blends have become commercially
important for optirnising the mechanical properties and
processability of individual members. Linear low density
polyethylene (LLDPE) has better mechanical properties than
L.DPE. I t has a higher t ensi 1 e strengt h , elongation at
break and also has higher resistance to puncture and
tearing. One of the draw backs of LLDPE 1S that it has
poorer fluidity 1n the molten state than LDPE. The
viscosity of molten LLDPE is about 50% higher than molten
LDPE with the same MFI value. As a consequence of the
greater viscosity of LLDPE in the molten state it is
necessary to carry out processing of the polymer at a
higher temperature, using extruder with a modified design.
However, the processing problem of LLDPE can be minimised
by blending with LOPE or HOPE.
Hence blends of LOPE and LLDPE are now regarded as
excellent materials for film manufacture because they
combine the processability of LOPE and the good mechanical
. 1-3and environmental cracking r e s i s t an c e of LLOPE. While
many studies have been undertaken on LDPE/LLOPE and
HOPE/LOPE blends, only very few studies are reported on
HOPE/LLOPE blends. However, it is reported that a blend of
HDPE and LLOPE exhibited a crystallisation exotherm of a

57
single peak which indicates that it is a compatible
4system.
1. EVALUATION OF MECHANICAL PROPERTIES OF BLENDS OF HDPE
AND LLDPE
Experimental
HDPE was blended with two selected grades of LLDPE
such that one of them had a higher melt viscosity than HDPE
(LLDPE 1) while the other had a lower melt viscosity
(LLDPE 2). The polymer blends were prepared in the weight
ratios 80/20, 60/40, 40/60 and 20/80. The appropriate
constituents in the form of pellets were accurately weighed
and then tumbled to achieve a good mix. These blends were
then extruded in a laboratory extruder having a screw
length to diameter (L/D) of 20: 1 attached to a Brabender
plasticorder at a die temperature of 220°C and pelletised.
This process was repeated again for better homogeneity.
Sheets of 120x120x3 mm
200°C by compression moulding.
size were prepared at
Test specimens for tensile
tests were cut from the moulded sheets wi th dimensions
according to the standard specifications.I
Tensile stress-strain data were obtained at 25°C
and 50% relative humidity as per the ASTM standard D-638.
58
Dumbbell specimens (ASTM type IV) were tested in the zwick
UTM at a constant crosshead speed of 50 mm/min.
Results and Discussion
The tensile stress-strain behaviour of the HDPE/
LLDPE 1 blends is shown in Fig.3.l. LLDPE has a lower
yield stress than HOPE, but a much higher elongation at
break. The very high elongation at break of LLDPE 1 is due
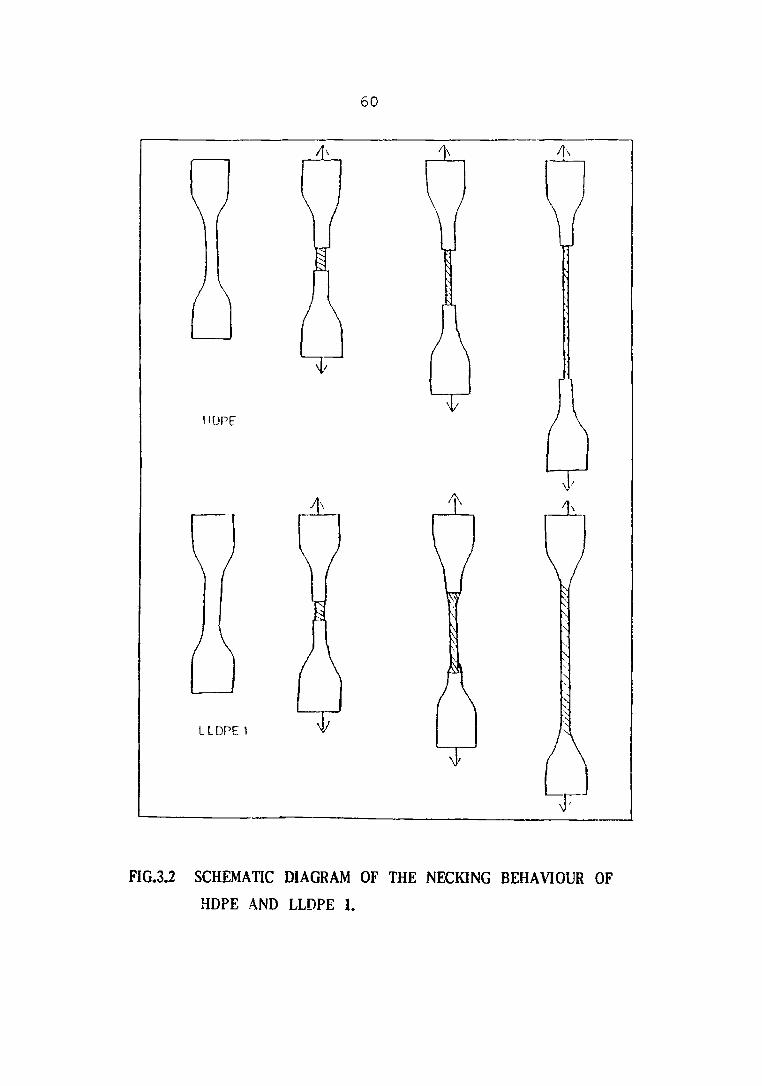
to its stable necking behaviour. In the case of LLDPE 1,
an increase in the neck occurs as a result of the transfer
of material from the wider part of the specimen, while in
the case of HDPE it occurs by deformation of the already
transformed material. The necking behaviour of HDPE and
LLDPE 1 lS schematically shown a n Fig.3.2. The tensile
properties of the blends vary smoothly between those of the
parent polymers. The obvious effects of adding LLDPE to
the blends are to lower the yield stress and increase the
elongation at break. The strain hardening during plastic
flow is similar for both the polymers and the blends.
Fig.3.3 shows the st ress-strain curves of HDPE/
LLDPE 2 blends. LLDPE 2 has a lower yield stress and
elongation at break than HDPE. Obviously, the low

59
N 00 M 0 00
NCX?QJ CO ('-. t;- u)
0c;) ~ N -..J" U"l N to00 r-- :1 -..J" U'"lN M
11 till .enClZ~...J::tl-~Q..
0 Cl- 1(1 ...:l<0
...:l~Q..0:c~
00
0
c:::z ::;)-r 0er ;;;1-
0 If) -<:- ?- --~CCl
Z-<c:::l-V).0 en0 0 0 -.IV)-.I -.I -.I -.I~-.I -.I -.I -......
f=-.... -- <-;
0 U.0 2lI.J 0 :r: :r: o.V)n, :r: 0 0
08 8 -.I0 0 QJ..J
((I:r: N --...... -- ~ -0 -- 0 0 0
M9 0to -.J N
<Xl
dN ,..., .J If) to -r....
o'T
oM
DdV'J < SS 3t!LS
60
\lOPE
l LOPE 1
\
,-,
FIG.3.2 SCHEMATIC DIAGRAM OF THE NECKING BEHAVIOUR OF
HDPE AND LLDPE 1.

61
0ClN
enClZ~....:lCQ
N
9 0 0 0 ~-l-J -J -l Q.,
-1 -l -' 0---. Cl--- --- --- 0
If)
0 0 0I lJl ....:l
III I I :r: n, ....:lQ. 0 0 0 0 0 ~0 ~
00 -1N -r:r: -- -1 Q.,
8 0 0 0 0 0 Cl00 <D --t r-, ~ :c
..~t&.o
'" "'1 . 1 LP ~0
Z c:::-r ~n:: 01- -8 lf1 >- ~
:cWJCQ
Z-~N ~en
thenWJc:::~
0 entrl
M.M
d-t&.o
o<"

62
molecular weight sample cannot support a stable neck.
However, in this case also the properties of the blends
vary smoothly between those of the parent polymers, HOPE
and LLOPE 2.
The tensile behaviour of the HDPE/LLDPE 1 and
HDPE/LLDPE 2 suggests that the blends exhibit sufficient
compatibility between HOPE and LLOPE in the solid phase,
irrespective of the different grades chosen. The ability
to co-crystallise may be a strong driving force for the
miscibility of these blends. 5
2. EVALUATION OF THE RHEOLOGICAL PROPERTIES OF HDPE/LLDPEBLENDS USING CAPILLARY RHEOMETER
HOPE/LLOPE blends were prepared in the weight
ratios 80/20, 60/40, 40/60 and 20/80 using Brabender
plasticorder. For evaluating the rheological charact-
eristics of the blends, a Goettfert capillary viscometer
model 1500 with capillary dies of 1 mm diameter and lengths
of 10 f 20 and 30 mm were used. These three different
capillaries were used to evaluate the Bagley end
corrections. The Newtonian shear rates used in this study
-1 -1varied from about 20 S to 3500 S and the temperatures
employed were 160, 170 and lS0°C.
63
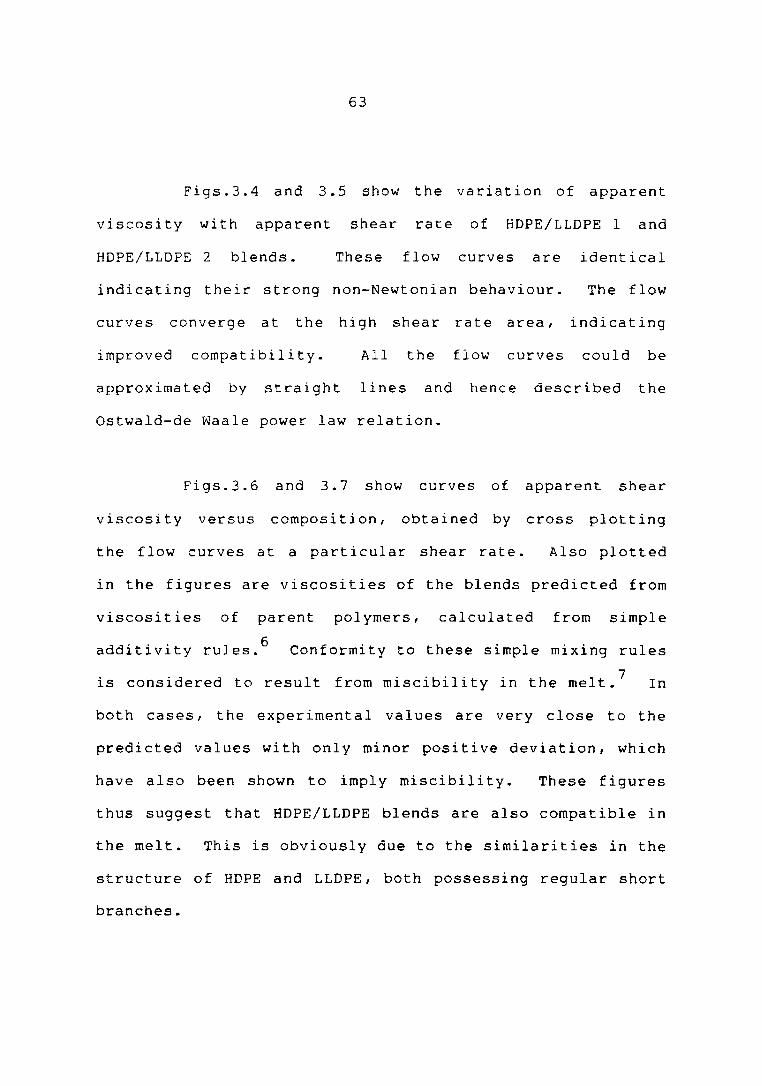
Figs.3.4 and 3.5 show the variation of apparent
viscosity with apparent shear rate of HDPE/LLDPE 1 and
HDPE/LLDPE 2 blends. These flow curves are identical
indicating their strong non-Newtonian behaviour. The flow
curves converge at the high shear rate area, indicating
improved compatibility. All the flow curves could be
approximated by straight lines and hence described the
Ostwald-de Waale power law relation.
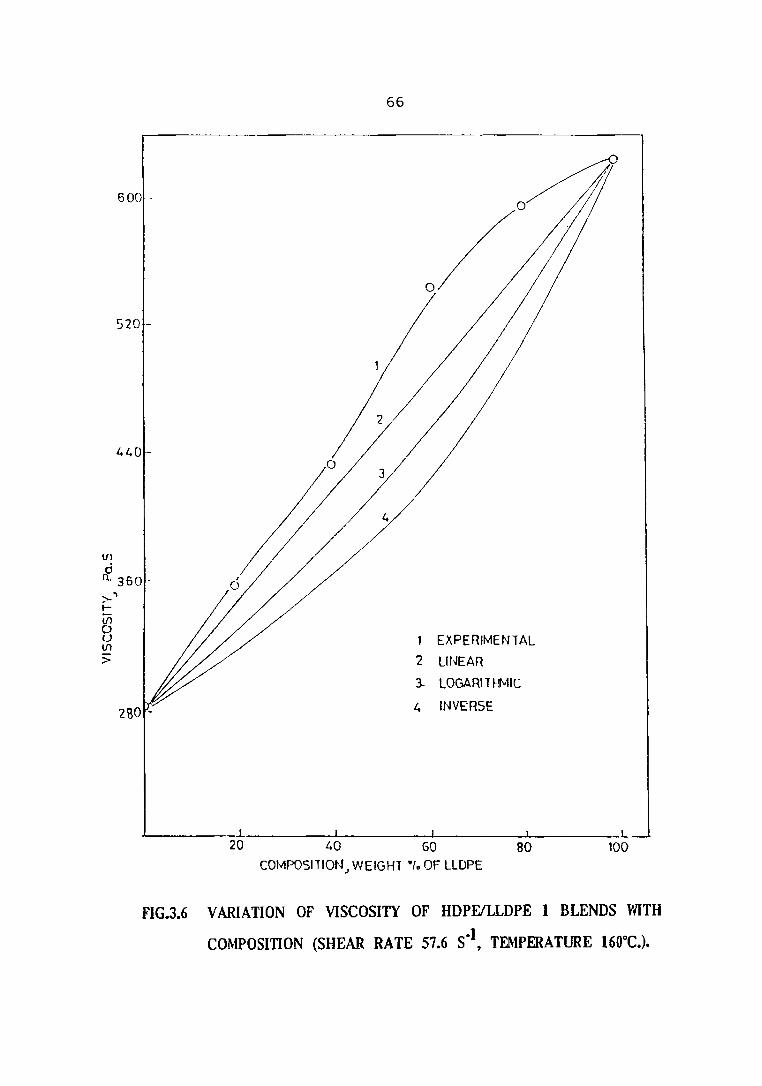
Figs.3.6 and 3.7 show curves of apparent shear
viscosity versus composition, obtained by cross plotting
the flow curves at a particular shear rate. Also plotted
in the figures are viscosities of the blends predicted from
viscosities of parent polymers, calculated from simple
additivity ruJes. 6 Conformity to these simple mixing rules
is considered to result from miscibility in the melt. 7 In
both cases, the experimental values are very close to the
predicted values with only minor positive deviation, which
have also been shown to imply miscibility. These figures
thus suggest that HDPE/LLDPE blends are also compatible in
the melt. This is obviously due to the similarities in the
structure of HDPE and LLDPE, both possessing regular short
branches.

64
3.52.52.0 -1LOG SHEAR RAts , S
15
o l00HDPE
• 80/20 HD!LLD
6 60/1.0 HO/LLD
'" ... 40/ 60 HO/LLDI\- o 20/ 80 HO/LLD
".. 100LLDPE
-. ~6~ ...-. "''''",,
.~.~6~:-.-,"'-0",- -. ~~~()-,
"'-0 .~.~...~~O"'- -. 'Z;~£~0
"o~"".~-, () ..
""O~.'{,~:'"~O"'-,""~~O <, -.
~."0 ...........
,>t::If)
ouIf)
soo..J
FIG.3.4 OF HDPFJLLDPE JRATE CURVESSHEARVISCOSITY Vs.BLENDS AT 160"C.

---.1
(1")o
Q...
~
>1-
\11oU~ 2,0>t9o-.J
65
100HDPE
~ 80120 HO! LLD
A 60! 1,0 HO/LLD
t::, L,0/60 HO/LLD
• 20/80 HDIL LO
o 100LLDPE
2·520 -1LOG SHEAR RA1E
J5
3.0 3.5
FIG.3.5 OF HDPFJLLDPE 2RATE CURVESSHEARVISCOSITY Vs.
BLENDS AT 160°C.
66
600 -
520 -
l, 40 -
VI
cln, 360 -
>-"'t-lfloUlfl>
1 EXPERIMENTAL
2 LINEAR
3. LOGAR1Hl!'>tIlC
" INVERSE
20 40 GO
COMPOSllION.J WEIGHT ·'0 OF LLDPE80 100
FIG.3.6 VARIATION OF VISCOSITY OF HDPFJLLDPE I BLENDS WITH
COMPOSITION (SHEAR RATE 57.6 S·I, TEMPERATURE 160°C.).

67
1 EXPERIMENTAL
2 LINEAR
3 LOGARITHMIC
t; INVERSE
350
>-'t-if)ou!!J>
200 3
1008020 40 60COMPOSITION... WEIGHT % LLDPE
1201-- ~_---.L...._-----l.----..l...--------L------l
FIG.3.7 VARIATION OF VISCOSITY OF HDPF/LLDPE 2 BLENDS WITH
COMPOSITION (SHEAR RATE 57.6 S·I, TEMPERATURE 160°C)
68
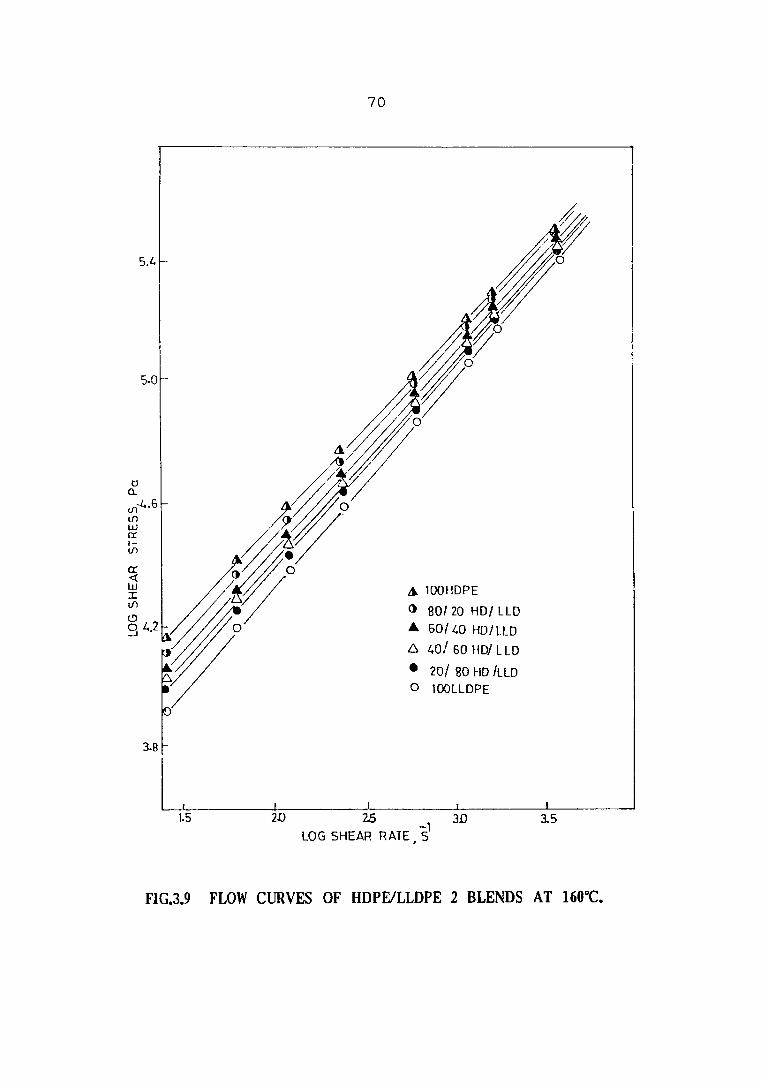
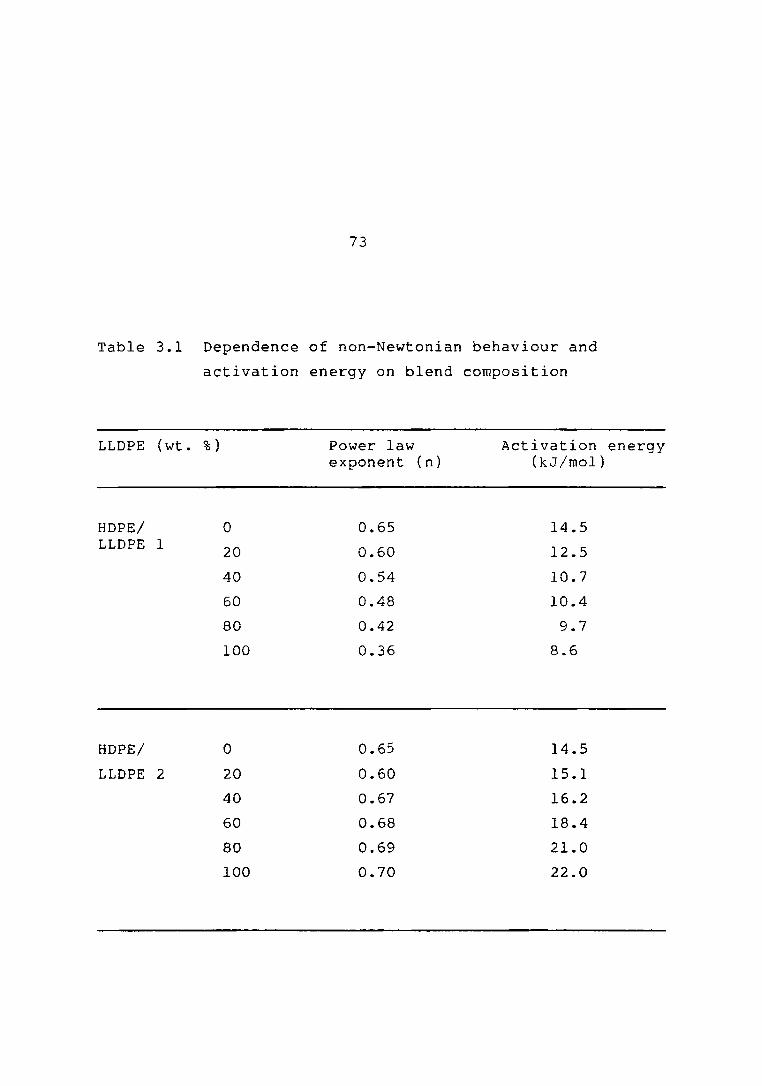
The flow curves of the blends are replotted in
Figs.3.8 and 3.9 and the power law exponent s of the blends
calculated from the curves are shown in Table 3.1. It
can be observed that LLOPE 1 is more non-Newtonian than
HOPE while LLDPE 2 is less non-Newtonian than HDPE. since
structure of HDPE and LLDPE have close similarities, the
most important factor contributing to the non-Newtonian
behaviour may be the average molecular weight of the
polymers. The usual behaviour of the polymers is to become
more non-Newtonian with increase In the molecular weight.
The power law exponent for the blends also varies smoothly
between those of the parent polymers indicating compati
bility of the polymers in the melt.
The slope of the 10g"1 vs. liT plot IS propor
tional to an apparent energy of activation for viscous
flow. Figs. 3.10 and 3.11 are such plots of HOPE/LLDPE 1 and
HDPE/L LOPE 2 bl ends. The act i vat i on energ ies calculated
for the various blends are shown in Table 3.1.
The activation energy for flow for low viscosity
material IS generally smaller than that for high viscosity
system. But the behaviour of these blends displays a very
interesting phenomenon. LLOPE I having a higher viscosity

68
The flow curves of the blends are replotted in
Figs.3.8 and 3.9 and the power law exponents of the blends
cal culated from the curves are shown in Ta bl e 3.1. It
can be observed that LLDPE I is more non-Newtonian than
HOPE while LLOPE 2 is less non-Newtonian than HOPE. Since
structure of HOPE and LLDPE have close similarities, the
most important factor contributing to the non-Newtonian
behaviour may be the average molecular weight of the
polymers. The usual behaviour of the polymers is to become
more non-Newtonian with increase in the molecular weight.
The power law exponent for the blends also varies smoothly
between those of the parent pol ymers i nd i cat ing compat i
bility of the polymers in the melt.
The slope of the log 't'f vs. liT plot is propor
tional to an apparent energy of activation for viscous
flow. Figs. 3.10 and 3.11 are such plots of HOPE/LLDPE 1 and
HDPE/L LDPE 2 bl ends. The act i vat i on energ ies calculated
for the various blends are shown in Table 3.1.
The activation energy for flow for low viscosity
material is generally smaller than that for high viscosity
system. But the behaviour of these blends displays a very
interesting phenomenon. LLDPE 1 having a higher viscosity

69
1.5 10
I BL .ENDS AT 160°C.
2.5
.(\ 100LLDPE
o 80/20 LLDI HO'" 6011,0 LLD!6. HO
40/60lLOI HO• 20/80 LLD/ HOo lCX)HDPE
2.0
LOG SHEAR RATE -1F ,s
LOW CURVES OF HDPEILLDPE
~
tf)tf)
wa:ttf)
FIG.3.8
70
5.0
oo,
&. 100HDPE() 80120 HO! LL.4 601 040 HO/LLD
6 40/60 HO' L• 1 lOo 20/ ao HO ILLD
l00LLDPE
25LOG SHEAR RATE -1 3.0 3.5, S
2DL1.s;---t~--'.-
FIG.3.9 FLOW CURVES OF HDPElLLDPE 2 BLENDS AT 160DC.

71
32
3.0
>-'t-
lfiou(Jl 2·8:>oo..J
2.6
.1.
.> ()~<t-----
~ .--...-<J • _____________
-.------------- ---------------.-------------._. 6-
~--------~-------- 0-
~o-------D Lt. IOOLLDPE
o 80/20 LLD/HO
A 60/40 LLD / HO
l:::. 40/60 LLD IHO
• 20/ BOLLD/HO
o lOOHDPE
2352·30
L....-. L -L. ---l. -----l
2-25
FIG.3.l0 VISCOSITY VS. liT CURVES OF HDPElLLDPE I BLENDS
(SHEAR RATE nsz S·,I).

72
.----------------------------~
l>. 100HDPE
() g0120 HO/LLD
.... 60/ L.O HO/LLD
£::, 1.0/60 HO/LLD
• 20/80HO/LLD
o 100 LlDPE
2B
-A------_______ <1._
26
tfl
on,
>-'~
if)o n.cu!!!>~o--.J
2·2
20L.- --1. -----!-. ---l..- ---.J
2·253 -1
1/Tx1G. K2·30 2·35
FIG.3.l1 VISCOSITY VS. liT CURVES OF HDPFlLLDPE 2 BLENDS(SHEAR RATE 115.2 S·I).
73
Table 3.1 Dependence of non-Newtonian behaviour and
activation energy on blend composition
LLDPE (wt. %) Power lawexponent (n)
Activation energy(kJ/mol)
HDPE/ 0 0.65 14.5LLDPE 1 20 0.60 12.5
40 0.54 10.7
60 0.48 10.4
80 0.42 9.7
100 0.36 8.6
HDPE/ 0 0.65 14.5
LLDPE 2 20 0.60 15.1
40 0.67 16.2
60 0.68 18.4
80 0.69 21.0
100 0.70 22.0
74
than HDPE, shows a slightly lower activation energy than
HDPE and LLDPE 2, which has a much lower v iscosi ty than
HDPE and LLDPE 1 shows a higher activation energy. This
may imply that LLDPE does possess a certain amount of
crystallinity in the melt. The degree of crystallinity
may be higher for the lower molecular weight LLDPE due to
its increased mobility and ability to pack into ordered
regions. Such crystallisation effects have been observed
9for polypropylene melts.
Bagley Correction Factor (p )c
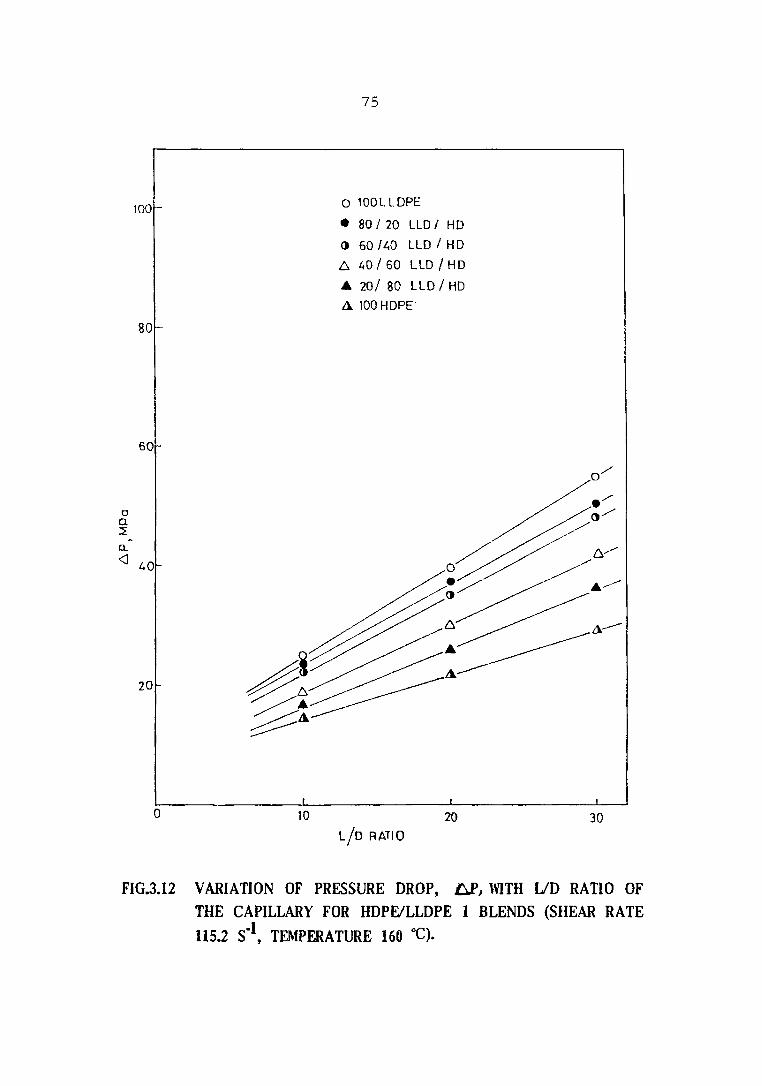
Bagley correction factor, P for HDPE/LLDPE 1c
blends was evaluated from the flow data recorded with three
different dies of LID ratio 10, 20 and 30. Bagley plots,
1! P as a function of LID for HDPE/LLDPE blends at various
composition are quite linear (Fig.3.l2). This linearity of
Bagley plot confirms the absence of slippage at the
capillary wall and at the interface boundaries where the
slippage
plot.
is believedl O to cause curvature in the Bagley
The true shear stress at the wall, <n wasVw
calculated by applying Bagley correction factor. variation
of Bagley correction factor as a function of blend composi-
100
80
60
Cla~
n,
<J 40
20
75
o 100L LOPE
• 80/ 20 LLD I HO
() 60/40 LLD I HO
6. 40/60 LLD / HO
• 20/ 80 LLD / HO
A 100HOPE"
o 10 20
LID RATIO
30
FIG.3.12 VARIATION OF PRESSURE DROP, l:::J'J WITH UD RATIO OFTHE CAPILLARY FOR HDPElLLDPE I BLENDS (SHEAR RATE115.2 S·I, TEMPERATURE 160 0c).
76
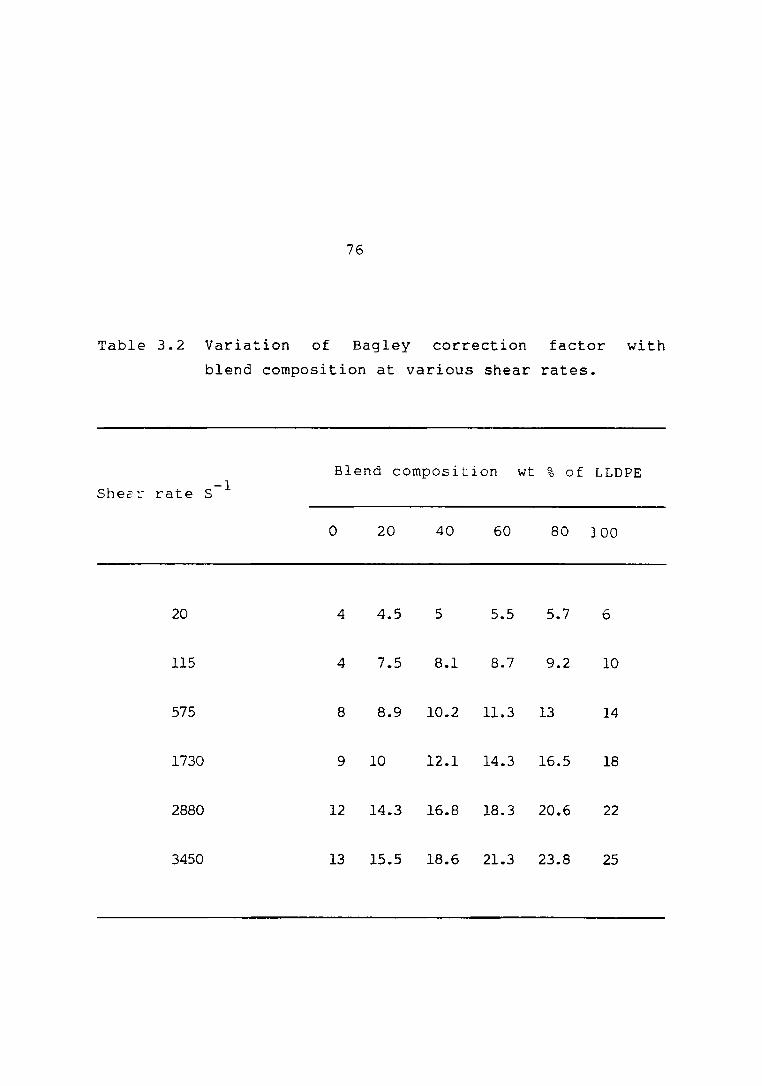
Table 3.2 Variation of Bagley correction factor with
blend composition at various shear rates.
Blend composiLion wt % of LLDPE-1She2: rate S
o 20 40 60 80 100
20
115
575
1730
2880
3450
4 4.5 5 5.5 5.7
4 7.5 8.1 8.7 9.2
8 8.9 10.2 11.3 13
9 10 12.1 14.3 16.5
12 14.3 16.8 18.3 20.6
13 15.5 18.6 21.3 23.8
6
10
14
18
22
25

tion at various shear rates is shown in Table 3.2.
Similarly the Rabinowitsch correction was applied using
values of n
shear rate Yw.
determined from flow curves, to obtain true
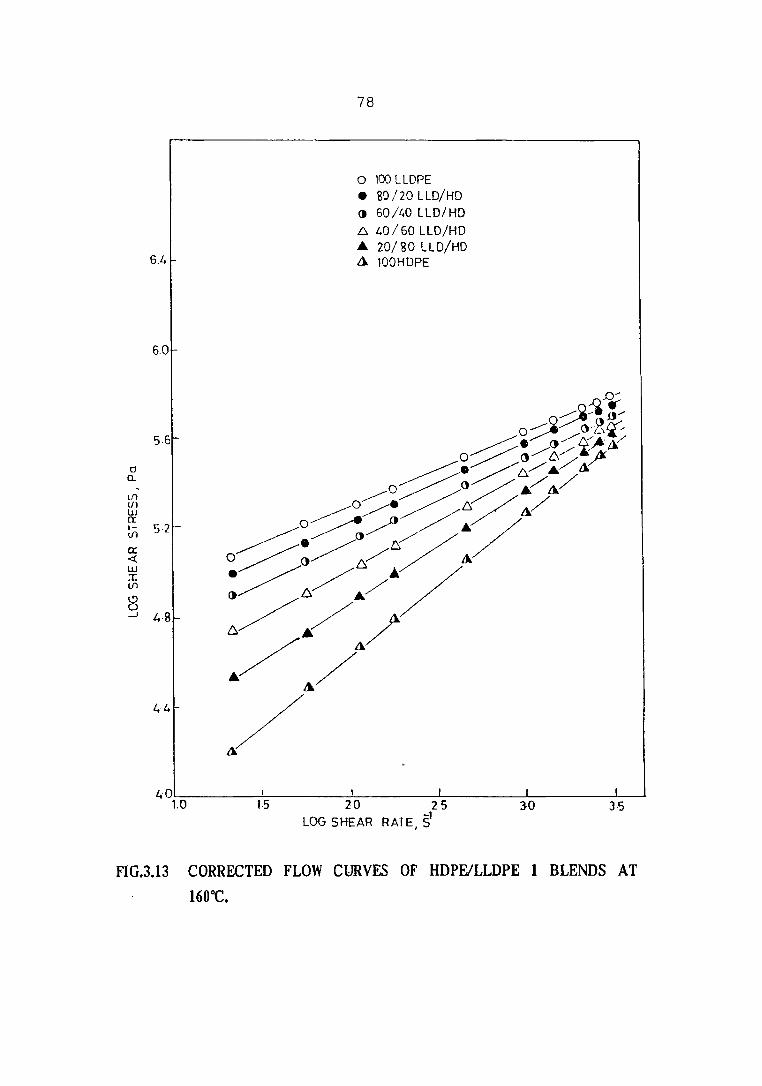
Flow curves in terms of corrected values of shear
stress and shear rate for HDPE, LLDPE and HDPE/LLDPE blends
at various compositions are shown in Fig.3.l3. Flow curves
of the blends are in between the flow curves of the pure
HDPE and LLDPE.
The power law exponent n obtained from the
corrected flow curves (Fig.3.l3) are given in Table 3.3.
Table 3.3: Corrected values of power law exponent for
HDPE/LLDPE blends
LLDPE (wt %)
Power lawexponent, n
o
0.61
20
0.57
40
0.50
60
0.44
80
0.39
100
0.28
78
6.4
o 100 lLDPE• BO/20 LLD/HO() 60/40 LLD/HD
f:j. L,O/60LLD/HD... 20/ so LLD/HOd 100HDPE
60
5·5
0Q.
,If){/llJJ0::1- 52-If)
0:<l;W:t:If)
8-.J £,·8
I
3-5r
3-0I I
10 25LOG SHEAR RA1E,~}
I
1-5L,·O~ ~ I-:-- ---l...- ---.l. --l----l
10
FIG.3.l3 CORRECTED FLOW CURVES OF HDPElLLDPE 1 BLENDS AT
160°C.
79
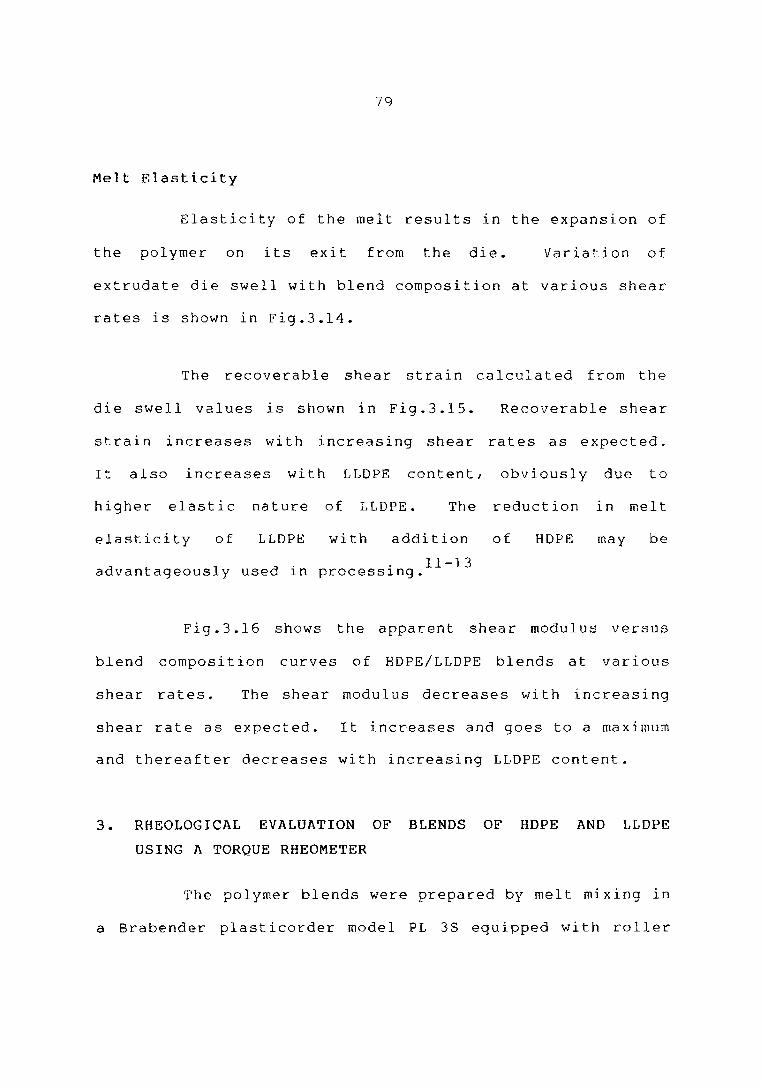
Melt Elasticity
Elasticity of the melt results in the expansion of
the polymer on its exit from the die. Variation of
extrudate die swell with blend composition at various shear
rates is shown in Fig.3.l4.
The recoverable shear strain calculated from the
die swell values is shown in Fig.3.15. Recoverable shear
strain increases with increasing shear rates as expected.
It also increases with LLDPE content, obviously due to
higher elastic nature of LLDPE. The reduction in melt
elasticity of LLDPE with addition of HOPE may be
. 11-13advantageously used in processlng.
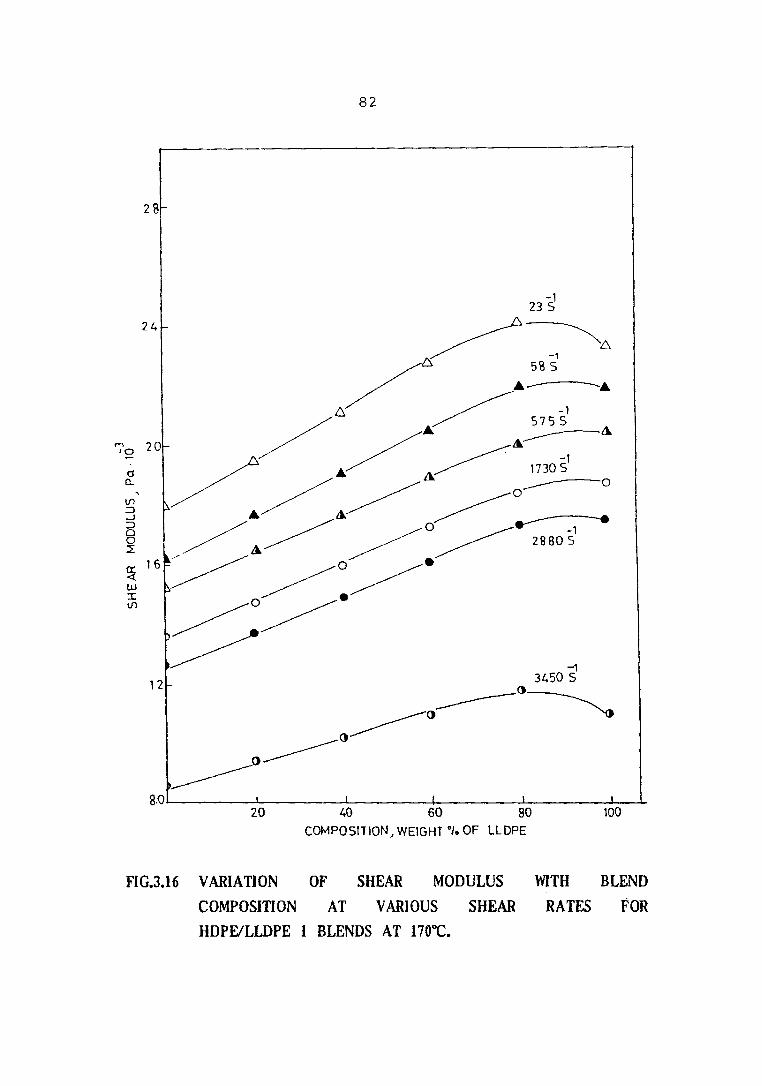
Fig.3.l6 shows the apparent shear modulus versus
blend composition curves of HDPE/LLDPE blends at various
shear rates. The shear modulus decreases with increasing
shear rate as expected. It increases and goes to a maximum
and thereafter decreases with increasing LLDPE content.
3. RHEOLOGICAL EVALUATION OF BLENDS OF HDPE AND LLDPE
USING A TORQUE RHEOMETER
The polymer blends were prepared by melt mixing in
a Brabender plasticorder model PL 33 equipped with roller

80
4.0
-I8 5
-123 S
----(')-~.----.
30 -13450 5____6___..
6------ '6
»->: ---A. -r--________6 .------ 211ll0 5 ...
6 • ______------.------ ~-.~ _____&- 1730S~o &______
-1'2.0 ~------- 0 1-0-I ___0 575 5~ 0----0Vl ___
Wo •
•.------ ------()---- ------~______ <J
10
o 20 40 60 80COMPOSIlION , WEIGHT Of. OF LLDPE
100
FIG.3.l4 VARIATION OF EXTRUDATE DIE SWELL WITH BLEND
COMPOSITION AT VARIOUS SHEAR RATES FOR HDPElLLDPE 1BLENDS AT 170°C.

50~
81
3450 ~}
"'Z<l:rrttfl
a:-::(
wItfl
-158 S____e------______ e ()~.
____ -1 o______ e tl 23 S
~----()-------I() I I
o 20 1.0 60 goCOMPOSITION, WEIGHT °/0 OF LLDPE
100
FIG.3.l5 VARIATION OF RECOVERABLE SHEAR STRAIN WITH BLEND
COMPOSITION AT VARIOUS SHEAR RATES FOR
HDPElLLDPE 1 BLENDS AT 170°C.,
82
I
100I I I
~ 60 00COMPO SITION, WEIGHT % OF LLOPE
20
'2-1
3450 S
-------~-------------() ~--------()--------()8.01-- --'-- -.L .\-- --..l.- ~_ _l...
24 ....
FIG.3.l6 VARIATION OF SHEAR MODULUS
COMPOSITION AT VARIOUS SHEAR
HDPElLLDPE I BLENDS AT 170°C.
WITH BLEND
RATES FOR
83
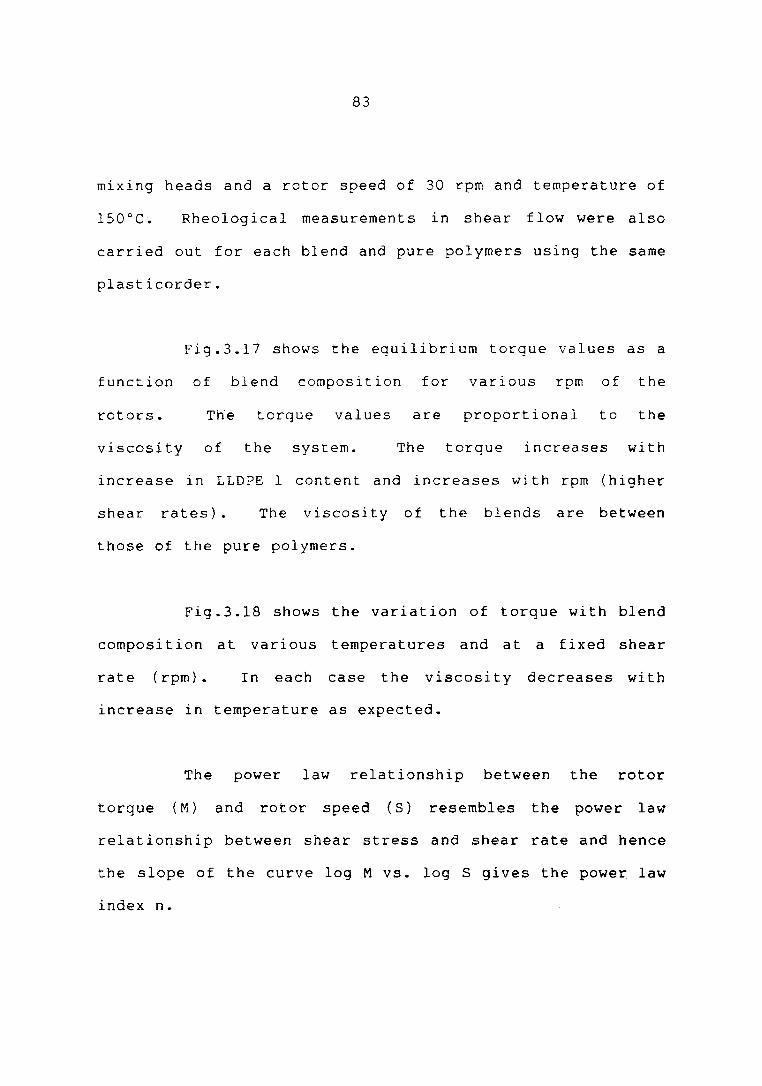
mixing heads and a rotor speed of 30 rpm and temperature of
150 0 C. Rheolog i ca 1 measurement sin shear f low were also
carried out for each blend and pure polymers using the same
plasticorder.
Fig.3.l? shows the equilibrium torque values as a
function of blend composition for various rpm of the
rotors. The torque values are proportional to the
viscosity of the system. The torque increases with
increase in LLDPE 1 content and increases with rpm (higher
shear rates). The v iscosi ty of the blends are between
those of the pure polymers.
Fig.3.18 shows the variation of torque with blend
c ompo s i t i o n at various temperatures and at a fixed shear
rat e ( rpm) • In ea c h case the vis cos i t Y de c rea s e s wit h
increase in temperature as expected.
The power law relationship between the rotor
torque (M) and rotor speed (S) resembles the power law
relationship between shear stress and shear rate and hence
the slope of the curve log M vs. log S gives the power law
index n.

84
:3 21-
()JORPM
• SOR PMo 70 RPM
E 161Z
"W::Jo0:ot-
I I
20 1,0 60 80
COMPOSITION, WEIGHT n, OF LlDPE
100
FIG.3.17 VARIATION OF EQUIUBRIUM TORQUE VALUES WITH
BLEND COMPOSITION AT VARI OUS RPM AT 170OC.

85
321-
o() 190 C
o• 180 C
Ez ,w:::>o3/-
I
100I I I I
20 40 60 80
COMPOSITION J WEIGHl °/. OF LLDPE
o'--- -!= .l::- --L. --..JL- --L..---J
FIG.3.l8 VARIATION OF TORQUE WITH BLEND COMPOSITION AT
VARIOUS TEMPERATURES (70 RPM).
86
Fig.3.l9 shows the log M versus log S plot for
v a r i ou s composi tion of the blend. The parallel straight
lines in this figure indicate that the power law indices
for the parent polymers and their blends are more or less
the same.
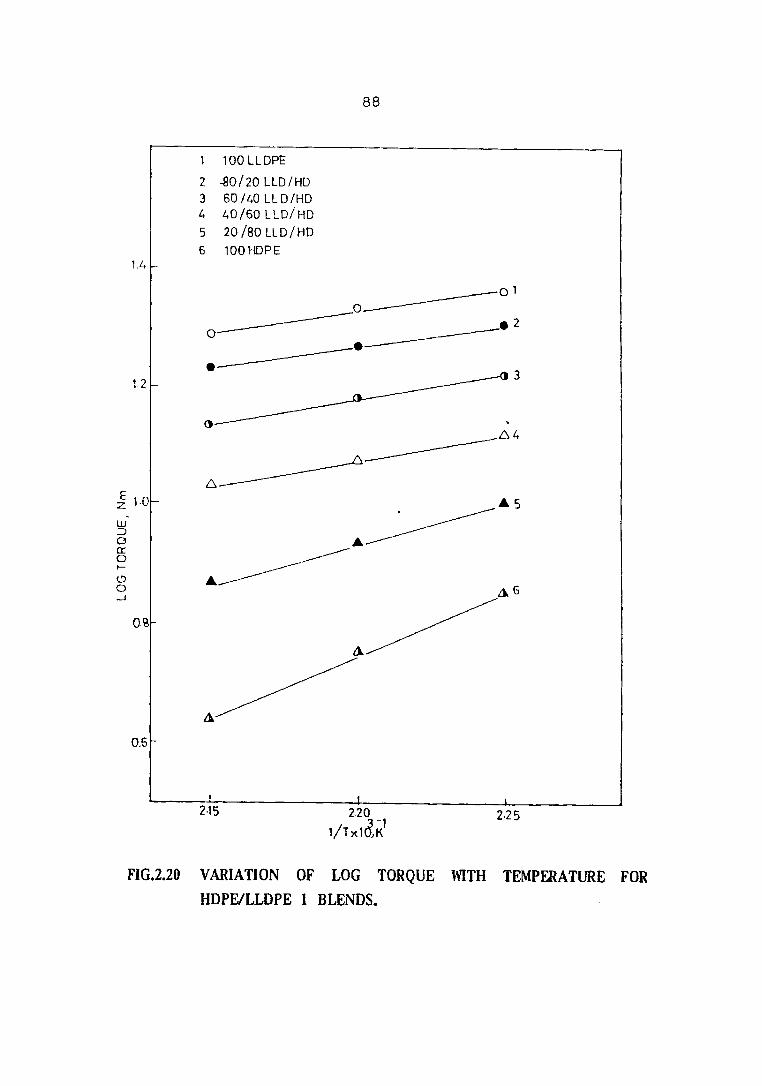
Fig.3.20 shows the log torque versus reciprocal of
absolute temperature (liT) for the HDPE/LLDPE 1 blends.
The slopes of the linear plots IS proportional to the
apparent energy of . . 14act1vatlon, which confirms the
Arrhenius type behaviour. This confirms the earlier
observa t i on that LLDPE rich blends requi res higher energy
for processing than HDPE rich blends.
The energy required to plasticize the material was
calculated from the torque-time curve at a particular
temperature for a specified period of time. The values
calculated for the blends and pure polymers at 150°C for 15
minutes are shown in Table 3.4.

1.4
12
Ezw'lO:::Ja0::ot-
08
06
1
23
L.
56
100LLDPE
80/20 LLD/HO
60/1.0 LLD/HO
40/ GO LLD/HO
201 BO LLD/ HO100 HOPE
1.5
LOG RPM
87
175
FIG.3.19 VARIATION OF LOG TORQUE WITH LOG RPM FOR
HDPElLLDPE 1 BLENDS.
88
100 LLDPE
2 ~0/20 LLD/HO3 60/40 LL O/HO4 1,0/60 LLD/HO
5 20/80 LLD/HO
6 100HDPE1.4
312
Ez '·0
.w~
oer:ot-
0.6
0 ° 1
_______ .2
° --------________ee
2·15 2.25
FIG.2.20 VARIATION OF LOG TORQUE WITH TEMPERATURE FORHDPFJLLDPE 1 BLENDS.

89
Table 3.4: Variation of energy required for plasticization
with blend composition
Blend composition (wt % of LLOPE)Property
20 40 60 800 100
Energyrequired for 64 70 75 80 86 92plasticization(kJ)
Conclusions
1. HDPE and LLOPE are sufficiently miscible in the solid
phase as well as in the melt to take advantage of the
attractive properties of both.
2. If the LLOPE used is of sufficiently higher molecular
weight to support a stable necking behaviour, it
enhances the toughness of HOPE with only slight decrease
in yield stress.
3. If the LLOPE added is of low molecular weight, it
improves the miscibility of the polymers in the melt.
However, the mechanical properties are inferior.
4. Irrespective of the viscosity of LLOPE, it shows a
higher activation energy than HOPE. This suggests that
under the influence of high stress LLOPE melts may
crystallise to a low degree, resulting in enhanced
resistance to flow.
90
REFERENCES
1. N.K.Dutta and A.W.Birley/ Plast. Rubb , Process. App l ; ,
3/ 237 (1983).
2. F.P.La Mantia and D.Acierno/ Eur. Polym. J./21/ 811
(1985).
3. F.P.La Mantia/ A.valenza and D.Acierno/ Eur. Polym. J./
22/ 647 (1986).
4. E.Jothier/ Presentation given at Interplas/ 1985/
Birmingham/ England.
5. O.Laguna, E.P.Collar and J. Tarenco/ J. Appl. Po1ym.
Sci., 36,667 (l989).
6. R.L.Zapp, Rubb. Chem. Techno1., 46, 251 (1973).
7. L.A.Utracki, Polym. Eng. Sci., 22, 1166 (1982).
8. L.A.Utracki and M.R.Kamal, Po1yrn. Eng. Sci., 22, 96
(1982) •
9. D.E.Hanson, F.N.Cogswell, Polymer Rheology and Plastics
Processing, Plastics and Rubber Institute, 1975 p.244.

91
10. R.C.Kanu and M.T.Shaw, Polym. Eng. Sei., 22, 507
(1982) •
11. A.K.Gupta and S.N.Purwar, J. Appl. Polym. SeL, 30,
1777 (1985).
12. C.D.Han and R.R.Lamonte, Polym. En q , SeL, 11, 385
(1971).
13. C.D.Han and R.R.Lamonte, Polym. Eng~ Sei., 12, 77
(1972).
14. C.L.Sieglaff, Polym. Eng. Sei., 9, 81 (1969).