chapter 3 business cycle measurement. copyright © 2005 pearson addison-wesley. all rights reserved....
TRANSCRIPT

Chapter 3
Business Cycle Measurement

Copyright © 2005 Pearson Addison-Wesley. All rights reserved. 3-2
Business Cycles
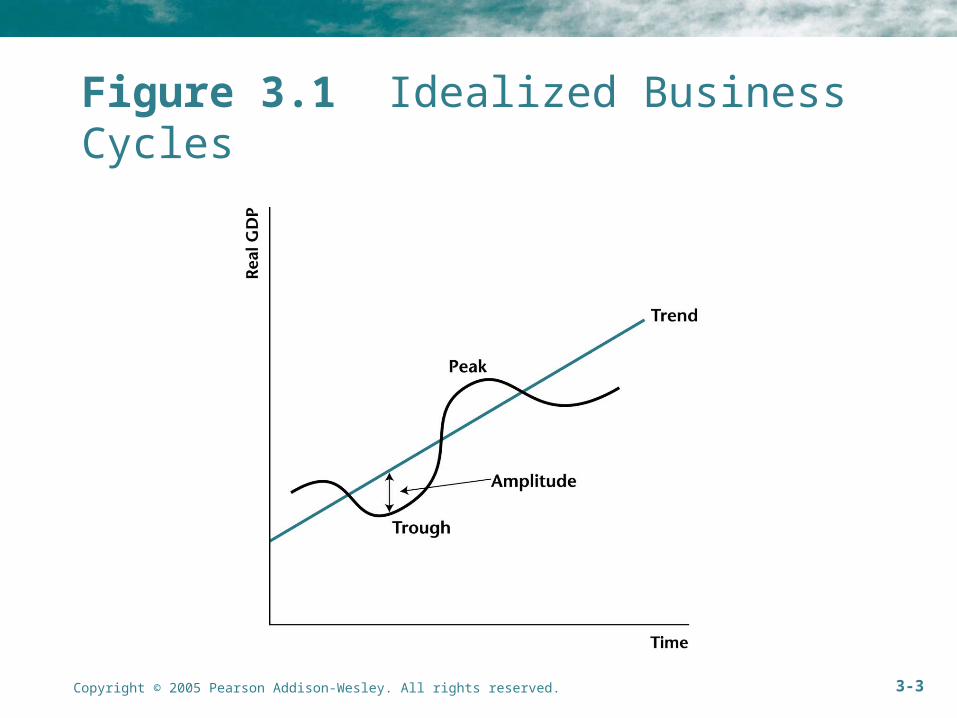
• What are they? Fluctuations about the trend in real GDP.
• Features of Business Cycles – Peaks
– Troughs
– Turning Points
– Amplitude: maximum deviation from trend
– Frequency: # of peaks in real GDP that occur per year
Copyright © 2005 Pearson Addison-Wesley. All rights reserved. 3-3
Figure 3.1 Idealized Business Cycles

Copyright © 2005 Pearson Addison-Wesley. All rights reserved. 3-4
Figure 3.2 Percentage Deviations from Trend in Real GDP: 1947--2003

Copyright © 2005 Pearson Addison-Wesley. All rights reserved. 3-5
Business Cycle Regularities
• Business Cycles are Persistent
• Deviations from Trend are Choppy
• Variability in Amplitude
• Variability in Frequency
Copyright © 2005 Pearson Addison-Wesley. All rights reserved. 3-6
Co-movement
• Macro variables tend to fluctuate together
• Can we measure this co-movement?

Copyright © 2005 Pearson Addison-Wesley. All rights reserved. 3-7
Correlation
• Time Series Comparisons
• Scatter Plots
• Correlation Coefficient
,
[( )( )]X Y
X Y
E X EX Y EY

Copyright © 2005 Pearson Addison-Wesley. All rights reserved. 3-8
Figure 3.3 Time Series Plots of x and y

Copyright © 2005 Pearson Addison-Wesley. All rights reserved. 3-9
Figure 3.4 Correlations Between Variables y and x
Copyright © 2005 Pearson Addison-Wesley. All rights reserved. 3-10
Cyclical Properties
• Procyclical: the deviations from trend are positively correlated with the deviations from trend in real GDP.
• Countercyclical: the deviations from trend are negatively correlated with the deviations from trend in real GDP.
• Acyclical: X,GDP 0

Copyright © 2005 Pearson Addison-Wesley. All rights reserved. 3-11
Figure 3.5 Imports and GDP

Copyright © 2005 Pearson Addison-Wesley. All rights reserved. 3-12
Figure 3.6 Scatter Plot of Imports and GDP
Copyright © 2005 Pearson Addison-Wesley. All rights reserved. 3-13
Imports are procyclical
IM,GDP 0.67

Copyright © 2005 Pearson Addison-Wesley. All rights reserved. 3-14
Timing
• Leading
• Lagging
• Coincident
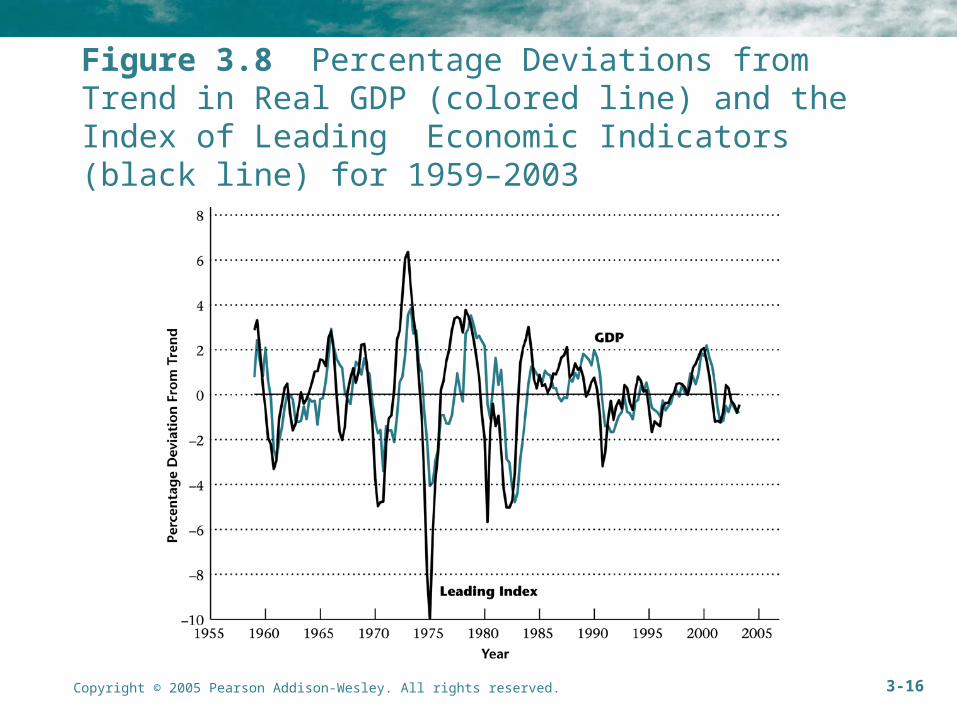
• The Index of Leading Indicators: we can use it to predict future real GDP

Copyright © 2005 Pearson Addison-Wesley. All rights reserved. 3-15
Figure 3.7 Leading and Lagging Variables
Copyright © 2005 Pearson Addison-Wesley. All rights reserved. 3-16
Figure 3.8 Percentage Deviations from Trend in Real GDP (colored line) and the Index of Leading Economic Indicators (black line) for 1959–2003

Copyright © 2005 Pearson Addison-Wesley. All rights reserved. 3-17
Volatility
• The patterns of variability of macro variables are an important part of business cycle behavior.
• We use standard deviation to measure it.
2[( ) ]X E X EX

Copyright © 2005 Pearson Addison-Wesley. All rights reserved. 3-18
Figure 3.9 Percentage Deviations from Trend in Real Consumption (black line) and Real GDP (colored line)

Copyright © 2005 Pearson Addison-Wesley. All rights reserved. 3-19
Figure 3.10 Percentage Deviations from Trend in Real Investment (black line)and Real GDP (colored line)
Copyright © 2005 Pearson Addison-Wesley. All rights reserved. 3-20
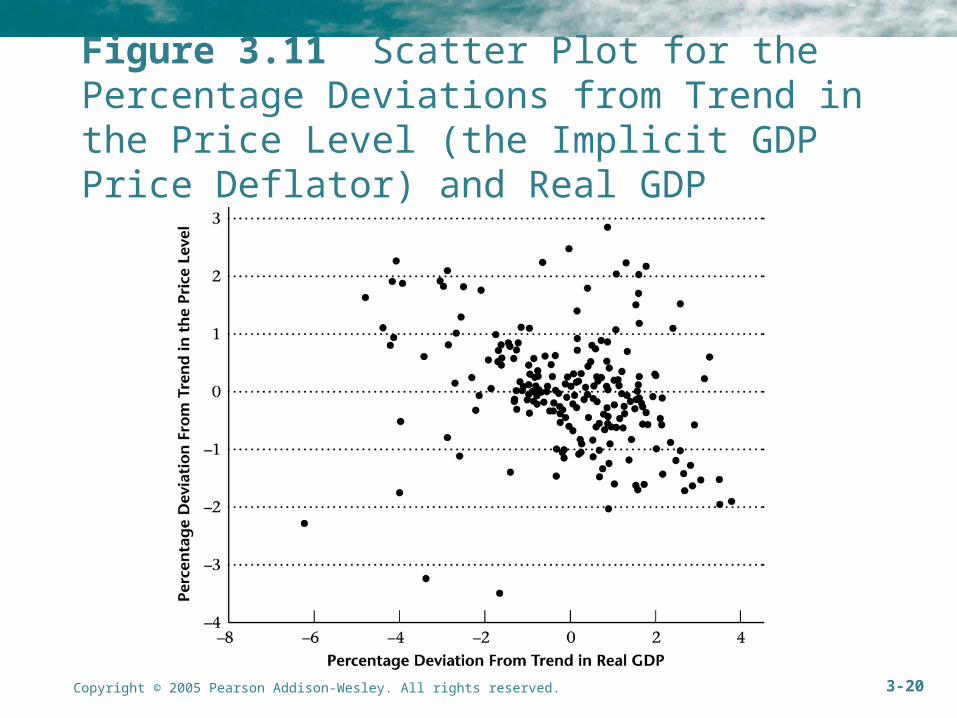
Figure 3.11 Scatter Plot for the Percentage Deviations from Trend in the Price Level (the Implicit GDP Price Deflator) and Real GDP

Copyright © 2005 Pearson Addison-Wesley. All rights reserved. 3-21
Figure 3.12 Price Level and GDP
Copyright © 2005 Pearson Addison-Wesley. All rights reserved. 3-22
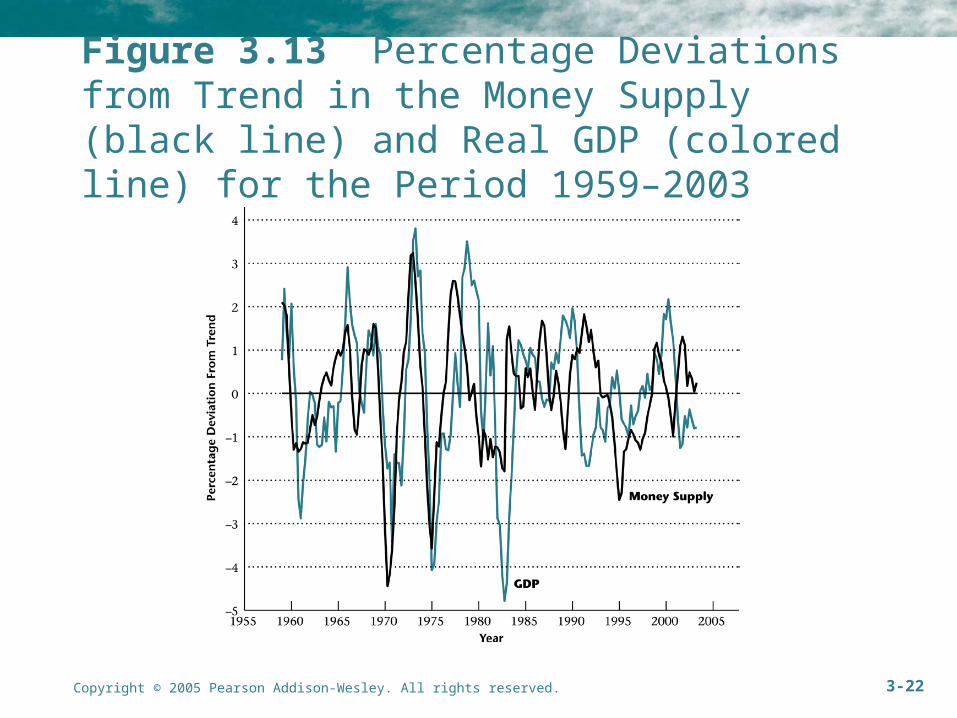
Figure 3.13 Percentage Deviations from Trend in the Money Supply (black line) and Real GDP (colored line) for the Period 1959–2003

Copyright © 2005 Pearson Addison-Wesley. All rights reserved. 3-23
Figure 3.14 Percentage Deviations from Trend in Employment (black line) and Real GDP (colored line)

Copyright © 2005 Pearson Addison-Wesley. All rights reserved. 3-24
Figure 3.15 Percentage Deviations from Trend in Average Labor Productivity (black line) and Real GDP (colored line) for 1948–2003
Copyright © 2005 Pearson Addison-Wesley. All rights reserved. 3-25
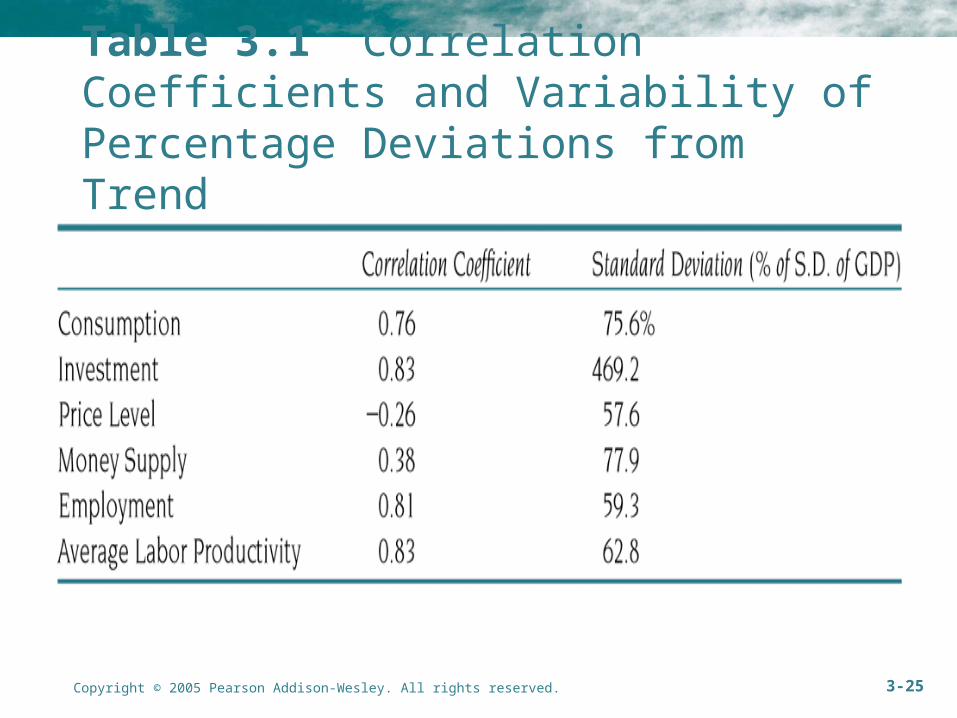
Table 3.1 Correlation Coefficients and Variability of Percentage Deviations from Trend

Copyright © 2005 Pearson Addison-Wesley. All rights reserved. 3-26
Table 3.2 Summary of Business Cycle Facts